


-
Indoor air quality generally refers to air quality in an enclosed environment with mechanical ventilation, such as cafeterias, classrooms, libraries, and offices. The university's facility management has received complaints about indoor air quality and thermal comfort issues in the cafeterias. Poor indoor air quality leads to adverse human health effects ranging from minor irritation to serious pulmonary diseases. Hence, it is a critical component of sustainability in human health, environmental protection, and economic stability.
Nowadays, indoor air quality in cafeterias has gained public attention as it is not only for dining purposes, but also for socializing and studying. Particulate matter 10 micrometers or less in diameter (PM10), volatile organic compounds, carbon monoxide, and elevated carbon dioxide levels are common indoor air contaminants. Alves et al.[1] and Tsai & Lin[2] reported that cooking activities, particularly at peak mealtimes, and cleaning agents in the university cafeteria were the main sources of PM10 and volatile organic compounds. Dede & Dede[3] also concluded that particulate matter 2.5 micrometers or less in diameter (PM2.5) and PM10 levels in student canteens often exceeded World Health Organization (WHO) limit values due to insufficient ventilation, posing health risks to students and employees. Furthermore, the high occupancy rate has increased carbon dioxide and temperatures due to human respiration and body heat. Outside contaminants, particularly from metropolitan regions, accelerate indoor air pollution[4,5].
Prolonged exposure to high amounts of indoor air contaminants exhibit symptoms such as respiratory issues, headaches, and decreased cognitive function[6,7]. In general, reports mentioned that the health risk and health issues were of great concern[1,8]. Figueiredo et al.[9] reported that indoor PM10 exhibited higher cytotoxicity and inflammatory responses than outdoor air in a university cafeteria due to combustion-derived organic compounds from cooking activities. In previous studies on indoor air quality in educational facilities, indoor air quality parameters were associated with health symptoms or 'Sick Building Syndrome'[10,11]. To maintain a safe and conducive indoor environment, it is essential to conduct health risk assessments, as well as implement regular monitoring and immediate remediation actions.
The objectives of this study are to investigate indoor air quality, assess the risk, and evaluate health risk. Therefore, this understanding facilitates decision-making regarding best management practices and mitigation strategies. It supports the well-being and academic performance of the university community.
-
Research ethics approval was obtained from the University Research Ethics Committee before the assessment. The study was conducted at two cafeterias in a university with the approval of cafeteria operators. Complaints and surveys of complaint procedures recorded discomfort with indoor air quality due to temperature and occupancy issues. The total areas of cafeterias A and B were 426.29 m2 and 168.15 m2, respectively. For each location, five sampling points were determined according to Appendix 4 in the Industry Code of Practice for Indoor Air Quality 2010 (ICOP IAQ 2010)[12].
Indoor air quality assessment
-
A walkthrough inspection was conducted based on Appendix 3-A ICOP IAQ 2010. Physical, chemical, and biological parameters were assessed. For physical and chemical parameters, four cycles of direct reading measurements were conducted continuously for 8 h, from 8 a.m. to 4 p.m. Meanwhile, only one cycle was carried out for biological parameters. All samples were prepared in duplicate.
An EVM environmental monitor (Quest EVM-7) was used to record the physical parameters of temperature and relative humidity. The formaldehyde and ozone concentrations were measured using a handheld formaldehyde meter (HAL-HFX205) and an Aeroqual ozone meter (Series-500), respectively. Carbon monoxide, total volatile organic compounds, carbon dioxide, and PM10 were recorded using an EVM environmental monitor. Tryptone soya agar and malt extract agar were prepared for total bacterial counts and total fungal counts, respectively. A single biostage standard impactor with a pump calibrated at a flow rate of 28.3 L/min was used to conduct the biological sampling. The tryptone soya agar plates were incubated at 30–35 °C for 2 d. Meanwhile, the malt extract agar plates were incubated at 20–25 °C for 4 d. The colony counts were corrected via hole correction and calculated.
A set of questionnaires for building occupants from Appendix 3-B ICOP IAQ 2010 was adopted. A Google form as a QR code was distributed to occupants of the cafeterias. A total of 63 and 60 respondents voluntarily participated in the questionnaire survey on environmental conditions and health symptoms for cafeterias A and B, respectively.
Risk assessment analysis
-
The risk assessment was performed using the risk assessment matrix. The risk score was calculated numerically by multiplying the likelihood of indoor air quality parameters exceeding the acceptable limit by the severity of symptoms among occupants due to poor indoor air quality at the workplace, as shown in Eq. (1).
$ Risk\; score=Likelihood\times S everity $ (1) Tables 1 and 2 present the indoor air quality likelihood based on parameters above the acceptable limit of ICOP IAQ 2010 and severity based on three main identified symptoms.
Table 1. Likelihood for calculation of risk assessment
Likelihood Level Criteria to consider Almost certain 5 8–10 parameters exceeding the acceptable limit Likely 4 5–7 parameters exceeding the acceptable limit Possible 3 3–4 parameters exceeding the acceptable limit Unlikely 2 1–2 parameters exceeding the acceptable limit Rare 1 No parameters exceeding the acceptable limit Table 2. Severity for calculation of risk assessment
Severity Level Criteria to consider Catastrophic 5 90%–100% of the occupants based on three main symptoms Fatal 4 61%–90% of the occupants based on three main symptoms Serious 3 31%–60% of the occupants based on three main symptoms Minor 2 1%–30% of the occupants based on three main symptoms Negligible 1 No symptoms appeared Health risk assessment
-
A human health risk assessment for inhalation exposure was conducted. The non-carcinogenic risk was calculated and evaluated according to Zehra et al.[13]. The hazard quotient (HQ) was calculated using Eqs (2)–(4). An HQ value less than or equal to 1 indicates no expected adverse health effects, while a value greater than 1 suggests a potential risk, especially public health implications. Due to the lack of an inhalation unit risk for PM10, the cancer risk could not be determined.
$ HQ=\dfrac{ADD}{RfD} $ (2) $ ADD=\dfrac{c \times InhR \times EF \times ED}{BW \times{AT}_{non-care}} $ (3) $ RfD=RfC \times \dfrac{InhR}{BW} $ (4) where, ADD is the average daily dose and RfD is the reference dose level. The ATnon-care is the averaging time for non-carcinogenic contaminants (d). The RfC for PM10 was taken from the ICOP IAQ 2010 at 150 µg/m3, and WHO 2021 at 45 µg/m3.
-
In both cafeterias A and B, uneven and high temperatures were observed. In addition, an odor issue was also identified. Poor air circulation, inefficiency of the mechanical ventilation air conditioning system, and high occupancy caused temperature issues[14]. The odor is attributed to food, refreshment food preparation, as well as waste management facilities[15,16]. Thus, such circumstances confirm the temperature and occupancy issues in discomfort complaints and negatively affect the quality of indoor air and the life of the surrounding population. The observed walkthrough inspection issues should be further confirmed quantitatively.
Physical parameters
-
Figure 1 illustrates the indoor air temperature in cafeterias A and B at five sampling points and four cycles. The obtained results showed the temperatures did not comply with the maximum acceptable limit stated by ICOP IAQ 2010 at 26 °C. Statistically, a significant temperature difference was determined among the cycles for cafeterias A and B (p <0.05). The inefficiency of the mechanical ventilation air conditioning system could not support the high occupancy in the cafeterias and caused high and uneven temperatures, thus indicating a thermal comfort issue[17,18]. Behaviors and activities of occupants, such as dining, food selection, and payment also contributed to the temperature effect[17]. Fans were installed to increase the ventilation and reduce the temperature, but this caused uneven temperatures in the cafeterias. In addition, it was observed that doors were opened during lunch hour, triggering high-temperature outdoor air and cross-ventilation, worsening the condition[5,19]. Ameen et al.[20] reported that the mechanical ventilation air conditioning system plays a major role in achieving thermal comfort in indoor air. Zhang et al.[21] reported that high occupancy increased the heat due to the respiration rate of occupants and its accumulation over time[22]. Elevated temperature not only leads to thermal comfort issues but also may contribute to headache, fatigue, reduced cognitive function, and 'Sick Building Syndrome' symptoms[23,24]. Overall, this finding confirmed the temperature issues observed through complaints and walkthrough inspection.
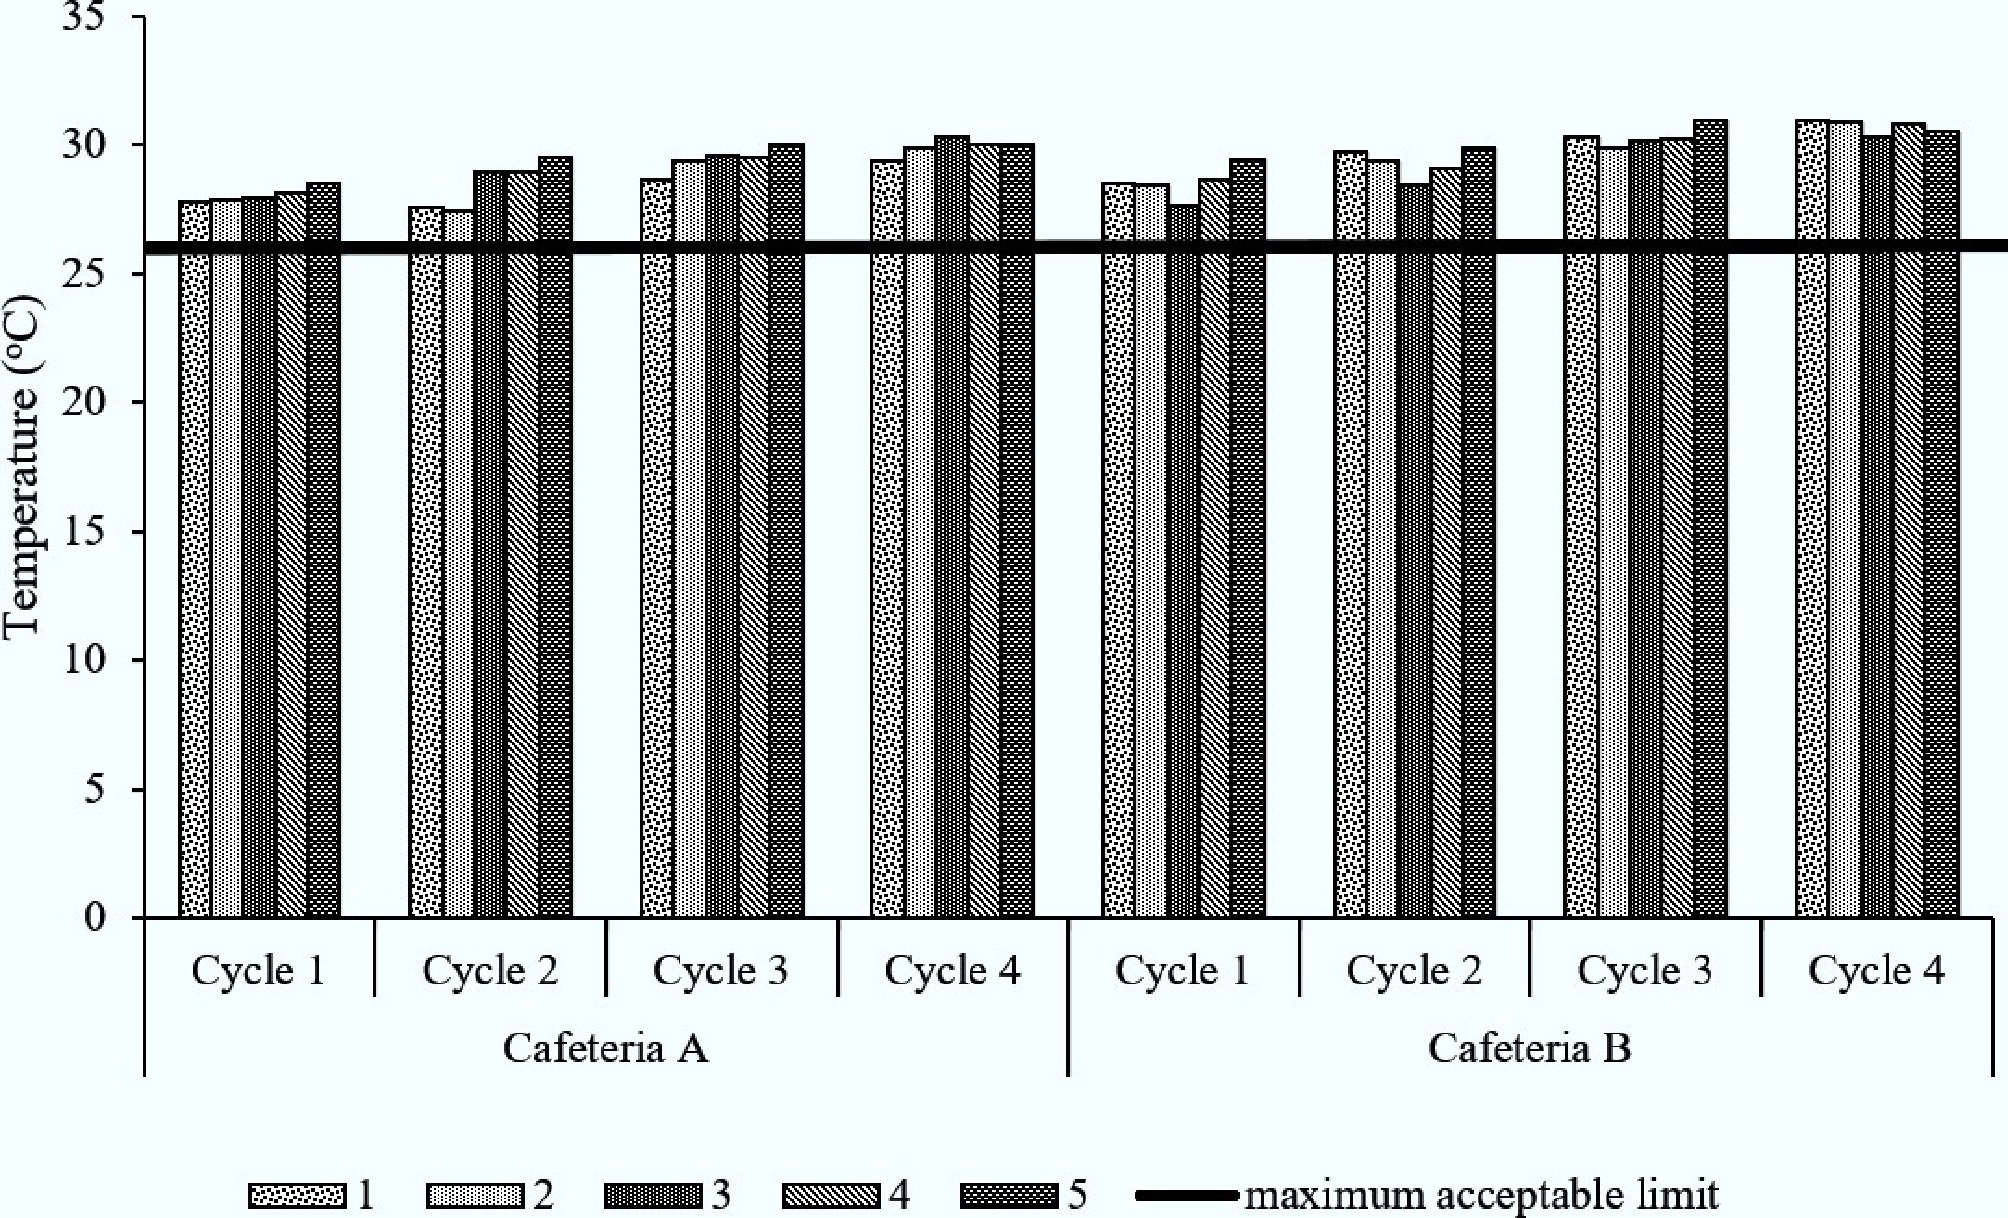
Figure 1.
Temperature in cafeterias A and B for five sampling points across four cycles.
Relative humidity at five sampling points across four cycles in cafeterias A and B is shown in Fig. 2. Findings were below the maximum acceptable limit of the ICOP 2010 at 70%. Relative humidity variations were found to be significantly different among cycles (p < 0.05). In general, the relative humidity was the highest for cycle one, when the dewpoint temperature was the coolest in the early morning. As the air conditioning system was turned on, the ability of air to hold water vapor was reduced, thus increasing the relative humidity[25]. Good housekeeping and management operations controlled relative humidity and promoted a sustainable environment and low-risk health issues[26]. Derikvand et al.[27] reported consistent findings where relative humidity in cafes in Tehran was within the permissible limit.
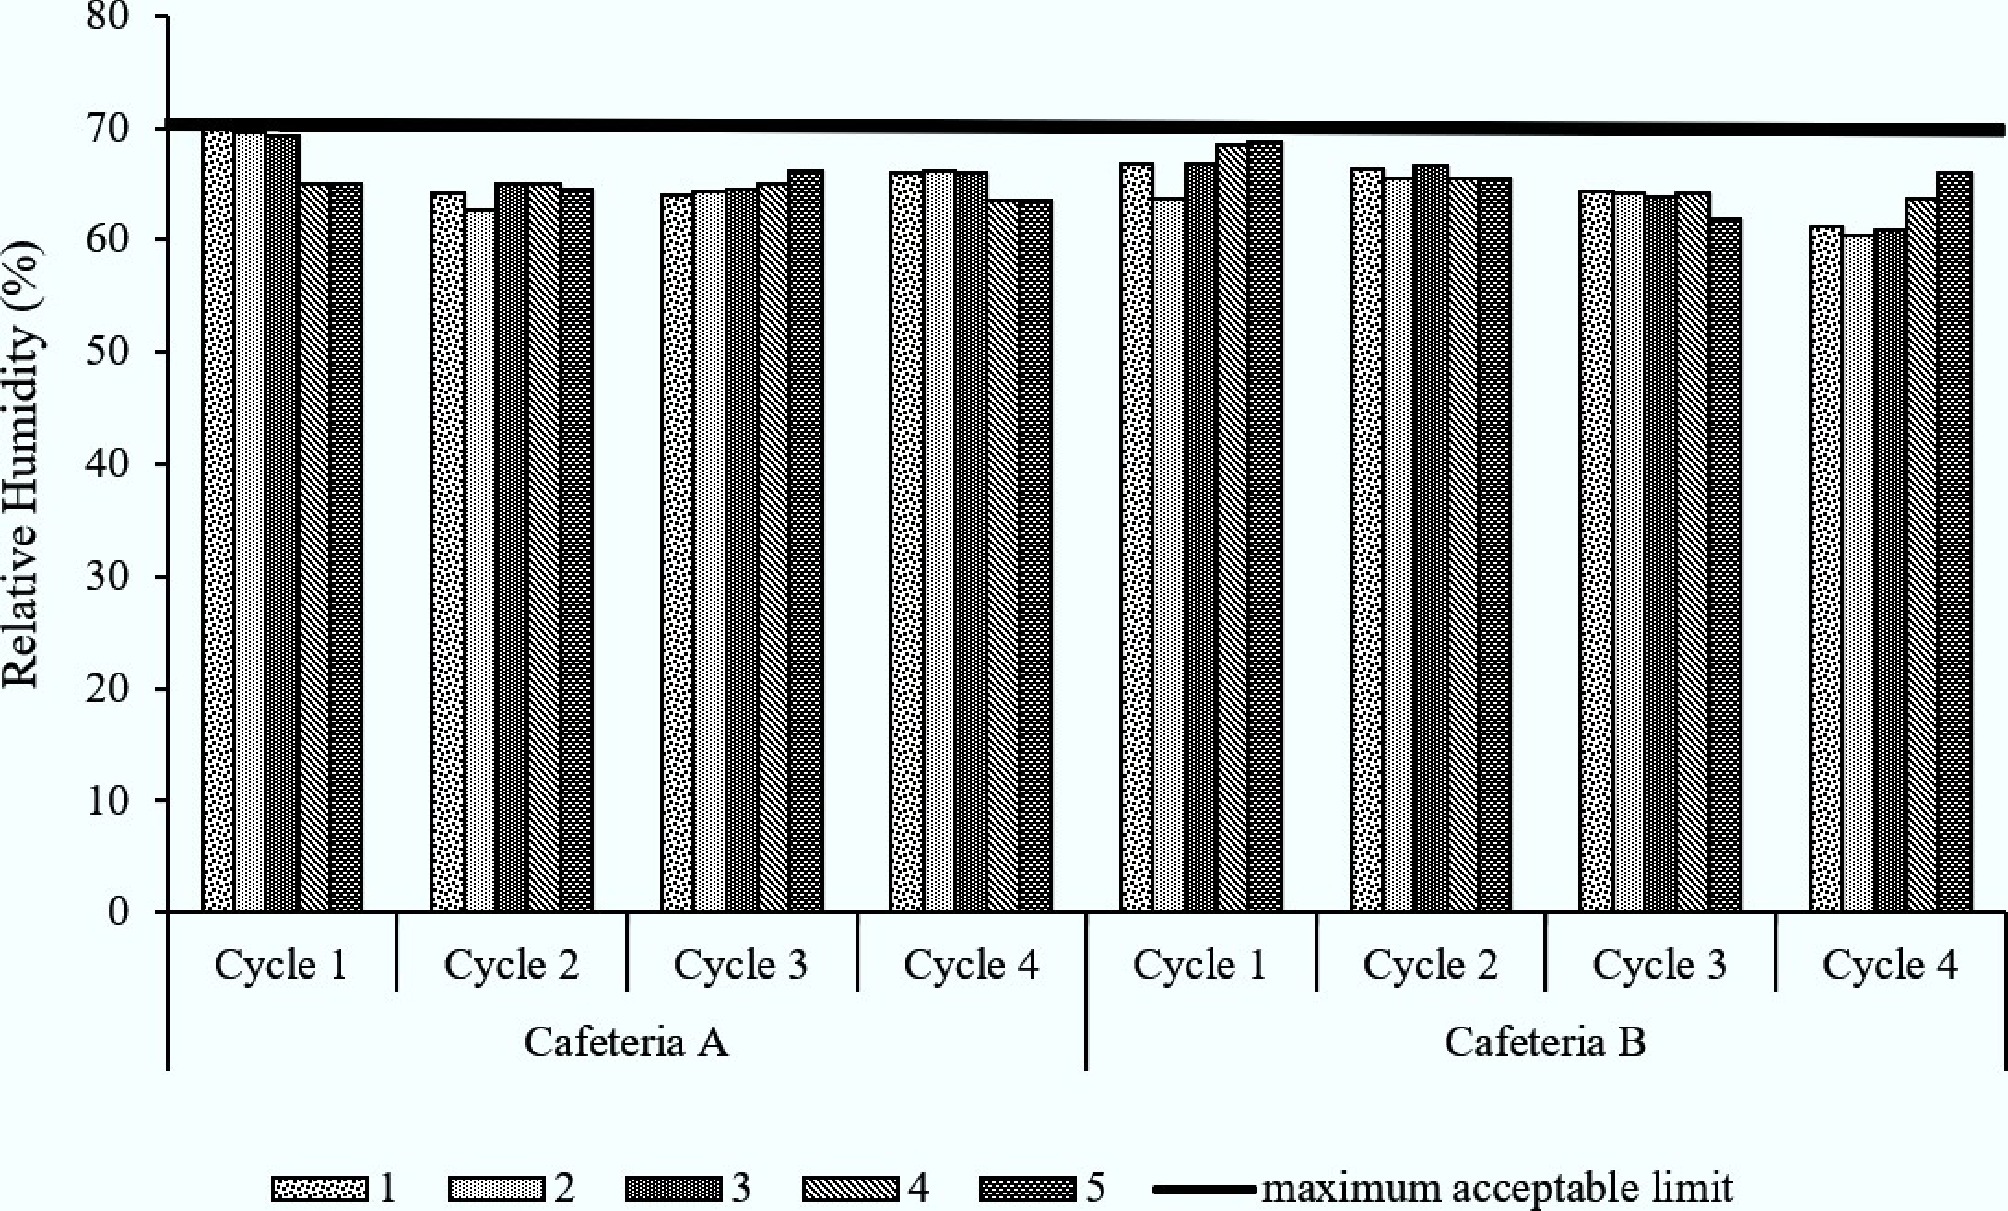
Figure 2.
Relative humidity in cafeterias A and B at five sampling points across four cycles.
Chemical parameters
-
The concentrations of formaldehyde, ozone, and carbon monoxide in cafeterias A and B were either not detected, or below the acceptable limits specified in ICOP IAQ 2010 (0.1 ppm for formaldehyde, 0.05 ppm for ozone, 10 ppm for carbon monoxide). The total volatile organic compound concentrations at both cafeterias ranged from 0.00 to 2.38 ppm, with an average of 0.73 ppm, all below the ICOP IAQ 2010 acceptable limit of 3 ppm. A statistically significant difference in concentrations of the total volatile organic compounds was observed across sampling cycles at cafeterias A and B (p < 0.05). The odor noted during the walkthrough inspection may be attributed to food preparation processes or cleaning detergents. These observations suggest that the odor was non-hazardous and posed a low risk of adverse health effects[28]. This finding is consistent with Reese et al.[29], who reported a significant association between low concentrations of total organic compounds and 'Sick Building Syndrome' symptoms, indicating a low health risk.
Figure 3 demonstrates the concentration of carbon dioxide for cafeterias A and B across four cycles. The ANOVA analysis showed a statistically significant differences in carbon dioxide concentration across cycles for cafeterias A and B (p < 0.05). Generally, all sampling points for cycle three in cafeteria A were above the acceptable limit of ICOP IAQ 2010 at 1,000 ppm, but all sampling points in cafeteria B were below the acceptable limit. This may be due to the cycle three sampling time being the lunch hour, between 12 p.m. and 2 p.m., when occupancy increased dramatically. When there was high occupancy in a confined space, a large amount of carbon dioxide was released into the air through respiration. Activities of occupants, such as dining, queueing to purchase food, and payment in crowded indoor environments, also increased carbon dioxide concentrations[22,30]. Impacts of high carbon dioxide concentrations are headaches, dizziness, fatigue, impaired cognitive function, and respiration issues[31,32].
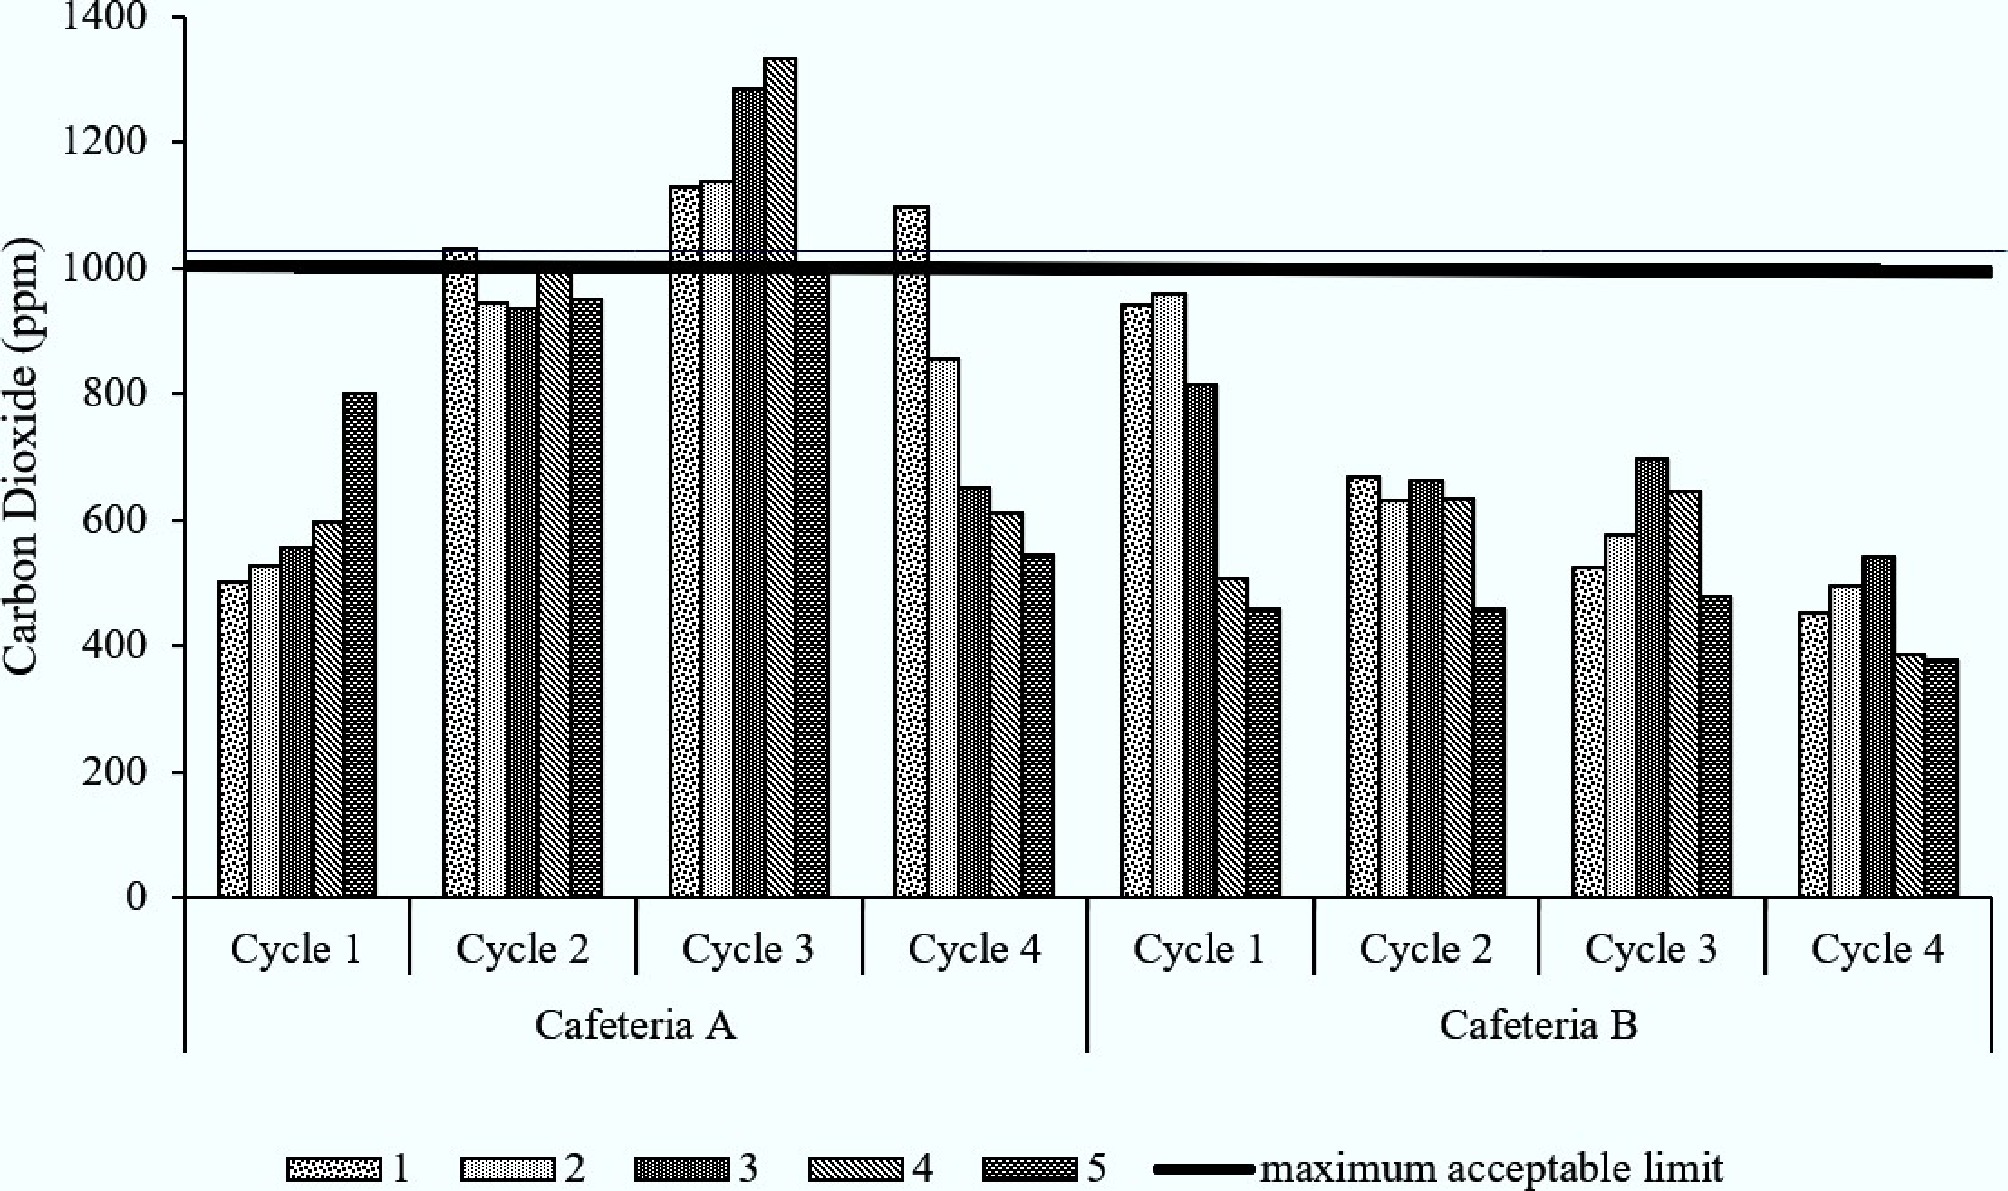
Figure 3.
Carbon dioxide in cafeterias A and B at five sampling points across four cycles.
PM10 concentrations in cafeterias A and B at five sampling points across four cycles are illustrated in Fig. 4. In general, the results were above the acceptable limit specified in ICOP IAQ 2010 at 0.15 mg/m3. A statistically significant difference in PM10 concentrations was observed across cycles (p < 0.05). PM10 was detected in the cafeterias due to its accumulation from various sources, including human presence, and cooking activities. The shoes and clothing of occupants with high movement frequency transported dust and soil into the cafeterias, thus increasing PM10 concentration[33]. Furthermore, cooking activities such as cooking methods, the number of cooking stations, type and amount of fuel used, and combustion conditions of the kitchen generated PM10[26,34]. Elevated concentrations of PM10 have been linked to acute adverse health effects, including respiratory discomfort, headaches, and exacerbation of pre-existing conditions such as asthma or other chronic respiratory disorders[35]. Beyond these short-term impacts, long-term exposure to PM10 carries severe health consequences, including an increased risk of cardiovascular diseases and elevated mortality rates specifically associated with respiratory illnesses[36].
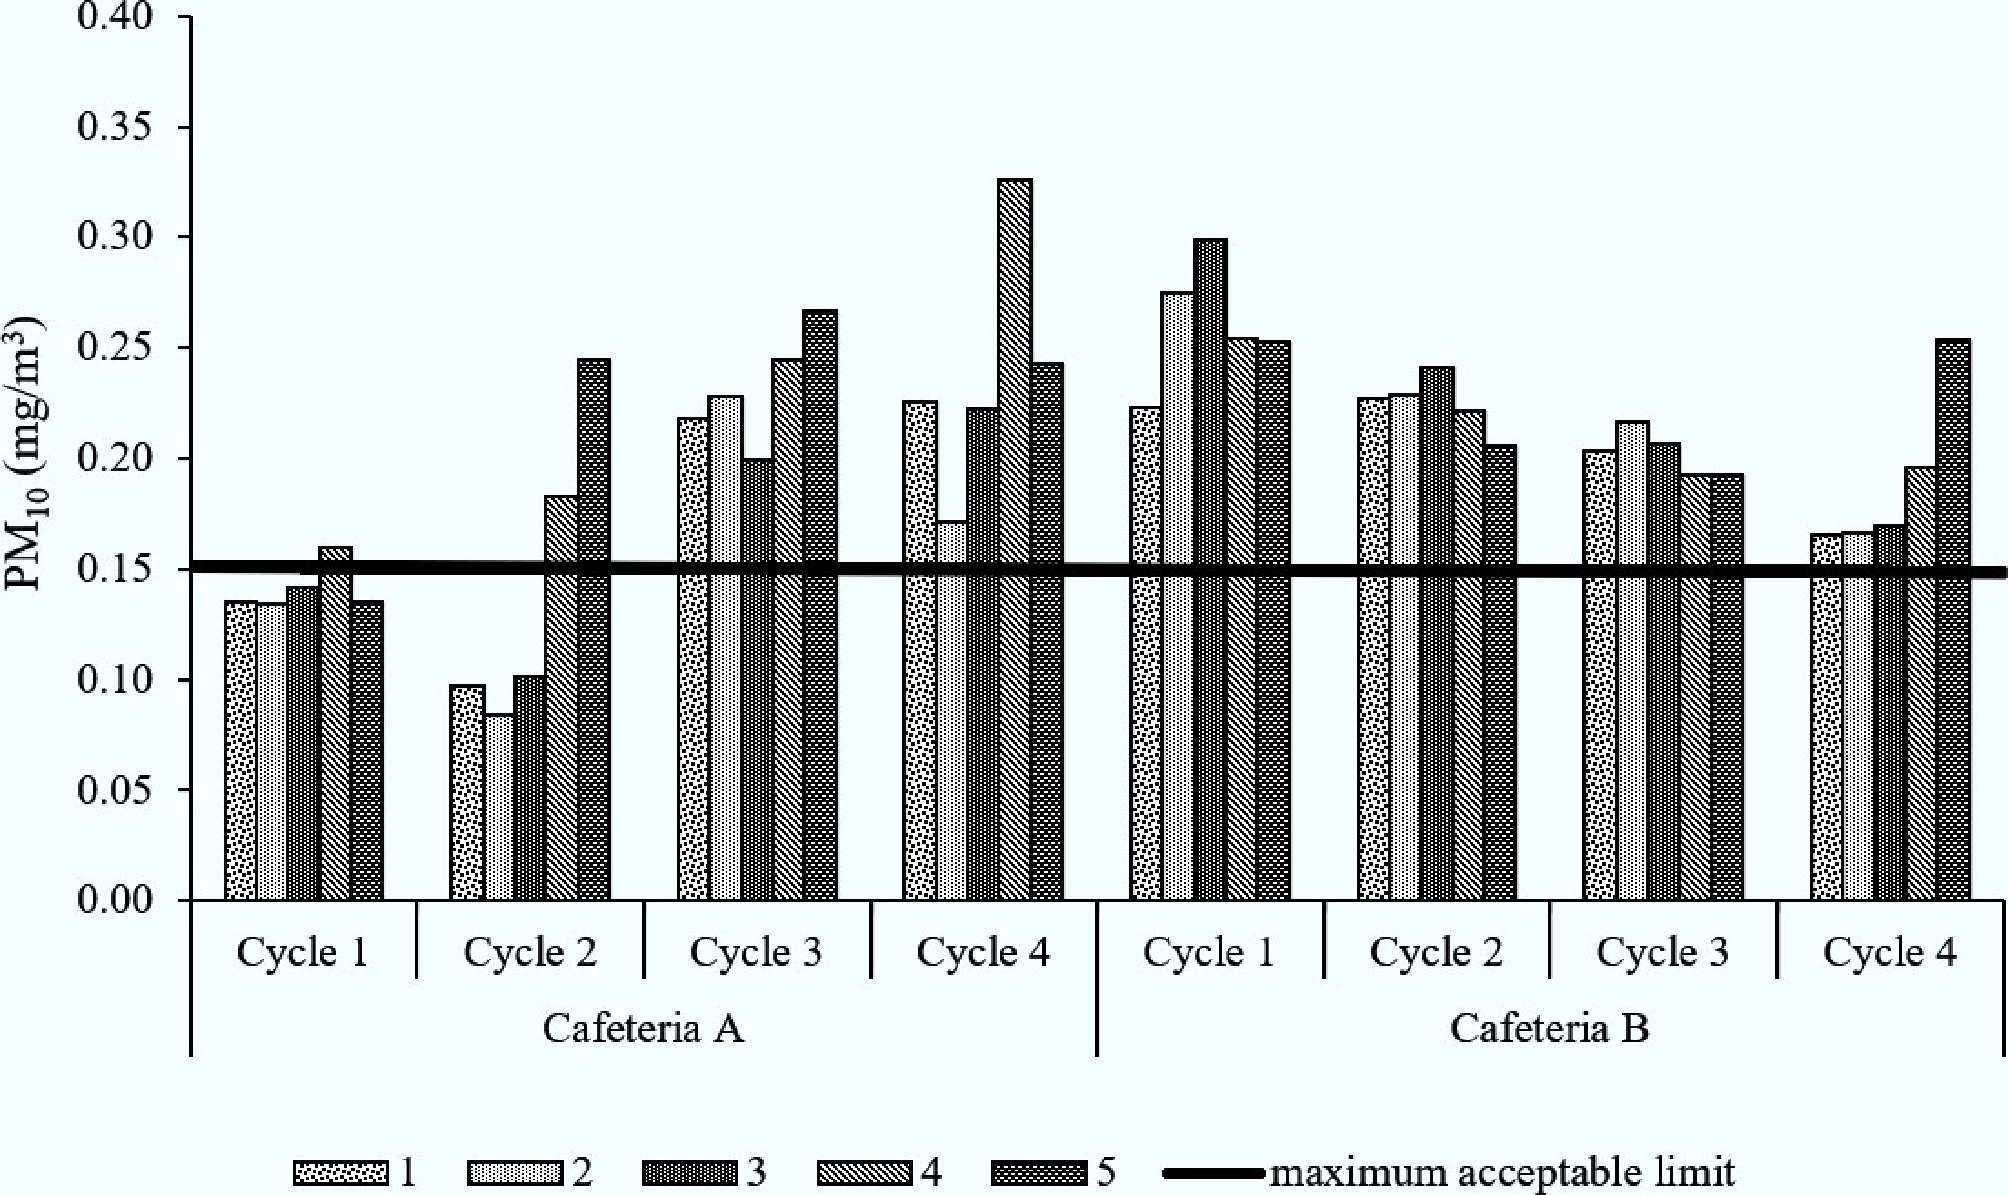
Figure 4.
PM10 in cafeterias A and B at five sampling points across four cycles.
Biological parameters
-
Table 3 summarizes the findings of the total bacteria count and total fungi count for the biological parameters in the cafeterias. All the recorded data were below the ICOP IAQ 2010 acceptable limits, except the cafeteria A sampling point five at 1,466 cfu/m3 for total bacterial counts. The elevated total bacteria counts may be attributed to the function of the sampling point in preparing and selling waffles, steamed buns, desserts, and drinks. High temperatures and relative humidity conditions promoted the growth of bacteria[37]. Asif et al.[38] also recorded a similar finding of a high total bacteria trend associated with temperature and relative humidity due to long operational hours, in-house cooking, and washing activities at the sampling point. High total bacterial counts in cafeteria environments indicate a health risk with potential acute symptoms including respiratory complications, allergic responses, headaches, and gastrointestinal disturbances, most notably foodborne illnesses caused by Salmonella and E. coli[39]. Beyond acute effects, prolonged exposure to elevated bacterial loads has been associated with serious health consequences, including the development of chronic respiratory diseases and increased susceptibility to systemic infections. These observations highlight the critical need for enhanced microbial monitoring and hygiene protocols in cafeteria settings, where repeated human exposure amplifies the public health implications of persistent bacterial contamination.
Table 3. Total fungi counts and total bacteria counts in cafeterias A and B
No. Sample
nameTotal bacteria counts (cfu/m3) Total fungi counts (cfu/m3) Cafeteria A Cafeteria B Cafeteria A Cafeteria B 1 Blank 1 - incubator 0 0 0 0 2 Blank 2 - icebox 0 0 0 0 3 Blank 3 - biostage 0 0 0 0 4 1 71 336 643 18 5 2 18 371 509 194 6 3 161 459 446 230 7 4 72 300 554 0 8 5 107 1,466 821 177 The acceptable limit for total bacteria counts based on ICOP 2010, Malaysia = 500 cfu/m3. The acceptable limit for total fungi counts based on ICOP 2010, Malaysia = 1000 cfu/m3. Mitigation strategies
-
To solve the problem of temperature and carbon dioxide, the individual air conditioning system must be improved and tuned, considering the current occupancy status. In addition, fresh air intake is vital through the mechanical ventilation system to dilute and reduce the accumulation of contaminants. The doors of the entrance and the kitchen should be closed to avoid cross-contamination issues. Frequent housekeeping and putting floor mats before the door entrance may reduce PM10 in the cafeterias effectively. The total bacteria counts are effectively controlled by adequate temperature and humidity within ICOP IAQ 2010 permissible limits, and the best housekeeping practices.
Environmental conditions
-
Environmental conditions that often affect occupants in cafeterias A and B are shown in Fig. 5. The top three environmental issues in cafeteria A were stuffy air (28%), varying room temperatures (23%), and room temperatures too high (16%). Meanwhile, cafeteria B recorded 18% dust and dirt, 17% unpleasant odor, and 15% varying room temperatures. These confirmed that cafeteria A mostly faced temperature comfort issues, and cafeteria B mainly had PM10 and temperature issues. In summary, the results of the questionnaire survey are consistent with the walkthrough inspection (3.1.1), temperature (3.1.2), and PM10 (3.1.3).
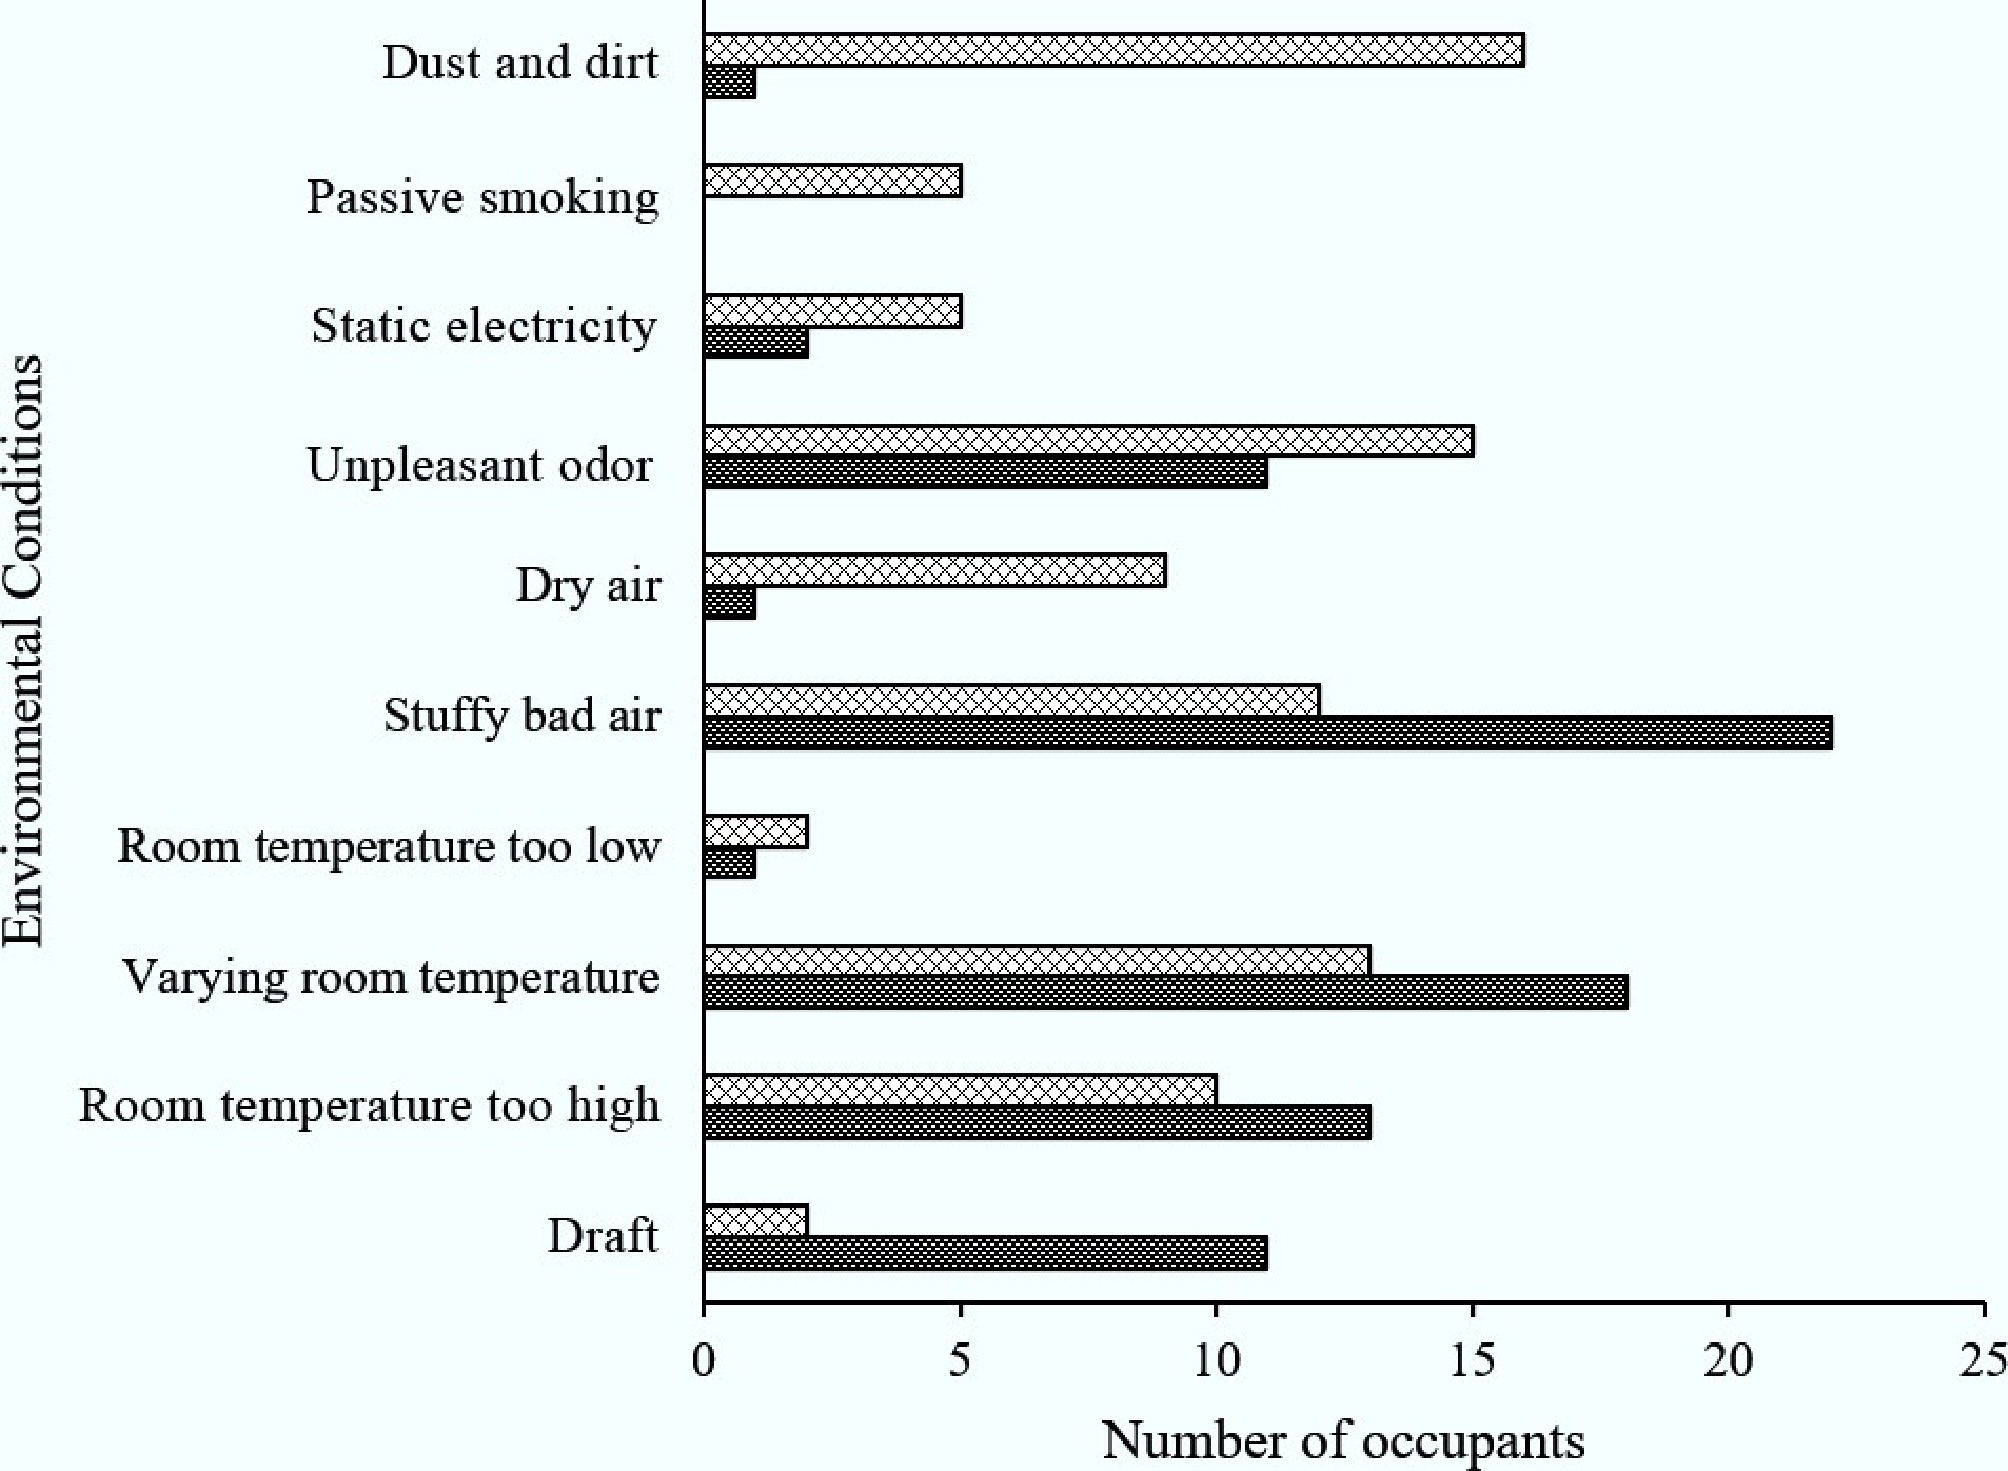
Figure 5.
Environmental conditions in cafeterias A and B that often affect the occupants.
Present symptoms
-
Figure 6 displays present symptoms that often affect the occupants in cafeterias A and B. In cafeteria A, the major present symptoms were 18% dizziness, 16% cough, and 16% feeling heavy-headed. These health symptoms were associated with the high and uneven temperature in cafeteria A, especially high occupancy. In addition, PM10 irritated the pulmonary airways and caused coughing[40]. On the other hand, occupants experienced difficulties concentrating (19%), headache (10%), and drowsiness (10%) in cafeteria B. Besides the temperature issue, elevated concentrations of PM10 were associated with neurological disorders[41]. High total bacterial counts in cafeteria environments are strongly indicative of a quantifiable health risk, with recurrent headaches emerging as a prominent acute adverse health effect—one closely linked to exposure to ambient microbial byproducts, endotoxins, or volatile organic compounds released by proliferating bacteria[39].
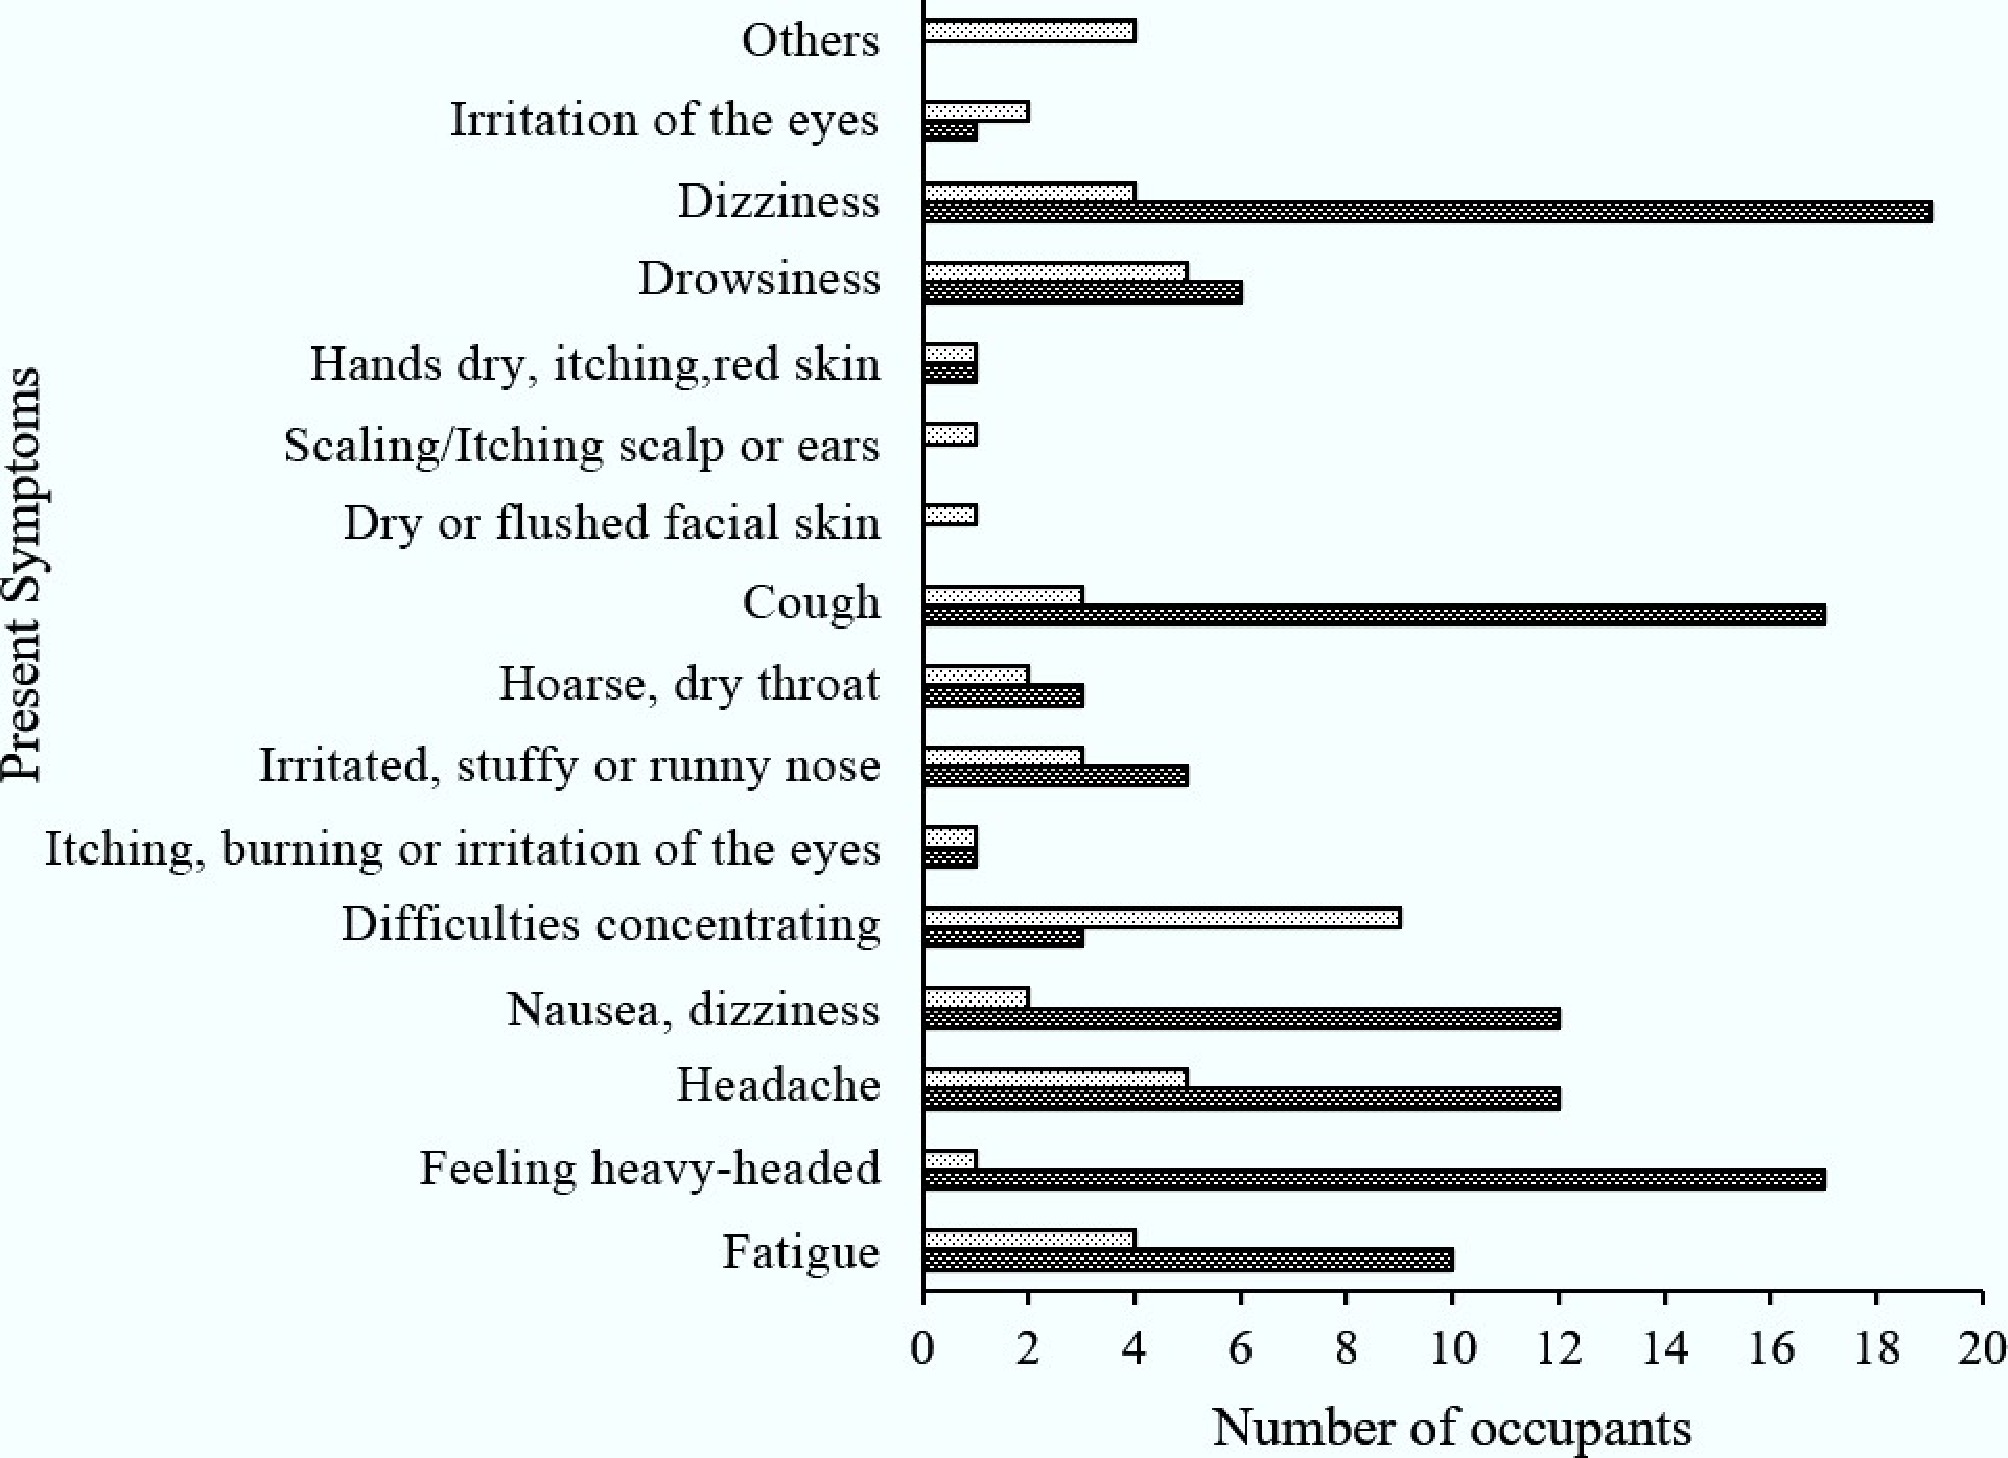
Figure 6.
Present symptoms of occupants in cafeterias A and B that often affect the occupants.
Risk assessment
-
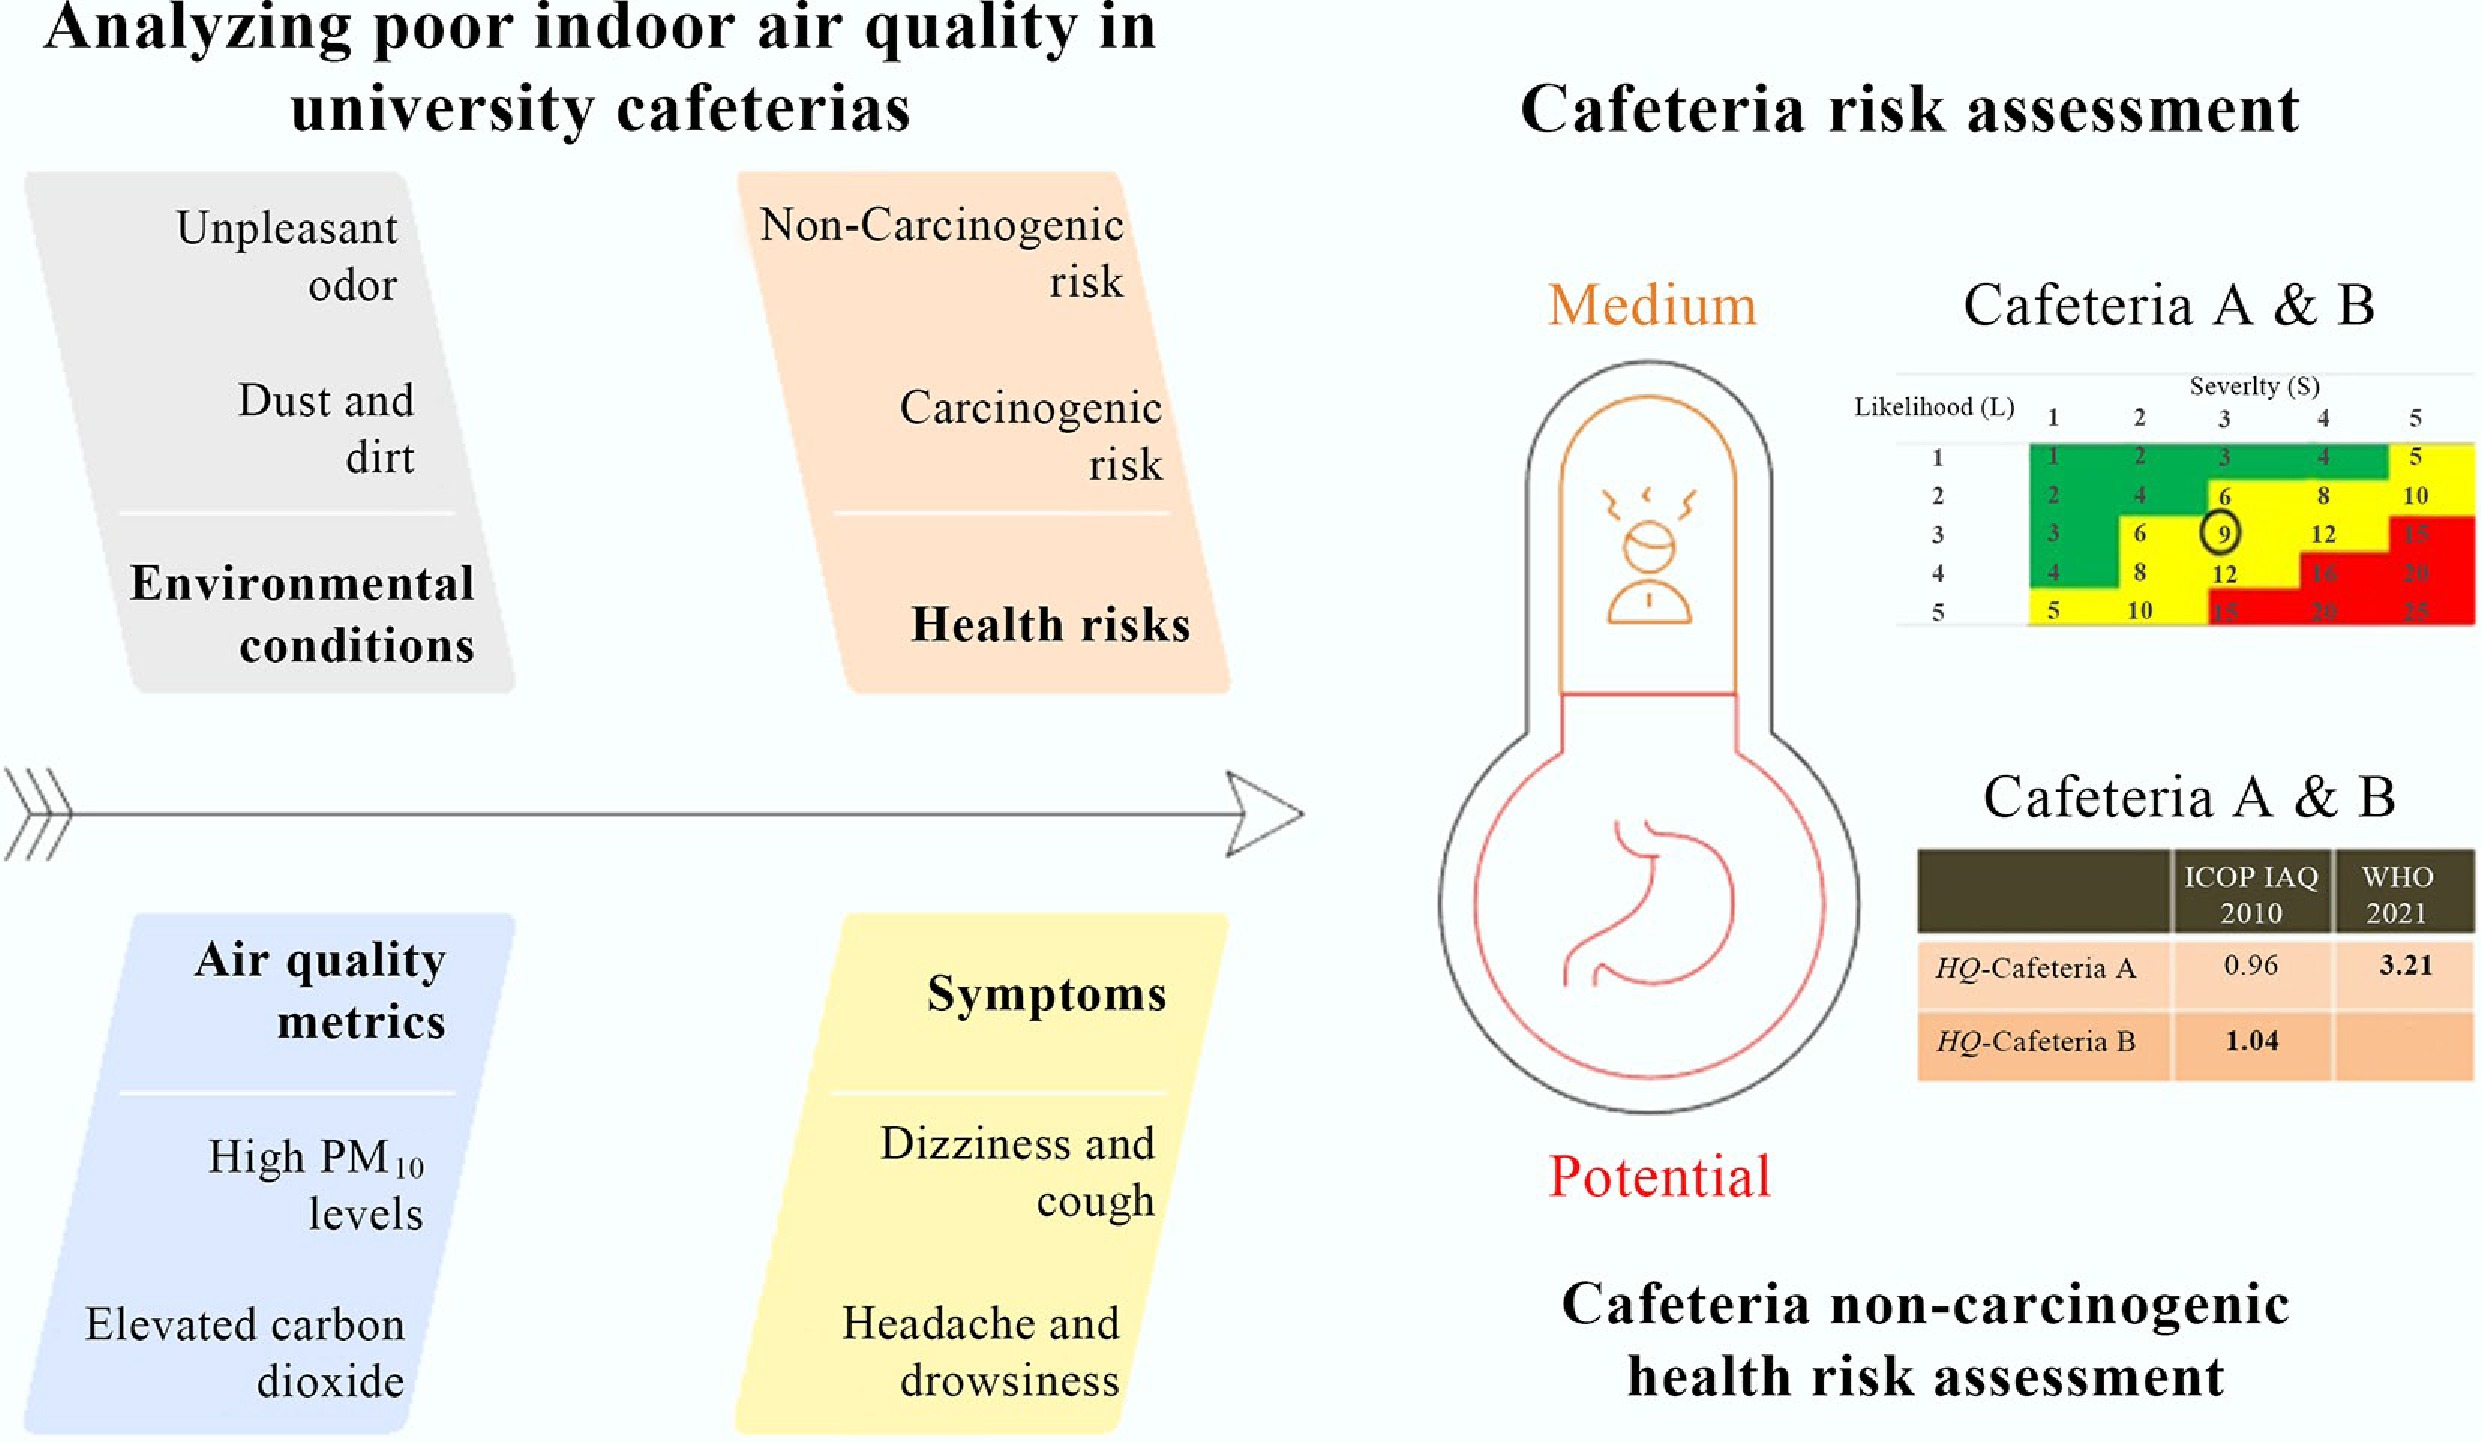
Both cafeterias had three parameters above the acceptable limit—temperature, PM10, and carbon dioxide for cafeteria A; temperature, PM10, and total bacteria counts for cafeteria B. Hence, the likelihood for both cafeterias was determined at Level three. On the other hand, 50% and 40% of occupants had experienced the three main present symptoms for cafeterias A and B, respectively. Consequently, the severity was classified as level three (serious). The calculated risk assessment for cafeterias A and B was found to be within the medium risk category, with a risk score of 9 (Appendix 1). Temporary measures and actions are required for medium risk, besides short- and long-term planned approaches for hazard control. This study is consistent with the findings of Jung et al.[42], who conducted a risk assessment of indoor air quality and associated symptoms among office workers in Korea.
Health risk assessment
-
Table 4 summarizes the exposure factors for the calculation of exposure dose in health risk assessment[13]. Based on the ICOP IAQ 2010 guidelines, the calculated non-carcinogenic hazard quotient (HQ) for PM10 exposure among adults aged 18–70 years was 0.96 in cafeteria A, and 1.04 in cafeteria B. Consistently, using the WHO 2021 guidelines, the corresponding HQ values were 1.04 and 3.48 for cafeterias A and B, respectively. An HQ value higher than 1 indicates a high potential for non-cancer adverse health effects and immediate remedial action is warranted to protect human health[13,27]. Findings suggest that PM10 associated with the total bacteria counts parameter is more hazardous than carbon dioxide through inhalation, especially for non-carcinogenic air contaminants.
Table 4. Exposure factors for calculating the exposure dose in health risk assessment
Factor Cafeteria A Cafeteria B Body weight (BW) 62 kg 62 kg Inhalation rate (InhR) 20 m3/d 20 m3/d Exposure frequency (EF) 260 d/year 260 d/year Exposure duration (ED) 50 years 50 years Averaging time (ATnoncare)a 18,250 d
(ED × 365 d)18,250 d
(ED × 365 d)Reference concentration (RfC)b 150 µg/m3 150 µg/m3 Reference concentration (RfC)c 45 µg/m3 45 µg/m3 Average concentration of PM10 in indoor air (c) 203 µg/m3 220 µg/m3 a Average years of exposure. b Value taken from ICOP IAQ 2010. c Value taken from WHO 2021. -
This study investigated indoor air quality assessment, risk assessment, and health risk assessment in university cafeterias. It was found that most of the indoor air quality parameters were below acceptable limits, except temperature, PM10, and carbon dioxide for cafeteria A, and temperature, PM10, and total bacteria counts for cafeteria B. Environmental conditions such as bad air, varying room temperature, temperature too high, dust and dirt, and unpleasant odors supported the findings of indoor air assessment and complaints. Symptoms of dizziness, coughing, and feeling heavy-headed were reported in cafeteria A, while difficulty concentrating, headache, and drowsiness were reported in cafeteria B. These were highly related to the parameters that were above acceptable limits and supported poor indoor air quality. The risk assessment with a medium risk score of 9 recommended that planned and temporary interventions are critical to mitigate the issues. Cafeteria B exhibited a higher non-cancer risk than cafeteria A. This study highlights the indoor air quality, risk assessment, and health risk assessment to safeguard human health and increase productivity. Findings of this study also provide vital information for the development of an indoor air quality database.
The authors would like to acknowledge Shaoxing University and Universiti Teknologi MARA for their support in the successful completion of the research.
-
The authors confirm their contributions to the paper as follows: Zhixin Liu: conception and design; Chia Chay Tay: conception and design, data collection, manuscript review; Nur Ijlah Wafa Abdul Rafik: data collection; Siti Norashahira Mustafa: data collection; Nor Azura Sulong: conception and design, manuscript review; Chengjue Bi: writing − original draft; XuXun Zheng: writing − original draft; Nurul Fariha Lokman: data collection; Baowei Hu: conception and design, manuscript review. All authors reviewed the results and approved the final version of the manuscript.
-
The data sets generated and analyzed in this study are available from the corresponding author upon reasonable request.
-
The authors did not receive any support from any organization for the submitted work.
-
The authors declare that they have no conflict of interest.
-
Full list of author information is available at the end of the article.
- Copyright: © 2026 by the author(s). Published by Maximum Academic Press, Fayetteville, GA. This article is an open access article distributed under Creative Commons Attribution License (CC BY 4.0), visit https://creativecommons.org/licenses/by/4.0/.
-
About this article
Cite this article
Liu Z, Tay CC, Abdul Rafik MIW, Mustafa SN, Sulong NA, et al. 2026. Indoor air quality and exposed health risks in university cafeterias. New Contaminants 2: e012 doi: 10.48130/newcontam-0026-0009 

Indoor air quality and exposed health risks in university cafeterias
- Received: 13 November 2025
- Revised: 25 February 2026
- Accepted: 05 March 2026
- Published online: 30 March 2026
Abstract: Indoor air quality is crucial for safeguarding the health and productivity of the university community. Complaints about discomfort in university cafeterias have intensified, drawing attention to poor indoor air quality and the associated elevated health risks. This study focuses on indoor air quality assessment, risk assessment, and health risk assessment in university cafeterias. The research methodology included sampling preparation, indoor air quality assessment, risk assessment, and health risk assessment. Both cafeterias A, and B exhibited temperatures and PM10 concentrations that exceeded the acceptable limits stipulated by the ICOP IAQ 2010 guidelines. In addition, carbon dioxide concentrations in cafeteria A, and total bacterial counts in cafeteria B exceeded the respective acceptable limits. Reports of poor air quality, varying and high room temperatures, with related occupant symptoms such as dizziness, coughing, and a sensation of heaviness in the head, corresponded to the complaints received, and adverse indoor air quality conditions observed in cafeteria A. For cafeteria B, environmental conditions of dust and dirt, unpleasant odors, varying room temperatures, and symptoms of difficulty concentrating, headache, and drowsiness, were consistent with the indoor air quality assessment findings. The risk assessment yielded a risk score of 9, indicating medium risk for both cafeterias. This suggests that a planned approach and temporary intervention are vital. Assessment of non-carcinogenic health risks indicated that cafeteria B posed a greater risk than cafeteria A, with a higher potential to induce adverse non-cancer health effects. This information contributes to the refinement of indoor air quality standards, supports the protection of human health, and provides a valuable foundation for the development of comprehensive indoor air quality assessment databases.
-
Key words:
- Cafeteria /
- Non-carcinogenic risk /
- Health risk /
- Indoor air quality /
- Risk assessment /
- Symptoms