ARTICLE   Open Access    

Economical substrate formulation for mushroom cultivation and food production of mushroom crackers to reduce postharvest waste

More Information
  • Received: 02 September 2023
    Revised: 02 March 2024
    Accepted: 13 March 2024
    Published online: 29 March 2024
    Studies in Fungi  9 Article number: e002 (2024)  |  Cite this article
  • Agriculture residues of oil palm waste are a big issue for palm oil producing countries. The residues from oil palm fronds are the most crucial to convert wealth. This study focused on oil palm-related agro biomass for mushroom substrate formulation for grey oyster mushroom cultivation. Mushrooms are a highly perishable vegetable that turn into postharvest waste within 4 to 7 d at normal temperatures. Therefore, in this study, the unsold mushroom was converted as a cracker food product to reduce the postharvest losses, especially for small-scale mushroom growers. The agriculture biomass used for substrate preparation is a combination of oil palm frond (OPF), oil palm empty fruit bunch (EFB), palm pressed fiber (PPF), and sawdust (SD). SD as a commercial substrate was used as a control in this study, and rice bran (RB) and lime (L) were used as supplement ingredients for all the treatments. The treatments were according to mixed formulation with the ratio of T0 (control: 97.2% SD, 0.8% RB + 2% L), T1 as a mixed ratio (60% RS + 22.2% EFB + 15% PPF + 0.8% RB + 2% L) and T2 as a mixed ratio (60% OPF + 22.2% EFB + 15% SD + 0.8% RB + 2% L). The total yield in four cycles showed 1.2 kg in T0 (sawdust), 1.4 kg in T1 (majority of rice straw), and 1.5 kg (majority of oil palm frond) in T3 treated substrate. In this study, the oil palm frond was received free of charge as compared to sawdust and rice straw. Therefore, it showed that using the oil palm frond not only gave a high yield of mushrooms at the same time, it was 100 X lower in cost. Next, the unsold yielded mushrooms were used for cracker preparation. The results obtained from this study indicate that mushroom crackers contain fat (11.34%), protein (2.19%), and carbohydrate (76.55%) while being high in moisture (7.87%) and ash (2.06%) compared to commercial potato crackers. Overall acceptance of sensory evaluation towards mushroom crackers showed a high 'extremely like' percentage, contributing about 66%. Thus, this study found that 66% of participants 'extremely liked' the new innovative mushroom crackers. Overall, the results show that oil palm substrate can be an alternative economical substrate for grey oyster mushroom cultivation and food products from mushrooms will be new items in the snack industry.
  • Tea, the second most popular and economically important beverage in the world offers numerous health benefits such as antioxidants, and the prevention of hypertension[1]. The quality of fresh leaves is the foremost element in determining economic value. Moreover, the quality of fresh leaves largely depends on soil nutritional conditions. Indeed, fertilizer management is a crucial measure in producing high-quality tea, particularly in the Jiangbei region of the southern Shaanxi Province, which is the core spring tea-producing region in China. Of late, the summer and autumn tea has also gained much attention in these regions. Considering the prominent contradiction between yield and quality faced by industrial development, a fertilization management strategy suitable for northern alpine summer tea cultivation was explored.

    In the southern Shaanxi Province, the soils are characterized by low organic matter content, ranging from 0.96–43.34 g·kg−1[2]. Therefore, the adoption of an organic-based fertilization system is urgently needed to improve soil health, enhance nutrient utilization efficiency, and promote high-quality tea production in these areas. The addition of organic fertilizers improves soil physiochemical properties including soil porosity and organic carbon content[3]. Moreover, organic fertilizers also support sustainable agricultural development due to their slow release of nutrients[4]. The soil of the experimental site, Xiaohemiao Village in Mianxian County, has a low pH, which poses a major problem in successful tea cultivation and production. On the other hand, organic fertilizers contain free hydroxyl groups, which can somehow alleviate soil acidification[5]. In bioorganic fertilizers, microbial agents contain a sufficient amount of organic matter and beneficial microorganisms that improve the soil microenvironment, increase soil enzymatic activity, and improve overall soil fertility. These conditions ultimately lead to increased crop yield[6]. Thus, the incorporation of bioorganic fertilizers would be an imperative solution to improve the soil conditions of tea plantation regions in southern Shaanxi (China).

    Reducing the application of inorganic N fertilizer is the primary direction to achieve green development goals. To date, no precise N management guidelines have been suggested for these important tea-producing areas. Some studies have also suggested that in pursuit of high yield, excessive N fertilization is commonly practiced, which, in turn, results in soil acidification. According to an estimate, the average amount of N fertilizer applied in major tea-producing areas in China is 600 kg N hm−2[7]. Excessive use of N fertilizer not only results in high input costs but also inevitably reduces nutrient utilization efficiency, damages soil quality, contributes to soil acidification, and diminishes soil buffering capacity[8]. Moreover, improper use of N fertilizer also leads to increase in greenhouse gas emissions and other soil and environmental problems[9]. The Mianxian tea plantation region has low-moderate soil N content and its utilization efficiency. Therefore, bioorganic fertilizers with large surface areas offer a sustainable solution to reduce N losses and enhance overall utilization efficiency.

    Reducing inorganic N application along with increasing the use of bioorganic fertilizers has been reported to have significant promise for achieving ecological nutrient balance and efficiency. It is estimated that about 1 million tons of applied fertilizer are wasted in China each year, highlighting the urgency of replacing chemical fertilizers with microbial fertilizers to effectively improve their utilization and alleviate the pressure on the ecological environment[10]. While bioorganic fertilizers can provide plants with the required nutrients for an extended period, their nutrient release rate is slow. In contrast, chemical fertilizers have a quick effect and are easily absorbed and utilized by plants. Overall, the reduced application of N fertilizer based on bioorganic fertilizer will be an effective measure that can regulate the nutrient release rate effectively, improve soil health, and enhance nutrient utilization rates by tea plants.

    To support China's Carbon Peak and Carbon Neutrality policy and implement the double reduction policy of fertilizer and pesticide, our study designed seven treatments based on reducing chemical N and incorporating bioorganic fertilizers to explore their effects on the yield and quality of summer tea. In this study, we hypothesized that reducing chemical N fertilizers while increasing bioorganic fertilizers, applied as a basic dose in autumn and top dressing in spring would promote soil health, tea quality, and yield in the Mianxian tea plantation region.

    The experimental site is located in the alpine tea plantation of Xiaohemiao Village, Mianxian County, Hanzhong City, Shaanxi Province (106°41'17.82" E longitude, 32°57'1.13" N latitude, 1,000–1,300 m alt.), China (Fig. 1). The site has a subtropical monsoon climate with obvious vertical climate differences and an annual average temperature and precipitation of 14.3 °C and 900 mm, respectively. Precipitation in this region is mainly concentrated in the summer and autumn seasons. The annual average frost-free period is 233 d. The soil type is yellow-brown soil. The basic soil nutrient is: pH 4.18, organic matter 18.29 g·kg−1, alkaline nitrogen 99.8 mg·kg−1, available phosphorus 4.35 mg·kg−1, rapidly available potassium 216 mg·kg−1, exchangeable magnesium 0.50 cmol·kg−1. Soil fertility is moderate to low. The tea variety used in this study was the 'Ziyangzhong', aged over 30 years. The seedlings were planted in double rows with 1 m distance between the rows. Manual picking was done for tea leaf harvesting. Fertilization management included only a base fertilizer application in the autumn season and top dressing in the spring season.

    Figure 1.  Location of experimental region.

    The organic fertilizer used in the experiment (with an organic matter content ≥ 45% and N + P2O5 + K2O ≥ 5%) was provided by China Shaanxi Ruihao Biological Co., Ltd. The nitrogen content of organic fertilizer was 3%. Microbial agents (Bacillus licheniformis, B. mucilaginosus, and B. amyloliquefaciens) were all solid inoculants provided by China Shaanxi Ruihao Biological Co., Ltd. The effective viable bacterial count of these agents was ≥ 1.0 × 10⁸ CFU g−1.

    The experiment was comprised of seven treatments including no fertilizer (N-CK), sole chemical N fertilizer at 450 kg N hm−2 (N-1), sole organic fertilizer (N-2), bioorganic fertilizer with the addition of three types of microbial agents (N-3), bioorganic fertilizer + chemical N application at 300 kg N hm−2 (N-4), 600 kg N hm−2 (N-5) and 900 kg N hm−2 (N-6). Chemical N fertilizer was applied in the form of large particle urea. The amount of organic fertilizer was 6,000 kg·hm−2, and the amount of each of three microbial agents was 6 kg·hm−2, respectively. Each treatment was set up with three replicates and followed a random block arrangement design. The area of each plot was 48 m2 (8 m × 6 m). During the observation period, all organic fertilizer and microbial agents were applied as a base fertilizer dose in mid-to-late September 2022, while only 40% of N fertilizer was applied as a base fertilizer and the remaining 60% was applied as topdressing fertilizer from late February to early March 2023. The specific fertilization plan is shown in Table 1.

    Table 1.  Nitrogen fertilizer application systems based on bioorganic fertilizers.
    Treatment Base fertilizer (mid-to-late September 2022) Additional fertilizer (late February – early March 2023)
    N Organic fertilizer Microbial agents N Organic fertilizer Microbial agents
    N-CK
    N-1 180 270
    N-2 6000
    N-3 6000 6+6+6
    N-4 120 6000 6+6+6 180
    N-5 240 6000 6+6+6 360
    N-6 360 6000 6+6+6 540
    — means no fertilization.
     | Show Table
    DownLoad: CSV

    Soil samples were collected in late June 2023. In each experimental plot, soil samples from the 0–20 cm rhizospheric soil layer were collected using the five-point sampling method. The soil bulk density and moisture content were measured immediately after sampling. Later, naturally air-dried and sieved samples were used to determine physicochemical properties.

    Determination of physical and chemical properties of tea plantation soil:

    The moisture soil contents were determined using the drying method[11]. Soil bulk density was measured using the cutting ring method[12]. Soil pH was measured using the sartorius acidimeter (PB-10) based on electrode potential method[13]. The potassium dichromate-sulfuric acid external heating method was used for soil organic matter[14]. Soil alkaline hydrolysis N content was determined based on the alkaline hydrolysis diffusion method[14]. Soil available phosphorus content was determined using the molybdenum antimony colorimetric method[14]. The available potassium content of the soil was measured using the flame photometer method[14]. The soil exchangeable magnesium content was estimated by the ammonium acetate exchange-atomic absorption method[14].

    Nitrogenpartialfactorproductivity=TeaseedlingyieldNapplication
    Nitrogenfertilizercontributionrate=(YieldinNsupplementedplotsYieldincontrolplots)YieldinNsupplementedplots×100%
    PhysiologicalNutilizationefficiency=(YieldinNsupplementedplotsYieldincontrolplots)(LeavesNuptakeinNsupplementedplotsLeavesNuptakeincontrolplots)
    AgronomicNuseefficiency=(YieldinNsupplementedplotsYieldincontrolplots)Napplicationrate

    The height and crown breadth of tea plants were measured with a tape measure. Leaf area (LA) was calculated using the formula: LA = leaf length × leaf width × 0.7. The number of new shoots sprouting from tea plants in each sample plot represented the germination density and shown as bud/m2. The method for determining 100-bud involved picking one bud and two leaves of 20 tea plants in each treatment line and then converting to 100-bud weight after weighing. The yield was calculated as the weight of one individual bud and two leaves multiplied by the number of the bud per unit area and the plot area.

    Samples of the tea plant bud, 1st leaf, and 2nd leaf were manually picked in late June 2023 and stored at −80°C after freezing in liquid nitrogen. Ground samples were used to measure nitrate reductase and glutamine synthetase activity, dry matter, tea polyphenols, water extracts, caffeine, free amino acids, malondialdehyde, proline, and soluble protein content using an ultraviolet spectrophotometer.

    Determination of key enzyme activities in nitrogen metabolism:

    Nitrate reductase activity was measured using an in vitro method[16]. Plant glutamine synthetase activity was determined according to the method outlines in the 'Handbook of Plant Physiology Experiments'[17].

    The dry matter, polyphenol, and water extract contents were measured according to the national standard GB/T 8303-2013[18], GB/T 8313-2018[19], and GB/T 8305-2013[20] methods, respectively. The caffeine content was measured according to the national standard (GB/T 8312-2013) method[21]. The free amino acid content was determined according to the national standard (GB/T 8314-2013) method[22].

    The malondialdehyde contents were determined based on the thiobarbituric acid method[23]. Proline content was determined using the acid ninhydrin method[24]. Soluble protein content was determined using the Coomassie brilliant blue method[25].

    Statistical analyses were done using Microsoft Excel 2016. The Pearson method was used to analyze the correlation between variables at significant levels of p ≤ 0.05, p ≤ 0.01 and p ≤ 0.001. Graphical presentations were made with Origin 2021, GraphPad Prism 8.0.2 and ChiPlot online software.

    Nitrogen fertilizer reduction based on bioorganic fertilizers improved soil physical properties. The tea plantation soil moisture content in summer was highest under the N-4 treatment (Fig. 2a), indicating that top-dressing in spring after applying base fertilizer in autumn is more conducive to soil water storage and moisture conservation in summer. The soil bulk density in summer was lowest under the N-3 treatment, about 34% lower than that under the CK treatment (Fig. 2b). The soil porosities increased in the following order: N-3 > N-2 > N-4 > N-5 > N-6 > N-1 > CK (Fig. 2c), suggesting that organic fertilizer improved the root's ability to absorb nutrients by increasing soil aeration.

    Figure 2.  Effect of nitrogen fertilizer reduction based on bioorganic fertilizer on the physicochemical properties including (a) soil moisture content, (b) soil bulk density, (c) soil porosity in summer under different fertilization treatments. Correlation relations are between (d) soil pH and organic matter, (e) soil organic matter and alkaline hydrolyzable nitrogen, (f) soil organic matter and available phosphorus, (g) soil organic matter and available potassium, (h) soil organic matter and exchangeable magnesium, and (i) between alkaline hydrolyzable nitrogen and exchangeable magnesium content in soil in summer.

    Topdressing N in spring after applying bioorganic fertilizer in autumn significantly increased soil organic matter and fast-effective nutrient content in summer. The soil pH of the experimental site is generally low in the summer. A positive correlation between soil organic matter content and soil pH in summer was observed, with a correlation coefficient of 0.22. That indicates that as the soil pH increases within the range suitable for the growth of tea plants, the organic matter in the soil accumulates (Fig. 2d). Compared with the control and sole chemical N treatment, the application of bioorganic fertilizer was more conducive to increasing the soil organic matter content in the summer. The soil organic matter content was the highest under the N-4 treatment, indicating that reducing N fertilizer application can improve soil organic matter content. The contents of soil alkaline hydrolyzable N, available phosphorus, and fast-effective potassium in summer are positively correlated with the soil organic matter content, with correlation coefficients of 0.47, 0.84, and 0.50, respectively (Fig. 2eg). The exchangeable magnesium content in summer is positively correlated with the soil organic matter content and alkali-hydrolyzable N content. The soil exchangeable magnesium content increased with the increase in soil organic matter and alkali-hydrolyzable N content (Fig. 2h & i). It is suggested that reducing N fertilizer based on bioorganic fertilizer can, in turn, promote chlorophyll synthesis, photosynthetic growth, and vegetative growth of tea plants in summer.

    Nitrogen fertilizer reduction based on bioorganic fertilizers improved N use efficiency in summer. The partial productivity of N fertilizer was the highest for the N-4 treatment and the values decreased with increasing N dose. The N fertilizer contribution rate was the highest under the N-5 treatment, significantly higher than the N-1 and N-6 treatments, followed by the N-4 treatment, but the difference between the two was not significant. The physiological utilization rate of N fertilizer was the highest under the N-5 treatment which was at par with the N-4 treatment. The agronomic utilization rate of N fertilizer showed a downward trend with the increase in N application rate. The agronomic N utilization rate under the N-4 treatment was significantly higher than that of other treatments in summer (Fig. 3). Therefore, moderate chemical N dose combined with bioorganic N sources was more conducive to enhancing N utilization and ultimately yield and outputs.

    Figure 3.  Effect of nitrogen fertilization treatments nitrogen use efficiency in summer tea. Note: *, ** and *** significant at p ≤ 0.05, p ≤ 0.01 and p ≤ 0.001.

    Nitrogen fertilizer reduction based on bioorganic fertilizers improved tea growth in summer and significantly promoted bud and leaf yield. The N-5 treatment depicted significantly higher plant height, followed by the N-4 treatment, compared with the N-1, N-3, and N-6 treatments (Fig. 4a). The crown breadth treated with bioorganic fertilizers was significantly higher than that of the CK treatment. The highest values were recorded for the N-5 treatment, followed by the N-4 treatment, which was significantly higher than that of sole chemical N application (Fig. 4b). The leaf area of the 3rd leaf under the N-4 and N-5 treatments was significantly larger than that of the CK and N-3 treatments (Fig. 4c). The germination densities in all chemical N treatments and sole bioorganic application (N-3) were significantly higher when compared with the CK treatment. The N-4 and N-5 treatments depicted significantly higher values of the second-round germination density than that of N-3 and N-6 treatments (Fig. 4d). The 100-bud weight under the N-4 and N-5 treatments was significantly higher than that of the CK treatment. Among them, the 100-bud weight under the N-5 treatment was the highest and significantly higher than that of the high N treatment (Fig. 4e). The tea yield under all chemical N treatments and sole bioorganic application (N-3) was significantly higher, over CK treatment. The tea yield under the N-4 and N-5 treatments was significantly higher than that of the N-1, N-2, and N-3 treatments. However, the difference between the N-4 and N-5 treatments was not significant (Fig. 4f). These results indicate that applying more N does not necessarily lead to higher growth and yield of the tea. This serves as a prominent example of 'too much is as bad as too little' in tea plantation management.

    Figure 4.  Effect of nitrogen fertilizer management treatments on (a) tea plant height, (b) plant crown breadth, (c) leaf area of the 3rd leaf, (d) germination density, (e) 100-bud weight of one bud and two leaves of summer tea plants, and (f) yield of one bud and two leaves of tea plants. Note: *, ** and *** significant at p ≤ 0.05, p≤ 0.01 and p ≤ 0.001, respectively.

    Reducing N fertilizer application based on bioorganic fertilizer improved nitrate reductase and glutamine synthetase activities. The highest nitrate reductase activity in bud and 1st leaf was observed under the N-4 treatment, while for the 2nd leaf, it was highest under the N-5 treatment. There are significant differences in the glutamine synthetase activity under different fertilization treatments. The highest glutamine synthetase activity in tea buds was recorded for the N-4 and N-5 treatments. For the 1st leaf, the highest glutamine synthetase activity was observed under the N-5 treatment, while for the 2nd leaf, the highest values were observed for the N-4 treatment (Fig. 5a).

    Figure 5.  Effect of reducing nitrogen rates based on bioorganic fertilizer on nitrate reductase, glutamine synthetase activities and quality traits of summer tea. (a) Activities of N metabolizing enzymes nitrate reductase and glutamine synthetase. (b) Dry matter, tea polyphenols, and water extract contents. (c) Caffeine and free amino acid content. (d) Correlation between free amino acid and glutamine synthetase activity. Note: *, ** and *** significant at p ≤ 0.05, p ≤ 0.01 and p ≤ 0.001.

    The application of lower chemical N fertilizer combined with bioorganic fertilizer significantly improved the quality traits, with the highest values recorded for N application at 300 kg N hm−2 combined with bioorganic fertilizer. After fertilization, the maximum dry matter content of the tea bud, 1st leaf, and 2nd leaf was recorded for the N-4 treatment which increased the values by 10%, 13%, and 15%, respectively, over the control. Similarly, N-4 treatment also recorded significantly higher polyphenol content in the tea bud and 2nd leaf. However, polyphenol content depicted a decreasing trend with increasing the N fertilizer application rate. Moreover, the polyphenol content of the 2nd leaf was lower than that of the bud and 1st leaf. Among all N treatments, the lowest water extract content in tea bud was recorded for the N-2 treatment. On the other hand, N-4 treatment depicted significantly higher water extract content in tea bud, 1st leaf, and 2nd leaf, which increased the values by 16.1%, 15.7%, and 12%, respectively, over control (Fig. 5b). Among all N treatments, N-4 treatment showed a significant decline in caffeine content in tea bud, 1st and 2nd leaves. A similar pattern was observed for free amino acids, with the N-4 treatment showing significantly higher values, followed by the N-5 treatment. The N-2 treatment increased free amino acid in tea bud, 1st leaf, and 2nd leaf by 5.5%, 8.9%, and 16.4%, respectively, over the CK treatment (Fig. 5c). There was a strong correlation between free amino acids and glutamine synthetase activity (Fig. 5d). These findings suggested that reducing chemical N fertilizer application is crucial in controlling the formation of excellent-quality tea with low caffeine and high amino acids concentrations.

    Applying bioorganic fertilizer and reducing chemical N dose proved effective in reducing oxidative damage caused by intense light and high-temperature stress during summer. The malondialdehyde content in tea bud, 1st leaf, and the 2nd leaf was observed under the N-3 treatment, showing a decrease of 23.8%, 20.6%, and 19.6%, respectively, compared with the CK treatment. The lowest malondialdehyde content in these plant organs was depicted for the N-4 and N-5 treatments. The highest soluble protein content in the bud and 2nd leaf was observed in the N-4 and N-5 treatments. For the 1st leaf, the highest soluble protein content was recorded in the N-5 treatment, followed by the N-4 treatment. While the high N fertilizer treatment was most beneficial for the proline content in the bud, 1st leaf, and 2nd leaf among all N application treatments, the associated costs were considerably higher (Fig. 6).

    Figure 6.  Effect of reducing nitrogen rates based on bioorganic fertilizer on stress related indices in tea organs. (a) Malondialdehyde, proline, and soluble protein contents in the bud. (b) Malondialdehyde, proline, and soluble protein contents in the 1st leaf. (c) Malondialdehyde, proline, and soluble protein contents in the 2nd leaf.

    Sustained soil physicochemical properties play an important role in improving soil quality and supporting normal plant growth[26]. Application of organic fertilizers is the most effective measure to improve soil fertility and microbial community structure over the long term[27]. The combined application of bioorganic and chemical fertilizers can effectively stabilize the soil properties and provide sufficient nutrients for better crop growth. Microbial agents from the Bacillus family, including Bacillus licheniformis, Bacillus mucilaginosus and Bacillus amyloliquefaciens can effectively inhibit the growth of certain plant pathogens and enhance plant resistance due to the secretion of antibiotics, active substances, and secondary metabolites such as iturin, surfactin, and fengycin, which have strong resistance to different pathogens[28]. According to Zhou et al., organic fertilizers increase soil water content, organic matter, and porosity, and reduces soil bulk density. However, sole chemical fertilizer application results in compacted soil particles, thus, in turn, reducing soil water content and porosity[29]. Moreover, the combined application of organic and inorganic N fertilizers have also been reported to improve soil nutrient supply, ensure efficient plant growth, and enable rational distribution of dry matter for better harvest index and yield[30]. Interestingly, Hooks et al. reported significantly similar above-ground fresh and dry weights of lettuce under organic fertilizers enriched with microbial inoculants and a control treatment without any amendment. However, organic fertilizer without any microbial inoculant resulted in 17% lower values of these traits in lettuce[31]. For soil properties, some previous studies have found that the combined application of organic and inorganic fertilizers can increase soil pH and enhance soil acid-base buffering capacity[32]. In this work, no significant effect of chemical N and bioorganic fertilizer on soil pH in Mianxian County was found. This might be explained by the fact that the application of whole N as base fertilizer dose increases soil pH, while top-dressing decreases the pH.

    The right amount of N is conducive to normal tea growth and development, as well as achieving reasonable yield and quality[33]. However, excessive N application results in higher retention of assimilates in leaves and new shoots, thereby adversely affecting root growth. Similarly, an excessive dose of N also leads to a decline in nutrient utilization efficiency, increased input costs, nitrate pollution, and poses a hazard to the ecological environment[34]. Recently, Pan et al. showed that a moderate reduction in N can improve crop productivity. This improvement is linked to enhanced soil physicochemical conditions, that promoted the elongation and growth of the root. This facilitates increased absorption and transportation of nutrients by the root system, leading to greater accumulation of dry matter in stems and leaves. Consequently, this enhancement contributes to increased N partial factor productivity[35]. Previously, numerous studies indicated a positive correlation between tea polyphenol content and the amount of N applied[36,37]. However, a high N supply has been shown in some experiments to increase the allocation of photosynthetic assimilation towards protein synthesis in the tea plant, consequently reducing the conversion to polyphenols. This decrease in polyphenol content and water extract proves detrimental to the quality of black tea[38,39]. The results of this experiment are consistent with previous studies. The amino acids in tea greatly influence its sensory characteristics. Therefore, the amino acid content in tea serves as a crucial indicator of tea quality, directly impacting the profitability. N application significantly influences the amino acid contents in tea. Excessive nitrogen tends to result in tea leaves with a dominant presence of arginine and lower levels of theanine. As arginine imparts a bitter and astringent taste, this imbalance adversely affects tea quality[40,41].

    In recent years, due to global warming, the frequency of extreme summer heat, drought, and other disasters has increased significantly. Currently, tea plantation diseases triggered by these climatic disasters have severely affected the growth and development of tea plants, leading to a decline in the quality of tea leaves. Malondialdehyde, a byproduct of lipid peroxidation, serves as an indicator of the extent of oxidative damage to cell membranes[42]. In this study, reducing the chemical N dose based on bioorganic fertilizers resulted in reduced malondialdehyde content and increased resistance in tea plants to summer conditions. Soluble proteins play a crucial role in maintaining the normal morphology of plant cells. Serving as important nutrients, they also function as osmoregulatory substances and are often used as a measure of plant stress tolerance[43]. In this work, reducing the chemical N dose based on bioorganic fertilizers favored the accumulation of soluble protein in tea plants. Similarly, proline also acts as an osmoregulatory substance in crop plants. Under stress conditions, proline helps eliminate various free radicals produced during adversity, participates in plant N metabolism, and releases energy. It can also act as a signaling molecule to induce other biochemical reactions[44]. While the high N fertilizer treatment based on bioorganic fertilizers in this study was more beneficial for the accumulation of proline in tea plants compared to other N treatments. It can also improve stress tolerance, but it will increase the cost. Therefore, considering this factor, lower concentrations of N based on bioorganic fertilizers remain more effective in reducing the damage of summer stress on tea plants.

    In conclusion, establishing a scientific and balanced pattern of base fertilizer and top dressing is crucial for ensuring both tea yield and quality. In southern Shaanxi tea plantations, the application of base fertilizer, often containing a certain amount of N, has been prioritized for many years. Typically, nitrogen fertilization is reduced or even discontinued in early spring, following the autumn application. The results of this study indicate that supplementing with bioorganic fertilizer in autumn and applying moderate N fertilizer at least once in spring significantly enhances both the yield and quality of summer tea. This model serves as an exemplary approach for the scientific, cost-effective, and efficient application of N fertilizer in northern tea plantations.

    The combination of reduced chemical N dose (300 kg N hm−2) with bioorganic fertilizer not only effectively improves soil fertility in the summer alpine tea plantation but also enhances yield, N utilization efficiency, and facilitates increased nitrate reductase and glutamine synthetase activities. These factors promote nutrient accumulation in the tea and enhance the resistance to harsh summer conditions. A study by Dai et al. showed that the amount of nitrogen fertilizer application differentially affects soil fertility of tea plantations with different fertilities: when tea plantations with low fertility are applied with 300 kg·hm−2 nitrogen and those with high fertility are applied with 150 kg·hm−2 nitrogen, the contents of carbon and nitrogen nutrients are relatively high[45]. In tea plantation management, proper fertilizer application according to local conditions is an essential measure to improve soil fertility. Our field research on soil organic matters of northern tea plantations showed that the content of soil organic matter in Motuo County is relatively high, followed by that of Chayu County. The content in Mianxian County is relatively low, which is 18.29 g·kg−1, ranking as the level 4 in national soil nutrient content. More tea plantations have relatively lower organic matter content due to nutrient leaching in mountainous terrain, which constrains the development of the tea industry. Moreover, the content of alkaline nitrogen of soil in Mianxian County is 99.8 mg·kg−1, ranking as level 3 in national soil nutrient content[46]. There is a lot of room for improvement in nitrogen utilization efficiency. Therefore, the nitrogen application of 300 kg N hm−2 is not too high, given that the soil fertility is relatively low in Mianxian County as the northern tea plantations and nutrient leaching is likely to occur in mountain tea plantations. Hence, this N management model is worthy of further promotion in tea plantations facing soil acidification in the north. Additionally, it can serve as a quarterly fertilizer management reference for most tea plantations with acidified soils in the south.

    The authors confirm contribution to the paper as follows: study conception and design: Gong C, Bai J, Shi R, Wang Y, Chen E, Wang C; experiments performed: Shi R, Wang Y, Zhou F, Chen E; data analysis: Shi R, Wang Y, Zhou F; draft manuscript preparation: Shi R, Hussain S, Lei X. All authors reviewed the results and approved the final version of the manuscript.

    Due to administrative requirements, the original data of the experiments during the research period of the project are not available to the public, but available from the corresponding author or the first author upon reasonable request.

    This research was supported by Key Research and Development Project of the Tibetan Autonomous Region Department of Science and Technology (XZ202401ZY0019) and the Key Agricultural Core Technology Research Project of Agriculture and Rural Affairs Department of Shaanxi Province (2023NYGG009).

  • The authors declare that they have no conflict of interest.

  • [1]

    Daniel JR, Baars J, Tan Q. 2017. Current overview of mushroom production in the world. In Edible and Medicinal Mushrooms: Technology and Applications, eds. Diego ZC, Giménez PA. New York, United States: John Wiley & Sons. pp. 5−13. https://doi.org/10.1002/9781119149446.ch2

    [2]

    Balan V, Zhu W, Krishnamoorthy H, Benhaddou D, Mowrer J, et al. 2022. Challenges and opportunities in producing high-quality edible mushrooms from lignocellulosic biomass in a small scale. Applied Microbiology and Biotechnology 106:1355−74

    Google Scholar

    [3]

    Poh PE, Wu TY, Lam WH, Poon WC, Lim CS. 2020. Oil palm plantation wastes. In Waste Management in the Palm Oil Industry. Green Energy and Technology. Cham: Springer. pp. 5−20. https://doi.org/10.1007/978-3-030-39550-6_2

    [4]

    Thakur MP. 2018. Advances in post-harvest technology and value additions of edible mushrooms. Indian Phytopathology 71:303−15

    doi: 10.1007/s42360-018-0060-9

    CrossRef   Google Scholar

    [5]

    Dawadi E, Magar PB, Bhandari S, Subedi S, Shrestha S and Shrestha, J. 2022. Nutritional and post-harvest quality preservation of mushrooms: A review. Heliyon 8:e12093

    doi: 10.1016/j.heliyon.2022.e12093

    CrossRef   Google Scholar

    [6]

    Riaz MN. 2006. Extruded snacks. In Handbook of food science, technology, and engineering. Vol.4. pp. 168

    [7]

    Godswill AC. 2019. Proximate composition and functional properties of different grain flour composites for industrial applications. International Journal of Food Sciences 2:43−64

    doi: 10.47604/ijf.1010

    CrossRef   Google Scholar

    [8]

    Naher L, Mazlan NA, Hamzah NAB, Islam S, Ab Rhaman S. 2022. Palm press fibre and rice straw for cultivation grey oyster mushroom (Pleurotus sajor-caju). Sains Malaysiana 51:1305−15

    doi: 10.17576/jsm-2022-5105-03

    CrossRef   Google Scholar

    [9]

    Sulaiman NS. 2019. Physical properties and sensory acceptability of cracker made from pumpkin (Cucurbita moschata) flour during storage. Thesis. Universiti of Malaysia Kelantan, Malaysia. http://discol.umk.edu.my/id/eprint/4713/

    [10]

    Loh SJ. 2020. Comparative studies of physicochemical and texture profile analysis of sweet potatoes (Ipomoea batatas) cookies from different variation of sweet potatoes. Thesis. University of Malaysia Kelantan, Malaysia. http://discol.umk.edu.my/id/eprint/4194/

    [11]

    Khalid SK, Ismail-Fitry MR, Mat Yusoff M, Halim HH, Jaafar AH, et al. 2021. Different maturities and varieties of coconut (Cocos nucifera L.) flesh as fat replacers in reduced-fat meatballs. Sains Malaysiana 50:2219−28

    doi: 10.17576/jsm-2021-5008-07

    CrossRef   Google Scholar

    [12]

    Setaiboma W, Kristanti D. 2021. Quality of physicochemical and sensory of mushroom (Pleurotus ostreatus) chicken nuggets with carrageenan and konjac as hydrocolloids. IOP Conference Series: Materials Science and Engineering 1011:012014

    doi: 10.1088/1757-899X/1011/1/012014

    CrossRef   Google Scholar

    [13]

    Lu X, Brennan MA, Serventi L, Mason S, Brennan CS. 2016. How the inclusion of mushroom powder can affect the physicochemical characteristics of pasta. International Journal of Food Science and Technology 51:2433−39

    doi: 10.1111/ijfs.13246

    CrossRef   Google Scholar

    [14]

    Tunick MH, Onwulata CI, Thomas AE, Phillips JG, Mukhopadhyay S, et al. 2013. Critical evaluation of crispy and crunchy textures: a review. International Journal of Food Properties 16:949−63

    doi: 10.1080/10942912.2011.573116

    CrossRef   Google Scholar

    [15]

    Nicole TZH, Nichelle TS, Elizabeth TE, Yuliarti O. 2021. Formulation of functional crackers enriched with fermented soybean (tempeh) paste: rheological and microstructural properties. Future Foods 4:100050

    doi: 10.1016/j.fufo.2021.100050

    CrossRef   Google Scholar

    [16]

    Haverkort AJ, Linnemann AR, Struik PC, Wiskerke JSC. 2023. On Processing Potato 2. Survey of Products, Processes and Operations in Manufacturing. Potato Research 66:339−83

    doi: 10.1007/s11540-022-09563-y

    CrossRef   Google Scholar

    [17]

    Djafari Petroudy SR, Rahmani N, Rasooly Garmaroody E, Rudi H, Ramezani O. 2019. Comparative study of cellulose and lignocellulose nanopapers prepared from hard wood pulps: Morphological, structural and barrier properties. International Journal of Biological Macromolecules 135:515−20

    doi: 10.1016/j.ijbiomac.2019.05.212

    CrossRef   Google Scholar

    [18]

    Butnariu M, Sarac I. 2019. What is sodium glutamate and what effects it has on health. Journal of Applied Biotechnology and Bioengineering 6:223−26

    doi: 10.15406/jabb.2019.06.00195

    CrossRef   Google Scholar

    [19]

    Bera TK, Kar SK, Yadav PK, Mukherjee P, Yadav S, et al. 2017. Effects of monosodium glutamate on human health: A systematic review. World Journal of Pharmaceutical sciences 5(5):139−44

    Google Scholar

    [20]

    MacLeod M. 2022. Home of Food Label. Reading and Understanding Food Labels and Nutrition Info Beaumont Health. www.beaumont.org/conditions/reading-a-food-label (Retrieved December 31, 2022)

    [21]

    Yahya F, Yusof N, Chen C. 2017. Effect of varying ratios of oyster mushroom powder to tapioca flour on the physicochemical properties and sensory acceptability of fried mushroom crackers. Malaysian Applied Biology 46:57−62

    Google Scholar

    [22]

    Ng SH, Robert SD, Wan Ahmad WA, Wan Ishak WR. 2017. Incorporation of dietary fibre-rich oyster mushroom (Pleurotus sajor-caju) powder improves postprandial glycaemic response by interfering with starch granule structure and starch digestibility of biscuit. Food Chemistry 227:358−68

    doi: 10.1016/j.foodchem.2017.01.108

    CrossRef   Google Scholar

    [23]

    Granite S. 2022. Ash determination: Ash content: Food samples. Precisa. www.precisa.com/blog/ash-content-in-food-analysis (Retrieved December 25, 2022)

    [24]

    Rahmah NL, Sukardi, Wulantiasari W, Wijayanti N. 2020. Physicochemical properties of oyster mushroom flavouring powder. IOP Conference Series: Earth and Environmental Science 443:012009

    doi: 10.1088/1755-1315/443/1/012009

    CrossRef   Google Scholar

    [25]

    Zhou S, Ma F, Zhang X, Zhang J. 2016. Carbohydrate changes during growth and fruiting in Pleurotus ostreatus. Fungal Biology 120:852−21

    doi: 10.1016/j.funbio.2016.03.007

    CrossRef   Google Scholar

    [26]

    Roshita I, Liyana NF, Adzemi MA, Zain SHM. 2015. The growth and post harvest performances of different species of osyter mushroom (Pleurotus sp.) cultivated on sawdust and oil palm frond. Malaysian Applied Biology 44:75−82

    Google Scholar

  • Cite this article

    Naher L, Mustaffa Bakri NA, Muhammad Sukhri SAN, Nik Hassan NR, Mohd Firdaus Ganga H, et al. 2024. Economical substrate formulation for mushroom cultivation and food production of mushroom crackers to reduce postharvest waste. Studies in Fungi 9: e002 doi: 10.48130/sif-2024-0003
    Naher L, Mustaffa Bakri NA, Muhammad Sukhri SAN, Nik Hassan NR, Mohd Firdaus Ganga H, et al. 2024. Economical substrate formulation for mushroom cultivation and food production of mushroom crackers to reduce postharvest waste. Studies in Fungi 9: e002 doi: 10.48130/sif-2024-0003

Figures(1)  /  Tables(7)

Article Metrics

Article views(4124) PDF downloads(1402)

ARTICLE   Open Access    

Economical substrate formulation for mushroom cultivation and food production of mushroom crackers to reduce postharvest waste

Studies in Fungi  9 Article number: e002  (2024)  |  Cite this article

Abstract: Agriculture residues of oil palm waste are a big issue for palm oil producing countries. The residues from oil palm fronds are the most crucial to convert wealth. This study focused on oil palm-related agro biomass for mushroom substrate formulation for grey oyster mushroom cultivation. Mushrooms are a highly perishable vegetable that turn into postharvest waste within 4 to 7 d at normal temperatures. Therefore, in this study, the unsold mushroom was converted as a cracker food product to reduce the postharvest losses, especially for small-scale mushroom growers. The agriculture biomass used for substrate preparation is a combination of oil palm frond (OPF), oil palm empty fruit bunch (EFB), palm pressed fiber (PPF), and sawdust (SD). SD as a commercial substrate was used as a control in this study, and rice bran (RB) and lime (L) were used as supplement ingredients for all the treatments. The treatments were according to mixed formulation with the ratio of T0 (control: 97.2% SD, 0.8% RB + 2% L), T1 as a mixed ratio (60% RS + 22.2% EFB + 15% PPF + 0.8% RB + 2% L) and T2 as a mixed ratio (60% OPF + 22.2% EFB + 15% SD + 0.8% RB + 2% L). The total yield in four cycles showed 1.2 kg in T0 (sawdust), 1.4 kg in T1 (majority of rice straw), and 1.5 kg (majority of oil palm frond) in T3 treated substrate. In this study, the oil palm frond was received free of charge as compared to sawdust and rice straw. Therefore, it showed that using the oil palm frond not only gave a high yield of mushrooms at the same time, it was 100 X lower in cost. Next, the unsold yielded mushrooms were used for cracker preparation. The results obtained from this study indicate that mushroom crackers contain fat (11.34%), protein (2.19%), and carbohydrate (76.55%) while being high in moisture (7.87%) and ash (2.06%) compared to commercial potato crackers. Overall acceptance of sensory evaluation towards mushroom crackers showed a high 'extremely like' percentage, contributing about 66%. Thus, this study found that 66% of participants 'extremely liked' the new innovative mushroom crackers. Overall, the results show that oil palm substrate can be an alternative economical substrate for grey oyster mushroom cultivation and food products from mushrooms will be new items in the snack industry.

    • Edible mushrooms are a rich source of nutrition as well as income generation for many poor communities. The mushroom industry is quickly gaining the attention of many entrepreneurs, particularly young ones. Due to concerns about health issues, mushrooms are in high demand among the general public, particularly in developed countries, as a medicinal product as well as a health food worldwide[1]. Grey oyster mushroom (Pleurotus sajor caju) is a popular mushroom in the edible group of mushrooms. The cultivation of grey oyster mushrooms requires high humidity of 95%−100% with temperatures between 28 to 30 °C , no exposure to sunlight and a good substrate material of lignocellulose agro-biomass[2]. Oil palm plants are a good source of lignocellulose plants. On the other hand, palm oil-producing countries including Malaysia, Indonesia, Africa, Papua New Guinea, and America face problems due to the vast amount of the plant residue management, especially for oil palm fronds[3]. Based on the economic conditions of using oil palm ago-residues such as oil palm frond and empty fruit bunch to convert mushroom substrates, will especially benefit the rural farmers. The global mushroom market is showing that the demand is projected to rise from 15.25 million tonnes in 2021 to 24.05 million tonnes in 2028 at a CAGR of 6.74% in the forecast period. Hence, the future economic value of mushrooms is predicted to be very high. However, to fulfil the demand of the market, growers need different types of good quality mushroom substrate rather than depending on a single substrate. In Malaysia, the grey oyster is one of the most popular edible mushrooms, mainly cultivated using rubber sawdust substrate. Therefore, mushroom growers often face problems with material supply due to the high demand for rubber sawdust. Besides mushroom cultivation, sawdust is also used for poultry farming; therefore, using oil palm-based residue substrates can be introduced in two factors as waste management and also for a newly formulated substrate.

      Mushrooms are a highly perishable vegetable crop. Mushrooms structurally do not consist of cuticles, which influences the high moisture content, and only 10% is fiber content. According to Thakur[4], numerous phytochemicals, enzymes, primary metabolites, and secondary mycometabolites cause sudden degradation, short shelf life, and high postharvest losses (30%–35%). In addition, fresh mushrooms have a short shelf life, which is within 1 to 8 d which will reduce their economic value[4]. After harvest, mushrooms undergo a series of quality degradations, including moisture loss, discolouration, texture changes, off-flavour, and nutrient loss[5]. The moisture content of fresh mushrooms ranges from 85% to 95%[6].

      As a result of their high moisture content, mushrooms should be preserved at low temperatures to prevent microbial infection. Mushrooms gradually lose moisture during the postharvest period, which causes ongoing weight reduction. Due to water loss and enzyme activity, postharvest mushrooms' colour shows a browning tendency, impacting customer purchase decisions[5]. Thus, the growers of mushrooms, especially in rural areas, often face postharvest losses. Therefore, our study also focused on easy product conversion from mushrooms.

    • Empty fruit bunch, palm pressed fiber, and oil palm fronds were freely collected from the palm oil plantation at Felda Kemahang, Tanah Merah, Kelantan, Malaysia. Rice straw was purchased from a paddy farmer in the Tumpat, Kelantan area after the harvesting season, and sawdust was purchased from the soil oil mill at Jeli, Kelantan.

    • The substrates, such as the empty fruit bunches (EFP), were shredded into small pieces, and the rice straw was cut into small pieces using a cutter machine. The oil palm fronds were cut into an appropriate size due to the hardwood used and ground using a grinder machine at ATP. After cutting, the substrates such as EFB, PPF, and RS were soaked overnight to reduce any excess water. On the next day, all the substrates were rinsed with clean water and put on the newspaper or plastics to dry for a few days under sunlight. All the dried materials were again ground using a grinding machine to obtain a smooth size (1.00 mm) for ease of mycelia penetration during mycelium colonization.

    • All the composition substrates including calcium carbonate, and rice bran as an additional supplement for mycelia growth, were mixed with a mixing machine and took around half an hour to mix well as shown in Table 1. Distilled water was added to retain moisture for mycelia growth, and each treatment was added to least two bottles (9.5 L/bottle). Moisture content should be in the 70 to 75% range. Before filling the substrates into the sawdust bag, the pH reader was checked for each treatment.

      Table 1.  Substrate composition.

      Substrate/
      treatment
      Composition of substrate
      T0 (Control)97.2% SD + 0.8% RB + 2% L
      T1 (Mixed)60% RS + 22.2% EFB + 15% PPF + 0.8% RB + 2% L
      T2 (Mixed)60% OPF + 22.2% EFB + 15% SD + 0.8% RB + 2% L
      OPF, Oil Palm Frond; EFB, Empty Fruit Bunch; PPF, Palm Pressed Fibre; SD, Sawdust; RB, Rice bran; L, Lime.

      The mixed prepared substrates for each treatment were then filled into a polyethylene (PE) bag (9'' × 15''), and the medium was pressed manually by hand to ensure it was as compact as possible, resulting in 500 g/bag. The medium was then closed with a PVC neck set. The blocks were then autoclaved to prevent contamination. After autoclaving, the sterilized substrate bags were put in a mushroom lab to cool. Next, 1-2 g of mushroom spawn were added to the blocks and all the blocks were arranged on the racks by each treatment for incubation in the mushroom lab. After mycelium was fully colonized, all the blocks showed primordia to produce the mushroom fruiting body. The harvested mushroom was recorded for total yield and biological efficiency to determine the best potential substrate mushroom for production. The biological efficiency was conducted based on the following formula:

      Biological efficiency, BE (%)= Weight of harvest  Weight of dry substratte ×100%
    • Unsold and leftover fresh mushrooms were cleaned and dried in sunlight for 2 d. The dried mushrooms were then ground into powder using a blender at the Food Laboratory (UMK, Malaysia). For the cracker preparation, the ingredients of PH (not stated due to copyright) were boiled to make a mash. A cup of water was transferred to a pot to boil, PH was then slowly added to the boiled water. In the meantime, further boiled water was added, and the ingredient CFH (not stated due to copyright) was slowly added until a rough dough formed in the pot. After mixing the CFH, the dough was transferred to a large plate. Next, another dry ingredient, such as a teaspoon of pepper powder, was added to the dough. Mushroom powder (approximately 10%) was added according to the final weight of 250 g of the dough. The dough was then divided into four to five parts. After 24 h under refrigeration, each dough piece was cut into thin pieces. Next, the crackers were dried using sunlight for at least two days to ensure the crackers were well dried. Finally, then the dried crackers were analysed for proximate analysis and sensory evaluation of participants.

    • Proximate analysis is a chemical analysis method to identify food substance nutritional content such as protein, carbohydrates, fat, and fibre[7]. The analysis results were presented as grades in units of %. The proximate analysis had benefits as an assessment of the quality of the food ingredients, especially on the standard of food substances they should contain.

    • Protein content of the mushroom powder, mushroom cracker and commerical crackers was determined using the Kjeldhal method according to the procedures of AOAC with some modification. This method involves three stages which are digestion, distillation and titration following the procedure of Naher et al.[8]. Crude protein was calculated using the following formulas:

      i) Calculate for N2 content:

      %ofN2=(TB)×N×1.4007weightofsample(g)

      ii) Crude protein = N2% × 6.25

    • Two grams of each mushroom cracker, mushroom powder and commercial cracker were weighed and transferred onto clean, dry, and pre-weighed crucibles, respectively. The samples and crucible were kept in a muffle furnace at 550 °C for 6 h. Then, the sample was cooled in a desiccator and weighed. The fat content was determined using the Soxhlet extractor method with some modifications following the procedure of Naher et al.[8].

      The ash and fat content for mushroom cracker and powder was calculated using the following formula:

      Percentage(%)ofAsh/Fatcontent=W1W2W×100

      Where: W1 = weight of final cup, W2 = weight of initial cup, W = weight of sample

      The formula for the percentage of carbohydrates determined the carbohydrate content of mushroom crackers, mushroom powder, and commercial crackers. The equation below was used to calculate the carbohydrate content:

      Totalcarbohydrate%=100(Moisture+Protein+Ash+Fat)
    • The physical attributes of mushroom crackers were analysed based on texture (crispiness, hardness, cohesiveness), moisture, and colour. The moisture analysis of the mushroom crackers was performed using the moisture analyzer A&D Heat-Drying Moisture Meter MX-50. A moisture analyzer weighed the sample of mushroom crackers. Then, the analyzer heated the sample at 180 ℃ until the sample dried. Lastly, the sample was weighed again, and the result recorded.

      The texture analysis of a mushroom cracker was designed to mimic biting person. The Brookfield CT3 Texture Analyzer with TA-MTP fixture was used to run the mushroom cracker test. The chip sample was penetrated using a stainless-steel cylinder probe type TA7 with a trigger load of 5 g and a speed of 5.00 mm/s[9]. The texture analysis parameters were set, and the mushroom cracker and commercial potato cracker (control) were positioned beneath the probe. Texture analyzers concentrate on the mushroom cracker's hardness, breaking strength, and cohesion. The data sample was recorded in triplicate.

      The Hunter Lab Colorimeter's optical sensor was placed on top of the mushroom cracker. A colour metre (Konica Minolta CR-400) was used to determine the product's colour for the instrumental measurement[10]. The mushroom cracker and commercial potato cracker (control) samples were tested. Each sample's colour was measured in the CIE L* a* b* colour space, and the results were reported in terms of lightness (L*), redness or red-green (a*), and yellowness or yellow-blue (b*)[11]. The data samples were recorded in triplicate.

    • The method of sensory evaluation was applied by evaluation of four sensory attributes, which are the number of crackers, texture or feel, colour, richness and overall acceptability of the cracker samples using a 4-point hedonic scale, in which the lowest value (1) stands for extreme dislike while the highest value (4) represents an extreme like (Table 2)[12]. Fifty participants were selected to take part in the determination of the sensory evaluation of mushroom crackers. Before tasting a mushroom cracker, plain water was served to participants to neutralize their mouthfeel and the tasting was carried out under good lighting to determine the colour of the crackers.

      Table 2.  Survey form for the sensory evaluation of mushroom crackers.

      ItemsExtremely
      like 4
      Like 3Dislike 2Extremely dislike 1
      Number of crackersCracker in every biteCracker in 75% chipsCracker in 50% chips< 50% cracker
      Texture/
      feel
      Consistently crispy and crunchy chewyChewy middle, crispy edgesCrunchy
      only and
      not crispy
      Less crunchy and not crispy
      ColourEven golden brownBrown with pale centreVery brownBurned
      RichnessEdible Less oilyMedium oilyHigh oily
    • All the parameters including total yield of mushrooms, biological efficiency from each treatment, proximate, physical attributes of mushroom crackers as well as sensory assessment information were collected and processed using IBM SPSS version 26 for the statistical analysis. The significance of the differences in the data was determined using an independent t-test, as well as ANOVA analysis. The significant differences in the mean values were determined at the 95% confidence interval level of (p < 0.05).

    • The species of grey oyster (Pleurotus ostreatus) mushroom was cultivated for two months in the mushroom house, at UMK Jeli campus, Malaysia. A total of 45 blocks were cultivated in three different treated substrates in three replicates. The total yield was recorded until the 4th cycle for two months. The results showed (Fig. 1) that oil palm frond majority substrate (T2) produced a higher yield (1.5 kg), while the 2nd highest (1.4 kg) was rice straw substrate (T1) and the lowest (1.2 kg) was sawdust substrate (T0).
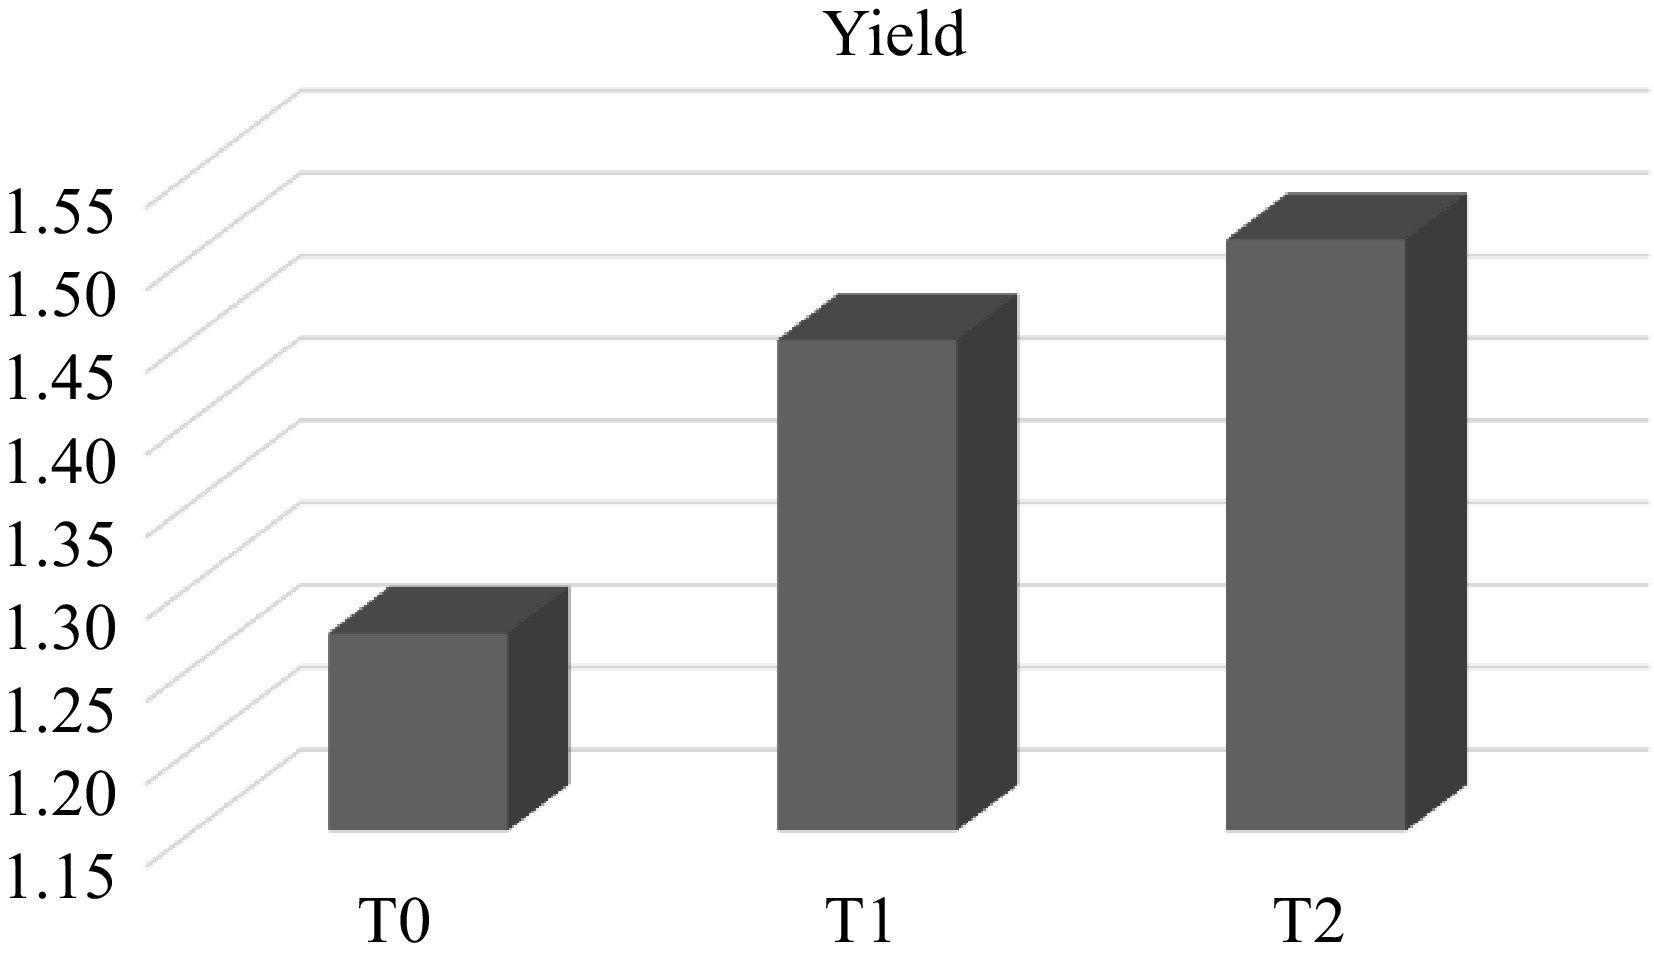
      Figure 1. 

      Total yield performance of grey oyster mushroom on different treated substrates.

      For income performance, the individual block preparation cost, yield in four cycles, selling price and net income of each substrate per block are shown in Table 3. T2 was 100 g/block which was higher than T0 and T1. For net income comparison, we make T0 or control a constant of 100% yield, which was compared with T1 and T2 total yield performance. The result showed T2 yield performance was 115% which was 15% higher than T0 (Table 3). The total cost per block also sowed in oil palm form was lowest in T2 as RM 0.60 as compare to T0 and T1. Therefore, the net income of T2 (RM 0.70) was higher than the control (RM 0.38) and T1 (RM 0.53) in Table 3.

      Table 3.  Income performance of each of the substrate treated mushroom yield.

      ProductsCost (RM)/blockYield/ block /selling priceYield performance/ income/block
      T0 (Sawdust commercial/control)0.7486.7 g/RM 1.12100%/RM 0.38
      T1 (RS + EFB + PPF)0.7593 g/RM 1.2107% (7% >)/RM 0.53
      T2 (OPF + EFB + sawdust)0.60100 g/RM 1.30115% (15% >)/RM 0.70
    • Proximate analysis was performed to determine the protein, fat, ash, moisture and carbohydrate content. The result shows that there was a significant difference (p < 0.05) in ash, fat and moisture content between commercial potato and mushroom cracker (Table 4). While, no significant difference (p > 0.05) was found in protein and carbohydrate between commercial potato and mushroom cracker (Table 4).

      Table 4.  Proximate analysis of mushroom cracker and commercial cracker.

      SampleMushroom cracker (1 g)Commercial potato
      cracker (1 g)
      Protein (%)2.19 ± 0.902.22 ± 0.10
      Fat (%)11.335 ± 0.306112.8283 ± 0.2475
      Ash (%)2.0567 ± 0.12011.4667 ± 0.2566
      Moisture (%)7.8733 ± 0.22196.15 ± 0.5
      Carbohydrate (%)76.5467 ± 0.1250377.3350 ± 0.5327
    • The colour property analysis of mushroom cracker and commercial potato cracker is shown in Table 5. The results found that mushroom crackers had the lowest value (55.89 ± 1.0017) of L* while commercial potato crackers showed higher values (62.8033 ± 0.1721). According to the value, L* indicate lightness. This shows that the colour of the mushroom cracker is darker than the commercial potato cracker because due to dark colour mushroom powder from the grey oyster mushroom. There was a significant difference (p < 0.05) shown in L* between mushroom and commercial potato crackers (Table 4).

      Table 5.  Independent t-test for colour analysis.

      Mushroom crackerCommercial potato crackerSig.
      (2-tailed)
      MeanS.D.MeanS.D.
      L*55.891.001762.80330.17210.006
      a*6.751.719711.72670.52580.029
      b*18.16671.501631.550.75020.001

      Next, a* is an indicator for the colour of the crackers to be red or green. The results obtained show that commercial potato crackers are much higher (11.7267 ± 0.5258) than mushroom crackers (6.75 ± 1.7197). This shows that commercial potato crackers have an orange to red colour while mushroom cracker shows less red colour as mushroom crackers have no artificial colour added. Hence, there is a significant different between mushroom crackers and commercial potato crackers which was (p < 0.05) shown in Table 5. Moreover, b* is indicated for yellow or blue colour. The highest b* value indicating yellowness of the sample was observed for the commercial potato cracker (31.55 ± 0.7502). A lower b* was noted in the mushroom cracker (18.1667 ± 1.5016) due to the incorporation of mushroom powder. Due to the mushroom powder's natural brown colour, the mushroom cracker's yellowness was concealed. Consequently, a decreasing trend in b* values was seen as mushroom inclusion increased[13]. Therefore, there is significant difference (p < 0.05) between mushroom crackers and commercial potato crackers.

    • Texture profile analysis (TPA) is used in a wide variety of fields to measure mechanical qualities like hardness, cohesiveness and springiness by repeatedly compressing a sample with a probe at a predetermined rate. The test was equipped using probe TA 7 Knife edge 60 mm W. A number of texture properties were chosen to analyse the crackers such as hardness, cohesiveness and springiness. Table 3 shows the texture properties of mushroom crackers and commercial potato crackers. For the hardness properties, the mushroom cracker (1,117.00 ± 126.74 g) shows a lower value than the commercial potato cracker (2,481.00 ± 115.8836 g). The hardness of the crackers can be determined by the sensory and terminology of hardness is opposite to crispiness. The lower the hardness is, the more crunchiness of the cracker. So, it can be seen that mushroom crackers are much crispier compared to the commercial potato crackers. Customers favour crackers with a high crispiness score, and low hardness will be displayed[14]. The hardness of the cracker is often related to the interaction of ingredients used. Both crackers were significantly different (p > 0.05) in hardness towards each other.

      Cohesiveness is a measure of how a cracker withstands deformation. Based on the results in Table 6, mushroom crackers show higher cohesiveness, which indicate about 1.00 ± 0.1473. While, commercial potato crackers indicate 0.1867 ± 0.0851 which is less compared to the mushroom cracker. Low cohesiveness indicates high brittleness or crumbliness of the cracker. Therefore, the higher cohesiveness of the mushroom cracker might be because the proteins in the mushroom cracker formed a three-dimensional cross-linked protein network that could withstand more deformation before breaking[15]. Other than that, the lower the cohesiveness value, the more prone it is to breakage. Therefore, there is no significant difference (p < 0.05) between the cohesiveness of mushroom crackers and commercial potato crackers.

      Table 6.  Independent t-test for texture properties.

      Mushroom crackerCommercial potato crackerSig.
      (2-tailed)
      MeanS.D.MeanS.D.
      Hardness (g)1,117.00126.742481.00115.88360.000
      Cohesiveness1.000.14730.18670.08510.003
      Springiness (mm)6.490.897214.619.51030.215

      In addition, springiness properties refer to how quickly and fully a deforming force is recovered. For springiness, the commercial potato cracker has a higher value (14.61 ± 9.5103 mm) than the mushroom cracker (6.49 ± 0.8972 mm). The higher springiness value is because of the extended storage time as commercial potato crackers have been developed on a large-scale during processing time[16]. So, this would affect the springiness of the cracker. Both crackers showed no significant difference (p > 0.05) in springiness attributes between each other.

    • The survey result of the participants' sensory evaluation of mushroom crackers is shown in Table 7. Sensory evaluation of four sensory attributes: the number of crackers consumed, texture or feel, colour, richness, and overall acceptability of the crackers samples, using a 4-point hedonic scale, in which the lowest value (1) stands for 'extreme dislike'. In contrast, the highest value (4) represents 'extremely like'. The percentage of 50 participants determines this sensory evaluation. It was presented that the highest percentage level acceptance of mushroom crackers of 74% are 'extremely like', which means that the respondent eats 100% of the mushroom crackers, whereas another 22% represent 'like', which means they consume 75% of the mushroom crackers while 'dislike' contributed to 4%. Next, for the texture of the mushroom, the largest scale is 'extremely like', contributing 74%.

      Table 7.  Sensory evaluation of mushroom crackers.

      ScaleSensory attribute
      AcceptableTextureColourRichnessOverall acceptance
      Extremely like74%74%38%78%66%
      Like22%26%62%22%33%
      Dislike4%0001%
      Extremely dislike00000

      In crackers, the colour attribute symbolizes the exterior colour of the crackers. The highest percentage of mushroom crackers were in the 'like' scale which contributed 62%, meaning that the crackers are brown in colour. Therefore, another 38% voted 'extremely like', which means the crackers are golden brown.

      Then for the richness of mushroom crackers, the highest scale percentage was 'extremely like', contributing to 78%, meaning that the mushroom cracker is edible. The participants observed that mushroom crackers could be eaten. Therefore, another 22% vote for the 'like' scale indicates that the mushroom crackers are lower in oil. Finally, the largest scale percentage of overall acceptance is 'extremely like', which contributed up to 66%, while another 33% and 1% are 'like' and 'dislike', respectively.

    • Mushrooms become a high-value food worldwide. Therefore, the demand for mushrooms is increasing day by day. A perfect substrate combination results in good growth of mycelia that helps for profitable production of mushroom fruit bodies in commercial cultivation. This study showed that T2 treatment combinations with 60% OPF (oil palm frond) + 22.2% EFB (empty fruit bunch) + 15% SD (sawdust) + 0.8% RB + 2% L recorded higher (1.5 kg in four cycles) production. While, treatment T1 as 60% RS (rice straw) + 22.2% EFB + 15% PPF + 0.8% RB +2% L) produced 1.3 kg and T0 as 97.2% SD (sawdust) + 0.8% RB + 2% L) produced 1.2 kg mushroom fruit bodies. It is interesting that T2 and T0 material composition is quite similar, as oil palm frond and sawdust mainly contain lignin and cellulose, whereas T1, which is a rice straw substrate, mainly contains cellulose-based material. Physiological attributes for substrate in terms of Carbone (c), Nitrogen (N), minerals, and moisture capacity content play important roles in mycelial development. The material of lignocellulose has less moisture vapour evaporation compared to cellulose-based material[17]. Thus, palm-based substrate maintained moisture in the substrate while with the rice straw substrate, several droplets on the substrate bag can be seen that cause issues for mycelial growth.

      The income performance result was also high in oil palm-based substrate (T2). For potential commercial substrates, there is a need to compare its cost price and net income to determine the maximum utilization of the substrate for mushroom production and worth for income generation. In this study, oil palm-based substrate was received free of charge, while sawdust and rice straw were purchased. Hence, oil palm based substrate can be profitable for mushroom farmers as well as a country's economic revenue.

      As for nutritional content, there was not much difference in protein content between commercial crackers and mushroom crackers, commercial potato cracker content was slightly higher (2.22% ± 0.10 %) compared to the mushroom crackers (2.19% ± 0.90 %). This is may be due to MSG (monosodium glutamate). MSG contains glutamate, rich in protein[18]. Another study by Bera et al.[19] defined that glutamate from MSG is the most abundant amino acid (the main component of protein). In preparation of mushroom crackers or even decoration time, this study did not use seasoning with MSG. This is because although MSG contains amino acids, it also contains artificial salt. Too much dietary sodium can cause an increase in blood pressure or health issues. Currently, cracker consumers are aware of MSG salt-processed crackers. Cracker lovers are looking for healthy quality ingredients with minimal processing and they should not contain excess salt while the taste should be similar to commercial crackers[2]. On the other hand, mushrooms contain umami flavor, which is the 5th state group that contains natural MSG flavor; therefore, for the preparation of mushroom crackers there is no need for artificial salt. In this study, mushroom crackers were made with very few ingredients, such as rice flour and potato. Conversely, commercial potato crackers usually contain several artificial ingredients that enhance the artificial protein amount. So, it can be noted that mushroom cracker contain completely natural protein. Table 3 shows that fat content in commercial potato crackers is slightly higher (12.8283 ± 0.2475) than in mushroom crackers (11.335 ± 0.3061). The literature suggests that the recommended fat content range is between 10% and 30% fat[20]. Therefore, mushroom crackers and commercial potato crackers are still in the recommended range. In addition, the higher protein content contributions increased in mushroom powder and constricted the starch-lipid interaction, causing a reduction in oil absorption during frying[21]. The ash content in the mushroom cracker proceeded to be higher, which is about 2.0567 ± 0.1201, compared to the commercial cracker (1.4667 ± 0.2566). The relatively high content of ash also shows fiber richness in the food[22]. Therefore, mushroom crackers show that the products are rich in fiber compared to commercial crackers. However, some studies have revealed that the ash content in processed food can be more than 10%, but in natural food, it must be less than 5%[23]. The mushroom crackers in this study are referred to as minimally processed, whereas commercial potato crackers are fully processed food. In recent years, cracker lovers require processed or minimally processed foods[2]. However, the moisture content in mushroom crackers was 7.8733%, which is slightly higher than that of commercial crackers at 6.15%. Higher moisture content is a result of the capacity of fibers and polysaccharides to retain water[24]. If the moisture level is too high (more than 10%), the texture and flavour will suffer, and the shelf life will be shortened[4]. Crackers with a low moisture level (5%) are more prone to breakage, which results in waste. As shown, commercial crackers are in the range of 5 to 10%, and the moisture content of mushroom crackers was also in a range of 5 to 10%, so it can be noted that the production of mushroom crackers is the commercial standard level. For carbohydrate content, there was no significant difference found between commercial crackers (77.3350%) and mushroom crackers (76.5%). Carbohydrates mainly originated from flour and sugar. In the mushroom cracker, no sugar or artificial additives were added except for flour and the mushroom itself. In commercial crackers, besides flour, a few more ingredients, such as sugar or additives, are added to enhance self-life. Mushroom carbohydrates contain good qualities, such as trehalose, xylitol, and sorbitol, which can act as natural additives.

      Besides natural sugar, the mushrooms also contain polysaccharides such as glycogen, β-glucan, heteroglycan, and chitin[25]. Among these polysaccharides, β-glucan is one of the dietary fibers that can reduce human blood cholesterol and glucose levels that affect cardiovascular heart disease and diabetes for health[25]. Therefore, it can be noted that mushrooms contain good quality carbohydrates which contribute to the healthy food attribution of mushroom crackers.

      As for colors, L* indicates lightness, a* is an indicator of the color of crackers being red or green, and b* indicates yellow or blue color. In all aspects of colour, commercial potato cracker values were higher than mushroom crackers (Table 3). In preparation of mushroom crackers, no artificial colour was added. Texture comparison between mushroom crackers and commercial potato crackers showed no significant difference (Table 3) which showed mushroom crackers as being a potential for commercial standard in taste.

      Sensory acceptability of mushroom crackers showed a higher rate of 72% which shows that the mushroom crackers were 'extremely accepted'. Richness means the texture with crispiness which was high at 78%. It means that the participant accepted the texture of the mushroom crackers that are constantly crispy and crunchy. Usually, customers favour crackers with a high crispiness, and low hardness[14]. In terms of colour, 62% showed that mushroom crackers looked to be brown. This is due to the colour of mushroom crackers being brown rather than golden because of the dark colour of mushroom powder from grey oyster mushrooms[26]. Hence, the mushroom powder contributes to the darkening after frying[21]. However, the colour did not affect the overall acceptance, which showed that 66% of participants 'extremely like' the mushroom crackers.

    • Mushroom is a potential agri-food which is referred to as vegetable meat. Since demand for mushroom is increasing dramatically, various types of cultivation substrate are needed to avoid raw material scarcity. The results of this study showed that oil palm plant material-based substrate produced the highest yield of 1.5 kg. The net income performance was 15% highest for oil palm substrate compared to rice straw and sawdust substrate. The food product of mushroom crackers overall acceptance level showed 66% participants accepted mushroom crackers. Therefore it can be concluded that the preparation of oil palm products is cost-effective, and growers can easily adopt them for their income generation, which can influence economic sustainability. The production of mushroom crackers can reduce postharvest losses and open the door for extra income for the growers.

    • The authors confirm contribution to the paper as follows: study conception and design: Naher L; data collection: Mustaffa Bakri NA, Muhammad Sukhri SAN, Nik Raihan NH, Mohd Firdaus Ganga H; analysis and interpretation of results: Md Zain N, Abdul Rahman N; draft manuscript preparation: Naher L, Ch'ng HY, Mokhtar SI. All authors reviewed the results and approved the final version of the manuscript.

    • All data generated or analyzed during this study are included in this published article.

      • The authors would like to acknowledge the Ministry of Finance, grant code R/MOF/A0700/01204A/2020/00724 for providing financial support. We also acknowledge the Universiti Malaysia Kelantan, Jeli Campus for all the laboratory facilities.

      • The authors declare that they have no conflict of interest.

      • Copyright: © 2024 by the author(s). Published by Maximum Academic Press, Fayetteville, GA. This article is an open access article distributed under Creative Commons Attribution License (CC BY 4.0), visit https://creativecommons.org/licenses/by/4.0/.
    Figure (1)  Table (7) References (26)
  • About this article
    Cite this article
    Naher L, Mustaffa Bakri NA, Muhammad Sukhri SAN, Nik Hassan NR, Mohd Firdaus Ganga H, et al. 2024. Economical substrate formulation for mushroom cultivation and food production of mushroom crackers to reduce postharvest waste. Studies in Fungi 9: e002 doi: 10.48130/sif-2024-0003
    Naher L, Mustaffa Bakri NA, Muhammad Sukhri SAN, Nik Hassan NR, Mohd Firdaus Ganga H, et al. 2024. Economical substrate formulation for mushroom cultivation and food production of mushroom crackers to reduce postharvest waste. Studies in Fungi 9: e002 doi: 10.48130/sif-2024-0003

Catalog

  • About this article

/

DownLoad:  Full-Size Img  PowerPoint
Return
Return