REVIEW   Open Access    

Understanding drought stress response mechanisms in tomato

More Information
  • Received: 20 October 2023
    Revised: 08 December 2023
    Accepted: 10 December 2023
    Published online: 09 January 2024
    Vegetable Research  4 Article number: e001 (2024)  |  Cite this article
  • Tomato (Solanum lycopersicum) is significantly affected by drought. An excessive amount of reactive oxidative species (ROS) is generated in tomato under drought stress, causing devastating effects on tomato growth and yield. Drought stress response and adaptation in plants are complex and their regulatory gene networks are being investigated to improve our understanding. The signaling molecule, ABA (abscisic acid), is one of the key players in drought stress response. Plants synthesize and accumulate ABA because ABA can act on membrane transporters, protein kinases, transcription factors, and other hormonal signaling pathways to elicit appropriate stress response. In this review, we will discuss our current knowledge of how tomato plants perform drought stress response. Moreover, we will offer future directions that can extend our understanding of tomato's adaptation and tolerance to drought stress.
  • Sweet cherries (Prunus avium L.) are a major focus of agriculture in the Okanagan region of British Columbia (BC), Canada. A large portion of the cherries grown in BC are exported and undergo up to four weeks of storage during transportation before delivery and consumption[1]. In 2022, sweet cherries accounted for 11.6% of the revenue of exported fruit from Canada and have an export value of nearly CAD$130 million[2]. As such, sweet cherry is an important fruit with high commercial importance for Canada. Although the application of cold storage is a necessary postharvest tool to maintain fruit quality up to consumption, there are preharvest factors that impact quality after longer-term storage. The work of Serrano et al.[3] noted that the maturity stage at harvest determined the fruit quality of sweet cherries after storage. For this reason, producers use several parameters to establish the optimum time for harvesting. Producers have long used colour as a marker for maturity, yet the concept of fruit dry matter (DM) at harvest affecting post-storage quality has advanced[46]. In fact, Toivonen et al.[6] developed a predictive model for 'Lapins' sweet cherry DM content using a visible/near-infrared spectrometer and noted its potential application to other cultivars to provide a rapid and non-destructive means of determining DM linked to cherry fruit quality. If sweet cherries are harvested at the wrong time or stored improperly during transit the quality of the cherries at their final destination does not compare to that at the time of harvest. Therefore, it is of the utmost importance to harvest cherries at their optimal time to ensure quality retention. Cherry fruits have minimal reserve carbohydrates so respiration relies primarily upon organic acids[7]. Additionally, cherries have a high susceptibility to physical damage making them highly perishable, so it is imperative to store them properly to maintain their flavour profile and overall quality[811]. Lower respiration rates help to maintain higher titratable acidity (TA) levels, thereby retaining flavour quality[11,12]. Decreased respiration rates are achieved through low-temperature storage and shipping.

    Previous research linking cherry fruit maturity to flavour quality indicated early-harvested cherries with low soluble solids (SS) levels showed low consumer acceptance due to perceived low sweetness, while late-harvested cherries showed low consumer acceptance due to poor texture[13,14]. This information underscores the challenge growers face when determining picking date. Additionally, once cherries are harvested, quality changes occur which include changes in the balance of SS to TA levels. Previous work has shown that SS levels remain relatively constant while malic acid levels (the predominant acid in sweet cherries) decreased by 20% when stored for 4 d at 20 °C[8,14]. Further, SS, TA, and the SS/TA ratio are key parameters in defining flavour quality[15] and consumer acceptance[14] as SS and TA have been reported to be measures of the cherry fruit attributes of sweetness, and sourness, respectively. Additionally, the SS/TA ratio is regarded as an overall taste attribute determining sweet cherry acceptability[14,16,17].

    Depending on cultivar and growing location, SS values for sweet cherries have been reported to range from 12.3 to 23.7 °Brix[14]. Rootstock and storage conditions have also been reported to affect SS, TA, and SS/TA values[18]. Depending on rootstock, for 'Regina' sweet cherries, harvest SS values ranged from 14.8 to 16.6 °Brix and TA values ranged from 5.7 to 7.4 g·L−1, while SS values after storage ranged from 14.6 to 18.2 °Brix and TA values ranged from 4.4 to 6.0 g·L−1. The harvest SS/TA ratio ranged from 2.0 to 2.91 and the SS/TA ratio after storage ranged from 2.47 to 3.77 depending on rootstock. Based on sensory studies using various cherry cultivars and breeding selections to gauge flavour quality and consumer acceptance, the optimal SS/TA ratio was reported to be between 1.5 and 2.0, with SS values ranging between 17 and 19 °Brix[19].

    Unfortunately, members of British Columbia's sweet cherry industry have noted that while their cherries arrive at their export locations with good condition in terms of appearance (i.e. firm, shiny, with green stems), issues have been reported concerning flavour. Poor flavour has been associated with lower levels of TA and lower oxygen in the storage atmosphere. Our previous work noted that BC cherry growers tend to pick their cherries at lighter colours in an attempt to harvest the crop as soon as possible to avoid any weather or pest issues and achieve the highest yield possible[1]. Staccato (SC) is a late maturing economically important cultivar with little research data available. It has been reported that SC cherries have a respiration rate that is negatively correlated with colour when collected between a 2 to 6 colour level as determined with CTFIL (Centre Technique Interprofessionnel des Fruit et Legumes, Paris, France) colour chips[1], which have been typically used as a marker of maturity. For SC cultivars, data showed the lowest respiration levels with cherries harvested at CTFIL colour standards 4-5, and may potentially have better flavour quality retention due to these lower respiration rates[1]. The aim of the work was to: 1) examine indicators of maturity/readiness for harvest (colour, SS, DM, TA, and the ratio of soluble solids to titratable acidity (SS/TA)); and 2) determine whether colour at harvest or other parameters (SS, TA, SS/TA, and DM) better predict flavour quality retention after storage.

    Sweetheart (SH), Staccato (SC), and Sentennial (SL) sweet cherries were sourced from research plots located at the Summerland Research and Development Center (SuRDC, Summerland, BC, Canada) in the Okanagan Valley region of British Columbia over three growing seasons (2018, 2019, and 2021). In the 2018 growing season, two cherry cultivars (SH and SC were collected, in the 2019 growing season, in response to BC Cherry Association interest, three cherry cultivars (SH, SC, and SL) were collected. Due to COVID, data was not collected during the 2020 growing season. In the 2021 growing season, full data (SS, TA, DM, and respiration rate) was only collected on the SC cherry cultivar, while DM and respiration values at harvest were also collected for SH and SL cultivars.

    To collect fruit at different maturity levels, cherry fruits were collected at three different color levels using the CTFIL (Centre Technique Interprofessionnel des Fruit et Legumes, Paris, France) colour standard series at three harvest dates for each cultivar which corresponded to the 3-4, 4-5, and 5-6 colour levels.

    To collect environmental data, two trees were chosen in each orchard block and Onset HOBO (Bourne, MA, USA) temperature and humidity loggers were mounted in these trees as described by Ross et al.[1] and captured data at 10 min intervals. The temperature and humidity data were used to calculate average temperature (AT), average high temperature (AHT), average low temperature (ALT), and average relative humidity (ARH) for 28 d preceding the cherry harvest date.

    Cherries were generally harvested before 11:00 h on each harvest day. Harvested cherries were transported back to the lab for sorting, sampling, and storage. Upon arrival, cherries were placed into a walk-in cooler at 0.5 °C to mimic rapid hydro-cooling capabilities that the industry uses. In the afternoon of each harvest day, cherries were removed from the cooler and sorted following British Columbia Tree Fruits Company protocol: (i) size was greater than 25.4 mm (< 10.5 row size); (ii) stemless cherries were removed; and (iii) cherries with defects such as blemishes, splits, pitting, disease (rot, fungi), hail damage and insect damage were removed. Again, the colour of the cherries was assessed using the CTFIL colour standard series. Based on the harvest period, cherries were separated into different colour levels: 3-4, 4-5, and 5-6. For each colour category, quality assessments (DM, SS, TA, SS/TA ratio, firmness, size, stem pull force, stem shrivel, stem browning, pitting, and pebbling) were performed before and after storage.

    Maintaining the quality of sweet cherries undergoing long distance ocean container shipment (up to 28 d/4 weeks) is important for securing a successful export market for Canadian sweet cherries and for ensuring that current market demand is met[1]. For cherries to be marketable after storage, they must pass several quality attributes. Attributes of firmness, size, stem pull force, stem shrivel, stem browning, pitting, and pebbling were assessed using previously described methods[1,20] to assess fruit quality at harvest and after storage for 28 d at 0.5 °C, ideal refrigerated storage temperature, for all cherry cultivars, and also storage for 28 d at 3 °C, non-ideal refrigerated storage temperature, for SC cherries. The values of these parameters are provided in Supplementary Tables S1S6. As the focus of this work was to examine how maturity level at harvest influenced the flavour quality of SC, SH, and SL sweet cherry cultivars, SS, DM, TA, and respiration rate values were the focus for discussion. Respiration analysis was performed using methods described by Ross et al. on freshly harvested cherries[1]. Rates of CO2 production were expressed as mg CO2 kg−1·h−1.

    DM of the cherries was determined using a Felix F750 handheld spectrometer (Felix Instruments, Inc., Camas, WA, USA) loaded with a valid model developed at the Summerland Research and Development Centre for cherries[6]. DM was measured on 25 fruits that were randomly selected from each sample replicate (i.e. 50 cherries). For SS and TA analyses, the methods of Ross et al.[1,20] were used to test 25 fruits that were randomly selected from each sample replicate (i.e. 50 cherries). Briefly, de-stemmed cherries were transferred into a 15.2 cm × 22.9 cm polyethylene Ziplock bag. The bag was left partially open, and the cherries were pressed by hand to obtain juice. The juice was strained and collected into 60 mL polypropylene screw cap containers. The resulting filtrate was tested for SS (°Brix), and TA (g·L−1 malic acid). For SS determination, the refractive indices of the solutions were observed in °Brix temperature-corrected mode on a digital refractometer (Mettler-Toledo, Refracto 30PX, 13/02, LXC13237, Japan). An automated titrator (Metrohm 848 Tritrino Plus; Mississauga, ON, Canada) was used to measure the TA of 10 mL of the juice with 65 mL distilled water to an endpoint of 8.1 with 0.1 mol·L−1 NaOH.

    At each colour level (3-4, 4-5, or 5-6) 10 kg of cherry samples were cooled to either 0.5 or 3 °C (for SC in 2021) and then packed into cardboard boxes with a polyethylene liner, an absorbent pad, and an iButton (Thermodata, Whitewater, WI, USA), which measured temperatures experienced by the cherries in the cardboard boxes during storage. After 28 d, the same quality assessment tests were performed to see if values varied throughout storage time at each temperature.

    Statistical analysis was conducted using SAS Institute Inc. software version 9.3 (SAS Institute, Cary, NC, USA). Data were subjected to a four-way analysis of variance (ANOVA) using the SAS PROC GLM procedure. The four factors tested were colour level (3-4, 4-5, and 5-6), cultivar (SH, SC, and SL), growing year (2018, 2019, and 2021), and time (harvest or storage (0.5 °C)). The significance of the main effects and interaction of the four factors was determined using Type III sum of squares via the ANOVA test. Additionally, ANOVA using the SAS PROC GLM procedure was performed on data collected for SC cultivar in the 2021 growing year to assess the influence on storage temperature (0.5 and 3 °C) on quality parameters. Statistical significance was determined by least significant difference (LSD) Fisher's test at 5% significance level. Principal Component Analysis (PCA) was performed using SAS version 9.3 PROC PRINCOMP (SAS Institute Inc., Cary, NC, USA) on data collected from the three cultivars over the tested growing years at three colour levels (i.e., up to nine samples per cultivar) and 10 variables for each investigation. Variables included: AT, AHT, ALT, ARH, colour at harvest (ColourH), SS at harvest (SSH), SS after 28 d of storage at 0.5 °C (SS05), TA at harvest (TAH), TA after 28 d of storage at 0.5 °C (TA05), and DM of cherry fruit at harvest (DMH). Microsoft Excel was used to generate PCA plots from the data provided by SAS. Only data available for every growing year were included in the PCA. Correlation coefficients were determined using Pearson's correlation coefficient statistical function in Excel (version 2306, Microsoft, Redmond, WA, USA). Histograms and frequency data were generated using the statistical function in Excel (version 2306, Microsoft, Redmond, WA, USA). Dry matter bin sizes of 1.5% increments were used to present and analyze the histogram and frequency data.

    Tables 14 present data on flavour attributes via values of soluble solids (SS), titratable acidity (TA), SS/TA ratio, and dry matter (DM) as affected by cultivar, growing year, storage and colour level at harvest and after storage, respectively. The most influential parameters in sweet cherry flavour have been found to be SS, TA, and the SS/TA ratio[15]. Additionally, SS and TA values have been found to be related to DM values in kiwis[2124], apples[25], and cherries[6,26]. DM is a measure of solids which includes both soluble sugars and acids along with insoluble structural carbohydrates and starch. Crisosto et al.[4] proposed using DM as an additional quality parameter as DM was determined not to change during cold storage[22]. Toivonen et al.[6] have performed research linking dry matter measurements with sweet cherry quality. As cold storage is also used to maintain cherry quality, assessing DM at harvest and upon storage was of relevance, and a key aspect of this work was to examine how DM values relate to sweet cherry respiration rates and cherry quality parameters.

    Table 1.  Soluble solids values as affected by cultivar, growing year, storage, and colour level at harvest.
    Cultivar Colour level Soluble solids (SS, °Brix)
    2018 2019 2021
    Harvest Storage (0.5 °C) Harvest Storage (0.5 °C) Harvest Storage (0.5 °C) [3 °C]
    Sweetheart 3-4 18.1aA1 17.7aA1 18.1aA1 18.2aA1
    4-5 20.0bA1 19.8bA1 19.4bA1 18.8bA1
    5-6 21.9cA1* 21.1cA1* 19.9bA1* 19.6cA1*
    Staccato 3-4 17.2aA2 17.2aA1 17.1aA2 17.2aA1 18.8aA* 18.9aA*
    18.4a
    4-5 17.8aA2 17.9aA2 18.3bA23 18.1bA1 19.9bA* 18.6aB
    18.9ab
    5-6 20.2bA2 17.9aB2* 20.2cA1 20.3cA13 20.1bA 19.5aA
    19.7b
    Sentennial 3-4 18.1aA1 18.1aA1
    4-5 18.9bA13 18.5aA1
    5-6 20.8cA2 20.6bA23
    Main effects Significance F-value Degrees of freedom
    Cultivar p < 0.0001 36.90 2
    Colour level p < 0.0001 125.76 2
    Year p < 0.0001 9.26 2
    Time (harvest or storage at 0.5 °C) p = 0.0002 13.68 1
    Colour differences: within common time and cultivar, values followed by different lower case letters indicate significant differences (p ≤ 0.05); Cultivar differences: within common colour level and time, values followed by different numbers indicate significant differences (p ≤ 0.05); Growing year differences: within common time, colour level and cultivar, values followed by * indicate significant differences (p ≤ 0.05); Storage differences (Harvest versus 0.5 °C storage): within common cultivar, colour level and growing year, values followed by different uppercase letter indicate significant differences (p ≤ 0.05); Temperature differences: within Staccato cultivar at 28 d storage and at common colour level, bolded values indicate significant differences (p ≤ 0.05) between storage temperatures (0.5 °C vs 3 °C). (N.B. no bolded values appear in this table).
     | Show Table
    DownLoad: CSV
    Table 2.  Titratable acidity values as affected by cultivar, growing year, storage and colour level at harvest.
    Cultivar Colour level Titratable acidity (TA, g·L−1 malic acid)
    2018 2019 2021
    Harvest Storage (0.5 °C) Harvest Storage (0.5 °C) Harvest Storage (0.5 °C) [3 °C]
    Sweetheart 3-4 8.99aA1* 7.11aB1* 7.31aA1* 6.31aB1*
    4-5 9.55bA1* 7.57bB1* 7.14aA1* 6.13aB1*
    5-6 10.56cA1* 8.57cB1* 7.56aA1* 6.50aB1*
    Staccato 3-4 8.53aA2* 6.65aB2* 6.96aA1* 5.51aB2* 12.0aA* 10.5aB*
    9.7a
    4-5 8.87abA2* 7.04bB2* 7.30aA1* 6.21bB1* 12.8aA* 10.2aB*
    9.3a
    5-6 8.91bA2* 6.91abB2 7.18aA1* 6.46bB1 10.6bA* 9.5b*
    8.5b
    Sentennial 3-4 9.21acA2 7.60aB3
    4-5 9.33aA2 7.89aB2
    5-6 8.79bcA2 7.66aB2
    Main effects Significance F-value Degrees of freedom
    Cultivar p < 0.0001 193.58 2
    Colour level p = 0.0023 5.49 2
    Year p < 0.0001 1,007.20 2
    Time (harvest or storage at 0.5 °C) p < 0.0001 474.18 1
    Colour differences: within common time and cultivar, values followed by different lower case letters indicate significant differences (p ≤ 0.05); Cultivar differences: within common colour level and time, values followed by different numbers indicate significant differences (p ≤ 0.05); Growing year differences: within common time, colour level and cultivar, values followed by * indicate significant differences (p ≤ 0.05); Storage differences (Harvest versus 0.5 °C storage): within common cultivar, colour level and growing year, values followed by different uppercase letter indicate significant differences (p ≤ 0.05); Temperature differences: within Staccato cultivar at 28 d storage and at common colour level, bolded values indicate significant differences (p ≤ 0.05) between storage temperatures (0.5 °C vs 3 °C).
     | Show Table
    DownLoad: CSV
    Table 3.  Soluble solids to titratable acidity ratio values as affected by cultivar, growing year, storage and colour level at harvest.
    Cultivar Colour level Soluble solids to titratable acidity ratio (SS/TA)
    2018 2019 2021
    Harvest Storage (0.5 °C) Harvest Storage (0.5 °C) Harvest Storage (0.5 °C) [3 °C]
    Sweetheart 3-4 2.02a1A* 2.49a1B* 2.49a1A* 2.78a1B*
    4-5 2.09a1A* 2.61a1B* 2.71b1A* 3.06b1B*
    5-6 2.07a1A* 2.46a1B* 2.63b1A* 3.02b1B*
    Staccato 3-4 2.01a1A* 2.58a1B* 2.46a1A* 3.11a2B* 1.57aA* 1.79aB*
    1.89a
    4-5 2.0a1A* 2.54a1B* 2.51a2A* 2.91b1B* 1.55aA* 1.83aB*
    2.04a
    5-6 2.27b2A* 2.58a1B* 2.81b1A* 3.14a1B* 1.89bA* 2.06bB*
    2.32b
    Sentennial 3-4 1.97a2A 2.38a3B
    4-5 2.02a3A 2.34a2B
    5-6 2.37b2A 2.69b2B
    Main effects Significance F-value Degrees of freedom
    Cultivar p < 0.0001 94.79 2
    Colour level p < 0.0001 22.04 2
    Year p < 0.0001 361.13 2
    Time (harvest or storage at 0.5 °C) p < 0.0001 134.15 1
    Colour differences: within common time and cultivar, values followed by different lower case letters indicate significant differences (p ≤ 0.05); Cultivar differences: within common colour level and time, values followed by different numbers indicate significant differences (p ≤ 0.05); Growing year differences: within common time, colour level and cultivar, values followed by * indicate significant differences (p ≤ 0.05); Storage differences (Harvest versus 0.5 °C storage): within common cultivar, colour level and growing year, values followed by different uppercase letter indicate significant differences (p ≤ 0.05); Temperature differences: within Staccato cultivar at 28 d storage and at common colour level, bolded values indicate significant differences (p ≤ 0.05) between storage temperatures (0.5 °C vs 3 °C).
     | Show Table
    DownLoad: CSV
    Table 4.  Dry matter values as affected by cultivar, growing year, storage and colour level at harvest.
    Cultivar Colour level Dry matter (DM, %)
    2018 2019 2021
    Harvest Storage (0.5 °C) Harvest Storage (0.5 °C) Harvest Storage (0.5 °C) [3 °C]
    Sweetheart 3-4 20.9aA1* 20.6aA1* 18.6aA1* 18.6aA1* 22.1aA1*
    4-5 21.9bA1 22.0bA1* 19.9bA1* 19.8acA1* 22.5bA1
    5-6 25.2cA1* 23.5cB1* 21.1cA1* 20.6bcA1* 23.6cA1*
    Staccato 3-4 20.2aA1* 19.5aA2* 18.4aA2* 18.1aA23* 21.0aA2* 20.6aA*
    19.8a
    4-5 20.4aA2* 20.8bA2* 19.1aA1* 18.8aA2* 22.0bA2* 21.6bA*
    21.9b
    5-6 22.4bA2 22.3cA2 22.9bA2* 21.6bA23 23.0cA2 22.2bA
    22.4b
    Sentennial 3-4 18.2aA2 18.4aA13 20.5aA2*
    4-5 19.3bA1 18.8bA2 22.6bA12*
    5-6 22.9cA2 20.9bA13 23.5cA12
    Main effects Significance F-value Degrees of freedom
    Cultivar p < 0.0001 11.36 2
    Colour level p < 0.0001 130.99 2
    Year p < 0.0001 56.64 2
    Time (harvest or storage at 0.5 °C) Not significant, p = 0.0922 2.97 1
    Colour differences: within common time and cultivar, values followed by different lower case letters indicate significant differences (p ≤ 0.05); Cultivar differences: within common colour level and time, values followed by different numbers indicate significant differences (p ≤ 0.05); Growing year differences: within common time, colour level and cultivar, values followed by * indicate significant differences (p ≤ 0.05); Storage differences (Harvest versus 0.5 °C storage): within common cultivar, colour level and growing year, values followed by different uppercase letter indicate significant differences (p ≤ 0.05); Temperature differences: within Staccato cultivar at 28 d storage and at common colour level, bolded values indicate significant differences (p ≤ 0.05) between storage temperatures (0.5 °C vs 3 °C). (N.B. no bolded values appear in this table).
     | Show Table
    DownLoad: CSV

    Data in Table 1 shows the SS levels at each colour level for each sweet cherry cultivar. Overall, SH cherries at harvest had ranges of 18.1%−21.9% over the 2018 and 2019 growing seasons. SC cherries at harvest had levels between 17.1%−20.2% over the three growing years (2018, 2019, and 2021), while SL cherries at harvest had levels of 18.1%−20.8% in 2019. Statistical analysis showed that the main effects of Cultivar (p < 0.0001; F-value = 36.90; degrees of freedom (df) = 2), Colour (p < 0.0001; F-value = 125.76, df = 2), Time (p = 0.0007; F-value = 13.68; df = 1), and Year (p < 0.0001; F-value = 9.26; df = 2) were all significant. Additionally, the interactions of Cultivar * Year (p < 0.0001, F-value = 26.37; df = 1), Colour * Year (p < 0.0069; F-value = 4.19; df = 4), Cultivar * Colour * Year (p < 0.0003; F-value = 10.28; df = 2) and Colour * Time * Year (p < 0.0131; F-value = 3.67; df = 4) were all significant.

    With respect to growing year differences, in 2018, SS levels in SH were greater than those of SC at all colour levels. In 2019, again at the 3-4 colour level SC, cherries exhibited lower SS levels than SH and SL cherries. At the 4-5 colour level, SH cherries again showed higher SS levels compared to SC cherries. At the 5-6 colour level, SL cherries showed higher SS levels compared to SC and SH, while SC and SH cherries showed comparable SS levels at the 5-6 colour level. The SS values of SC cherries at 3-4 and 4-5 colour levels from the 2021 growing year were higher than values observed at the same colour levels in 2018 and 2019 growing year samples. There was no difference observed in SS levels of SC cherries at the 5-6 colour level between growing years. The data shows that colour level, cultivar, and growing year all affected SS levels.

    Within cultivars, for SH in the 2018 growing season, as colour level increased, SS level increased. An increase in SS as colour at harvest increased for SH cultivar was reported by Puniran et al.[27]. In the 2019 growing year for SH cherries and in the 2021 growing year for SC cherries, SS levels plateaued at the 4-5 colour level. For SC (2018 and 2019 growing year) and SL cherries (2019 growing year) as colour level increased, SS level increased. Ross et al.[1] reported this same trend for SC cultivar on data collected from 2015, 2016, and 2017 growing years. This data demonstrates the influence of growing conditions on SS levels.

    In general the SS levels at each colour level for each sweet cherry cultivar did not change over the 28 d storage at 0.5 °C. It should be noted that SC cherries from the 2018 growing year at the 5-6 colour level and SC cherries from the 2021 growing year at the 4-5 colour level did show a significant (p ≤ 0.05) decrease in soluble solids after 28 d of storage at 0.5 °C. SS values for 2018 SC cherries at the 5-6 colour level harvest was 20.2 °Brix, while SS values after 28 day storage at 0.5 °C was 17.9 °Brix. SS values for 2021 SC cherries at the 4-5 colour level harvest was 19.9 °Brix, while SS values after 28 d of storage at 0.5 °C was 18.6 °Brix. In 2021 the effect of storage temperature (0.5 °C vs 3 °C) was investigated. SS levels in the SC cherries at the different colour levels were not affected by the different storage temperatures. This result was consistent with other findings[1,8,14], which suggested that under typical low temperature storage conditions and proper shipping conditions, the change in flavour profiles were likely not due to major changes in SS levels. It is important to note that Alique et al.[8] found that while SS values were consistent, the levels of glucose and fructose decreased by 13% and 10%, respectively, after 4 d under ambient conditions. It may be worth investigating if under a lower temperature environment, the levels of key monosaccharides would remain constant or change.

    This moves the focus of flavour retention to TA values. Table 2 shows the TA levels at each colour level for each sweet cherry cultivar. Statistical analysis showed that the main effects of Cultivar (p < 0.0001; F-value = 193.58; df = 2), Colour (p = 0.0023; F-value = 5.49, df = 2), Time (p < 0.0001; F-value = 474.18; df = 1), and Year (p < 0.0001; F-value = 1007.20; df = 2) were all significant. The interactions of Cultivar * Colour (p < 0.001; F-value = 5.81; df = 4); Cultivar * Year (p < 0.0001; F-value = 19.9; df = 1); Colour * Time (p = 0.0431; F-value = 3.44; df = 2); Colour * Year (p < 0.0001; F-value = 18.01; df = 4); Time * Year (p < 0.0001; F-value = 17.21; df = 2); Cultivar * Colour * Year (p = 0.0009; F-value = 8.63; df = 2); Colour * Time * Year (p = 0.0127; F-value = 3.70; df = 4) were all significant.

    SH cherries at harvest had TA value ranges of 8.99−10.56 g·L−1 in 2018, and 7.31−7.56 g·L−1 in 2019. In 2018, the highest TA value was at the 5-6 colour level for SH cherries, while for the 2019 SH cherries there was no difference between colour levels for the TA values. After storage SH cherries at the various colour levels showed TA levels of 7.11−8.57 g·L−1 and 6.31−6.50 g·L−1 for 2018 and 2019, respectively. Again the stored 2018 SH cherries at the 5-6 colour level showed the highest TA values, while the TA values for the stored 2019 SH cherries were not affected by colour level. SC cherries at harvest showed TA value ranges of 8.53−8.91 g·L−1 in 2018, 6.96−7.18 g·L−1 in 2019, and 10.6−12.8 g·L−1 in 2021. After storage SC cherries had lower TA values at all colour levels for all growing years. In 2018, 2019, and 2021, TA values for SC cherries after storage ranged from 6.65–7.04 g·L−1, 5.51−6.46 g·L−1 and 8.5−10.5 g·L−1, respectively. In 2021, for the SC cherries, the higher storage temperature (3 °C) resulted in a greater loss of TA values for all colour levels compared to the lower temperature of 0.5 °C. SL cherries at harvest had TA levels of 8.79−9.33 g·L−1 in 2019 and after storage at 0.5 C, TA values ranged from 7.60−7.89 g·L−1, with the highest value of TA at the 4-5 colour level. Therefore for all cultivars over all growing years, TA values decreased upon storage, which was expected. The data from Table 2 shows the magnitude of the decrease in TA values after storage varied by growing year. Additionally, trends for differences of TA magnitude change with respect to cultivar and colour level were not obvious. The magnitude of the decrease in TA values between harvest and storage was higher for the SC cherries stored at 3 °C compared to those stored at 0.5 °C.

    Comparing the effect of colour level on TA level within cultivar for SH cherries, TA values increased as colour level at harvest increased in 2018, but the trend did not continue in 2019, possibly due to different growing conditions such as orchard temperature and relative humidity values, which will be further discussed. For SC cherries, TA values peaked at the 4-5 colour level for 2018 and 2021 growing years, but were not significantly different between colour levels in 2019 (p ≤ 0.05). In the 2019 growing year, SL cherries also had the highest TA values at the 4-5 colour level. Comparing the effect of cultivar on TA level within comparable colour level, 2018 harvest SH cherries showed higher TA values than SC cherries. In the 2018 growing year, upon storage and at comparable colour level, SH cherries again showed higher TA values than SC cherries. In the 2019 harvest, SC cherries exhibited the same TA values as SH cherries, while SL cherries had higher TA values than SC and SH. In the 2019 growing year SL cherries harvested at the 3-4 colour level showed greater TA values after storage compared to SH and SC cherries; SC cherries had the lowest TA values at this colour level. When harvested at the 4-5 and 5-6 colour levels, SL cherries had higher TA values upon storage compared to SH and SC cherries.

    The data suggests that different cultivars tend to peak TA values, which may be affected by growing conditions/growing year and maturity level/colour level. This is further supported by the work of Miloševic & Miloševic[28] that indicated TA levels of sour cherries are affected by level of ripeness. Puniran et al.[27] also indicted that finding where peak TA values occur at harvest can help negate the decrease in values that occurs during storage and therefore promote flavour quality retention.

    In 2021 the effect of storage temperature (0.5 °C vs 3 °C) was investigated as 0.5 °C represents ideal storage temperature while 3 °C represents a storage temperature where quality deterioration would be promoted, and may be a more realistic temperature experienced during overseas/export shipping (personal communication, Dr. Peter Toivonen, May, 2021). TA levels in the SC cherries harvested at the different colour levels were affected by the different storage temperature as seen in Table 2. At common colour level, SC cherries from the 2021 growing season stored at 3 °C showed lower TA values than samples stored at 0.5 °C. The SC cherries at the 5-6 colour level stored at 3 °C showed the lowest TA values upon storage. As higher TA values are associated with flavour quality[11,12], the SC cherries harvested at the 5-6 colour level and stored at 3 °C would show poorer flavour quality.

    Table 3 shows the SS/TA ratio values as affected by cultivar, growing year, storage and colour level at harvest. Statistical analysis showed that the main effects of Cultivar (p = 0.0001; F-value = 94.79; df = 2), Colour (p < 0.0001; F-value = 22.04; df = 2), Time (p < 0.0001; F-value = 134.15; df = 1), and Year (p < 0.0001; F-value = 361.13; df = 2) were all significant. The interactions of Cultivar * Colour (p = 0.0009; F-value = 5.91; df = 4) and Time * Year (p = 0.0059; F-value = 5.95; df = 2) were significant. The SS/TA ratio values over all cultivars, colour levels and growing years ranged from 1.55 to 2.81 at harvest and 1.79 to 3.14 after storage at 0.5 °C for 28 d. SC cherries in the 2021 growing year were tested to determine the effect of storage temperature (0.5 or 3 °C) on flavour quality. The SS/TA ratio for the 2021 SC cherries stored at 0.5 °C for 28 d ranged from 1.79 to 2.06 while the SS/TA ratio for the 2021 SC cherries stored at 3 °C for 28 d ranged from 1.89 to 2.32. SS/TA ratios for the 3 °C stored cherries at the 4-5 and 5-6 colour levels were significantly higher (p ≤ 0.05) compared to corresponding SS/TA ratios for the 0.5 °C stored cherries at the 4-5 and 5-6 colour levels. Higher SS/TA ratio are due to lower TA values (data in Table 3) and impact flavour quality and therefore lower storage temperatures are preferable, which was expected.

    Comparing between growing years, for SH and SC cherries, the SS/TA ratio at harvest was higher in the 2019 growing year compared to the 2018 growing year. SC cherries from the 2021 growing year showed the lowest at harvest SS/TA ratio. Within cultivar, the SH cherries from the 2018 growing year showed no difference in harvest SS/TA ratio at the different colour levels. SH cherries from the 2019 growing year showed higher harvest SS/TA ratios at the 4-5 and 5-6 colour levels compared to the 3-4 colour level. The SC cherries at all growing years showed highest harvest SS/TA ratio levels at the 5-6 colour level and comparable harvest SS/TA ratio levels at the 3-4 and 4-5 colour levels. SL cherries also showed the highest harvest SS/TA ratio at the 5-6 colour level and comparable harvest SS/TA ratios at the 3-4 and 4-5 colour levels.

    Comparing cultivars at common colour level, in 2018 growing year SC cherries at the 5-6 colour level showed a higher harvest SS/TA ratio compared to SH cherries at the corresponding colour level. In the 2019 growing year SH and SC cherries showed higher harvest SS/TA ratios at the 3-4 colour level compared to SL cherries. At the 4-5 colour level, SH cherries showed the highest harvest SS/TA ratio value and SL cherries showed the lowest harvest SS/TA ratio value. At the 5-6 colour level, SH and SC cherries showed comparable SS/TA ratios while SL cherries showed the lowest SS/TA ratio.

    Overall, this data indicates that ensuring cherry flavour quality is complex as SS/TA ratio varied by growing year, colour level and cultivar. Comparing SS/TA ratio data for all cultivars over all growing years did not show an observable trend between colour level and SS/TA ratio. As such, colour is not a reliable indicator of flavor quality.

    Table 4 shows the DM values as affected by cultivar, growing year, storage and colour level at harvest. Statistical analysis showed that the main effects of Cultivar (p = 0.0001; F-value = 11.36; df = 2), Colour (p < 0.0001; F-value = 130.99; df = 2), and Year (p < 0.0001; F-value = 56.64; df = 2) were all significant. Notably, the main effect of Time (harvest vs stored) was not significant (p = 0.0922). The interactions of Cultivar * Year (p = 0.001; F-value = 6.45; df = 3); Colour * Year (p = 0.0004; F-value = 6.38; df = 4); Cultivar * Colour * Year (p = 0.0018; F-value = 4.64; df = 5) were all significant. Although SS and TA values were not obtained for all three cultivars in 2021, DM values at harvest were obtained for all three cultivars in 2021. Data in Table 4 show, in general, DM levels did not change over 28-d storage, which was expected. Additionally, data in Table 4 shows that in most cases, at common cultivar and colour level, DM values measured in 2021 were greater than DM values measured in 2018 and 2019 for all cultivars (SH, SC, and SL).

    Within each cultivar, over all growing years, the harvest DM values were significantly different (p < 0.05) at each colour level, except for SC cherries in the 2018 and 2019 growing years. 2018 and 2019 DM values were not significantly different from colour level 3-4 to colour level 4-5. At the 5-6 colour level, over all growing years, SH cherries showed higher DM values compared to dry matter values observed for SC cherries (p < 0.05). At the 3-4 colour level, over all growing seasons, the DM values for SL and SC cherries were not significantly different (p < 0.05). At the 4-5 colour level, over all growing seasons, the DM values for SL were not significantly different than the DM values exhibited by SH and SC cherries (p < 0.05). In 2021 the effect of storage temperature (0.5 °C vs 3 °C) was investigated. DM levels in the SC cherries at the different colour levels were not affected by the different storage temperature. Overall, DM levels ranged from 18.1 to 25.2 depending on cultivar, colour level, growing year, and storage.

    Figure 1ac shows the distribution of the three cherry cultivars relative to DM value ranges over all three growing years via histograms. Cherries at the same colour level did not all have the same DM; this was observed both within and between cultivars (Fig. 1ac). DM data, compiled over all available growing years, for each cultivar in the 3-4, 4-5, and 5-6 colour levels had considerable overlap. However, it is noted there is consistent shift to a higher DM at the 5-6 colour level.

    Figure 1.  Histogram representing distribution of dry matter data for: (a) Sweetheart (SH) cherries over the 2018, 2019, and 2021 growing years; (b) Staccato (SC) cherries over the 2018, 2019, and 2021 growing years; and (c) Sentennial (SL) cherries over the 2019 and 2021 growing years. For all parts, the 3-4 colour level is solid black, the 4-5 level is black stripes, and the 5-6 level is solid grey. On the horizontal axis different dry matter value (DM) ranges are shown via bins and on the vertical axis the frequency or proportion (%) of cherries within the DM bins/ranges are shown. Data was generated from two replicates of samples of 25 cherries (i.e. 50 cherries) from all available growing years.

    Over all growing years, DM values for SH cherries ranged from 14%−27%, 14%−28.5%, and 16.5%−33%, at the 3-4, 4-5, and 5-6 colour levels, respectively (Fig. 1a). SH cherries at the 3-4 and 4-5 colour levels showed the highest proportion (26% and 26%, respectively) of cherries resided in the 22.5 and 22.5% DM bins indicating the highest percentage of SH cherries in these colour levels exhibited a DM of 21% to 22.5%, while the highest proportion (21%) of cherries at the 5-6 colour level resided in the 24% DM bin indicating the highest percentage of SH cherries at this colour level exhibited a DM of 22.5% to 24% (Fig. 1a).

    For SC cherries over all growing years, DM values ranged from 14%−25.5%, 14%−30%, and 16.5%−30%, at the 3-4, 4-5, and 5-6 colour levels, respectively (Fig. 1b). SC cherries at the 3-4 colour level showed the highest proportion of cherries (27%) resided in the 19.5% DM bin which indicated the highest percentage of SC cherries at this colour level exhibited a DM of 18 to 19.5%. SC cherries at the 4-5 colour level showed the highest proportion of cherries (25%) resided in the in the 21% DM bin which indicated the highest percentage of SC cherries at this colour level exhibited a DM of 19.5% to 21 %. At the 5-6 colour level, the highest proportion (35%) of SC cherries resided in the 22.5% DM bin which indicated the highest percentage of SC cherries exhibited a DM of 21%−22.5% (Fig. 1b).

    Over the 2019 and 2021 growing years, SL cherries DM values ranged from 15%−25.5%, 15%−28.5%, and 16.5%−33% at the 3-4, 4-5 and 5-6 colour levels, respectively (Fig. 1c). SL cherries at the 3-4 colour level showed the highest proportion of cherries (36%) resided in the 21% DM bin which indicated the highest percentage of SL cherries at this colour level exhibited a DM of 19.5% to 21%. SL cherries at the 4-5 colour level showed the highest proportion of cherries (28%) resided in the in the 21% DM bin which indicated the highest percentage of SL cherries at this colour level exhibited a DM of 19.5% to 21 %. At the 5-6 colour level, the highest proportion (26%) of SC cherries resided in the 22.5% DM bin which indicated the highest percentage of SL cherries exhibited a DM of 21%−22.5% (Fig. 1c).

    In all, the data in Tables 14 and Fig. 1 indicate that colour is not a reliable indicator of maturity or flavor quality. Cherries of the same colour may differ in DM, SS, TA, and SS/TA ratio due to cultivar and growing conditions. The implication of these results are discussed in subsequent sections.

    Temperature, relative humidity and harvest date for the 2018, 2019, and 2021 growing years are detailed in Table 5. Environmental variations between years impacted colour development, which resulted in yearly variations in our harvest dates as cherry picks were based on cherry colour levels: 2018, July 16 to August 9; 2019, July 18 to August 6; and 2021, July 5 to July 27, nearly two weeks earlier than in previous years (Table 5). In terms of environmental data, the average temperature (AT), average high temperature (AHT), and average low temperature (ALT) values measured in 2021 were greater than the values determined in 2018 and 2019, while the average relative humidity (ARH) values determined in 2021 were lower than the values measured in 2018 and 2019 (Table 5). Depending on growing year and harvest date, average temperature values ranged from 17.17 to 24.28 °C, average high temperature values ranged from 28.59 to 50.68 °C, average low temperatures ranged from 7.17 to 10.68 °C, and average relative humidity values ranged from 40.68% to 66.16% (Table 5).

    Table 5.  Temperature and relative humidity environmental data for 2018, 2019, and 2021 growing years.
    Growing year Colour level Harvest date Average
    temperature
    (AT) (°C)
    Average relative humidity (ARH) Average low temperature (ALT) (°C) Average high temperature (AHT) (°C)
    2018 Sweetheart 3-4 July 16 18.96 61.5% 7.17 32.14
    4-5 July 23 18.85 59.8% 7.17 32.13
    5-6 July 30 20.45 56.85% 7.49 32.05
    Staccato 3-4 July 30 19.74 59.17% 7.42 32.04
    4-5 August 9 21.14 54.46% 7.42 32.77
    5-6 August 9 21.14 54.49% 7.42 32.77
    2018 overall average 20.05 57.71% 7.35 32.32
    2019 Sweetheart 3-4 July 18 17.86 66.04% 7.22 28.79
    4-5 July 24 18.39 66.1% 7.22 28.59
    5-6 July 24 18.39 66.1% 7.22 28.59
    Staccato 3-4 July 22 18.03 66.16% 7.22 28.59
    4-5 July 29 19.19 62.92% 8.67 29.39
    5-6 July 31 19.19 62.92% 8.67 29.39
    Sentennial 3-4 July 22 18.03 66.16% 7.22 28.59
    4-5 July 29 18.99 63.77% 8.67 29.39
    5-6 August 6 19.79 59.94% 8.67 29.39
    2019 overall average 18.87 63.65% 8.19 28.96
    2021 Sweetheart 3-4 July 5 24.01 40.68% 8.51 50.68
    4-5 July 12 24.28 40.68% 10.68 49.23
    5-6 July 20 24.10 40.68% 9.66 47.47
    Staccato 3-4 July 13 24.01 40.68% 8.51 50.68
    4-5 July 21 24.28 40.68% 10.68 49.23
    5-6 July 27 24.10 40.68% 9.66 47.47
    Sentennial 3-4 July 12 24.01 40.68% 8.51 50.68
    4-5 July 19 24.28 40.68% 10.68 49.23
    5-6 July 26 24.10 40.68% 9.66 47.47
    2021 overall average 24.12 40.68% 9.62 49.13
     | Show Table
    DownLoad: CSV

    Principal component analysis (PCA) was performed on all cultivars over all growing seasons to best resolve cultivar specific relationships between variables affecting flavour quality parameters: colour, DM, SS and TA (Fig. 2).

    Figure 2.  Principal component analysis (PCA) plot for: Sweetheart (SH) cherries with data from 2018 and 2019 growing years at the 3-4, 4-5, and 5-6 colours levels (SH34-2018, SH45-2018, SH56-2018, SH34-2019, SH45-2019, and SH56-2019; Staccato (SC) cherries with data from 2018, 2019 and 2021 growing years at the 3-4, 4-5, and 5-6 colour levels (SC34-2018, SC45-2018, SC56-2018, SC34-2019, SC45-2019, SC56-2019, SC34-2021, SC45-2021, and SC56-2021); and Sentennial (SL) cherries with data from 2019 growing year (SL34-2019, SL45-2019, and SL56-2019). PC1 and PC2 accounted for 84.75% variation. The variables include: average temperature (AT), average high temperature (AHT), average low temperature (ALT), average relative humidity (ARH), colour at harvest (ColourH), SS at harvest (SSH), SS after 28 d of storage at 0.5 °C (SS05), titratable acidity at harvest (TAH), titratable acidity after 28 d of storage at 0.5 °C (TA05) and dry matter of cherry fruit at harvest (DMH). Orchard growing factors, flavour quality attributes (loading factors), along with sweet cherry cultivars from each growing season (component scores) were presented as lines with arrows, lines with circles, and squares, respectively. Variables close to each other with small angles between them are strongly positively correlated; variables at right angles are likely not correlated; variables at large angles (close to 180°) are strongly negatively correlated.

    Figure 2 shows that principal components 1 and 2 described most of the variation (84.75%) in the model. SS at harvest (SSH) and SS at 28-d storage at 0.5 °C (SS05) along with DM at harvest (DMH) were positively correlated with colour at harvest (ColourH). TA at harvest (TAH) and TA at 28-d storage at 0.5 °C (TA05) were positively correlated with average high temperature (ATH). AHT, average low temperature (ALT) and average temperature (AT). DMH was more strongly correlated with TAH and TA05 compared to ColourH. TAH and TA05 were positively correlated, yet negatively correlated with average relative humidity (ARH). The 2021 SC samples at the 3-4, 4-5, and 5-6 colour levels (SC34-2021, SC45-2021, and SC56-2021) were clustered with TAH, TA05, ALT, AHT, and AT variables and located in a quadrant opposite of ARH. In late June 2021 a heatwave of unprecedented magnitude impacted the Pacific Northwest region of Canada and the United States; the Canadian national temperature record was broken with a new record temperature of 49.6 °C[29]. Also, the relative humidity levels during this period were also extremely low[30]. As the location of this study was impacted by this heatwave, the data shown in Table 6 shows higher temperatures and lower relative humidity values for the 2021 growing year. The TA values measured in the 2021 growing year were nearly two times the levels measured in the 2018 and 2019 growing years (Table 2). This shows an impact of growing conditions on flavor quality; both the negative correlation between ARH and TA and positive correlations of AT, AHT, and ALT with TA are notable. However, it is noted that correlation does not mean causation. The SH and SC cultivars from the 2018 growing year at the 5-6 colour level were clustered together, and were located in the same quadrant as ColourH, SSH, SS05, and DMH variables (Fig. 2). This indicates these samples were characterized by high values of SSH, SS05, and DMH. All cultivars at the 3-4 colour level from the 2018 (SH and SC), and 2019 (SH, SC, and SL) growing years along with all cultivars at the 4-5 colour level from the 2019 (SH, SC, and SL) growing year were clustered in quadrants opposite of the SSH, SS05, DMH, ColourH, TAH, and TA05 variables while near the ARH variable. The clustering of the samples indicates similarity and lower levels of SSH, SS05, DMH, TAH, and TA05.

    Table 6.  Average colour level and respiration rate of sweet cherries at harvest.
    Growing year Colour
    level
    Average colour measured at harvest
    [average dry matter at harvest]
    Dry matter bin (%), highest
    proportions of cherries
    Respiration rate (mg CO2 kg−1·h−1)
    assessed at 0.5, 5 or 10 °C
    0.5 °C 5 °C 10 °C
    2018 Sweetheart 3-4 3.74a1 [20.9%] 21, 38% 2.87a1 * 5.99a1* 9.75a1*
    4-5 4.66b1 [21.9%] 22.5, 38% 3.57b1* 5.53b1* 9.06a1*
    5-6 5.54c1 [25.2%] 25.5, 26% 3.50b1* 5.18b1* 9.58a1*
    Staccato 3-4 3.58a1 [20.2%] 19.5, 44% 4.43a2* 7.08a2* 9.90a1*
    4-5 4.62b1 [20.4%] 21, 36% 4.58a2* 8.05b2* 11.22b2*
    5-6 5.64c1 [22.4%] 22.5, 50% 4.12b2* 6.43c2* 9.78a1*
    2019 Sweetheart 3-4 3.76a1 [18.6%] 18, 26%; 19.5, 26% Nd 6.04 13.7
    4-5 4.42b1 [19.9%] 21, 32% Nd Nd 8.3
    5-6 5.42c1 [21.1%] 22.5, 28% Nd 6.95 13.5
    Staccato 3-4 3.46a1 [18.4%] 19.5, 32% Nd 5.8 12.47
    4-5 4.40b12 [19.1%] 19.5, 40% Nd 6.14 Nd
    5-6 5.40c1 [22.9%] 22.5, 26% Nd Nd Nd
    Sentennial 3-4 3.62a1 [18.2%] 18, 28% Nd 6.5 12.80
    4-5 4.22b2 [19.3%] 21, 40% Nd 3.76 Nd
    5-6 5.20c2 [22.9%] 22.5, 24% Nd Nd Nd
    2021 Sweetheart 3-4 Nd [22.1%] 22.5, 40% 3.18a1* 5.86a1* 8.8a1*
    4-5 Nd [22.5%] 22.5, 28% 2.78a1* 5.08b1* 8.1a1*
    5-6 Nd [23.6%] 24, 30% 2.65a1* 4.32c1* 9.19a1*
    Staccato 3-4 3.50a1 [21.0%] 19.5, 28% 2.72a1 4.65ab2 10.94a2*
    4-5 4.80b1 [22.0%] 21, 24%; 22.5, 20% 3.27a1* 4.38a2* 8.22b1*
    5-6 5.60c1 [23.0%] 24, 30% 3.05a1* 5.07b2* 9.57ab1*
    Sentennial 3-4 Nd [20.5%] 21, 48% 2.71a1* 4.77a2* 7.84a1*
    4-5 Nd [22.6%] 22.5, 28%; 24, 24% 2.78a1* 4.81a12* 8.28ab1*
    5-6 Nd [23.5%] 22.5, 28%; 24, 24% 4.23b2 4.47a12 9.88b1*
    Within common cultivar and growing year, values followed by different letters indicate significant differences (p ≤ 0.05)-shows colour differences; Within common colour level and growing year, values followed by different numbers indicate significant differences (p ≤ 0.05)-shows cultivar differences; Within common cultivar, growing year and colour level, values followed by * indicate significant differences (p ≤ 0.05)-shows respiration rate differences at the different temperatures. Due to incomplete data, statistical analysis was not performed on 2019 data. Nd = Actual colour was not calculated for Sweetheart and Sentennial cherries in 2021 although cherries were collected 3-4, 4-5, 5-6 colour levels as in previous years and can be considered to have colour levels of approximately 3.5, 4.5, and 5.5, respectively.
     | Show Table
    DownLoad: CSV

    High respiration rates have long been associated with rapid fruit quality deterioration[11]. Lower respiration rates help to maintain higher TA levels, thereby retaining flavour quality[11,12]. This work aimed to provide information on assessing whether rapid and non-invasive dry matter measurements can serve as a surrogate for respiration rate measurements and/or TA measurements to predict fruit quality as this information is essential for developing recommendations to optimize cherry quality retention upon long distance transport. Although it is well known that quality deteriorates more quickly in fruit with higher respiration rates, the respiration rate data for the SH, SC, and SL cherries was collected and analyzed with respect to the different colour levels and corresponding DM values to investigate a link between respiration rate and DM value. Examining the data with this perspective is very novel and additionally very little information on respiration rates is available for SC and SL sweet cherries cultivars in the literature.

    Table 6 shows the respiration rates for a) SH and b) SC cherries at different colour levels for the 2018 growing year and how they were affected by respiration rate assessment temperature (0.5, 5, and 10 °C). Table 6 also shows the respiration rates for a) SH, b) SC, and c) SL cherries at different colour levels for the 2021 growing year and how they are affected by respiration rate assessment temperature. Please note respiration data is incomplete for the 2019 growing year because of data constraints due to equipment difficulties and therefore no statistical analysis was performed on the available 2019 respiration data. As little information exists in the literature for SC and SL cherries, we have included the incomplete respiration data. Table 6 also shows average color data and average DM data for the cherries collected at the different colour levels. Additionally, Table 6 shows data on the DM (%) bins containing the highest proportion of cherries for each cultivar in each growing year at each colour level (histograms for each cultivar for individual growing year not shown).

    Table 6 shows the average colour measured for the cherries harvested at the 3-4, 4-5, and 5-6 colour levels all varied slightly depending on growing year and cultivar. In both the 2018 and 2019 growing years there was no difference in color levels between SH and SC at harvest. In the 2019 growing year, the SL cherries showed lower average colour values at the 4-5 and 5-6 colour levels compared to the average colour levels of SH and SC cherries at the same level. Nevertheless, results indicated the cherries were harvested and sorted to the desired colour levels. In 2021, average colour was not calculated for SH and SL cherries, although cherries were collected at the 3-4, 4-5, and 5-6 colour levels, as in previous years, and can be considered to have been within range. The average colour level was calculated for SC cherries in 2021, as SC cultivar received comprehensive study over all growing years (2018, 2019 and 2021). The calculated colour level values for SC cherries in the 2021 growing year at the 3-4, 4-5, and 5-6 colour levels were 3.5, 4.8, and 5.6, respectively.

    Table 6 shows the lower the respiration rate assessment temperature, the lower the respiration rate, which was expected as cherries are recommended to be stored at 0.5 °C to ensure quality retention due to this fact[1]. In 2018, SH respiration rate values were consistently lower than SC cherries at 0.5 and 5 °C. However, at 10 °C the respiration rate values become comparable between cultivars (Table 6). Comparing between colour level, SH at colour level 3-4 showed the lowest respiration rate at 0.5 °C but had the highest respiration rate when assessed at 5 °C (Table 6). While SC 5-6 cherries at the 5 °C respiration rate assessment temperature showed a significantly lower respiration rate compared to respiration rates measured for SC 3-4 and SC 4-5 cherries at 5 °C (Table 6).

    In 2021, SH and SC respiration rates were more comparable at 0.5 and 10 °C, but at 5 °C, SH respiration rates were higher than SC at the 3-4 and 4-5 colour levels while SC cherries showed a higher respiration rate when assessed at 5 °C compared to the SH cherries at the 5-6 colour level (Table 6). SH respiration rates in 2021 were consistent at 0.5 and 10 °C for all colour levels (Table 6). However, at 5 °C SH cherries at the 5-6 colour level had the lowest respiration rate for all three of the colour levels and the SH cherries at the 3-4 colour level showed the highest respiration rate. This occurred in both 2018 and 2021 (Table 6). The respiration rates of SC cherries were not affected by colour level when assessed at 0.5 °C, but at the 5 °C respiration rate assessment temperature, 2018 SC cherries at 5-6 colour level had lower respiration values (Table 6), while 2021 SC cherries at the 4-5 colour level showed a lower respiration rate value (Table 6). Comparing colour levels, SL cherries at the 5-6 colour level had the highest respiration rates at 0.5 and 10 °C (Table 6). However, at 5 °C, all SL colour levels had comparable respiration values (Table 6). Further, in 2021, all cultivars at 0.5 °C assessment temperature showed respiration rates that were comparable between all colour levels except for SL 5-6. This respiration rate value was significantly higher than the respiration rates measured for the SL 3-4 and 4-5 colour levels and was also higher than the respiration rates determined for SH and SC at the 5-6 colour level. Interestingly, the respiration rate assessed at 0.5 °C for SL at the 5-6 colour level was not significantly different than the respiration rate assessed at 5 °C for SL at the 5-6 colour level (Table 6).

    To further discuss the results presented above, a main source of decreasing TA values in cherries is high respiratory activity[11]. Therefore, linking flavour quality, which is affected by TA levels, to differences in respiration rates is reasonable. Higher respiration rate assessment temperatures were related to higher respiration rates of cherries as seen in Table 6, which was not unexpected and again points to the importance of keeping temperature near 0.5 °C during storage. Additionally, the temperature cherries experience during a growing season affects the respiration rate of the harvested fruit, as Ross et al.[1] found the average temperature and the average high temperature measured in an orchard was positively correlated with the cherry respiration rate at both 5 and 10 °C. Therefore, understanding factors that impact respiration rate, and ensuring cherries are harvested under conditions that ensure a low respiration rate is of significant importance. Table 6 (2021 data) suggests the colour level with the lowest respiration rates for SC cherries is 4-5, which is supported by previous work[1]. While Table 6 (2018 data) suggests the 5-6 colour level gives the lowest respiration rates for SC cherries. When this information is combined with the TA value data, the peak TA values for SC cherries occurs at the 4-5 level and 5-6 colour levels. SH cherries showed that for respiration rate assessed at 0.5 °C, the colour level with the consistently lowest respiration rate was 3-4, but at the 5 °C respiration rate assessment temperature, which is a more abusive temperature, the 5-6 colour level showed the lowest respiration rate in both 2018 and 2021. The highest TA values were seen at the 5-6 colour level for SH cherries. SL cherries show highest TA values at the 3-4 and 4-5 colour level in the 2019 growing year, but insufficient respiration rate data is available in 2019 to comment further. However, the data in Tables 14 indicate that colour is not a reliable indicator of maturity and/or flavor quality. Cherries of the same colour may differ in DM, SS and TA due to cultivar and growing conditions. Figure 1 shows that not all cherries at the same colour level are at the same DM both within and between cultivars. There is a range of DM values for each cultivar in the 3-4, 4-5, and 5-6 colour ranges. However, it is noted the distribution of DM shifted to the right (higher levels) in the 5-6 colour cherries. The work of Palmer et al.[25] and Toivonen et al.[6] have indicated the importance of DM as a fruit quality metric. The implications of colour, DM, and respiration rate results on flavour quality and DM standards are discussed below.

    Associations between colour and DM at harvest with sweet cherry flavour quality attributes and respiration rates were statistically examined using Pearson's correlation coefficient from all available data over all growing years to investigate whether there may be colour/DM levels that are associated with lower respiration rates (Table 7) and could be indicative of when harvest should be performed (i.e. maturity). It was found that colour at harvest was positively correlated with SS at harvest and SS after storage (r = 0.845, p ≤ 0.0005, and r = 0.684, p ≤ 0.005, respectively). Colour at harvest was also positively correlated with DM at harvest (r = 0.768, p ≤ 0.0005). This was expected as darker cherries of a certain cultivar are generally more developed or mature; sugar content (main contributor to DM) and TA increases upon fruit development[1,6,22]. Neither colour or DM at harvest were correlated with SS/TA ratio at harvest or after storage (Table 7). Over all cultivars, no correlation was seen between respiration rate at any assessment temperature and colour level (Table 7). No significant correlations were found between respiration rate assessed at 0.5 and 10 °C and DM (Table 7). A significant negative correlation (r = −0.514, p ≤ 0.025) was found between respiration rate at 5 °C and DM. It was speculated that a correlation between respiration rate and DM was not observed when assessed at 0.5 °C, as this temperature is very low and effectively slows metabolic activity regardless of physiological status of the cherry. No observed correlation between respiration rate assessed at 10 °C and DM was speculated to be due to 10 °C being such an abusive temperature that even physiologically healthy cherries show elevated respiration rates when stored at 10 °C, and likely experienced increased flavour quality deterioration, which could be tested by measuring SS and TA values. Over all cultivars at 5 °C, cherries with lower DM tended to have higher respiration rates, and may be susceptible to more rapid quality deterioration at non-ideal temperatures such as 3−5 °C, which can be encountered in the cherry industry, particularly during export shipping (personal communication, Dr. Peter Toivonen, May, 2021). This points to the importance of good temperature control during storage and diverting lower DM cherries to the domestic and/or rapid consumption market vs export market. Colour was not correlated with TA, while DM at harvest was positively correlated with TA at harvest and upon storage (Table 7), which is relevant for flavour quality. These results indicate that DM has a greater influence on flavour quality attributes than cherry colour.

    Table 7.  Correlations between colour and dry matter at harvest with sweet cherry flavour quality attributes and respiration rate.
    Relationship assessed for Sweetheart*,
    Staccato, and Sentennial**
    cultivars over 2018, 2019,
    and 2021 growing seasons
    Pearson's
    correlation
    coefficient
    Significance
    level
    (p value)
    Colour correlated with
    Soluble solids at harvest r = +0.845 p ≤ 0.0005
    Soluble solids at 28-d storage r = +0.684 p ≤ 0.005
    Dry matter at harvest r = +0.768 p ≤ 0.0005
    Dry matter correlated with
    Soluble solids at harvest r = +0.871 p ≤ 0.0005
    Soluble solids at 28-d storage r = +0.776 p ≤ 0.0005
    Colour at harvest r = +0.769 p ≤ 0.0005
    Titratable acidity at harvest r = +0.439 p ≤ 0.05
    Titratable acidity at 28 d storage r = +0.398 p ≤ 0.10
    Respiration rate at 5 °C r = −0.514 p ≤ 0.025
    Insignificant correlations
    Colour and titratable acidity at harvest r = +0.099 p = 0.696
    Colour and titratable acidity at 28 d storage r = +0.100 p = 0.692
    Colour and soluble solids to titratable
    acidity ratio at harvest
    r = +0.218 p = 0.383
    Colour and soluble solids to titratable
    acidity ratio at 28 d storage
    r = +0.073 p = 0.774
    Colour and respiration rate at 0.5 °C r = +0.252 p = 0.364
    Colour and respiration rate at 5 °C r = −0.206 p = 0.462
    Colour and respiration rate at 10 °C r = +0.084 p = 0.766
    Dry matter and soluble solids to titratable
    acidity ratio at harvest
    r = −0.135 p = 0.595
    Dry matter and soluble solids to titratable
    acidity ratio at 28 d storage
    r = −0.227 p = 0.365
    Dry matter and respiration rate at 0.5 °C r =−0.125 p = 0.657
    Dry matter and respiration rate at 10 °C r = −0.181 p = 0.519
    *Only 2018 and 2019 growing season data available; **only 2019 growing season data available.
     | Show Table
    DownLoad: CSV

    Further, specific cultivar respiration rate and DM relationships were also examined (data not shown). For SH cherries, a negative correlation was determined between respiration rate assessed at 5 °C and DM (p ≤ 0.1), yet this correlation was not seen for SL cherries. Based on statistical parameters SC cherries only showed a negative correlation between respiration rate assessed at 5 °C and DM if a higher p value > 0.1 was used which signifies evidence is not strong enough to suggest a relationship exists. Nevertheless, the statistically significant negative correlation between respiration rate assessed at 5 °C and DM over all cultivars was identified (Table 7).

    Although colour was positively correlated with DM (Table 7), a higher colour may not necessarily indicate a low respiration rate as no significant correlation was observed between colour and respiration rate at any assessment temperature when examined over all cultivars over the growing years tested. Although this highlights the importance of DM in overall quality rather than colour, the data presented thus far suggests certain cultivars achieve different optimal DM values or ranges at maturity that are related to quality retention. In general, higher DM is positive, but is there an upper limit/threshold in terms of higher respiration rate. The lack of correlation between respiration rate assessed at 5 °C and DM for SC and SL cherries seems to indicate a lower optimal DM level for these cultivars compared to SH cherries, as a negative correlation between respiration rate assessed at 5 °C and DM was observed for SH cherries. Again, non-ideal temperatures such as 3−5 °C, can be encountered in the cherry industry, particularly during export shipping, which makes these results extremely relevant to help ensure cherry growers deliver high quality fruit for the export market.

    In 2018, the respiration rate at 5 °C was lowest at the 4-5 and 5-6 colour levels for SH cherries, and the average DM values were ~22% and 25%, respectively. Information from Table 6 shows that 38% of SH fruit were in the 22.5% DM bin indicating the highest percentage of SH cherries at the 4-5 colour level had a DM of 21% to 22.5% while 26% of SH cherries at the 5-6 colour level resided in the 25.5% DM bin indicating the highest percentage of cherries at this colour level had a DM of 24% to 25.5%. For SH cherries in 2021, the lowest respiration rate at 5 °C was at the 5-6 colour level and average DM value was ~23.6%. Information from Table 6 shows that 30% of SH at the 5-6 colour level resided in 24% DM bin indicating the highest percentage of SH cherries at this colour level had a dry mater of 22.5% to 24%. For 2018 SH cherries, titratable acidity, which is important for flavour quality, was highest at the 5-6 colour level where respiration rate assessed at 5 °C was lower. These results imply, that at maturity, cherries tend to a certain DM value or range that corresponds to reduced respiratory activity and promotes quality retention, and would therefore be considered optimal. Based on this data (lower respiration rate (2018 and 2021) and peak TA (2018)), an optimal DM range for SH may be between 22.5%−25% DM or around 23% DM. This optimal DM corresponded to cherries in the 4-5 colour level (21.9%) in 2018, and in the 5-6 colour level (25.2%, 23.6% respectively) in 2018 and 2021.

    2018 respiration rate (assessed at 5 °C) was lowest at the 5-6 colour level for SC cherries and the average DM value was ~22%, respectively. Information from Table 6 shows that 50% of SC cherries resided in the 22.5% DM bin indicating the highest percentage of SC cherries at the 5-6 colour level had a DM of 21% to 22.5% The 2021 respiration rate (assessed at 5 °C) was lowest for SC cherries at the 4-5 colour level and average DM value was ~22% while the highest respiration rate was measured at the 5-6 colour level and the average DM value was ~23.0%. Information from Table 6 shows that 24% and 20% of SC cherries resided in each the 21% and 22.5% DM bins, respectively, indicating the highest percentage of SC cherries at the 4-5 colour level had a DM of 19.5% to 22.5%. For 2021 SC cherries, TA was higher at the 4-5 colour levels, where respiration rate assessed at 5 °C was lowest. Again, these results imply that at maturity cherries tends to a certain DM value or range (optimal) that corresponds to reduced respiratory activity and promotes quality retention. Based on this data (lower respiration rate (2018 and 2021) and peak TA (2018 and 2021)) an optimal DM range for SC may be between 19.5%−22.5% DM or around 22% DM. This optimal DM corresponded to cherries in the 4-5 colour level (22.0%) in 2021, and in the 5-6 colour level (22.4%) in 2018. The data also shows the optimal DM range for SH cherries is higher than the optimal DM range for SC cherries.

    In 2021, for the SL cherries, all colour levels showed the same respiration rate (assessed at 5 °C) and average DM values were 20.5%, 22.6% and 23.5% for the 3-4, 4-5 and 5-6 colour levels, respectively. Information from Table 6 shows that SL cherries at both the 4-5 and 5-6 colour levels, 28% and 24% of the cherries resided in the 22.5% and 24% DM bins indicting the highest percentage of cherries at these colour stages ranged from 21% to 24% DM. For SL, based on the one year of respiration data (2021), determining optimum DM was not as clear. At lower storage temperature (0.5 °C), lower average DM (20.5%−22.6% vs 23.5%) maintained lower respiration rates, but at higher storage temperature (5 and 10 °C) respiration rate did not appear to be affected by DM level. These lower DM values occurred at the 3-4 and 4-5 colour levels.

    Available DM, TA and respiration rate data as discussed suggests the optimal DM range for SH may be between 22.5%−25% DM or around 23% and an optimal dry matter range for SC may be between 19.5%−22.5% DM or around 22% DM, The histogram data over all growing years does further strengthen the justification for suggesting different optimal DM values for different cultivars (Fig. 1). The data over all growing years shows higher proportions of cherries in the 24 % DM bin for SH cherries at the 5-6 colour level which indicated highest proportion of cherries with a DM of 22.5% to 24%. The SC cherries at the 5-6 colour level showed the highest proportion of cherries in the 22.5% DM bin, which indicates the highest percentage of cherries have a DM of 21% to 22.5%; again these DM ranges have been suggested as optimal DM values based on previously discussed respiration data.

    In psychology self-actualization is a concept regarding the process by which an individual reaches their full potential[31]. The data suggests that sweet cherries self-actualize, with the majority of cherries reaching maturity with a DM range that promotes quality retention during storage when growing conditions are favourable. This optimal DM range is different for different cultivars, and growing conditions would be expected to influence the rate and/or ability of this 'self-actualization', as this work and our previous research has shown that environmental factors are correlated with these important quality characteristics[1]. Placing highest importance on distribution of DM levels at the 5-6 colour levels (Fig. 1) is justified as the cherries are the most physiologically mature and will likely exhibit the highest proportion of cherries with optimal DM; however, the optimal DM can occur at other colour ranges and should be used as the primary indicator of maturity. Maturity at harvest is the most important factor that determines storage-life and final fruit quality assweet cherries produce very small quantities of ethylene and do not respond to ethylene treatment; they need to be picked when fully ripe to ensure good flavour quality[32]. It is noted the CTFIL colour standard series goes up to colour level 7, yet a balance needs to be reached between flavour quality optimization vs other quality parameters such as firmness and stem pull force. Supplementary Tables S1S6 provide values of the quality parameters of firmness, stem pull force, stem shrivel, stem browning, pebbling and pitting levels at harvest and after storage for the SH, SC and SL cherries. All of these cherry cultivars exhibited good quality attributes at the 5-6 colour level, as well as lighter colour ranges.

    It is noted that the development of DM standards for different cultivars is a novel concept. This work was positioned as field work that collected cherry data for three cultivars over three growing years in adjacent orchards using the same management practices. Equipment constraints limited respiration rate data collection. As such absolute optimal DM values and/or ranges could not be determined nor was the goal of this study. The goal of this work was to further the concept that different cultivars may reach maturity at different DM levels, which would result in lower respiration rates and higher TA levels at harvest, and after storage, achieving enhanced quality retention. In this regard, absolute optimal DM would be the DM achievable by a cherry cultivar that maximizes flavour attributes and minimizes respiration under ideal conditions. In reality, the absolute optimal DM may or may not be reached during a growing season depending on environmental conditions and orchard management practices; however, cherry cultivars will reach a DM that will be optimal for the growing conditions at harvest maturity, as the present research demonstrates. Developing definitive DM standards to determine optimal harvest points for different cultivars under different environmental conditions should be a direction of research to be further pursued to ensure cherry quality, particularly for cherries subjected to longer term storage and/or cherries destined for the overseas export market.

    The present work is not the first to point to the importance of DM and cherry flavour retention, as an anecdotal report[33] indicated that SH cherries should be harvested at a DM of no higher than 20% or the fruit will lose both sugar and acidity more rapidly during shipping storage. Although this DM value is lower than the DM recommended for SH in the current work, it indicates the importance of DM level and flavour quality in relation to a specific cultivar. The differences between optimal DM for flavour retention in our work and the anecdotal report signifies the complexity of determining DM standards and the impact of growing year/environmental conditions and orchard management practices on optimal DM. Growers will continue to face these complex issues but the present work provides valuable information to growers regarding DM standards for three cultivars.

    It must be noted again that development of absolute DM standards for different cherry cultivars requires more study under rigorous controlled environmental conditions. Additionally, given the impact of environmental conditions on optimal DM, cultivars of interest must be studied over many growing years and orchard conditions to collect a robust data set. Nevertheless, the present research indicates that SH, SC, and SL cultivars have different dry matter values at maturity. The data also shows the DM range for SH cherries at maturity is higher than the DM range for SC cherries at maturity and that for SL, lower DM levels maintained lower respiration rates at lower temperatures, potentially improving ability to maintain quality after harvest.

    Overall, this research showed that DM was a better indicator of flavour quality than colour, as DM was related to both sugars and TA, while colour was only related to sugar. Therefore, this work identified that colour may not be a reliable indicator of maturity and/or flavor quality. This work indicated that cherries of the same colour may differ in DM, SS, and TA due to cultivar type and growing conditions as influenced by growing year. Relative humidity encountered by cherries during the growing season was negatively correlated with TA and higher growing temperatures were positively correlated with TA. This work discovered that sweet cherries may self-actualize, in that when growing conditions are favourable, DM levels may tend towards a certain level at maturity (optimal DM) resulting in superior flavour quality attributes and lower respiration, allowing cherries to reach their full quality potential and ensure quality retention in storage. Therefore, optimal DM can be reached at maturity despite colour. Remaining challenges include development of DM standards for various sweet cherry cultivars and further understanding the impact of growing conditions to better allow for self-actualization and prediction of the optimal DM under those conditions to optimize timing of harvest from year-to-year. Nevertheless, this research based on field work for three sweet cherry cultivars over three growing years, indicated an optimal DM range for SH between 22.5%−25% DM and an optimal DM range for SC between 19.5%−22.5% DM. Interestingly, under the same field conditions, the optimal DM range for SH cherries was higher than the optimal DM range for SC cherries. More analysis is required for determining optimal DM for SL, but the initial data indicates DM in the range of 20.5% to 22.6% maintained lower respiration rates at lower temperature potentially improving ability to maintain quality after harvest.

    The authors confirm contribution to the paper as follows: study conception and design: Ross KA, DeLury NC, Fukumoto L; data collection: Ross KA, DeLury NC, Fukumoto L; analysis and interpretation of results: Ross KA, DeLury NC, Fukumoto L; draft manuscript preparation: Ross KA, DeLury N, Fukumoto L, Forsyth JA. All authors reviewed the results and approved the final version of the manuscript.

    The datasets generated during and/or analysed during the current study are available from the corresponding author on reasonable request.

    We are grateful to the BC Cherry Association for financial support of this research project. We acknowledge Manon Gentes, Gillian Beaudry, and Duncan Robinson for their technical assistance. We are grateful to Brenda Lannard for providing her expertise on using the Felix F750 handheld spectrometer (Felix Instruments, Inc.) to obtain dry matter values and obtaining respiration data. Kelly A. Ross would like to thank and acknowledge Dr. Peter Toivonen for his mentorship, valuable scientific discussions and consistently kind support.

  • The authors declare that they have no conflict of interest.

  • [1]

    Good SP, Noone D, Bowen G. 2015. Hydrologic connectivity constrains partitioning of global terrestrial water fluxes. Science 349:175−77

    doi: 10.1126/science.aaa59

    CrossRef   Google Scholar

    [2]

    Quinet M, Angosto T, Yuste-Lisbona FJ, Blanchard-Gros R, Bigot S, et al. 2019. Tomato fruit development and metabolism. Frontiers in Plant Science 10:1554

    doi: 10.3389/fpls.2019.01554

    CrossRef   Google Scholar

    [3]

    Zhu Y, Zhu G, Xu R, Jiao Z, Yang J, et al. 2023. A natural promoter variation of SlBBX31 confers enhanced cold tolerance during tomato domestication. Plant Biotechnology Journal 21:1033−43

    doi: 10.1111/pbi.14016

    CrossRef   Google Scholar

    [4]

    Waadt R, Seller CA, Hsu PK, Takahashi Y, Munemasa S, et al. 2022. Plant hormone regulation of abiotic stress responses. Nature Reviews Molecular Cell Biology 23:680−94

    doi: 10.1038/s41580-022-00479-6

    CrossRef   Google Scholar

    [5]

    Ku Y, Sintaha M, Cheung M, Lam H. 2018. Plant hormone signaling crosstalks between biotic and abiotic stress responses. International Journal of Molecular Sciences 19:3206

    doi: 10.3390/ijms19103206

    CrossRef   Google Scholar

    [6]

    Gong Z, Xiong L, Shi H, Yang S, Herrera-Estrella LR, et al. 2020. Plant abiotic stress response and nutrient use efficiency. Science China Life Sciences 63:635−74

    doi: 10.1007/s11427-020-1683-x

    CrossRef   Google Scholar

    [7]

    Yuan F, Yang H, Xue Y, Kong D, Ye R, et al. 2014. OSCA1 mediates osmotic-stress-evoked Ca2+ increases vital for osmosensing in Arabidopsis. Nature 514:367−71

    doi: 10.1038/nature13593

    CrossRef   Google Scholar

    [8]

    Zhu J. 2016. Abiotic stress signaling and responses in plants. Cell 167:313−24

    doi: 10.1016/j.cell.2016.08.029

    CrossRef   Google Scholar

    [9]

    Uehlein N, Lovisolo C, Siefritz F, Kaldenhoff R. 2003. The tobacco aquaporin NtAQP1 is a membrane CO2 pore with physiological functions. Nature 425:734−37

    doi: 10.1038/nature02027

    CrossRef   Google Scholar

    [10]

    Tyerman SD. 2002. Nonselective cation channels. Multiple functions and commonalities. Plant Physiology 128:327−28

    doi: 10.1104/pp.900021

    CrossRef   Google Scholar

    [11]

    Kruse E, Uehlein N, Kaldenhoff R. 2006. The aquaporins. Genome Biology 7:206

    doi: 10.1186/gb-2006-7-2-206

    CrossRef   Google Scholar

    [12]

    Shivaraj SM, Sharma Y, Chaudhary J, Rajora N, Sharma S, et al. 2021. Dynamic role of aquaporin transport system under drought stress in plants. Environmental and Experimental Botany 184:104367

    doi: 10.1016/j.envexpbot.2020.104367

    CrossRef   Google Scholar

    [13]

    Li R, Wang J, Li S, Zhang L, Qi C, et al. 2016. Plasma membrane intrinsic proteins SlPIP2;1, SlPIP2;7 and SlPIP2;5 conferring enhanced drought stress tolerance in tomato. Scientific Reports 6:31814

    doi: 10.1038/srep31814

    CrossRef   Google Scholar

    [14]

    Chong L, Hsu CC, Zhu Y. 2022. Advances in mass spectrometry-based phosphoproteomics for elucidating abscisic acid signaling and plant responses to abiotic stress. Journal of Experimental Botany 73:6547−57

    doi: 10.1093/jxb/erac324

    CrossRef   Google Scholar

    [15]

    Zhu JK. 2002. Salt and drought stress signal transduction in plants. Annual Review of Plant Biology 53:247−73

    doi: 10.1146/annurev.arplant.53.091401.143329

    CrossRef   Google Scholar

    [16]

    Zhang J, Jia W, Yang J, Ismail AM. 2006. Role of ABA in integrating plant responses to drought and salt stresses. Field Crops Research 97:111−19

    doi: 10.1016/j.fcr.2005.08.018

    CrossRef   Google Scholar

    [17]

    Ali A, Pardo JM, Yun DJ. 2020. Desensitization of ABA-signaling: the swing from activation to degradation. Frontiers in Plant Science 11:379

    doi: 10.3389/fpls.2020.00379

    CrossRef   Google Scholar

    [18]

    Takahashi F, Suzuki T, Osakabe Y, Betsuyaku S, Kondo Y, et al. 2018. A small peptide modulates stomatal control via abscisic acid in long-distance signalling. Nature 556:235−38

    doi: 10.1038/s41586-018-0009-2

    CrossRef   Google Scholar

    [19]

    Chen X, Ding Y, Yang Y, Song C, Wang B, et al. 2021. Protein kinases in plant responses to drought, salt, and cold stress. Journal of Integrative Plant Biology 63:53−78

    doi: 10.1111/jipb.13061

    CrossRef   Google Scholar

    [20]

    Ma Y, Szostkiewicz I, Korte A, Moes D, Yang Y, et al. 2009. Regulators of PP2C phosphatase activity function as abscisic acid sensors. Science 324:1064−68

    doi: 10.1126/science.1172408

    CrossRef   Google Scholar

    [21]

    Park SY, Fung P, Nishimura N, Jensen DR, Fujii H, et al. 2009. Abscisic acid inhibits type 2C protein phosphatases via the PYR/PYL family of START proteins. Science 324:1068−71

    doi: 10.1126/science.1173041

    CrossRef   Google Scholar

    [22]

    Liu S, Lv Z, Liu Y, Li L, Zhang L. 2018. Network analysis of ABA-dependent and ABA-independent drought responsive genes in Arabidopsis thaliana. Genetics and Molecular Biology 41:624−37

    doi: 10.1590/1678-4685-gmb-2017-0229

    CrossRef   Google Scholar

    [23]

    Sakuma Y, Maruyama K, Qin F, Osakabe Y, Shinozaki K, et al. 2006. Dual function of an Arabidopsis transcription factor DREB2A in water-stress-responsive and heat-stress-responsive gene expression. Proceedings of the National Academy of Sciences of the United States of America 103:18822−27

    doi: 10.1073/pnas.0605639103

    CrossRef   Google Scholar

    [24]

    Sakuma Y, Liu Q, Dubouzet JG, Abe H, Shinozaki K, et al. 2002. DNA-binding specificity of the ERF/AP2 domain of Arabidopsis DREBs, Transcription factors involved in dehydration- and cold-inducible gene expression. Biochemical and Biophysical Research Communications 290:998−1009

    doi: 10.1006/bbrc.2001.6299

    CrossRef   Google Scholar

    [25]

    Sakuma Y, Maruyama K, Osakabe Y, Qin F, Seki M, et al. 2006. Functional analysis of an Arabidopsis transcription factor, DREB2A, involved in drought-responsive gene expression. The Plant Cell 18:1292−309

    doi: 10.1105/tpc.105.035881

    CrossRef   Google Scholar

    [26]

    Lee SJ, Kang JY, Park HJ, Kim MD, Bae MS, et al. 2010. DREB2C interacts with ABF2, a bZIP protein regulating abscisic acid-responsive gene expression, and its overexpression affects abscisic acid sensitivity. Plant Physiology 153:716−27

    doi: 10.1104/pp.110.154617

    CrossRef   Google Scholar

    [27]

    Kim JS, Mizoi J, Yoshida T, Fujita Y, Nakajima J, et al. 2011. An ABRE promoter sequence is involved in osmotic stress-responsive expression of the DREB2A gene, which encodes a transcription factor regulating drought-inducible genes in Arabidopsis. Plant and Cell Physiology 52:2136−46

    doi: 10.1093/pcp/pcr143

    CrossRef   Google Scholar

    [28]

    Fujii H, Zhu JK. 2009. Arabidopsis mutant deficient in 3 abscisic acid-activated protein kinases reveals critical roles in growth, reproduction, and stress. Proceedings of the National Academy of Sciences of the United States of America 106:8380−85

    doi: 10.1073/pnas.0903144106

    CrossRef   Google Scholar

    [29]

    Zhu Y, Huang P, Guo P, Chong L, Yu G, et al. 2020. CDK8 is associated with RAP2.6 and SnRK2.6 and positively modulates abscisic acid signaling and drought response in Arabidopsis. New Phytologist 228:1573−90

    doi: 10.1111/nph.16787

    CrossRef   Google Scholar

    [30]

    Chong L, Xu R, Ku L, Zhu Y. 2022. Beyond stress response: OST1 opening doors for plants to grow. Stress Biology 2:44

    doi: 10.1007/s44154-022-00069-8

    CrossRef   Google Scholar

    [31]

    Chong L, Xu R, Huang P, Guo P, Zhu M, et al. 2022. The tomato OST1-VOZ1 module regulates drought-mediated flowering. The Plant Cell 34:2001−18

    doi: 10.1093/plcell/koac026

    CrossRef   Google Scholar

    [32]

    Chen Q, Hu T, Li X, Song C, Zhu J, et al. 2022. Phosphorylation of SWEET sucrose transporters regulates plant root: shoot ratio under drought. Nature Plants 8:68−77

    doi: 10.1038/s41477-021-01040-7

    CrossRef   Google Scholar

    [33]

    De Zelicourt A, Colcombet J, Hirt H. 2016. The role of MAPK modules and ABA during abiotic stress signaling. Trends in Plant Science 21:677−85

    doi: 10.1016/j.tplants.2016.04.004

    CrossRef   Google Scholar

    [34]

    Danquah A, de Zelicourt A, Colcombet J, Hirt H. 2014. The role of ABA and MAPK signaling pathways in plant abiotic stress responses. Biotechnology Advances 32:40−52

    doi: 10.1016/j.biotechadv.2013.09.006

    CrossRef   Google Scholar

    [35]

    Yu J, Kang L, Li Y, Wu C, Zheng C, et al. 2021. RING finger protein RGLG1 and RGLG2 negatively modulate MAPKKK18 mediated drought stress tolerance in Arabidopsis. Journal of Integrative Plant Biology 63:484−93

    doi: 10.1111/jipb.13019

    CrossRef   Google Scholar

    [36]

    Cheng MC, Hsieh EJ, Chen JH, Chen HY, Lin TP. 2012. Arabidopsis RGLG2, functioning as a RING E3 ligase, interacts with AtERF53 and negatively regulates the plant drought stress response. Plant Physiology 158:363−75

    doi: 10.1104/pp.111.189738

    CrossRef   Google Scholar

    [37]

    Wang L, Zhao R, Li R, Yu W, Yang M, et al. 2018. Enhanced drought tolerance in tomato plants by overexpression of SlMAPK1. Plant Cell, Tissue and Organ Culture (PCTOC) 133:27−38

    doi: 10.1007/s11240-017-1358-5

    CrossRef   Google Scholar

    [38]

    Wang L, Chen L, Li R, Zhao R, Yang M, et al. 2017. Reduced drought tolerance by CRISPR/Cas9-mediated SlMAPK3 mutagenesis in tomato plants. Journal of Agricultural and Food Chemistry 65:8674−82

    doi: 10.1021/acs.jafc.7b02745

    CrossRef   Google Scholar

    [39]

    Hoang XLT, Prerostova S, Thu NBA, Thao NP, Vankova R, et al. 2021. Histidine kinases: diverse functions in plant development and responses to environmental conditions. Annual Review of Plant Biology 72:297−323

    doi: 10.1146/annurev-arplant-080720-093057

    CrossRef   Google Scholar

    [40]

    Nishimura C, Ohashi Y, Sato S, Kato T, Tabata S, et al. 2004. Histidine kinase homologs that act as cytokinin receptors possess overlapping functions in the regulation of shoot and root growth in Arabidopsis. The Plant Cell 16:1365−77

    doi: 10.1105/tpc.021477

    CrossRef   Google Scholar

    [41]

    Mushtaq N, Wang Y, Fan J, Li Y, Ding J. 2022. Down-regulation of cytokinin receptor gene SlHK2 improves plant tolerance to drought, heat, and combined stresses in tomato. Plants 11:154

    doi: 10.3390/plants11020154

    CrossRef   Google Scholar

    [42]

    Thirumalaikumar VP, Devkar V, Mehterov N, Ali S, Ozgur R, et al. 2018. NAC transcription factor JUNGBRUNNEN1 enhances drought tolerance in tomato. Plant Biotechnology Journal 16:354−66

    doi: 10.1111/pbi.12776

    CrossRef   Google Scholar

    [43]

    Fujita Y, Fujita M, Satoh R, Maruyama K, Parvez MM, et al. 2005. AREB1 is a transcription activator of novel ABRE-dependent ABA signaling that enhances drought stress tolerance in Arabidopsis. The Plant Cell 17:3470−88

    doi: 10.1105/tpc.105.035659

    CrossRef   Google Scholar

    [44]

    Gilroy S, Read ND, Trewavas AJ. 1990. Elevation of cytoplasmic calcium by caged calcium or caged inositol triphosphate initiates stomatal closure. Nature 346:769−71

    doi: 10.1038/346769a0

    CrossRef   Google Scholar

    [45]

    Murata Y, Pei ZM, Mori IC, Schroeder J. 2001. Abscisic acid activation of plasma membrane Ca2+ channels in guard cells requires cytosolic NAD(P)H and is differentially disrupted upstream and downstream of reactive oxygen species production in abi1-1 and abi2-1 protein phosphatase 2C mutants. The Plant Cell 13:2513−23

    doi: 10.1105/tpc.010210

    CrossRef   Google Scholar

    [46]

    Mustilli AC, Merlot S, Vavasseur A, Fenzi F, Giraudat J. 2002. Arabidopsis OST1 protein kinase mediates the regulation of stomatal aperture by abscisic acid and acts upstream of reactive oxygen species production. The Plant Cell 14:3089−99

    doi: 10.1105/tpc.007906

    CrossRef   Google Scholar

    [47]

    Yoshida T, Fujita Y, Maruyama K, Mogami J, Todaka D, et al. 2015. Four Arabidopsis AREB/ABF transcription factors function predominantly in gene expression downstream of SnRK2 kinases in abscisic acid signalling in response to osmotic stress. Plant, Cell & Environment 38:35−49

    doi: 10.1111/pce.12351

    CrossRef   Google Scholar

    [48]

    Nakashima K, Ito Y, Yamaguchi-Shinozaki K. 2009. Transcriptional regulatory networks in response to abiotic stresses in Arabidopsis and grasses. Plant Physiology 149:88−95

    doi: 10.1104/pp.108.129791

    CrossRef   Google Scholar

    [49]

    Wang Z, Liu L, Cheng C, Ren Z, Xu S, et al. 2020. GAI functions in the plant response to dehydration stress in Arabidopsis thaliana. International Journal of Molecular Sciences 21:819

    doi: 10.3390/ijms21030819

    CrossRef   Google Scholar

    [50]

    Li Q, Wang C, Jiang L, Li S, Sun S, et al. 2012. An interaction between BZR1 and DELLAs mediates direct signaling crosstalk between brassinosteroids and gibberellins in Arabidopsis. Science Signaling 5:ra72

    doi: 10.1126/scisignal.2002908

    CrossRef   Google Scholar

    [51]

    Yoshida T, Fujita Y, Sayama H, Kidokoro S, Maruyama K, et al. 2010. AREB1, AREB2, and ABF3 are master transcription factors that cooperatively regulate ABRE-dependent ABA signaling involved in drought stress tolerance and require ABA for full activation. The Plant Journal 61:672−85

    doi: 10.1111/j.1365-313X.2009.04092.x

    CrossRef   Google Scholar

    [52]

    Singh D, Laxmi A. 2015. Transcriptional regulation of drought response: a tortuous network of transcriptional factors. Frontiers in Plant Science 6:895

    doi: 10.3389/fpls.2015.00895

    CrossRef   Google Scholar

    [53]

    Todaka D, Shinozaki K, Yamaguchi-Shinozaki K. 2015. Recent advances in the dissection of drought-stress regulatory networks and strategies for development of drought-tolerant transgenic rice plants. Frontiers in Plant Science 6:84

    doi: 10.3389/fpls.2015.00084

    CrossRef   Google Scholar

    [54]

    Nie S, Huang S, Wang S, Mao Y, Liu J, et al. 2019. Enhanced brassinosteroid signaling intensity via SlBRI1 overexpression negatively regulates drought resistance in a manner opposite of that via exogenous BR application in tomato. Plant Physiology and Biochemistry 138:36−47

    doi: 10.1016/j.plaphy.2019.02.014

    CrossRef   Google Scholar

    [55]

    Mahesh K, Balaraju P, Ramakrishna B, Rao S. 2013. Effect of brassinosteroids on germination and seedling growth of radish (Raphanus sativus L.) under PEG-6000 induced water stress. American Journal of Plant Sciences 4:2305−13

    doi: 10.4236/ajps.2013.412285

    CrossRef   Google Scholar

    [56]

    Behnamnia M, Kalantari M, Rezanejad F. 2009. Exogenous application of brassinosteroid alleviates drought-induced oxidative stress in Lycopersicon esculentum L. General and Applied Plant Physiology 35:22−34

    Google Scholar

    [57]

    Fujita Y, Yoshida T, Yamaguchi-Shinozaki K. 2013. Pivotal role of the AREB/ABF-SnRK2 pathway in ABRE-mediated transcription in response to osmotic stress in plants. Physiologia Plantarum 147:15−27

    doi: 10.1111/j.1399-3054.2012.01635.x

    CrossRef   Google Scholar

    [58]

    Wang H, Tang J, Liu J, Hu J, Liu J, et al. 2018. Abscisic acid signaling inhibits brassinosteroid signaling through dampening the dephosphorylation of BIN2 by ABI1 and ABI2. Molecular Plant 11:315−25

    doi: 10.1016/j.molp.2017.12.013

    CrossRef   Google Scholar

    [59]

    Wang Q, Yu F, Xie Q. 2020. Balancing growth and adaptation to stress: crosstalk between brassinosteroid and abscisic acid signaling. Plant, Cell & Environment 43:2325−35

    doi: 10.1111/pce.13846

    CrossRef   Google Scholar

    [60]

    Zhao W, Huang H, Wang J, Wang X, Xu B, et al. 2023. Jasmonic acid enhances osmotic stress responses by MYC2-mediated inhibition of protein phosphatase 2C1 and response regulators 26 transcription factor in tomato. The Plant Journal 113:546−61

    doi: 10.1111/tpj.16067

    CrossRef   Google Scholar

    [61]

    Huang H, Qiao H, Ma X, Zhao W, Sun L, et al. 2023. Roles of jasmonates in tomato growth, development and defense. Vegetable Research 3:14

    doi: 10.48130/VR-2023-0014

    CrossRef   Google Scholar

    [62]

    Yao G, Li F, Nie Z, Bi M, Jiang H, et al. 2021. Ethylene, not ABA, is closely linked to the recovery of gas exchange after drought in four Caragana species. Plant, Cell & Environment 44:399−411

    doi: 10.1111/pce.13934

    CrossRef   Google Scholar

    [63]

    Gu X, Smaill SJ, Wang B, Liu Z, Xu X, et al. 2022. Reducing plant-derived ethylene concentrations increases the resistance of temperate grassland to drought. Science of The Total Environment 846:157408

    doi: 10.1016/j.scitotenv.2022.157408

    CrossRef   Google Scholar

    [64]

    Pan Y, Seymour GB, Lu C, Hu Z, Chen X, et al. 2012. An ethylene response factor (ERF5) promoting adaptation to drought and salt tolerance in tomato. Plant Cell Reports 31:349−60

    doi: 10.1007/s00299-011-1170-3

    CrossRef   Google Scholar

    [65]

    Salvi P, Manna M, Kaur H, Thakur T, Gandass N, et al. 2021. Phytohormone signaling and crosstalk in regulating drought stress response in plants. Plant Cell Reports 40:1305−29

    doi: 10.1007/s00299-021-02683-8

    CrossRef   Google Scholar

    [66]

    Baillo EH, Kimotho RN, Zhang Z, Xu P. 2019. Transcription factors associated with abiotic and biotic stress tolerance and their potential for crops improvement. Genes 10:771

    doi: 10.3390/genes10100771

    CrossRef   Google Scholar

    [67]

    Xu ZY, Kim SY, Hyeon DY, Kim DH, Dong T, et al. 2013. The Arabidopsis NAC transcription factor ANAC096 cooperates with bZIP-type transcription factors in dehydration and osmotic stress responses. The Plant Cell 25:4708−24

    doi: 10.1105/tpc.113.119099

    CrossRef   Google Scholar

    [68]

    Zhu M, Chen G, Zhang J, Zhang Y, Xie Q, et al. 2014. The abiotic stress-responsive NAC-type transcription factor SlNAC4 regulates salt and drought tolerance and stress-related genes in tomato (Solanum lycopersicum). Plant Cell Reports 33:1851−63

    doi: 10.1007/s00299-014-1662-z

    CrossRef   Google Scholar

    [69]

    Jian W, Zheng Y, Yu T, Cao H, Chen Y, et al. 2021. SlNAC6, A NAC transcription factor, is involved in drought stress response and reproductive process in tomato. Journal of Plant Physiology 264:153483

    doi: 10.1016/j.jplph.2021.153483

    CrossRef   Google Scholar

    [70]

    Achard P, Renou JP, Berthomé R, Harberd NP, Genschik P. 2008. Plant DELLAs restrain growth and promote survival of adversity by reducing the levels of reactive oxygen species. Current Biology 18:656−60

    doi: 10.1016/j.cub.2008.04.034

    CrossRef   Google Scholar

    [71]

    Cao Y, Li K, Li Y, Zhao X, Wang L. 2020. MYB transcription factors as regulators of secondary metabolism in plants. Biology 9:61

    doi: 10.3390/biology9030061

    CrossRef   Google Scholar

    [72]

    Cui J, Jiang N, Zhou X, Hou X, Yang G, et al. 2018. Tomato MYB49 enhances resistance to Phytophthora infestans and tolerance to water deficit and salt stress. Planta 248:1487−503

    doi: 10.1007/s00425-018-2987-6

    CrossRef   Google Scholar

    [73]

    Chen Y, Feng P, Zhang X, Xie Q, Chen G, et al. 2022. Silencing of SlMYB50 affects tolerance to drought and salt stress in tomato. Plant Physiology and Biochemistry 193:139−52

    doi: 10.1016/j.plaphy.2022.10.026

    CrossRef   Google Scholar

    [74]

    Chen Y, Li L, Tang B, Wu T, Chen G, et al. 2022. Silencing of SlMYB55 affects plant flowering and enhances tolerance to drought and salt stress in tomato. Plant Science 316:111166

    doi: 10.1016/j.plantsci.2021.111166

    CrossRef   Google Scholar

    [75]

    Feng K, Hou X, Xing G, Liu J, Duan A, et al. 2020. Advances in AP2/ERF super-family transcription factors in plant. Critical Reviews in Biotechnology 40:750−76

    doi: 10.1080/07388551.2020.1768509

    CrossRef   Google Scholar

    [76]

    Ohme-Takagi M, Shinshi H. 1995. Ethylene-inducible DNA binding proteins that interact with an ethylene-responsive element. The Plant Cell 7:173−82

    doi: 10.1105/tpc.7.2.173

    CrossRef   Google Scholar

    [77]

    Li Z, Tian Y, Xu J, Fu X, Gao J, et al. 2018. A tomato ERF transcription factor, SlERF84, confers enhanced tolerance to drought and salt stress but negatively regulates immunity against Pseudomonas syringae pv. tomato DC3000. Plant Physiology and Biochemistry 132:683−95

    doi: 10.1016/j.plaphy.2018.08.022

    CrossRef   Google Scholar

    [78]

    Agarwal P, Agarwal PK, Joshi AJ, Sopory SK, Reddy MK. 2010. Overexpression of PgDREB2A transcription factor enhances abiotic stress tolerance and activates downstream stress-responsive genes. Molecular Biology Reports 37:1125

    doi: 10.1007/s11033-009-9885-8

    CrossRef   Google Scholar

    [79]

    Maqsood H, Munir F, Amir R, Gul A. 2022. Genome-wide identification, comprehensive characterization of transcription factors, cis-regulatory elements, protein homology, and protein interaction network of DREB gene family in Solanum lycopersicum. Frontiers in Plant Science 13:1031679

    doi: 10.3389/fpls.2022.1031679

    CrossRef   Google Scholar

    [80]

    Li J, Sima W, Ouyang B, Wang T, Ziaf K, et al. 2012. Tomato SlDREB gene restricts leaf expansion and internode elongation by downregulating key genes for gibberellin biosynthesis. Journal of Experimental Botany 63:6407−20

    doi: 10.1093/jxb/ers295

    CrossRef   Google Scholar

    [81]

    Zhao Y, Zheng Y, Jiang L, Niu Y, Yang Y, et al. 2022. Identification of stress-related characteristics of the WRKY gene family: a case study of Dendrobium catenatum. Ornamental Plant Research 2:21

    doi: 10.48130/OPR-2022-0021

    CrossRef   Google Scholar

    [82]

    Chen W, Zheng C, Yao M, Chen L. 2021. The tea plant CsWRKY26 promotes drought tolerance in transgenic Arabidopsis plants. Beverage Plant Research 1:3

    doi: 10.48130/BPR-2021-0003

    CrossRef   Google Scholar

    [83]

    Ahammed GJ, Li X, Mao Q, Wan H, Zhou G, et al. 2021. The SlWRKY81 transcription factor inhibits stomatal closure by attenuating nitric oxide accumulation in the guard cells of tomato under drought. Physiologia Plantarum 172:885−95

    doi: 10.1111/ppl.13243

    CrossRef   Google Scholar

    [84]

    Gao Z, Bao Y, Wang Z, Sun X, Zhao T, et al. 2022. Gene silencing of SLZF57 reduces drought stress tolerance in tomato. Plant Cell, Tissue and Organ Culture (PCTOC) 150:97−104

    doi: 10.1007/s11240-022-02247-y

    CrossRef   Google Scholar

    [85]

    Rai AC, Singh M, Shah K. 2013. Engineering drought tolerant tomato plants over-expressing BcZAT12 gene encoding a C2H2 zinc finger transcription factor. Phytochemistry 85:44−50

    doi: 10.1016/j.phytochem.2012.09.007

    CrossRef   Google Scholar

    [86]

    Shah K, Singh M, Rai AC. 2013. Effect of heat-shock induced oxidative stress is suppressed in BcZAT12 expressing drought tolerant tomato. Phytochemistry 95:109−17

    doi: 10.1016/j.phytochem.2013.07.026

    CrossRef   Google Scholar

    [87]

    Zhu M, Meng X, Cai J, Li G, Dong T, et al. 2018. Basic leucine zipper transcription factor SlbZIP1 mediates salt and drought stress tolerance in tomato. BMC Plant Biology 18:83

    doi: 10.1186/s12870-018-1299-0

    CrossRef   Google Scholar

    [88]

    Pan Y, Hu X, Li C, Xu X, Su C, et al. 2017. SlbZIP38, a tomato bZIP family gene downregulated by abscisic acid, is a negative regulator of drought and salt stress tolerance. Genes 8:402

    doi: 10.3390/genes8120402

    CrossRef   Google Scholar

    [89]

    Bao Y, Song W, Wang P, Yu X, Li B, et al. 2020. COST1 regulates autophagy to control plant drought tolerance. Proceedings of the National Academy of Sciences of the United States of America 117:7482−93

    doi: 10.1073/pnas.1918539117

    CrossRef   Google Scholar

    [90]

    Bao Y, Bassham DC. 2020. COST1 balances plant growth and stress tolerance via attenuation of autophagy. Autophagy 16:1157−58

    doi: 10.1080/15548627.2020.1752981

    CrossRef   Google Scholar

    [91]

    Christmann A, Grill E. 2018. Peptide signal alerts plants to drought. Nature 556:178−79

    doi: 10.1038/d41586-018-03872-4

    CrossRef   Google Scholar

    [92]

    Asano T, Hayashi N, Kikuchi S, Ohsugi R. 2012. CDPK-mediated abiotic stress signaling. Plant Signaling & Behavior 7:817−21

    doi: 10.4161/psb.20351

    CrossRef   Google Scholar

    [93]

    Bi Z, Wang Y, Li P, Sun C, Qin T, et al. 2021. Evolution and expression analysis of CDPK genes under drought stress in two varieties of potato. Biotechnology Letters 43:511−21

    doi: 10.1007/s10529-020-03037-2

    CrossRef   Google Scholar

    [94]

    Dekomah SD, Wang Y, Qin T, Xu D, Sun C, et al. 2022. Identification and expression analysis of Calcium-dependent protein kinases gene family in potato under drought stress. Frontiers in Genetics 13:874397

    doi: 10.3389/fgene.2022.874397

    CrossRef   Google Scholar

    [95]

    Candar-Cakir B, Arican E, Zhang B. 2016. Small RNA and degradome deep sequencing reveals drought-and tissue-specific micrornas and their important roles in drought-sensitive and drought-tolerant tomato genotypes. Plant Biotechnology Journal 14:1727−46

    doi: 10.1111/pbi.12533

    CrossRef   Google Scholar

    [96]

    Li Q, Shen H, Yuan S, Dai X, Yang C. 2022. miRNAs and lncRNAs in tomato: roles in biotic and abiotic stress responses. Frontiers in Plant Science 13:1094459

    doi: 10.3389/fpls.2022.1094459

    CrossRef   Google Scholar

    [97]

    Chen L, Meng J, Luan Y. 2019. miR1916 plays a role as a negative regulator in drought stress resistance in tomato and tobacco. Biochemical and Biophysical Research Communications 508:597−602

    doi: 10.1016/j.bbrc.2018.11.165

    CrossRef   Google Scholar

    [98]

    Zhang X, Zou Z, Gong P, Zhang J, Ziaf K, et al. 2011. Over-expression of microRNA169 confers enhanced drought tolerance to tomato. Biotechnology Letters 33:403−9

    doi: 10.1007/s10529-010-0436-0

    CrossRef   Google Scholar

    [99]

    Li N, Wang Y, Zheng R, Song X. 2022. Research progress on biological functions of lncRNAs in major vegetable crops. Vegetable Research 2:14

    doi: 10.48130/VR-2022-0014

    CrossRef   Google Scholar

    [100]

    Chong L, Zhu Y. 2022. Mass spectrometry-based proteomics for abiotic stress studies. Trends in Plant Science 27:729−30

    doi: 10.1016/j.tplants.2021.12.013

    CrossRef   Google Scholar

  • Cite this article

    Xie G, Xu R, Chong L, Zhu Y. 2024. Understanding drought stress response mechanisms in tomato. Vegetable Research 4: e001 doi: 10.48130/vegres-0023-0033
    Xie G, Xu R, Chong L, Zhu Y. 2024. Understanding drought stress response mechanisms in tomato. Vegetable Research 4: e001 doi: 10.48130/vegres-0023-0033

Figures(1)

Article Metrics

Article views(5750) PDF downloads(1479)

Other Articles By Authors

REVIEW   Open Access    

Understanding drought stress response mechanisms in tomato

Vegetable Research  4 Article number: e001  (2024)  |  Cite this article

Abstract: Tomato (Solanum lycopersicum) is significantly affected by drought. An excessive amount of reactive oxidative species (ROS) is generated in tomato under drought stress, causing devastating effects on tomato growth and yield. Drought stress response and adaptation in plants are complex and their regulatory gene networks are being investigated to improve our understanding. The signaling molecule, ABA (abscisic acid), is one of the key players in drought stress response. Plants synthesize and accumulate ABA because ABA can act on membrane transporters, protein kinases, transcription factors, and other hormonal signaling pathways to elicit appropriate stress response. In this review, we will discuss our current knowledge of how tomato plants perform drought stress response. Moreover, we will offer future directions that can extend our understanding of tomato's adaptation and tolerance to drought stress.

    • Drought is one of the major abiotic stresses that limits plant growth, development and yield worldwide. Climate change and soil aridification are predicted to reduce soil moisture content and affect crop growth significantly[1]. Therefore, attaining a better understanding of the molecular mechanisms that underlie plant's drought response is needed to develop drought mitigation strategies.

      Tomato (Solanum lycopersicum) is a valuable fruit and vegetable crop with profound economic and nutritional values. International trade in tomato products has increased over the years, making tomato production an essential component of global agriculture[2,3]. Drought stress severely affects tomato yield and this has negative impacts for both the tomato industry and agricultural economy. Currently, ABA (abscisic acid) is known to play a crucial role in regulating plant's drought response through acting on a number of protein kinases, transcription factors (TFs), various hormonal signaling pathways, and membrane/channel proteins. In this review, we will highlight the most recent information of how these components contribute to the molecular mechanisms underlying tomato's responses to drought.

    • In the presence of low water availability, osmotic stress can occur. Within seconds of osmotic shock, plants increase their cellular concentration of free calcium ions ( [Ca2+]cyt )[46]. It is reported that plants modulate [Ca2+]cyt via OSCA1 (REDUCED HYPEROSMOLALITY-INDUCED CA2+ INCREASE 1)[7,8]. Plants can also utilize AQPs (aquaporins) to regulate the transport of water, small neutral solutes, and CO2 between plasma membranes[912] . In tomato, plasma membrane intrinsic proteins SlPIP2.1, SlPIP2.5 and SlPIP2.7 were found as candidate AQPs for contributing root water uptake since they can increase water content and maintain osmotic balance[13].

      Plants can mediate intracellular signals and gene expression in response to drought via two different ABA signaling pathways: ABA-dependent and ABA-independent pathways[4,14]. ABA-dependent pathways are more common in plant responses to drought stress. Osmotic stress is also known to induce ABA synthesis[15]. As an endogenous messenger for biotic and abiotic stresses, ABA acts as a long-distance water stress signal for monitoring early signs of drought[16]. In fact, ABA plays a crucial role in plant response to drought because it triggers protective mechanisms such as regulating stomatal closure and gene expression to prevent further water loss. The molecular mechanisms underlying the responses of plants to drought involve a series of actions. Multiple processes starting from elaborate sensing, signaling, transcription, transcript processing, translation to post-translational protein modifications all contribute to plant's drought response. The ABA signaling pathway is by far the most well recognized stress response mechanisms utilized by plants to regulate abiotic stress.

      The ABA-dependent signaling pathway is composed of ABA receptors PYR/PYL/RCAR, co-receptors PP2Cs, SnRK2 kinase and TF ABI5/ABFs[17]. Under normal conditions, PP2C binds to SnRK2, thereby inhibiting the ABA signaling pathway. When plant roots detect water deficiency, drought signal is transmitted to the stem, leading to the accumulation of ABA throughout the plant[18]. The ABA receptor PYR/PYL/RCAR recognizes and binds to ABA, which causes the release of the phosphorylation site of SnRK2 from PP2C. This in turn allows SnRK2 to phosphorylate downstream proteins, such as the cis-acting element, ABA-responsive element (ABRE), and ABRE-binding protein/ABRE-binding factors (AREB/ABF) TFs[1921].

      In the ABA-independent pathway, a cis-element, dehydration-responsive element/C-repeat (DRE/CRT) and DRE-/CRT-binding protein 2 (DREB2) TFs contribute pivotal roles in response to drought and osmotic stress[22]. DREB2 proteins are AP2/ERF family members in plants. Arabidopsis DREB2A and DREB2B were found to be highly inducible by drought, high salinity, and heat stress[23,24]. In fact, it is the key TF for osmotic stress response in the ABA-independent pathway. Under normal conditions, DREB2A is repressed by GROWTH-REGULATING FACTOR7 (GRF7) to maintain plant growth. DREB2A-INTERACTING PROTEINs (DRIP1 and DRIP2), which are ubiquitin E3 ligases, target DREB2A to 26S proteasome for proteolysis under normal conditions. DREB2A protein is known to be instable in plants and once it is activated, it can induce a myriad of genes that encode proteins responsible for stress response and tolerance. Some of these genes encode the LEA (late embryogenesis abundant) proteins, which are thought to protect enzymes and lipids from drought-induced dehydration[25].

      Since GRF7 was discovered to repress DREB2A, ABA-inducible genes, and osmotic stress-inducible genes, crosstalk was suggested to occur between ABA-independent and dependent signaling pathways. Furthermore, AREB/ABFs in the ABA-dependent pathway have been shown to interact with DREBs to regulate drought stress response, highlighting both ABA-independent and dependent pathways are involved in mediating plant's response to drought[26,27]. Most of what we know about how plants respond to drought via the ABA-independent pathway and crosstalk of the two signaling pathways came from Arabidopsis studies. This information remains to be explored in tomato, and crosstalk is suspected to occur between the two signaling pathways in tomato.

    • Protein kinases are a class of enzymes that catalyzes protein phosphorylation. Protein kinases that are involved in drought stress response include SNF1-related protein kinase 2 (SnRK2), mitogen-activated protein kinase (MAPK), and histidine kinase (HK). SnRK2.6, also known as OST1, is a SnRK2 family member that has been reported to play a major role in plant's response to drought[28,29]. SnRK2.6 can phosphorylate several ion channel proteins of SLAC1 (SLOW ANION CHANNEL ASSOCIATED 1), QUAC1 (the R-/QUAC-type anion channel), and KAT1 (POTASSIUM CHANNEL IN ARABIDOPSIS THALIANA 1) under drought stress to positively regulate ABA/drought-induced stomatal closure[30]. In addition, SnRK2.6 can phosphorylate several TFs including ABF2 (ABSCISIC ACID RESPONSIVE ELEMENT BINDING FACTOR 2) and ABI5 (The PP2C ABA INSENSITIVE 5) to regulate drought responses at the transcriptional level[19,28]. In tomato, SnRK2.6 can modulate the balance between plant growth and development under drought. In fact, tomato SnRK2.6 can enhance the protein stability of NAC (NAM (No Apical Meristem), ATAF1 (Arabidopsis thaliana Activation Factor 1), and CUC2 (Cup-shaped Cotyledon)-type TF SlVOZ1 (VASCULAR PLANT ONE-ZINC-FINGER) through phosphorylation, thereby regulating the expression of flowering gene SFT (SINGLE FLOWER TRUSS) and promoting drought-induced flowering[31]. Arabidopsis SnRK2s can phosphorylate sucrose transporters SWEET11 and 12 to enhance their oligomerization and sucrose transport activity under drought conditions, which help to increase the root's sucrose content and plant root-to-shoot ratio[32].

      The MAP kinase cascade also contributes to plant's drought response through the phosphorylation of MAPKKK, which can be activated by lipid membrane receptors or extracellular stimuli. Activated MAPKKK promotes the phosphorylation of MAPKK, which subsequently activates MPK through dual phosphorylation[33]. The MAPK cascade is a highly conserved signal transduction pathway in plants. In tomato and multiple plant species, the transcription, protein accumulation, and kinase activity of MAPK signaling components are regulated by drought and ABA signals[34]. In Arabidopsis, the E3 ubiquitin ligases RGLG1 (RING DOMAIN LIGASE 1) and RGLG2 (RING DOMAIN LIGASE 2) ubiquitinate MAPKKK18 at lysine residues K32 and K154, thus promoting MAPKKK18 degradation. The absence of these two ubiquitin ligases stabilizes MAPKKK18 and enhances the drought tolerance of MAPKKK18-OE lines[35]. Water deficit or ABA treatment rapidly up-regulate MAPKKK levels in plants and inhibit the expression of RGLG1 and RGLG2, leading to the accumulation of MAPKK18, thereby increasing plant resistance to drought stress[36]. SlMAPK1 overexpression enhanced the relative expression of a series of genes associated with antioxidant enzyme activities, such as SlAPX (ascorbate peroxidase), SlCAT (catalase), SlPOD (peroxidase), and SlGST (glutathione S-transferase zeta class-like isoform X1). These changes led to lower ROS accumulation in SlMAPK1-OE lines than in the WT plants. Tomato plants overexpressing SlMAPK1 showed less H2O2 and ROS accumulation and exhibited higher antioxidant enzyme activity under drought stress[37,38].

      HKs serve diverse functions in plant development and responses to environmental stress. They are particularly known as osmotic stress sensors in plants. In Arabidopsis, AHK2, AHK3, and AHK4 negatively regulate ABA sensitivity and drought response, while AHK1 positively regulates drought response through the activation of ABA-responsive gene expression, ultimately enhancing plant drought tolerance[39,40]. In tomato, SlHK2 has been shown to specifically respond to drought. Inhibition of the cytokinin signaling pathway in SlHK2-RNAi plants resulted in increased tolerance to drought and high-temperature stress[41].

    • Drought stress induces an excessive amount of reactive oxygen species (ROS), which lead to severe cellular damage, leaf wilting and declined photosynthetic efficiency in plants[42]. Despite the negative effects that ROS can cause to plants, increasing evidence is suggesting that ROS accumulation is an adaptive response of plants under stress situations. If they are balanced properly, ROS can act as stress-responsive substance and plants can circumvent some of the serious defects caused by ROS such as programmed cell death. The hormone of ABA is associated with ROS because ABA can engage with the plant's non-enzymatic scavenging system to eliminate ROS. ABA can also integrate with Ca2+ (calcium) signaling to transmit stress signals to intracellular sensor proteins and initiate downstream stress responses. Since Ca2+ is a versatile second messenger, ABA can further trigger Ca2+ signals and act on Ca2+ channels to induce stomatal pore closure in response to drought.

      ABA can further help plants survive drought through acting on the PYR/PYL/RCAR receptors, which are responsible for inducing downstream TFs such as AREB/ABFs via a cascade of kinase reactions[18,4346]. Thus far, PYL9 has been reported to participate the most in drought resistance. ABRE is a conserved cis-acting regulatory element in the promoter of stress-induced genes and AREB/ABF proteins can bind to the ABRE element in the promoter region of stress responsive genes and regulate gene expression under stress[4749]. In plants, overexpression of the AREB1/ABF2, AREB2/ABF4, and ABF3 genes can enhance plant's drought resistance[4,43,5053].

      In addition to ABA, phytohormones such as brassinosteroids (BRs), jasmonic acid (JA), and ethylene (ETH) have also been reported to be involved in plant's response to drought. In particular, BRs have been documented to positively regulate drought resistance in tomato[54]. Exogenous BRs can improve drought tolerance through increasing leaf water potential and water absorption capacity. BRs can also reduce transpiration rate and maintain metabolic responses. Moreover, BRs increase the activities of POD, CAT, ABA and carotenoids to eliminate ROS, stabilizing cell membrane and alleviate stress damage[55,56]. In Arabidopsis, BR regulates early ABA signaling mainly by affecting the phosphorylation of SnRK2.2, SnRK2.3, and SnRK2.6[51,57]. However, ABA accumulates in plants and antagonizes BR regulators under unfavorable conditions such as drought[28,58,59]. In tomato, high level of SlBRI1 negatively influences tomato's drought tolerance. High expression of SlBRI1 leads to increased BR signaling, which not only augments H2O2 content but also reduces stomatal closure, antioxidant enzyme activity, and the expression of drought stress-related genes[60].

      Like BR, JA also coordinates with ABA to synergistically activate drought stress responses to regulate stomatal closure, extracellular Ca2+ influx, H2O2, and NO signaling. The crosstalk between JA and ABA signaling pathways can induce the transcriptional activation of the basic-helix-loop-helix (bHLH) TF MYC2 (MYELOCYTOMATOSIS2). MYC2 has been reported to serve as a master regulator of the JA signaling pathway in Arabidopsis. MYC2 in tomato was shown to negatively regulate PP2C1 of the ABA signaling and RR26, a type-B response regulator in the cytokinin pathway that was shown to decrease drought tolerance in tomato[60,61]. ETH is another hormone that links with ABA, JA, BR, auxin, GA (gibberellic acid), SA (salicylic acid) and CK (cytokinin) to help plants mediate the negative effects of abiotic stress on plant growth and development. ETH has the ability to induce defense and survival mechanisms in response to abiotic stress such as drought, thereby influencing plant growth and structure maintenance under drought conditions[62,63]. The involvement of ETH receptors in drought stress response are complex. ERF (ethylene response factors) are AP2/ERF (APETALA2/ethylene-responsive factor) superfamily proteins and they are the largest family of TFs reported to participate in various abiotic stresses including drought. In tomato, SlERF5 gene can be induced by various abiotic stresses. Transgenic tomatoes overexpressing ERF5 showed resistance to drought and salt stresses[64].

      It is evident that phytohormones play essential roles in plant's tolerance to drought. Their intricate network of crosstalk leads to transcriptional reprogramming in plants and phytohormone crosstalk in drought stress response will be briefly discussed next. Drought stress inhibits both salicylic acid (SA) and GA biosynthesis to help plants conserve energy for growth. Lower amount of circulating SA in plants leads to higher ABA production, thus increasing the chances for ABA to synergize with other phytohormones to induce drought stress response. Like ABA, phytohormones of JA, BR, and auxins are also increased under drought conditions. While BR signaling can suppress JA production, it helps plants to respond to drought via promoting ABA and auxin biosynthesis. ABA and auxin can then coordinately regulate stomatal aperture. ABA also cooperates with ETH and SA to inhibit CK production, thereby mediating plant's drought tolerance mechanism[4,65].

    • TFs are proteins that bind to specific DNA motifs in the promoter regions of target genes to regulate their transcription. TFs possess multifunctional roles in signal transduction networks ranging from stress signal sensing to expressing stress-responsive genes. Often times, stress mechanisms such as drought are complex and multiple TFs are involved to mediate numerous pathways simultaneously in plants. Thus far, more than 80 TF families have been isolated from a wide range of crops[66]. TFs that have been reported to regulate plant drought resistance include the NAC (NAM, ATAF1/2, CUC1/2), MYB (v-myb avian myeloblastosis viral oncogene homolog), WRKY (WRKY-type TF), AP2/ERF, ZFP (zinc-finger protein), and bZIP (basic region/leucine zipper). We will next provide a brief description of their roles and functions in drought stress response.

    • To date, a number of NACs has been shown to regulate plant's drought response. In Arabidopsis, ANAC096 encodes a key NAC TF in the ABA-independent signaling pathway and it has been shown to interact directly with ABF2 and ABF4 to regulate gene expression under drought stress[67]. In transgenic tomato plants, the silent expression of SlNAC4 was found to reduce their water and chlorophyll content, while accelerated their desiccation under drought stress[68]. In SlNAC6-RNAi seedlings subjected to drought, the ABA content and expression level of the genes in the ABA signaling pathway were reduced. These seedlings also exhibited signs of lower tolerance to PEG-stimulated osmotic stress, and increased water loss and oxidative damage[69]. Additionally, JUNGBRUNNE1 (JUB1) in the NAC family was identified as a regulator of tomato drought tolerance. Silencing SlJUB1 caused an excessive accumulation of H2O2 in tomato plants, leading to oxidative damage and more water loss under water-limiting conditions, thereby negatively affecting tomato's drought tolerance and expression of drought-responsive genes SlDREB1, SlDREB2, and SlDELLA[42]. In tomato, JUB1 was demonstrated to directly activate the expression of DREB2A, and inhibit intracellular H2O2 accumulation by directly activating DELLA for protein accumulation[70]. The reduction of H2O2 levels in tomato was dependent on the activation of SlDREB1, SlDREB2 and SlDELLA by SlJUB1[42].

    • As one of the largest TF families in plants, MYB plays an important role in plant's responses to various biotic and abiotic stresses. The MYB TF family is divided into four subclasses by the number of N-terminal structures: 1R-MYB/MYB-related, R2R3-MYB, 3R-MYB/R1R2R3-MYB, and 4R-MYB-containing, which consists of 1, 2, 3, and 4 repeat sub-structures, respectively. Among them, the R2R3-MYB proteins are the most widely distributed class of MYB TFs in plants. They have been reported to participate the most in abiotic stress regulation. These proteins can regulate secondary metabolite biosynthesis, hormone signaling, and stress responses[71]. In tomato, the overexpression of SlMYB49 was shown to enhance the plant's drought tolerance via eliminating ROS, inhibiting cell membrane damage, and suppressing cell death[72]. Silencing SlMYB50 in tomato could significantly reduce the levels of O2 and H2O2 accumulation as well as increase the activation of genes related to chloroplast development, flavonoid and ABA biosynthesis to cope with osmotic stress[73]. Evidently, flavonoid content regulated by SlMYB55 can help with tomato's drought resistance[74].

    • The AP2/ERF TFs have the ability to mediate biological and physiological roles such as stress responsive mechanisms, hormone signal transduction, plant morphogenesis, and metabolite regulation. They are classified into four subfamilies: DREB, AP2, ERF, RAV (Related to ABI3/VP), and Soloists[75]. DREBs and ERFs are reported mostly in the involvement of stress responsive mechanisms. Originally discovered in tobacco, ERFs could bind to the ETH response element GCC box and affect ETH signal transduction[76]. The roles of ERF TFs have been expanded to stress protective mechanism and responses in other plants. In Arabidopsis, AtERF84 overexpression can enhance the plant's ROS scavenging ability and improve drought and salt stress tolerance[77] while the overexpression of SlERF5 in tomato can trigger similar stress protective mechanisms[64]. DREB TFs are highly inducible by abiotic stresses. DREB1 TF was shown to function under low-temperature stress while DREB2 functions in response to dehydration[78]. A majority of DREBs in tomato seedlings was found upregulated under drought stress, indicating DREBs can serve as potential targets for developing drought resistant crops[79,80].

    • The WRKY gene family is a class of plant-specific TFs. Various WRKY family members have been identified from horticultural plants and they were mainly found to be involved in plant responses to biotic and abiotic stresses[81,82]. Tomato WRKY81 can inhibit the transcription of NR (nitrate reductase) and NR expression in tomato leaves. NO accumulation was inhibited in guard cells due to NR suppression, thereby attenuating stomatal closure and drought tolerance[83].

    • Zinc finger proteins (ZFPs) have finger-like structure that can bind to Zn2+. They are characterized into nine subfamilies by their conserved Cys and His motifs. The subfamily of C2H2-type ZFPs are investigated for their roles and functions in abiotic stress responses. SLZF57-silenced tomato plants accumulated more ROS, and the ability of plants to scavenge free radicals and hydrogen peroxide was reduced[84]. ZAT12 is a stress responsive C2H2-type ZFP reported to mediate several stress-activated genes through ROS signaling[85]. In one study, ZAT12 was transferred from Chinese cabbage to tomato and BcZAT12 overexpression in transformed tomato showed stronger membrane integrity, higher water retention and lower H2O2 levels than control plants[85,86]. ZFP proteins can help plants such as tomato to mitigate drought stress and tomato ZFPs such as SlZAT12 should be investigated further as it could be a target for improving tomato's drought tolerance.

    • Many bZIP TFs serve various essential roles in the ABA signaling pathway and abiotic stress response. They also regulate genes related to seed maturation, light, pathogen defense, and flower development. In tomato, SlbZIP1 was found to regulate salt and drought stress tolerance. Silencing of SlbZIP1 decreased the expression of genes involved in ABA biosynthesis and signal transduction. The transcription levels of various abiotic and biotic stress-related genes were downregulated in SlbZIP1-RNAi, suggesting SlbZIP1 can mediate abiotic stress tolerance[87]. In contrast, SlbZIP38 was reported to have opposite functions of SlbZIP1. SlbZIP38 inhibits tomato's drought and salt resistance through regulating the ABA signaling pathway[88].

    • In response to drought, plants can activate their response mechanisms ranging from mediating morphological/structural changes, osmosis regulatory components, and hormone synthesis. These processes are complex and many elements are required to drive drought stress response in plants. The predominant phytohormone involved in the drought stress response is ABA. ABA accumulates during water deficient conditions[16]. Increasing evidence suggests extensive crosstalk presents among ABA and other phytohormones that can regulate plant's drought tolerance. The synergism and functional interaction between ABA and other phytohormones during drought lead to transcriptional reprogramming and downstream responses that help plants cope with stress (Fig. 1). Thus far, we observed that the molecular mechanism underlying tomato's drought response shares some similarities with Arabidopsis and other plants. However, there are other potential routes that tomato can take to trigger drought response and enhance its drought tolerance.
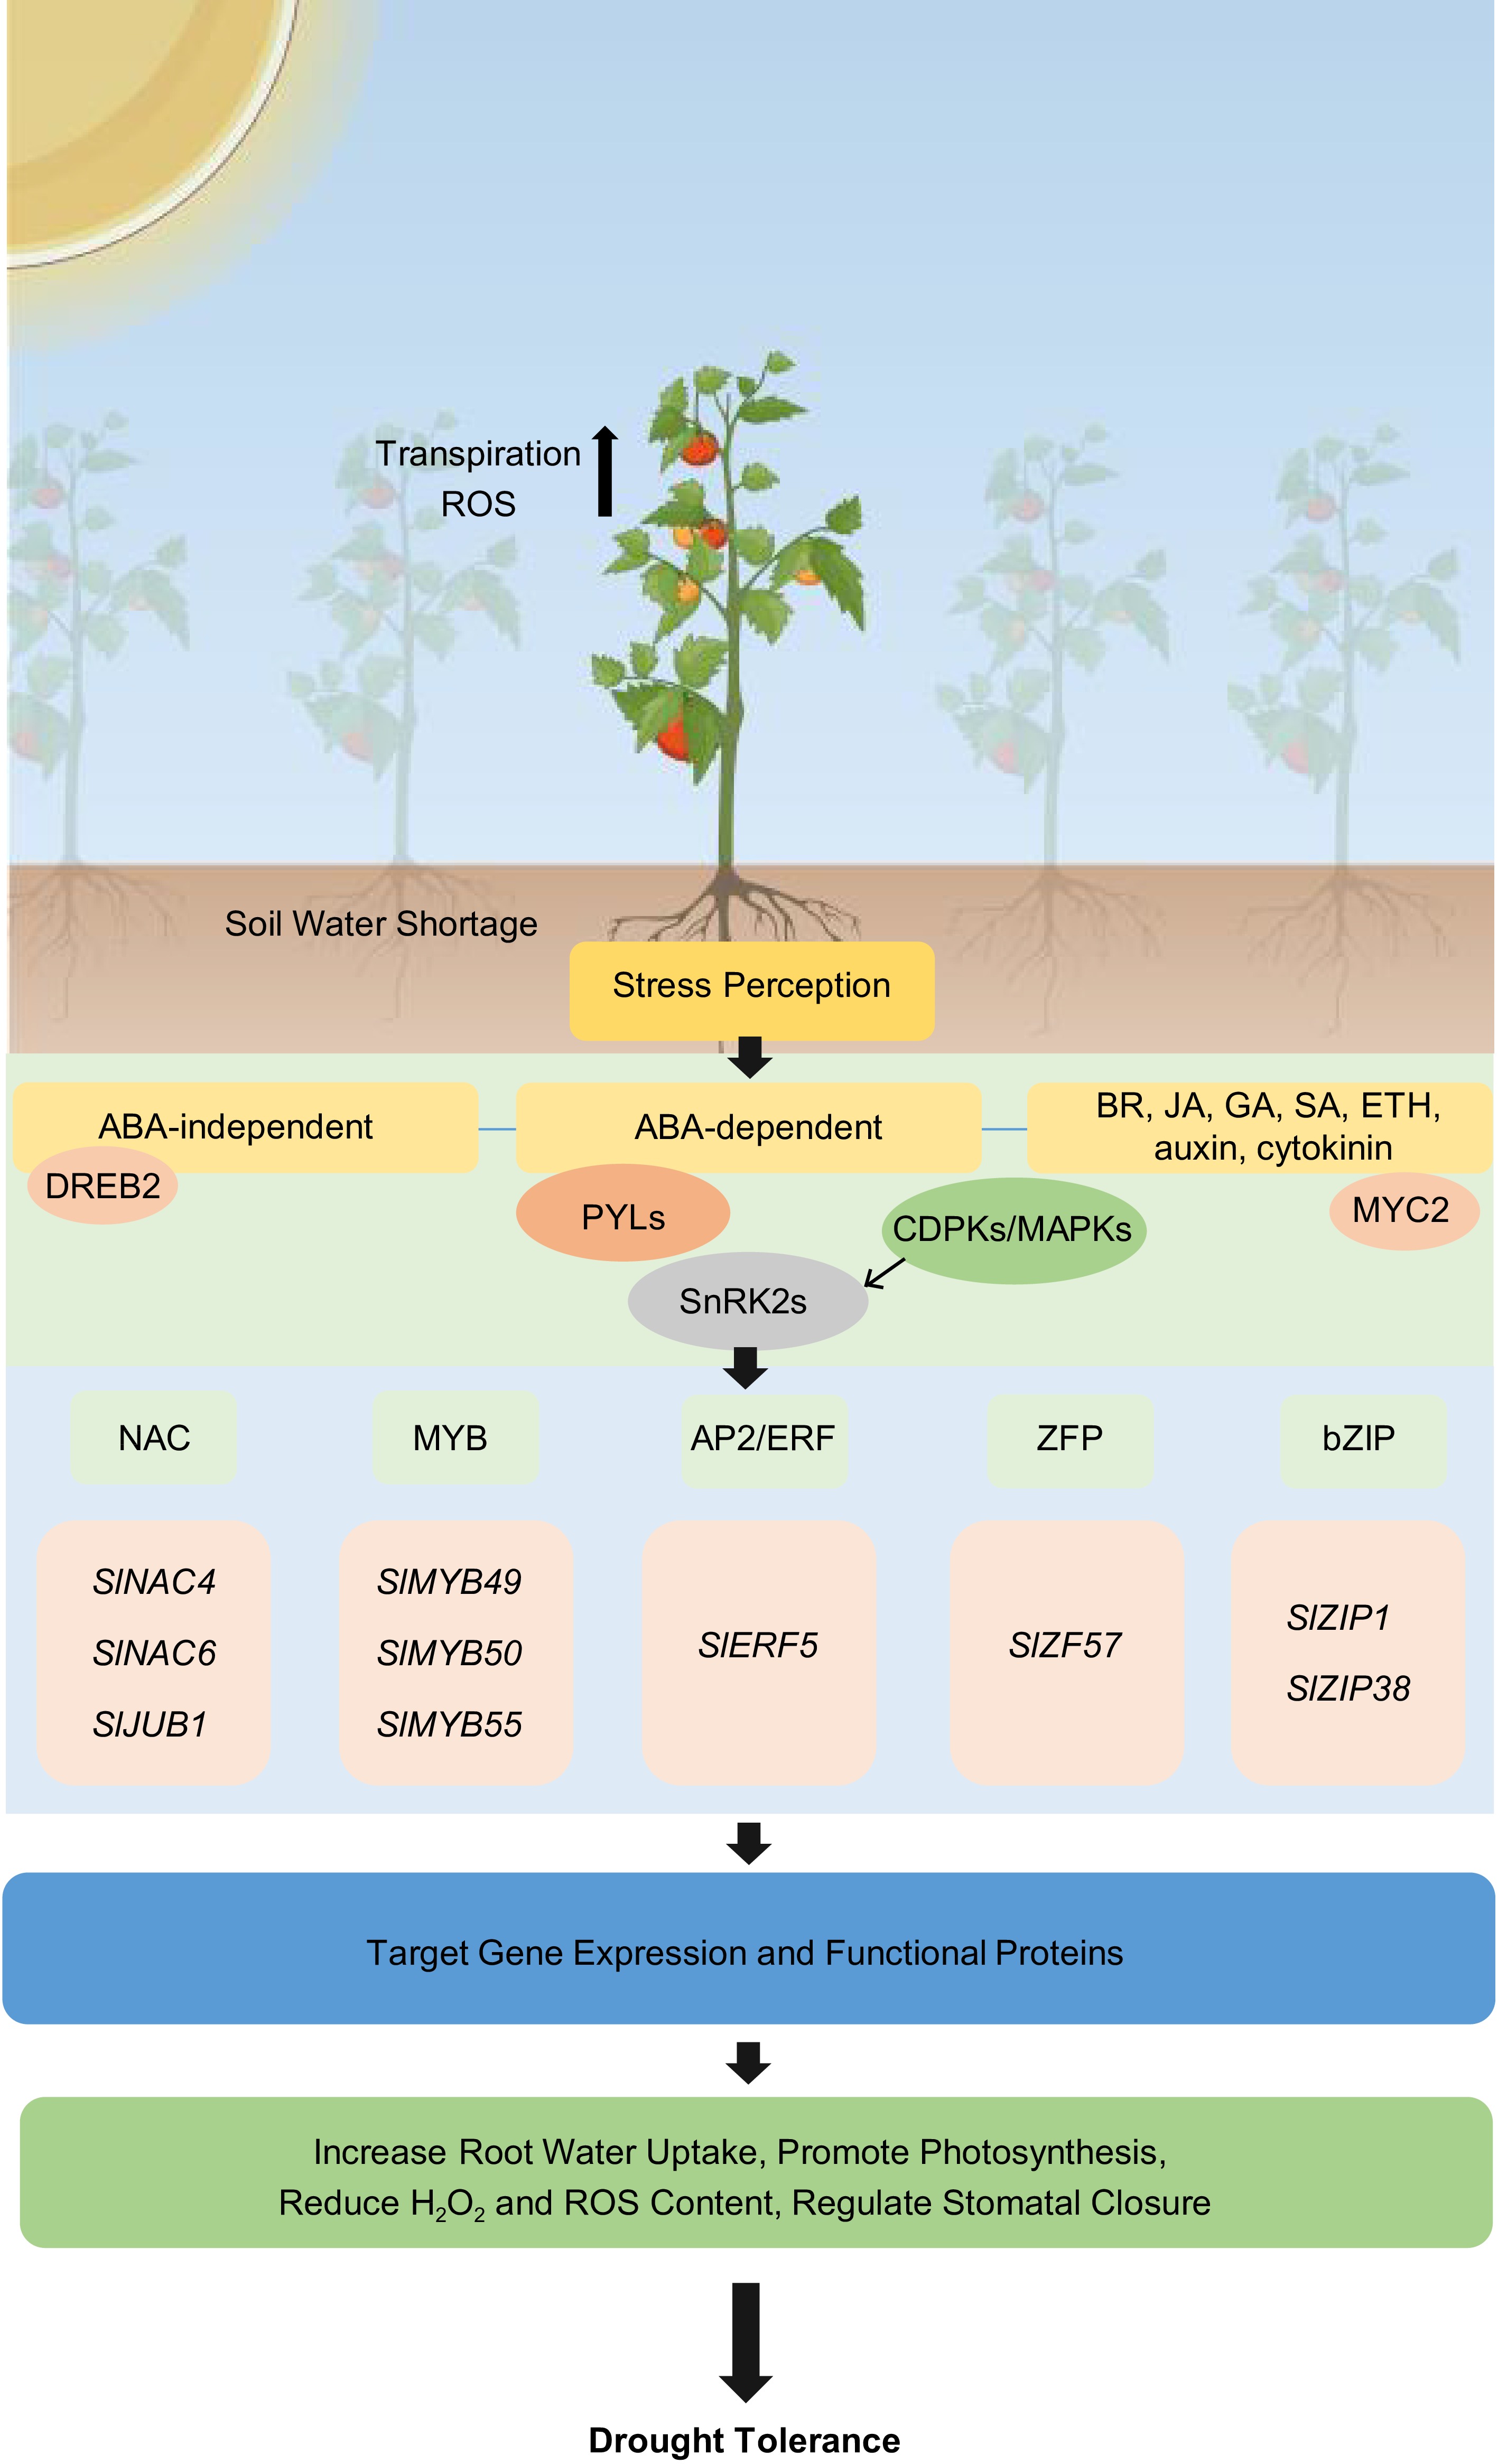
      Figure 1. 

      Drought stress signals, signal transduction pathways including ABA-independent, ABA-dependent, and phytohormone crosstalk play a major role in regulating drought stress response mechanisms in tomato. These pathways involve the modulation of protein kinases, transcription factors, ion channels, aquaporins, and oxidative species to help tomato plants survive under drought conditions.

      In Arabidopsis, COST1 (constitutively stressed 1) was found to negatively regulate drought resistance through affecting the autophagy pathway. Similar to SnRK2.6/OST1, COST1 can balance between growth and stress responses in plants, revealing a potential target for improving tomato's drought resistance[89,90]. In addition to COST, other gene members of Arabidopsis such as CLE peptides can be investigated for their functions in tomato's drought tolerance. Arabidopsis CLEs have been found to play a role between water deficiency and ABA synthesis[18,91]. In response to dehydration stress, the expression of AtCLE25 was found in vascular tissues and augmented in roots to form polypeptides. AtCLE25 gene can further induce AtNCED3 (NINE-CIS-EPOXYCAROTENOID DIOXYGENASE 3), an enzyme needed for ABA biosynthesis during drought[18].

      The functions of CDPK (calcium-dependent protein kinases) in tomato's drought tolerance should be explored in-depth. CDPK is a crucial calcium sensor that conveys calcium signals into physiological changes. Once ABA synthesis is activated in response to drought, CDPK can phosphorylate various substrates including AQPs, ion channels, metabolic enzymes and TFs to maintain intracellular water balance[6,92]. Whole genome sequence analysis and mRNA expression data from a variety of potatoes revealed that StCDPK21/22 and StCDPK3 can regulate MDA (malondialdehyde) and proline content under drought stress[93,94]. However, the exact role of CDPKs in tomatoes has not been investigated.

      Moreover, studies have shown that miRNAs, lncRNAs (long non-coding RNAs) and phytohormones are integrated to regulate environmental stress in plants such as tomato[9599]. This is still a relatively new area and requires more studies for validation. Plant's drought resistance is complex and regulated by multiple genes, application of '-omics' approaches such as transcriptomics, proteomics, epigenomics, interactomics, metabolomics and phenomics remain essential for a thorough understanding of the regulatory and signaling networks involved in drought stress response in tomato[100].

    • The authors confirm contribution to the paper as follows: study conception and design: Zhu Y, Chong L; data collection: Xie G, Xu R; draft manuscript preparation: Xie G, Xu R, Chong L, Zhu Y. All authors reviewed the results and approved the final version of the manuscript.

    • All data generated or analyzed during this study are included in this published article.

      • This work was supported by the National Natural Science Foundation of China (NSFC 32350610245, 32150410345, 32070307 and 32270308), and Scientific and Technological Innovation Talents in Colleges and Universities in Henan, China (23HASTIT036).

      • The authors declare that they have no conflict of interest. Yingfang Zhu is the Editorial Board member of Vegetable Research who was blinded from reviewing or making decisions on the manuscript. The article was subject to the journal's standard procedures, with peer-review handled independently of this Editorial Board member and the research groups.

      • Copyright: © 2024 by the author(s). Published by Maximum Academic Press, Fayetteville, GA. This article is an open access article distributed under Creative Commons Attribution License (CC BY 4.0), visit https://creativecommons.org/licenses/by/4.0/.
    Figure (1)  References (100)
  • About this article
    Cite this article
    Xie G, Xu R, Chong L, Zhu Y. 2024. Understanding drought stress response mechanisms in tomato. Vegetable Research 4: e001 doi: 10.48130/vegres-0023-0033
    Xie G, Xu R, Chong L, Zhu Y. 2024. Understanding drought stress response mechanisms in tomato. Vegetable Research 4: e001 doi: 10.48130/vegres-0023-0033

Catalog

  • About this article

/

DownLoad:  Full-Size Img  PowerPoint
Return
Return