


-
Non-heading Chinese cabbage (Brassica rapa ssp. chinensis; NHCC) is a popular leafy vegetable in China and widely cultivated in the middle and lower reaches of the Yangtze River. Leaves are the predominant edible organ of NHCC. NHCC has abundant germplasm resources and can be divided into six variants according to the genome, displaying various leaf morphologies[1]. Leaves can be divided into two parts: the photosynthetic blade (lamina) and the structurally specialized petiole. Petioles can provide mechanical support and transfer water and nutrients from stem to leaves, processes critical for blade morphogenesis and photosynthetic efficiency[2]. Blades have traditionally dominated varietal selection criteria in breeding programs. Conventional breeding strategies have primarily focused on reducing petiole specific gravity while expanding blade area, resulting in cultivars characterized by short, narrow, and thin petioles to maximize photosynthetic efficiency and foliar yield. Notably, petioles have emerged as versatile raw materials for value-added processing, including industrial-scale production of pickled foods, dehydrated products, and plant-based meat analogues, which result in breeding objectives toward developing longer, wider, and thicker petioles to meet processing industry requirements. Furthermore, petiole morphology constitutes a critical appearance quality trait for NHCC. Cultivar diversification through the development of shape-variable petioles (e.g., flattened, grooved, or cylindrical geometries) could cater to heterogeneous consumer aesthetics while optimizing processing adaptability.
Petiole shape is determined by petiole length (PL), petiole width (PW), and petiole thickness (PT), which is controlled by cell elongation and cell division[3]. Previous studies reported that genetics, light, and phytohormones played crucial roles in the development of petiole. Light contributes to petiole elongation, while phytochrome regulation performs core roles in regulating petiole elongation during a seeding stage in many species[4]. The development of leaf petioles in Arabidopsis is regulated by a phytochrome-mediated mechanism. The phy b mutants in Arabidopsis show longer petiole[5]. Low light intensity can induce plants to extend the petiole and shade avoidance for adoptive growth. Photoperiod also plays a role in regulating petiole elongation. Under the short day length (SD), the petiole exhibits shorter cell length and fewer cells[6]. After the emergence of the petiole, the petiole cell elongation is affected by photoperiod, whereas the cell number in the petiole is independent[6]. Moreover, light can also activate brassinosteroid (BR) biosynthesis to promote petiole development[7]. Far-red light can induce auxin and gibberellin accumulation and function in petiole growth[8]. However, only a limited genetic model and a few genes associated with PL, PW, and PT were revealed in previous studies.
In soybeans, short petiole length is controlled by single recessive genes[9]. In Arabidopsis, the inheritance analysis revealed that phyB, GAI, GA1, and ROT3 function in cell elongation and proliferation in petioles[10−12]. In spinach, the BC1 population is adapted to QTL mapping, and three QTLs controlling petiole length were obtained[13]. In broccoli, a total of 23 QTL for PL is identified using a DH population. Five QTLs showed a positive additive effect and contributed to 3.93%-20.02% of the trait[14]. The inheritance of petiole characteristics in Brassica rapa was revealed in 1986[15]. The study illustrated that PL and PT were controlled by a small number of genes, and the dominant genes showed important effects[15]. In Brassica rapa, a total of four QTLs related to petiole are identified by a DH population[13]. Li et al. revealed three QTLs related to PL on A01 and A03 chromosomes using an F2 population[16]. Our previous study also revealed PL, PW, and PT were controlled by multiple genes. A total of four QTLs for PL, two QTLs for PW, and three QTLs for petiole shape were explored using an RIL population, developed by Suzhouqing & Maertou[17]. However, different populations developed from different parental lines may lead to different QTLs for the same phenotypes. Obtaining comprehensive QTL can contribute to identifying more key genes, clarifying the molecular regulatory network, and developing effective and widely applicable molecular markers for breeding.
In this study, Wutacai and Erqing, which showed significant differences in petiole shape, were adopted to identify the QTL for petiole. PL, PW, and PT were used to characterize petioles' shape. Phenotypic data was collected from three locations to perform genetic analysis and calculate broad sense heritability by constructing a mixed linear model. To obtain comprehensive and accurate QTL, BLUPs and all of the phenotypic data were utilized for QTL mapping using the MQM method. Co-localized QTL between PL, PW, and PT were annotated, and possible candidate genes were screened. The study provides a genetic basis to reveal the genetic mechanisms and develop valuable and effective molecular markers for petiole shape in NHCC.
-
Wutacai as the female parent and Erqing as the male parent were adopted to construct an F7:8 recombinant inbred lines (RIL) population comprising 127 lines. Wutacai produced slimmer, narrow, and thin petioles, and Erqing exhibited dumpy, wide, and thick petioles. Parental lines, F1 hybrid, and RIL population were planted at the Baima Research Station (BRS, 31°35' N and 119°09' E) of Nanjing Agricultural University in Jiangsu Province, Jurong Experimental Station (JES, 31°956' N and 119°16' E) of Nanjing Agricultural University in Jiangsu Province, and Huzhou Academy of Agricultural Sciences Experimental Station (HES, 30°90' N and 120°08' E) in Zhejiang Province. The RIL population was planted in three plot replications to reduce microenvironmental variation at HES. All plants were directly sowed in September 2021, and phenotypic data were evaluated at about 98 d after germination. The experiment was conducted using a randomized complete block design (RCBD).
Phenotypic data collection
-
The largest leaves were selected to measure the length, width, and thickness of the petiole (Fig. 1a). The petiole length (PL) was measured from the bottommost tip of the petiole to overlap between the petiole and lamina. The width of the bottommost tip in the petiole was considered the final petiole width (PW). The thickest region of the petiole was considered the final petiole thick (PT). Three plants for each line were studied as biological replications.
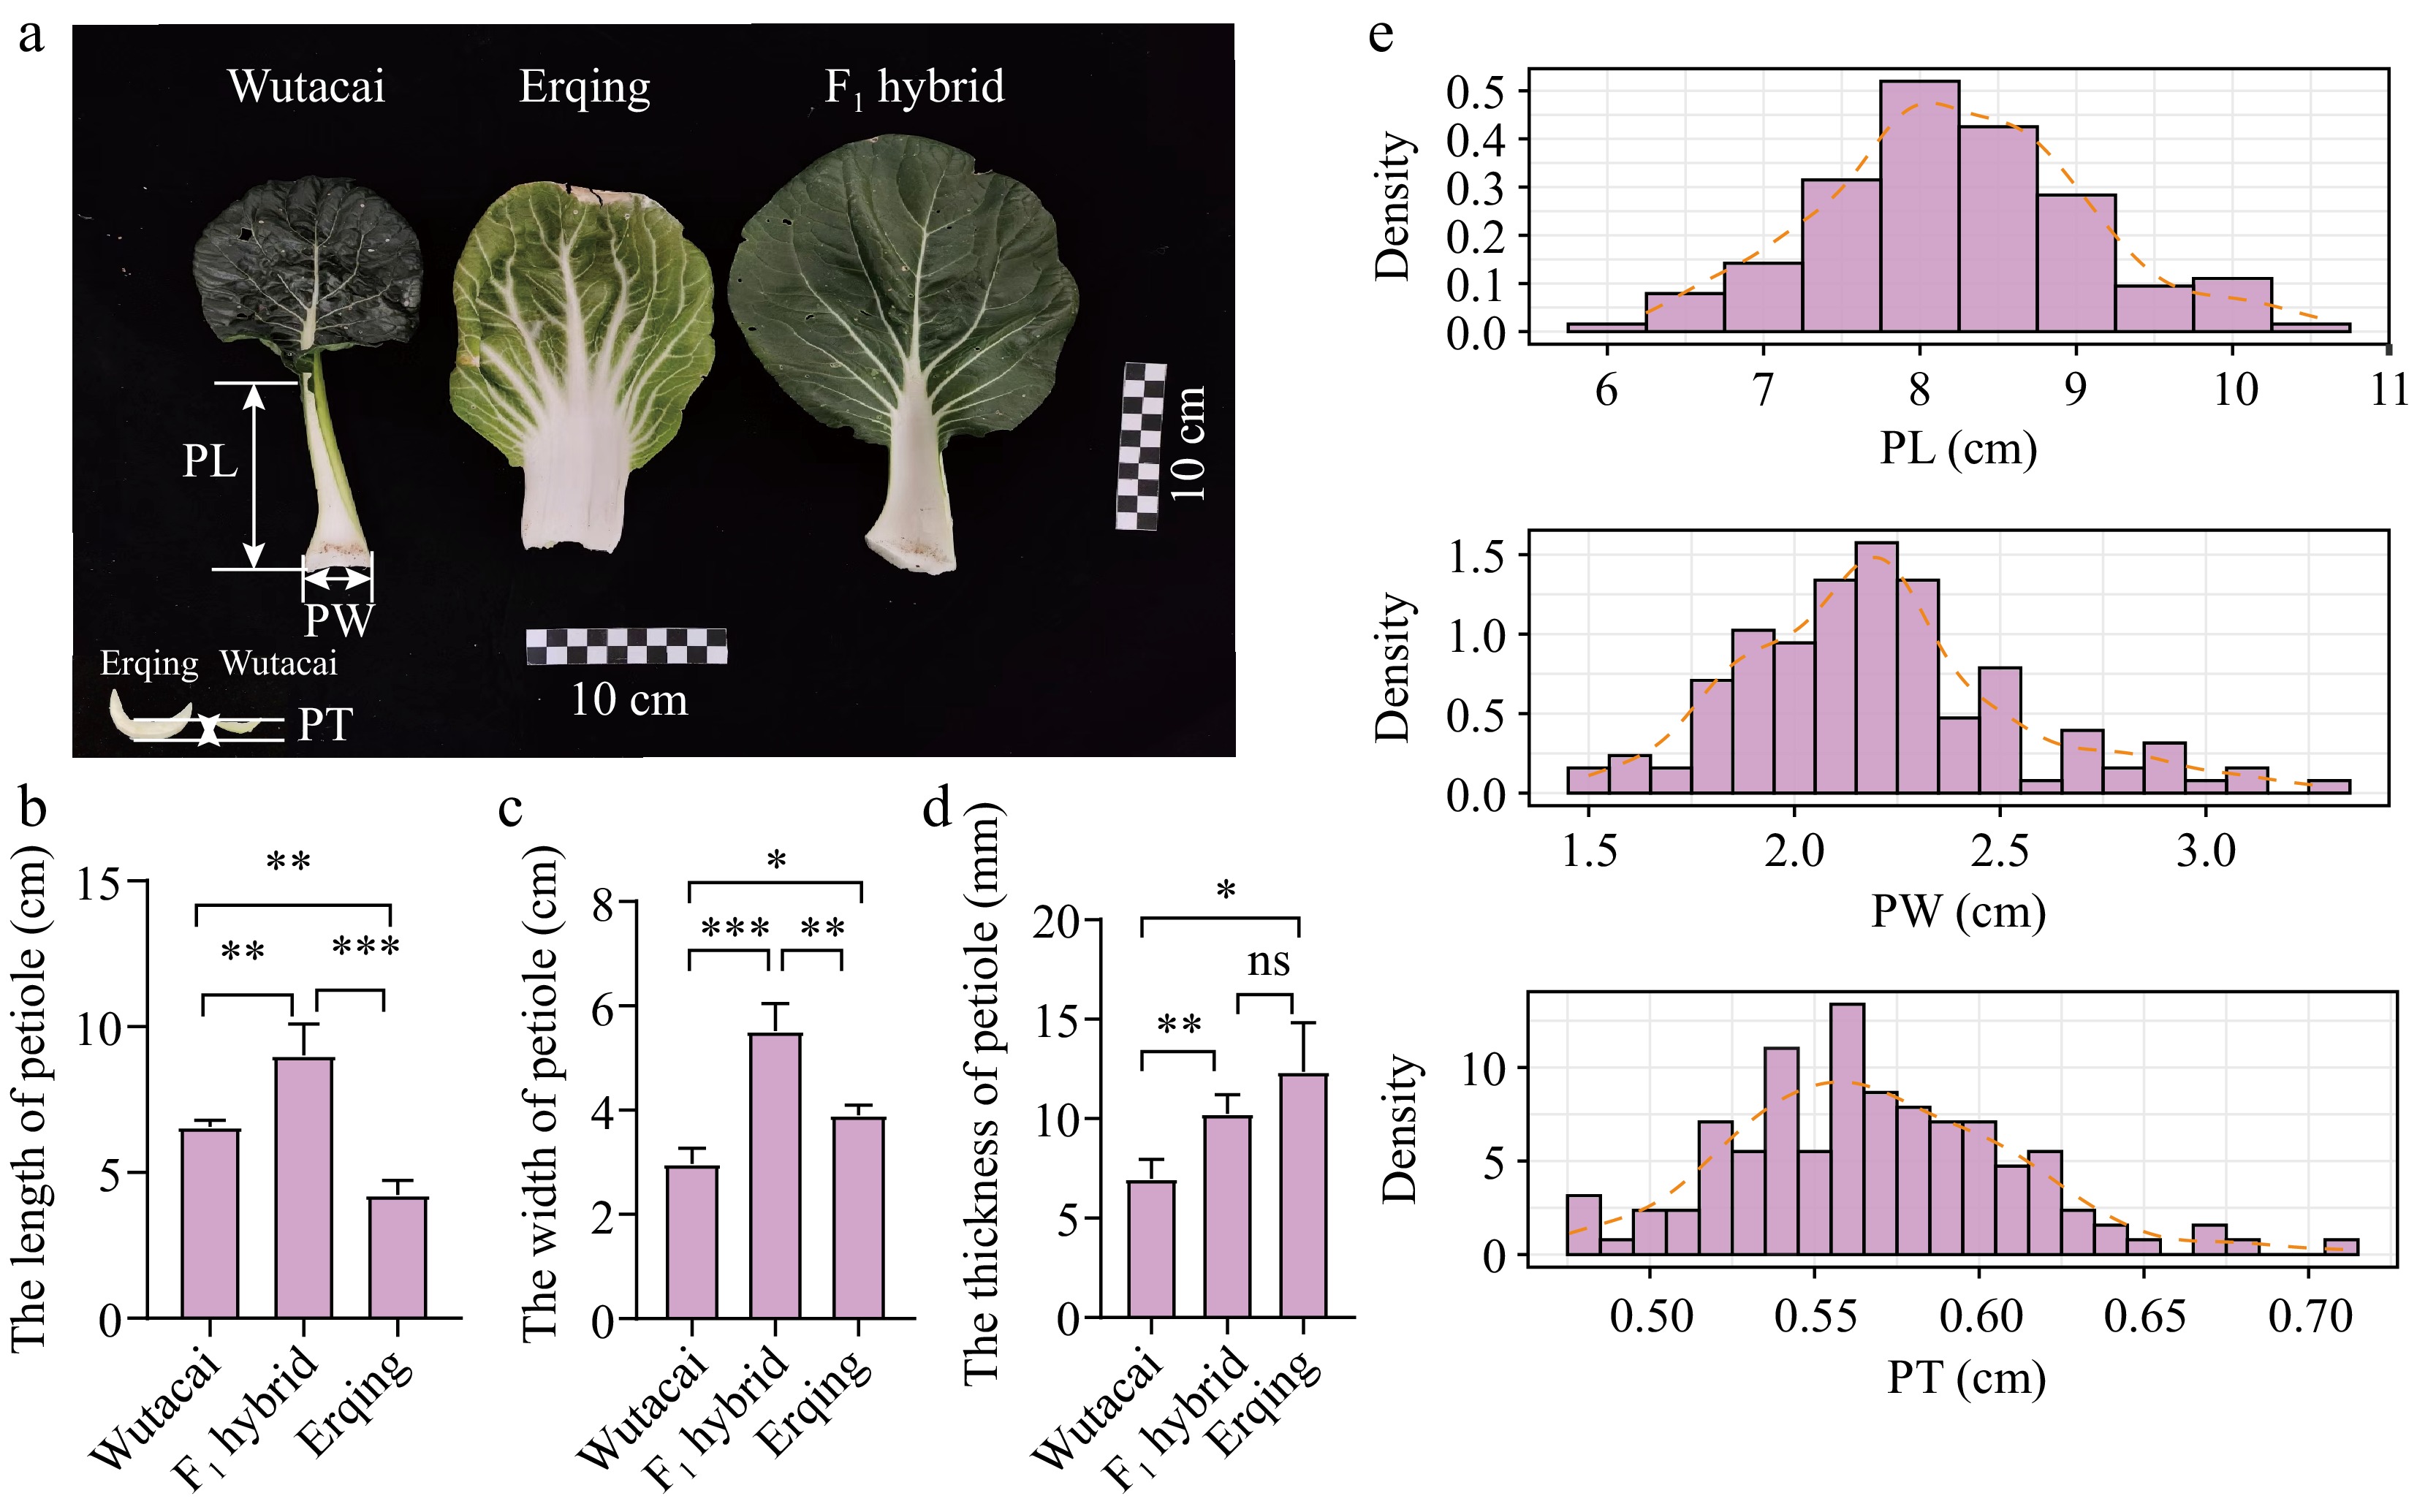
Figure 1.
The performances of Wutacai, Erqing, F1 hybrid, and RIL population. (a) The appearance of Wutacai, Erqing, and F1 hybrid. (b) Comparison of PL from Wutacai, Erqing, and F1 hybrid. (c) Comparison of PW from Wutacai, Erqing, and F1 hybrid. (d) Comparison of PT from Wutacai, Erqing, and F1 hybrid. ns indicates no significance. Asterisks(*, **, and ***) indicate p < 0.05, p < 0.01, and p < 0.001. (e) Distribution plots of BLUPs for PL, PW, and PT.
Statistical analysis of phenotypic data
-
The phenotypic data was collected from three locations. Genotypes, environments, and repeat-in environments were adopted to estimate the best mixed linear model of PL, PW, and PT using the R/lme4 package. Analysis of variance (ANOVA) was utilized for PL, PW, and PT to estimate the variance of genotypes and environmental effects. Best linear unbiased predictors (BLUPs) were obtained from the mixed linear model with genotypes, environments, and repeats in environments as random factors, and they were further used for QTL mapping. The broad sense heritability (H2) was estimated by the formula, H2 =σ2g/(σ2g + σ2ge/E + σ2e/E × R).
QTL mapping
-
The genetic linkage map has been constructed in previous studies[18]. QTL mapping was performed using R/qtl and R/qtl2 packages[19,20]. Simple marker analysis (SMA) was utilized for preliminary QTL mapping. Multiple-QTL mapping (MQM) method was also employed to improve the accuracy of the results of the QTL mapping. The LOD threshold was determined by 1,000 permutations at 0.05 level. The final interval of significant QTL was determined using a 1.5 LOD drop.
Candidate gene analysis
-
The candidate genes were annotated according to the genome of non-heading Chinese cabbage, which was downloaded from the Non-heading Chinese Cabbage and Watercress Database (
http://tbir.njau.edu.cn/NhCCD bHubs/index.jsp )[21]. BLASTp with value 1e-5 was used to identify the homologous genes in Arabidopsis. Gene description was downloaded from the TAIR database (www.arabidopsis.org ).RNA isolation and qRT-PCR anaylsis
-
The total RNA of petioles in Wutacai and Erqing was isolated using SteadyPure Plant RNA Extraction Kit (Accurate Biology, Changsha, China). RNA was reverse transcribed into cDNA using HiScript IV 1st Strand cDNA Synthesis Kit (+gDNA wiper) (Vazyme, Nanjing, China). ChamQ Blue Universal SYBR qPCR Master Mix (Vazyme, Nanjing, China) was utilized for qRT-PCR analysis. The PCR procedure and calculation of relative expression followed the method of Bai et al.[18]. The relative primers were designed by SnapGene and listed in Supplementary Table S1.
-
Wutacai and Erqing, which exhibited different types of petiole, were selected to construct an RIL population for genes associated with petiole exploration (Fig. 1a; Supplementary Table S2). Wutacai produced slender, narrow, and thin petioles, whereas Erqing exhibited shorter, wider, and thicker petioles (Fig. 1a). Based on the difference of petioles, PL, PW, and PT were measured in Wutacai, Erqing, and their F1 hybrid, which came from the crossing of Wutacai and Erqing (Fig. 1b; Supplementary Table S2). The PL in Erqing was 55.22%−74.60% of that in Wutacai. The PW and PT in Wutacai were 60.23%−80.49%, and 44.79%−66.50% of those in Erqing, respectively (Fig. 1c, d; Supplementary Table S2). PL and PW in the F1 hybrid exhibited higher than that in parents, which indicated that PL and PW showed heterosis and overdominance (Fig. 1b, c; Supplemental Table S2). PT in the F1 hybrid showed an intermediated level, indicating that PT was an incomplete dominant trait (Fig. 1d; Supplementary Table S2). The RIL population was cultivated at three locations (Baima, Jurong, and Huzhou). The PL, PW, and PT exhibited normal distribution, which suggested that those traits were controlled by multiple genes (Fig. 1e; Supplementary Fig. S1; Supplementary Table S2).
Genetic analysis of petiole shape
-
The phenotypic data collected from three locations were used to construct the best-mixed liner model. The ANOVA analysis revealed that PL, PW, and PT were suitable for the model with genotype and environment as fixed factors and interaction between genotype and environment, repeat in the environment as a random factor, which suggested that PL, PW, and PT were mutually controlled by genotype and environment (Table 1). Meanwhile, the broad sense heritability (H2) was also calculated for PL, PW, and PT. The heritability of PL and PW were 0.66 and 0.74, respectively. The high H2 suggested a dominant effect for PL and PW from genotype (Table 1). The heritability of PT was 0.44, indicating that PT was not stable and affected easily by environments (Table 1).
Table 1. The variance of effect factor and heritability for PL, PW, and PT.
Components PL PW PT Genotype 1.17946 0.16256 0.00477 Environment 2.87536 0.48803 0.04405 Genotype:environment 0.99288 0.08294 0.01179 Blocks (rep in environment) 0.08763 0.04030 0.00078 Residual 1.37812 0.14696 0.01153 Heritability (H2) 0.66038 0.74026 0.43340 QTL mapping
-
To obtain the comprehensive QTL, BLUPs and all of the phenotypic data collected from different environments were used for QTL mapping. A total of four QTL were detected in PL and contributed to 10.31%−18.57% phenotypic variance (Figs 2, 3; Supplementary Fig. S2; Table 2; Supplementary Table S3). qPL.A04.1 and qPL.A09.1 explained the highest phenotypic variance and detected at BLUPs, Jurong, and Huzhou (Figs 2, 3; Supplementary Fig. S2; Table 2; Supplementary Table S3). qPL.A03.1 and qPL.A07.1 were also detected in Baima and Huzhou (Figs 2, 3; Supplementary Fig. S2; Table 2; Supplementary Table S3). A total of seven QTL were detected for PW and explained 15.49%−45.94% phenotypic variance (Figs 2, 3; Supplementary Fig. S2; Table 2; Supplementary Table S3). qPW.A03.1, qPW.A04.1, and qPW.A06.1 were detected in several environments and explained 2.39%−6.63%, 3.10%−5.66%, and 2.77%−15.49% phenotypic variance, respectively (Figs 2, 3; Supplementary Fig. S2; Table 2; Supplementary Table S3). A total of eight QTL were detected in PT and explained 20.76%−31.20% phenotypic variance (Figs 2, 3; Supplementary Fig. S2; Table 2). qPT.A03.1, was detected in the majority of environments, was determined as the stable QTL for PT and explained 5.89%−19.83% phenotypic variance (Figs 2, 3; Supplementary Fig. S2; Table 2; Supplementary Table S3). The QTL for PL, PW, and PT were not stable and affected easily by environments.
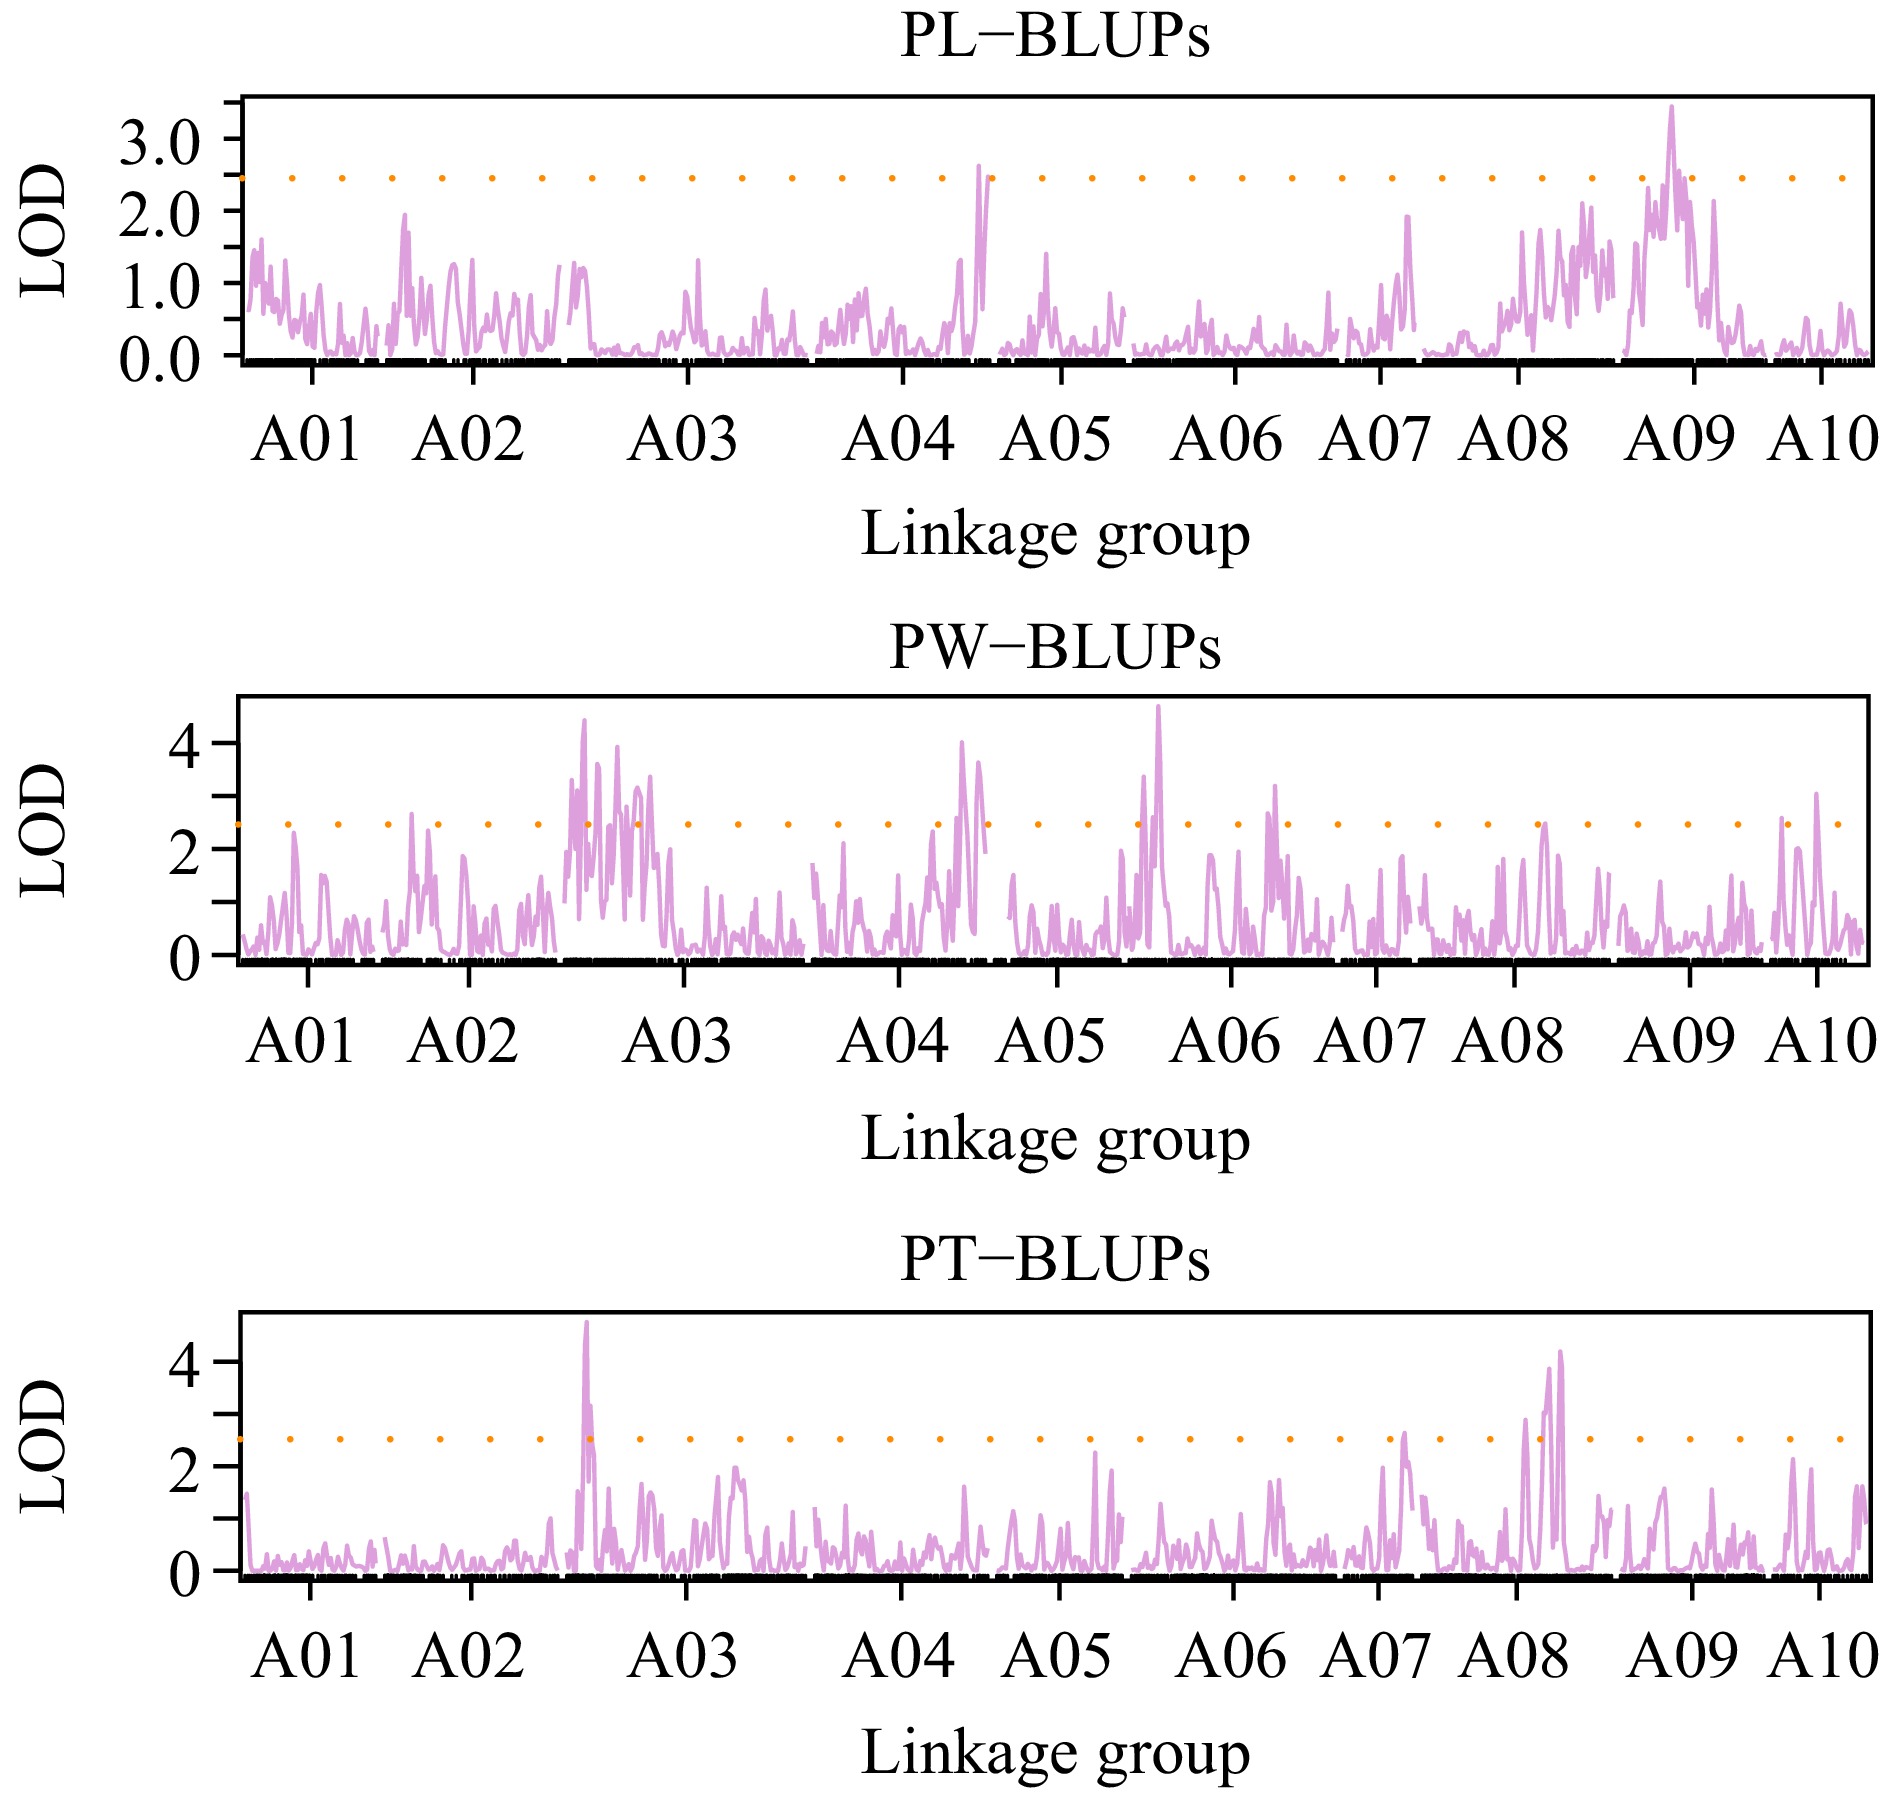
Figure 2.
QTL mapping for BLUP values in PL, PW, and PT.
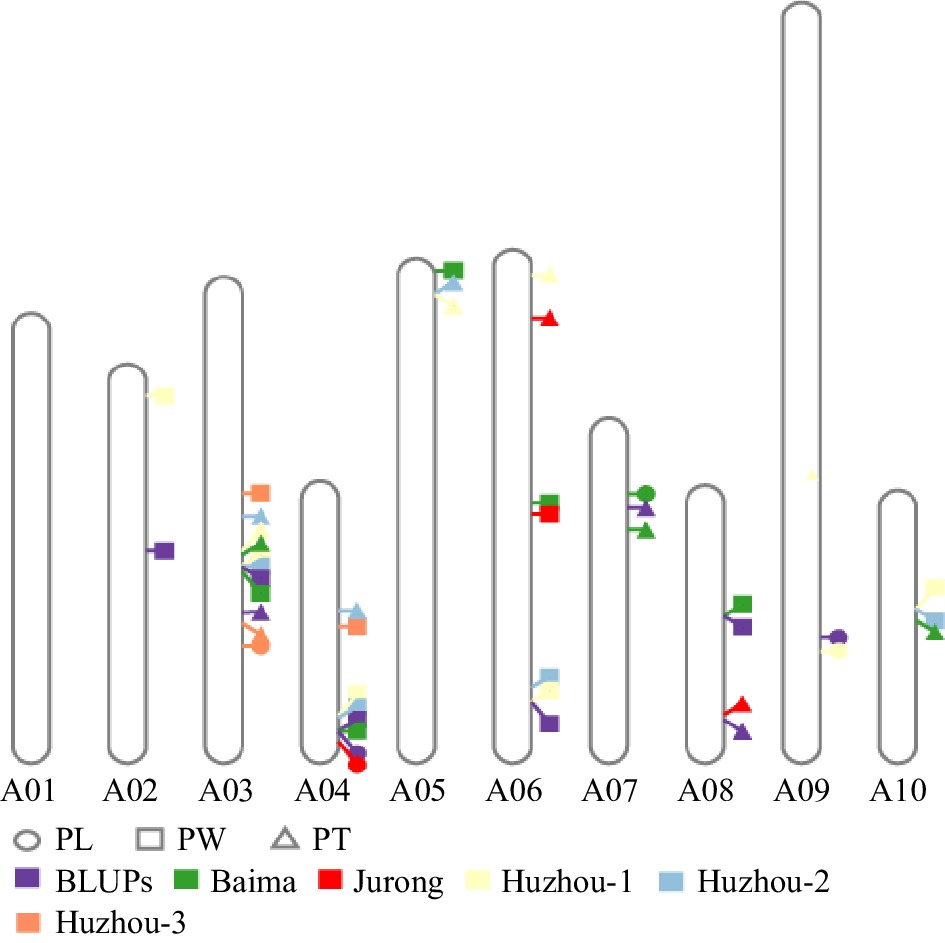
Figure 3.
Physical location of QTL for PL, PW, and PT.
Table 2. The QTL detected by BLUPs.
Traits Locations Linkage
groupLocus Peak LOD 1.5 LOD interval Additive effect Phenotypic variance explained (%) Marker right Marker left PL BLUPs A04 qPL.A04.1 2.62 A04_20389448 A04_22047361 0.23155 6.056 A09 qPL.A09.1 3.42 A09_58654691 A09_49099062 −0.26456 9.13 Baima A07 qPL.A07.1 2.81 A07_11058656 A07_1764887 0.1465 10.31459 Jurong A04 qPL.A04.1 2.77 A04_22095429 A04_22047361 1.0422 14.812217 Huzhou-1 A09 qPL.A09.1 2.73 A09_59798610 A09_50254249 −0.548 11.37389 Huzhou-3 A03 qPL.A03.1 3.15 A03_32044940 A03_30518078 −0.5585 10.97715 PW BLUPs A02 qPW.A02.1 2.66 A02_733009 A02_30883969 −0.06004 2.477 A03 qPW.A03.1 4.43 A03_31182238 A03_18015813 −0.07582 3.997 A04 qPW.A04.1 4.01 A04_20233219 A04_22047361 −0.0734 3.967 A06 qPW.A06.1 4.69 A06_40690069 A06_35966291 −0.09773 6.639 A08 qPW.A08.1 2.48 A08_517021 A08_21634479 0.05469 2.065 Baima A03 qPW.A03.1 4.11 A03_31182335 A03_18724031 −0.09117 5.642 A04 qPW.A04.1 4.20 A04_19732246 A04_22656727 −0.06587 3.099 A05 qPW.A05.1 3.76 A05_1222122 A05_815039 0.07976 4.678 A06 qPW.A06.1 4.55 A06_38372945 A06_4564281 −0.07796 4.141 A08 qPW.A08.1 2.90 A08_145893 A08_21920792 0.0713 3.862 Jurong A06 qPW.A06.1 3.23 A06_41497657 A06_3383035 −0.32253 15.489 Huzhou-1 A02 qPW.A02.1 2.69 A02_130169 A02_5193431 −0.1424 4.59 A03 qPW.A03.1 3.52 A03_30864524 A03_18015813 −0.10545 2.39 A04 qPW.A04.1 3.22 A04_17762563 A04_22047361 −0.12212 3.436 A06 qPW.A06.1 3.99 A06_40690069 A06_35966291 −0.1821 7.46 A10 qPW.A10.1 2.74 A10_1410956 A10_18769214 −0.1114 2.585 Huzhou-2 A03 qPW.A03.1 4.28 A03_24356778 A03_24682730 −0.14407 4.007 A04 qPW.A04.1 3.47 A04_17762563 A04_22312000 −0.15091 4.341 A06 qPW.A06.1 3.16 A06_38372945 A06_35966291 −0.12281 2.769 A10 qPW.A10.1 3.15 A10_1410956 A10_18769214 −0.15227 4.242 Huzhou-3 A03 qPW.A03.1 4.11 A03_18727114 A03_17930086 −0.19753 6.626 A04 qPW.A04.1 2.67 A04_2530871 A04_22047361 0.19091 5.66 PT BLUPs A03 qPT.A03.1 4.76 A03_30621834 A03_26249977 −0.01541 11.31 A07 qPT.A07.1 2.64 A07_14415306 A07_775788 0.010057 4.7 A08 qPT.A08.1 4.2 A08_18588344 A08_21214068 0.014503 10.21 Baima A03 qPT.A03.1 3.33 A03_30478585 A03_16647267 −0.02032 5.888 A07 qPT.A07.1 4.14 A07_14441999 A07_4436414 0.021074 5.974 A10 qPT.A10.1 2.52 A10_1739370 A10_20349334 0.014812 2.633 Jurong A06 qPT.A06.1 2.87 A06_7730815 A06_3882585 −0.07958 7.368 A08 qPT.A08.1 2.88 A08_17707535 A08_21175529 0.07518 6.907 Huzhou-1 A03 qPT.A03.1 3.19 A03_30864524 A03_15713701 −0.03759 6.163 A05 qPT.A05.1 4.10 A05_4097617 A05_1951585 −0.04991 9.805 A06 qPT.A06.2 2.93 A06_2453061 A06_1858366 0.03243 4.529 Huzhou-2 A03 qPT.A03.1 4.52 A03_21844186 A03_18724031 −0.05279 11.217 A04 qPT.A04.1 2.47 A04_1147833 A04_20772670 0.03016 3.228 A05 qPT.A05.1 3.26 A05_4097617 A05_1749785 −0.03566 5.048 Huzhou-3 A03 qPT.A03.1 7.38 A03_31182238 A03_27499477 −0.07229 19.834 Moreover, the QTL for PL, PW, and PT were compared, and the study found that qPL.A03.1, qPW.A03.1, and qPT.A03.1 shared co-localization and were determined as the same QTL. qPL.A04.1, qPW.A04.1, and qPT.A04.1 also shared the same physical position, considering the same QTL (Fig. 3; Supplementary Fig. S2; Supplementary Table S3). The results suggested that the two QTLs could control PL, PW, and PT simultaneously and showed a predominant effect, regarded as the key QTL for petioles shape. qPL.A07.1 and qPT.A07.1 were considered as the same QTL and showed similar localization, which indicated that the QTL was responsible for PL and PT simultaneously (Fig. 3; Supplementary Fig. S2; Supplementary Table S3). qPW.A05.1, qPW.A06.1, qPW.A08.1, and qPW.A10.1 were co-localized with qPT.A05.1, qPT.A06.1, qPT.A08.1, and qPT.A10.1 respectively, which indicated that the four QTL were responsible for PW and PT simultaneously (Fig. 3; Supplementary Fig. S2; Supplementary Table S3).
Effect analysis of QTL
-
The additive effect was analyzed to understand the effect of QTL further. qPL.A03.1, qPW.A03.1, and qPT.A03.1 showed a negative additive effect, signifying the contributions for slender, wider, and thicker petiole from the Erqing allele (AA) (Fig. 4; Supplementary Table S3). qPL.A04.1 and qPT.A04.1 exhibited positive additive effects, whereas qPW.A04.1 showed negative additive effect, which suggested that the Wutacai allele (BB) contributed to slender and thicker petiole and contributions from the Erqing allele led to wider petiole (Fig. 4; Supplementary Table S3). Apart from the two crucial intervals, The QTL on chromosome A05 showed positive additive effects in PW and negative additive effects in PT, signifying that the Wutacai allele contributed to wider and thinner petiole (Fig. 4; Supplementary Table S3). qPW.A06.1 and qPT.A06.1 showed negative additive effects, which indicated that contribution for wider and thicker petiole from the Erqing allele (Fig. 4; Supplementary Table S3). qPW.A08.1 and qPT.A08.1 showed positive additive effects, which indicated that contribution for wider and thicker petiole from the Wutacai allele (Fig. 4; Supplementary Table S3). qPW.A10.1 showed a positive additive effect, signifying contribution for wider petiole from Wutacai, whereas qPT.A10.1 showed a negative additive effect, suggesting contribution for thicker petiole from Erqing (Fig. 4; Supplementary Table S3). qPL.A10.1 and qPT.A10.1 showed a positive additive effect, which indicated that contribution for slender and thicker petiole from the Wutacai allele (Fig. 4; Supplementary Table S3).
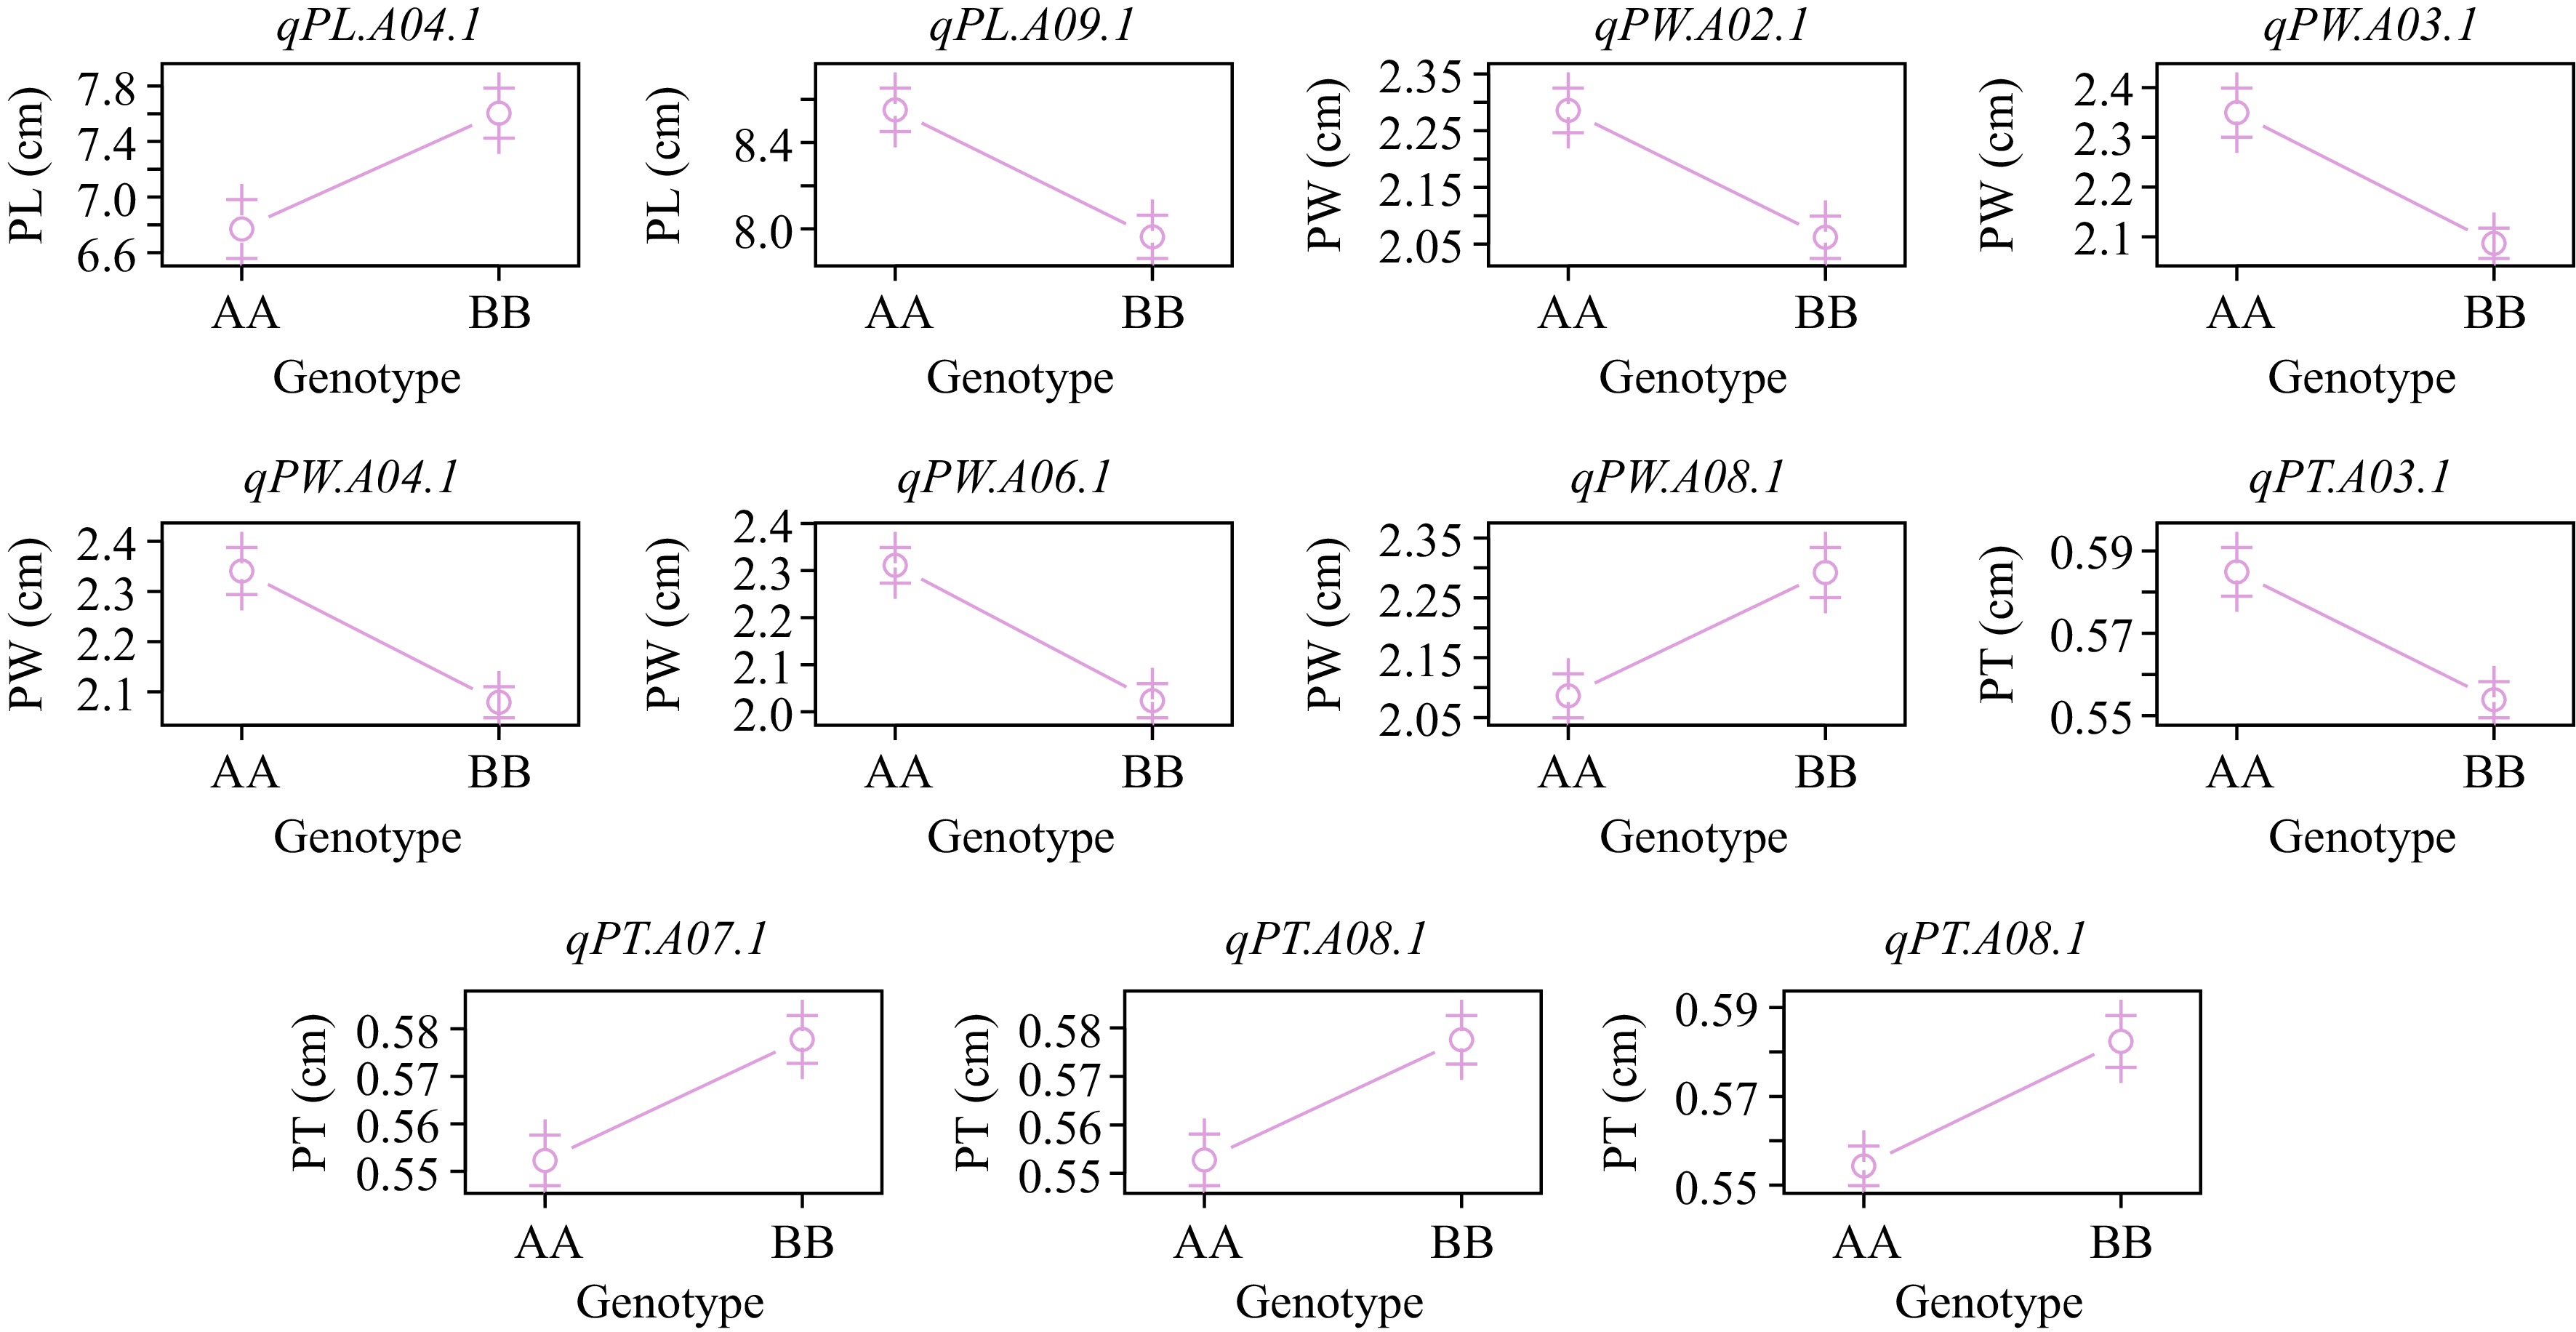
Figure 4.
The effect plot of QTL detected by BLUPs.
Candidate genes analysis
-
The QTL detected on chromosomes A03 and A04 were considered the most important QTL for petiole development. The qPL.A03.1, qPW.A03.1, and qPT.A03.1 were annotated based on NHCC001 genome[21]. The candidate genes were screened by gene description, and 12 candidate genes associated with leaf and petiole development were obtained (Table 3). BraC03g067590, homologue of ABNORMAL LEAF-SHAPE 1 (ALE1), the mutant exhibited shorter petiole[22]. BraC03g044910 was a member of the NAC transcription factor family, named NAC036; overexpression of NAC036 in Arabidopsis thaliana led to shorter petiole length[23]. BraC03g037400, BraC03g049640 and BraC03g045390, homologues of TCP4, TCP2 and TCP5, participated in leaf differentiation[24−26]. Two candidate genes (IAA31 and IPT8) related to IAA and cytokinin also may play a role in petiole development[27,28]. BraC03g050770 and BraC03g063060 were homologous with BARELY ANY MERISTEM 3 (BAM3) and ROTUNDIFOLIA 3 (ROT3), which involved in controlling leaf shape[29,30]. GRF2 (BraC03g064340) and GRF5 (BraC03g036830) were also annotated, and the two genes were related to plant growth and may function in petiole and leaf development[31,32]. Two reliable genes associated with petiole development were screened in qPL.A04.1, qPW.A04.1, and qPT.A04.1. BraC04g031470 was homologous with BLADE ON PETIOLE2 (BOP2), which mutant in Arabidopsis exhibited short petiole[33]. BraC04g031910 was annotated as SQUAMOSA PROMOTER BINDING PROTEIN-LIKE 9 (SPL9), which showed genetic interaction with BOP2[33].
Table 3. The reliable candidate genes annotated in QTL on chromosomes A03 and A04.
ID Chromosomes Candidate genes Homologue in Arabidopsis Gene name Ref. P1 A03 BraC03g067590 AT1G62340.1 ALE1 [22] P2 A03 BraC03g044910 AT2G17040.1 NAC036 [23] P3 A03 BraC03g036830 AT3G13960.1 GRF5 [31] P4 A03 BraC03g064340 AT4G37740.1 GRF2 [32] P5 A03 BraC03g037400 AT3G15030.3 TCP4 [26] P6 A03 BraC03g038570 AT3G17600.1 IAA31 [27] P7 A03 BraC03g039350 AT3G19160.1 IPT8 [28] P8 A03 BraC03g042250 AT3G23980.1 BLI [34] P9 A03 BraC03g049640 AT4G18390.2 TCP2 [24] P10 A03 BraC03g050770 AT4G20270.1 BAM3 [30] P11 A03 BraC03g063060 AT4G36380.1 ROT3 [29] P12 A03 BraC03g045390 AT5G60970.1 TCP5 [25] P13 A04 BraC04g031470 AT2G41370.1 BOP2 [33] P14 A04 BraC04g031910 AT2G42200.1 SPL9 [33] The qRT-PCR analysis was adopted to further identify the candidate genes. The expression levels of six candidate genes (BcNAC036, BcIAA31, BcBLI, BcTCP2, BcBOP2, and BcSPL9) were detected in petioles of parental lines, and others were not, suggesting the association between these genes and petiole development (Fig. 5). The expression levels of BcBLI and BcSPL9 showed no significant difference between Wutacai and Erqing, which indicated that the two genes were not related to petiole shape (Fig. 5). The expression levels of BcNAC036, BcIAA31, BcTCP2, and BcBOP2 in Wutacai were higher than that in Erqing (Fig. 5). Especially, the expression levels of BcIAA31 and BcBOP2 in Wutacai were approximately five folds of those in Erqing (Fig. 5). The results revealed that BcNAC036, BcIAA31, and BcTCP2 may be the major candidate genes in qPL.A03.1, qPW.A03.1, and qPT.A03.1, and BcIAA31 was the promise candidate genes. BcBOP2 was the promising candidate gene in qPL.A04.1, qPW.A04.1, and qPT.A04.1.
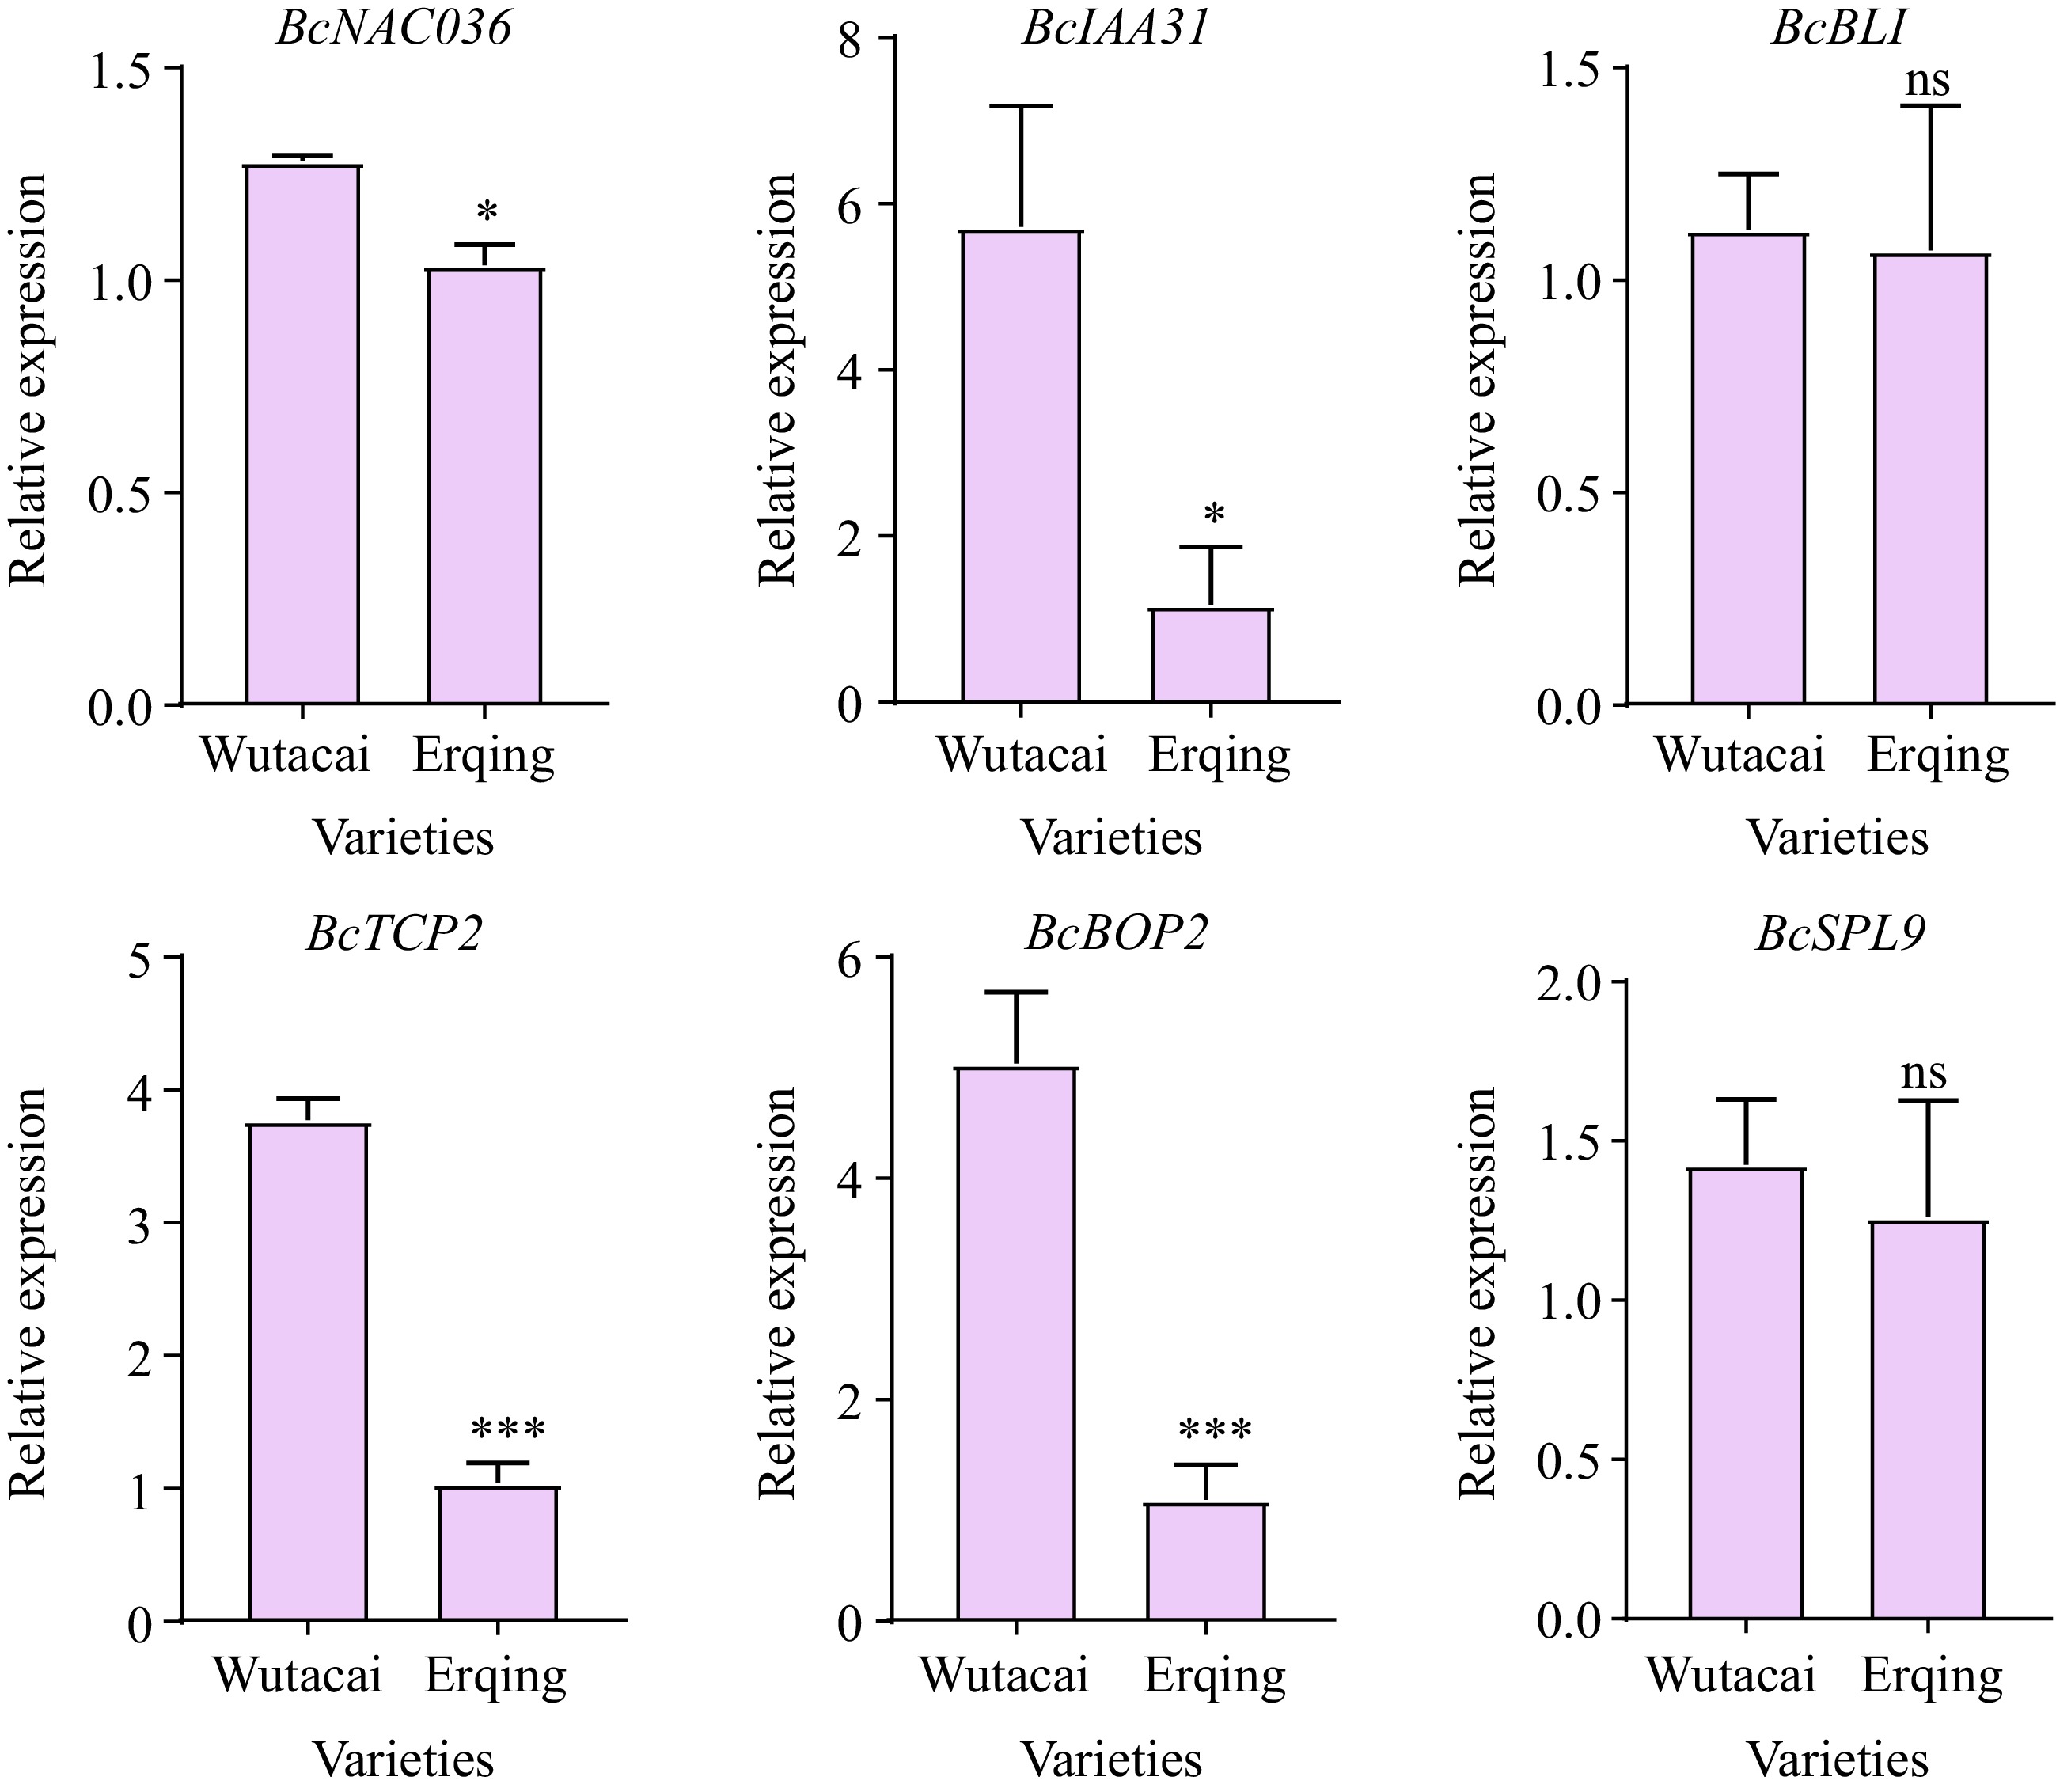
Figure 5.
qRT-PCR analysis of candidate genes in Wutacai and Erqing.
-
Petiole is an important edible organ, and the petiole shape gradually becomes one of the traits of concern in NHCC. With the improvement of people's living standards, the requirement for quality of vegetables is increasing, and the vegetables with specific characteristics are needy, such as NHCC with short and slimer petioles as leafy varieties and NHCC with length, wide and thick petiole as petiole variety. Thus, understanding the genetic model and exploration of candidate genes for petiole development and shape are required for germplasm enhancement of breeding in NHCC.
In this study, two varieties were adopted, showing significant differences in petiole length, width, and thickness in different environments, to construct a RIL population for genetic analysis and QTL mapping (Fig. 1a; Supplementary Table S2). Genetic analysis showed that PL, PW, and PT were dominant traits and controlled by multiple genes, which was similar to previous studies[15−17]. Meanwhile, the broad sense heritability of PL, PW, and PT were 0.66, 0.74, and 0.43 respectively (Table 1). Previous studies have illustrated the heritability of PL, PW, and PT as 0.33, 0.41, and 0.33, respectively, by another RIL population[17]. The low heritability of the two studies illustrated that the three traits were easily affected by the environment.
The four QTLs for PL were identified on chromosomes A03, A04, A07, and A09, which showed little difference from previous studies[15−17]. The three QTLs were identified in Wutacai and Chinese cabbage populations and distributed on chromosomes A01 and A06[16]. The four QTLs were identified in Maertou and Suzhouqing populations and distributed in A08 and A09[17]. The QTL on chromosome A09 was compared and illustrated that the qPL.A09.1 (49.10−59.80 Mb) shared physical localization with the two QTLs identified in Maertou and Suzhouqing population (qPL.9.2, 55.24−55.38 Mb; qPL.9.1, 55.97−55.61 Mb)[17]. The comparison indicated that qPL.A09.1 may be stable QTL for NHCC accessions, which could be utilized for molecular marker development and explore the core genes for PL. The QTL for PW was identified on chromosomes A02, A03, A04, A05, A06, A08, and A10 in our study (Supplementary Table S3), which were not detected in previous studies. The new QTL may contribute to obtaining new genes for controlling PW. QTL on chromosomes A03 and A04 were mutually detected in all three traits, including PL, PW, and PT. The results indicate that the two QTL can regulate PL, PW and PT, PL, PW, and PT simultaneously, suggesting pleiotropic effects and linkage among the traits related to petiole shape (Supplementary Table S3). The relationship was beneficial in developing molecular markers that could identify three traits simultaneously, improving the efficiency of the breeding process. Moreover, QTL on chromosome A04 showed different additive effects for PL, PW, and PT. qPL.A04.1 and qPT.A04.1 performed a positive additive effect, which indicated that the allele from Erqing contributed to longer and thicker petiole, whereas qPW.A04.1 showed a negative additive effect, which indicated that the allele from Wutacai contributed to narrow petiole (Fig. 3; Supplementary Table S3). The same QTL showed opposing effect for different traits, which may make it difficult to breed a single trait. The same QTL may imply the same genes controlled for three traits, which indicates that the genes may participate upstream of a regulatory pathway or play an important role in mediating phytohormone. The potential regulatory network could be studied in the future.
A total of 14 reliable candidate genes were obtained, and the qRT-PCR analysis further identified BcIAA31 and BcBOP2 as the promising candidate genes in QTL on chromosomes A03 and A04, respectively (Fig. 5; Table 3). A total of five candidate genes were screened for PL, PW, and PT, and obtained one candidate gene for PL in a previous study[17]. From those candidate genes, BOP and IAA genes are annotated in the Wutacai and Erqing populations and the Maertou and Suzhouqing populations[17]. BOP1 and IAA19 are annotated in Maertou and Suzhouqing populations, and BOP2 and IAA31 were annotated in Wutacai and Erqing populations (Table 3). BOP1 is a promising candidate gene in qPL.9.2 mapped in Maertou and Suzhouqing populations, which share physical location with qPL.A09.1 in this study, which further revealed the essential roles in petiole shape. BOP1 and BOP2 are BTB-ankyrin proteins and are involved in plant architecture[35]. In Arabidopsis, bop1bop2 mutant results in loss of petiole[35,36]. During vegetative development. BOP1 and BOP2 are transcriptional coactivators in shoot apical meristem and participate in leaf morphogenesis and floral induction[37,38]. Thus, BOP genes may be the important regulator for petiole development and petiole shape. IAA19 and IAA31 are members of the Aux/IAA family of proteins, and they respond to auxin signaling and can simultaneously control PL, PW, and PT[39]. Auxin is an important phytohormone and promotes cell proliferation and cell elongation[40]. IAA19 and IAA31 can regulate hypocotyls growth[41−43]. However, the function of these genes in NHCC has not been identified.
This work was supported by the National Natural Science Foundation of China (Grant No. 32172565), Earmarked Fund for China Agriculture Research System (Grant No. CARS-23-A-16), Jiangsu Seed Industry Revitalization Project (Grant No. JBGS (202015)), and the Bioinformatics Center of Nanjing Agricultural University.
-
The authors confirm contribution to the paper as follows: study conception and design: Li Ying, Bai A, Chen Z, data collection: Zhao T, Zhang F, Li Yan, analysis and interpretation of results: Chen Z, Liu T, Bai A, Wang X, manuscript revision: Chen Z, Bai A, Hou X. All authors reviewed the results and approved the final version of the manuscript.
-
The datasets generated during and/or analyzed during the current study are available from the corresponding author upon reasonable request.
-
The authors declare that they have no conflict of interest.
-
# Authors contributed equally: Zhongwen Chen, Aimei Bai
- Supplementary Table S1 The summary of primers for qRT-PCR.
- Supplementary Table S2 The descriptive statistics of PL, PW, and PT.
- Supplementary Table S3 The summary of QTL detected for petiole shape.
- Supplementary Fig. S1 The distribution plots of PL, PW, and PT collected from three locations.
- Supplementary Fig. S2 The QTL for PL, PW, and PT collected from three locations.
- Copyright: © 2025 by the author(s). Published by Maximum Academic Press, Fayetteville, GA. This article is an open access article distributed under Creative Commons Attribution License (CC BY 4.0), visit https://creativecommons.org/licenses/by/4.0/.
-
About this article
Cite this article
Chen Z, Bai A, Wang X, Zhao T, Zhang F, et al. 2025. QTL mapping for petiole shape in non-heading Chinese cabbage. Vegetable Research 5: e020 doi: 10.48130/vegres-0025-0014 

QTL mapping for petiole shape in non-heading Chinese cabbage
- Received: 20 February 2025
- Revised: 16 April 2025
- Accepted: 13 May 2025
- Published online: 13 June 2025
A Publisher Correction to this article was published on 2 July 2025, http://doi.org/10.48130/vegres-0025-0023.
Abstract: Non-heading Chinese cabbage (NHCC) is an important leafy vegetable in China. Petiole shape is crucial for NHCC, and cultivating diverse and abundant petiole shapes is essential to meet consumer demand. Understanding the genetic mechanism for petiole shape is significant for variety innovation. Petiole length (PL), petiole width (PW), and petiole thickness (PT) emerge as cardinal phenotypic proxies for shape characterization. In this study, 127 RILs from Wutacai and Erqing were used for QTL mapping. Genetic analysis revealed that PL, PW, and PT are dominant traits controlled by multiple genes. To obtain comprehensive and accurate QTL, phenotypic data collected from three locations and BLUP values were used for QTL mapping. 19 stable QTLs were detected and distributed as four for PL, seven for PW, and eight for PT. The QTL on chromosomes A03 and A04 were detected in all three traits and shared similar physical positions. The QTL qPL.A03.1, qPW.A03.1, and qPT.A03.1 showed negative additive effects, signifying the contributions for slender, wider, and thicker petiole from the Erqing allele. The QTL qPL.A04.1 and qPT.A04.1 exhibited positive additive effects, whereas qPW.A04.1showed negative additive effect, which suggested that the Wutacai allele contributed to slender and thicker petiole and contributions from Erqing allele led to wider petiole. Candidate genes analysis in parental lines revealed that BcIAA31 and BcBOP2 were the promise candidate genes in QTL on chromosomes A03 and A04. These findings advance mechanistic understanding of petiole morphogenesis and establish a molecular toolkit for marker-assisted pyramiding of optimal petiole traits in NHCC breeding programs.
-
Key words:
- QTL mapping /
- Petiole shape /
- NHCC /
- Candidate genes