2021 Volume 1
Article Contents
About this article
ARTICLE   Open Access    

AgMYB1, an R2R3-MYB factor, plays a role in anthocyanin production and enhancement of antioxidant capacity in celery

More Information
  • Celery is rich in nutrients and cultivated worldwide. Anthocyanins are natural plant pigments with high antioxidant capabilities in the human diet. The accumulation of anthocyanins in celery results in the purple skin color of petioles. Here, an R2R3-MYB transcription factor (TFs), AgMYB1, was cloned from purple-skin celery. Phylogenetic analysis revealed that AgMYB1 belongs to the anthocyanin branch. Sequence alignment showed that AgMYB1 contains multiple anthocyanin-related motifs. Consistent with the activating role in anthocyanin production, AgMYB1 showed higher transcriptions in purple celery compared with non-purple celery. Transient expression of AgMYB1 in tobacco leaves promoted the accumulation of anthocyanins and produced red pigments in leaves. Heterologous expression of AgMYB1 in Arabidopsis activates anthocyanin production and generates dark-purple plants. The enhancement of anthocyanin biosynthetic genes transcripts and glycosylation capacities in transgenic Arabidopsis verified the activating roles of AgMYB1 at the gene and protein level, respectively. The antioxidant capacity of transgenic Arabidopsis was also increased compared to wild type Arabidopsis. Additionally, yeast two-hybrid assay proved that AgMYB1 interacted with bHLH TFs to regulate anthocyanin biosynthesis. Our results show that the overexpression of single R2R3-MYB gene, AgMYB1, without co-expression of other TFs, can improve anthocyanin production and antioxidant capacity in transgenic plants. This study presents new information for anthocyanin regulatory mechanisms in purple celery and provides a strategy for cultivating plants with high levels of anthocyanins.
  • Aquaporins (AQPs) constitute a large family of transmembrane channel proteins that function as regulators of intracellular and intercellular water flow[1,2]. Since their first discovery in the 1990s, AQPs have been found not only in three domains of life, i.e., bacteria, eukaryotes, and archaea, but also in viruses[3,4]. Each AQP monomer is composed of an internal repeat of three transmembrane helices (i.e., TM1–TM6) as well as two half helixes that are formed by loop B (LB) and LE through dipping into the membrane[5]. The dual Asn-Pro-Ala (NPA) motifs that are located at the N-terminus of two half helixes act as a size barrier of the pore via creating an electrostatic repulsion of protons, whereas the so-called aromatic/arginine (ar/R) selectivity filter (i.e., H2, H5, LE1, and LE2) determines the substrate specificity by rendering the pore constriction site diverse in both size and hydrophobicity[59]. Based on sequence similarity, AQPs in higher plants could be divided into five subfamilies, i.e., plasma membrane intrinsic protein (PIP), tonoplast intrinsic protein (TIP), NOD26-like intrinsic protein (NIP), X intrinsic protein (XIP), and small basic intrinsic protein (SIP)[1017]. Among them, PIPs, which are typically localized in the cell membrane, are most conserved and play a central role in controlling plant water status[12,1822]. Among two phylogenetic groups present in the PIP subfamily, PIP1 possesses a relatively longer N-terminus and PIP2 features an extended C-terminus with one or more conserved S residues for phosphorylation modification[5,15,17].

    Tigernut (Cyperus esculentus L.), which belongs to the Cyperaceae family within Poales, is a novel and promising herbaceous C4 oil crop with wide adaptability, large biomass, and short life period[2327]. Tigernut is a unique species accumulating up to 35% oil in the underground tubers[2830], which are developed from stolons and the process includes three main stages, i.e., initiation, swelling, and maturation[3133]. Water is essential for tuber development and tuber moisture content maintains a relatively high level of approximately 85% until maturation when a significant drop to about 45% is observed[28,32]. Thereby, uncovering the mechanism of tuber water balance is of particular interest. Despite crucial roles of PIPs in the cell water balance, to date, their characterization in tigernut is still in the infancy[21]. The recently available genome and transcriptome datasets[31,33,34] provide an opportunity to address this issue.

    In this study, a global characterization of PIP genes was conducted in tigernut, including gene localizations, gene structures, sequence characteristics, and evolutionary patterns. Moreover, the correlation of CePIP mRNA/protein abundance with water content during tuber development as well as subcellular localizations were also investigated, which facilitated further elucidating the water balance mechanism in this special species.

    PIP genes reported in Arabidopsis (Arabidopsis thaliana)[10] and rice (Oryza sativa)[11] were respectively obtained from TAIR11 (www.arabidopsis.org) and RGAP7 (http://rice.uga.edu), and detailed information is shown in Supplemental Table S1. Their protein sequences were used as queries for tBLASTn[35] (E-value, 1e–10) search of the full-length tigernut transcriptome and genome sequences that were accessed from CNGBdb (https://db.cngb.org/search/assembly/CNA0051961)[31,34]. RNA sequencing (RNA-seq) reads that are available in NCBI (www.ncbi.nlm.nih.gov/sra) were also adopted for gene structure revision as described before[13], and presence of the conserved MIP (major intrinsic protein, Pfam accession number PF00230) domain in candidates was confirmed using MOTIF Search (www.genome.jp/tools/motif). To uncover the origin and evolution of CePIP genes, a similar approach was also employed to identify homologs from representative plant species, i.e., Carex cristatella (v1, Cyperaceae)[36], Rhynchospora breviuscula (v1, Cyperaceae)[37], and Juncus effusus (v1, Juncaceae)[37], whose genome sequences were accessed from NCBI (www.ncbi.nlm.nih.gov). Gene structure of candidates were displayed using GSDS 2.0 (http://gsds.gao-lab.org), whereas physiochemical parameters of deduced proteins were calculated using ProtParam (http://web.expasy.org/protparam). Subcellular localization prediction was conducted using WoLF PSORT (www.genscript.com/wolf-psort.html).

    Nucleotide and protein multiple sequence alignments were respectively conducted using ClustalW and MUSCLE implemented in MEGA6[38] with default parameters, and phylogenetic tree construction was carried out using MEGA6 with the maximum likelihood method and bootstrap of 1,000 replicates. Systematic names of PIP genes were assigned with two italic letters denoting the source organism and a progressive number based on sequence similarity. Conserved motifs were identified using MEME Suite 5.5.3 (https://meme-suite.org/tools/meme) with optimized parameters as follows: Any number of repetitions, maximum number of 15 motifs, and a width of 6 and 250 residues for each motif. TMs and conserved residues were identified using homology modeling and sequence alignment with the structure resolved spinach (Spinacia oleracea) SoPIP2;1[5].

    Synteny analysis was conducted using TBtools-II[39] as described previously[40], where the parameters were set as E-value of 1e-10 and BLAST hits of 5. Duplication modes were identified using the DupGen_finder pipeline[41], and Ks (synonymous substitution rate) and Ka (nonsynonymous substitution rate) of duplicate pairs were calculated using codeml in the PAML package[42]. Orthologs between different species were identified using InParanoid[43] and information from synteny analysis, and orthogroups (OGs) were assigned only when they were present in at least two species examined.

    Plant materials used for gene cloning, qRT-PCR analysis, and 4D-parallel reaction monitoring (4D-PRM)-based protein quantification were derived from a tigernut variety Reyan3[31], and plants were grown in a greenhouse as described previously[25]. For expression profiling during leaf development, three representative stages, i.e., young, mature, and senescing, were selected and the chlorophyll content was checked using SPAD-502Plus (Konica Minolta, Shanghai, China) as previously described[44]. Young and senescing leaves are yellow in appearance, and their chlorophyll contents are just half of that of mature leaves that are dark green. For diurnal fluctuation regulation, mature leaves were sampled every 4 h from the onset of light at 8 a.m. For gene regulation during tuber development, fresh tubers at 1, 5, 10, 15, 20, 25, and 35 d after tuber initiation (DAI) were collected as described previously[32]. All samples with three biological replicates were quickly frozen with liquid nitrogen and stored at −80 °C for further use. For subcellular localization analysis, tobacco (Nicotiana benthamiana) plants were grown as previously described[20].

    Tissue-specific expression profiles of CePIP genes were investigated using Illumina RNA-seq samples (150 bp paired-end reads) with three biological replicates for young leaf, mature leaf, sheath of mature leaf, shoot apex, root, rhizome, and three stages of developmental tuber (40, 85, and 120 d after sowing (DAS)), which are under the NCBI accession number of PRJNA703731. Raw sequence reads in the FASTQ format were obtained using fastq-dump, and quality control was performed using fastQC (www.bioinformatics.babraham.ac.uk/projects/fastqc). Read mapping was performed using HISAT2 (v2.2.1, https://daehwankimlab.github.io/hisat2), and relative gene expression level was presented as FPKM (fragments per kilobase of exon per million fragments mapped)[45].

    For qRT-PCR analysis, total RNA extraction and synthesis of the first-strand cDNA were conducted as previously described[24]. Primers used in this study are shown in Supplemental Table S2, where CeUCE2 and CeTIP41[25,33] were employed as two reference genes. PCR reaction in triplicate for each biological sample was carried out using the SYBR-green Mix (Takara) on a Real-time Thermal Cycler Type 5100 (Thermal Fisher Scientific Oy). Relative gene abundance was estimated with the 2−ΔΔCᴛ method and statistical analysis was performed using SPSS Statistics 20 as described previously[13].

    Raw proteomic data for tigernut roots, leaves, freshly harvested, dried, rehydrated for 48 h, and sprouted tubers were downloaded from ProteomeXchange/PRIDE (www.proteomexchange.org, PXD021894, PXD031123, and PXD035931), which were further analyzed using Maxquant (v1.6.15.0, www.maxquant.org). Three dominant members, i.e., CePIP1;1, -2;1, and -2;8, were selected for 4D-PRM quantification analysis, and related unique peptides are shown in Supplemental Table S3. Protein extraction, trypsin digestion, and LC-MS/MS analysis were conducted as described previously[46].

    For subcellular localization analysis, the coding region (CDS) of CePIP1;1, -2;1, and -2;8 were cloned into pNC-Cam1304-SubN via Nimble Cloning as described before[30]. Then, recombinant plasmids were introduced into Agrobacterium tumefaciens GV3101 with the helper plasmid pSoup-P19 and infiltration of 4-week-old tobacco leaves were performed as previously described[20]. For subcellular localization analysis, the plasma membrane marker HbPIP2;3-RFP[22] was co-transformed as a positive control. Fluorescence observation was conducted using confocal laser scanning microscopy imaging (Zeiss LMS880, Germany): The wavelength of laser-1 was set as 730 nm for RFP observation, where the fluorescence was excited at 561 nm; the wavelength of laser-2 was set as 750 nm for EGFP observation, where the fluorescence was excited at 488 nm; and the wavelength of laser-3 was set as 470 nm for chlorophyll autofluorescence observation, where the fluorescence was excited at 633 nm.

    As shown in Table 1, a total of 14 PIP genes were identified from eight tigernut scaffolds (Scfs). The CDS length varies from 831 to 882 bp, putatively encoding 276–293 amino acids (AA) with a molecular weight (MW) of 29.16–31.59 kilodalton (kDa). The theoretical isoelectric point (pI) varies from 7.04 to 9.46, implying that they are all alkaline. The grand average of hydropathicity (GRAVY) is between 0.344 and 0.577, and the aliphatic index (II) ranges from 94.57 to 106.90, which are consistent with the hydrophobic characteristic of AQPs[47]. As expected, like SoPIP2;1, all CePIPs include six TMs, two typical NPA motifs, the invariable ar/R filter F-H-T-R, five conserved Froger's positions Q/M-S-A-F-W, and two highly conserved residues corresponding to H193 and L197 in SoPIP2;1 that were proven to be involved in gating[5,48], though the H→F variation was found in CePIP2;9, -2;10, and -2;11 (Supplemental Fig. S1). Moreover, two S residues, corresponding to S115 and S274 in SoPIP2;1[5], respectively, were also found in the majority of CePIPs (Supplemental Fig. S1), implying their posttranslational regulation by phosphorylation.

    Table 1.  Fourteen PIP genes identified in C. esculentus.
    Gene name Locus Position Intron no. AA MW (kDa) pI GRAVY AI TM MIP
    CePIP1;1 CESC_15147 Scf9:2757378..2759502(–) 3 288 30.76 8.82 0.384 95.28 6 47..276
    CePIP1;2 CESC_04128 Scf4:3806361..3807726(–) 3 291 31.11 8.81 0.344 95.95 6 46..274
    CePIP1;3 CESC_15950 Scf54:5022493..5023820(+) 3 289 31.06 8.80 0.363 94.57 6 49..278
    CePIP2;1 CESC_15350 Scf9:879960..884243(+) 3 288 30.34 8.60 0.529 103.02 6 33..269
    CePIP2;2 CESC_00011 Scf30:4234620..4236549(+) 3 293 31.59 9.27 0.394 101.57 6 35..268
    CePIP2;3 CESC_00010 Scf30:4239406..4241658(+) 3 291 30.88 9.44 0.432 98.97 6 31..266
    CePIP2;4 CESC_05080 Scf46:307799..309544(+) 3 285 30.44 7.04 0.453 100.32 6 28..265
    CePIP2;5 CESC_05079 Scf46:312254..314388(+) 3 286 30.49 7.04 0.512 101.68 6 31..268
    CePIP2;6 CESC_05078 Scf46:316024..317780(+) 3 288 30.65 7.68 0.475 103.06 6 31..268
    CePIP2;7 CESC_05077 Scf46:320439..322184(+) 3 284 30.12 8.55 0.500 100.00 6 29..266
    CePIP2;8 CESC_14470 Scf2:4446409..4448999(+) 3 284 30.37 8.30 0.490 106.90 6 33..263
    CePIP2;9 CESC_02223 Scf1:2543928..2545778(–) 3 283 30.09 9.46 0.533 106.47 6 31..262
    CePIP2;10 CESC_10007 Scf27:1686032..1688010(–) 3 276 29.16 9.23 0.560 106.05 6 26..256
    CePIP2;11 CESC_10009 Scf27:1694196..1696175(–) 3 284 29.71 9.10 0.577 105.49 6 33..263
    AA: amino acid; AI: aliphatic index; GRAVY: grand average of hydropathicity; kDa: kilodalton; MIP: major intrinsic protein; MW: molecular weight; pI: isoelectric point; PIP: plasma membrane intrinsic protein; Scf: scaffold; TM: transmembrane helix.
     | Show Table
    DownLoad: CSV

    To uncover the evolutionary relationships, an unrooted phylogenetic tree was constructed using the full-length protein sequences of CePIPs together with 11 OsPIPs and 13 AtPIPs. As shown in Fig. 1a, these proteins were clustered into two main groups, corresponding to PIP1 and PIP2 as previously defined[10,49], and each appears to have evolved into several subgroups. Compared with PIP1s, PIP2s possess a relatively shorter N-terminal but an extended C-terminal with one conserved S residue (Supplemental Fig. S1). Interestingly, a high number of gene repeats were detected, most of which seem to be species-specific, i.e., AtPIP1;1/-1;2/-1;3/-1;4/-1;5, AtPIP2;1/-2;2/-2;3/-2;4/-2;5/-2;6, AtPIP2;7/-2;8, OsPIP1;1/-1;2/-1;3, OsPIP2;1/-2;4/-2;5, OsPIP2;2/-2;3, CePIP1;1/-1;2, CePIP2;2/-2;3, CePIP2;4/-2;5/-2;6/-2;7, and CePIP2;9/-2;10/-2;11, reflecting the occurrence of more than one lineage-specific whole-genome duplications (WGDs) after their divergence[50,51]. In Arabidopsis that experienced three WGDs (i.e. γ, β, and α) after the split with the monocot clade[52], AtPIP1;5 in the PIP1 group first gave rise to AtPIP1;1 via the γ WGD shared by all core eudicots[50], which latter resulted in AtPIP1;3, -1;4, and -1;2 via β and α WGDs; AtPIP2;1 in the PIP2 group first gave rise to AtPIP2;6 via the γ WGD, and they latter generated AtPIP2;2, and -2;5 via the α WGD (Supplemental Table S1). In rice, which also experienced three WGDs (i.e. τ, σ, and ρ) after the split with the eudicot clade[51], OsPIP1;2 and -2;3 generated OsPIP1;1 and -2;2 via the Poaceae-specific ρ WGD, respectively. Additionally, tandem, proximal, transposed and dispersed duplications also played a role on the gene expansion in these two species (Supplemental Table S1).

    Figure 1.  Structural and phylogenetic analysis of PIPs in C. esculentus, O. sativa, and A. thaliana. (a) Shown is an unrooted phylogenetic tree resulting from full-length PIPs with MEGA6 (maximum likelihood method and bootstrap of 1,000 replicates), where the distance scale denotes the number of amino acid substitutions per site. (b) Shown are the exon-intron structures. (c) Shown is the distribution of conserved motifs among PIPs, where different motifs are represented by different color blocks as indicated and the same color block in different proteins indicates a certain motif. (At: A. thaliana; Ce: C. esculentus; PIP: plasma membrane intrinsic protein; Os: O. sativa).

    Analysis of gene structures revealed that all CePIP and AtPIP genes possess three introns and four exons in the CDS, in contrast to the frequent loss of certain introns in rice, including OsPIP1;2, -1;3, -2;1, -2;3, -2;4, -2;5, -2;6, -2;7, and -2;8 (Fig. 1b). The positions of three introns are highly conserved, which are located in sequences encoding LB (three residues before the first NPA), LD (one residue before the conserved L involved in gating), and LE (18 residues after the second NPA), respectively (Supplemental Fig. S1). The intron length of CePIP genes is highly variable, i.e., 109–993 bp, 115–1745 bp, and 95–866 bp for three introns, respectively. By contrast, the exon length is relatively less variable: Exons 2 and 3 are invariable with 296 bp and 141 bp, respectively, whereas Exons 1 and 4 are of 277–343 bp and 93–132 bp, determining the length of N- and C-terminus of PIP1 and PIP2, respectively (Fig. 1b). Correspondingly, their protein structures were shown to be highly conserved, and six (i.e., Motifs 1–6) out of 15 motifs identified are broadly present. Among them, Motif 3, -2, -6, -1, and -4 constitute the conserved MIP domain. In contrast to a single Motif 5 present in most PIP2s, all PIP1s possess two sequential copies of Motif 5, where the first one is located at the extended N-terminal. In CePIP2;3 and OsPIP2;7, Motif 5 is replaced by Motif 13; in CePIP2;2, it is replaced by two copies of Motif 15; and no significant motif was detected in this region of CePIP2;10. PIP1s and PIP2s usually feature Motif 9 and -7 at the C-terminal, respectively, though it is replaced by Motif 12 in CePIP2;6 and OsPIP2;8. PIP2s usually feature Motif 8 at the N-terminal, though it is replaced by Motif 14 in CePIP2;2 and -2;3 or replaced by Motif 11 in CePIP2;10 and -2;11 (Fig. 1c).

    As shown in Fig. 2a, gene localization of CePIPs revealed three gene clusters, i.e., CePIP2;2/-2;3 on Scf30, CePIP2;4/-2;5/-2;6/-2;7 on Scf46, and CePIP2;10/-2;11 on Scf27, which were defined as tandem repeats for their high sequence similarities and neighboring locations. The nucleotide identities of these duplicate pairs vary from 70.5% to 91.2%, and the Ks values range from 0.0971 to 1.2778 (Table 2), implying different time of their birth. According to intra-species synteny analysis, two duplicate pairs, i.e., CePIP1;1/-1;2 and CePIP2;2/-2;4, were shown to be located within syntenic blocks (Fig. 2b) and thus were defined as WGD repeats. Among them, CePIP1;1/-1;2 possess a comparable Ks value to CePIP2;2/-2;3, CePIP1;1/-1;3, and CePIP2;4/-2;8 (1.2522 vs 1.2287–1.2778), whereas CePIP2;2/-2;4 harbor a relatively higher Ks value of 1.5474 (Table 2), implying early origin or fast evolution of the latter. While CePIP1;1/-1;3 and CePIP2;1/-2;8 were characterized as transposed repeats, CePIP2;1/-2;2, CePIP2;9/-2;10, and CePIP2;8/-2;10 were characterized as dispersed repeats (Fig. 2a). The Ks values of three dispersed repeats vary from 0.8591 to 3.0117 (Table 2), implying distinct times of origin.

    Figure 2.  Duplication events of CePIP genes and synteny analysis within and between C. esculentus, O. sativa, and A. thaliana. (a) Duplication events detected in tigernut. Serial numbers are indicated at the top of each scaffold, and the scale is in Mb. Duplicate pairs identified in this study are connected using lines in different colors, i.e., tandem (shown in green), transposed (shown in purple), dispersed (shown in gold), and WGD (shown in red). (b) Synteny analysis within and between C. esculentus, O. sativa, and A. thaliana. (c) Synteny analysis within and between C. esculentus, C. cristatella, R. breviuscula, and J. effusus. Shown are PIP-encoding chromosomes/scaffolds and only syntenic blocks that contain PIP genes are marked, i.e., red and purple for intra- and inter-species, respectively. (At: A. thaliana; Cc: C. cristatella; Ce: C. esculentus; Je: J. effusus; Mb: megabase; PIP: plasma membrane intrinsic protein; Os: O. sativa; Rb: R. breviuscula; Scf: scaffold; WGD: whole-genome duplication).
    Table 2.  Sequence identity and evolutionary rate of homologous PIP gene pairs identified in C. esculentus. Ks and Ka were calculated using PAML.
    Duplicate 1 Duplicate 2 Identity (%) Ka Ks Ka/Ks
    CePIP1;1 CePIP1;3 78.70 0.0750 1.2287 0.0610
    CePIP1;2 CePIP1;1 77.20 0.0894 1.2522 0.0714
    CePIP2;1 CePIP2;4 74.90 0.0965 1.7009 0.0567
    CePIP2;3 CePIP2;2 70.50 0.1819 1.2778 0.1424
    CePIP2;4 CePIP2;2 66.50 0.2094 1.5474 0.1353
    CePIP2;5 CePIP2;4 87.30 0.0225 0.4948 0.0455
    CePIP2;6 CePIP2;5 84.90 0.0545 0.5820 0.0937
    CePIP2;7 CePIP2;6 78.70 0.0894 1.0269 0.0871
    CePIP2;8 CePIP2;4 72.90 0.1401 1.2641 0.1109
    CePIP2;9 CePIP2;10 76.40 0.1290 0.8591 0.1502
    CePIP2;10 CePIP2;8 64.90 0.2432 3.0117 0.0807
    CePIP2;11 CePIP2;10 91.20 0.0562 0.0971 0.5783
    Ce: C. esculentus; Ka: nonsynonymous substitution rate; Ks: synonymous substitution rate; PIP: plasma membrane intrinsic protein.
     | Show Table
    DownLoad: CSV

    According to inter-species syntenic analysis, six out of 14 CePIP genes were shown to have syntelogs in rice, including 1:1, 1:2, and 2:2 (i.e. CePIP1;1 vs OsPIP1;3, CePIP1;3 vs OsPIP1;2/-1;1, CePIP2;1 vs OsPIP2;4, CePIP2;2/-2;4 vs OsPIP2;3/-2;2, and CePIP2;8 vs OsPIP2;6), in striking contrast to a single one found in Arabidopsis (i.e. CePIP1;2 vs AtPIP1;2). Correspondingly, only OsPIP1;2 in rice was shown to have syntelogs in Arabidopsis, i.e., AtPIP1;3 and -1;4 (Fig. 2b). These results are consistent with their taxonomic relationships that tigernut and rice are closely related[50,51], and also imply lineage-specific evolution after their divergence.

    As described above, phylogenetic and syntenic analyses showed that the last common ancestor of tigernut and rice is more likely to possess only two PIP1s and three PIP2s. However, it is not clear whether the gene expansion observed in tigernut is species-specific or Cyperaceae-specific. To address this issue, recently available genomes were used to identify PIP subfamily genes from C. cristatella, R. breviuscula, and J. effuses, resulting in 15, 13, and nine members, respectively. Interestingly, in contrast to a high number of tandem repeats found in Cyperaceae species, only one pair of tandem repeats (i.e., JePIP2;3 and -2;4) were identified in J. effusus, a close outgroup species to Cyperaceae in the Juncaceae family[36,37]. According to homologous analysis, a total of 12 orthogroups were identified, where JePIP genes belong to PIP1A (JePIP1;1), PIP1B (JePIP1;2), PIP1C (JePIP1;3), PIP2A (JePIP2;1), PIP2B (JePIP2;2), PIP2F (JePIP2;3 and -2;4), PIP2G (JePIP2;5), and PIP2H (JePIP2;6) (Table 3). Further intra-species syntenic analysis revealed that JePIP1;1/-1;2 and JePIP2;2/-2;3 are located within syntenic blocks, which is consistent with CePIP1;1/-1;2, CePIP2;2/-2;4, CcPIP1;1/-1;2, CcPIP2;3/-2;4, RbPIP1;1/-1;2, and RbPIP2;2/-2;5 (Fig. 2c), implying that PIP1A/PIP1B and PIP2B/PIP2D were derived from WGDs occurred sometime before Cyperaceae-Juncaceae divergence. After the split with Juncaceae, tandem duplications frequently occurred in Cyperaceae, where PIP2B/PIP2C and PIP2D/PIP2E/PIP2F retain in most Cyperaceae plants examined in this study. By contrast, species-specific expansion was also observed, i.e., CePIP2;4/-2;5, CePIP2;10/-2;11, CcPIP1;2/-1;3, CcPIP2;4/-2;5, CcPIP2;8/-2;9, CcPIP2;10/-2;11, RbPIP2;3/-2;4, and RbPIP2;9/-2;10 (Table 3 & Fig. 2c).

    Table 3.  Twelve proposed orthogroups based on comparison of representative plant species.
    Orthogroup C. esculentus C. cristatella R. breviuscula J. effusus O. sativa A. thaliana
    PIP1A CePIP1;1 CcPIP1;1 RbPIP1;1 JePIP1;1 OsPIP1;3 AtPIP1;1, AtPIP1;2,
    AtPIP1;3, AtPIP1;4,
    AtPIP1;5
    PIP1B CePIP1;2 CcPIP1;2, CcPIP1;3 RbPIP1;2 JePIP1;2
    PIP1C CePIP1;3 CcPIP1;4 RbPIP1;3 JePIP1;3 OsPIP1;1, OsPIP1;2
    PIP2A CePIP2;1 CcPIP2;1 RbPIP2;1 JePIP2;1 OsPIP2;1, OsPIP2;4,
    OsPIP2;5
    AtPIP2;1, AtPIP2;2,
    AtPIP2;3, AtPIP2;4,
    AtPIP2;5, AtPIP2;6
    PIP2B CePIP2;2 CcPIP2;2 RbPIP2;2 JePIP2;2 OsPIP2;2, OsPIP2;3
    PIP2C CePIP2;3 CcPIP2;3 RbPIP2;3, RbPIP2;4
    PIP2D CePIP2;4, CePIP2;5 CcPIP2;4, CcPIP2;5 RbPIP2;5
    PIP2E CePIP2;5 CcPIP2;5 RbPIP2;6
    PIP2F CePIP2;6 CcPIP2;6
    PIP2G CePIP2;7 CcPIP2;7 RbPIP2;7 JePIP2;3, JePIP2;4
    PIP2H CePIP2;8 CcPIP2;8, CcPIP2;9 RbPIP2;8 JePIP2;5 OsPIP2;6 AtPIP2;7, AtPIP2;8
    PIP2I CePIP2;9, CePIP2;10,
    CePIP2;11
    CcPIP2;10, CcPIP2;11 RbPIP2;9, RbPIP2;10 JePIP2;6 OsPIP2;7, OsPIP2;8
    At: A. thaliana; Cc: C. cristatella; Ce: C. esculentus; Je: J. effuses; Os: O. sativa; Rb: R. breviuscula; PIP: plasma membrane intrinsic protein.
     | Show Table
    DownLoad: CSV

    Tissue-specific expression profiles of CePIP genes were investigated using transcriptome data available for young leaf, mature leaf, sheath, root, rhizome, shoot apex, and tuber. As shown in Fig. 3a, CePIP genes were mostly expressed in roots, followed by sheaths, moderately in tubers, young leaves, rhizomes, and mature leaves, and lowly in shoot apexes. In most tissues, CePIP1;1, -2;1, and -2;8 represent three dominant members that contributed more than 90% of total transcripts. By contrast, in rhizome, these three members occupied about 80% of total transcripts, which together with CePIP1;3 and -2;4 contributed up to 96%; in root, CePIP1;1, -1;3, -2;4, and -2;7 occupied about 84% of total transcripts, which together with CePIP2;1 and -2;8 contributed up to 94%. According to their expression patterns, CePIP genes could be divided into five main clusters: Cluster I includes CePIP1;1, -2;1, and -2;8 that were constitutively and highly expressed in all tissues examined; Cluster II includes CePIP2;2, -2;9, and -2;10 that were lowly expressed in all tested tissues; Cluster III includes CePIP1;2 and -2;11 that were preferentially expressed in young leaf and sheath; Cluster IV includes CePIP1;3 and -2;4 that were predominantly expressed in root and rhizome; and Cluster V includes remains that were typically expressed in root (Fig. 3a). Collectively, these results imply expression divergence of most duplicate pairs and three members (i.e. CePIP1;1, -2;1, and -2;8) have evolved to be constitutively co-expressed in most tissues.

    Figure 3.  Expression profiles of CePIP genes in various tissues, different stages of leaf development, and mature leaves of diurnal fluctuation. (a) Tissue-specific expression profiles of 14 CePIP genes. The heatmap was generated using the R package implemented with a row-based standardization. Color scale represents FPKM normalized log2 transformed counts, where blue indicates low expression and red indicates high expression. (b) Expression profiles of CePIP1;1, -2;1, and -2;8 at different stages of leaf development. (c) Expression profiles of CePIP1;1, -2;1, and -2;8 in mature leaves of diurnal fluctuation. Bars indicate SD (N = 3) and uppercase letters indicate difference significance tested following Duncan's one-way multiple-range post hoc ANOVA (p< 0.01). (Ce: C. esculentus; FPKM: Fragments per kilobase of exon per million fragments mapped; PIP: plasma membrane intrinsic protein)

    As shown in Fig. 3a, compared with young leaves, transcriptome profiling showed that CePIP1;2, -2;3, -2;7, -2;8, and -2;11 were significantly down-regulated in mature leaves, whereas CePIP1;3 and -2;1 were up-regulated. To confirm the results, three dominant members, i.e., CePIP1;1, -2;1, and -2;8, were selected for qRT-PCR analysis, which includes three representative stages, i.e., young, mature, and senescing leaves. As shown in Fig. 3b, in contrast to CePIP2;1 that exhibited a bell-like expression pattern peaking in mature leaves, transcripts of both CePIP1;1 and -2;8 gradually decreased during leaf development. These results were largely consistent with transcriptome profiling, and the only difference is that CePIP1;1 was significantly down-regulated in mature leaves relative to young leaves. However, this may be due to different experiment conditions used, i.e., greenhouse vs natural conditions.

    Diurnal fluctuation expression patterns of CePIP1;1, -2;1, and -2;8 were also investigated in mature leaves and results are shown in Fig. 3c. Generally, transcripts of all three genes in the day (8, 12, 16, and 20 h) were higher than that in the night (24 and 4 h). During the day, both CePIP1;1 and -2;8 exhibited an unimodal expression pattern that peaked at 12 h, whereas CePIP2;1 possessed two peaks (8 and 16 h) and their difference was not significant. Nevertheless, transcripts of all three genes at 20 h (onset of night) were significantly lower than those at 8 h (onset of day) as well as 12 h. In the night, except for CePIP2;1, no significant difference was observed between the two stages for both CePIP1;1 and -2;8. Moreover, their transcripts were comparable to those at 20 h (Fig. 3c).

    To reveal the expression patterns of CePIP genes during tuber development, three representative stages, i.e., 40 DAS (early swelling stage), 85 DAS (late swelling stage), and 120 DAS (mature stage), were first profiled using transcriptome data. As shown in Fig. 4a, except for rare expression of CePIP1;2, -2;2, -2;9, and -2;10, most genes exhibited a bell-like expression pattern peaking at 85 DAS, in contrast to a gradual decrease of CePIP2;3 and -2;8. Notably, except for CePIP2;4, other genes were expressed considerably lower at 120 DAS than that at 40 DAS. For qRT-PCR confirmation of CePIP1;1, -2;1, and -2;8, seven stages were examined, i.e., 1, 5, 10, 15, 20, 25, and 35 DAI, which represent initiation, five stages of swelling, and maturation as described before[32]. As shown in Fig. 4b, two peaks were observed for all three genes, though their patterns were different. As for CePIP1;1, compared with the initiation stage (1 DAI), significant up-regulation was observed at the early swelling stage (5 DAI), followed by a gradual decrease except for the appearance of the second peak at 20 DAI, which is something different from transcriptome profiling. As for CePIP2;1, a sudden drop of transcripts first appeared at 5 DAI, then gradually increased until 20 DAI, which was followed by a gradual decrease at two late stages. The pattern of CePIP2;8 is similar to -1;1, two peaks appeared at 5 and 20 DAI and the second peak was significantly lower than the first. The difference is that the second peak of CePIP2;8 was significantly lower than the initiation stage. By contrast, the second peak (20 DAI) of CePIP2;1 was significantly higher than that of the first one (1 DAI). Nevertheless, the expression patterns of both CePIP2;1 and -2;8 are highly consistent with transcriptome profiling.

    Figure 4.  Transcript and protein abundances of CePIP genes during tuber development. (a) Transcriptome-based expression profiling of 14 CePIP genes during tuber development. The heatmap was generated using the R package implemented with a row-based standardization. Color scale represents FPKM normalized log2 transformed counts, where blue indicates low expression and red indicates high expression. (b) qRT-PCR-based expression profiling of CePIP1;1, -2;1, and -2;8 in seven representative stages of tuber development. (c) Relative protein abundance of CePIP1;1, -2;1, and -2;8 in three representative stages of tuber development. Bars indicate SD (N = 3) and uppercase letters indicate difference significance tested following Duncan's one-way multiple-range post hoc ANOVA (p < 0.01). (Ce: C. esculentus; DAI: days after tuber initiation; DAS: days after sowing; FPKM: Fragments per kilobase of exon per million fragments mapped; PIP: plasma membrane intrinsic protein).

    Since protein abundance is not always in agreement with the transcript level, protein profiles of three dominant members (i.e. CePIP1;1, -2;1, and -2;8) during tuber development were further investigated. For this purpose, we first took advantage of available proteomic data to identify CePIP proteins, i.e., leaves, roots, and four stages of tubers (freshly harvested, dried, rehydrated for 48 h, and sprouted). As shown in Supplemental Fig. S2, all three proteins were identified in both leaves and roots, whereas CePIP1;1 and -2;8 were also identified in at least one of four tested stages of tubers. Notably, all three proteins were considerably more abundant in roots, implying their key roles in root water balance.

    To further uncover their profiles during tuber development, 4D-PRM-based protein quantification was conducted in three representative stages of tuber development, i.e., 1, 25, and 35 DAI. As expected, all three proteins were identified and quantified. In contrast to gradual decrease of CePIP2;8, both CePIP1;1 and -2;1 exhibited a bell-like pattern that peaked at 25 DAI, though no significant difference was observed between 1 and 25 DAI (Fig. 4c). The trends are largely in accordance with their transcription patterns, though the reverse trend was observed for CePIP2;1 at two early stages (Fig. 4b & Fig. 4c).

    As predicted by WoLF PSORT, CePIP1;1, -2;1, and -2;8 may function in the cell membrane. To confirm the result, subcellular localization vectors named pNC-Cam1304-CePIP1;1, pNC-Cam1304-CePIP2;1, and pNC-Cam1304-CePIP2;8 were further constructed. When transiently overexpressed in tobacco leaves, green fluorescence signals of all three constructs were confined to cell membranes, highly coinciding with red fluorescence signals of the plasma membrane marker HbPIP2;3-RFP (Fig. 5).

    Figure 5.  (a) Schematic diagram of overexpressing constructs, (b) subcellular localization analysis of CePIP1;1, -2;1, and -2;8 in N. benthamiana leaves. (35S: cauliflower mosaic virus 35S RNA promoter; Ce: C. esculentus; EGFP: enhanced green fluorescent protein; kb: kilobase; NOS: terminator of the nopaline synthase gene; RFP: red fluorescent protein; PIP: plasma membrane intrinsic protein).

    Water balance is particularly important for cell metabolism and enlargement, plant growth and development, and stress responses[2,19]. As the name suggests, AQPs raised considerable interest for their high permeability to water, and plasma membrane-localized PIPs were proven to play key roles in transmembrane water transport between cells[1,18]. The first PIP was discovered in human erythrocytes, which was named CHIP28 or AQP1, and its homolog in plants was first characterized in Arabidopsis, which is known as RD28, PIP2c, or AtPIP2;3[3,7,53]. Thus far, genome-wide identification of PIP genes have been reported in a high number of plant species, including two model plants Arabidopsis and rice[10,11,1317,5456]. By contrast, little information is available on Cyperaceae, the third largest family within the monocot clade that possesses more than 5,600 species[57].

    Given the crucial roles of water balance for tuber development and crop production, in this study, tigernut, a representative Cyperaceae plant producing high amounts of oil in underground tubers[28,30,32], was employed to study PIP genes. A number of 14 PIP genes representing two phylogenetic groups (i.e., PIP1 and PIP2) or 12 orthogroups (i.e., PIP1A, PIP1B, PIP1C, PIP2A, PIP2B, PIP2C, PIP2D, PIP2E, PIP2F, PIP2G, PIP2H, and PIP2I) were identified from the tigernut genome. Though the family amounts are comparative or less than 13–21 present in Arabidopsis, cassava (Manihot esculenta), rubber tree (Hevea brasiliensis), poplar (Populus trichocarpa), C. cristatella, R. breviuscula, banana (Musa acuminata), maize (Zea mays), sorghum (Sorghum bicolor), barley (Hordeum vulgare), and switchgrass (Panicum virgatum), they are relatively more than four to 12 found in eelgrass (Zostera marina), Brachypodium distachyon, foxtail millet (Setaria italic), J. effuses, Aquilegia coerulea, papaya (Carica papaya), castor been (Ricinus communis), and physic nut (Jatropha curcas) (Supplemental Table S4). Among them, A. coerulea represents a basal eudicot that didn't experience the γ WGD shared by all core eudicots[50], whereas eelgrass is an early diverged aquatic monocot that didn't experience the τ WGD shared by all core monocots[56]. Interestingly, though both species possess two PIP1s and two PIP2s, they were shown to exhibit complex orthologous relationships of 1:1, 2:2, 1:0, and 0:1 (Supplemental Table S5). Whereas AcPIP1;1/AcPIP1;2/ZmPIP1;1/ZmPIP1;2 and ZmPIP2;1/AcPIP2;1 belong to PIP1A and PIP2A identified in this study, AcPIP2;2 and ZmPIP2;2 belong to PIP2H and PIP2I, respectively (Supplemental Table S5), implying that the last common ancestor of monocots and eudicots possesses only one PIP1 and two PIP2s followed by clade-specific expansion. A good example is the generation of AtPIP1;1 and -2;6 from AtPIP1;5 and -2;1 via the γ WGD, respectively[17].

    In tigernut, extensive expansion of the PIP subfamily was contributed by WGD (2), transposed (2), tandem (5), and dispersed duplications (3). It's worth noting that, two transposed repeats (i.e., CePIP1;1/-1;3 and CePIP2;1/-2;8) are shared by rice, implying their early origin that may be generated sometime after the split with the eudicot clade but before Cyperaceae-Poaceae divergence. By contrast, two WGD repeats (i.e., CePIP1;1/-1;2 and CePIP2;2/-2;4) are shared by C. cristatella, R. breviuscula, and J. effusus but not rice and Arabidopsis, implying that they may be derived from WGDs that occurred sometime after Cyperaceae-Poaceae split but before Cyperaceae-Juncaceae divergence. The possible WGD is the one that was described in C. littledalei[58], though the exact time still needs to be studied. Interestingly, compared with Arabidopsis (1) and rice (2), tandem/proximal duplications played a more important role in the expansion of PIP genes in tigernut (5) as well as other Cyperaceae species tested (5–6), which were shown to be Cyperaceae-specific or even species-specific. These tandem repeats may play a role in the adaptive evolution of Cyperaceae species as described in a high number of plant species[14,41]. According to comparative genomics analyses, tandem duplicates experienced stronger selective pressure than genes formed by other modes (WGD, transposed duplication, and dispersed duplication) and evolved toward biased functional roles involved in plant self-defense[41].

    As observed in most species such as Arabidopsis[10,1417], PIP genes in all Cyperaceae and Juncaceae species examined in this study, i.e., tigernut, C. cristatella, R. breviuscula, and J. effuses, feature three introns with conserved positions. By contrast, zero to three introns was not only found in rice but also in other Poaceae species such as maize, sorghum, foxtail millet, switchgrass, B. distachyon, and barley[54,55], implying lineage/species-specific evolution.

    Despite the extensive expansion of PIP genes (PIP2) in tigernut even after the split with R. breviuscula, CePIP1;1, -2;1, and -2;8 were shown to represent three dominant members in most tissues examined in this study, i.e., young leaf, mature leaf, sheath, rhizome, shoot apex, and tuber, though the situation in root is more complex. CePIP1;1 was characterized as a transposed repeat of CePIP1;3, which represents the most expressed member in root. Moreover, its recent WGD repeat CePIP1;2 was shown to be lowly expressed in most tested tissues, implying their divergence. The ortholog of CePIP1;1 in rice is OsPIP1;3 (RWC-3), which was shown to be preferentially expressed in roots, stems, and leaves, in contrast to constitutive expression of OsPIP1;1 (OsPIP1a) and -1;2[5961], two recent WGD repeats. Injecting the cRNA of OsPIP1;3 into Xenopus oocytes could increase the osmotic water permeability by 2–3 times[60], though the activity is considerably lower than PIP2s such as OsPIP2;2 and -2;2[6163]. Moreover, OsPIP1;3 was shown to play a role in drought avoidance in upland rice and its overexpression in lowland rice could increase root osmotic hydraulic conductivity, leaf water potential, and relative cumulative transpiration at the end of 10 h PEG treatment[64]. CePIP2;8 was characterized as a transposed repeat of CePIP2;1. Since their orthologs are present in both rice and Arabidopsis (Supplemental Table S3), the duplication event is more likely to occur sometime before monocot-eudicot split. Interestingly, their orthologs in rice, i.e., OsPIP2;1 (OsPIP2a) and -2;6, respectively, are also constitutively expressed[61], implying a conserved evolution with similar functions. When heterologously expressed in yeast, OsPIP2;1 was shown to exhibit high water transport activity[62,6466]. Moreover, root hydraulic conductivity was decreased by approximately four folds in OsPIP2;1 RNAi knock-down rice plants[64]. The water transport activity of OsPIP2;6 has not been tested, however, it was proven to be an H2O2 transporter that is involved in resistance to rice blast[61]. More work especially transgenic tests may improve our knowledge of the function of these key CePIP genes.

    Leaf is a photosynthetic organ that regulates water loss through transpiration. In tigernut, PIP transcripts in leaves were mainly contributed by CePIP1;1, -2;1, and -2;8, implying their key roles. During leaf development, in contrast to gradual decrease of CePIP1;1 and -2;8 transcripts in three stages (i.e. young, mature, and senescing) examined in this study, CePIP2;1 peaked in mature leaves. Their high abundance in young leaves is by cell elongation and enlargement at this stage, whereas upregulation of CePIP2;1 in mature leaves may inform its possible role in photosynthesis[67]. Thus far, a high number of CO2 permeable PIPs have been identified, e.g., AtPIP2;1, HvPIP2;1, HvPIP2;2, HvPIP2;3, HvPIP2;5, and SiPIP2;7[6870]. Moreover, in mature leaves, CePIP1;1, -2;1, and -2;8 were shown to exhibit an apparent diurnal fluctuation expression pattern that was expressed more in the day and usually peaked at noon, which reflects transpiration and the fact that PIP genes are usually induced by light[11,7173]. In rice, OsPIP2;4 and -2;5 also showed a clear diurnal fluctuation in roots that peaked at 3 h after the onset of light and dropped to a minimum 3 h after the onset of darkness[11]. Notably, further studies showed that temporal and dramatic induction of OsPIP2;5 around 2 h after light initiation was triggered by transpirational demand but not circadian rhythm[74].

    As an oil-bearing tuber crop, the main economic goal of tigernut cultivation is to harvest underground tubers, whose development is highly dependent on water available[32,75]. According to previous studies, the moisture content of immature tigernut tubers maintains more than 80.0%, followed by a seed-like dehydration process with a drop of water content to less than 50% during maturation[28,32]. Thereby, the water balance in developmental tubers must be tightly regulated. Like leaves, the majority of PIP transcripts in tubers were shown to be contributed by CePIP1;1, -2;1, and -2;8, which was further confirmed at the protein level. In accordance with the trend of water content during tuber development, mRNA, and protein abundances of CePIP1;1, -2;1, and -2;8 in initiation and swelling tubers were considerably higher than that at the mature stage. High abundances of CePIP1;1, -2;1, and -2;8 at the initiation stage reflects rapid cell division and elongation, whereas upregulation of CePIP1;1 and -2;1 at the swelling stage is in accordance with cell enlargement and active physiological metabolism such as rapid oil accumulation[28,30]. At the mature stage, downregulation of PIP transcripts and protein abundances resulted in a significant drop in the moisture content, which is accompanied by the significant accumulation of late embryogenesis-abundant proteins[23,32]. The situation is highly distinct from other tuber plants such as potato (Solanum tuberosum), which may contribute to the difference in desiccation resistance between two species[32,76]. It's worth noting that, in one study, CePIP2;1 was not detected in any of the four tested stages, i.e., freshly harvested, dried, rehydrated for 48 h, and sprouted tubers[23]. By contrast, it was quantified in all three stages of tuber development examined in this study, i.e., 1, 25, and 35 DAI (corresponding to freshly harvested tubers), which represent initiation, swelling, and maturation. One possible reason is that the protein abundance of CePIP2;1 in mature tubers is not high enough to be quantified by nanoLC-MS/MS, which is relatively less sensitive than 4D-PRM used in this study[30,46]. In fact, nanoLC-MS/MS-based proteomic analysis of 30 samples representing six tissues/stages only resulted in 2,257 distinct protein groups[23].

    Taken together, our results imply a key role of CePIP1;1, -2;1, and -2;8 in tuber water balance, however, the mechanism underlying needs to be further studied, e.g., posttranslational modifications, protein interaction patterns, and transcriptional regulators.

    To our knowledge, this is the first genome-wide characterization of PIP genes in tigernut, a representative Cyperaceae plant with oil-bearing tubers. Fourteen CePIP genes representing two phylogenetic groups or 12 orthogroups are relatively more than that present in two model plants rice and Arabidopsis, and gene expansion was mainly contributed by WGD and transposed/tandem duplications, some of which are lineage or even species-specific. Among these genes, CePIP1;1, -2;1, and -2;8 have evolved to be three dominant members that are constitutively expressed in most tissues, including leaf and tuber. Transcription of these three dominant members in leaves are subjected to development and diurnal regulation, whereas in tubers, their mRNA and protein abundances are positively correlated with the moisture content during tuber development. Moreover, their plasma membrane-localization was confirmed by subcellular localization analysis, implying that they may function in the cell membrane. These findings shall not only provide valuable information for further uncovering the mechanism of tuber water balance but also lay a solid foundation for genetic improvement by regulating these key PIP members in tigernut.

    The authors confirm contribution to the paper as follows: study conception and design, supervision: Zou Z; analysis and interpretation of results: Zou Z, Zheng Y, Xiao Y, Liu H, Huang J, Zhao Y; draft manuscript preparation: Zou Z, Zhao Y. All authors reviewed the results and approved the final version of the manuscript.

    All the relevant data is available within the published article.

    This work was supported by the Hainan Province Science and Technology Special Fund (ZDYF2024XDNY171 and ZDYF2024XDNY156), China; the National Natural Science Foundation of China (32460342, 31971688 and 31700580), China; the Project of Sanya Yazhou Bay Science and Technology City (SCKJ-JYRC-2022-66), China. The funders had no role in study design, data collection and analysis, decision to publish, or preparation of the manuscript.

  • The authors declare that they have no conflict of interest.

  • Additional file 1: Fig. S1 Nucleotide acid and deduced amino acid sequence of AgMYB1 from Apium graveolens.
    Additional file 2: Fig. S2 GUS staining (a) and PCR assay (b) of AgMYB1 with specific primers from cDNA of WT and transgenic Arabidopsis.
  • [1] Holton TA, Cornish EC. 1995. Genetics and Biochemistry of Anthocyanin Biosynthesis. The Plant Cell 7:1071−83 doi: 10.2307/3870058

    CrossRef   Google Scholar

    [2] Harborne JB. 1967. Comparative Biochemistry of the Flavonoids-IV.: Correlations between chemistry, pollen morphology and systematics in the family plumbaginaceae. Phytochemistry 6:1415−28 doi: 10.1016/S0031-9422(00)82884-8

    CrossRef   Google Scholar

    [3] Winkel-Shirley B. 2001. Flavonoid biosynthesis. A colorful model for genetics, biochemistry, cell biology, and biotechnology. Plant Physiology 126:485−93 doi: 10.1104/pp.126.2.485

    CrossRef   Google Scholar

    [4] Kähkönen MP, Heinonen M. 2003. Antioxidant activity of anthocyanins and their aglycons. Journal of Agricultural and Food Chemistry 51:628−33 doi: 10.1021/jf025551i

    CrossRef   Google Scholar

    [5] Feng K, Xu Z, Liu J, Li J, Wang F, et al. 2018. Isolation, purification, and characterization of AgUCGalT1, a galactosyltransferase involved in anthocyanin galactosylation in purple celery (Apium graveolens L.). Planta 247:1363−75 doi: 10.1007/s00425-018-2870-5

    CrossRef   Google Scholar

    [6] Hedin PA, Waage SK. 1986. Roles of flavonoids in plant resistance to insects. Progress in Clinical and Biological Research 213:87−100

    Google Scholar

    [7] Koes R, Verweij W, Quattrocchio F. 2005. Flavonoids: a colorful model for the regulation and evolution of biochemical pathways. Trends in Plant Science 10:236−42 doi: 10.1016/j.tplants.2005.03.002

    CrossRef   Google Scholar

    [8] Petroni K, Tonelli C. 2011. Recent advances on the regulation of anthocyanin synthesis in reproductive organs. Plant Science 181:219−29 doi: 10.1016/j.plantsci.2011.05.009

    CrossRef   Google Scholar

    [9] Ahmed NU, Park JI, Jung HJ, Hur Y, Nou IS. 2015. Anthocyanin biosynthesis for cold and freezing stress tolerance and desirable color in Brassica rapa. Functional & Integrative Genomics 15:383−94 doi: 10.1007/s10142-014-0427-7

    CrossRef   Google Scholar

    [10] Bassolino L, Zhang Y, Schoonbeek HJ, Kiferle C, Perata P, et al. 2013. Accumulation of anthocyanins in tomato skin extends shelf life. The New Phytologist 200:650−5 doi: 10.1111/nph.12524

    CrossRef   Google Scholar

    [11] Gould KS. 2004. Nature's Swiss Army Knife: The Diverse Protective Roles of Anthocyanins in Leaves. Journal of Biomedicine and Biotechnology 2004:314−20 doi: 10.1155/S1110724304406147

    CrossRef   Google Scholar

    [12] Roldan MVG, Engel B, de Vos RCH, Vereijken P, Astola L, et al. 2014. Metabolomics reveals organ-specific metabolic rearrangements during early tomato seedling development. Metabolomics 10:958−74 doi: 10.1007/s11306-014-0625-2

    CrossRef   Google Scholar

    [13] Bąkowska-Barczak A. 2005. Acylated anthocyanins as stable, natural food colorants − A Review. Polish Journal of Food and Nutrition Sciences 55:107−16

    Google Scholar

    [14] Reed J. 2002. Cranberry flavonoids, atherosclerosis and cardiovascular health. Critical Reviews in Food Science and Nutrition 42:301−16 doi: 10.1080/10408390209351919

    CrossRef   Google Scholar

    [15] Zafra-Stone S, Yasmin T, Bagchi M, Chatterjee A, Vinson JA, Bagchi D. 2007. Berry anthocyanins as novel antioxidants in human health and disease prevention. Molecular Nutrition and Food Research 51:675−83 doi: 10.1002/mnfr.200700002

    CrossRef   Google Scholar

    [16] He J, Giusti MM. 2010. Anthocyanins: natural colorants with health-promoting properties. Annual Review of Food Science and Technology 1:163−87 doi: 10.1146/annurev.food.080708.100754

    CrossRef   Google Scholar

    [17] Tohge T, Nishiyama Y, Hirai MY, Yano M, Nakajima J, et al. 2005. Functional genomics by integrated analysis of metabolome and transcriptome of Arabidopsis plants over-expressing an MYB transcription factor. The Plant Journal 42:218−35 doi: 10.1111/j.1365-313X.2005.02371.x

    CrossRef   Google Scholar

    [18] Deluc L, Barrieu F, Marchive C, Lauvergeat V, Decendit A, et al. 2006. Characterization of a grapevine R2R3-MYB transcription factor that regulates the phenylpropanoid pathway. Plant Physiology 140:499−511 doi: 10.1104/pp.105.067231

    CrossRef   Google Scholar

    [19] Xu Z, Huang Y, Wang F, Song X, Wang G, et al. 2014. Transcript profiling of structural genes involved in cyanidin-based anthocyanin biosynthesis between purple and non-purple carrot (Daucus carota L.) cultivars reveals distinct patterns. BMC Plant Biology 14:262 doi: 10.1186/s12870-014-0262-y

    CrossRef   Google Scholar

    [20] Xu W, Dubos C, Lepiniec L. 2015. Transcriptional control of flavonoid biosynthesis by MYB-bHLH-WDR complexes. Trends in Plant Science 20:176−85 doi: 10.1016/j.tplants.2014.12.001

    CrossRef   Google Scholar

    [21] Gao Y, Liu J, Chen Y, Tang H, Wang Y, et al. 2018. Tomato SlAN11 regulates flavonoid biosynthesis and seed dormancy by interaction with bHLH proteins but not with MYB proteins. Horticulture Research 5:27 doi: 10.1038/s41438-018-0032-3

    CrossRef   Google Scholar

    [22] Feyissa DN, Løvdal T, Olsen KM, Slimestad R, Lillo C. 2009. The endogenous GL3, but not EGL3, gene is necessary for anthocyanin accumulation as induced by nitrogen depletion in Arabidopsis rosette stage leaves. Planta 230:747−754 doi: 10.1007/s00425-009-0978-3

    CrossRef   Google Scholar

    [23] Xu WJ, Grain D, Le Gourrierec J, Harscoet E, Berger A, et al. 2013. Regulation of flavonoid biosynthesis involves an unexpected complex transcriptional regulation of TT8 expression, in Arabidopsis. New Phytologist 198:59−70 doi: 10.1111/nph.12142

    CrossRef   Google Scholar

    [24] Gonzalez A, Zhao M, Leavitt JM, Lloyd AM. 2008. Regulation of the anthocyanin biosynthetic pathway by the TTG1/bHLH/Myb transcriptional complex in Arabidopsis seedlings. The Plant Journal 53:814−27 doi: 10.1111/j.1365-313X.2007.03373.x

    CrossRef   Google Scholar

    [25] Dubos C, Stracke R, Grotewold E, Weisshaar B, Martin C, Lepiniec L. 2010. MYB transcription factors in Arabidopsis. Trends in Plant Science 15:573−81 doi: 10.1016/j.tplants.2010.06.005

    CrossRef   Google Scholar

    [26] Feller A, Machemer K, Braun EL, Grotewold E. 2011. Evolutionary and comparative analysis of MYB and bHLH plant transcription factors. The Plant Journal 66:94−116 doi: 10.1111/j.1365-313X.2010.04459.x

    CrossRef   Google Scholar

    [27] Kwon SJ, Choi EY, Seo JB, Park OK. 2007. Isolation of the Arabidopsis phosphoproteome using a biotin - tagging approach. Molecules and Cells 24:268−75

    Google Scholar

    [28] Gou JY, Felippes FF, Liu CJ, Weigel D, Wang JW. 2011. Negative Regulation of Anthocyanin Biosynthesis in Arabidopsis by a miR156-Targeted SPL Transcription Factor. The Plant Cell 23:1512−22 doi: 10.1105/tpc.111.084525

    CrossRef   Google Scholar

    [29] Baudry A, Caboche M, Lepiniec L. 2006. TT8 controls its own expression in a feedback regulation involving TTG1 and homologous MYB and bHLH factors, allowing a strong and cell-specific accumulation of flavonoids in Arabidopsis thaliana. The Plant Journal 46:768−79 doi: 10.1111/j.1365-313X.2006.02733.x

    CrossRef   Google Scholar

    [30] Rowan DD, Cao MS, Lin-Wang K, Cooney JM, Jensen DJ, et al. 2009. Environmental regulation of leaf colour in red 35S:PAP1 Arabidopsis thaliana. New Phytologist 182:102−15 doi: 10.1111/j.1469-8137.2008.02737.x

    CrossRef   Google Scholar

    [31] Hsu CC, Chen YY, Tsai WC, Chen WH, Chen HH. 2015. Three R2R3-MYB transcription factors regulate distinct floral pigmentation patterning in Phalaenopsis spp. Plant Physiology 168:175−91 doi: 10.1104/pp.114.254599

    CrossRef   Google Scholar

    [32] Li M, Hou X, Wang F, Tan G, Xu Z, et al. 2018. Advances in the research of celery, an important Apiaceae vegetable crop. Critical Reviews in Biotechnology 38:172−83 doi: 10.1080/07388551.2017.1312275

    CrossRef   Google Scholar

    [33] Nagella P, Ahmad A, Kim SJ, Chung IM. 2012. Chemical composition, antioxidant activity and larvicidal effects of essential oil from leaves of Apium graveolens. Immunopharmacology and immunotoxicology 34:205−9 doi: 10.3109/08923973.2011.592534

    CrossRef   Google Scholar

    [34] Dianat M, Veisi A, Ahangarpour A, Fathi Moghaddam H. 2015. The effect of hydro-alcoholic celery (Apium graveolens) leaf extract on cardiovascular parameters and lipid profile in animal model of hypertension induced by fructose. Avicenna journal of phytomedicine 5:203−9

    Google Scholar

    [35] Huang W, Wang G, Li H, Wang F, Xu Z, et al. 2016. Transcriptional profiling of genes involved in ascorbic acid biosynthesis, recycling, and degradation during three leaf developmental stages in celery. Molecular Genetics and Genomics 291:2131−43 doi: 10.1007/s00438-016-1247-3

    CrossRef   Google Scholar

    [36] Feng K, Liu J, Duan A, Li T, Yang Q, et al. 2018. AgMYB2 transcription factor is involved in the regulation of anthocyanin biosynthesis in purple celery (Apium graveolens L.). Planta 248:1249−61 doi: 10.1007/s00425-018-2977-8

    CrossRef   Google Scholar

    [37] Feng K, Hou X, Li M, Jiang Q, Xu Z, et al. 2018. CeleryDB: a genomic database for celery. Database 2018:bay070 doi: 10.1093/database/bay070

    CrossRef   Google Scholar

    [38] Li M, Feng K, Hou X, Jiang Q, Xu Z, et al. 2020. The genome sequence of celery (Apium graveolens L.), an important leaf vegetable crop rich in apigenin in the Apiaceae family. Horticulture Research 7:9 doi: 10.1038/s41438-019-0235-2

    CrossRef   Google Scholar

    [39] Rhee SY, Beavis W, Berardini TZ, Chen G, Dixon D, et al. 2003. The Arabidopsis Information Resource (TAIR): a model organism database providing a centralized, curated gateway to Arabidopsis biology, research materials and community. Nucleic Acids Research 31:224−8 doi: 10.1093/nar/gkg076

    CrossRef   Google Scholar

    [40] Tamura K, Peterson D, Peterson N, Stecher G, Nei M, et al. 2011. MEGA5: molecular evolutionary genetics analysis using maximum likelihood, evolutionary distance, and maximum parsimony methods. Molecular Biology and Evolution 28:2731−9 doi: 10.1093/molbev/msr121

    CrossRef   Google Scholar

    [41] Larkin MA, Blackshields G, Brown NP, Chenna R, McGettigan PA, et al. 2007. Clustal W and Clustal X version 2.0. Bioinformatics 23:2947−8 doi: 10.1093/bioinformatics/btm404

    CrossRef   Google Scholar

    [42] Tian J, Peng Z, Zhang J, Song T, Wan H, et al. 2015. McMYB10 regulates coloration via activating McF3'H and later structural genes in ever-red leaf crabapple. Plant Biotechnology Journal 13:948−61 doi: 10.1111/pbi.12331

    CrossRef   Google Scholar

    [43] Lim SH, Song JH, Kim DH, Kim JK, Lee JY, et al. 2016. Activation of anthocyanin biosynthesis by expression of the radish R2R3-MYB transcription factor gene RsMYB1. Plant Cell Reports 35:641−53 doi: 10.1007/s00299-015-1909-3

    CrossRef   Google Scholar

    [44] Xu Z, Feng K, Que F, Wang F, Xiong A. 2017. A MYB transcription factor, DcMYB6, is involved in regulating anthocyanin biosynthesis in purple carrot taproots. Scientific Reports 7:45324 doi: 10.1038/srep45324

    CrossRef   Google Scholar

    [45] Schmittgen TD, Livak KJ. 2008. Analyzing real-time PCR data by the comparative CT method. Nature protocols 3:1101−8 doi: 10.1038/nprot.2008.73

    CrossRef   Google Scholar

    [46] Li M, Wang F, Jiang Q, Wang G, Tian C, et al. 2016. Validation and Comparison of Reference Genes for qPCR Normalization of Celery (Apium graveolens) at Different Development Stages. Frontiers in Plant Science 7:313 doi: 10.3389/fpls.2016.00313

    CrossRef   Google Scholar

    [47] Sparkes IA, Runions J, Kearns A, Hawes C. 2006. Rapid, transient expression of fluorescent fusion proteins in tobacco plants and generation of stably transformed plants. Nature Protocols 1:2019−25 doi: 10.1038/nprot.2006.286

    CrossRef   Google Scholar

    [48] Espley RV, Hellens RP, Putterill J, Stevenson DE, Kutty-Amma S, et al. 2007. Red colouration in apple fruit is due to the activity of the MYB transcription factor, MdMYB10. The Plant Journal 49:414−27 doi: 10.1111/j.1365-313X.2006.02964.x

    CrossRef   Google Scholar

    [49] Zhang X, Henriques R, Lin SS, Niu Q, Chua NH. 2006. Agrobacterium-mediated transformation of Arabidopsis thaliana using the floral dip method. Nature Protocols 1:641−6 doi: 10.1038/nprot.2006.97

    CrossRef   Google Scholar

    [50] Jefferson RA, Kavanagh TA, Bevan MW. 1987. Gus Fusions: Beta-Glucuronidase as a Sensitive And Versatile Gene Fusion Marker In Higher-Plants. The EMBO Journal 6:3901−7 doi: 10.1002/j.1460-2075.1987.tb02730.x

    CrossRef   Google Scholar

    [51] Lee HS, Wicker L. 1991. Anthocyanin Pigments In the Skin Of Lychee Fruit. Journal of Food Science 56:466−8 doi: 10.1111/j.1365-2621.1991.tb05305.x

    CrossRef   Google Scholar

    [52] Li Y, Mao K, Zhao C, Zhao X, Zhang H, et al. 2012. MdCOP1 ubiquitin E3 ligases interact with MdMYB1 to regulate light-induced anthocyanin biosynthesis and red fruit coloration in apple. Plant Physiology 160:1011−22 doi: 10.1104/pp.112.199703

    CrossRef   Google Scholar

    [53] Feng K, Xu Z, Que F, Liu J, Wang F, et al. 2018. An R2R3-MYB transcription factor, OjMYB1, functions in anthocyanin biosynthesis in Oenanthe javanica. Planta 247:301−15 doi: 10.1007/s00425-017-2783-8

    CrossRef   Google Scholar

    [54] Gietz RD, Schiestl RH. 2007. High-efficiency yeast transformation using the LiAc/SS carrier DNA/PEG method. Nature Protocols 2:31−4 doi: 10.1038/nprot.2007.13

    CrossRef   Google Scholar

    [55] Benzie IFF, Szeto YT. 1999. Total antioxidant capacity of teas by the ferric reducing/antioxidant power assay. Journal of Agricultural and Food Chemistry 47:633−6 doi: 10.1021/jf9807768

    CrossRef   Google Scholar

    [56] Borevitz JO, Xia Y, Blount J, Dixon RA, Lamb C. 2000. Activation tagging identifies a conserved MYB regulator of phenylpropanoid biosynthesis. The Plant Cell 12:2383−94 doi: 10.1105/tpc.12.12.2383

    CrossRef   Google Scholar

    [57] Clotault J, Peltier D, Berruyer R, Thomas M, Briard M, et al. 2008. Expression of carotenoid biosynthesis genes during carrot root development. Journal of Experimental Botany 59:3563−73 doi: 10.1093/jxb/ern210

    CrossRef   Google Scholar

    [58] Hatlestad GJ, Sunnadeniya RM, Akhavan NA, Gonzalez A, Goldman IL, et al. 2012. The beet R locus encodes a new cytochrome P450 required for red betalain production. Nature Genetics 44:816−20 doi: 10.1038/ng.2297

    CrossRef   Google Scholar

    [59] Jin W, Wang H, Li M, Wang J, Yang Y, et al. 2016. The R2R3 MYB transcription factor PavMYB10.1 involves in anthocyanin biosynthesis and determines fruit skin colour in sweet cherry (Prunus avium L.). Plant Biotechnology Journal 14:2120−33 doi: 10.1111/pbi.12568

    CrossRef   Google Scholar

    [60] Tan GF, Wang F, Ma J, Zhang X, Xiong A. 2017. Analysis of anthocyanin and apigenin contents and the expression profiles of biosynthesis-related genes in the purple and non-purple varieties of celery. Acta Horticulturae Sinica 44:1327−34 doi: 10.16420/j.issn.0513-353x.2017-0221

    CrossRef   Google Scholar

    [61] Appelhagen I, Jahns O, Bartelniewoehner L, Sagasser M, Weisshaar B, et al. 2011. Leucoanthocyanidin Dioxygenase in Arabidopsis thaliana: characterization of mutant alleles and regulation by MYB-BHLH-TTG1 transcription factor complexes. Gene 484:61−8 doi: 10.1016/j.gene.2011.05.031

    CrossRef   Google Scholar

    [62] Sapir M, Oren-Shamir M, Ovadia R, Reuveni M, Evenor D, et al. 2008. Molecular aspects of Anthocyanin fruit tomato in relation to high pigment-1. Journal of Heredity 99:292−303 doi: 10.1093/jhered/esm128

    CrossRef   Google Scholar

    [63] Stracke R, Werber M, Weisshaar B. 2001. The R2R3-MYB gene family in Arabidopsis thaliana. Current Opinion in Plant Biology 4:447−56 doi: 10.1016/S1369-5266(00)00199-0

    CrossRef   Google Scholar

    [64] Zimmermann IM, Heim MA, Weisshaar B, Uhrig JF. 2004. Comprehensive identification of Arabidopsis thaliana MYB transcription factors interacting with R/B-like BHLH proteins. The Plant Journal 40:22−34 doi: 10.1111/j.1365-313X.2004.02183.x

    CrossRef   Google Scholar

    [65] Lin-Wang K, Bolitho K, Grafton K, Kortstee A, Karunairetnam S, et al. 2010. An R2R3 MYB transcription factor associated with regulation of the anthocyanin biosynthetic pathway in Rosaceae. BMC Plant Biology 10:50 doi: 10.1186/1471-2229-10-50

    CrossRef   Google Scholar

    [66] Vogt T, Jones P. 2000. Glycosyltransferases in plant natural product synthesis: characterization of a supergene family. Trends in Plant Science 5:380−6 doi: 10.1016/S1360-1385(00)01720-9

    CrossRef   Google Scholar

    [67] Outchkourov NS, Karlova R, Hölscher M, Schrama X, Blilou I, et al. 2018. Transcription Factor-Mediated Control of Anthocyanin Biosynthesis in Vegetative Tissues. Plant Physiology 176:1862−78 doi: 10.1104/pp.17.01662

    CrossRef   Google Scholar

    [68] Chun OK, Kim DO, Lee CY. 2003. Superoxide radical scavenging activity of the major polyphenols in fresh plums. Journal of Agricultural and Food Chemistry 51:8067−72 doi: 10.1021/jf034740d

    CrossRef   Google Scholar

    [69] Butelli E, Titta L, Giorgio M, Mock HP, Matros A, et al. 2008. Enrichment of tomato fruit with health-promoting anthocyanins by expression of select transcription factors. Nature Biotechnology 26:1301−8 doi: 10.1038/nbt.1506

    CrossRef   Google Scholar

    [70] Cavagnaro PF, Iorizzo M, Yildiz M, Senalik D, Parsons J, et al. 2014. A gene-derived SNP-based high resolution linkage map of carrot including the location of QTL conditioning root and leaf anthocyanin pigmentation. BMC Genomics 15:1118 doi: 10.1186/1471-2164-15-1118

    CrossRef   Google Scholar

    [71] Iorizzo M, Cavagnaro PF, Bostan H, Zhao Y, Zhang J, et al. 2018. A Cluster of MYB Transcription Factors Regulates Anthocyanin Biosynthesis in Carrot (Daucus carota L.) Root and Petiole. Frontiers in Plant Science 9:1927 doi: 10.3389/fpls.2018.01927

    CrossRef   Google Scholar

    [72] Xu Z, Yang Q, Feng K, Xiong A. 2019. Changing Carrot Color: Insertions in DcMYB7 Alter the Regulation of Anthocyanin Biosynthesis and Modification. Plant Physiology 181:195−207 doi: 10.1104/pp.19.00523

    CrossRef   Google Scholar

  • Cite this article

    Feng K, Xing G, Liu J, Wang H, Tan G, et al. 2021. AgMYB1, an R2R3-MYB factor, plays a role in anthocyanin production and enhancement of antioxidant capacity in celery. Vegetable Research 1: 2 doi: 10.48130/VR-2021-0002
    Feng K, Xing G, Liu J, Wang H, Tan G, et al. 2021. AgMYB1, an R2R3-MYB factor, plays a role in anthocyanin production and enhancement of antioxidant capacity in celery. Vegetable Research 1: 2 doi: 10.48130/VR-2021-0002

Figures(10)  /  Tables(1)

Article Metrics

Article views(6154) PDF downloads(1164)

ARTICLE   Open Access    

AgMYB1, an R2R3-MYB factor, plays a role in anthocyanin production and enhancement of antioxidant capacity in celery

Vegetable Research  1 Article number: 2  (2021)  |  Cite this article

Abstract: Celery is rich in nutrients and cultivated worldwide. Anthocyanins are natural plant pigments with high antioxidant capabilities in the human diet. The accumulation of anthocyanins in celery results in the purple skin color of petioles. Here, an R2R3-MYB transcription factor (TFs), AgMYB1, was cloned from purple-skin celery. Phylogenetic analysis revealed that AgMYB1 belongs to the anthocyanin branch. Sequence alignment showed that AgMYB1 contains multiple anthocyanin-related motifs. Consistent with the activating role in anthocyanin production, AgMYB1 showed higher transcriptions in purple celery compared with non-purple celery. Transient expression of AgMYB1 in tobacco leaves promoted the accumulation of anthocyanins and produced red pigments in leaves. Heterologous expression of AgMYB1 in Arabidopsis activates anthocyanin production and generates dark-purple plants. The enhancement of anthocyanin biosynthetic genes transcripts and glycosylation capacities in transgenic Arabidopsis verified the activating roles of AgMYB1 at the gene and protein level, respectively. The antioxidant capacity of transgenic Arabidopsis was also increased compared to wild type Arabidopsis. Additionally, yeast two-hybrid assay proved that AgMYB1 interacted with bHLH TFs to regulate anthocyanin biosynthesis. Our results show that the overexpression of single R2R3-MYB gene, AgMYB1, without co-expression of other TFs, can improve anthocyanin production and antioxidant capacity in transgenic plants. This study presents new information for anthocyanin regulatory mechanisms in purple celery and provides a strategy for cultivating plants with high levels of anthocyanins.

  • Anthocyanins are important pigments with multiple biological functions in plants[1]. By the activity of six aglycones (cyanidin, petunidin, peonidin, pelargonidin, delphinidin, and malvidin) and multiple chemical modifications (glycosylation, acylation, and methylation), anthocyanins exhibit various colors in plants[25]. The accumulation of anthocyanins also impacts many other biological processes, such as UV-light protection, insect attraction, biological and other abiotic stress (low-temperature, drought, and salt) defenses, not just in tissue coloration[69].

    Anthocyanins are ubiquitous in plant seeds, roots, fruits, and flowers and are also known as effective antioxidants[10]. It was reported that anthocyanins were generated in vegetative tissues for scavenging reactive oxygen species under stress conditions[11, 12]. Furthermore, anthocyanins play multiple roles in the human diet and food consumption[13]. Anthocyanins are effective antioxidants that can reduce the incidence of diseases such as cancer, atherosclerosis, and cardiopathy[1416].

    Given the importance of anthocyanins in plant development and the human diet, anthocyanin biosynthesis has been extensively studied in many higher plants, such as carrot, Arabidopsis, and grape[1719]. In anthocyanin pathways, the early biosynthetic genes (EBGs) including chalcone isomerase (CHI), chalcone synthase (CHS), flavonoid 3’-hydroxylase (F3’H), and flavanone 3-hydroxylase (F3H) are responsible for the production of flavonoid precursors. The late biosynthetic genes (LBGs) of anthocyanin include dihydroflavonol 4-reductase (DFR), leucoanthocyanidin dioxygenase (LDOX), and flavonoid 3-O-glycosyltransferase (UFGT)[20]. The expression levels of structural genes are often positively associated with anthocyanin content in plants[19]. Previous studies have demonstrated that the expression of anthocyanin biosynthetic genes were activated by the R2R3-MYB, basic helix-loop-helix (bHLH), and WD40 repeat protein complex (MBW)[20, 21]. At the transcriptional level, MBW complex regulates anthocyanin production by interacting with the DNA-binding sites[22, 23]. The R2R3-MYB transcription factors in Arabidopsis could be divided into different subgroups and the members in subgroup 6 function in the regulation of anthocyanins[24, 25]. The post-translational mechanisms of MBW complex also play important roles in anthocyanin regulation, such as phosphorylation and cysteine nitrosylation[2628]. MBW-mediated anthocyanin regulation is also influenced by both developmental and physiological factors in higher plants[29, 30]. Moreover, the R2R3-MYB transcription factors (TFs) are the key regulators of MBW complex determining the tissue coloration of plants. R2R3-MYB (PeMYB2, PeMYB11, and PeMYB12) TFs activate the downstream structural genes to promote the formation of anthocyanin in Phalaenopsis spp[31].

    Celery (Apium graveolens L.), an important vegetable crop of the Apiaceae family, is cultivated worldwide[32]. Celery has medicinal value and abundant phytochemical nutrients, such as cellulose, vitamins, and flavonoids[3335]. Purple celery accumulates anthocyanins in the petioles and its skin appears purple[5]. The functions of AgMYB2 in the regulation of anthocyanin biosynthesis have been investigated in previous research[36]. In this study, another R2R3-MYB TF in S6 subgroup, AgMYB1, was identified from purple celery and its role in controlling anthocyanin biosynthesis was also determined.

  • ‘Liuhe huangxin celery’ (Q1) is a landrace with yellow-green leaves from Nanjing, China. ‘Nanxuan liuhe purple celery’ (PQ1) has purple petioles (Fig. 1). Nicotiana benthamiana and Columbia ecotype of Arabidopsis thaliana were used for functional verification. The seeds of celery, N. benthamiana, and A. thaliana were stored in the State Key Laboratory of Crop Genetics and Germplasm Enhancement (Nanjing Agricultural University; 32°04′ N, 118°85′ E). Plant materials were cultivated in an artificial climatic chamber with the conditions as previously described[5].

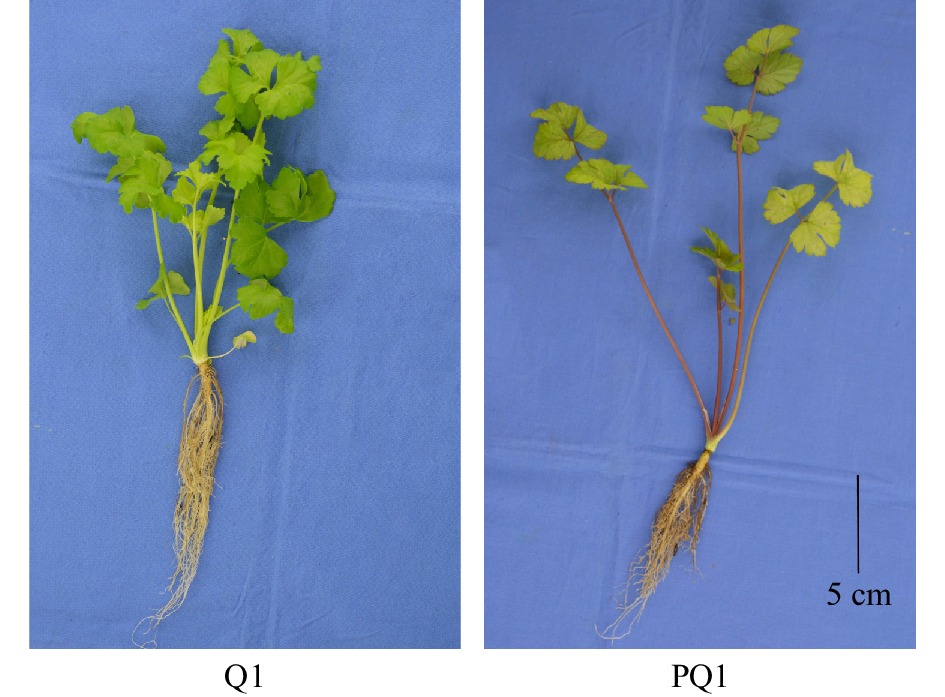
    Figure 1.  Phenotypes of different celery varieties. The black line at the right corner represents 5 cm in that pixel. Q1, ‘Liuhe huangxin celery’; PQ1, ‘Nanxuan liuhe purple celery’.

  • RNA was extracted from celery, Arabidopsis, and tobacco plants using an RNAsimple Total RNA Kit (Tiangen, Beijing, China). cDNA was synthesized using Prime-Script RT reagent Kit (TaKaRa, Dalian, China) according to the product manual. cDNA was stored for further gene cloning and quantitative real-time PCR (RT-qPCR) assays.

  • The sequences of MYB transcription factors in celery were downloaded from CeleryDB, a genomic database for celery (http://apiaceae.njau.edu.cn/celerydb)[37, 38]. The sequences of 126 Arabidopsis R2R3-MYB transcription factors were obtained from TAIR (http://www.arabidopsis.org)[39]. The amino acid sequences of the above MYB transcription factors were used to construct the phylogenetic tree using MEGA 5.0[40]. The MYB transcription factors in celery were divided into various subgroups based on the phylogenetic relationships with Arabidopsis R2R3-MYB[25].

  • The predicted AgMYB1 gene was amplified with special primers (Forward: 5'-ATGAAGAGTGGCAACGCTTCAAAG-3'; Reverse: 5'-TTAATTATCATCTGCTGGATTTAGA-3') and subsequently cloned into pMD-19 vector (Takara). The positive plasmid was verified for further sequencing (Genscript, Nanjing, China). The sequence alignments of anthocyanin-related R2R3-MYB proteins were achieved using Clustal X[41]. The phylogenetic analysis of different R2R3-MYB TFs was performed using MEGA 5.0 software[40]. The phylogenetic tree was constructed using the neighbor-joining method and the reliability was set to 1000 bootstrap replicates.

  • The expression levels of various genes in plants were detected by RT-qPCR assay. The RT-qPCR primers (Forward: 5'-AACAGATGGTCACTAATCGGTGGAAG-3'; Reverse: 5'-CAGCAGTAGTTGGAGCAATGTAACG-3') of AgMYB1 gene were designed using Primer Premier 6.0 software. RT-qPCR primers of anthocyanin-related structural genes in Arabidopsis and tobacco followed the methods used in previous studies[4244]. RT-qPCR assay was performed with SYBR Premix Ex Taq (TaKaRa, Dalian, China) and conducted on a CFX96 Real-Time PCR system (Bio-Rad) following the manufacturer’s instructions. The relative gene expression values were calculated using Schmittgen's method[45]. The AgTUB-B, AtActin2, and NtActin genes were selected as the internal control for celery, Arabidopsis, and tobacco, respectively[46]. Each sample was performed with three biological replicates.

  • In order to verify the activating role of AgMYB1 in anthocyanin production, the transient expression assay was conducted as previously described[47, 48]. The AgMYB1 gene was amplified with specific primers (Forward: 5'-TTTACAATTACCATGGGATCCATGAAGAGTGGCAACGCTTCAAAG-3'; Reverse: 5'-ACCGATGATACGAACGAGCTCTTAATTATCATCTGCTGGATTTAGA-3'). AgMYB1 and previously reported AgMYB2 were cloned into binary vector pCAMBIA-1301 between the Bam HI and Sac I sites. The recombinant pCAMBIA-1301 vector containing entire AgMYB1 or AgMYB2 was transformed into Agrobacterium tumefaciens strain GV3101 (pSoup-p19). The A. tumefaciens strain hosting AgMYB1 and AgMYB2 was infiltrated into the tobacco leaves, respectively. Three independent replicates were performed for each infiltration. After 10-day growth, the samples of tobacco leaf were collected for anthocyanin determination and RNA extraction.

  • The genetic transformation assay of AgMYB1 gene in Arabidopsis plants was performed following the floral-dip method[49]. The transgenic Arabidopsis harboring AgMYB1 gene was confirmed using the β-glucuronidase (GUS) assay[50] and polymerase chain reaction (PCR) amplification with special primers (Forward: 5'-ATGAAGAGTGGCAACGCTTCAAAG-3'; Reverse: 5'-AAGCACAACAAATGGTACAAG-3').

  • Total anthocyanins were extracted following previous methods, with some modification[51]. The whole plants of 35-day-old Arabidopsis were collected and used for anthocyanin extraction and determination. Briefly, the plant samples of Arabidopsis and tobacco were ground in liquid nitrogen. The powder samples were transferred to an extraction solution and extracted overnight at room temperature in the dark. The extracting solution was centrifuged at 15,294 g for 10 min at 4 °C to remove sediment. The absorbance of extraction at 530, 620, and 650 nm were determined using a spectrophotometer. The normalized optical density (OD) of anthocyanin was calculated based on the formula:

    OD = (OD530−OD620) − 0.1 × (OD650 − OD620)

    And the total anthocyanin content was calculated based on the normalized OD and expressed by cyanidin 3-O-galactoside equivalents in 100 g fresh weight (mg/100 g FW)[52]. The extraction and measurements were conducted for three biological replicates.

  • To determine the glycosylation capacity of wild type (WT) and transgenic Arabidopsis plants, the glycosylation products catalyzed by crude enzymes were detected. Approximately 0.2 g of fresh samples of WT and transgenic Arabidopsis plants were used for the extraction of crude enzymes. The extraction of crude enzymes and determination of glycosylation capacity was carried out following previous methods[53]. The relative glycosylation capacity of Arabidopsis crude enzyme was calculated based on the peak area of the glycosylation product. The measurement was performed with three biological replicates.

  • Yeast two hybrid (Y2H) assay of AgMYB1 and bHLH (AgbHLH2, AtTT8, and AtEGL3) proteins were performed according to the Matchmaker Gold Yeast Two-Hybrid System (Clontech, http://www.takarabio.com). AgMYB1 was fused with the pGADT7 vector between Eco RI and Xho I sites with specific primers (Forward: 5'-GCCATGGAGGCCAGTGAATTCATGAAGAGTGGCAACGCTTCAAAG-3'; Reverse: 5'-ACGATTCATCTGCAGCTCGAGTTAATTATCATCTGCTGGATTTAGA-3'). As previously reported, AgMYB2 and bHLH TFs were cloned into pGADT7 and pGBKT7 vectors, respectively[36]. Using Gietz’s method, the recombinant vector and empty vector were co-transformed into the Y2HGold yeast strain[54]. The transformed yeast cells were photographed following 3 days of incubation.

  • The ferric reducing/antioxidant power (FRAP) is a typical method used to determine plant antioxidant capacity[55]. The total antioxidant capacity of Arabidopsis plants was measured using Total Antioxidant Capacity Assay Kit with FRAP method (Beyotime Institute of Biotechnology, Nanjing, China) based on the manufacturer’s instructions. Total antioxidant capacity quantities are represented in the FeSO4 concentration equivalents per g fresh weight (mM/g FW). Each sample was conducted for three biological replicates.

  • The Duncan’s multiple-range test (at a 0.05 significance level) was used to compare the differences of gene expressions and anthocyanin content. Statistical analysis was carried out using SPSS software Version 17.0.

  • According to the genomic sequence in CeleryDB, 154 MYB transcription factors were identified from celery[37, 38]. The phylogenetic tree was constructed using the sequences of MYB transcription factors in celery and Arabidopsis (Fig. 2). The celery MYB transcription factors were classified into different subgroups based on the previous results found in Arabidopsis[25]. In Arabidopsis, the functions of different subgroups of R2R3-MYB factors were diverse. The subgroup 6 of Arabidopsis R2R3-MYB includes AtMYB75, AtMYB90, AtMYB113, and AtMYB114, which are involved in the regulation of anthocyanin biosynthesis[24, 56]. Phylogenetic tree analysis showed that there were two celery MYB transcription factors, Agr10145 and Agr41800, in the S6 subgroup, namely AgMYB1 and AgMYB2 respectively. We suggest that these two transcription factors are related to anthocyanin accumulation in celery.

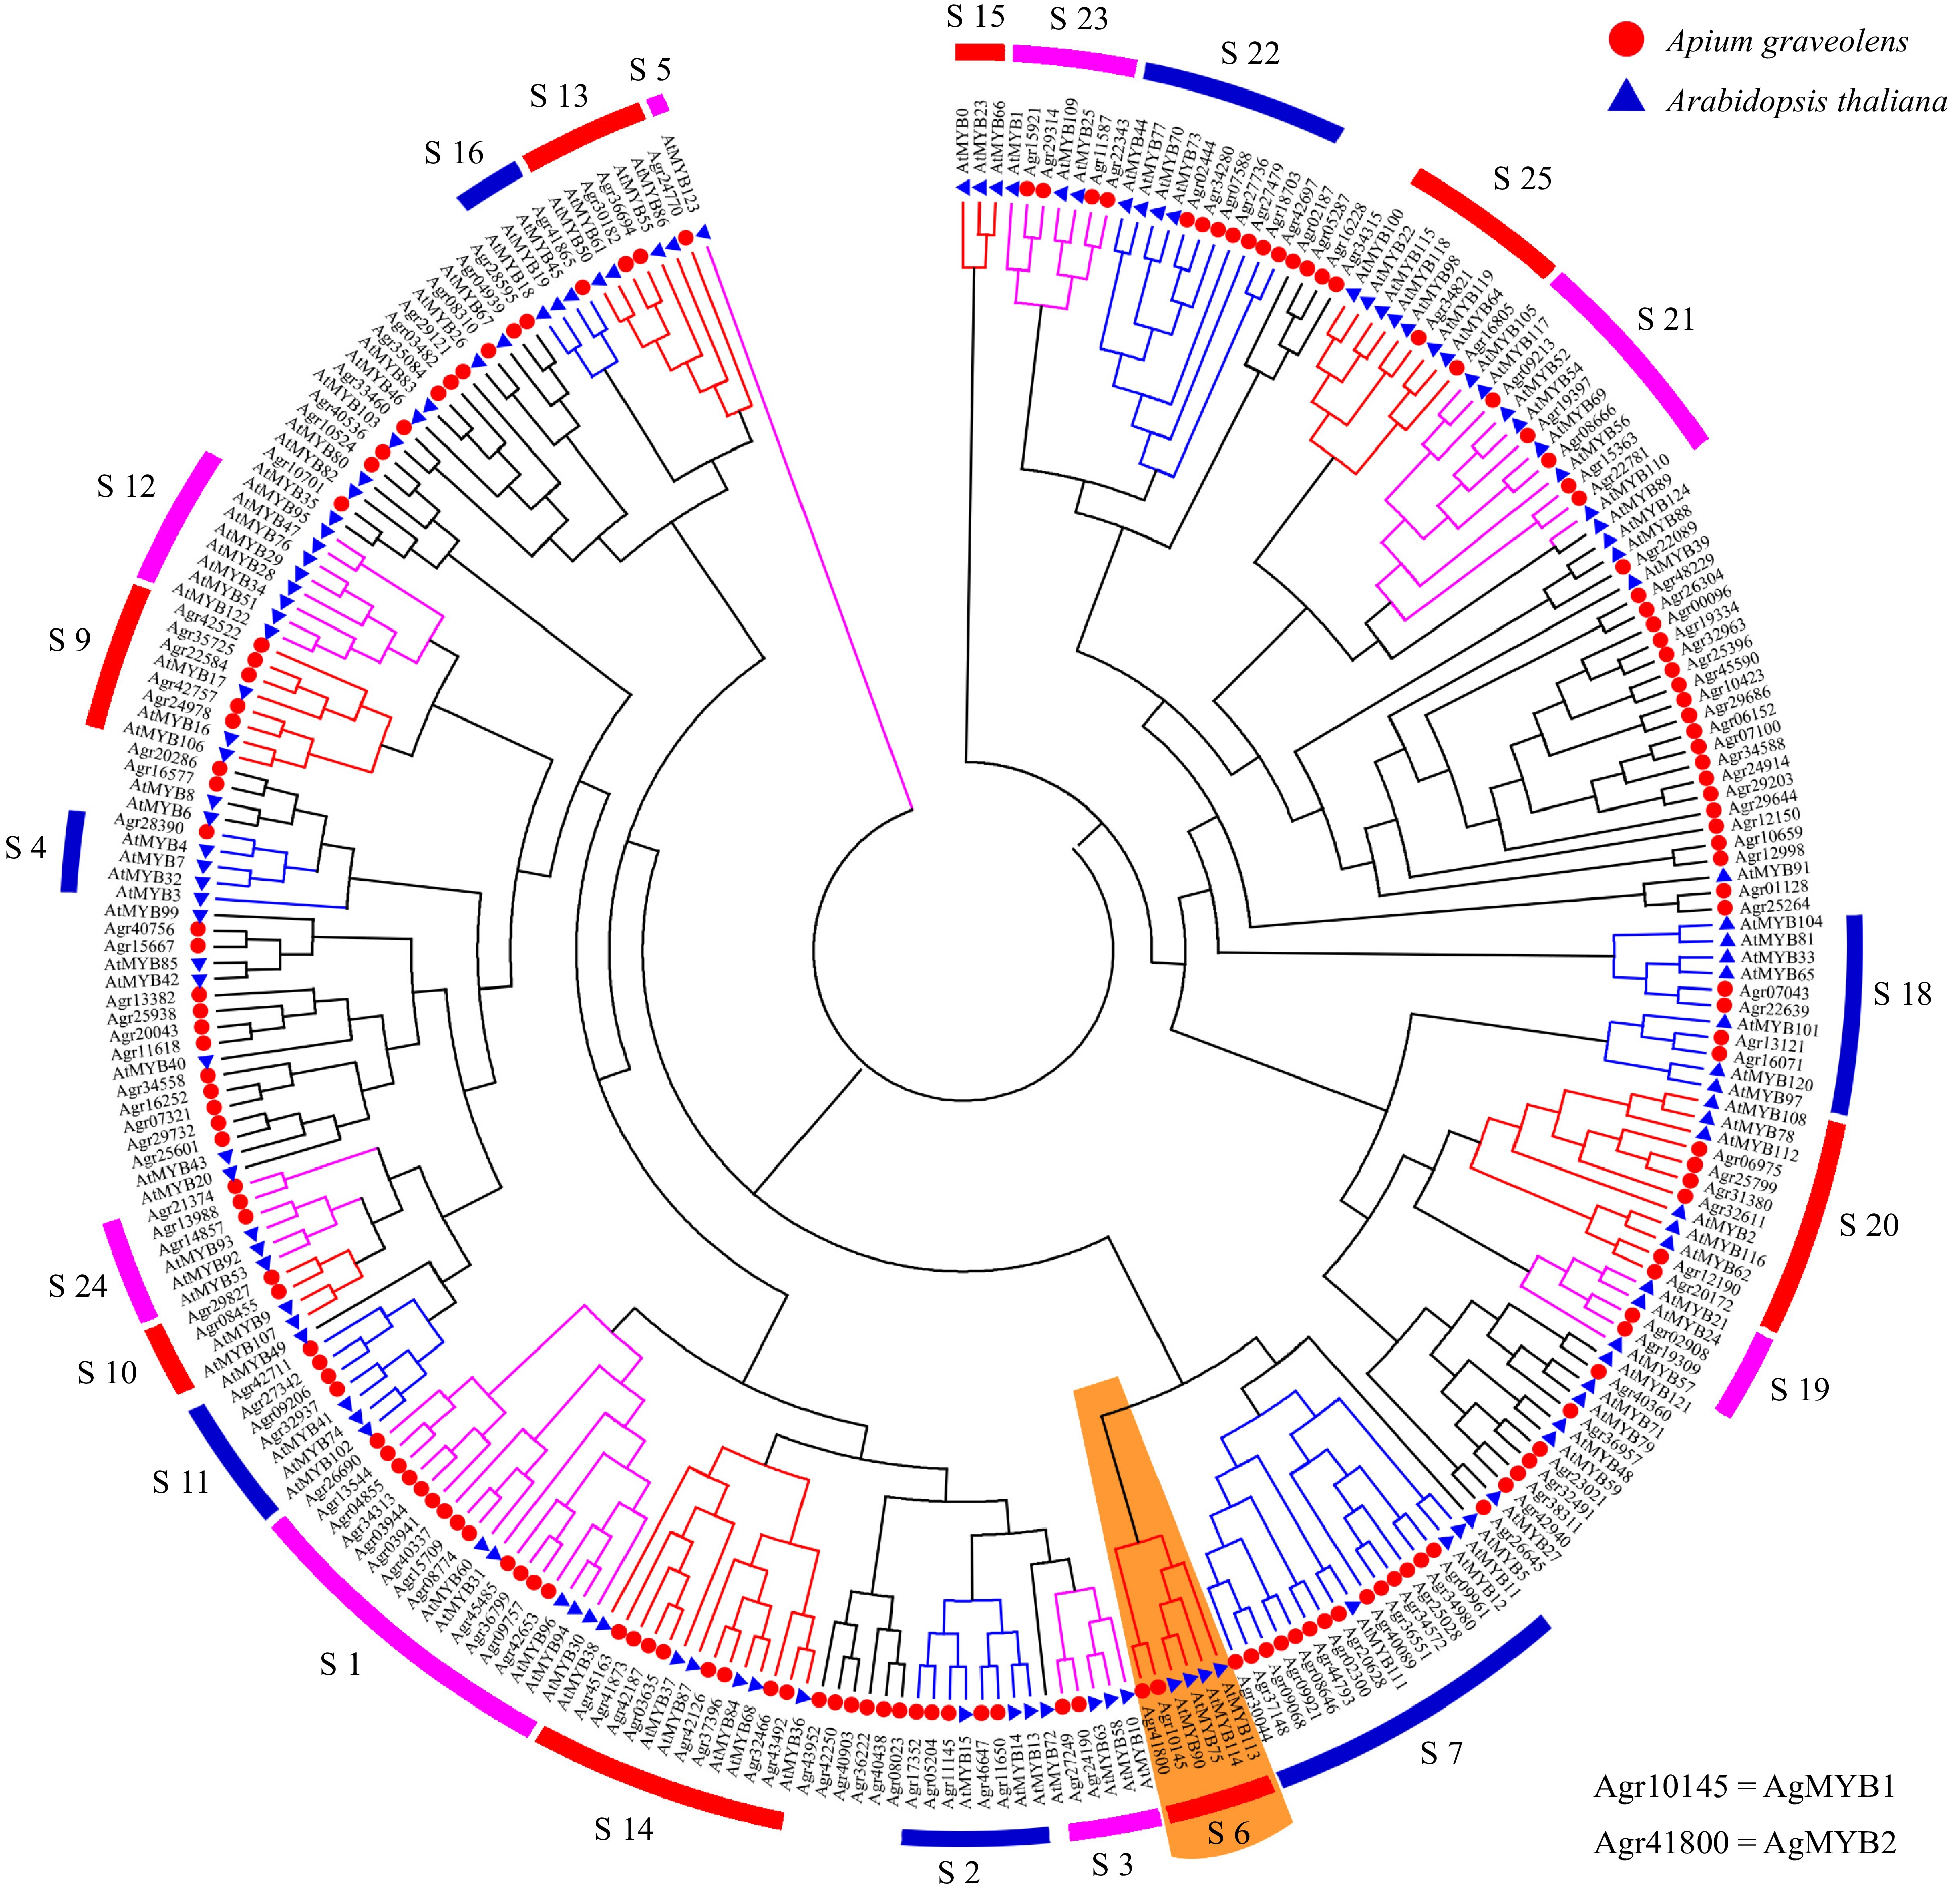
    Figure 2.  Phylogenetic tree of MYB transcription factors from celery and Arabidopsis. Different subgroups are represented using different colors. The S6 subgroup is shaded orange.

  • The function of AgMYB2 has been previously studied[36]. The current study focuses on the identification of AgMYB1 in celery. The predicted AgMYB1 gene was amplified from purple celery with specific primers. The sequencing results revealed that the open reading frame (ORF) of AgMYB1 gene was 960 bp and encoded 319 amino acids (Additional file 1: Fig. S1). The constructed phylogenetic tree indicated that R2R3-MYB TFs with similar functions were clustered into the same branch. As shown in Fig. 3a, AgMYB1 TF belongs to the branch of the anthocyanin pathway and it has the closest evolutionary relationship with AgMYB2.

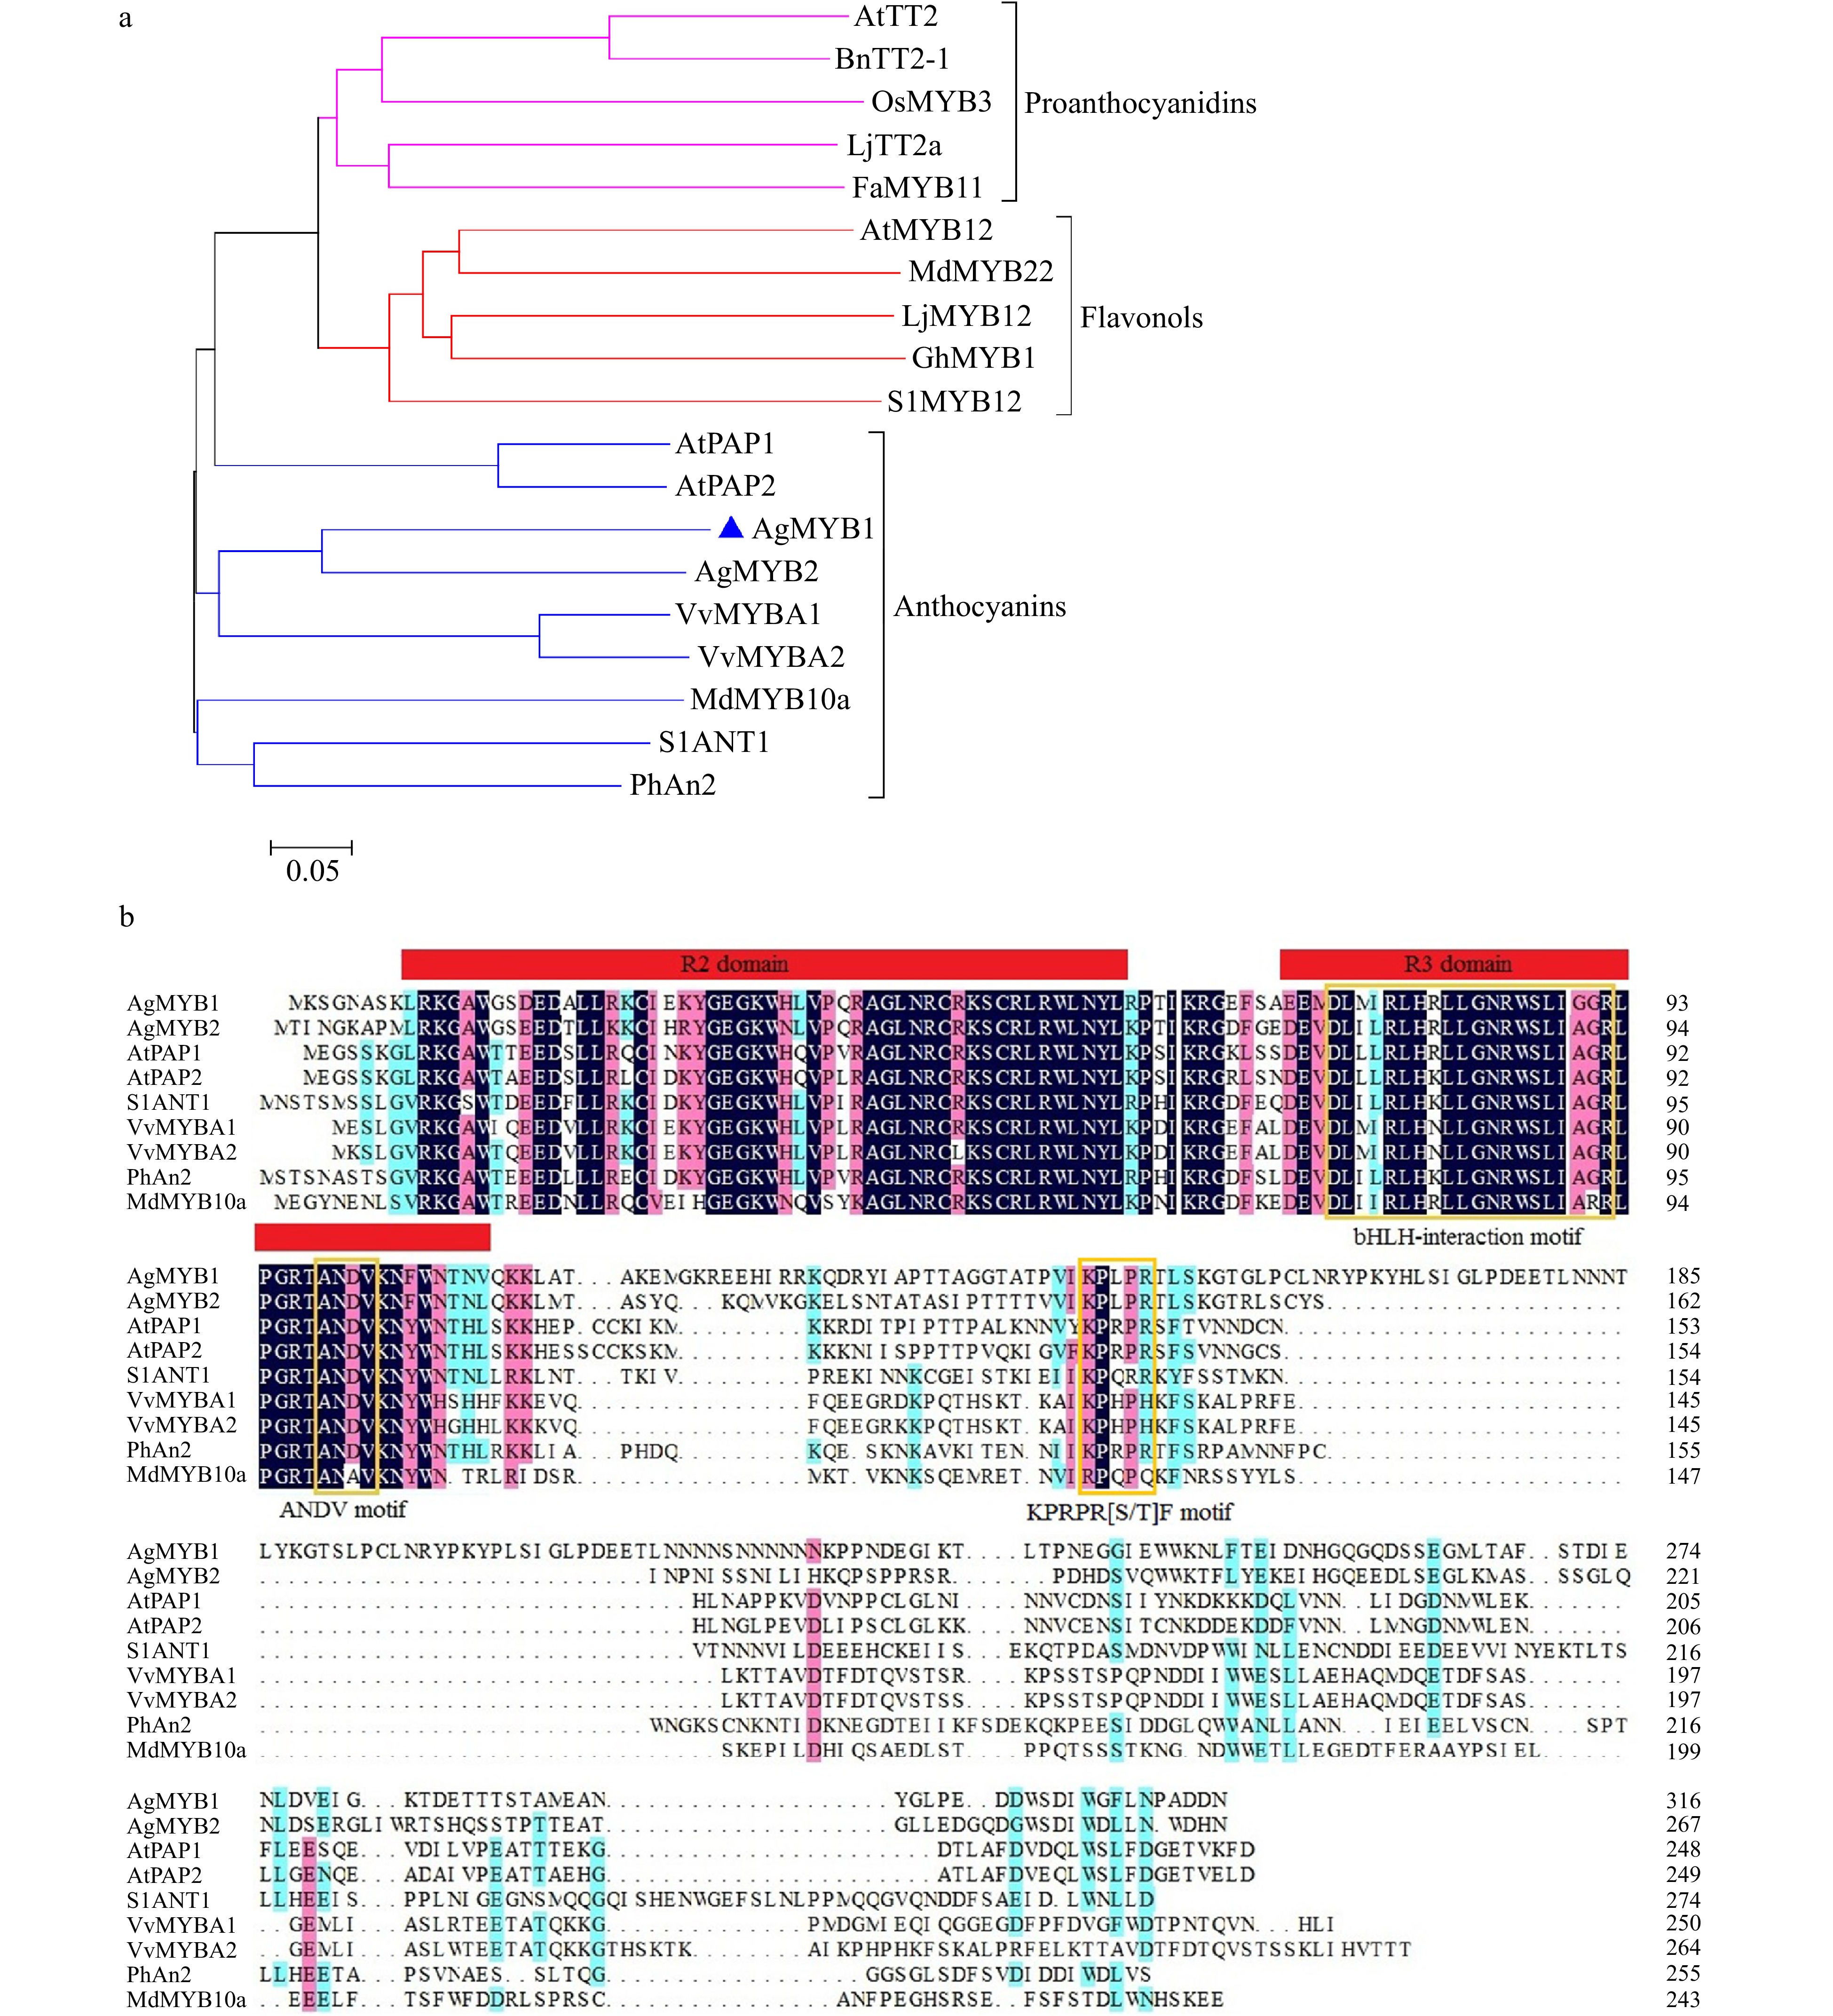
    Figure 3.  Phylogenetic analysis and sequence alignment of AgMYB1 and other R2R3-MYB proteins. (a) Phylogenetic analysis of AgMYB1 with R2R3-MYB TFs from celery and other plants. (b) Protein sequence alignment of AgMYB1 with other known anthocyanin-related R2R3-MYB TFs. The various motifs are indicated with yellow frames. The R2R3-MYB TFs with similar functions are clustered onto the same branch (anthocyanins, proanthocyanidins, and flavonols). The accession numbers of R2R3-MYB TFs: Arabidopsis thaliana AtPAP1 (AAG42001), AtPAP2 (AAG42002), AtMYB12 (ABB03913), AtTT2 (NP_198405); Solanum lycopersicum SlANT1 (AAQ55181), SlMYB12 (ACB46530); Vitis vinifera VvMYBA1 (BAD18977) and VvMYBA2 (BAD18978); Fragaria×ananassa FaMYB11 (AFL02461.1); Oryza sativa OsMYB3 (BAA23339.1); Gerbera hybrida GhMYB1 (CAD87007.1); Petunia×hybrida PhAn2 (AAF66727); Malus domestica MdMYB10a (ABB84753.1) and MdMYB22 (AAZ20438.1); Lotus japonicus LjMYB12 (BAF74782), LjTT2a (BAG12893); Brassica napus BnTT2-1 (ABI13034).

    To further analyze the sequence structure of the AgMYB1 protein, sequence alignment of the AgMYB1 protein with other anthocyanin-related R2R3-MYB TFs was performed, including A. graveolens AgMYB2, A. thaliana AtPAP1 and AtPAP2, Solanum lycopersicum SlANT1, Vitis vinifera VvMYBA1 and VvMYBA2, Petunia × hybrida PhAN2, and Malus × domestica MdMYB10a (Fig. 3b). Sequence alignment indicated that the R2R3 domain in AgMYB1 and other anthocyanin-related R2R3-MYB proteins was highly conserved. AgMYB1 contained the typical bHLH-interaction motif, ANDV motif, and KPRPR[S/T]F motif, which are related to the regulation of anthocyanin biosynthesis in higher plants.

  • To recognize the relationship between color phenotypes and AgMYB1 transcripts, an RT-qPCR assay was conducted in the petioles of purple and non-purple celery plants (Fig. 4). At three developmental stages, the purple celery showed higher AgMYB1 gene transcripts compared with non-purple celery. The expression of the AgMYB1 gene in purple celery was approximately 17-fold higher than that of non-purple celery at the second development stage. We suggest that the transcripts of the AgMYB1 gene are involved in the phenotype difference in purple and non-purple celery varieties.

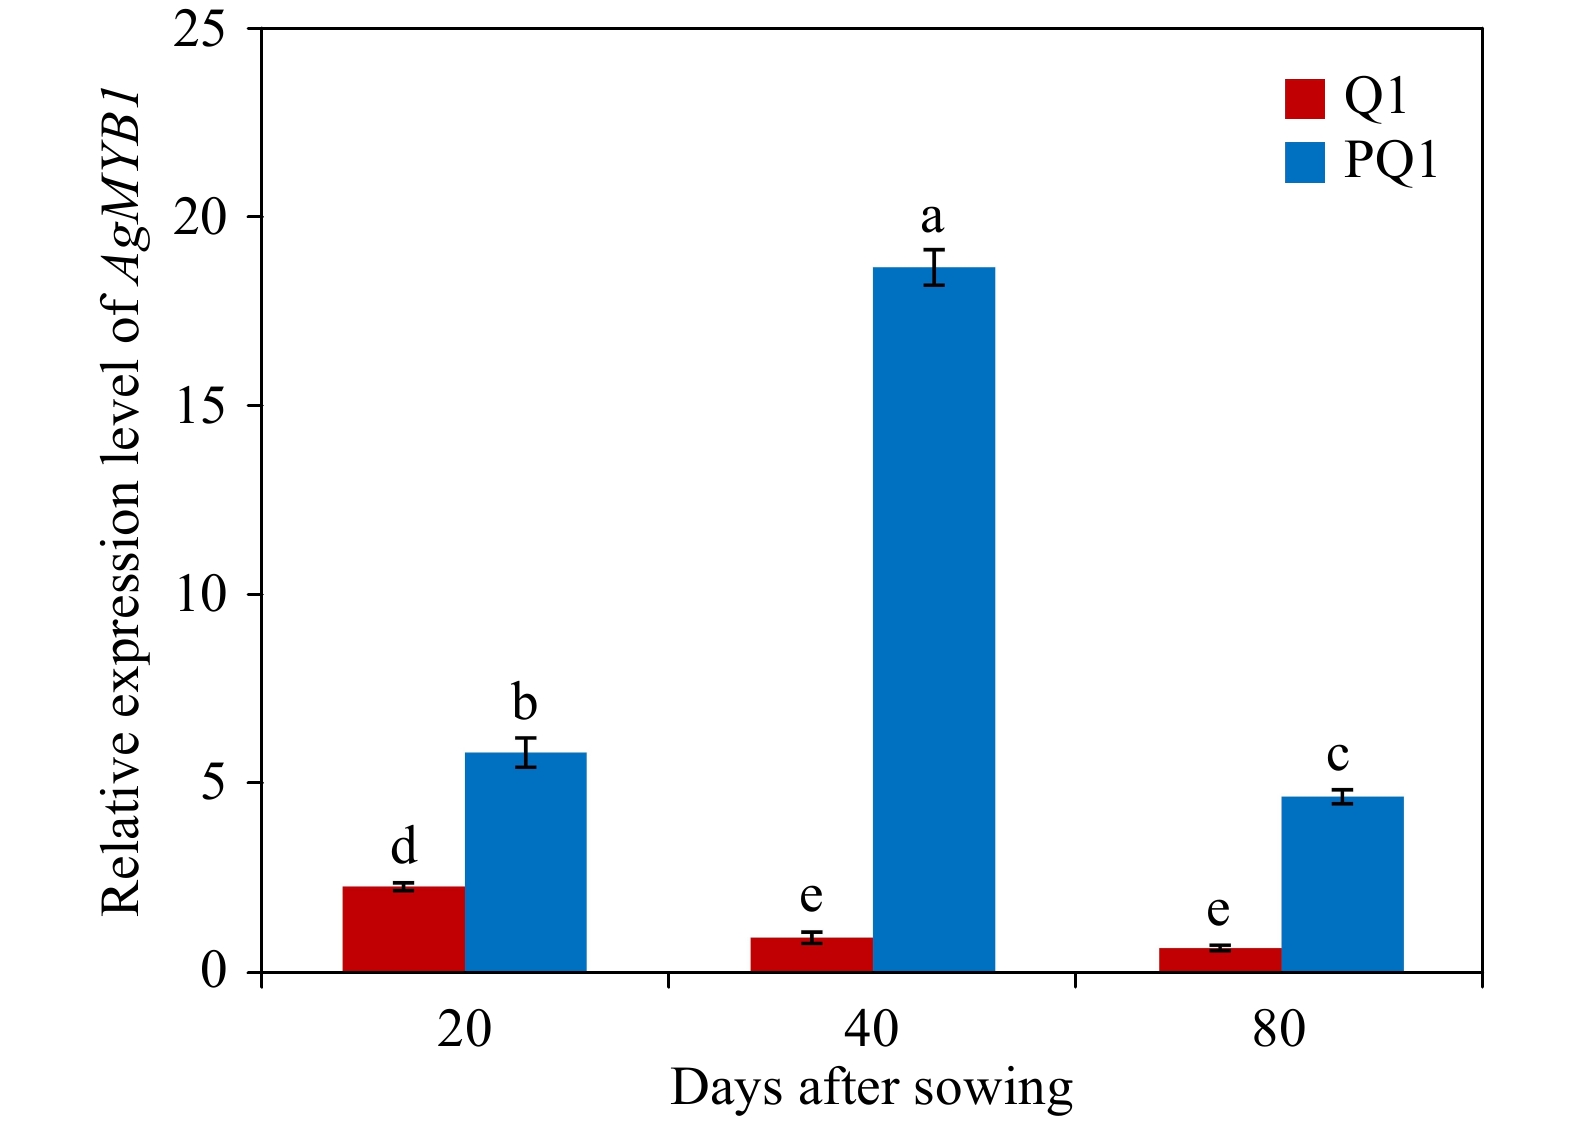
    Figure 4.  Relative transcript levels in various developmental stages and varieties. Q1, ‘Liuhe huangxin celery’; PQ1, ‘Nanxuan liuhe purple celery’. The values represent the mean of three independent experiments ± SD. The lowercase letters over the columns represent the significant differences at P < 0.05.

  • AgMYB1 and AgMYB2 were transiently expressed in tobacco to investigate the anthocyanin-promoting function. As shown in Fig. 5, the tobacco leaves expressing AgMYB1 and AgMYB2 appeared with a red pigmentation and contained significantly higher total anthocyanin content compared to control tobacco leaves. To understand the relationship between expression levels of structural genes and anthocyanin production in tobacco, RT-qPCR assay of NtCHI, NtCHS, NtF3H, NtF3’H, NtDFR, NtANS was conducted. As for the two R2R3-MYBs, the total anthocyanin contents and structural gene expressions in tobacco hosting AgMYB2 were significantly higher than those in tobacco hosting AgMYB1.

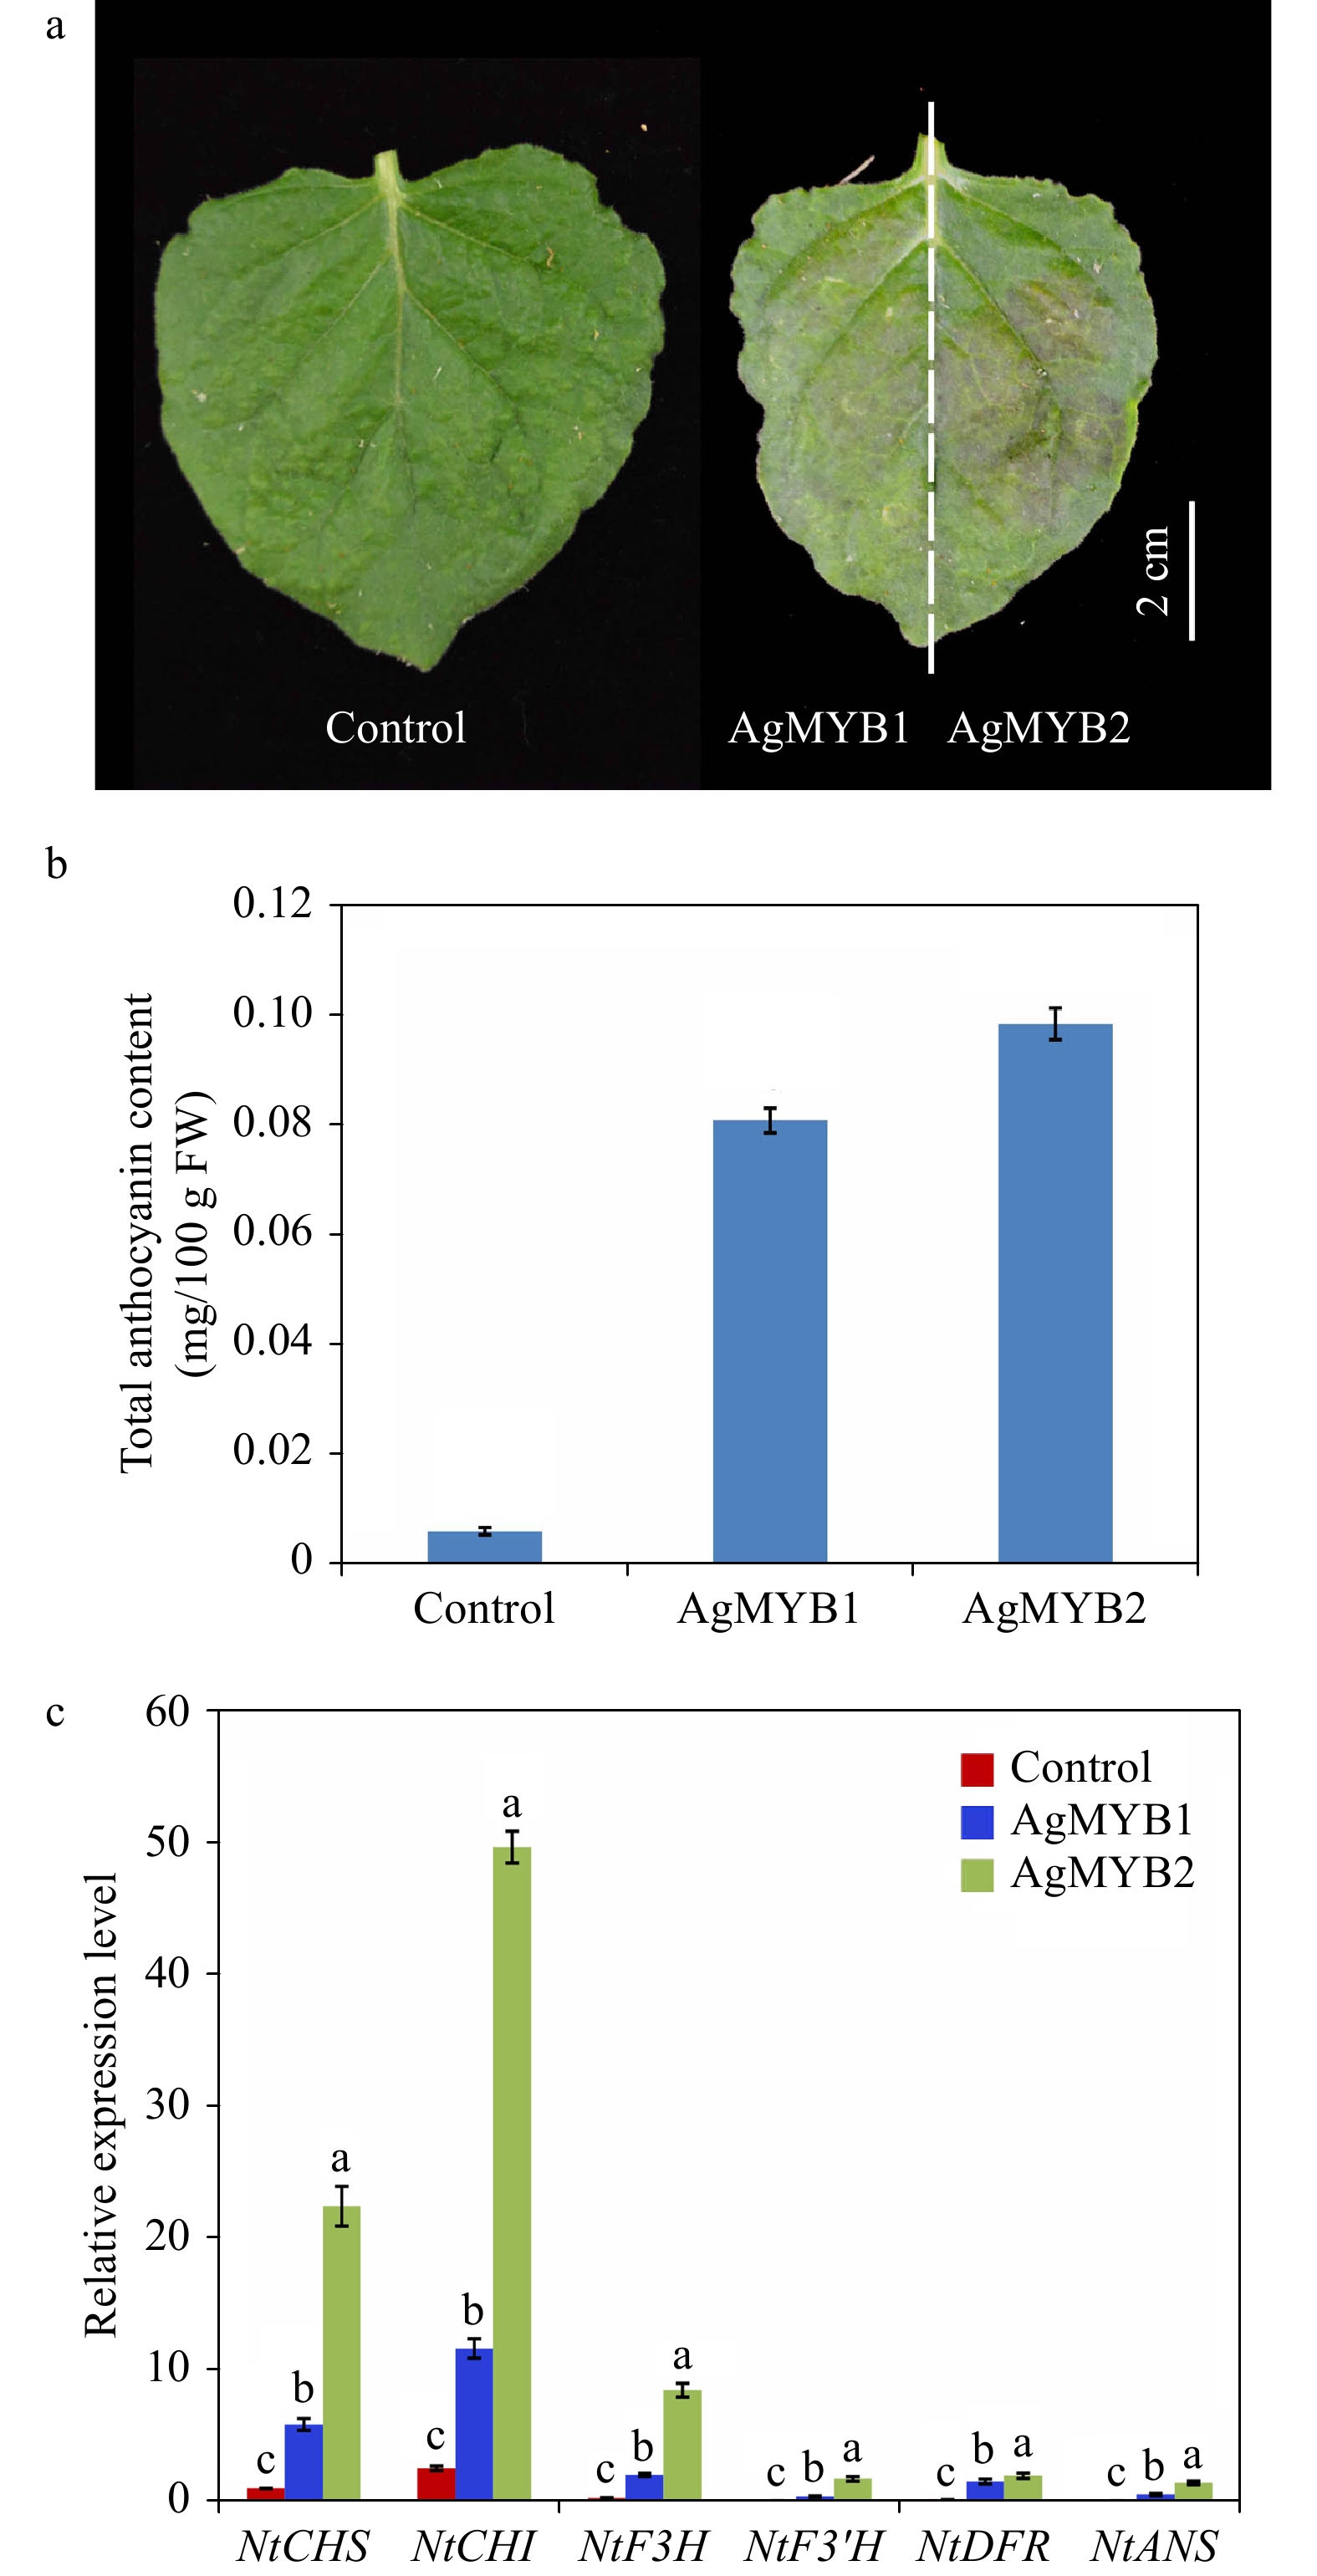
    Figure 5.  Transient expression of AgMYB1 and AgMYB2 in tobacco leaves. (a) Tobacco leaves infiltrated with Agrobacterium strain harboring AgMYB1 or AgMYB2. (b) Total anthocyanin content of control tobacco and tobacco transient expressing AgMYB1 or AgMYB2. (c) The relative transcript levels of anthocyanin biosynthetic genes in tobacco leaves. The AgMYB1 and AgMYB2 genes were transiently expressed in the left and right halves of tobacco leaves, respectively. The values represent the mean of three independent experiments ± SD. The lowercase letters over the columns represent the significant differences at P < 0.05.

  • To further confirm the activation roles of AgMYB1 in anthocyanin production, the gene was overexpressed in Arabidopsis. Transgenic Arabidopsis hosting AgMYB1 gene was screened from 1/2 MS agar plates (hygromycin B resistance). The OE-1 and OE-3 lines of Arabidopsis were selected for further analysis. The transgenic Arabidopsis (T2 generation) was further confirmed by GUS-staining and PCR amplification assay (Additional file 2: Fig. S2). The transgenic lines of Arabidopsis exhibited GUS activity. PCR amplification assay showed that the AgMYB1 gene was amplified from the cDNA of transgenic Arabidopsis but not from the cDNA of WT Arabidopsis. These results indicated that the AgMYB1 gene was stably expressed in transgenic Arabidopsis plants.

    The phenotype comparison revealed that the transgenic Arabidopsis overexpressing AgMYB1 exhibited distinctly dark-purple seeds and leaves, compared with WT Arabidopsis (Fig. 6). Anthocyanin production was significantly promoted in transgenic Arabidopsis. Total anthocyanin content in OE-1 and OE-3 lines were 0.548 and 0.249 mg/ 100g FW, respectively (Fig. 6d). In addition, an enzyme activity assay was performed to verify the anthocyanin activating role of AgMYB1 at the protein level. The glycosylation products catalyzed by crude enzymes were detected (Fig. 7). Glycosylation products catalyzed by crude enzyme extracted from OE-1 Arabidopsis were significantly more than those catalyzed by crude enzymes extracted from WT Arabidopsis. The relative glycosylation capacity was calculated based on the peak area of the glycosylation product. As shown in Table 1, the relative glycosylation capacity of OE-1 Arabidopsis was 100%, while that of WT Arabidopsis was 3.59 ± 1.61%.

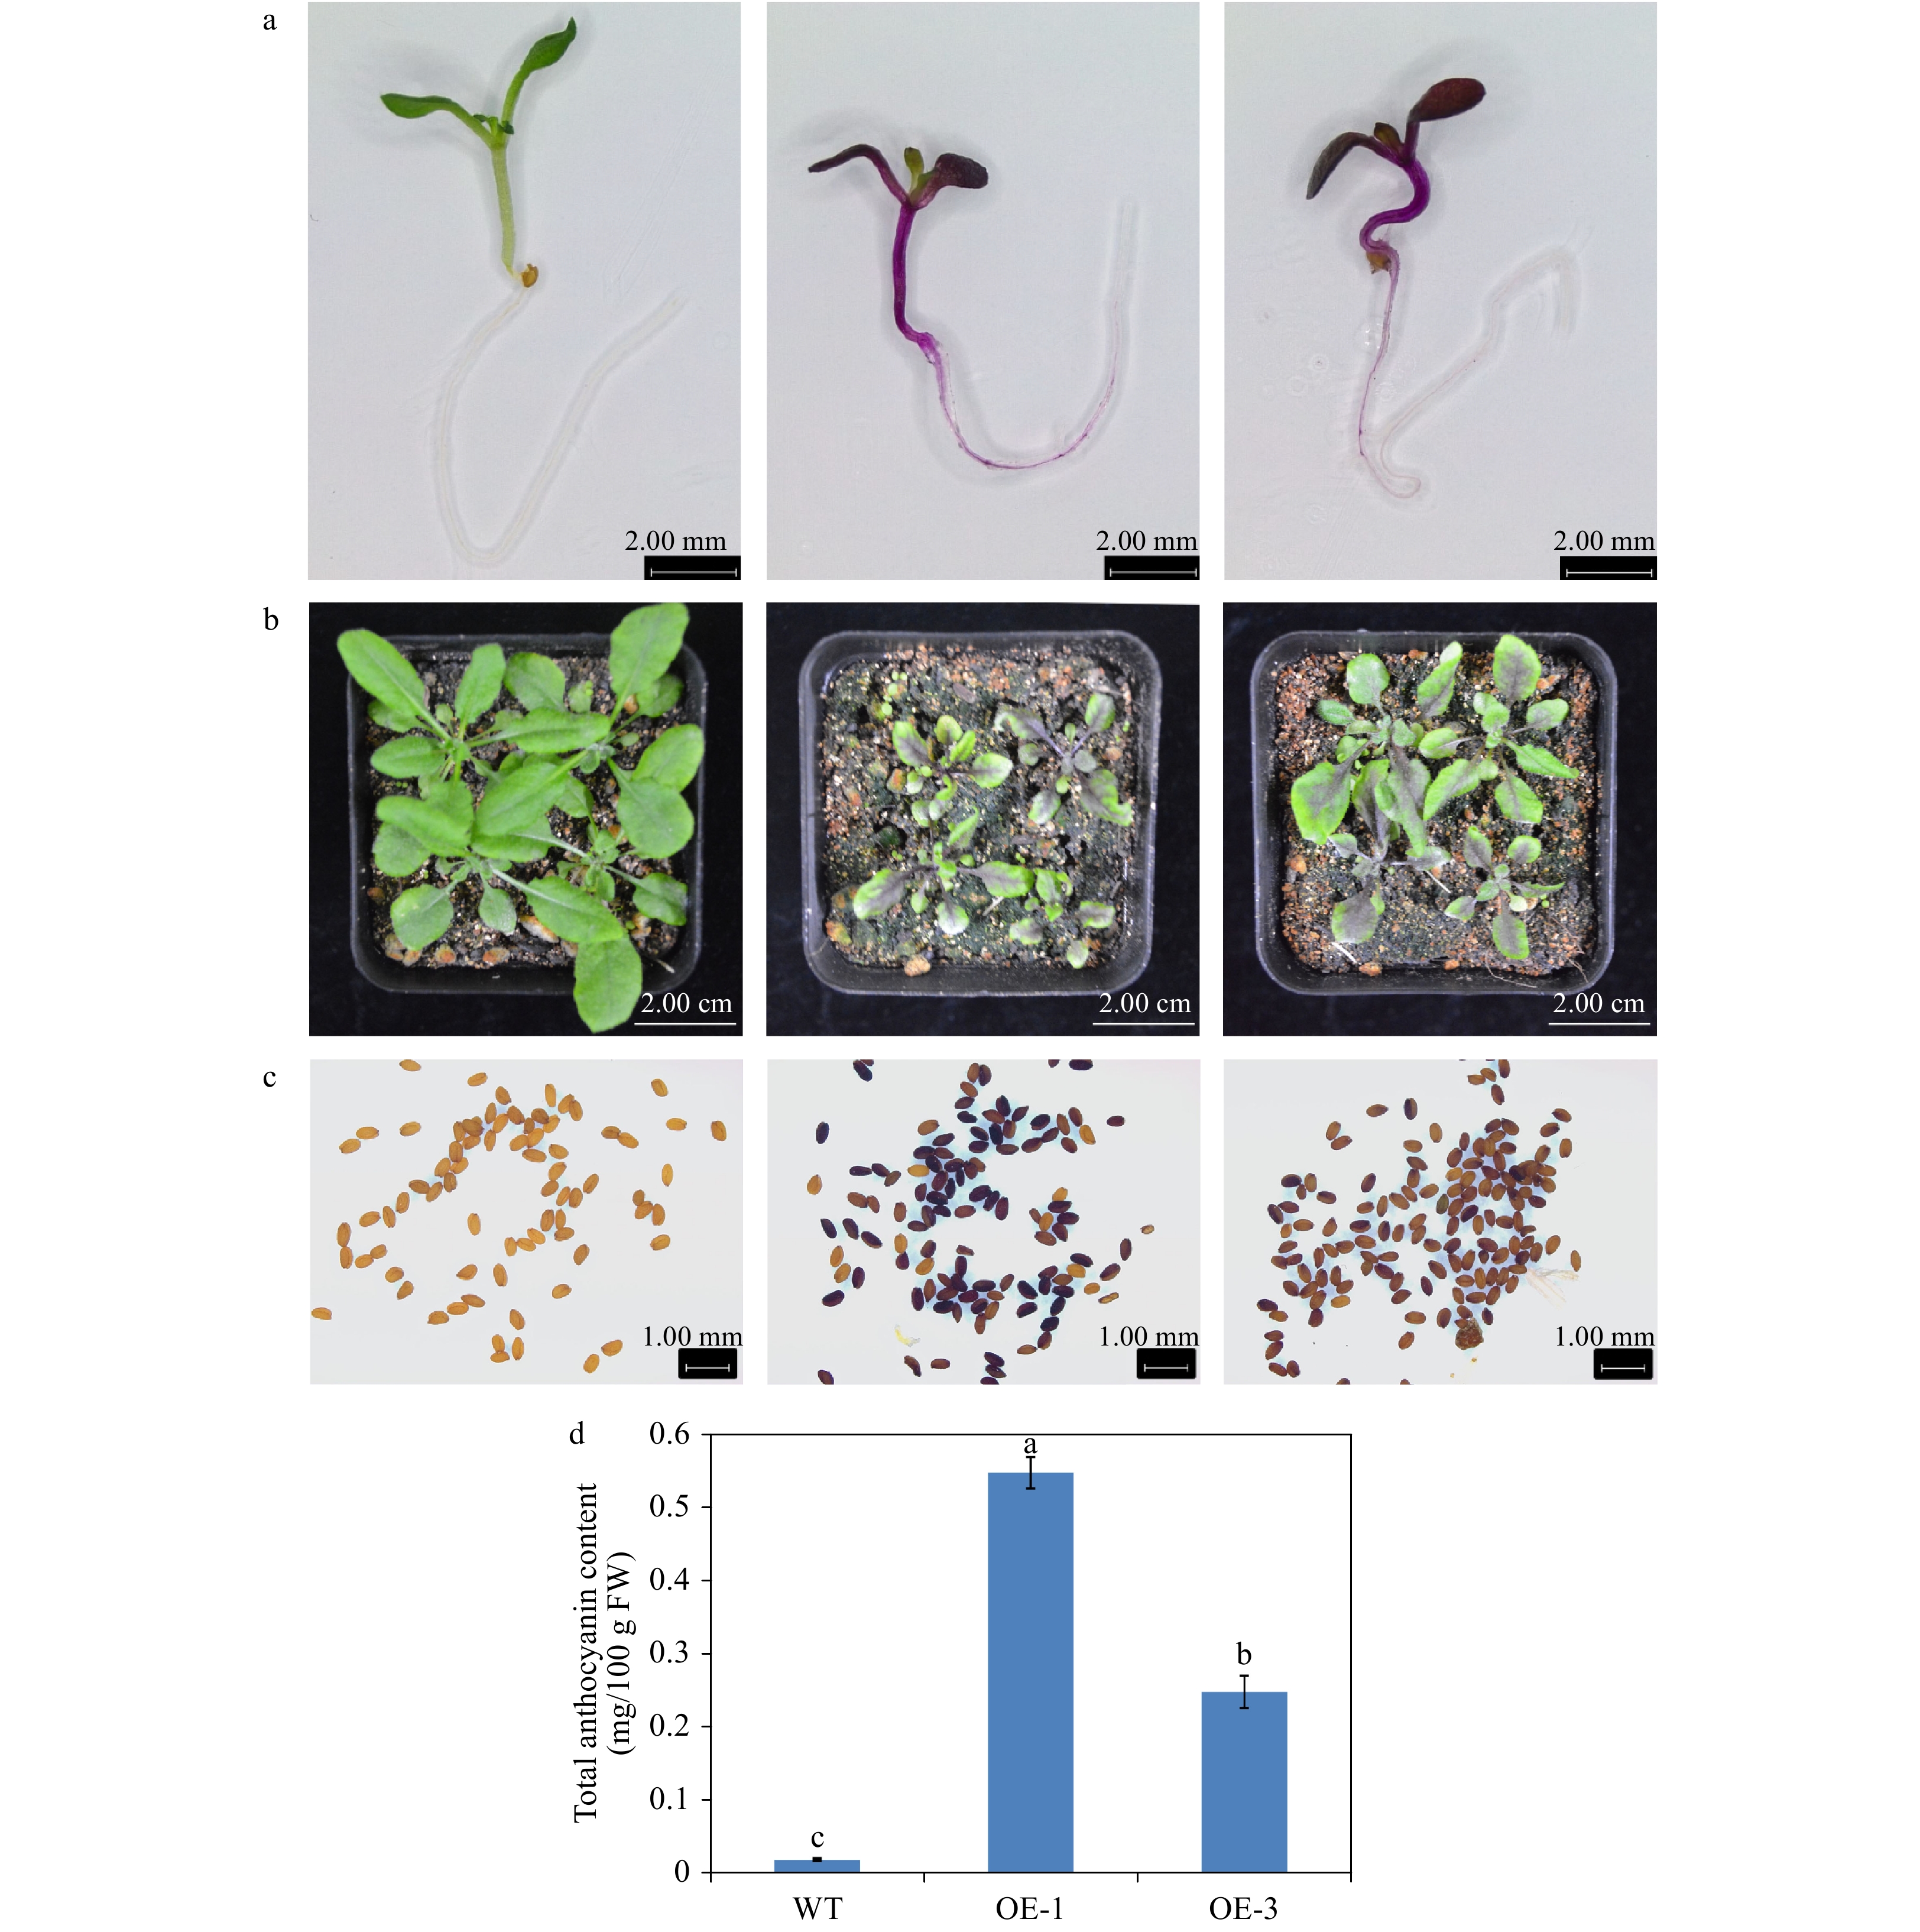
    Figure 6.  Overexpression of AgMYB1 in Arabidopsis. (a) Seedlings of WT and transgenic Arabidopsis grown on medium plate. (b) Seedlings of WT and transgenic Arabidopsis grown in soil. (c) Seeds of WT and transgenic Arabidopsis plants. (d) Total anthocyanin content of whole plants of WT and transgenic Arabidopsis. The values represent the mean of three independent experiments ± SD. The lowercase letters over the columns represent the significant differences at P < 0.05.

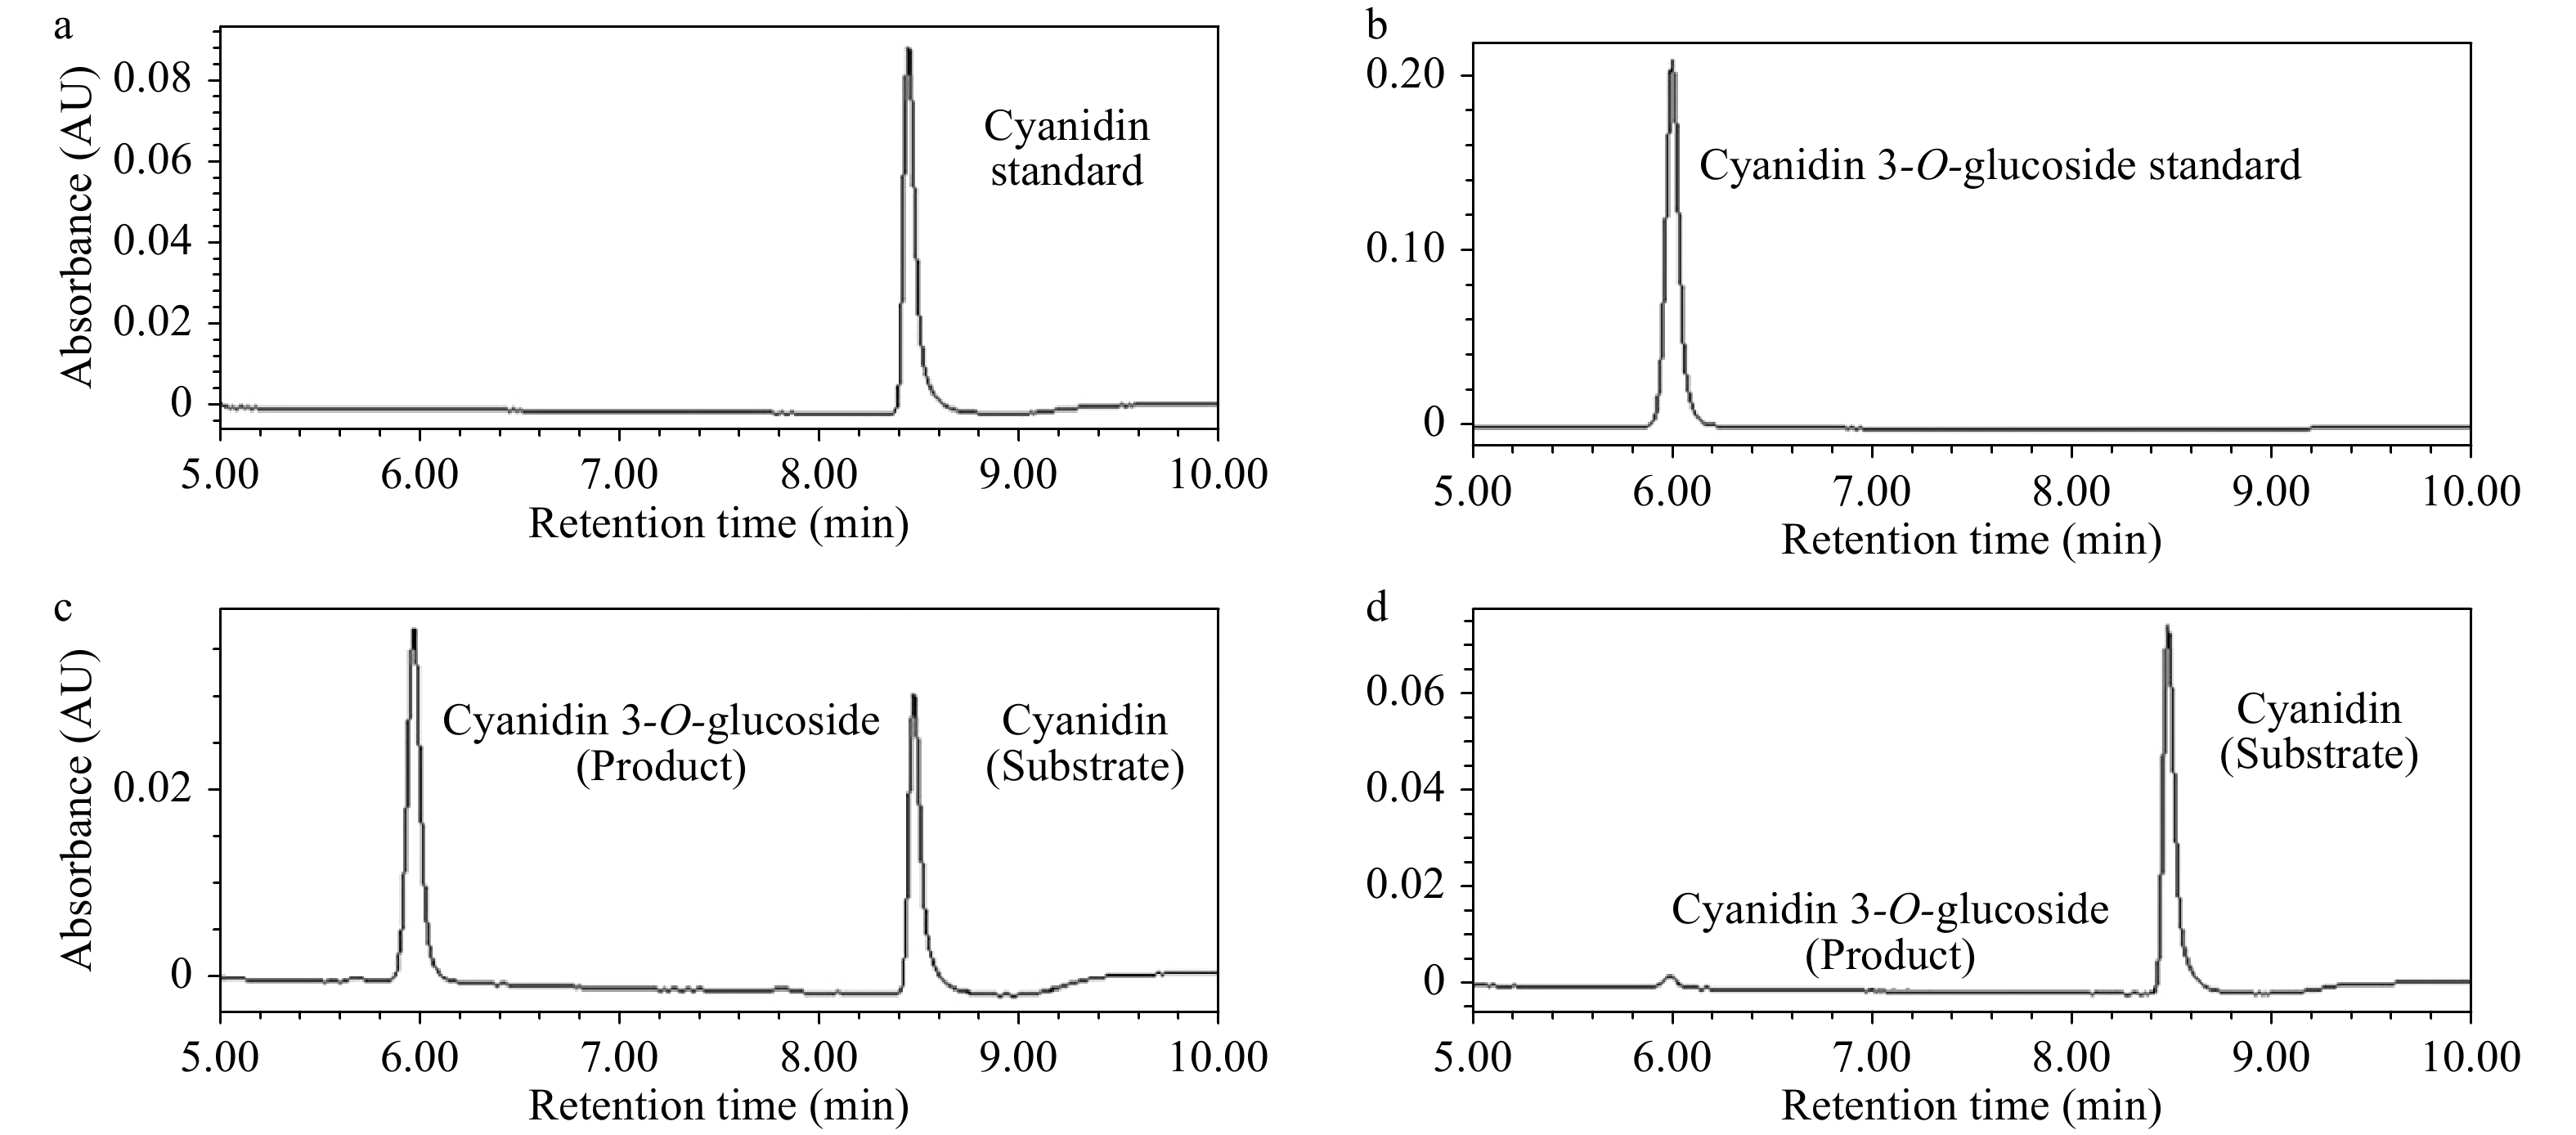
    Figure 7.  UPLC chromatograms of enzyme activity reactions. (a) Cyanidin standard sample. (b) Cyanidin 3-O-glucoside standard sample. (c) Enzyme activity reaction of crude enzyme extracted from OE-1 Arabidopsis. (d) Enzyme activity reaction of crude enzyme extracted WT Arabidopsis.

    Table 1.  Relative glycosylation abilities of WT and transgenic Arabidopsis.The glycosylation ability of OE-1 Line of Arabidopsis was set as 100%. The values represent the mean of three independent experiments ± SD.

    Arabidopsis categoryRelative glycosylation ability (%)
    WT Arabidopsis3.59 ± 1.61
    OE-1 Arabidopsis100 ± 3.99

    The total anthocyanin content in plants were found to correlate with the expression of structural genes in the anthocyanin pathway. RT-qPCR assay was conducted to identify the role of AgMYB1 in activating the transcripts of structural genes in transgenic Arabidopsis plants. As shown in Fig. 8, the relative expression levels of anthocyanin-related structural genes in transgenic Arabidopsis over-expressing AgMYB1, were significantly higher than those in WT Arabidopsis.

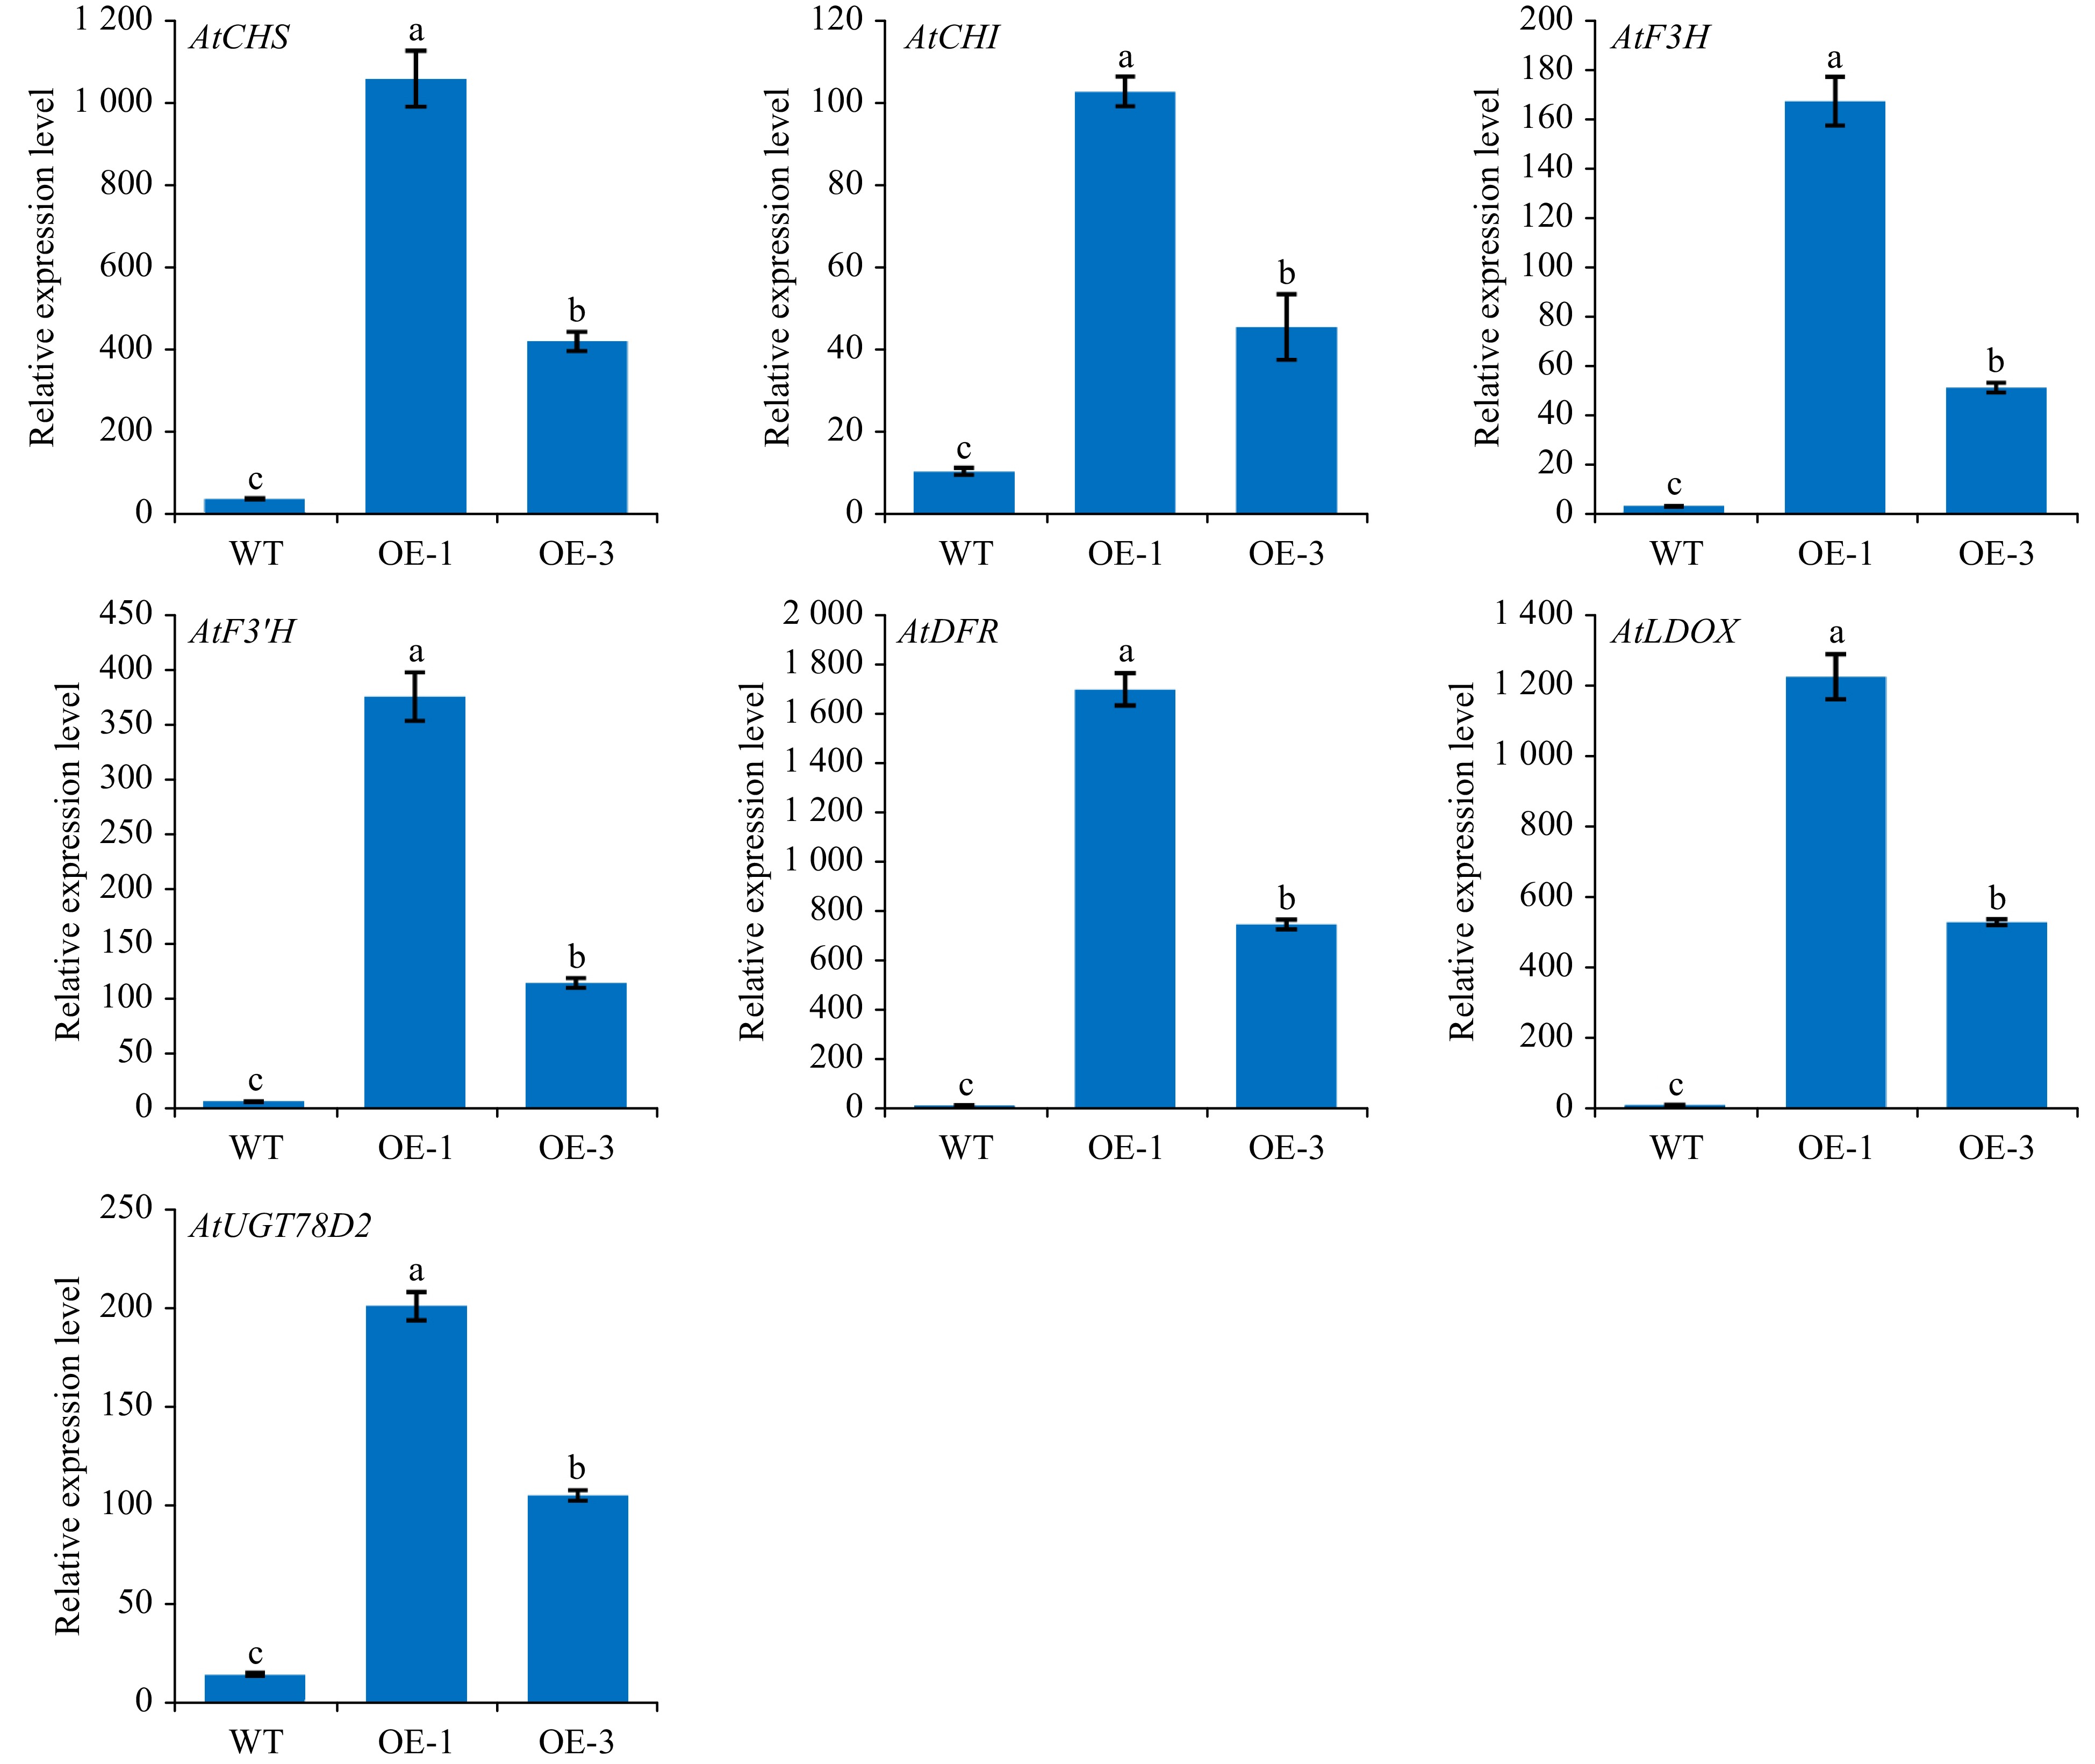
    Figure 8.  The relative transcripts of structural genes involved in anthocyanin biosynthesis in WT and transgenic Arabidopsis. The values represent the mean of three independent experiments ± SD. The lowercase letters over the columns represent the significant differences at P < 0.05.

  • R2R3-MYB TF could interact with the bHLH protein to modulate the biosynthesis and accumulation of anthocyanin in many plants. In consideration of the bHLH-interaction motif in the AgMYB1 protein, we performed Y2H assay to verify the interaction of AgMYB1 with bHLH proteins. For interaction analysis, AtEGL3 and AtTT8 from Arabidopsis and AgbHLH2 from celery were selected as the bHLH regulatory proteins in the anthocyanin pathway. The results in Fig. 9a indicate that co-transformed yeast cells harboring AgMYB1-AD and AgbHLH2-BD, or AtEGL3-BD, or AtTT8-BD combinations survived in DDO and QDO selection plates, and the above co-transformed yeast cells also exhibited α-galactosidase activity. In contrast, the co-transformed yeast cells containing empty vectors and AgMYB1-AD, or AgbHLH2-BD, or AtEGL3-BD, or AtTT8-BD did not survive on the QDO selection plates and did not show α-galactosidase activity. Previous study showed that AgMYB2 also interacted with AgbHLH2 protein in yeast[35]. The comparison of Y2H indicated that the yeasts harboring AgMYB2-AD + AgbHLH2-BD grew faster than those harboring AgMYB1-AD + AgbHLH2-BD vectors (Fig. 9b). These results indicated that AgMYB1 interacted with bHLH proteins and the AgbHLH2-binding activity of AgMYB2 was stronger than AgMYB1 in yeasts.

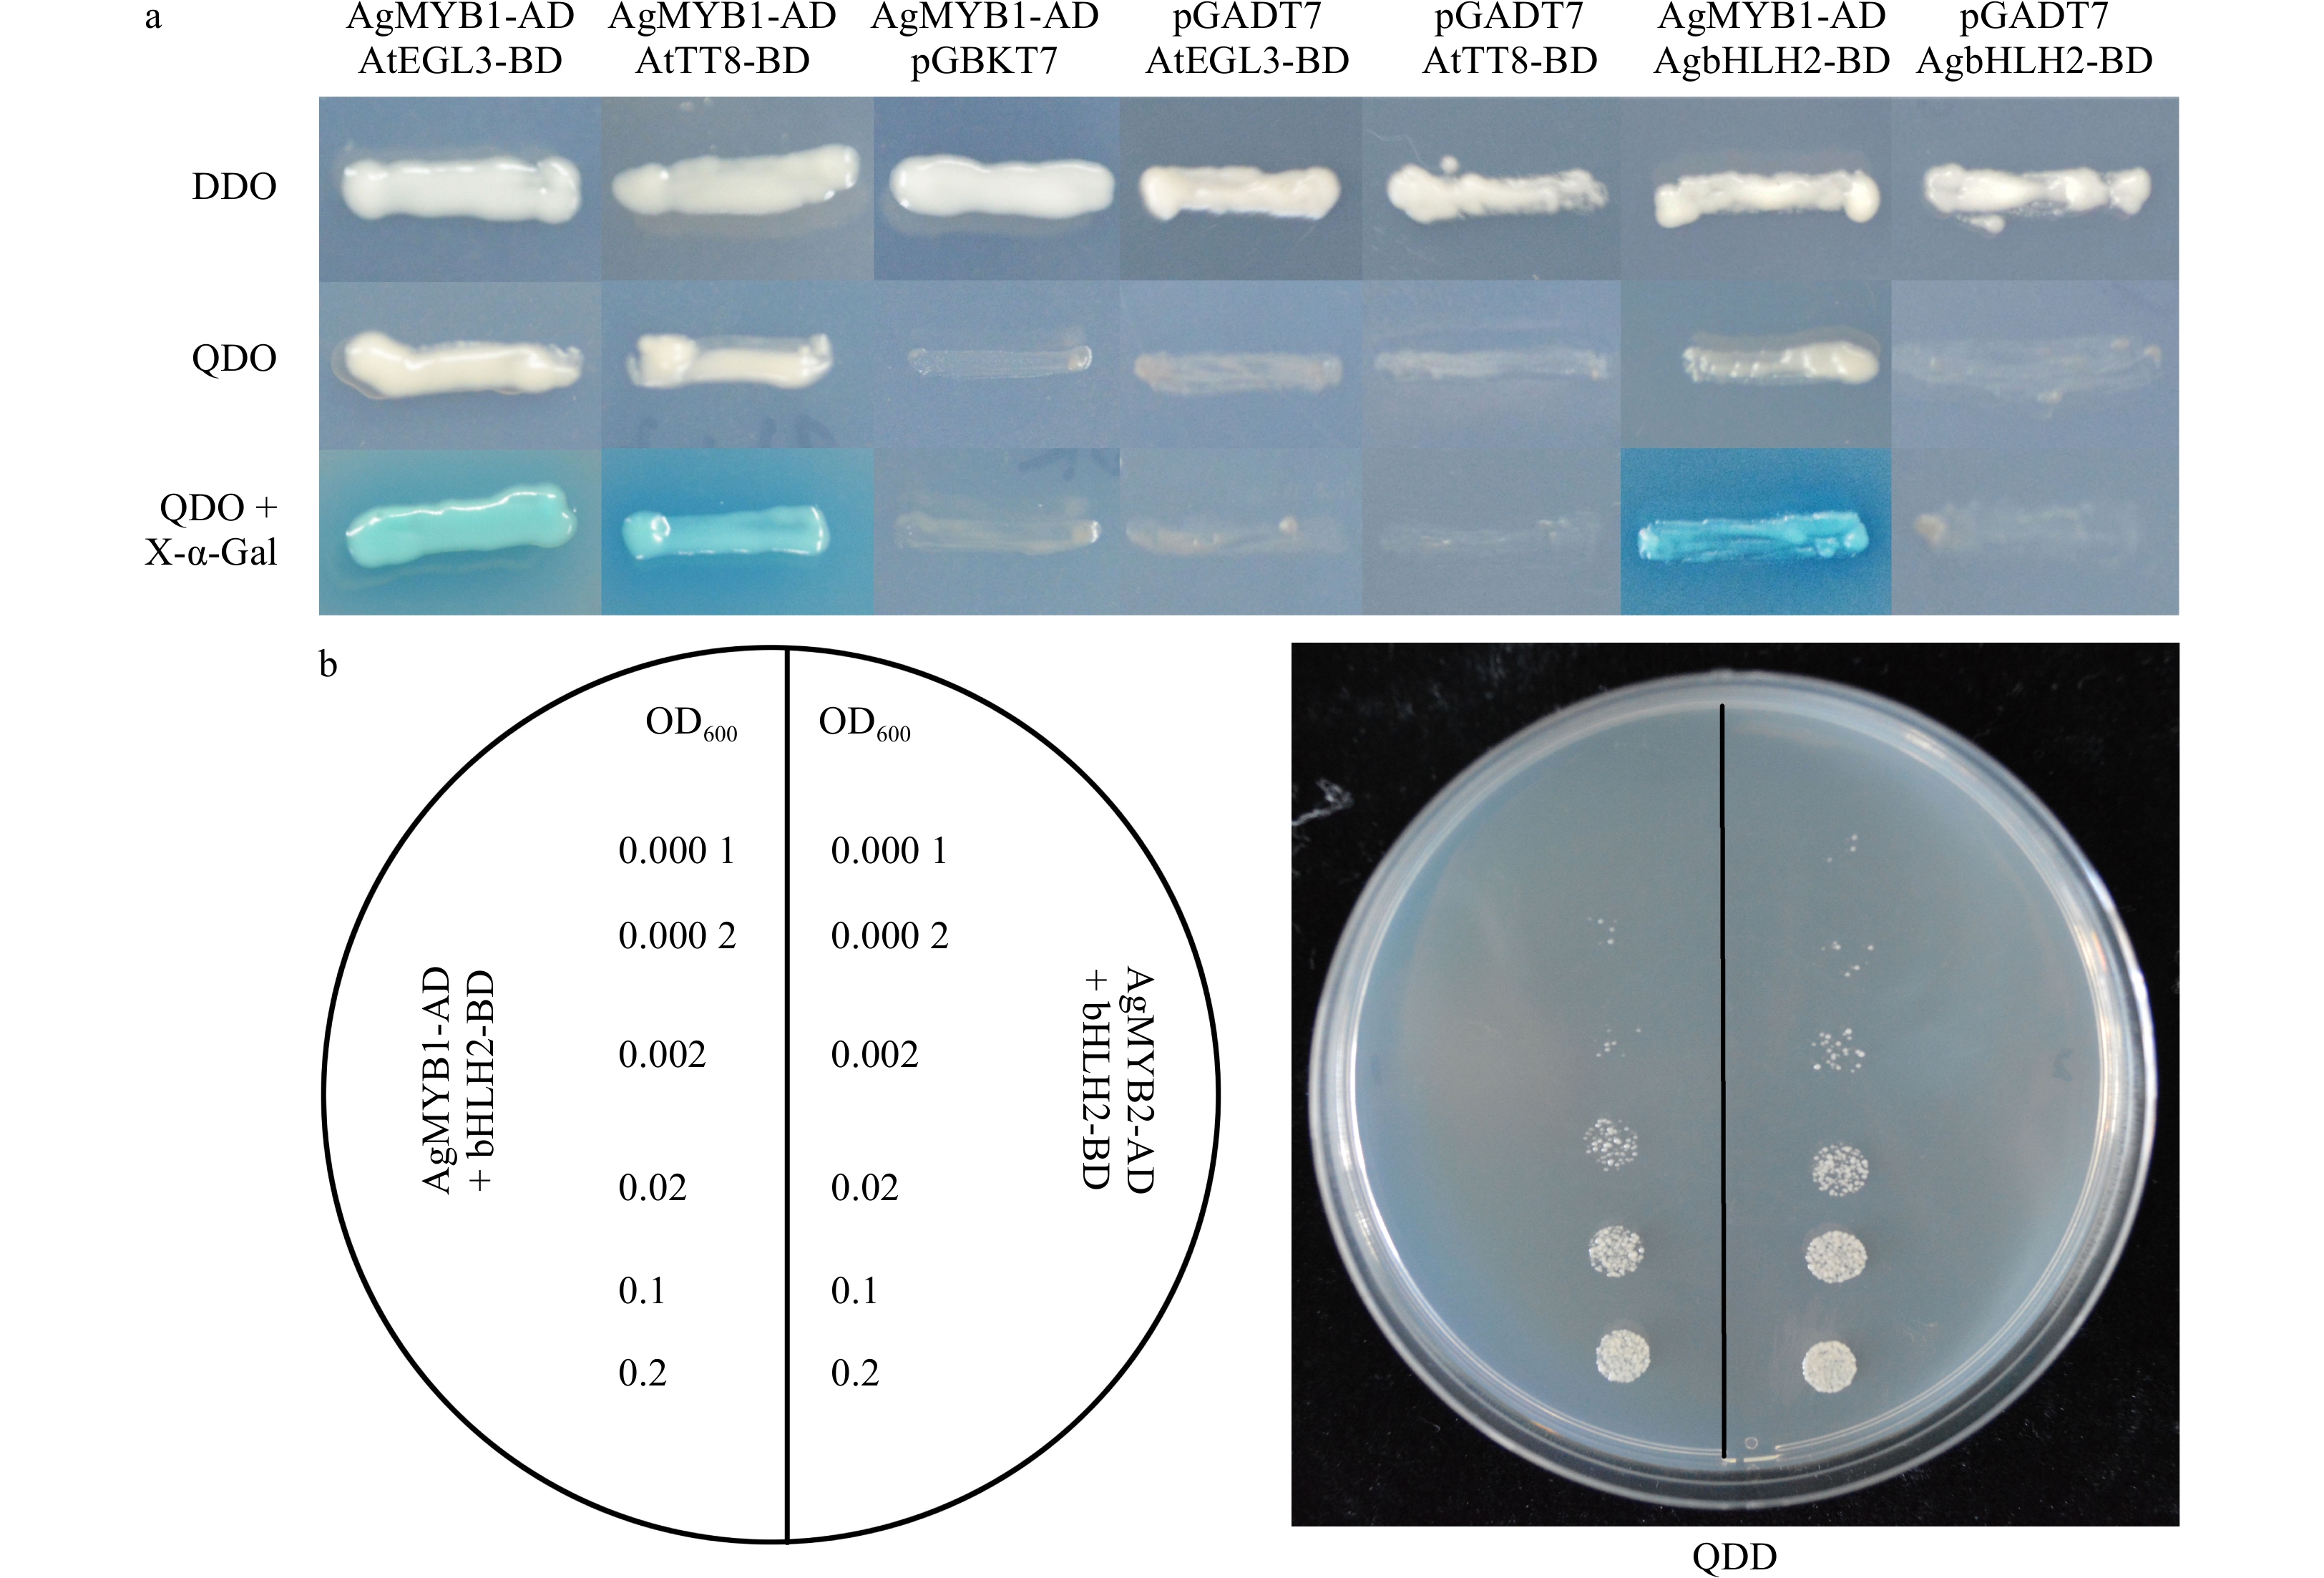
    Figure 9.  Yeast two-hybrid of celery R2R3-MYB and bHLH TFs. (a) Yeast two-hybrid of AgMYB1 with AtEGL3, AtTT8, and AgbHLH2 proteins. (b) Growth status of yeast cells harboring AgMYB1 and AgMYB2 with different OD600 values. DDO: SD/-Trp/-Leu; QDO: SD/-Leu/-Trp/-His/-Ade; QDO+X-α-Gal: SD/-Leu/-Trp/-His/-Ade/+X-α-Gal.

  • To confirm the effects of anthocyanin content in promoting antioxidant capacity, we determined the antioxidant capacity of WT and transgenic Arabidopsis plants. The antioxidant capacity of OE-1 and OE-3 Arabidopsis plants was 10.46 and 7.43 mM/g FW respectively, but the antioxidant capacity of WT Arabidopsis was only 5.52 mM/g FW (Fig. 10). This result suggests that the increase in anthocyanin content enhances the antioxidant capacity in transgenic Arabidopsis overexpressing AgMYB1.

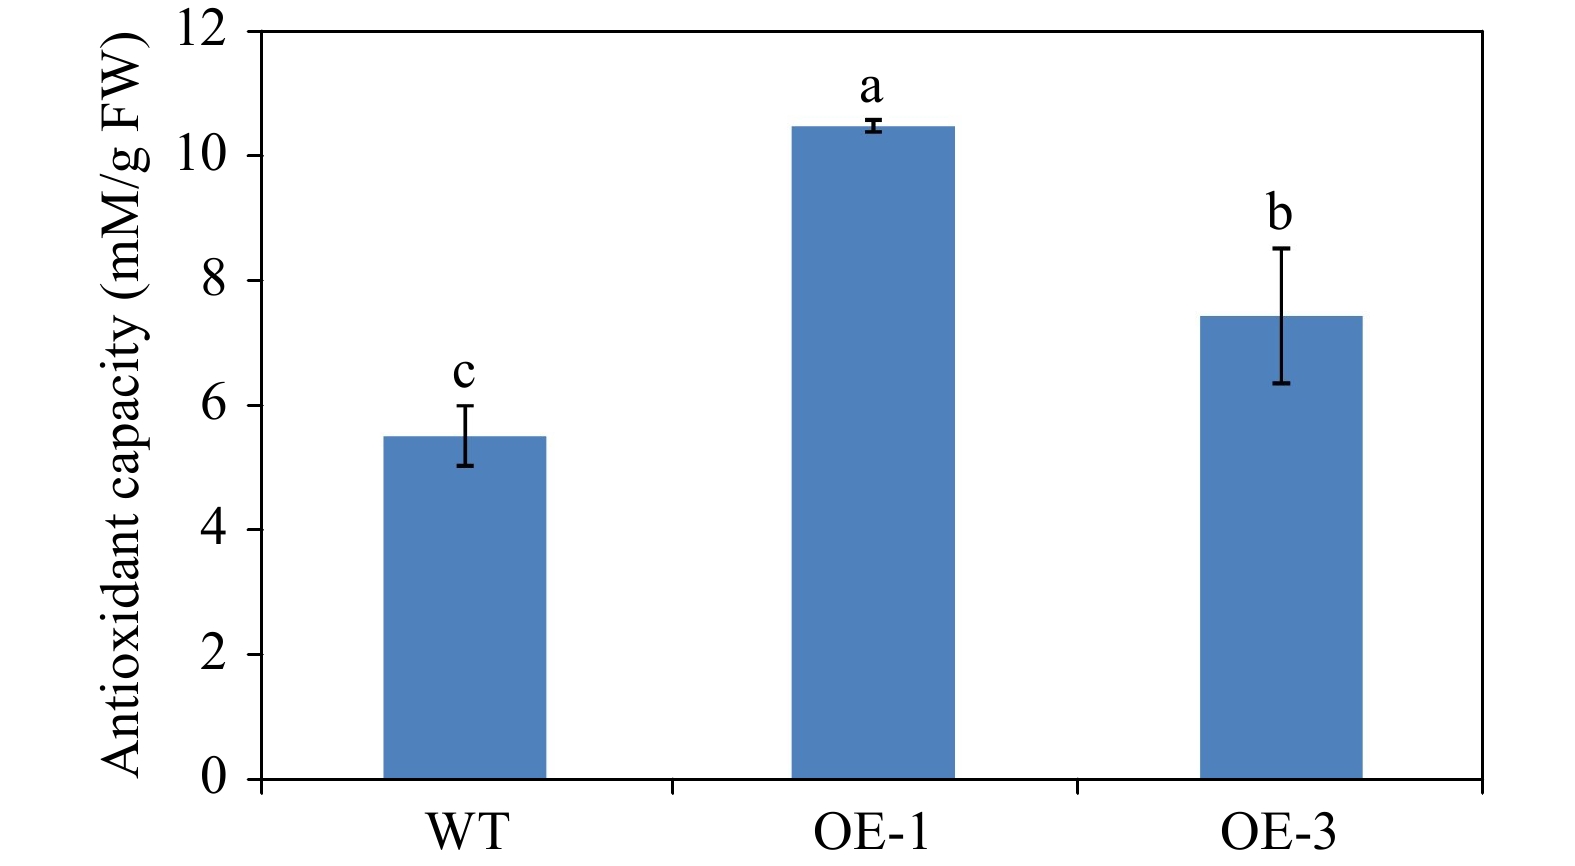
    Figure 10.  Antioxidant activity measurement of WT and transgenic Arabidopsis plants using FRAP method. The values represent the mean of three independent experiments ± SD. The lowercase letters over the columns represent the significant differences at P < 0.05.

  • Plant tissue coloration is determined by various plant metabolites (carotenoids, anthocyanins, and betalains)[19, 57]. The accumulation of various anthocyanins results in the formation of purple, blue, red, or black organs in different species[48, 58, 59]. A previous study reported that the transcripts of anthocyanin structural genes were related to the anthocyanin content and skin colors in different celery plants[60]. The anthocyanin pathway is mainly controlled by MBW complex protein where MYB TFs always play a central role in plants[20, 24]. The S6 subgroup of R2R3-MYB factors plays an important role in anthocyanin biosynthesis in Arabidopsis[25]. In this study, two R2R3-MYB transcription factors (AgMYB1 and AgMYB2) in S6 subgroup were identified from celery, based on the genome-wide analysis of MYB family factors. The expression level of AgMYB2 was higher in purple celery than that in non-purple celery and the anthocyanin-regulatory role of AgMYB2 has been investigated to activate anthocyanin biosynthesis in our previous research[36]. In the current study, we isolated another R2R3-MYB regulator from purple celery, AgMYB1, and the results indicated that it is a transcriptional activator in the anthocyanin biosynthetic pathway. However, the bHLH-binding and anthocyanin-activating activities of AgMYB2 were stronger than AgMYB1.

    Phylogenetic analysis showed that AgMYB1 TF was clustered with anthocyanin regulatory MYB TFs from other species, such as Arabidopsis AtPAP1 and AtPAP2[61], Solanum lycopersicum SlANT1[62], Malus domestica MdMYB10a[48]. The biological function of plant TFs usually depends on the protein sequence structure[63]. Sequence alignment of AgMYB1 and other anthocyanin-related R2R3-MYBs revealed that the R2R3 domain was highly conserved in these TFs. The anthocyanin-related bHLH-interaction motif, ANDV motif, and KPRPR[S/T]F motif were recognized in AgMYB1[6365]. The RT-qPCR analysis indicated that the transcripts of AgMYB1 in purple celery were significantly higher than that in non-purple celery. The difference of AgMYB1 expression levels may be due to the differences of promoter sequence in different varieties, or the regulation of upstream regulatory genes. These results suggest that AgMYB1 TF is involved in the regulation of anthocyanin biosynthesis in purple celery.

    Transient expression of AgMYB1 and AgMYB2 in tobacco promote anthocyanin production and result in red pigmentation in tobacco leaves. The tobacco leaf hosting AgMYB2 gene harbored darker pigments than that of leaves hosting the AgMYB1 gene. The total anthocyanin content and expression levels of anthocyanin biosynthetic gene in tobacco leaf overexpressing AgMYB2 were also higher than those in leaves overexpressing AgMYB2. In addition, AgMYB1 TF was heterologous expressed in Arabidopsis to further confirm its regulatory role in activating anthocyanin production. The transgenic Arabidopsis overexpressing AgMYB1 exhibited dark-purple organs at different developmental stages. The phenotypic differences between WT and transgenic Arabidopsis can be attributed to the increase of total anthocyanin content. Previous studies revealed that overexpression of R2R3-MYBs promoted pigmentation and enhanced the anthocyanin production in many plants, e.g. overexpression of RsMYB1 and OjMYB1 in tobacco and Arabidopsis plants, respectively[43, 53]. The transcripts of anthocyanin biosynthetic genes were activated by R2R3-MYB in plants[42]. The expression of anthocyanin biosynthetic genes were up-regulated in transgenic Arabidopsis hosting AgMYB1. The glycosylation process of anthocyanin enhances its stability and water-solubility in plants[66]. Anthocyanin glycosylation was enhanced in transgenic Arabidopsis overexpressing AgMYB1. Previous studies reported that R2R3-MYB and bHLH TFs interacted and co-regulated the anthocyanin pathway in many species[24, 67]. Considering the bHLH-interaction motif in the R2R3 domain, the combination of AgMYB1 and bHLH proteins was also investigated in this study. The growth assay of yeast with various OD values indicated that the bHLH-binding activity of AgMYB2 was stronger than that of AgMYB1. TFs regulate the transcript of target genes via interacting with its upstream promoters. McMYB10 directly binds with the promoter of McF3’H and activates its expression, thereby promoting anthocyanin biosynthesis in crabapple[42]. We also performed a yeast one hybrid assay with AgMYB1 with the promoter of AgF3’H, whereas the promoter showed strong self-activation and affected the verification of interaction. The strong self-activation may be due to the activation of transcription factors inside the yeast. Foods rich in anthocyanins have health-promoting values by improving antioxidant activities in the human diet[68]. The expression of specific TF improved the antioxidant capacities of plants and it is considered beneficial for human health[69]. Our results showed that the overexpression of single R2R3-MYB, AgMYB1, without co-expression of other TFs, can improve anthocyanin production and antioxidant capacity in transgenic plants.

    The regulatory mechanism of anthocyanin biosynthesis in higher plants is complicated. Many regulatory genes involved in anthocyanin biosynthesis were identified and genetically mapped in carrot[70, 71]. A previous study reported that DcMYB7, rather than DcMYB6, was responsible for anthocyanin accumulation in purple carrot taproots[72]. So far, AgMYB1 and AgMYB2 were identified from S6 subgroup of R2R3-MYB family, and we have made comparison and analysis in this study. The regulatory mechanism of anthocyanin pathway controlled by AgMYB1 and AgMYB2 in purple celery is still unclear. In future, we will focus on the interaction and regulatory mechanism between AgMYB1 and AgMYB2 and how they co-regulate anthocyanin biosynthesis in purple celery.

  • In this study, we mainly focused on the identification of AgMYB1, an R2R3-MYB TF related to anthocyanin biosynthesis in purple celery. The results indicate that AgMYB1 can promote anthocyanin production and antioxidant activity in transgenic plants. The present study presents useful information for the research of anthocyanin regulation and provides a strategy for cultivating plants with high levels of anthocyanins.

  • This study was financially supported by the Jiangsu Agricultural Science and Technology Innovation Fund [CX(2018)2007], Priority Academic Program Development of Jiangsu Higher Education Institutions (PAPD); Postgraduate Research & Practice Innovation Program of Jiangsu Province (KYCX18_0692).

    • The authors declare that they have no conflict of interest.
    • Copyright: © 2021 by the author(s). Exclusive Licensee Maximum Academic Press, Fayetteville, GA. This article is an open access article distributed under Creative Commons Attribution License (CC BY 4.0), visit https://creativecommons.org/licenses/by/4.0/.
Figure (10)  Table (1) References (72)
  • About this article
    Cite this article
    Feng K, Xing G, Liu J, Wang H, Tan G, et al. 2021. AgMYB1, an R2R3-MYB factor, plays a role in anthocyanin production and enhancement of antioxidant capacity in celery. Vegetable Research 1: 2 doi: 10.48130/VR-2021-0002
    Feng K, Xing G, Liu J, Wang H, Tan G, et al. 2021. AgMYB1, an R2R3-MYB factor, plays a role in anthocyanin production and enhancement of antioxidant capacity in celery. Vegetable Research 1: 2 doi: 10.48130/VR-2021-0002
  • Catalog

    • About this article

    /

    DownLoad:  Full-Size Img  PowerPoint
    Return
    Return