ARTICLE   Open Access    

Content analysis of state hazard mitigation plans and their ability to address pandemics

More Information
  • Hazard mitigation plans address hazards such as earthquakes, hurricanes, landslides, tornados, flooding more explicitly than pandemics or other public health crises. This paper analyzes and identifies pandemic-related mitigation strategies in state-level hazard mitigation plans across the United States. This study identifies common and uncommon strategies that could be included in plan updates such as: use of personal protective equipment (PPE), self-isolation/quarantine, hygiene, restricted gatherings, vaccination, vulnerability assessment, economic consequences analysis, acknowledging the need to address pandemics, and referring Centers for Disease Control and Prevention (CDC) guidelines. The 54 state-level plans are compared based on their inclusion of the nine strategies. Findings show that vaccination, self-isolation/ quarantine, and vulnerability assessment are the strategies most listed in plans. Additional concerns made evident by the 2020 coronavirus pandemic, such as contact tracing, environmental impact, and public services, were limited across the plans. It was concluded that long-term mitigation strategies for reducing the risk and speed of spread such as identifying strategic locations for testing, vaccination, and quarantine should be devised and implemented. Pandemics should be included as a distinct class of hazards while formulating state hazard mitigation plans. Strategies for addressing the impact of long working hours on the mental health of healthcare workers should be explored. Economic and psychological impact of unavailability of essential public services, such as transport and groceries, should be investigated and strategies should be formulated in the mitigation plans accordingly.
  • Scale insects (Hemiptera: Coccomorpha) with hypogeic habits are considered of high phytosanitary relevance for coffee crops (Rubiaceae: Coffea spp.) in Colombia[1]. A total of 65 species of scale insects associated with coffee roots have been recorded in Colombia[24]. The most species-rich family is the Pseudococcidae with 28 species distributed in nine genera: Dysmicoccus Ferris, 1950 (13 spp.), followed by Pseudococcus Westwood, 1840 (four spp.), Phenacoccus Cockerell, 1893 (three spp.), Planococcus Ferris, 1950, and Spilococcus Ferris, 1950 (two spp. each), and Chorizococcus McKenzie, 1960, Distichlicoccus Ferris, 1950, Ferrisia Fullaway, 1923, and Paraputo Laing, 1929 (one sp. each). For the family Rhizoecidae, 19 species have been recorded in six genera, namely, Rhizoecus Kunckel d'Herculais, 1878 (13 spp.), Pseudorhizoecus Green, 1933 (two spp.), and Capitisetella Hambleton, 1977, Coccidella Hambleton, 1946, Geococcus Green, 1902, and Ripersiella Tinsley, 1899 (one sp. each). Other minor families include Coccidae and Ortheziidae (five spp. in each family), Xenococcidae (three spp.), and Putoidae and Diaspididae (two spp. in each family) and Margarodidae (one sp.). For this study all previous records were re-analysed with the purpose of providing an accurate list of species

    The taxonomic identification of scale insects by a morphological approach is particularly difficult, mainly for two reasons. First, they are small insects (usually < 5 mm) that require the preparation of slide-mounted specimens. Second, the taxonomic keys needed for morphological identifications are primarily designed for adult female specimens[5]. Differing from other insect orders (e.g., Coleoptera, Diptera and Hymenoptera), female scale insects lack well-defined tagmata, as well as sclerites, sutures, or discernible areas. Characters of taxonomic value in scale insects include cuticular processes, such as pores, ducts and, setae[5]. Recognizing these cuticular structures on such small bodies poses a difficult task for non-expert entomologists. To facilitate accessible identification, this manuscript offers an illustrated taxonomic key to scale insect species associated with coffee roots in Colombia and is aimed at users with basic knowledge of scale insect morphology.

    A careful revision of the specimens studied by Caballero et al.[2], preserved in the Scale Insect Collection at the Entomological Museum 'Universidad Nacional Agronomía Bogota' UNAB (Bogotá, Colombia), was carried out to exclude species that are doubtfully recorded from coffee roots in Colombia. This re-assessment allowed the compilation of an accurate list of species that could be included in the taxonomic key. Additional species and information from Caballero[3] and Caballero et al.[4] also were used for construction of the key. List of species recorded for Colombia and c ollection data of specimens analized are in Supplemmental Table S1 and S2 respectivately.

    The illustrated taxonomic key (Table 1) is based on the external morphology of the adult female with a dichotomous structure. Each couplet after the first one is numbered followed by the number of the preceding couplet in parenthesis, e.g. 12(7) means that couplet 12 is derived from couplet 7; the numbers at the end of the couplet indicate the next couplet in order to arrive at the species name that best matches the character states selected by the user. It is illustrated in most of the steps using microphotographs. Acquisition and analysis of images were done with a Lumenera 1-5C camera and the software Image Pro Insight 8.0. Designs were performed with Affinity Photo V 2.1 and Affinity Designer V 2.1 software. The taxonomic keys were structured with some adaptations of published taxonomic keys[615]. The general morphological terminology follows Kondo & Watson[5] with specific terminology for Coccidae[6,16], Margarodidae[17], Ortheziidae[7], Diaspididae[18], Pseudococcidae, Putoidae[8,9], and Rhizoecidae[10,11]. The abdominal segmentation is given as SabdI for abdominal segment 1 to SabdVIII for abdominal segment 8. All microphotographs are of adult female scale insects or their taxonomically important morphological structures.

    Table 1.  Illustrated taxonomic key.
    No.DetailsRef.
    1Abdominal spiracles present (Fig. 1a)2
    Abdominal spiracles absent (Fig. 1b)7
    Fig. 1 Abdominal spiracles (sp) on margin (a) present on Eurhizococcus colombianus, (b) absent on Distichlicoccus takumasai.
    2(1)Anal aperture without pores and setae (Fig. 2a); legs shorter than half of the transversal diameter of body (Fig. 2b); eyespots and mouthparts absentEurhizococcus colombianus

    Jakubski, 1965
    Anal aperture forming a well-developed anal ring with pores and setae (Fig. 2c); legs longer than transversal diameter of body; eyespots and mouthparts present (Fig. 2d)
    3
    Fig. 2 Eurhizococcus colombianus: (a) Anal aperture without pores and setae in the border, (b) section of mid body showing the length of hind leg (lel) and transversal body line (btl). Insignorthezia insignis: (c) Anal aperture with pores (po) and setae (st), (d) section of head with protruding eyespot (es) and labium (lb).
    3(2)Antennae each with eight segments (Fig. 3a)4
    Antennae each with fewer than five segments (Fig. 3b)5
    Fig. 3 (a) Eight-segmented antenna. (b) Four-segmented antenna.
    4(3)Transversal bands of spines absent in ventral region surrounded by an ovisac band (Fig. 4a); dorsal interantennal area without sclerosis (Fig. 4b)Insignorthezia insignis (Browne, 1887)
    Transversal bands of spine plates present in ventral region surrounded by an ovisac band (Fig. 4c); longitudinal sclerosis on dorsum in interantennal area (Fig. 4d)Praelongorthezia praelonga (Douglas, 1891)
    Fig. 4 Insignorthezia insignis: (a) Abdomen without transversal clusters of wax plates, (b) Dorsal interantennal area without sclerosis. Praelongorthezia praelonga: (c) Abdomen with transversal clusters of wax plates marked by dash lines, (d) dorsal interantennal area with a longitudinal sclerotic plate (ep).
    5(3)Antennae each with three segments (Fig. 5a)Newsteadia andreae Caballero, 2021
    Antennae each with four segments (Fig. 5b)6
    Fig. 5 (a) Three-segmented antenna of Newsteadia andreae. Note the presence of pseudosegmentation which gives the appearance of additional segments in the last antennal segment. (b) Four-segmented antenna of Mixorthezia minima.
    6(5)Dorsal area anterior to anal ring with simple pores on protuberances (Fig. 6a); ventral areas surrounding each coxa with a row of wax plate spines (Fig. 6b)Mixorthezia minima Koczné Benedicty & Kozár, 2004
    Dorsal area anterior to anal ring without simple pores or protuberances (Fig. 6c); ventral areas posterior to each coxa without wax plate spines (Fig. 6d)Mixorthezia neotropicalis (Silvestri, 1924)
    Fig. 6 Mixorthezia minima: (a) Dorsum of area anterior to anal ring with close-up of simple pores on protuberances (dash box); (b) ventral area posterior to each coxa with a row of wax plate spines (dash box). Mixorthezia neotropicalis: (c) Close-up of dorsum of area anterior to anal ring lacking simple pores on protuberances (dash box); (d) ventral area posterior to each coxa without associated wax plate spines.
    7(1)Anal plates present (Fig. 7a)8
    Anal plates absent (Fig. 7b)12
    Fig. 7 (a) Anal apparatus of Saissetia coffeae with anal plates (ap) covering the anal aperture (aa). (b) Anal apparatus of Pseudococcus sp. with anal aperture lacking anal plates.
    8(7)Antennae and legs with length similar to or shorter than spiracles (Fig. 8a)9
    Antennae and legs with length at least twice as long as spiracles (Fig. 8b)11
    Fig. 8 (a) Antenna (an) and foreleg (lg) (green lines), and anterior spiracle (sp) (yellow line) of Toumeyella coffeae showing their relative length. Note the similar size of the limbs and spiracle. (b) Antenna (an) and leg (lg) (green lines), and anterior spiracle (sp) (yellow line) of Coccus viridis showing their relative length. Note the relatively smaller size of the spiracle.
    9(8)Ventral tubular macroducts present (Fig. 9)Toumeyella coffeae
    Kondo, 2013
    Ventral tubular macroducts absent10
    Fig. 9 Ventral tubular macroducts (dash box) and close-up of macroducts (photo on right side).
    10(9)Orbicular pores (Fig. 10a) and cribriform platelets present (Fig. 10b); dorsal setae absent; opercular pores absentCryptostigma urichi (Cockerell, 1894)
    Orbicular pores and cribriform platelets absent; dorsal setae present (Fig. 10c); numerous opercular pores present throughout mid areas of dorsum (Fig. 10d)Akermes colombiensis Kondo & Williams, 2004
    Fig. 10 Cryptostigma urichi: (a) Orbicular pore and (b) close-up of a cribriform platelet. Akermes colombiensis: (c) Close-up of a dorsal body setae (dash box) and (d) close-up of opercular pores (arrows).
    11(8)Band of ventral tubular ducts in lateral and submarginal regions absent, ventral tubular ducts of one type; anal plates without discal setae (Fig. 11a); dorsal body setae capitate or clavate (Fig. 11b); perivulvar pores with seven or eight loculi, rarely with 10 loculi (Fig. 11c)Coccus viridis
    (Green, 1889)
    Band of ventral tubular ducts in lateral and submarginal regions present, submarginal region with two types of tubular ducts (Fig. 11d); anal plates with discal setae (Fig. 11e); dorsal body setae spine-like, apically pointed (Fig. 11f); perivulvar pores mostly with 10 loculi (Fig. 11g)Saissetia coffeae
    (Walker, 1852)
    Fig. 11 Coccus viridis: (a) Anal plates without discal setae; (b) dorsal body setae capitate (top) or clavate (below); (c) multilocular disc pores mostly with eight loculi. Saissetia coffeae: (d) Ventral submarginal region with two types of tubular ducts; (e) each anal plate with a discal seta; (f) dorsal body setae acute; (g) multilocular disc pores with mostly 10 loculi.
    12(7)Cerarii present on body margin, at least a pair on each anal lobe (Fig. 12a)13
    Cerarii absent on body margin (Fig. 12b)38
    Fig. 12 Abdominal body margin of (a) Pseudococcus sp. with three cerarii (dash box) and (b) Rhizoecus sp. (dash box) without cerarii.
    13(12)Enlarged oral collar tubular ducts composed of a sclerotized area surrounding the border and a set of flagellated setae (Ferrisia-type oral collar tubular ducts) (Fig. 13a)Ferrisia uzinuri
    Kaydan & Gullan, 2012
    Oral collar tubular ducts simple, not as above (Fig. 13b) or absent14
    Fig. 13 (a) Ferrisia-type oral collar tubular ducts with aperture of tubular duct (ad) surrounded by a sclerotized area (sa) and associated flagellate setae (fs). (b) Oral collar tubular ducts simple (arrows).
    14(12)Antenna with nine segments (Fig. 14a)15
    Antenna with eight segments (Fig. 14b) or fewer (Fig. 14c)19
    Fig. 14 Antenna with (a) nine segments, (b) eight segments and (c) seven segments.
    15(14)Cerarii with more than five conical setae (Fig. 15a); hind trochanter with six sensilla, three on each surface (Fig. 15b)16
    Cerarii with two lanceolate setae (Fig. 15c); hind trochanter with four sensilla, two on each surface (Fig. 15d)17
    Fig. 15 Puto barberi: (a) upper and lateral view of a cerarius, (b) close-up of the surface of trochanter with three sensilla (arrows). Phenacoccus sisalanus: (c) cerarius, (d) trochanter with two sensilla (arrows) on single surface.
    16(15)Cerarii with tubular ducts (Fig. 16a)Puto antioquensis
    (Murillo, 1931)
    Cerarii without tubular ducts (Fig. 16b)Puto barberi
    (Cockerell, 1895)
    Fig. 16 (a) Cerarius associated with tubular ducts (arrows). (b) Cerarius without tubular ducts.
    17(15)Oral collar tubular ducts absentPhenacoccus sisalanus Granara de Willink, 2007
    Oral collar tubular ducts present, at least on venter (Fig. 17)18
    Fig. 17 Ventral surface with oral collar tubular ducts (dash circles).
    18(17)Oral collar tubular ducts restricted to venterPhenacoccus solani
    Ferris, 1918
    Oral collar tubular ducts present on dorsum and venterPhenacoccus parvus Morrison, 1924
    19(14)Oral rim tubular ducts present (Fig. 18)20
    Oral rim tubular ducts absent26
    Fig. 18 Oral rim tubular ducts in upper view (dash circles) and close-up of lateral view.
    20(19)Oral rim tubular ducts present on venter onlyPseudococcus landoi (Balachowsky, 1959)
    Oral rim tubular ducts present on both dorsum and venter21
    21(20)Cerarii restricted to anal lobes (Fig. 19a)Chorizococcus caribaeus Williams & Granara de Willink, 1992
    Cerarii present, at least on the last five abdominal segments (Fig. 19b)22
    Fig. 19 Location of cerarii (dash boxes) on abdominal margin with close-up of cerarius (a) restricted to anal lobes (dash boxes) and (b) cerarii present on the last five abdominal segments.
    22(21)Circulus absent (Fig. 20a)23
    Circulus present (Fig. 20b)24
    Fig. 20 Ventral mid area of abdominal segments III and IV (dash box) of (a) Distichlicoccus takumasai without circulus and (b) Pseudococcus jackbeardsleyi with circulus.
    23(22)Multilocular disc pores present on venter of SabdIV and posterior segments (Fig. 21a); hind coxa with translucent pores and hind femur without translucent pores (Fig. 21b)Spilococcus pressus
    Ferris, 1950
    Multilocular disc pores absent, if some present, not more than three around vulvar opening (i.e. venter of SabdVII or SabdVIII); hind coxa without translucent pores (Fig. 21c) and hind femur with translucent pores (Fig. 21d)Distichlicoccus takumasai Caballero, 2021
    Fig. 21 Spilococcus pressus: (a) Ventral section of abdomen with multilocular disc pores (arrows); (b) hind leg with close-up of coxa with translucent pores (arrows). Distichlicoccus takumasai: (c) Hind coxa without translucent pores; (d) hind femur with translucent pores (arrows).
    24(22)Eyes without discoidal pores nor sclerotized surrounding area (Fig. 22a); circulus with transversal diameter 40 to
    60 µm (Fig. 22b)
    Pseudococcus luciae Caballero, 2021
    Eyes with discoidal pores and sclerotized surrounding area (Fig. 22c); circulus diameter 100 to 200 µm (Fig. 22d)26
    25(24)Oral rim tubular ducts on dorsal abdominal segments numbering three to eight; area between posterior ostiole and cerarius of SabdVII without oral rim tubular ducts (Fig. 23a)Pseudococcus elisae Borchsenius, 1947
    Oral rim tubular ducts on dorsal abdominal segments numbering 14 to 27; area between posterior ostiole and cerarius of SabdVII with an oral rim tubular duct (Fig. 23b)Pseudococcus jackbeardsleyi Gimpel & Miller, 1996
    Fig. 22 Pseudococcus luciae: (a) Eyespot without surrounding sclerotized area nor associated pores; (b) circulus ca. 58 µm wide. Pseudococcus jackbeardsleyi: (a) Eyespot with sclerotized area (sa) and associated pores (po); (d) circulus ca. 154 µm wide.
    Fig. 23 (a) Dorsal margin of abdominal segments VI to VIII, between cerarius of anal lobe (C1), cerarius of SabdVII (C2) and posterior ostiole (os) without oral rim tubular ducts. (b) Dorsal margin of abdominal segments VI to VIII, between cerarius of anal lobe (C1), cerarius of SabdVII (C2) and posterior ostiole (os) with an oral rim tubular duct and/or cerarius adjacent to SabdVII.
    26(19)Oral collar tubular ducts (Fig. 24) on both dorsum and venter27
    Oral collar tubular ducts restricted to venter28
    Fig. 24 Oral collar tubular duct in lateral view.
    27(26)Hind coxa with translucent pores (Fig. 25a); anal lobe with sclerotized bar, not on a sclerotized area (Fig. 25b); multilocular disc pores present posterior to fore coxaPlanococcus citri-minor complex
    Hind coxa without translucent pores (Fig. 25c); anal lobe without sclerotized bar, on a sclerotized area (Fig. 25d); multilocular disc pores absent posterior to fore coxaDysmicoccus quercicolus (Ferris, 1918)
    28(27)Oral collar tubular ducts absent on venter of both head and thorax.29
    Oral collar tubular ducts present on either head or thorax, but not on both areas (Fig. 26)30
    Fig. 25 Planococcus citri-minor complex: (a) Hind coxa with translucent pores (dash box) and (b) anal lobe with a sclerotization forming a bar (ab). Dysmicoccus quercicolus: (c) Hind coxa without translucent pores and (d) anal lobe with irregular broad sclerotized area (sa).
    Fig. 26 Marginal area of Dysmicoccus grassii, lateral to posterior spiracle (ps), with close-up of oral collar tubular ducts (oc) (left side).
    29(28)Translucent pores present on hind coxa, trochanter, femur and tibia (Fig. 27a); marginal clusters of oral collar tubular ducts on venter of SabdVI and SabdVIIDysmicoccus caribensis Granara de Willink, 2009
    Translucent pores restricted to hind femur and tibia (Fig. 27b); marginal clusters of oral collar tubular ducts present on venter of SabdIV to SabdVIIParaputo nasai
    Caballero, 2021
    Fig. 27 (a) Hind leg of Dysmicoccus caribensis with translucent pores on coxa (cx), trochanter (tr) and femur (fm), and tibia (tb). (b) Hind leg of Paraputo nasai with translucent pores restricted to femur (fm) and tibia (tb).
    30(28)Hind coxa with translucent pores (Fig. 28a)Dysmicoccus sylvarum
    Williams & Granara de Willink, 1992
    Hind coxa without translucent pores (Fig. 28b)31
    Fig. 28 (a) Translucent pores on hind coxa. (b) Translucent pores absent on hind coxa.
    31(30)Hind trochanter with translucent pores (Fig. 29a)Dysmicoccus varius
    Granara de Willink, 2009
    Hind trochanter without translucent pores (Fig. 29b)32
    Fig. 29 Translucent pores (a) on hind trochanter, (b) absent from hind trochanter.
    32(31)Oral collar tubular ducts present on margin of thorax (Fig. 30)33
    Oral collar tubular ducts absent from margin of thorax34
    Fig. 30 Prothorax margin of Dysmicoccus grassii with close-up of oral collar tubular ducts.
    33(32)Multilocular disc pores absent on SabdV; dorsal area immediately anterior to anal ring with tuft of flagellate setae; longest flagellate seta as long as diameter of anal ring (Fig. 31a), and discoidal pores larger than trilocular pores (Fig. 31b)Dysmicoccus radicis
    (Green, 1933)
    Multilocular disc pores present on SabdV; dorsal area immediately anterior to anal ring without a tuft of flagellate setae; flagellate setae much shorter than diameter of anal ring (Fig. 31c) and discoidal pores smaller than trilocular pores (Fig. 31d)Dysmicoccus grassii (Leonardi, 1913)
    34(32)Oral collar tubular ducts absent in interantennal area35
    Oral collar tubular ducts present in interantennal area (Fig. 32)36
    35(34)Translucent pores on hind leg restricted to tibia (Fig. 33a)Dysmicoccus perotensis
    Granara de Willink, 2009
    Translucent pores on hind leg present on tibia and femur (Fig. 33b)Dysmicoccus joannesiae-neobrevipes complex
    Fig. 31 Dysmicoccus radicis: (a) Area anterior to anal ring with a cluster of flagellate setae (fs) and anal ring (ar) showing the diameter of the different pores (dash box); (b) discoidal pores (dp) and trilocular pores (tp). Dysmicoccus grassii: (c) Area anterior to anal ring with scattered short flagellate setae (fs) contrasted with anal ring (ar) diameter (dash box); (d) discoidal pores (dp) and trilocular pores (tp) with similar diameter.
    Fig. 32 Interantennal area (dash box) of Dysmicoccus brevipes with close-up of oral collar tubular ducts.
    Fig. 33 (a) Hind leg of Dysmicoccus perotensis with close-up of femur and tibia with translucent pores on tibia only (arrows). (b) Hind leg of Dysmicoccus joannesiae-neobrevipes complex with close-up of femur and tibia with translucent pores (arrows).
    36(34)Hind coxa with translucent pores (see Fig. 28a)Dysmicoccus mackenziei
    Beardsleyi, 1965
    Hind coxa without translucent pores (see Fig. 28b)37
    37(36)Dorsal SabdVIII setae forming a tuft-like group, each seta conspicuously longer than remaining dorsal abdominal setae (Fig. 34a) and setal length similar to anal ring diameter (60–80 µm long)Dysmicoccus brevipes (Cockerell, 1893)
    Dorsal SabdVIII setae evenly distributed, each setae as long as remaining dorsal abdominal setae (Fig. 34b) and length less than half diameter of anal ringDysmicoccus texensis-neobrevipes complex
    38(12)Tritubular ducts absent39
    Tritubular ducts present (Fig. 35a-b)46
    Fig. 34 (a) Abdomen of Dysmicoccus brevipes with dorsal setae on SabdVIII (lfs) longer than setae on anterior segments (sfs). (b) Abdomen of Dysmicoccus texensis-neobrevipes complex with dorsal setae (ufs) along the abdominal segments of uniform length and scattered distribution.
    Fig. 35 (a) Tritubular duct in upper (left) and lateral view (right) with the border of the cuticular ring attached to tubules. (b) Tritubular duct with the border of the cuticular ring widely separated from tubules (arrows).
    39(38)Anal lobes strongly protruded, bulbiform (Fig. 36a) jutting out from margin for a distance equivalent to diameter of anal ring40
    Anal lobes shallow, if protruded, their length never more than half of diameter of anal ring (Fig. 36b)42
    Fig. 36 (a) Abdomen of Neochavesia caldasiae with anal lobes (al) protruding beyond the anal aperture (aa). (b) Abdomen of Ripersiella sp. with anal lobes (al) at the same level as the anal aperture (aa).
    40(39)Anal aperture located at the same level as the base of anal lobes (Fig. 37a); antennae located on ventral margin of headNeochavesia caldasiae (Balachowsky, 1957)
    Anal aperture located anterior to bases of anal lobes (Fig. 37b); antennae located on dorsum of head41
    Fig. 37 (a) Abdomen of Neochavesia caldasiae with anal aperture (aa) positioned between the anal lobes (al), at the same level as the bases of anal lobes (dash line). (b) Abdomen of Neochavesia eversi with anal aperture (aa) situated anterior to the bases of the anal lobes (al) (dash line).
    41(40)Antennae each with five segments, situated on a membranous base (Fig. 38a); length of hind claw less than length of hind tarsus (Fig. 38b)Neochavesia trinidadensis (Beardsley, 1970)
    Antennae each with four segments, situated on a sclerotized base (Fig. 38c); hind claw longer than hind tarsus (Fig. 38d)Neochavesia eversi (Beardsley, 1970)
    Fig. 38 (a) Antenna with four segments and a membranous base (mb). (b) Hind tarsus (green line) longer than the hind claw (red line). (c) Antenna with four segments and a sclerotized base (sb). (d) Hind tarsus (green line) shorter than hind claw (red line).
    42(39)Body setae capitate, at least on one surface (Fig. 39a)43
    Body setae never capitate (Fig. 39b)44
    Fig. 39 (a) Capitate setae. (b) Flagellate setae.
    43(42)Anal aperture without associated cells (Fig. 40a); three-segmented antennae (Fig. 40b); ventral setae in median
    and submedian regions capitate
    Capitisitella migrans
    (Green, 1933)
    Anal aperture surrounded by cells (Fig. 40c); six-segmented antennae (Fig. 40d); ventral setae in medial and submedial regions flagellateWilliamsrhizoecus coffeae
    Caballero & Ramos, 2018
    44(42)Three-segmented antennae (Fig. 41a); circulus present (Fig. 41b)Pseudorhizoecus bari
    Caballero & Ramos, 2018
    Five-segmented antennae (Fig. 41c); circulus absent45
    Fig. 40 Capitisitella migrans: (a) Anal aperture of surrounded only by setae; (b) antenna composed of three segments. Williamsrhizoecus coffeae: (c) Anal aperture of surrounded by setae and cells (flesh); (d) antenna composed of six segments.
    Fig. 41 Pseudorhizoecus bari: (a) Antenna composed of three segments and (b) circulus. (c) Antenna of Pseudorhizoecus proximus composed of five segments.
    45(44)Multilocular disc pores absent; anal aperture ornamented with small protuberances and two to five short setae, each seta never longer than 1/3 diameter of anal aperture, without cells (Fig. 42a)Pseudorhizoecus proximus
    Green, 1933
    Multilocular disc pores present (Fig. 42b); anal aperture not ornamented with small protruberances, ring with well-developed cells and six long setae, each seta as long as diameter of anal ring (Fig. 42c)Ripersiella andensis (Hambleton,
    1946)
    Fig. 42 (a) Anal aperture of Pseudorhizoecus proximus surrounded by protuberances (pr) and a few short setae (st). Ripersiella andensis: (b) Ventral section of abdomen with multilocular disc pores (mp); (c) anal aperture with a ring of cells and six long setae (se).
    46(38)Anal lobes strongly protruded, conical, each one with a stout spine at apex (Fig. 43a)Geococcus coffeae
    Green, 1933
    Anal lobes flat or barely protruded, without spines at apex (Fig. 43b)47
    47(46)Venter of abdomen with clusters of trilocular pores in medial region (Fig. 44a)Coccidella ecuadorina Konczné Benedicty & Foldi, 2004
    Venter of abdomen with trilocular pores evenly dispersed, never forming clusters in medial region (Fig. 44b)48
    Fig. 43 (a) Abdomen of Geococcus coffeae with protruding anal lobe (al) with a stout spine at the apex (sp). (b) Abdomen of Rhizoecus sp. with anal lobe (al) flat, with numerous flagellate setae (fs) at the apex.
    Fig. 44 (a) Ventral surface of Coccidella ecuadorina with clusters of trilocular pores (tc) (dash box) on medial region of abdomen. (b) Ventral surface of Rhizoecus sp. with trilocular pores (tr) scattered on venter of abdomen.
    48(47)Antennae with six well-developed segments (Fig. 45a)51
    Antennae with five well-developed segments (Fig. 45b), apical segment sometimes partially divided (Fig. 45c)49
    Fig. 45 (a) Six-segmented antenna. (b) Five-segmented antenna. (c) Five-segmented antenna with partially divided apical segment (pd). Note: antennal segments numbered in Roman numerals.
    49(48)Antennae length more than 140 µm (Fig. 46a); tritubular ducts of similar diameter to trilocular pores (± 2 µm variation) (Fig. 46b); tritubular ducts with space between ductules and edge as wide as the ductules (Fig. 46c); slender ductule, width/length ratio 1:6Rhizoecus coffeae
    Laing, 1925
    Antennae length less than 130 µm (Fig. 46d); tritubular ducts of diameter nearly twice diameter of trilocular pores (Fig. 46e); tritubular ducts with reduced space or without space between ductules and edge (Fig. 46f); stout ductule, width/length ratio 1:350
    50(49)Tubular ducts present (Fig. 47a); each anal lobe with around 28 dorsal setae of similar length, greater than 30 µm (Fig. 47b, al); and dorsal marginal clusters of setae on SabdVII 20–30 µm long (Fig. 47b, SabdVII)Rhizoecus setosus (Hambleton, 1946)
    Tubular ducts absent; each anal lobe with around 14 dorsal setae, with length less than 15 µm (Fig. 47c, al); dorsal marginal clusters of setae on SabdVII with length less 15 µm (Fig. 47c, SabdVII)Rhizoecus compotor
    Williams & Granara de Willink, 1992
    Fig. 46 (a) Antenna ca. 207 µm long. (b) Tritubular ducts (td) and trilocular pores (tp) with similar diameter. (c) Close-up of a tritubular duct indicating the space between the cuticular ring (mg) and the ductule (dt). (d) Antenna ca. 105 µm long. (e) Each tritubular duct (td) twice the diameter of a trilocular pore (tp). (f) Close-up of tritubular duct without a space between the cuticular ring (mg) and the ductule (dt).
    Fig. 47 Rhizoecus setosus: (a) Tubular ducts (td); (b) anal lobe (al) and abdominal segment (SabdVII) with marginal clusters of setae longer than 30 µm. (c) Abdomen of Rhizoecus compotor with marginal cluster of setae shorter than 20 µm on anal lobe (al) and abdominal segment (SabdVII).
    51(48)Fore tibia with at least one of two internal preapical setae spine-like (Fig. 48a-b)52
    Fore tibia with both internal preapical setae flagellate (Fig. 48c)56
    Fig. 48 Fore legs with preapical setae on tibia (ft): (a) one flagellate (fs) and one spine seta (ss), (b) with a pair of spine setae (ss), (c) with a pair of flagellate setae (fs).
    52(51)Fore tibia with one internal preapical spine-like setae and other seta flagellate (Fig. 48a); anal ring composed of spine-like setae (Fig. 49a); circulus absentRhizoecus spinipes (Hambleton, 1946)
    Fore tibia with both internal preapical setae spine-like (Fig. 48b); anal ring composed of flagellate-like setae (Fig. 49b); at least, one circulus present (Fig. 49c)53
    Fig. 49 (a) Anal ring (ar) of Rhizoecus spinipes with spine-like setae (ss). (b) Anal ring (ar) of Rhizoecus arabicus with flagellate setae (fs). (c) Circulus of Rhizoecus cacticans.
    53(52)Claw digitules setose and short, length less than half length of claw (Fig. 50a)54
    Claw digitules capitate and long, as long as claw (Fig. 50b)55
    Fig. 50 Claw with claw digitule: (a) setose (sd), (b) flagellate (fd).
    54(53)Anal ring with external row composed of 35 cells or more (Fig. 51a, ext); anal ring with external and internal rows separated by a space as wide as a cell of the external row (Fig. 51a, spc); anal ring cells without spicules (Fig. 51a, sp)Rhizoecus variabilis Hambleton, 1978
    Anal ring with external row composed of less than 30 cells (Fig. 51b, ext); anal ring with external and internal rows separated by a narrow space, as wide as half (or less) a cell of the external row (Fig. 51b, spc); anal ring cells with spicules (Fig. 51b, sp)Rhizoecus arabicus Hambleton, 1976
    Fig. 51 (a) Anal ring of Rhizoecus variabilis with external row (ext) of anal ring consisting of over 35 cells; external row separated from the internal row (int) by a similar width as the diameter of a cell (spc). (b) Anal ring of Rhizoecus arabicus with external row (ext) of anal ring with less than 30 cells; external row separated from the internal row (int) by a width less than half the diameter of a cell (spc); cells of the external row with spicules (sp).
    55(53)More than 80 tritubular ducts; circulus with basal diameter at least five times greater than apical diameter (Fig. 52a); stick-like genital chamber, parallel borders and all of similar width and structure, length across about two abdominal segments (169–175 µm long) (Fig. 52b)Rhizoecus atlanticus (Hambleton, 1946)
    Less than 50 tritubular ducts; circulus with basal diameter less than three times the apical diameter (Fig. 52c); genital chamber with basal third two times wider than anterior two-thirds, length across one abdominal segment (43–52 µm long) (Fig. 52d)Rhizoecus cacticans (Hambleton, 1946)
    Fig. 52 Rhizoecus atlanticus: (a) Circulus with diameter at base five times the apical diameter, (b) genital chamber tubular shape, length ca. 150 µm long. Rhizoecus cacticans: (c) Circulus with diameter at base about two times the apical diameter, (d) genital chamber with proximal section basiform and distal section tubular, with arms, length ca. 45 µm long.
    56(51)Multilocular disc pores absent on dorsumRhizoecus mayanus (Hambleton, 1946)
    Multilocular disc pores present on dorsum57
    57(56)Marginal prothoracic setae length greater than 50 µm (Fig. 53a); marginal SabdVII setae length greater than 45 µm (Fig 53b)Rhizoecus colombiensis Ramos-Portilla & Caballero, 2016
    Marginal prothoracic setae length less than 25 µm (Fig. 53c); marginal SabdVII setae length less than 30 µm (Fig. 53d)58
    Fig. 53 Rhizoecus colombiensis: (a) Body margin with a long seta (pts) (> 40 µm), longer than remaining setae in prothorax; (b) margin of abdominal segment VII (SabdVII) (st). with a long seta (pts) (> 40 µm), longer than remaining setae in abdomen. Rhizoecus americanus: (c) Margin of prothorax (pts) with setae of uniform length, shorter than 30 µm; (d) margin of abdominal segment VII (SabdVII) with setae (st) shorter than 30 µm.
    58(57)Tritubular ducts of two sizesRhizoecus caladii
    Green, 1933
    Tritubular ducts of three sizesRhizoecus americanus (Hambleton, 1946)
     | Show Table
    DownLoad: CSV

    The following illustrated taxonomic key (Table 1) is a tool for the identification of adult female scale insects (Hemiptera : Sternorrhyncha : Coccomorpha) associated with coffee roots in Colombia, which includes 59 species from seven families (see Supplemental Table S1).

    The taxonomic key includes 59 species associated with coffee roots. Hemiberlesia sp., Odonaspis sp., Rhizoecus stangei McKenzie, 1962, Spilococcus mamillariae (Bouche, 1844), Planococcus citri (Risso, 1813) and Planococcus minor (Maskell, 1897) were excluded from the key. In the case of the two armoured scale insects, the specimens were found in Berlese funnel samples associated with coffee roots[2], however, there is no evidence of these species feeding on the roots and there are no previous records of association of Hemiberlesia nor Odonaspis species with coffee roots.

    Previous records of single specimens of R. stangei and S. mamillariae by Caballero et al.[2] were determined as misidentifications of Rhizoecus caladii Green, 1933 and Spilococcus pressus Ferris, 1950, respectively. Spilococcus mamillariae is considered as an oligophagous species, but mainly associated with Cactaceae plants and feeding on the aerial parts of plants[19,20]. There are no records of S. mamillariae being found on any plant species of the family Rubiaceae, and hence we have removed this species from the list of species associated with coffee roots. The species R. stangei, which has been recorded only from Mexico and lacks information on its host plant[21] has apparently not been found since its original description[8].

    Planococcus citri and Pl. minor were listed also by Caballero et al.[2] as literature records. the morphological identification of P. citri and P. minor needs to be complemented with molecular and geographical analysis to be more accurate[22]. Therefore, the present key considers only identification to the Planococcus citri-minor complex.

    Furthermore, many specimens of Dysmicoccus collected from coffee roots in Colombia have morphological character states that overlap with Dysmicoccus neobrevipes Beardsley, 1959, Dysmicoccus joannesiae (Costa Lima, 1939) and Dysmicoccus texensis (Tinsley, 1900). The first case is a mix of character states of D. texensis and D. neobrevipes. The number of setae in the abdominal cerarii and the size of oral collar tubular ducts are the most important characters used to differentiate the adult females of Dysmicoccus species[8,23]. Adult females of D. texensis have a consistent pattern of only two setae in all thoracic and abdominal cerarii, along with a uniform size of oral collar tubular ducts (OC). On the other hand, D. neobrevipes varies in the number of setae in the cerarii, ranging from two to seven, accompanied by two distinct sizes of OC. These character states are generally constant among specimens found on the aerial parts of plants. However, among the specimens examined here, while the anal lobe cerarii consistently have two setae on the specimens of D. texensis found on the roots, the remaining cerarii display a variable number of setae, notably ranging from two to five, particularly within the abdominal cerarii. Furthermore, the OC of these specimens all are the same size. Regarding the differences in number of setae in the cerarii, Granara de Willink[23] underlined the need of more comprehensive studies to definitively separate these species.

    The second case involves D. joannesiae and D. neobrevipes. These species exhibit similarities in the number of setae on each cerarius (ranging from two to seven setae per cerarius) and differences in the number of clusters of OC along the abdominal margin; D. joannesiae has more than 25 clusters of OC and D. neobrevipes has fewer than 10 clusters of OC[8]. Granara de Willink also separated these two species by the presence of OC on the thorax and head[23] (present in D. neobrevipes and absent in D. joannesiae). Within the specimens of putative D. neobrevipes studied here, a few had clusters of OC numbering 15 to 20 along the abdominal margin and OC on the thorax and head. The primary challenge with addressing this dilemma lies in the fact that D. joannesiae has only been reported on Joannesia princeps Vell., 1798 (Euphorbiaceae) in Brazil and on Annona muricata (Annonaceae) intercepted in London from Saint Lucia[8,24]. Moreover, there has been no additional morphological variations recorded in the new records of D. joannesiae since its initial description in 1932 by Costa Lima. Therefore, the character states defining D. joannesiae are based on six type specimens. Based on these arguments, the following taxonomic key considers two species complex groups, namely the Dysmicoccus texensis-neobrevipes complex and the D. joannesiae-neobrevipes complex.

    Following article 31.1.2 of the International Commission of Nomenclature (ICZN), herein we make a change in nomenclature for Distichlicoccus takumasae Caballero, 2021. The ending -ae for takumasae is incorrect because the species was dedicated to Dr. Takumasa Kondo (a male coccidologist), and thus the correct ending is -i, hence the species epithet is herein amended to 'takumasai'. The corrected name is Distichlicoccus takumasai Caballero, 2021.

    After reviewing the species of scale insects associated with coffee roots in Colombia, we have compiled a list of 59 species (Supplemental Table S1). Although this study did not focus on the effect of habit (aerial vs underground) or host plant on the morphology of scale insects, we detected significant morphological variation within facultative hypogeal species. Until further studies allow an understanding of the overlap of character states between D. texensisD. neobrevipes and D. joannesiaeD. neobrevipes, we suggest considering these species as a morphological complex for hypogeal specimens. Further ecomorphological studies should be conducted to determine whether the morphology of a species may differ when feeding on the aerial parts compared when feeding on the underground parts of a host and to try to elucidate what factors trigger those changes, especially in species associated with coffee plants. As for the species complex, further collecting, morphological, and molecular studies should help elucidate these taxonomic problems.

    During the literature review performed for this study, we realized that most of the records of species are limited to mentioning the host but not the plant part on which collections were made, however, it is suspected that most species are normally collected from the aerial parts of the plant host. Although this taxonomic key is limited to root-associated species recorded in Colombia, this key could be useful for identifying scale insects associated with coffee in other tropical regions, extending also to species collected from the aerial parts of the hosts.

    The authors confirm contributions to the paper as follows: study conception and design: Caballero A, Kondo T; data collection: Caballero A, Kondo T; analysis and interpretation of results: Caballero A, Kondo T; draft manuscript preparation: Caballero A, Kondo T. Both authors reviewed the results and approved the final version of the manuscript.

    The data (microscopy slides of specimens) that support the findings of this study are available in the Scale insect repository of the entomological museum Universidad Nacional Agronomia Bogota – UNAB, Facultad de Ciencias Agrarias, Colombia. All data generated or analyzed during this study are included in this published article and its supplementary information files.

    The authors thank Dr. Andrea Ramos-Portilla for clarifying some aspects of the morphological variations of Rhizoecus species and Dr. Penny Gullan (Australian National University, Canberra, Australia) for reviewing an earlier version of the manuscript. Many thanks to Erika Valentina Vergara (AGROSAVIA) and Dr. Francisco Serna (Universidad Nacional de Colombia) for their help to access the Museum UNAB. Special thanks to Dr Giuseppina Pellizzari (University of Padova, Italy) for advice on scientific nomenclature. This study was financed by Colciencias (Programa Nacional de Ciencias Básicas [National Program on Basic Sciences]), code 110165843233, contract FP44842-004-2015), by the entomological museum UNAB (Facultad Ciencias Agrarias, Universidad Nacional de Colombia, sede Bogotá) and by Federación Nacional de Cafeteros.

  • The authors declare that they have no conflict of interest.

  • [1]

    Centre for Research on the Epidemiology of Disasters - CRED. 2020. Human Cost of Disasters (2000−2019).www.emdat.be/cred-crunch-61-human-cost-disasters-2000-2019-0

    [2]

    Pearce L. 2003. Disaster management and community planning, and public participation: How to achieve sustainable hazard mitigation. Natural Hazards 28:211−28

    doi: 10.1023/A:1022917721797

    CrossRef   Google Scholar

    [3]

    Parker T, Shen R, O'Connor M, Wang Q. 2019. Application of safety triad in preparation for climate extremes affecting the process industries. Process Safety Progress 38:e12091

    doi: 10.1002/prs.12091

    CrossRef   Google Scholar

    [4]

    Godschalk DR. 2003. Urban hazard mitigation: creating resilient cities. Natural Hazards Review 4:136−43

    doi: 10.1061/(ASCE)1527-6988(2003)4:3(136)

    CrossRef   Google Scholar

    [5]

    Lindell MK. 1997. Adoption and implementation of hazard adjustments. International Journal of Mass Emergencies and Disasters 15:327−453

    Google Scholar

    [6]

    Lindell MK, Prater C, Perry RW. 2006. Introduction to Emergency Management. US: John Wiley & Sons

    [7]

    Wang Z, Gong J, Wang Q, Qiao X. 2021. Emergency Management Science and Technology: An international transdisciplinary platform. Emergency Management Science and Technology 1:1

    doi: 10.48130/EMST-2021-0001

    CrossRef   Google Scholar

    [8]

    Highfield WE, Peacock WG, Van Zandt S. 2014. Mitigation planning: why hazard exposure, structural vulnerability, and social vulnerability matter. Journal of Planning Education and Research 34:287−300

    doi: 10.1177/0739456X14531828

    CrossRef   Google Scholar

    [9]

    FEMA. 2015. State Hazard Mitigation Plan Review Guide. Washington, DC. www.fema.gov/sites/default/files/2020-06/fema-state-mitigation-plan-review-guide_03-09-2015.pdf

    [10]

    Berke PR, Malecha ML, Yu S, Lee J, Masterson JH. 2019. Plan integration for resilience scorecard: evaluating networks of plans in six US coastal cities. Journal of Environmental Planning and Management 62:901−20

    doi: 10.1080/09640568.2018.1453354

    CrossRef   Google Scholar

    [11]

    Yu S, Brand AD, Berke P. 2020. Making room for the river: Applying a plan integration for resilience scorecard to a network of plans in Nijmegen, The Netherlands. Journal of the American Planning Association 86:417−30

    doi: 10.1080/01944363.2020.1752776

    CrossRef   Google Scholar

    [12]

    FEMA. 2021. Regulations and Guidance. FEMA. www.fema.gov/emergency-managers/risk-management/hazard-mitigation-planning/regulations-guidance

    [13]

    Ives M, Yasir S, Suhartono M. (2021, April 17). As Covid Death Toll Passes 3 Million, a Weary World Takes Stock. The New York Times. www.nytimes.com/2021/04/17/world/covid-deaths-3-million.html

    [14]

    Chan EYY, Dubois C, Fong AHY, Shaw R, Chatterjee R, et al. 2021. Reflection of Challenges and opportunities within the Covid-19 pandemic to include biological hazards into Drr Planning. International Journal of Environmental Research and Public Health 18:1614

    doi: 10.3390/ijerph18041614

    CrossRef   Google Scholar

    [15]

    Peleg K, Moran B, Attila JH, and Thomas DK. 2021. The COVID-19 pandemic challenge to the all-hazards approach for disaster planning. International Journal of Disaster Risk Reduction 55:102103

    doi: 10.1016/j.ijdrr.2021.102103

    CrossRef   Google Scholar

    [16]

    Bodas M, Thomas DK, Kobi P. 2020. Top hazards approach – rethinking the appropriateness of the all-hazards approach in disaster risk management. International Journal of Disaster Risk Reduction 47:101559

    doi: 10.1016/j.ijdrr.2020.101559

    CrossRef   Google Scholar

    [17]

    Gregory PA. 2015. Reassessing the effectiveness of all-hazards planning in emergency management. Inquiries Journal/Student Pulse 7 www.inquiriesjournal.com/a?id=1050

    [18]

    Merriam D. 2020. The pandemic and the failure to plan: We can do better. The Urban Lawyer 50:401–14. https://pesquisa.bvsalud.org/global-literature-on-novel-coronavirus-2019-ncov/resource/pt/covidwho-1134801

    [19]

    Centers for Disease Control and Prevention. 2012. Principles of Epidemiology in Public Health Practice. An Introduction to Applied Epidemiology and Biostatistics. Third Edition. www.cdc.gov/csels/dsepd/ss1978/lesson1/section11.html

    [20]

    Centers for Disease Control and Prevention. 2018. 1918 Pandemic Influenza Historic Timeline. www.cdc.gov/flu/pandemic-resources/1918-commemoration/pandemic-timeline-1918.htm?web=1&wdLOR=cC4BCDB98-9BE1-4246-8100-6BEAAEFB9375

    [21]

    Centers for Disease Control and Prevention. 2019. 2014–2016 Ebola Outbreak in West Africa. www.cdc.gov/vhf/ebola/history/2014-2016-outbreak/index.html

    [22]

    Sejvar JJ. 2003. West Nile virus: an historical overview. The Ochsner journal, 5:6−10

    Google Scholar

    [23]

    McDonald E, Martin SW, Landry K, Gould CV, Lehman J, et al. 2019. West Nile virus and other domestic nationally notifiable arboviral diseases — United States, 2018. American Journal of Transplantation 19:2949−54

    doi: 10.1111/ajt.15589

    CrossRef   Google Scholar

    [24]

    Centers for Disease Control and Prevention. 2021. Mosquito Control - West Nile Virus. www.cdc.gov/westnile/vectorcontrol/index.html

    [25]

    Gottlieb R. 1993. Forcing the spring: The transformation of the American environmental movement. Washington D.C.: Island Press. 413 pp

    [26]

    Megahed NA, Ghoneim EM. 2020. Antivirus-built environment: Lessons learned from Covid-19 pandemic. Sustainable Cities and Society 61:102350

    doi: 10.1016/j.scs.2020.102350

    CrossRef   Google Scholar

    [27]

    Pang Z, Hu P, Lu X, Wang Q, O'Neill Z. 2021. A Smart CO2-Based Ventilation Control Framework to Minimize the Infection Risk of COVID-19 In Public Buildings. www.researchgate.net/publication/349121056_A_Smart_CO2-Based_Ventilation_Control_Framework_to_Minimize_the_Infection_Risk_of_COVID-19_In_Public_Buildings

    [28]

    Keenan JM. 2020. COVID, resilience, and the built environment. Environment Systems and Decisions 40:216−21

    doi: 10.1007/s10669-020-09773-0

    CrossRef   Google Scholar

    [29]

    Li B, Peng Y, He H, Wang M, Feng T. 2021. Built environment and early infection of COVID-19 in urban districts: A case study of Huangzhou. Sustainable Cities and Society 66:102685

    doi: 10.1016/j.scs.2020.102685

    CrossRef   Google Scholar

    [30]

    Li S, Ma S, Zhang J. 2021. Association of built environment attributes with the spread of COVID-19 at its initial stage in China. Sustainable Cities and Society 67:102752

    doi: 10.1016/j.scs.2021.102752

    CrossRef   Google Scholar

    [31]

    Handmer JW, Dovers SR. 1996. A typology of resilience: rethinking institutions for sustainable development. Industrial & Environmental Crisis Quarterly 9:482−511

    doi: 10.1177/108602669600900403

    CrossRef   Google Scholar

    [32]

    Qualls N, Levitt A, Kanade N, Wright-Jegede N, Dopson S, et al. 2017. Community Mitigation Guidelines to Prevent Pandemic Influenza — United States, 2017. Morbidity and Mortality Weekly Report - Recommendations and Reports 66:1−34

    doi: 10.15585/mmwr.rr6601a1

    CrossRef   Google Scholar

    [33]

    Li F, Wang W, Xu J, Yi J, Wang Q. 2018. Comparative study on vulnerability assessment for urban buried gas pipeline network based on SVM and ANN methods. Process Safety and Environmental Protection, 122:23−32

    doi: 10.1016/j.psep.2018.11.014

    CrossRef   Google Scholar

    [34]

    Hood E. 2005. Dwelling disparities: How poor housing leads to poor health. Environmental Health Perspectives 113:A310−A317

    doi: 10.1289/ehp.113-a310

    CrossRef   Google Scholar

    [35]

    Cutter SL, Boruff BJ, Shirley WL. 2003. Social vulnerability to environmental hazards. Social Science Quarterly 84:242−61

    doi: 10.1111/1540-6237.8402002

    CrossRef   Google Scholar

    [36]

    Van Zandt S, Peacock WG, Henry DW, Grover H, Highfield WE, et al. 2012. Mapping social vulnerability to enhance housing and neighborhood resilience. Housing Policy Debate 22:29−55

    doi: 10.1080/10511482.2011.624528

    CrossRef   Google Scholar

    [37]

    Karaye IM, Horney JA. 2020. The impact of social vulnerability on COVID-19 in the U.S.: An analysis of spatially varying relationships. American Journal of Preventive Medicine 59:317−25

    doi: 10.1016/j.amepre.2020.06.006

    CrossRef   Google Scholar

    [38]

    Kim SJ, Bostwick W. 2020. Social vulnerability and racial inequality in COVID-19 deaths in Chicago. Health Education & Behavior 47:509−13

    doi: 10.1177/1090198120929677

    CrossRef   Google Scholar

    [39]

    Lewis T. 2021. How the US pandemic response went wrong – and what went right – during a year of COVID-19. Scientific American. www.scientificamerican.com/article/how-the-u-s-pandemic-response-went-wrong-and-what-went-right-during-a-year-of-covid/

    [40]

    Lindell MK, Perry RW, Prater C, Nicholson WC. 2006. Fundamentals of emergency management. Washington, DC, USA: FEMA. https://training.fema.gov/hiedu/aemrc/booksdownload/fem/

    [41]

    Krippendorff K. 2018. Content analysis: An introduction to its methodology. London: SAGE Publications. https://dx.doi.org/10.4135/9781071878781

    [42]

    Neuendorf KA, Kumar A. 2016. Content Analysis. In The International Encyclopedia of Political Communication, ed. Mazzoleni G. US: John Wiley & Sons. https://doi.org/10.1002/9781118541555.wbiepc065

    [43]

    Bennett D. 2010. State emergency plans: Assessing the inclusiveness of Vulnerable Populations. International Journal of Emergency Management 7:100−110

    doi: 10.1504/ijem.2010.032048

    CrossRef   Google Scholar

    [44]

    Purdum JC, Meyer MA. 2020. Prisoner labor throughout the life cycle of disasters. Risks, Hazards & Crisis in Public Policy 11:296−319

    doi: 10.1002/rhc3.12191

    CrossRef   Google Scholar

    [45]

    Berke P, Smith G, Lyles W. 2012. Planning for resiliency: Evaluation of state hazard mitigation plans under the disaster mitigation act. Natural Hazards Review, 13:139−49

    doi: 10.1061/(ASCE)NH.1527-6996.0000063

    CrossRef   Google Scholar

    [46]

    Lyles W, Stevens M. 2014. Plan quality evaluation 1994–2012: Growth and contributions, limitations, and new directions. Journal of Planning Education and Research, 34:433−50

    doi: 10.1177/0739456X14549752

    CrossRef   Google Scholar

    [47]

    Olonilua OO, Ibitayo O. 2011. Toward multihazard mitigation: An evaluation of FEMA-approved hazard mitigation plans under the Disaster Mitigation Act of 2000. Journal of Emergency Management 9:37−49

    doi: 10.5055/jem.2011.0045

    CrossRef   Google Scholar

    [48]

    Dzigbede KD, Gehl SB, Willoughby K. 2020. Disaster resiliency of US local governments: Insights to strengthen local response and recovery from the COVID-19 pandemic. Public Administration Review 80:634−43

    doi: 10.1111/puar.13249

    CrossRef   Google Scholar

  • Cite this article

    Pawar B, Meyer M, Wang Q. 2022. Content analysis of state hazard mitigation plans and their ability to address pandemics. Emergency Management Science and Technology 2:12 doi: 10.48130/EMST-2022-0012
    Pawar B, Meyer M, Wang Q. 2022. Content analysis of state hazard mitigation plans and their ability to address pandemics. Emergency Management Science and Technology 2:12 doi: 10.48130/EMST-2022-0012

Figures(5)  /  Tables(2)

Article Metrics

Article views(11441) PDF downloads(776)

Other Articles By Authors

ARTICLE   Open Access    

Content analysis of state hazard mitigation plans and their ability to address pandemics

Emergency Management Science and Technology  2 Article number: 12  (2022)  |  Cite this article

Abstract: Hazard mitigation plans address hazards such as earthquakes, hurricanes, landslides, tornados, flooding more explicitly than pandemics or other public health crises. This paper analyzes and identifies pandemic-related mitigation strategies in state-level hazard mitigation plans across the United States. This study identifies common and uncommon strategies that could be included in plan updates such as: use of personal protective equipment (PPE), self-isolation/quarantine, hygiene, restricted gatherings, vaccination, vulnerability assessment, economic consequences analysis, acknowledging the need to address pandemics, and referring Centers for Disease Control and Prevention (CDC) guidelines. The 54 state-level plans are compared based on their inclusion of the nine strategies. Findings show that vaccination, self-isolation/ quarantine, and vulnerability assessment are the strategies most listed in plans. Additional concerns made evident by the 2020 coronavirus pandemic, such as contact tracing, environmental impact, and public services, were limited across the plans. It was concluded that long-term mitigation strategies for reducing the risk and speed of spread such as identifying strategic locations for testing, vaccination, and quarantine should be devised and implemented. Pandemics should be included as a distinct class of hazards while formulating state hazard mitigation plans. Strategies for addressing the impact of long working hours on the mental health of healthcare workers should be explored. Economic and psychological impact of unavailability of essential public services, such as transport and groceries, should be investigated and strategies should be formulated in the mitigation plans accordingly.

    • According to the Centre for Research on the Epidemiology of Disasters (CRED), the number of reported disasters across the world in the period 2000−2019 increased to 7,348 from 4,212 in 1980−1999[1]. The CRED report also indicates that the reported fatalities increased to 1.23 million in 2000−2019 from 1.19 million in 1980−1999. This implies that the reported fatalities increased by about 3.36% whereas the reported disasters increased by 74.45% from 1980−1999 to 2000−2019. The increase in the number of fatalities is not as significant as the increase in reported disasters. This can be attributed to the rapid advancement in medical science, engineering, and technology. Although the fatalities appear to be under control, the occurrences of disasters have increased rapidly. To continue keeping the fatalities during disasters in check, it is important to learn from past disasters, plan, prepare, and then implement the essential steps accordingly. Disaster risk reduction and planning has always been explored predominantly from a restoration and recovery point of view[2]. To further minimize fatalities and loss, it is also important to consider disaster management from a hazard mitigation perspective. Reducing death and loss from this increasing number of disasters requires better and wider implementation of hazard mitigation techniques and activities. As such, hazard mitigation has gained policy and research across the world. Hazard mitigation is defined as actions, activities, and processes undertaken well in advance of a disaster impact to minimize or eliminate risks to life and property[36]. Hazard mitigation provides passive resistance to a hazard which helps minimize the probability of a major adverse impact. Hazard mitigation is relevant for many types of environmental (e.g., flooding), geological (e.g., earthquakes), climate (e.g., sea level rise), technological (e.g., oil spills), and health (e.g., vector-borne diseases) hazards[7].

      Community design and implementation of hazard mitigation are guided by mitigation plans. Hazard mitigation plans are developed and adopted by local, state, and national governments and include reviews of past hazard occurrence; past and predicted future disaster damage; identification of vulnerable locations, property, and populations[8] and outline a set of community-determined mitigation strategies to reduce impacts of the hazards identified in the plan[9]. These plans form the basis of community resilience and should connect with other community planning efforts including emergency operations planning for disaster response and recovery as well as community development plans[10, 11].

      Hazard mitigation in the United States draws from the Robert T. Stafford Disaster Relief and Emergency Assistance Act (Stafford Act) adopted in 1988[12]. This act requires state, local, tribal, and territorial governments to develop and adopt a hazard mitigation plan in order to be eligible for post-disaster federal assistance. The Federal Emergency Management Agency (FEMA) supports governments in drafting hazard mitigation plans by providing technical support and guidance tools. The Stafford Act also authorized several grant programs for states that developed a FEMA-approved hazard mitigation plan such as: Hazard Mitigation Grant Program (HMGP), Pre-Disaster Mitigation Grant Program (PDM), Public Assistance Grant Program (PA), Building Resilient Infrastructure and Communities (BRIC), and Fire Management Assistance Grant Program (FMAG). After the Stafford Act, some additional laws support hazard mitigation such as the Sandy Recovery Improvement Act (SRIA) of 2013, the National Flood Insurance Act of 1968, and the Water Infrastructure Improvements for the Nation (WIIN) Act of 2016[12]. As of September 30, 2020, all 50 states, the District of Columbia, and five territories (American Samoa, Guam, Northern Mariana Islands, Puerto Rico, and US Virgin Islands) have FEMA-approved state hazard mitigation plans.

      The ongoing coronavirus pandemic has attracted the attention of the scientific community and there has been tremendous loss of life and economic activity worldwide[13]. The coronavirus pandemic raises the question of how hazard mitigation planning and plans address this health risk and future similar health hazards. The All-Hazards Approach (AHA) has been the prominent approach taken for disaster risk reduction and planning[14, 15]. This approach is based on the hypothesis that all disasters share some commonalities with regards to their mitigation, impact, and recovery[16]. Although this approach has been implemented globally for disaster planning and hazard mitigation, there has been an increasing focus on exploring hazard specific approach for disaster planning[17]. All-Hazards Approach is often regarded as the most cost-effective approach for disaster planning and hazard mitigation. However, the recent coronavirus pandemic has proven that some disasters, for instance a pandemic, are unique and they need to be considered independently[15]. They need distinct hazard mitigation plans based on their severity and therefore cannot be efficiently tackled using the All-Hazards Approach. Peleg et al. performed a comparative analysis of the ongoing coronavirus pandemic with other natural disasters such as earthquakes[15]. They concluded that the pandemic mitigation and recovery differ in various aspects such as warning indicators, impact, dependence on external assistance, medical response, and politicization. A pandemic can usually give the government a grace period of a few weeks or months to take appropriate action and decelerate the spread of infection. In contrast, other seasonal hazards such as hurricanes or tornados can strike within minutes even with prior warning indicators. The impact of the pandemic on population cannot be determined until the entire population is immune. However, this is not always possible, and impact will vary with time depending on the availability of vaccinations, personal protective equipment (PPE), and willingness of the population to abide by the safety protocols. The impact of other disasters, such as hurricanes or tornados, can be estimated over a relatively shorter period as compared to that of a pandemic. Also, pandemic is a global phenomenon in contrast to other disasters that affect local populations. Therefore, collaboration with other countries to prevent the spread of infection and vaccination plays a vital role. Thus, it can be concluded that pandemics form a different category of disasters and should be scrutinized distinctly.

      Merriam has explained the reasons FEMA failed to plan efficiently and even recognize the risk of the coronavirus pandemic[18]. Despite enduring the deadly influenza pandemics in the past, FEMA failed to address and learn from the issues encountered during these pandemics. Merriam reviewed the FEMA documents for pandemic planning and preparedness and concluded that the documents just gave some insight into the statistics of fatalities and economic loss[18]. In one of the documents titled 'Continuity Planning for Pandemic Influenza', the readers were directed to the World Health Organization (WHO) and Center of Disease Control and Prevention (CDC) website instead of addressing the core problem of hazard mitigation. These websites simply highlight the fatalities statistics and describe some general steps that could be taken to avoid infection on a personal level instead of a holistic view or in-depth analysis for drafting mitigation plans[1921]. There is tremendous research literature available on the impact of influenza pandemics and the measures that could have been taken to control it. The government did plan for the coronavirus pandemic; however, it appears they were unable to build upon the previous research work and implement those plans efficiently. One of the reasons for negligence of pandemics from a hazard mitigation perspective can be the low occurrence frequency of pandemics. Pandemics can be classified as extremely low frequency and high impact events. Because the world had not experienced a pandemic since the deadly influenza pandemic, it might have resulted in complacency regarding considering pandemics as a distinct hazard in the mitigation plans.

      Therefore, to draft effective state hazard mitigation plans, it is necessary to consider pandemics as a distinct hazard in the plans instead of an All-Hazard Approach. Also, it is essential to have clear and well-defined steps needed to take appropriate decisions to mitigate the risk of a pandemic. Just referring to some earlier CDC and WHO documents, and websites is not sufficient[18]. In this paper, the research question that we have addressed is whether the state hazard mitigation plans address pandemics, and if yes, are they addressed distinctly or do they simply refer to some other CDC document. We have examined all state hazard mitigation plans to investigate if pandemics were considered in all the plans. Content analysis was performed to investigate the research question mentioned above.

    • Pandemics have been common throughout the history of humanity, and today still pose a high risk for large loss of life if not mitigated or controlled once they begin[19, 20]. Influenza-type pandemics are common and thus contribute to a large loss of life[20]. The timeline of past influenza pandemics is shown below in Fig. 1. Millions of people all over the world have lost their lives during these pandemics[20].
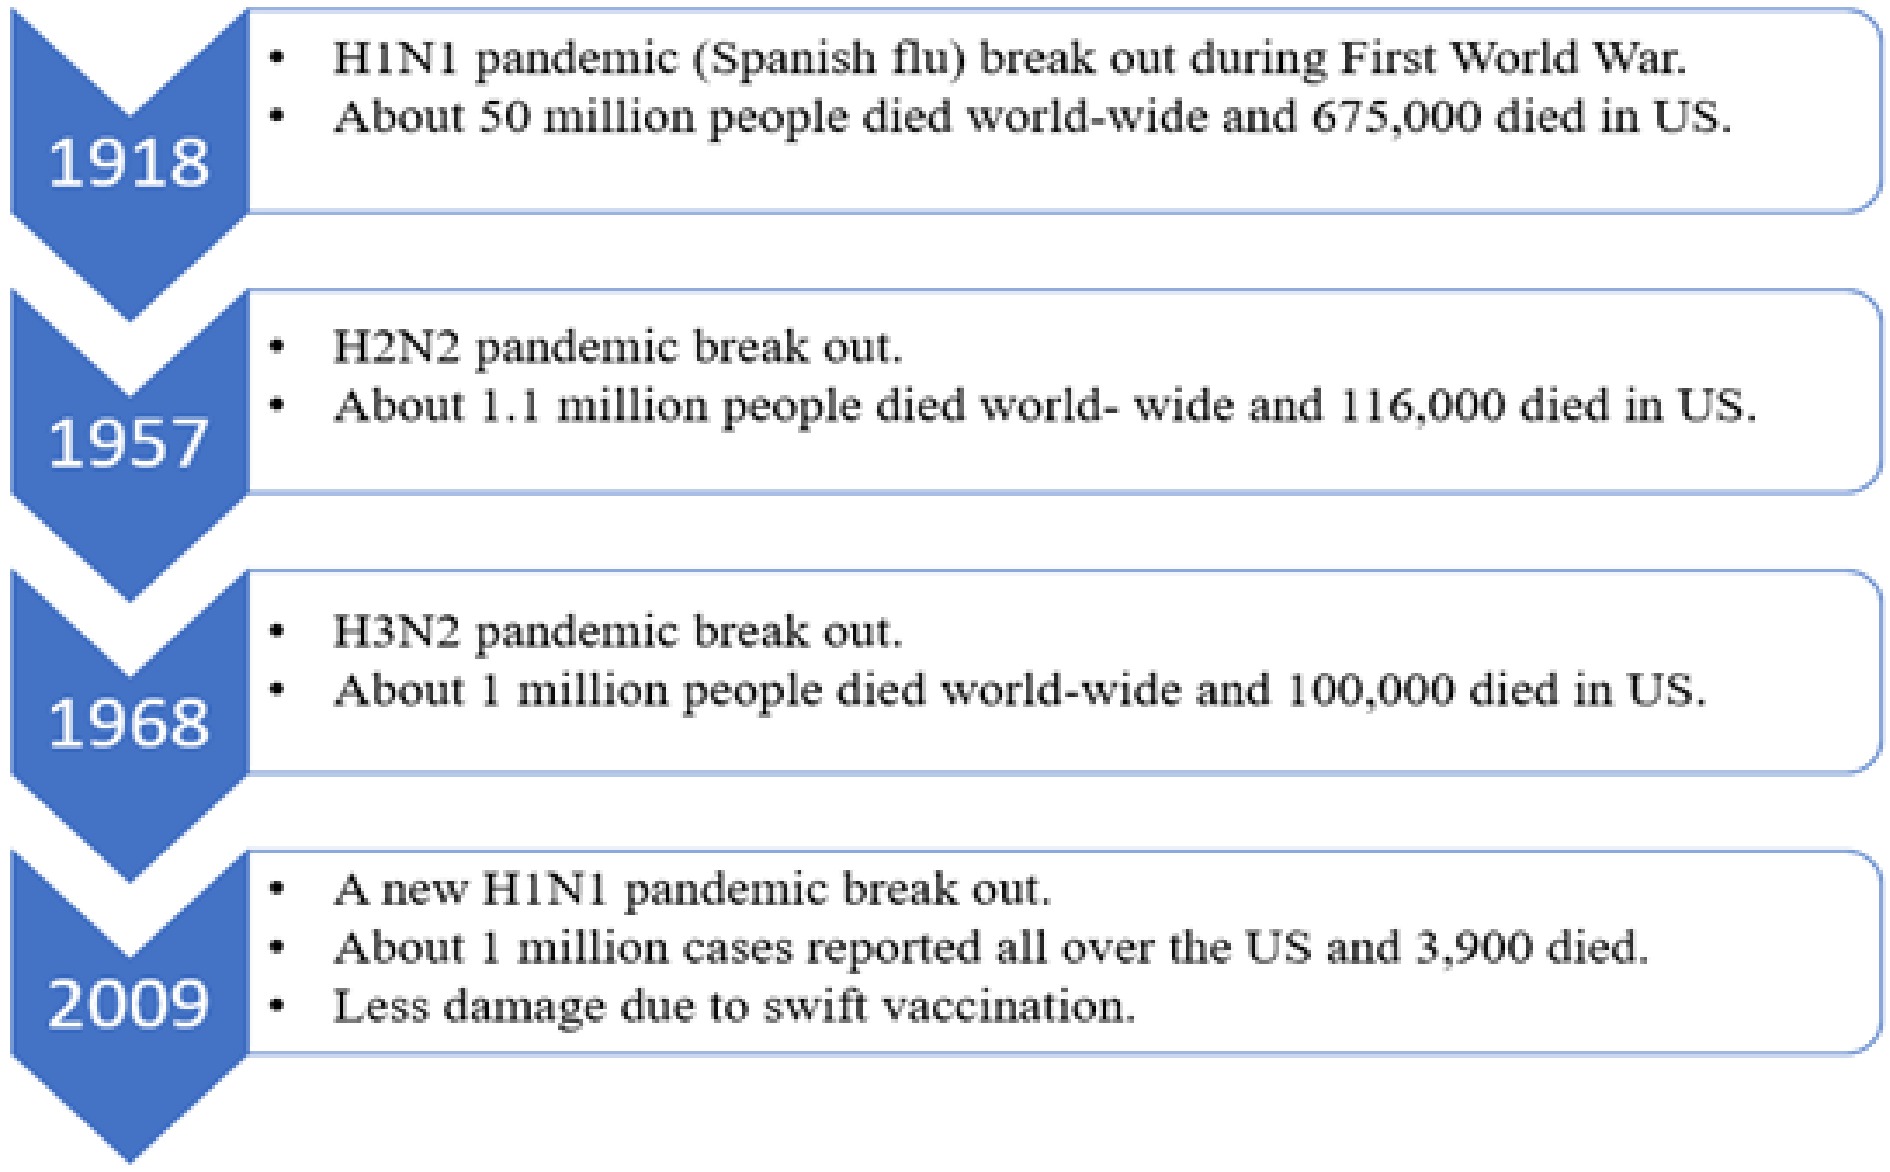
      Figure 1. 

      Timeline of influenza pandemics and estimated number of deaths[[20]].

      As we can see from Fig. 1, influenza pandemics occurred repeatedly due to mutations in the influenza viruses. The current coronavirus pandemic, at the time of writing in February 2021, is close behind the 1918 Spanish Flu in loss of life in the US and has surpassed death tolls for the more recent flu pandemics listed. Both pandemics and epidemics are a serious health hazard to the world. The major distinction between a pandemic and an epidemic is that the epidemic affects population in a particular area at a community level whereas a pandemic is an enhanced epidemic which affects populations across different countries[19].

      Besides influenza, the US also experienced an outbreak of the West Nile virus in 1999. The first West Nile virus epidemic was reported in Israel in 1951 where 123 cases of infection were identified[22]. Later in 1999, 62 residents of Queens in New York City, US were found to be infected with the West Nile virus. The rapid outbreak led to spread of virus across the west coast of the US. The West Nile virus causes an arboviral disease which means that it needs an arthropod such as a mosquito to transmit it to different hosts. In 2018, a total of 2,813 cases of arboviral diseases were reported of which 2,647 cases were caused by the West Nile virus[23]. Therefore, CDC recommended mitigation strategies such as aerial spraying of adulticides or larvicides for mosquito control at household and community level[24]. Mitigation strategies like these could help in curbing the spread of such viruses.

      Another example of mitigation is the CDC response to the Ebola epidemic of West Africa in 2014. Cases of infection were also reported in other countries such as the UK, the US, Italy, and Nigeria[21]. According to CDC, the spread of this epidemic could have been a result of increased travelling across the countries and crowding in urban areas. Therefore, CDC recommended mitigation strategies such as exit screening of travelers leaving West Africa and enhanced entry screening of travelers arriving from affected countries. This ensured that the probability of spread of the epidemic was minimized. This is an example of mitigation strategies being implemented on an international level.

      Mitigation strategies have dramatically reduced the death rates for many health hazards, especially in high income countries. For example, advances in basic sanitation and water distribution have reduced the impact of many bacteria-based health hazards[25, 26]. Viruses, with their capacity to mutate, make mitigation more difficult than other types of health hazards. It might take several years for the scientific community to manufacture a vaccine, with the coronavirus vaccine development in 2020 being an amazing quick breakthrough. Hence, to prevent such tremendous loss of life, it is necessary to identify some mitigation strategies that will help in reducing the human and economic losses. Scholars are calling for research on mitigative opportunities of the built environment, such as housing size, density, access to outdoor spaces, ventilation systems, etc., that could reduce the potential of pandemics or spread of them[2630]. Some of the suggestions for research involve building code changes, which are a common strategy to reduce damage from natural hazards like hurricanes or floods. There have been attempts to model the characteristics of built environment and the clusters of reported COVID-19 cases mathematically[29]. Researchers have found significant direct and indirect influences of built environment characteristics such as transportation infrastructure and places of public gathering on occurrences of infectious clusters[29, 30]. Similar research studies could be instrumental in improving the preparedness for the next pandemic and taking better mitigative steps. However, after a pandemic begins, it might take a long time to analyze all its characteristics and manufacture a vaccine. There is a possibility that the initial preparedness and response measures may fail. In such situations, the learnings obtained from the consequence analysis of previous pandemics can be used to design better and safer mitigation strategies[28]. Thus, while preparedness and response are the most crucial once a pandemic has begun, considering ways to reduce spread are mitigative actions appropriate for consideration in hazard mitigation planning.

      Besides being a unique class of hazards, pandemics can impact the functioning of societies across the world from the individual to the governmental scale. Therefore, hazards such as pandemics demand a high level of flexibility to adapt to the dynamic nature of the hazard. Handmer & Dovers proposed a typology of resilience for institutions against hazardous environmental challenges[31]. They classified the response to external hazards into three categories: resistance and maintenance, change at the margins, openness and adaptability. Resistance and maintenance are the inability of the system to change its operation and denial of the possible threat. Change at the margins refers to minor changes in the system's operation, which slowly mitigates the risk of the hazard over time. These two types of responses are favorable for hazards which affect a small proportion of the population at a local scale. They can be handled by a small team of hazard mitigation professionals[31]. However, for hazards such as pandemics that affect the population on a global scale, openness and adaptability to changing hazard conditions are necessary to minimize the severity of the impact. The state hazard mitigation plans fall under this category of response because they prescribe the strategies that need to be implemented to tackle such hazards based on the learnings from past incidents. These strategies can involve drastic measures such as prohibition of public gatherings, transport services, etc. which impact the population on a global scale. Although the plans are based on past incidents, they are not a standard set of instructions that should be followed exactly in the event of a pandemic because it is very difficult to predict the severity of a hazard that is ever changing. However, the plans still serve as a guide for the steps that could be taken on a governmental as well as individual level. The aim of this research is to analyze the hazard mitigation plans of all the states in the US for their ability to address pandemics. The content analysis of plans will help in identifying the strengths and weaknesses in the pandemic mitigation planning. This will be instrumental in promoting adaptability among people at an individual and governmental level by updating the state hazard mitigation plans. The mitigation strategies promoted by CDC for influenza pandemics are used as a standard to gauge the ability of the plans.

      In 2017, the CDC recommended some community mitigation strategies to prevent influenza pandemics[32]. The strategies recommended by the CDC are non-pharmaceutical interventions which help in restricting the spread of disease during an influenza pandemic. This implies that these strategies can be implemented on an administrative as well as personal level with the help of emergency management and public health officials, local leaders, organizations, and stakeholders. Therefore, these strategies can be extended to any pandemic in general and would be appropriate to be addressed in all plans. We briefly review these strategies below.

    • PPE type will vary based on the properties of the disease but include items such as face masks (disposable surgical, medical, or dental procedure masks), which have been widely used by health care workers to prevent respiratory infections. Masks can also be worn by infected people during pandemics to prevent spread of infection to household members and others in the community. Face shields can also be used to avoid infections due to droplets dispersed in air. Gloves are another example of PPEs which can help in preventing the spread of infection through contact. The beginning of the COVID-19 pandemic saw a lack of PPE available or stock-piled.

    • Self-isolation is an important strategy for containing the spread of infection during a pandemic. If a person feels sick or is showing the symptoms of the disease, then he/she should isolate or quarantine themselves to prevent the spread of infection. This will help in containing the disease to a minimum and result in eventual eradication of the disease. The hazard mitigation plans should address strategies for setting up quarantine centers for infected people. Quarantine centers are essential to ensure the infected person does not spread the disease to their family member at home. The plans should mention strategies for allocating places for quarantine centers and what factors should be considered while choosing such places.

    • The plans should address strategies for educating the public and promoting hygiene habits such as avoiding handshakes to prevent spread of disease through contact, cleaning surfaces which are regularly accessed by people, and sanitizing or washing hands before consuming food. Such habits are easy to follow and can be effective in preventing the spread of disease. Social distancing strategies should also be addressed to prevent the spread.

    • Restricting access to areas of mass gatherings such as workplaces and schools is an important strategy that must be addressed in hazard mitigation plans. The influenza pandemic of 1918 proved to be so lethal because of over-crowding and travelling of soldiers during the First World War. Travel across states and countries could be restricted as well to prevent the spread of the disease globally. Some other areas of mass gathering such as parks, movie theaters, etc. could also be restricted.

    • Vaccination helps reduce the probability of getting infected by a disease in future. It is one of the important strategies for preventing pandemics. State hazard mitigation plans must address the vaccinations available for various diseases that are usually encountered in that state. Plans must also address strategies for vaccinating all the people in a community in a systematic way. Whenever a vaccine is discovered for a disease, it should be updated in the plan. Some diseases are seasonal in nature. Vaccination drives for such diseases should be organized for before the beginning of season for all diseases.

    • Vulnerability assessment is instrumental in identifying the most vulnerable populations to a particular disease. Most of the time they are people above the age of 65 and young children between 0 to 5 years of age but vary depending on how the disease spreads and affects the body. Identifying the vulnerable population helps in prioritizing the vaccination plan. Vulnerability is not only age specific, but it can also depend on population density and climatic factors. People living in a densely populated region would be more vulnerable to a disease like influenza or any other airborne disease. Similarly, people living in a region where the climate is conducive to the growth of disease vectors such as mosquitoes will be more vulnerable. Vector-based diseases are diseases which need carriers like mosquito for transmission. All these factors must be addressed in hazard mitigation plans. Vulnerability assessments are commonplace in mitigation plans for risk and hazards[8, 33]. These assessments for health are especially important to address disparities in risk of infection and severity of impacts[34]. Early research on the ongoing COVID-19 pandemic show that some aspects of social vulnerability used to understand those that are most at risk during natural hazards[16, 35, 36] also correlate with COVID-19 infection[37, 38].

      For instance, Kim & Botswick developed a social vulnerability index using sociodemographic factors such as percentage of poverty, median household income, employment ratio, percentage of less than high school education, and the percentage of female-headed households with children[38]. The values of these indicators were retrieved from US census. Similarly, a health risk score was created using factors such as stroke deaths, heart related deaths, diabetes, obesity, etc. Finally, the correlation between the social vulnerability index, heath risk score, and the reported COVID deaths were calculated for people belonging to a particular section of the population. This analysis can be carried out to determine the vulnerability of people of a particular ethnicity, socioeconomic status, or health conditions. The correlation between the indices will be proportional to the vulnerability of that section of the population.

    • Economic analysis helps in estimating the economic loss that could be endured during a pandemic. Shutting down places of mass gatherings like movie theaters, restaurants, etc. can have a significant impact on the economy of a state. An increase in homelessness and joblessness has been particularly observed during the ongoing coronavirus pandemic. These factors can adversely affect the mental stability of people leading to suicides or other mental illnesses. Therefore, estimating the economic loss based on the data from past pandemics is immensely important. It can be instrumental in preparing the economy to be resilient to such economic damage. This strategy must be addressed in all hazard mitigation plans.

      Governments have used all the above strategies during the current COVID-19 pandemic, with much critique for slow implementation of mitigation strategies, confusing public communication, and unsystematic analysis of vulnerability and economic consequences[39]. Hazard mitigation plans provide an opportunity for a jurisdiction to identify risks and the actions, resources, and coordination needed to mitigate those risks[9, 40]. Mitigation actions should reduce the costs of response and recovery, and actions identified in plans already offer pre-identified strategies that also should speed response such as pre-identified vaccination locations, pre-developed messaging content and channels, and contracts for sourcing supplies. Thus, this recent crisis prompts the question of how CDC recommended mitigation actions were or were not included in hazard mitigation plans. A lack of inclusion could help explain the slow response to the COVID-19 crises and point toward future hazard mitigation planning changes. Thus, we asked how did states in the US address pandemics in their hazard mitigation plans?

    • Content analysis is an analytical method used to evaluate various forms of printed, visual, or audio materials[41, 42]. It has been used to assess emergency management and hazard mitigation plans for their inclusion (or lack thereof) particular topics, concerns, or population groups. Bennett, for example, performed a content analysis of state emergency management plans to assess their inclusion of populations known to be at risk of impact during a disaster, such as older persons, persons with disabilities or chronic disease, children, and those with low-incomes or limited transportation options, among other populations[43]. She concluded that vulnerable populations aged above 65 years of age and population aged above 5 years of age with disabilities have not been sufficiently addressed in emergency management plans and therefore they tend to suffer more during disasters. Purdum & Meyer, similarly, analyzed state emergency operations plans for the inclusion of prison inmates in disaster mitigation, preparedness, response, and recovery[44]. They developed a typology of different hazard-related tasks that may be assigned to inmates. Several content analysis studies assess the quality of hazard mitigation plans at various jurisdictional levels[45, 46].

      Performing a content analysis of state hazard mitigation plans for their ability to address pandemics can reveal valuable insights into the steps proposed by states to counter pandemics as well as the effectiveness of these steps. With this goal, we have performed a content analysis of all the state hazard mitigation plans to identify the mitigation strategies for pandemics which are addressed in the plans. We have also identified the strategies which are not sufficiently addressed in the plans. This is the first study, to the best of our knowledge, which analyzes mitigation plans from a pandemic perspective. This study will be instrumental in providing some guidance while drafting updated hazard mitigation plans so that communities can be better prepared for another pandemic like the recent coronavirus pandemic.

      We analyzed the hazard mitigation plans for 49 states, the District of Columbia, and four territories (American Samoa, Guam, Northern Mariana Islands, and Puerto Rico). The Oklahoma hazard mitigation plan was updated in 2019, however the plan was not available on the official website. Hence, we excluded Oklahoma from our analysis. The New York hazard mitigation plan document was not available, however there is a website dedicated entirely to the hazard mitigation strategies for New York state which we analyzed. Similarly, we analyzed the hazard mitigation website for US Virgin Islands because the document was not available.

      Figure 2 shows the number of hazard mitigation plans that had been updated every year since 2014. It can be observed from Fig. 2, that most of the plans (32 out of 54) were updated in 2018, which is a year before the advent of the ongoing coronavirus pandemic. The hazard mitigation plans which were updated in 2018 and after 2018 hardly addressed mitigation strategies for pandemics. However, during the ongoing coronavirus pandemic all the state governments had been working with federal government and the CDC to control the spread of the pandemic. The government authorities and the scientific community has been studying the nature of the coronavirus pandemic extensively. Therefore, we can hope for more mitigation strategies for pandemics in the next updated versions of the plans. Also, the District of Columbia and the territory of American Samoa had their mitigation plans last updated in 2014 and 2015. Therefore, those plans need to be updated soon to account for the impacts of a pandemic.
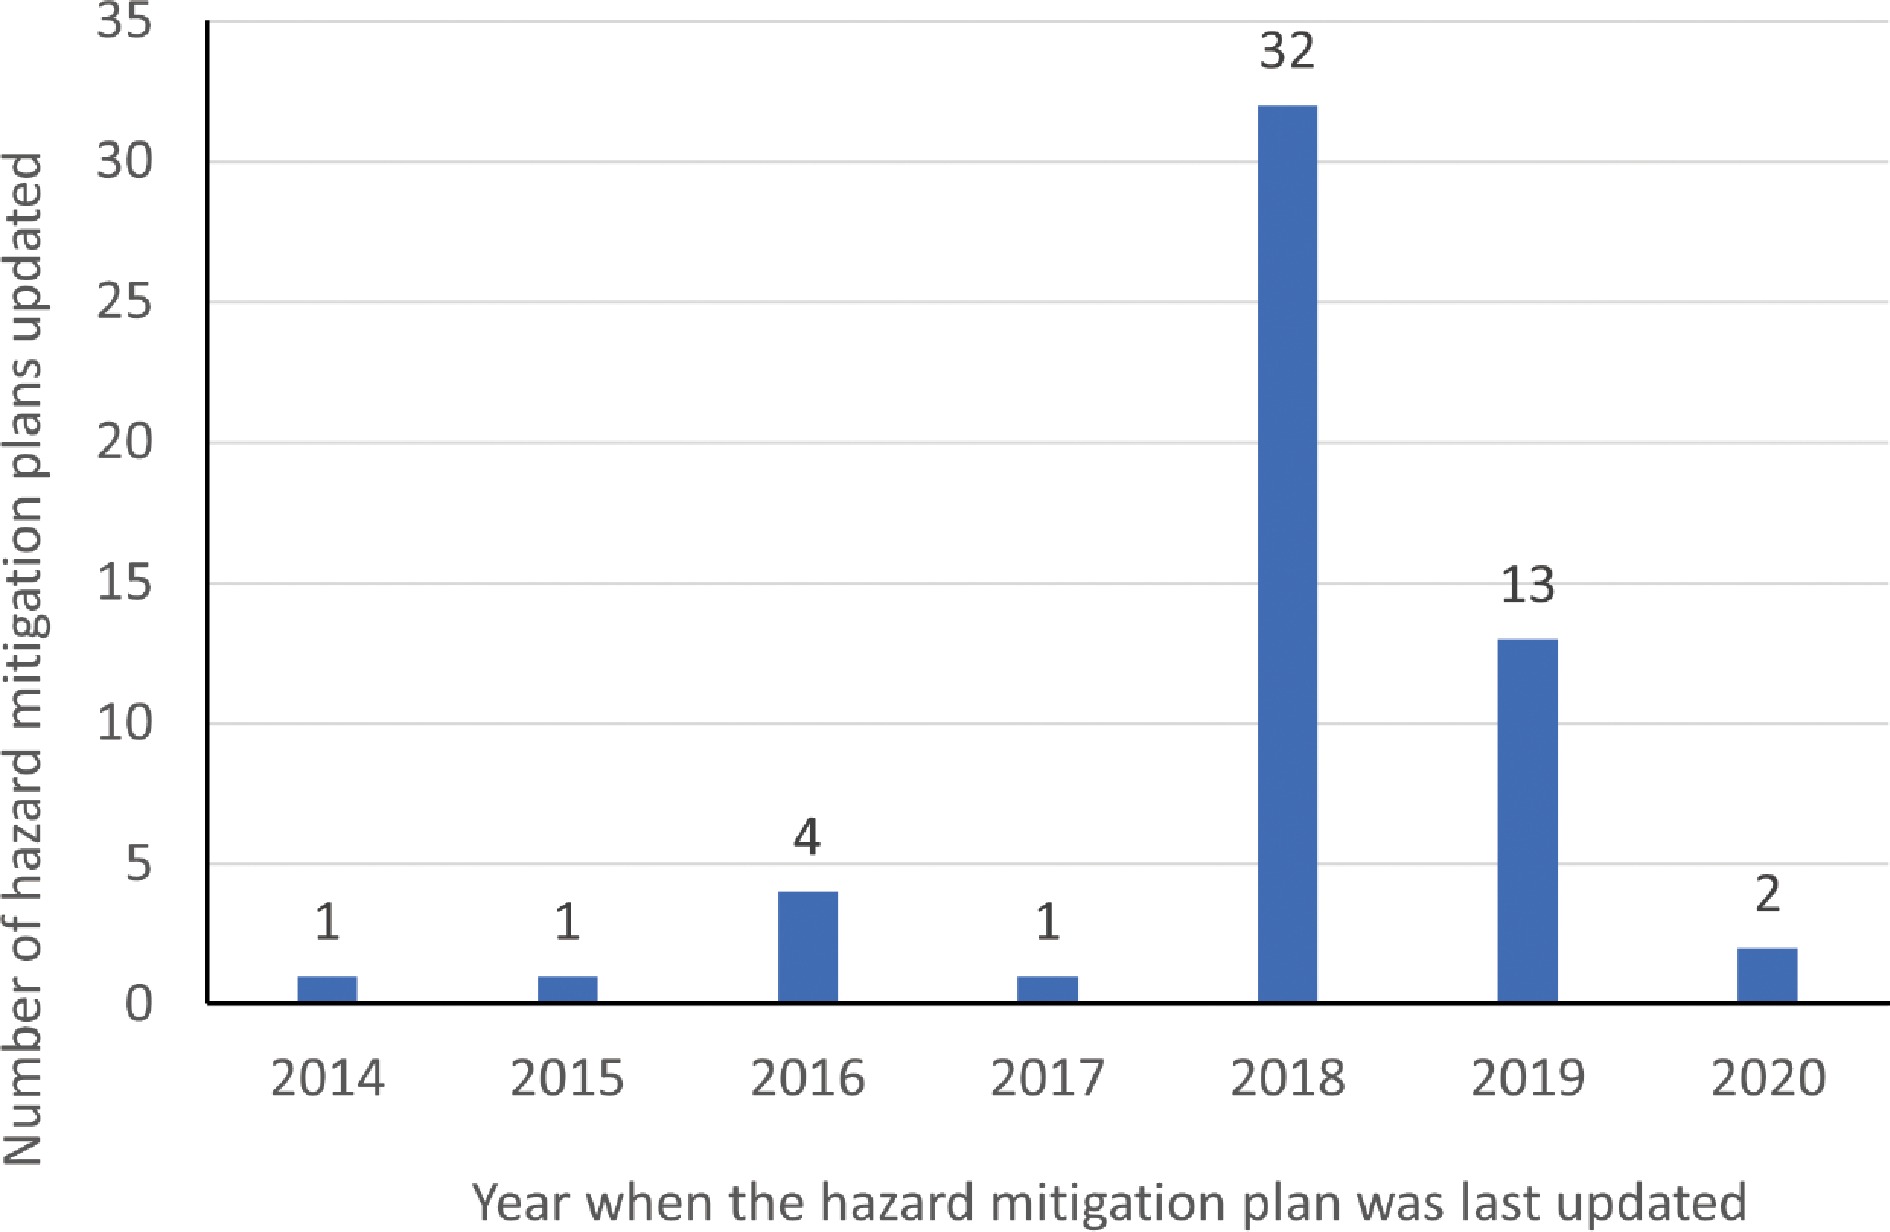
      Figure 2. 

      Graph depicting number of hazard mitigation plans updated every year since 2014.

      We manually analyzed the plans to identify keywords. It was found that keywords such as 'pandemic', 'epidemic', 'influenza', 'virus', and 'disease' have been frequently used throughout the plans while documenting the mitigation strategies. This finding was expected because the mitigation strategies in the plans have been based on the learnings from the past influenza pandemics. Some plans have used the words 'pandemic' and 'epidemic' interchangeably. This is understandable because pandemics are epidemics which occur throughout the world in different countries. The word 'disease' is used frequently because many plans address specific human and animal diseases that are encountered frequently in a particular state. Along with influenza virus, many other viruses, and diseases such as malaria, hantavirus, nipha virus, smallpox, measles, zika virus, cholera, mumps, Ebola, chikungunya, HIV, etc. were mentioned in the plans. Figures 3 & 4 show that influenza, West Nile virus, and plague are the most frequently discussed public health crises. About 31% (29 out of 54) of the plans address influenza, which is understandable because of the devastating impact of influenza pandemics in the past.
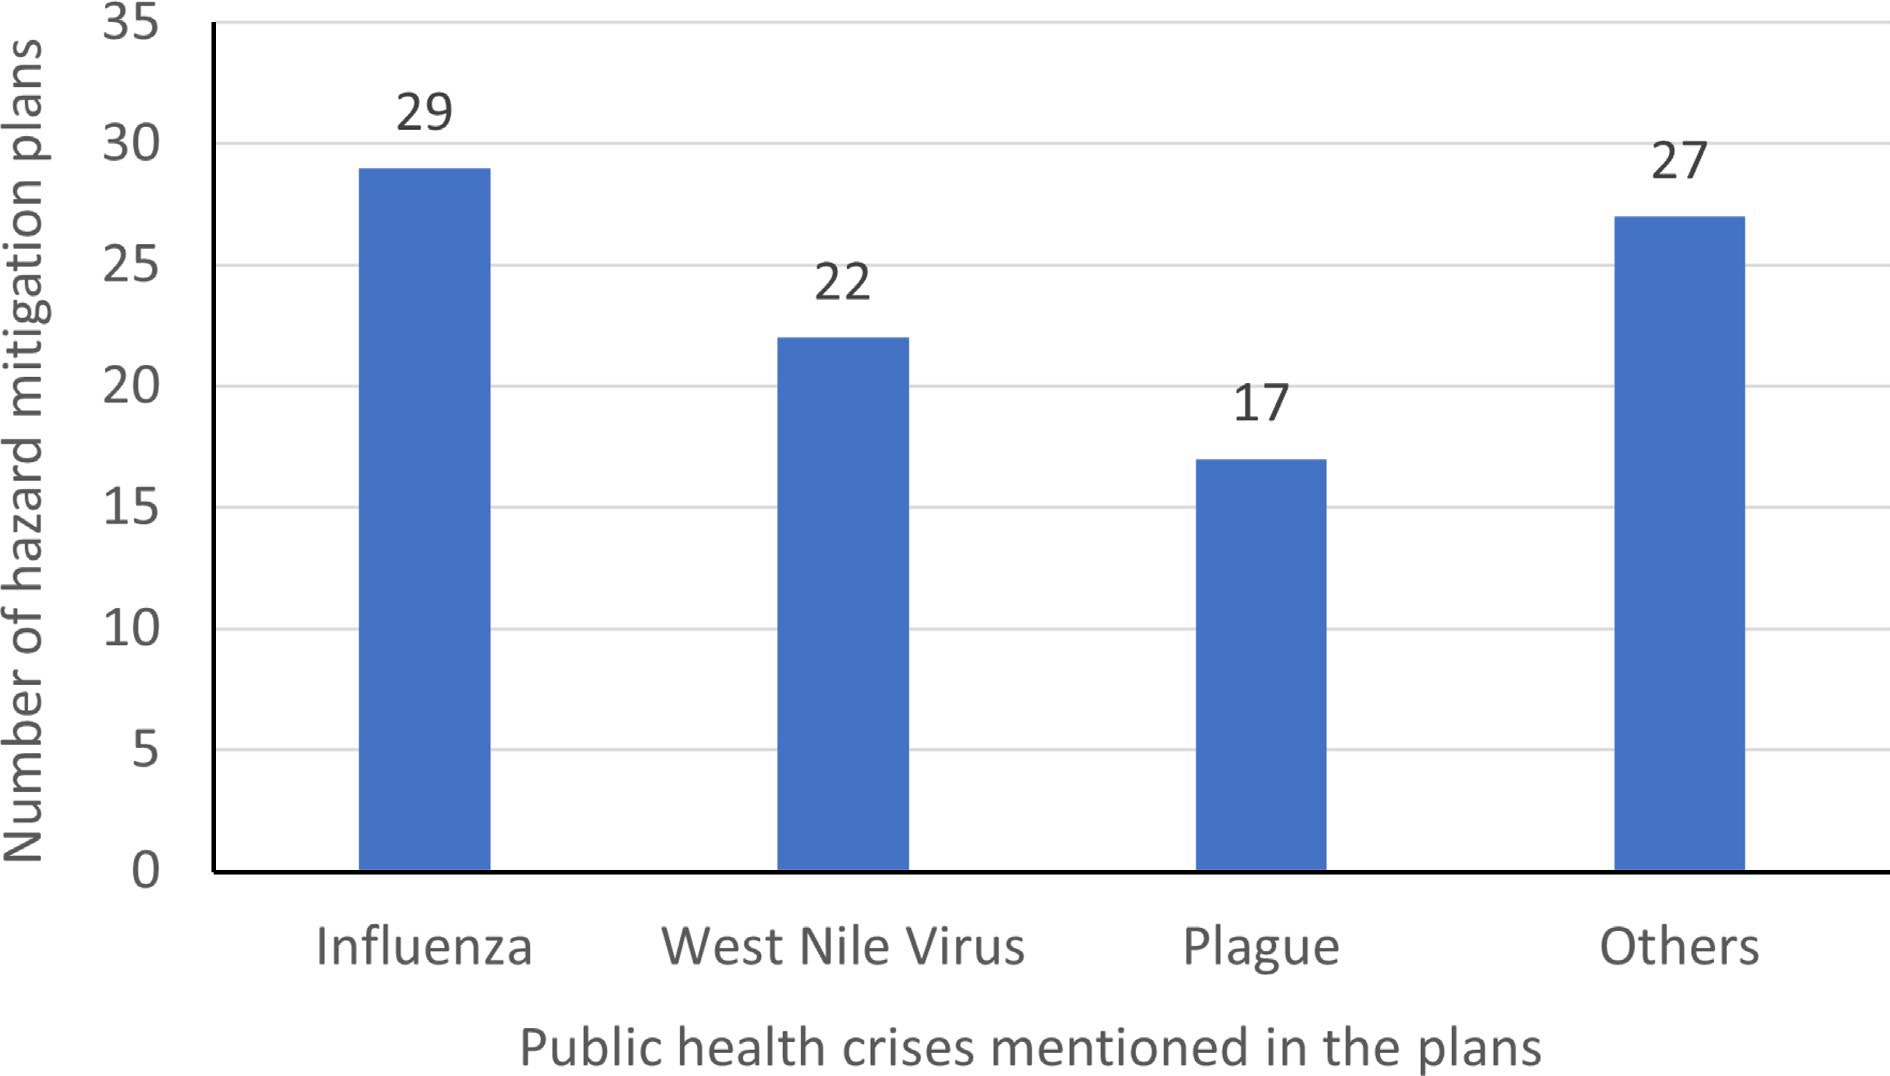
      Figure 3. 

      Graph depicting the different public health crises mentioned in the hazard mitigation plans.
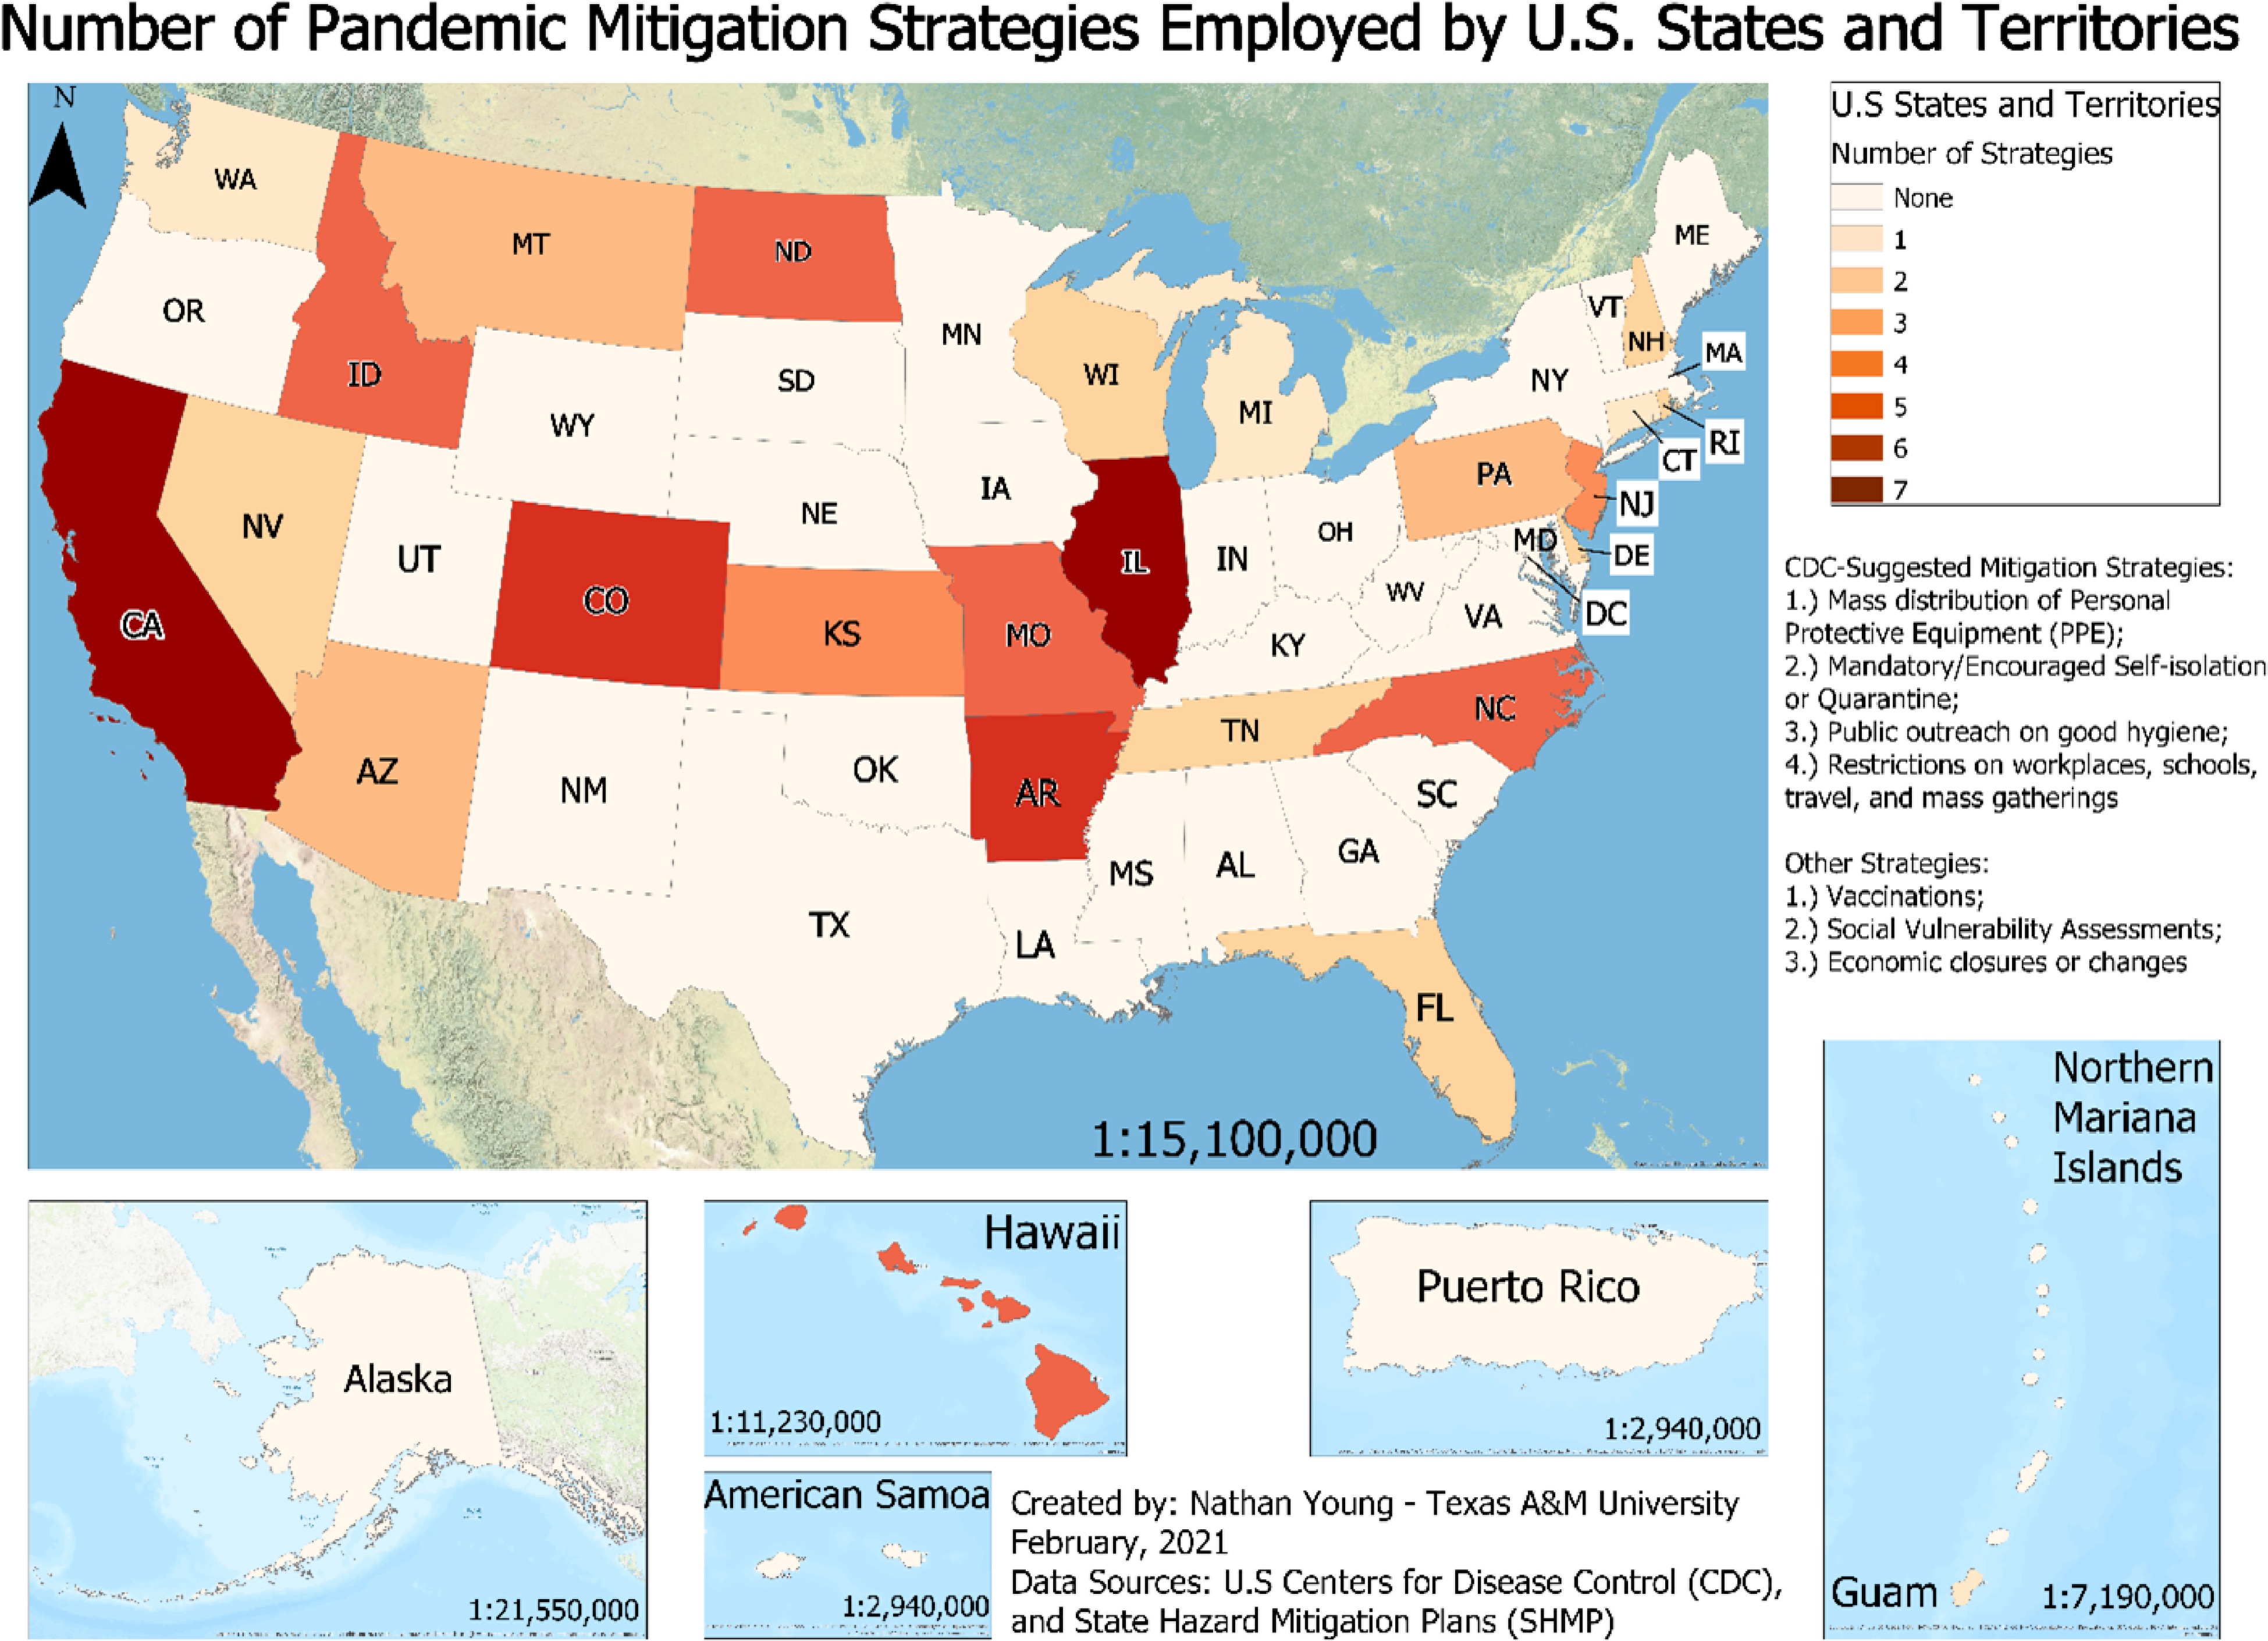
      Figure 4. 

      State wise distribution of number of pandemic mitigation strategies employed by US states and territories.

      Some plans addressed mitigation strategies for pandemics in the context of bioterrorism. We counted those strategies in our analysis because those strategies were also applicable in pandemics. For example, social distancing and self-isolation strategies are valid during a bioterrorism incident as well as a pandemic. However, bioterrorism is different to a pandemic. Bioterrorism is a manmade hazard which involves intentional outbreak of a disease on a large scale. Pandemics are not intentional.

      Apart from influenza, West Nile virus, and plague, all the other viruses and diseases are addressed in varying proportions across all the plans. This might be because of the demographic and climatic factors of the state to which the plan belongs. For instance, a state with climatic conditions conducive to the growth of mosquitoes will focus on diseases like malaria in their hazard mitigation plan. Whereas a state with impure water supply problem will focus more on waterborne diseases in their hazard mitigation plan. The 54 state hazard mitigation plans were analyzed manually to identify the public health crises addressed by them. A summary of the different public health crises addressed in hazard mitigation plans for 49 states, the District of Columbia, and four territories (American Samoa, Guam, Northern Mariana Islands, and Puerto Rico) is shown in Table 1. The results of the analysis were arranged as shown in Table 1 with an 'x' denoting the public health crises addressed in the corresponding state hazard mitigation plan. We have classified the results into four categories.

      Table 1.  Summary of different public health crises addressed in hazard mitigation plans for 49 states, the District of Columbia, and four territories (American Samoa, Guam, Northern Mariana Islands, and Puerto Rico).

      Hazard mitigation plansInfluenzaWest Nile virusPlagueOthers
      Alabama
      Alaska
      American Samoax
      Arizonaxxxx
      Arkansasxxx
      Californiaxxxx
      Coloradoxxxx
      Connecticutxx
      Delawarexx
      District of Columbia
      Floridaxxx
      Georgia
      Guamxxx
      Hawaiixxx
      Idahoxxxx
      Illinoisx
      Indianaxxx
      Iowa
      Kansasxx
      Kentucky
      Louisianax
      Maine
      Maryland
      Massachusettsx
      Michiganx
      Minnesotaxxx
      Mississippi
      Missourixxxx
      Montanaxxxx
      Nebraska
      Nevadaxxx
      New Hampshirexxx
      New Jerseyxxx
      New Mexico
      New York
      North Carolinaxxxx
      North Dakotaxxxx
      Northern Mariana Islands
      Ohioxxxx
      Oregon
      Pennsylvaniaxxxx
      Puerto Rico
      Rhode Islandxx
      South Carolinaxx
      South Dakota
      Tennesseexxx
      Texas
      Utah
      Vermontxxxx
      Virginiaxxxx
      Washington
      West Virginia
      Wisconsinxx
      Wyoming

      Finally, the plans were analyzed for the mitigation strategies proposed by the CDC. After manually analyzing the 54 state hazard mitigation plans, the coding scheme shown in Table 2 was proposed. Keywords 'pandemic' and 'influenza' were used to search through the documents to locate the relevant information on pandemic hazard mitigation. All the information related to any type of pandemics were thoroughly analyzed manually to identify the strategies that were being proposed in the 54 state hazard mitigation plans. Based on the results of the analysis, the strategies proposed in the plans were arranged as shown in Table 2 with a 'x' corresponding to every strategy that was mentioned in the plans. Keywords 'pandemic' and 'influenza' were used together because the influenza pandemics were found to be addressed the most frequently in the plans. We considered the strategies proposed for influenza pandemic specifically in our results because those strategies could be extended for other similar types of pandemics in the future.

      Table 2.  Summary of different mitigation strategies for pandemics addressed in hazard mitigation plans for 49 states, the District of Columbia, and four territories (American Samoa, Guam, Northern Mariana Islands, and Puerto Rico).

      Hazard
      mitigation
      plans
      Mitigation strategies as suggested by CDCVaccinationVulnerability assessmentEconomic consequencesOnly acknowledges the need for addressing pandemicsRefers
      to CDC
      guidelines
      Refers to
      some other
      Influenza
      pandemic plan
      Use of Personal Protective Equipment (PPEs)Self-isolation/ quarantinehygieneRestricted workplaces, schools, travel, and mass gatherings
      Alabamax
      Alaska
      American Samoa
      Arizonaxxxx
      Arkansasxxxxxxxx
      Californiaxxxxxxxxx
      Coloradoxxxxxxx
      Connecticutxx
      Delawarexxx
      District of Columbiax
      Floridaxxxx
      Georgia
      Guamxx
      Hawaiixxxxxx
      Idahoxxxxxx
      Illinoisxxxxxxxxx
      Indianax
      Iowaxx
      Kansasxxxxx
      Kentucky
      Louisianaxx
      Mainex
      Maryland
      Massachusettsxx
      Michiganx
      Minnesotaxxx
      Mississippix
      Missourixxxxxxx
      Montanaxxxxx
      Nebraska
      Nevadaxxx
      New Hampshirexxxx
      New Jerseyxxxxx
      New Mexico
      New York
      North Carolinaxxxxxx
      North Dakotaxxxxxx
      Northern Mariana Islands
      Ohiox
      Oregonxx
      Pennsylvaniaxxxx
      Puerto Rico
      Rhode Islandxxx
      South Carolinax
      South Dakotax
      Tennesseexxx
      Texas
      Utahx
      Vermontxx
      Virginiax
      Washingtonxx
      West Virginia
      Wisconsinxxx
      Wyoming
    • We analyzed the hazard mitigation plans for the nine strategies identified above. Figure 4 shows the number of hazard mitigation plans addressing different mitigation strategies for pandemics. According to Fig. 5 and Table 2, about 57% (31 out of 54) of the hazard mitigation plans refer to the CDC guidelines.
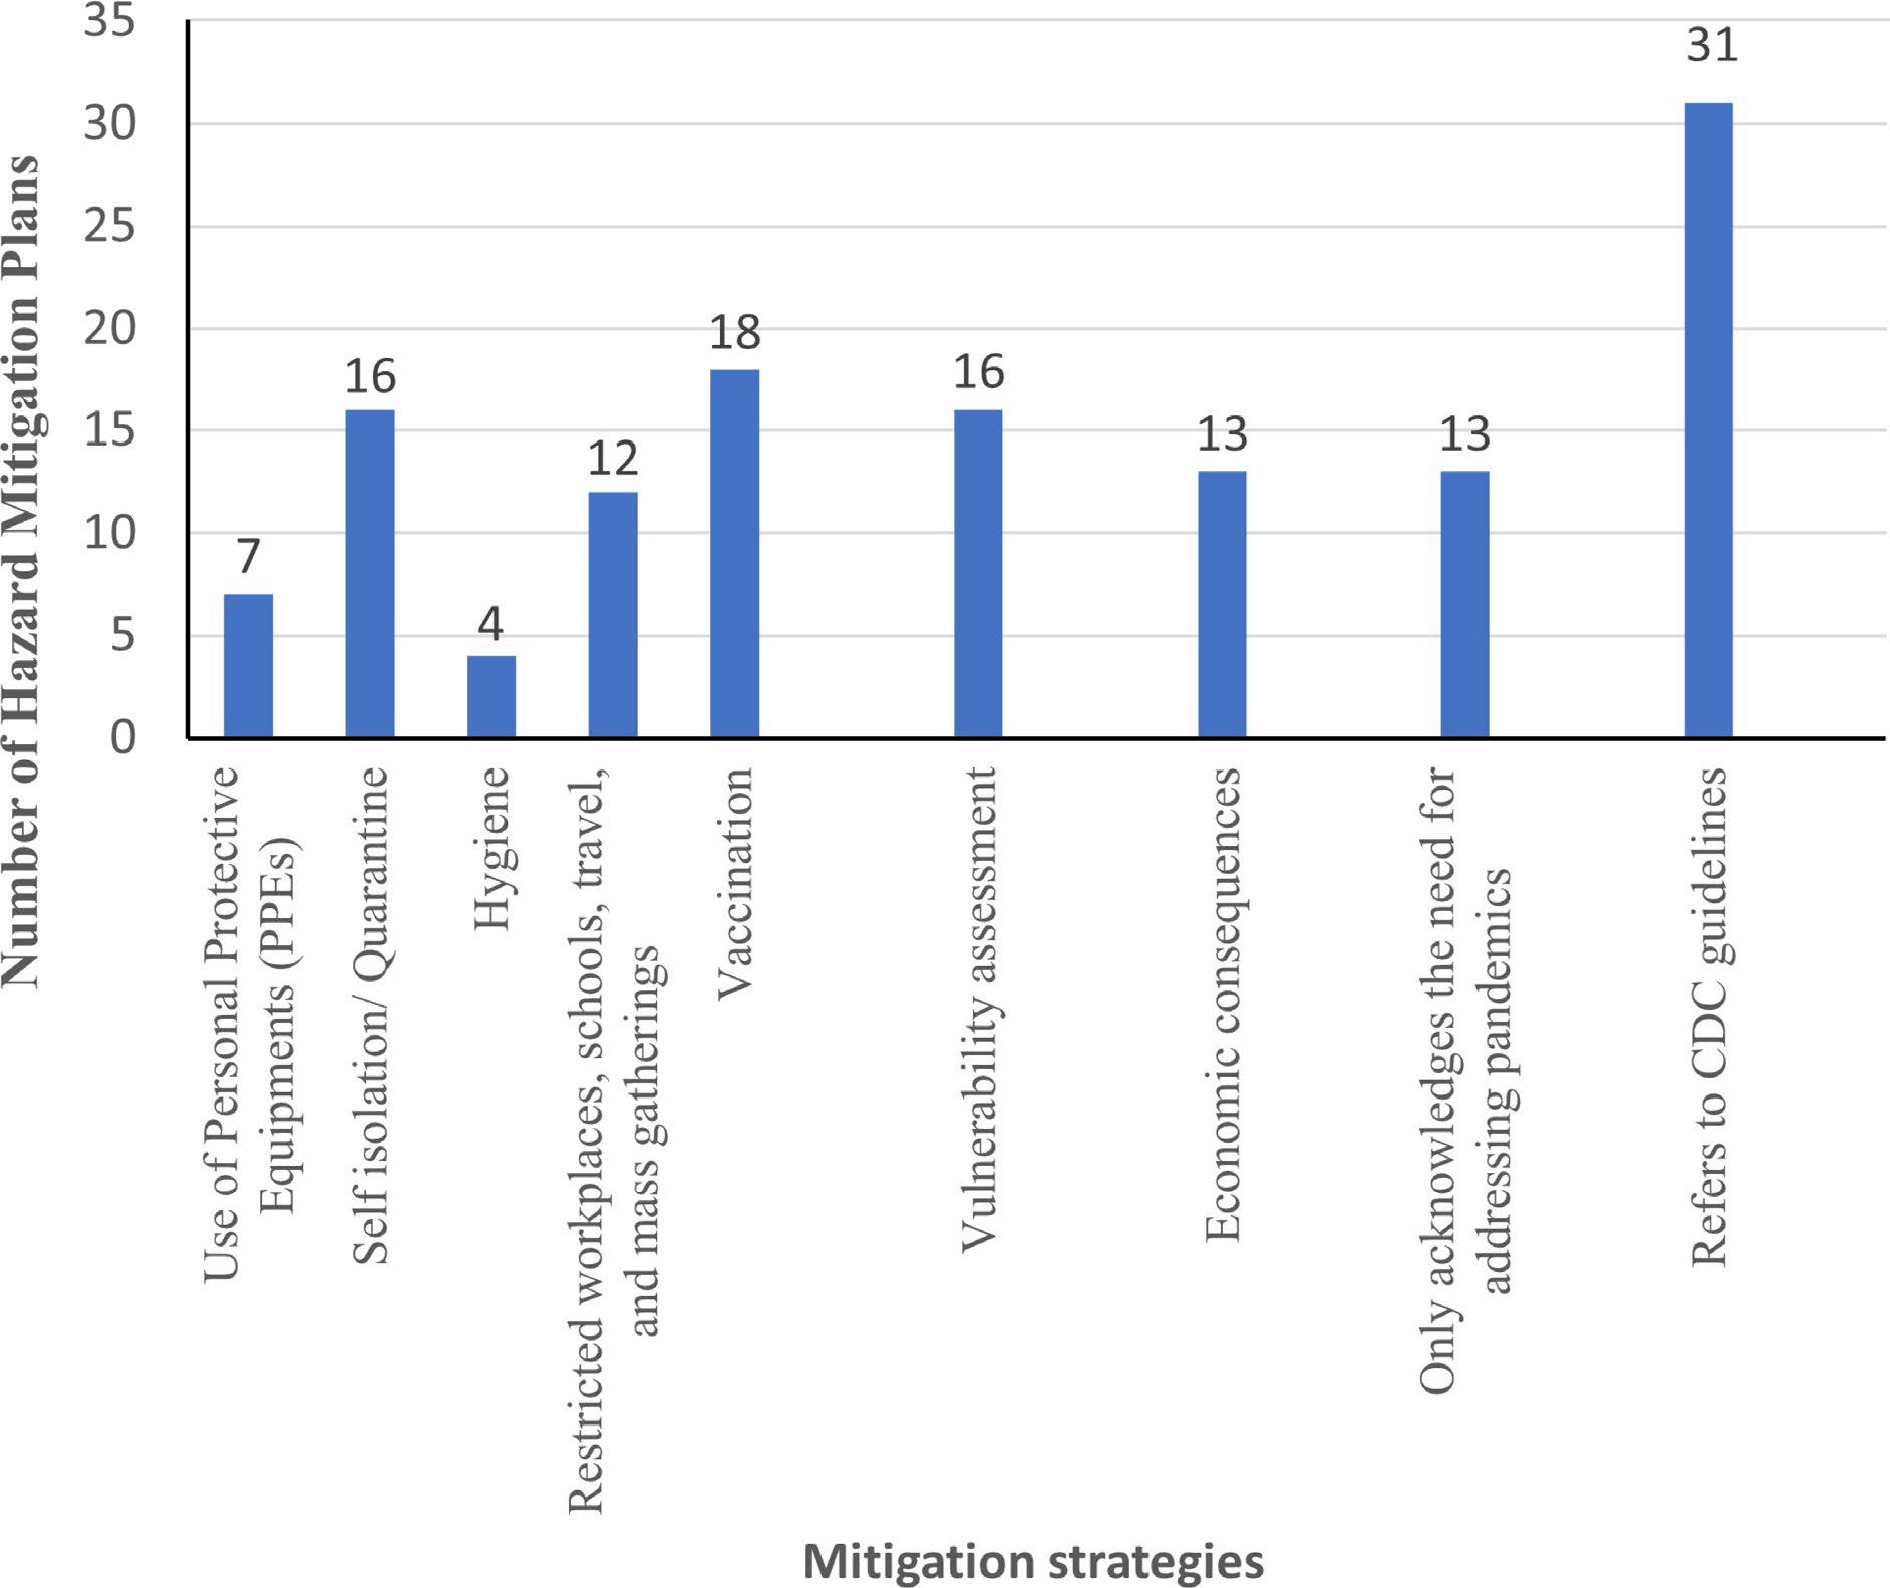
      Figure 5. 

      Graph depicting number of hazard mitigation plans addressing different mitigation strategies for pandemics.

      About 24% (13 out of 54) of the plans only acknowledge the need for addressing pandemics. These states include Alabama, Iowa, Louisiana, Massachusetts, Minnesota, Mississippi, Oregon, South Carolina, South Dakota, Utah, Vermont, Virginia, and the District of Columbia. This is an alarming situation considering the impact of the ongoing coronavirus pandemic. Therefore, these states need to update their hazard mitigation plans to include the mitigation strategies for pandemics.

      Table 2 provides a summary of different mitigation strategies for pandemics which are addressed in the hazard mitigation plans. From Table 2, we found that about 24% (13 out of 54) of the plans do not even acknowledge the need for addressing pandemics. These states include Alaska, Georgia, Kentucky, Maryland, Nebraska, New Mexico, New York, Texas, West Virginia, Wyoming, and territories of American Samoa, Northern Mariana Islands, and Puerto Rico. These states are in dire need of a mitigation plan update. If a pandemic were to strike again later, these states could be worst affected. Therefore, these states also need to update their hazard mitigation plans based on the CDC guidelines, local characteristics, and population. About 18% (10 out of 54) of the plans refer to some other earlier proposed emergency plans for influenza pandemics. The hazard mitigation plans for Arkansas, California, Florida, Illinois, Iowa, Louisiana, Minnesota, Mississippi, Montana, and New Hampshire refer to other mitigation plans which are designed specifically for influenza pandemics. Therefore, guidelines should be made in accordance with the nature of a pandemic such as airborne, waterborne, respiratory disease, etc.

      As shown in Fig. 4, only a few states address all the mitigation strategies described in Table 2. Figure 4 shows the number of pandemic mitigation strategies employed by US states and territories. Use of PPEs is only addressed in about 13% (7 out of 54) of the plans. These states include Arkansas, California, Colorado, Florida, Illinois, North Carolina, and Wisconsin. Promoting the use of PPEs appeared to be a simple task. However, this misconception was highlighted during the coronavirus pandemic in 2020. Some people had been avoiding the use of PPEs due to their set of beliefs and ideologies. Also, political agendas played an important role in further exploiting this issue. Therefore, more states need to address this issue of promoting the use of PPEs effectively in their hazard mitigation plans. Hygiene was also hardly addressed in mitigation plans. Only 7% (4 out of 54) of the plans addressed the importance of proper hygiene to restrict the spread of pandemic. These states include Arkansas, California, Connecticut, and Illinois. Hygiene practices are ignored because they are usually considered too simple and obvious. However, the mitigation plans need to include these because they are critical to restrict the spread of pandemics.

      California and Illinois are the only two states that address all the nine mitigation strategies identified above. They have separate chapters in their hazard mitigation plans which are solely dedicated to infectious diseases outbreak and pandemics. Also, Arkansas and Colorado address eight out of the nine mitigation strategies identified above. Other states can draw some parallels by comparing their plans with California, Illinois, Arkansas, and Colorado.

      Finally, Fig. 5 suggests that all the mitigation strategies identified above are scarcely addressed in the hazard mitigation plans. This might be because pandemics are low probability disasters, but they have a high impact. The next occurrence of a pandemic cannot be predicted. The uncertain nature of pandemics makes them more worthy of consideration in hazard mitigation plans. Therefore, all states, the District of Columbia, and the territories need to address mitigation strategies for pandemics thoroughly while updating their hazard mitigation plans.

    • Merriam observed that the FEMA documents for pandemic planning and preparedness usually just redirect the readers to CDC or WHO websites and barely analyzes the issue of hazard mitigation[18]. This was also observed from the results of the content analysis. This can be one of the potential reasons for the slow implementation of mitigation measures during the recent coronavirus pandemic. Although the CDC prescribed some steps that could potentially hinder the spread of infection, the state hazard mitigation plans should have analyzed, modified, and then implemented those measures according to the geographic, social, and economic characteristics of the state. Also, the compliance of hazard mitigation plans with the requirements proposed by the Disaster Mitigation Act of 2000 and FEMA is generally low[47]. This further implies that the plans would not be able to tackle pandemics efficiently which was observed during the recent COVID pandemic. However, a drastic change in planning could be expected after the recent pandemic from the local as well as federal government officials in terms of pandemic mitigation when the state hazard mitigation plans are revised in future[48].

      It was also concluded that although most mitigation plans consider pandemics and epidemics to some extent, they still addressed them with an All-Hazards Approach described earlier. Most mitigation plans described the same general mitigation steps that could be taken on a community level for one public health crisis such as influenza while merely illustrating the steps that need to be taken for other different types of crises. This was also observed in Merriam's analysis of the FEMA documents where the same general links to CDC websites were cited[18]. A thorough analysis is further required to recommend mitigation steps based on the nature of the health crises. For instance, water borne diseases will need different mitigation strategies than air borne diseases. None of the mitigation plans analyze the health crises based on their nature or characteristics. Also, local characteristics of the population such as vulnerability, economics, geography, etc. should be considered to propose mitigation plans tailored according to the local characteristics. This is one of the important drawbacks observed in all the mitigation plans that needs to be addressed in future. A Top Hazards Approach (THA) is being considered as a suitable alternative to AHA[15]. THA is based on the hypothesis that every disaster risk is unique and requires a distinct mitigation plan. It will be interesting to see if the planners consider this approach in the updated plans. Although it is reasonable to refer to such plans for guidance, it would be preferrable to include proper guidelines in the respective state hazard mitigation plans. The plans currently tend to be influenza pandemic specific; this discrepancy should be addressed appropriately in the updated versions of the state hazard mitigation plans.

    • This analysis indicates there is much room for improvement to connect pandemic mitigation into hazard mitigation planning. Furthermore, the current coronavirus pandemic and the strategies undertaken across the world bring many more mitigation strategies that future planners could learn from and apply in mitigation plan revisions. Additional mitigation strategies for pandemics should be explored and could coincide with more traditional natural hazard mitigation actions. For instance, long-term mitigation strategies related to the built environment, for both reducing risk and speed of spread as well as pre-identifying needed strategic locations for testing, vaccination, and quarantine.

      Also, the THA approach for mitigation planning needs to be implemented while drafting the new state hazard mitigation plans. This approach will be instrumental in developing more effective plans which are suited to the state population. Along with the THA approach, FEMA should mandate the inclusion of pandemics as a distinct class of hazards in multi-hazard mitigation planning like other hazards. Most state hazard mitigation plans do not consider pandemics as a distinct class of hazards and instead focus on a particular pandemic hazard such as influenza. After learning through the outcomes of the coronavirus pandemic, the hazard mitigation planners can add much detailed analysis of the mitigation steps necessary to curb the pandemic to avoid such disaster in future.

      This pandemic with its economic consequences and social distancing requirements also highlights mental health impacts as a risk to be estimated and mitigated if possible. Strategies for addressing the mental stability of health care workers, which face long working hours are needed. Currently, Arkansas hazard mitigation plan addresses this issue. Therefore, more work needs to be done to address mental stability of health care workers. As the pandemic continues across the US, these mental health consequences are increasing for other populations as well, and preplanning for surge in these areas is needed.

      Contact tracing is also not addressed adequately in the plans. A proper methodology needs to be proposed for carrying out contact tracing efficiently. Contact tracing has been implemented heavily in the ongoing coronavirus pandemic. A lot can be learned about contact tracing from the outcomes of the coronavirus pandemic. This will help in addressing contact tracing in future mitigation plans.

      The impact of unavailability of public services on people and the economy needs to be addressed. This is an important issue which was not addressed in any plans we analyzed. Unavailability of public services such as transport, restaurants, essential groceries, etc. during pandemics can have a tremendous impact on people. Plans need to address this issue of shortage of public services. Also, shortage in services can lead to economic losses of many locally owned businesses. This can lead to an increase in homelessness and joblessness. These conditions can adversely impact the mental wellbeing of people and lead to mental illnesses. Mitigation plans also need to address this issue.

      Moving forward, hazard mitigation planners can use lessons learned during the COVID-19 pandemic to identify needed mitigation features for future pandemics, thinking creatively about health in our built and social environments. Future researchers could evaluate how COVID-19 has changed hazard mitigation plans in the future and how well mitigation plans integrate with public health planning efforts.

      A limitation of this research could be that the pandemic hazard mitigation strategies used for the content analysis of the 54 plans are adopted from CDC based on their recommendations for the recent coronavirus pandemic. More strategies could be identified and adopted along with the nine strategies mentioned in this paper for the content analysis based on the review of CDC recommendations for past pandemics.

      • The authors declare that they have no conflict of interest.

      • Copyright: © 2022 by the author(s). Published by Maximum Academic Press on behalf of Nanjing Tech University. This article is an open access article distributed under Creative Commons Attribution License (CC BY 4.0), visit https://creativecommons.org/licenses/by/4.0/.
    Figure (5)  Table (2) References (48)
  • About this article
    Cite this article
    Pawar B, Meyer M, Wang Q. 2022. Content analysis of state hazard mitigation plans and their ability to address pandemics. Emergency Management Science and Technology 2:12 doi: 10.48130/EMST-2022-0012
    Pawar B, Meyer M, Wang Q. 2022. Content analysis of state hazard mitigation plans and their ability to address pandemics. Emergency Management Science and Technology 2:12 doi: 10.48130/EMST-2022-0012

Catalog

  • About this article

/

DownLoad:  Full-Size Img  PowerPoint
Return
Return