


-
Global soil salinization poses a significant threat to worldwide agricultural production. Efficiently utilizing saline-alkali land is crucial, but enhancing crop salt tolerance remains a challenge. Molecular marker-assisted genetic breeding is the primary strategy for improving salt tolerance in crops, aiming to explore and exploit the genetic resources within the crop such as rice[1], wheat[2], cotton[3], tomato[4], and soybean[5]. However, the success of this approach depends on the availability of genetic variation resources within the species. Notably, the development of 'Salt-tolerant Rice' by Yuan Longping's team was attributed to the wild variety 'Hai Rice 86', which possesses excellent salt tolerance genes[6,7]. Additionally, the creation of salt-tolerant mutants has been successful, as seen in the development of the salt-tolerant rice variety 'Kaijin' derived from the mutant hst1[8−10]. However, most crops are sensitive to saline soil, with limited genetic variation and available salt-tolerant QTL/genes[11,12]. Hence, it is crucial to investigate salt-tolerant wild species to understand their coping mechanisms and identify genetic resources related to salt tolerance[13,14].
Ipomoea pes-caprae L. (IPC), also known as beach morning glory, is a perennial herbaceous vine belonging to the Convolvulaceae family. It is primarily distributed in tropical and subtropical beach areas[15]. Due to its coastal nature, IPC possesses a well-developed root system and creeping growth advantages, making it highly effective in windbreak and sand-fixing[16]. As a pioneer plant, it plays a crucial role in ecological improvement, particularly in desert and harsh environments. IPC has been widely used in traditional medicine for treating various ailments, such as skin infections, respiratory diseases, and hypertension. It exhibits exceptional salt tolerance and can thrive in high-temperature, dry, and saline-alkali environments[17,18]. Currently, research on IPC primarily focuses on its medicinal value. The plant serves as a valuable source of bioactive compounds, including flavonoids, alkaloids, and saponins, which exhibit various pharmacological activities, such as antioxidant, anti-inflammatory, and antitumor effects[16]. Being closely related to sweet potato, IPC holds substantial genetic resources that could contribute to the innovation of sweet potato germplasm. Several studies have reported that IPC exhibits high levels of tolerance to various abiotic stresses, such as salt, drought, and heat, making it a potential candidate for breeding programs aimed at enhancing stress tolerance in sweet potato cultivars. High-throughput RNA-seq technology has been employed to uncover IPC’s response to salt treatment and high/low-temperature stress[19,20]. Through a Fox-hunting technology, Zhang et al. identified 38 candidate salt-tolerance genes involved in water deficit, reactive oxygen species (ROS) scavenging, cellular vesicle trafficking, metabolic enzymes, and signal transduction factors. Among them, IpDHN was isolated and characterized to have the potential to enhance plant salt-tolerance subsequently[21,22].
Considering the importance of IPC in medicine, ecology, and biology, we reported its fundamental characteristics, including chromosome number and genome sizes[23], and have also deciphered its chloroplast genome[24]. In this study, we assembled and annotated the high-quality chromosome-level genome of IPC, anchoring the scaffold to 15 chromosomes (2n = 2x = 30). Comparative genomic analysis revealed a closer relationship between Ipomoea trilobal (ITB) and Ipomoea trifida (ITF) than with IPC. The diversity between IPC and its close relatives occurred ~17.41 million years ago. Gene expansion and duplication analysis shed light on salt tolerance in IPC and the evolutionary formation of salt tolerance compared to non-tolerant relatives. Analysis of gene expression changes under salt treatment provided insights into IPC's response to salt-stress, including salinity-related genes and the synthesis of chlorogenic acid (CQA), a primary medicinal component. We identified CQA synthesis genes and analyzed their expression in different tissues and under salt treatment. Our findings suggest that medicinal components may accumulate under salinity conditions, highlighting the importance of cultivating IPC in its native or similar environments for optimal medicinal productivity.
-
IPC plants for genome sequencing were collected from a beach in Changle, Fuzhou, Fujian, China (Latitude 25°54'33˝ N, Longitude 119°40'42˝ E). One-month-old seedlings were used for DNA isolation and subjected to de novo genome sequencing. A 40 KB SMRTbell library was constructed for CCS mode sequencing on the PacBio Sequel II platform. A 2 g leaf sample was used for Hi-C library construction using Mbo I enzyme for DNA digestion, following a method by Xie et al.[25].
De novo assembly of the IPC genome
-
PacBio raw data underwent HiFi CCS reads extraction using SMRTlink software (
www.pacb.com/support/software-downloads ) with minPasses of 5. The HiFi reads were assembled into a contig-level genome using the HiCanu software[26], and Purge_dups was used for removing redundant contigs[27]. Hi-C sequencing data were first evaluated by HiC-Pro software[28], then subjected to anchor the contigs to 15 chromosomes with ALLHiC software[29]. Both the raw data and the genome assembly have been securely archived at the China National Center for Bioinformation (www.cncb.ac.cn ), accessible via the project number PRJCA020559 or the following accession numbers: CRA013080 for the raw data and GWHEQBK00000000 for the genome assembly.Comparative genomic analysis, repeat analysis, and duplication detection
-
The longest protein sequences of all species were searched against each other using BLASTP (E value < 1e-5) (
https://blast.ncbi.nlm.nih.gov/Blast.cgi ), and they were clustered using the OrthoFinder algorithm[30]. The MUSCLE program was used for alignment[31], and the RAxML package was used to construct a maximum-likelihood phylogenetic tree with single-copy genes from the analyzed species[32]. Repeat sequences were annotated using Repbase and a species-specific de novo repeat library from RepeatModeler[33]. Different modes of gene duplication were identified using DupGen_finder with default parameters[34]. -
The genome size of IPC was initially estimated using flow cytometry (FCM) and the results showed that its genome is approximately 1.08 GB in size (Supplemental Table S1). 24.07 GB of CCS reads (30×) were generated from 338.5 GB of PacBio SMRT HiFi read (Supplemental Table S2). The resulting contig-level genome was 2.08 GB, representing the diploid genome of IPC, with an N50 length of 1.77 MB and an average contig length of 255 KB (Supplemental Table S3). The haploid genome was 1.05 GB with an N50 of 4.02 MB and an average contig length of 1.87 MB (Supplemental Table S4). The similarity of the genome size to the FCM results and the good quality of the contigs indicate that the haploid contig-level genome could be used for chromosome anchoring. 125.55 GB (125×) Hi-C data (Supplemental Table S5) was used to anchor the contigs on 15 pseudochromosomes (Supplemental Table S6), and the interaction heatmap supports the quality of the assembly and chromosome-level genome (Fig. 1, Supplemental Fig. S1).
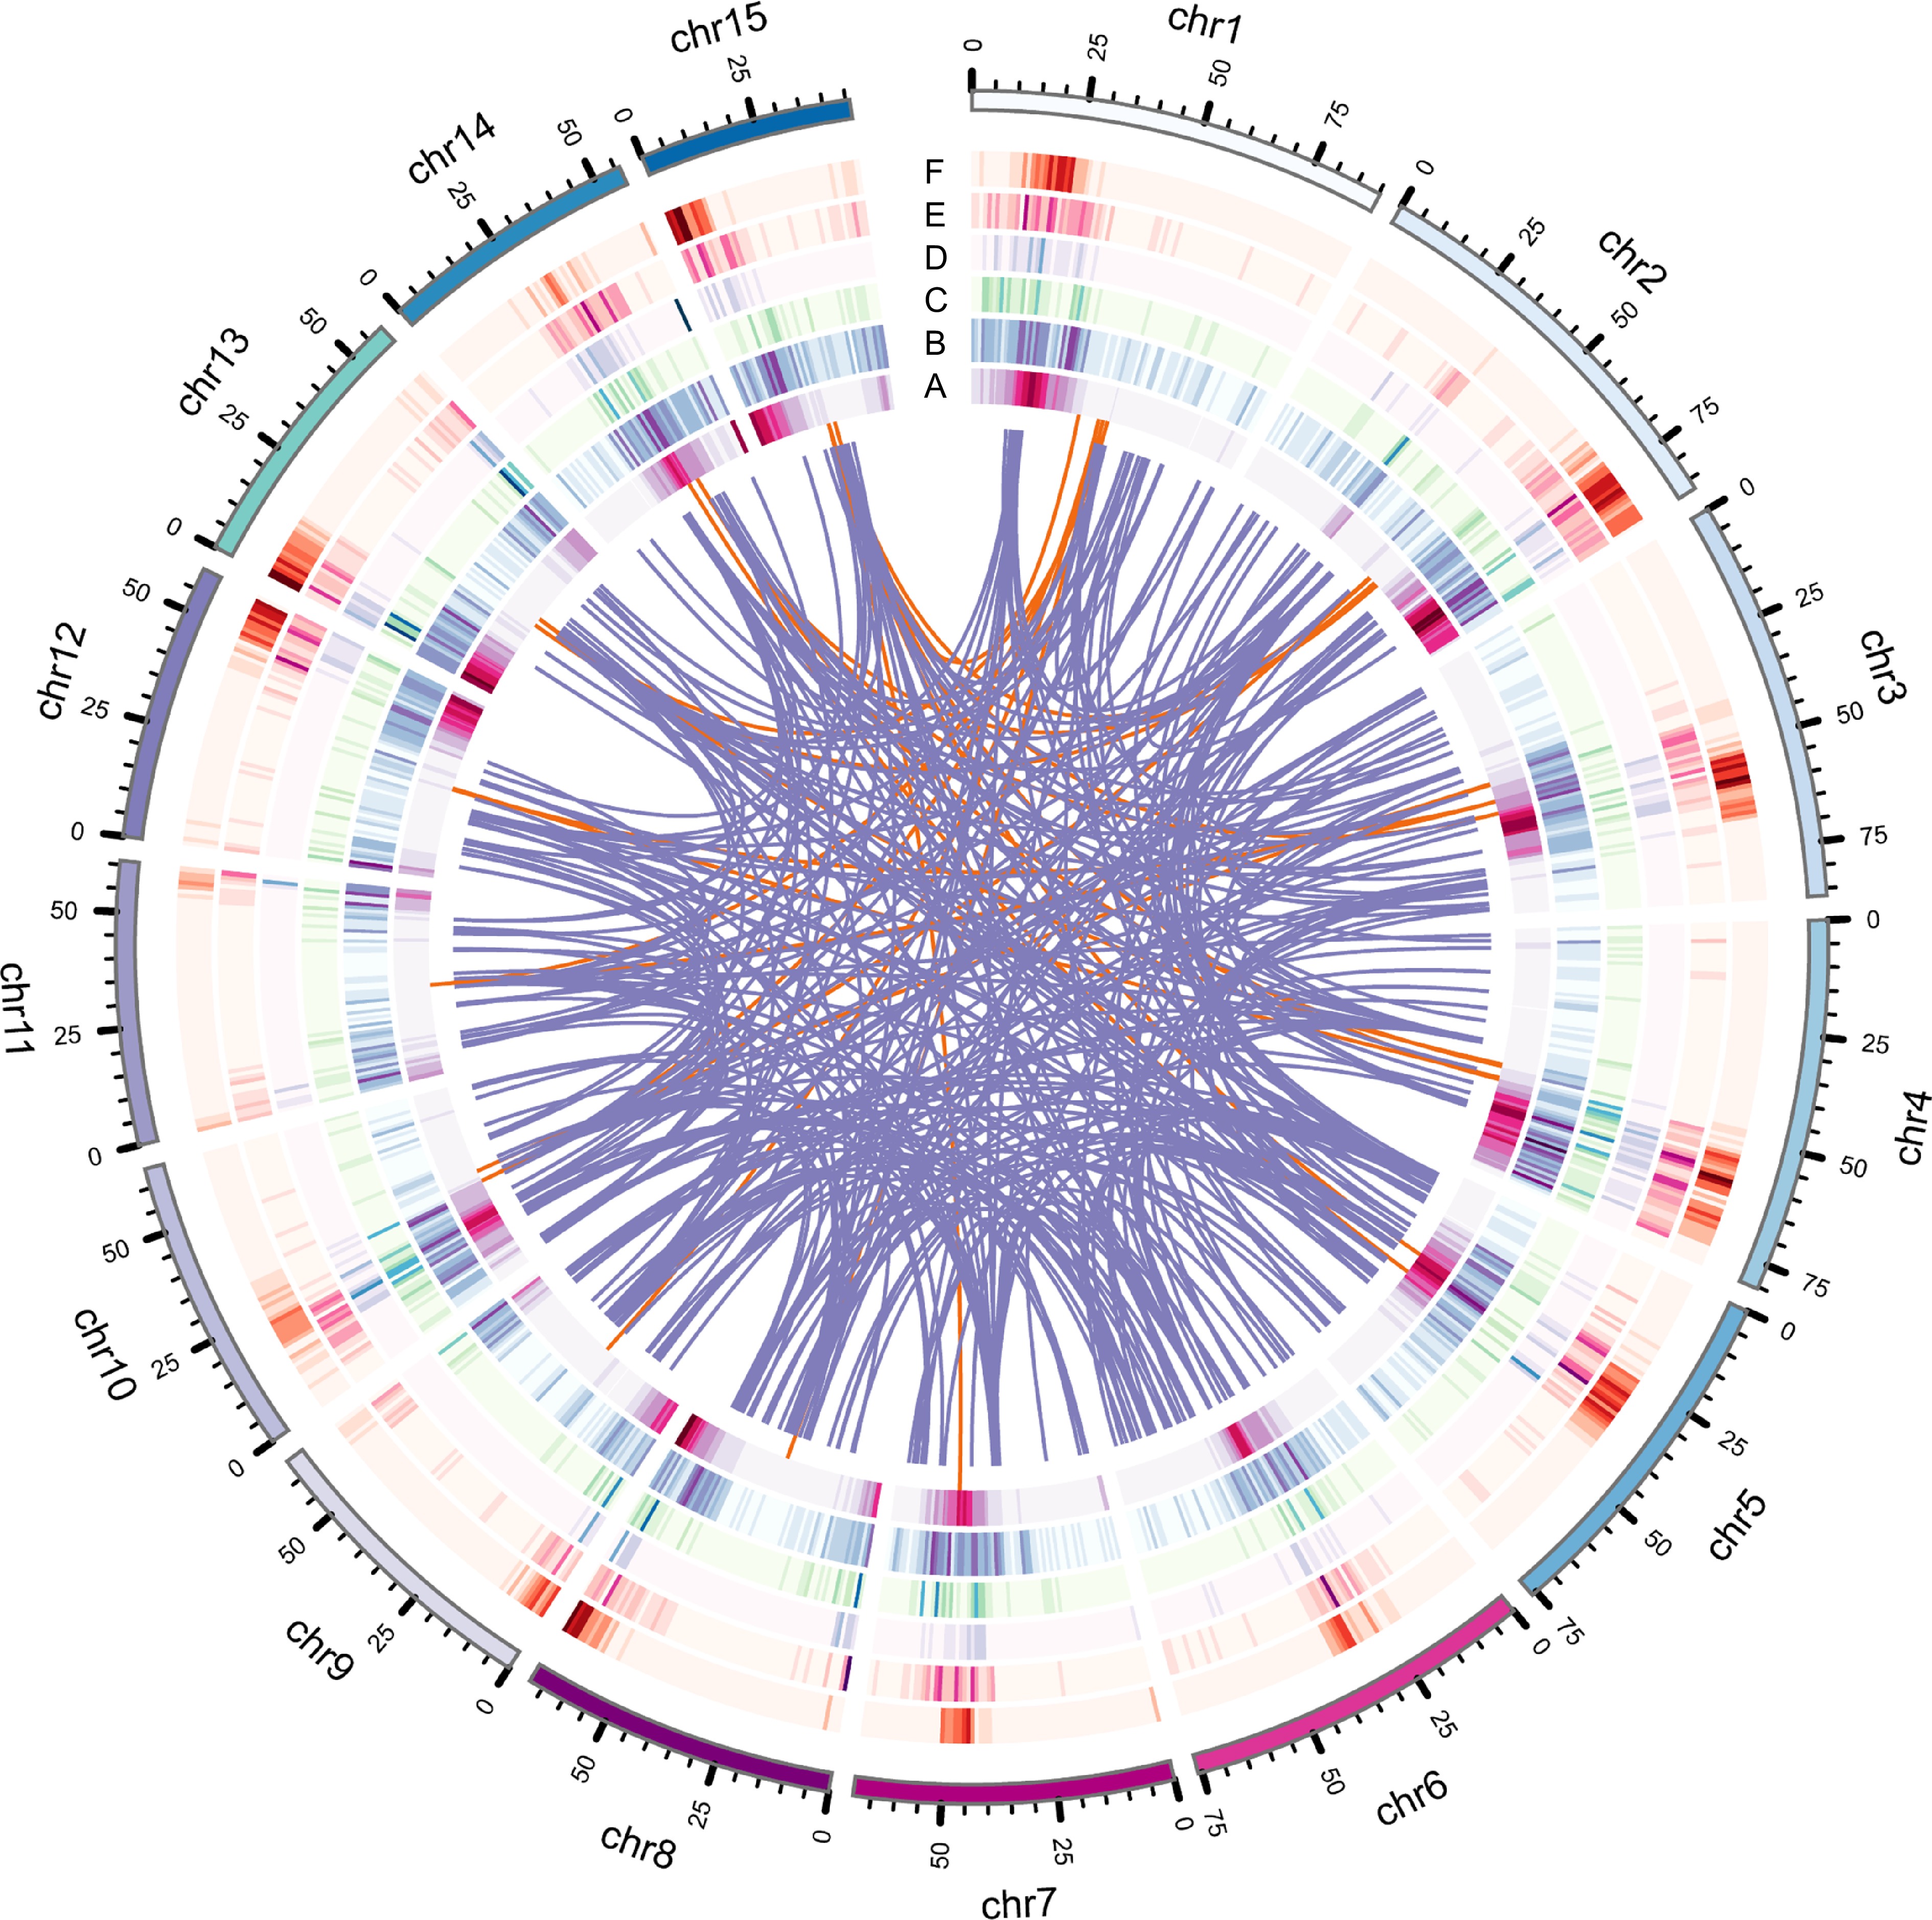
Figure 1.
Genome features of IPC, including various types of gene duplications. (a) Circles represent gene density, (b) DSD, (c) PD, (d) TD, (e) TRD, and (f) WGD duplicated gene densities. The innermost circle represents gene density, while the other circles represent the density of different types of gene duplications.
A comprehensive and reliable annotation of IPC protein-coding genes was obtained by combining the results of de novo prediction, homologous gene prediction, and prediction based on RNA-seq data (Supplemental Table S7, Supplemental File 1−3). The quality of all protein sequences was evaluated using BUSCO, with 1571 complete protein sequences accounting for 97.4% of all protein sequences (Supplemental Table S8). In total, 34,077 protein-coding genes were predicted, with an average gene length of 3496.93 bp and an average exon length of 252.6 bp, of which, 14,008 (41.1%) were annotated by the GO database and 13,975 were annotated by the KEGG database (Supplemental Table S9).
Understanding the IPC genome in the context of comparative genomic analysis
-
Comparative genomics offers a powerful approach to studying the evolutionary history of an organism. In order to elucidate the mechanisms underlying the development of salt resistance in IPC, we conducted a comparative genomic analysis of IPC, along with nine other species. This set of species included four from the Convolvulaceae family: Cuscuta australis, Cuscuta campestris, ITB, and ITF. Additionally, we incorporated five model or node species: Oryza sativa, Actinidia chinensis, Vitis vinifera, Solanum lycopersicum, and Solanum tuberosum. The longest transcripts of the protein-coding genes from each genome were extracted using Orthfinder software, and a comparative analysis and gene family clustering were conducted (Supplemental File 4). As a result, 28,134 orthologous gene families were identified among the 301,339 genes from the 10 species (Supplemental Table S10). Among these genes, 87,501 were single-copy orthologs, while the remaining 213,838 were multi-copy orthologs. Notably, Oryza sativa had the most unclustered genes (7591) and unique family genes (2052), reflecting its distant evolutionary relationship with dicot species (Fig. 2a). Our analysis revealed significant differences in gene composition and gene number between the two Cuscuta species, while the three Ipomoea species showed similar gene compositions, indicating close evolutionary and taxonomical relationships. Shared orthologs among ITB, IPC, Vitis vinifera, Solanum lycopersicum, and Oryza sativa were visualized with a Venn diagram (Fig. 2b), showing that these five species shared 10,170 orthologous gene families, with the maximum number of specific orthologous gene families (2458) observed in IPC. This indicates an early divergence of IPC from other Ipomoea species, specifically ITB. The 168 single-copy orthologs from the 10 species were used to construct a phylogenetic tree, which showed that ITB and ITF are closer to each other than they are to IPC. It is estimated that the diversity of IPC from ITB and ITF occurred ~17.41 million years ago (Fig. 2c).
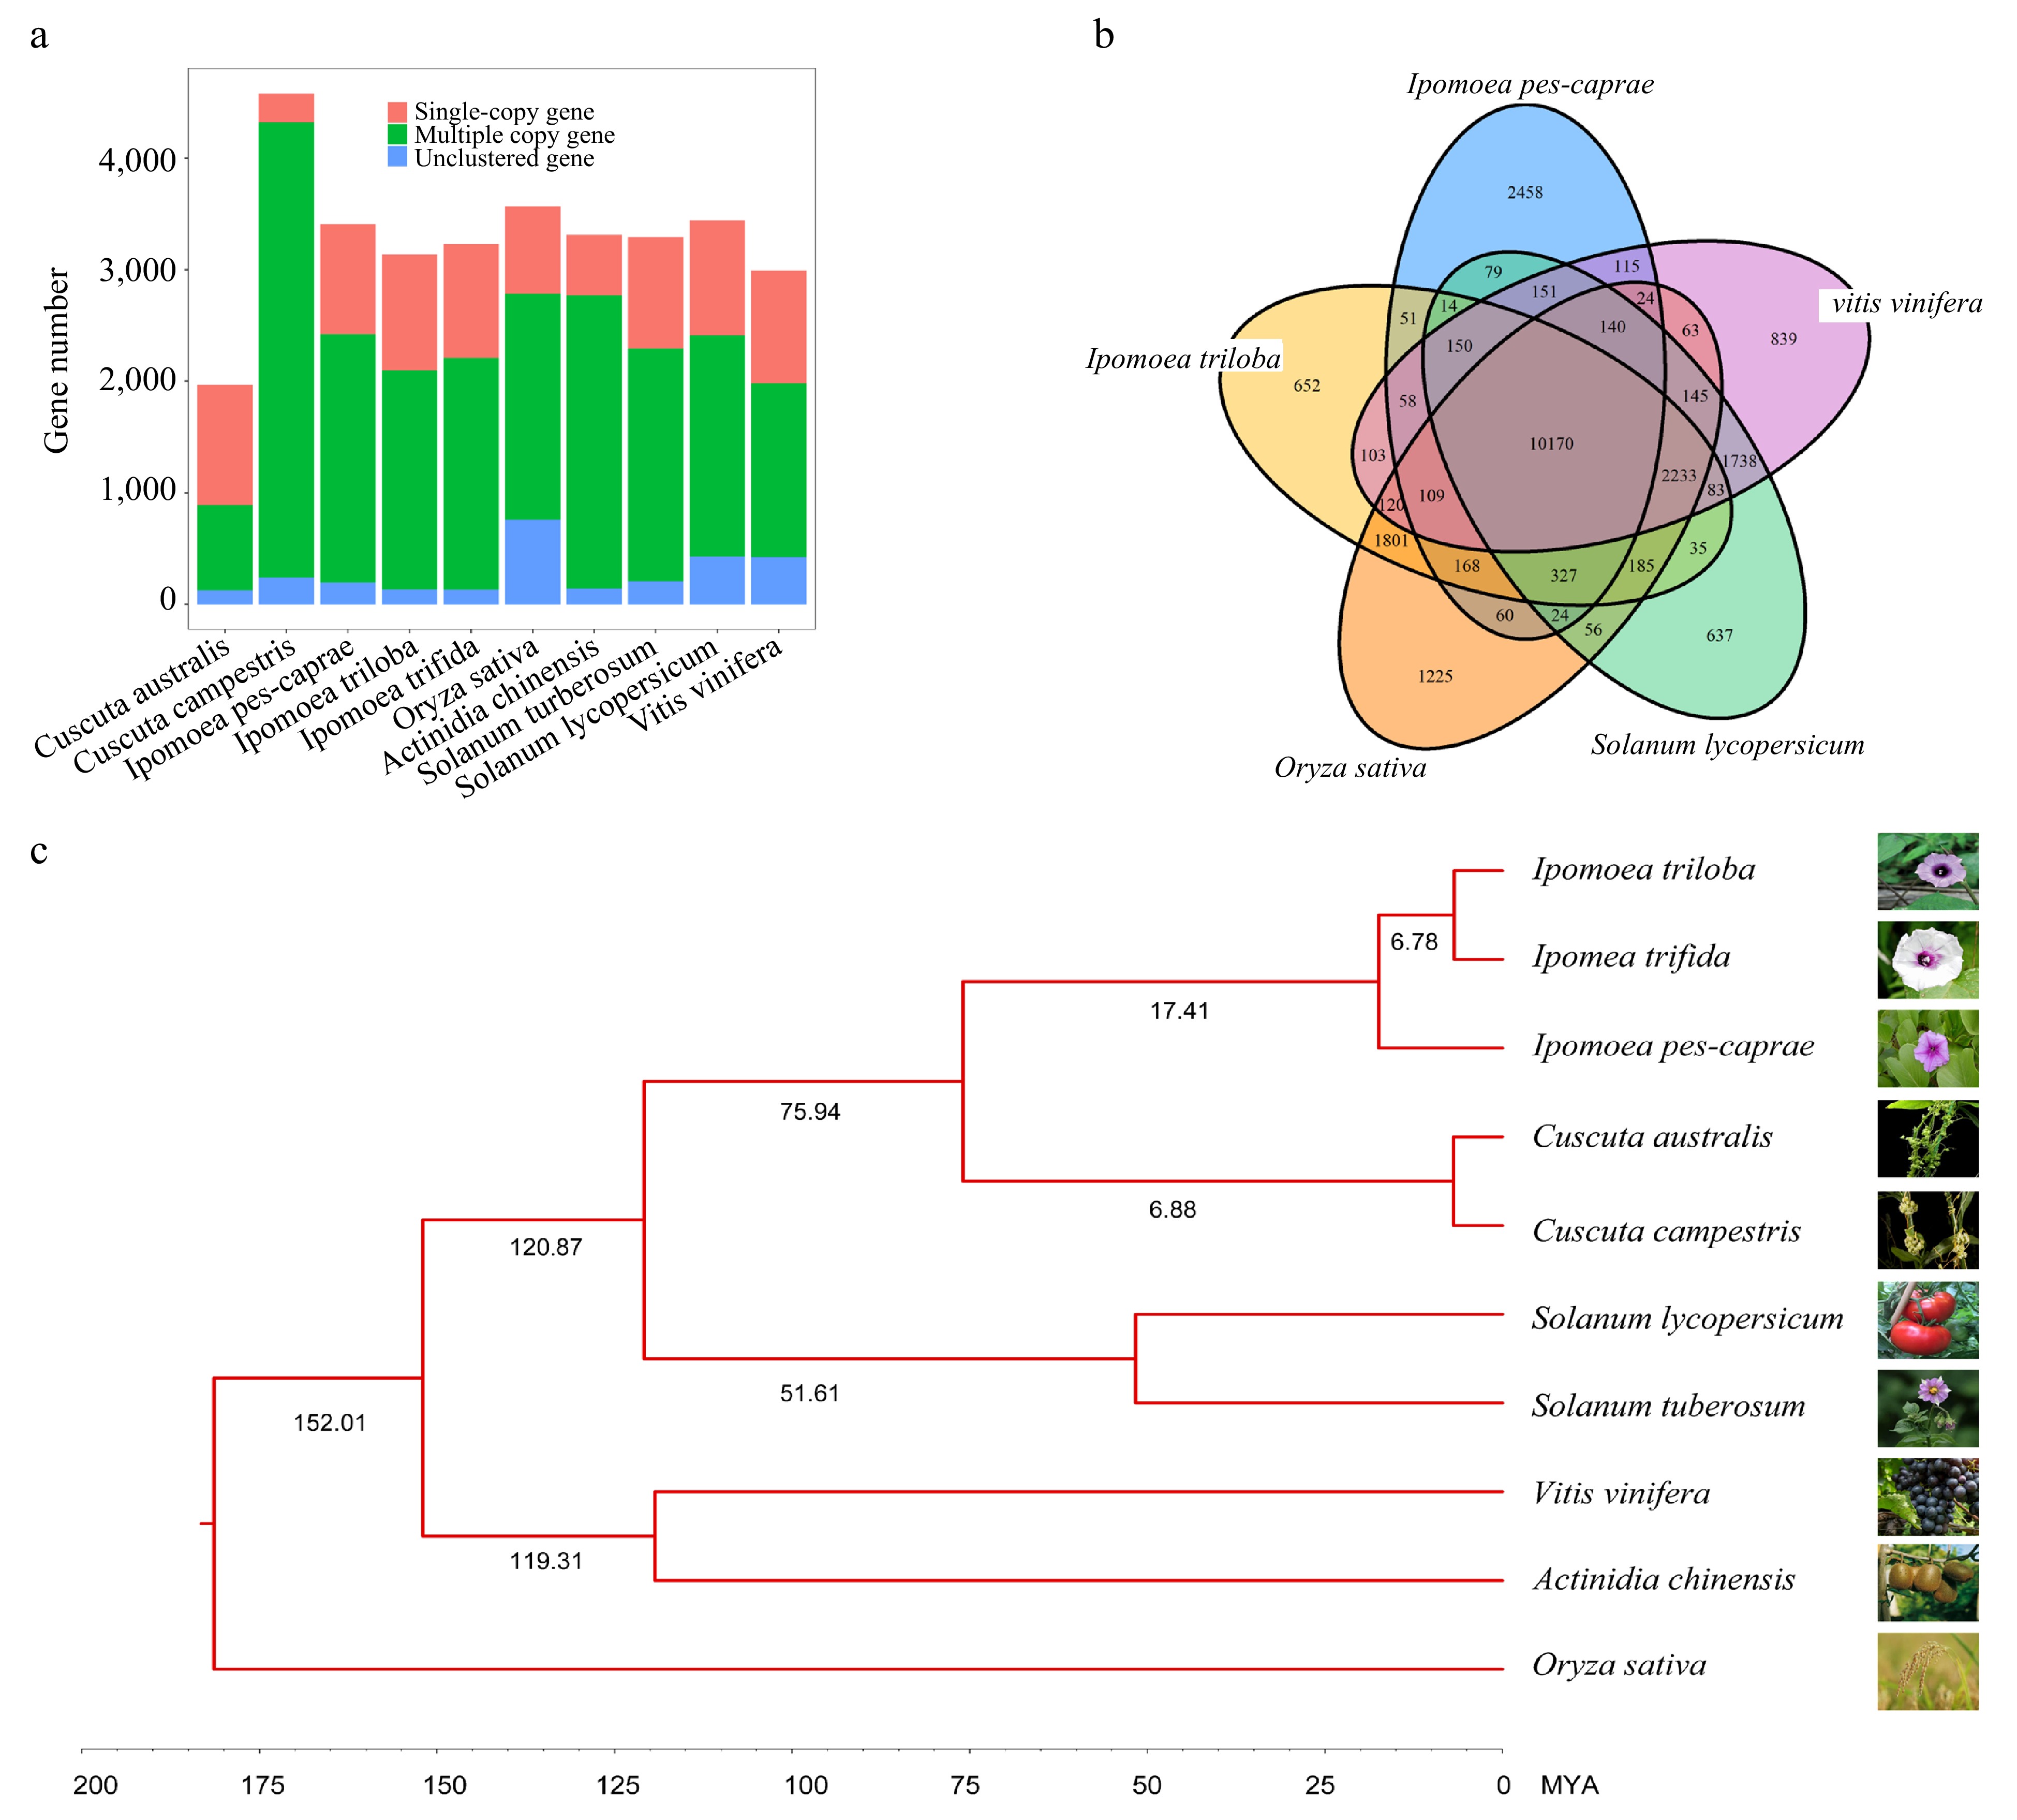
Figure 2.
Comparative analysis of the IPC genome and its close relatives. (a) Copy number analysis of IPC in comparison to nine other species. (b) Venn diagram showing the unique and shared gene families among IPC and four other species. (c) Phylogenetic relationships and estimated divergent times among IPC and nine other species.
To study the WGD (Whole Genome Duplication) in IPC, the homologous protein pairs between ITB and IPC (34239) and within the genome of ITB (17890), Vitis vinifera (7822), and IPC (19945) were used for calculating Ks via WGDI software (Supplemental File 4). The distribution curve of syntenic block kernel density indicated that only one WGD event had occurred in these three species. The close proximity of Ks peaks for IPC and ITB suggests a relatively close genetic relationship between the two Ipomoea species and that they are recently diverged species (Supplemental Fig. S2a). There are 24,041 shared orthologs between IPC and ITF, which accounts for 70.55% of the annotated genes in IPC. In comparison, 24,434 shared orthologs were detected between IPC and ITB, accounting for 71.70% of the total number of IPC genes. We analyzed the genome synteny of IPC with ITB and ITF based on the syntenic blocks of orthologous genes. The results showed that ITB and ITF have a good chromosome synteny, consistent with previous analysis. However, except for chromosomes 8, 9, and 13, significant inversions were observed in other chromosomes of IPC compared to ITB and ITF. Additionally, translocations were detected in chromosomes 2 and 12 of IPC (Supplemental Fig. S2b).
Gene expansion and duplication analysis shed light on salt-tolerance in IPC at the genomic level
-
The same set of species used in previous studies was analyzed for gene family expansion and contraction. In this analysis, the orthologous gene families were clustered by OrthoFinder, which was subjected to detect orthologs family expansion and contraction of the species (Supplemental Table S11, Supplemental Fig. S3). To gain insights into the functions of expansion and contraction genes in the IPC genome, we performed a GO enrichment analysis on these genes, respectively. The contraction gene families were mainly enriched in the following processes or molecular functions: glycosyltransferase activity, response to oxygen levels, and lipid and sterol metabolism (Supplemental Fig. S4). These results suggest that these processes or molecular functions are not critical for IPC's salt tolerance. However, the genes in the expanded gene family are mainly involved in the following processes: immune response, composition of vacuoles, and plasma membrane composition (Supplemental Fig. S3, Supplemental File 5). These genes have been widely studied in the context of plant salt tolerance and suggest that the expansion of these gene families improves the response to salt stress and enhances salt tolerance in IPC. The enrichment of expansion genes in salt tolerance-related GO terms provides new insights into the salt tolerance mechanism of IPC from the genomic perspective.
To determine the origin of the rapid expansion gene in IPC, we analyzed the gene duplication in the genome via DupGen_finder software, resulting in 27040 duplicated genes divided into five duplication types: 9790 WGD (Whole-genome duplication) genes (36.21%), 2760 TD (Tandem duplication) genes (10.2%), 1280 PD (Proximal duplication) genes (4.73%), 6891 TRD (Transposed duplication) genes (25.48%), and 6319 DSD (Dispersed duplication) genes (23.37%). A comparative analysis between the duplicated genes and the rapid expansion genes was conducted (Fig. 3a, b; Supplemental Table S12). Our findings indicate that 1,412 out of the 1,907 rapid expansion genes belong to the DSD type, suggesting that DSD genes were the primary source of the rapid expansion genes in IPC. Moreover, the results showed that the DSD genes account for a high proportion of duplicated genes in IPC.
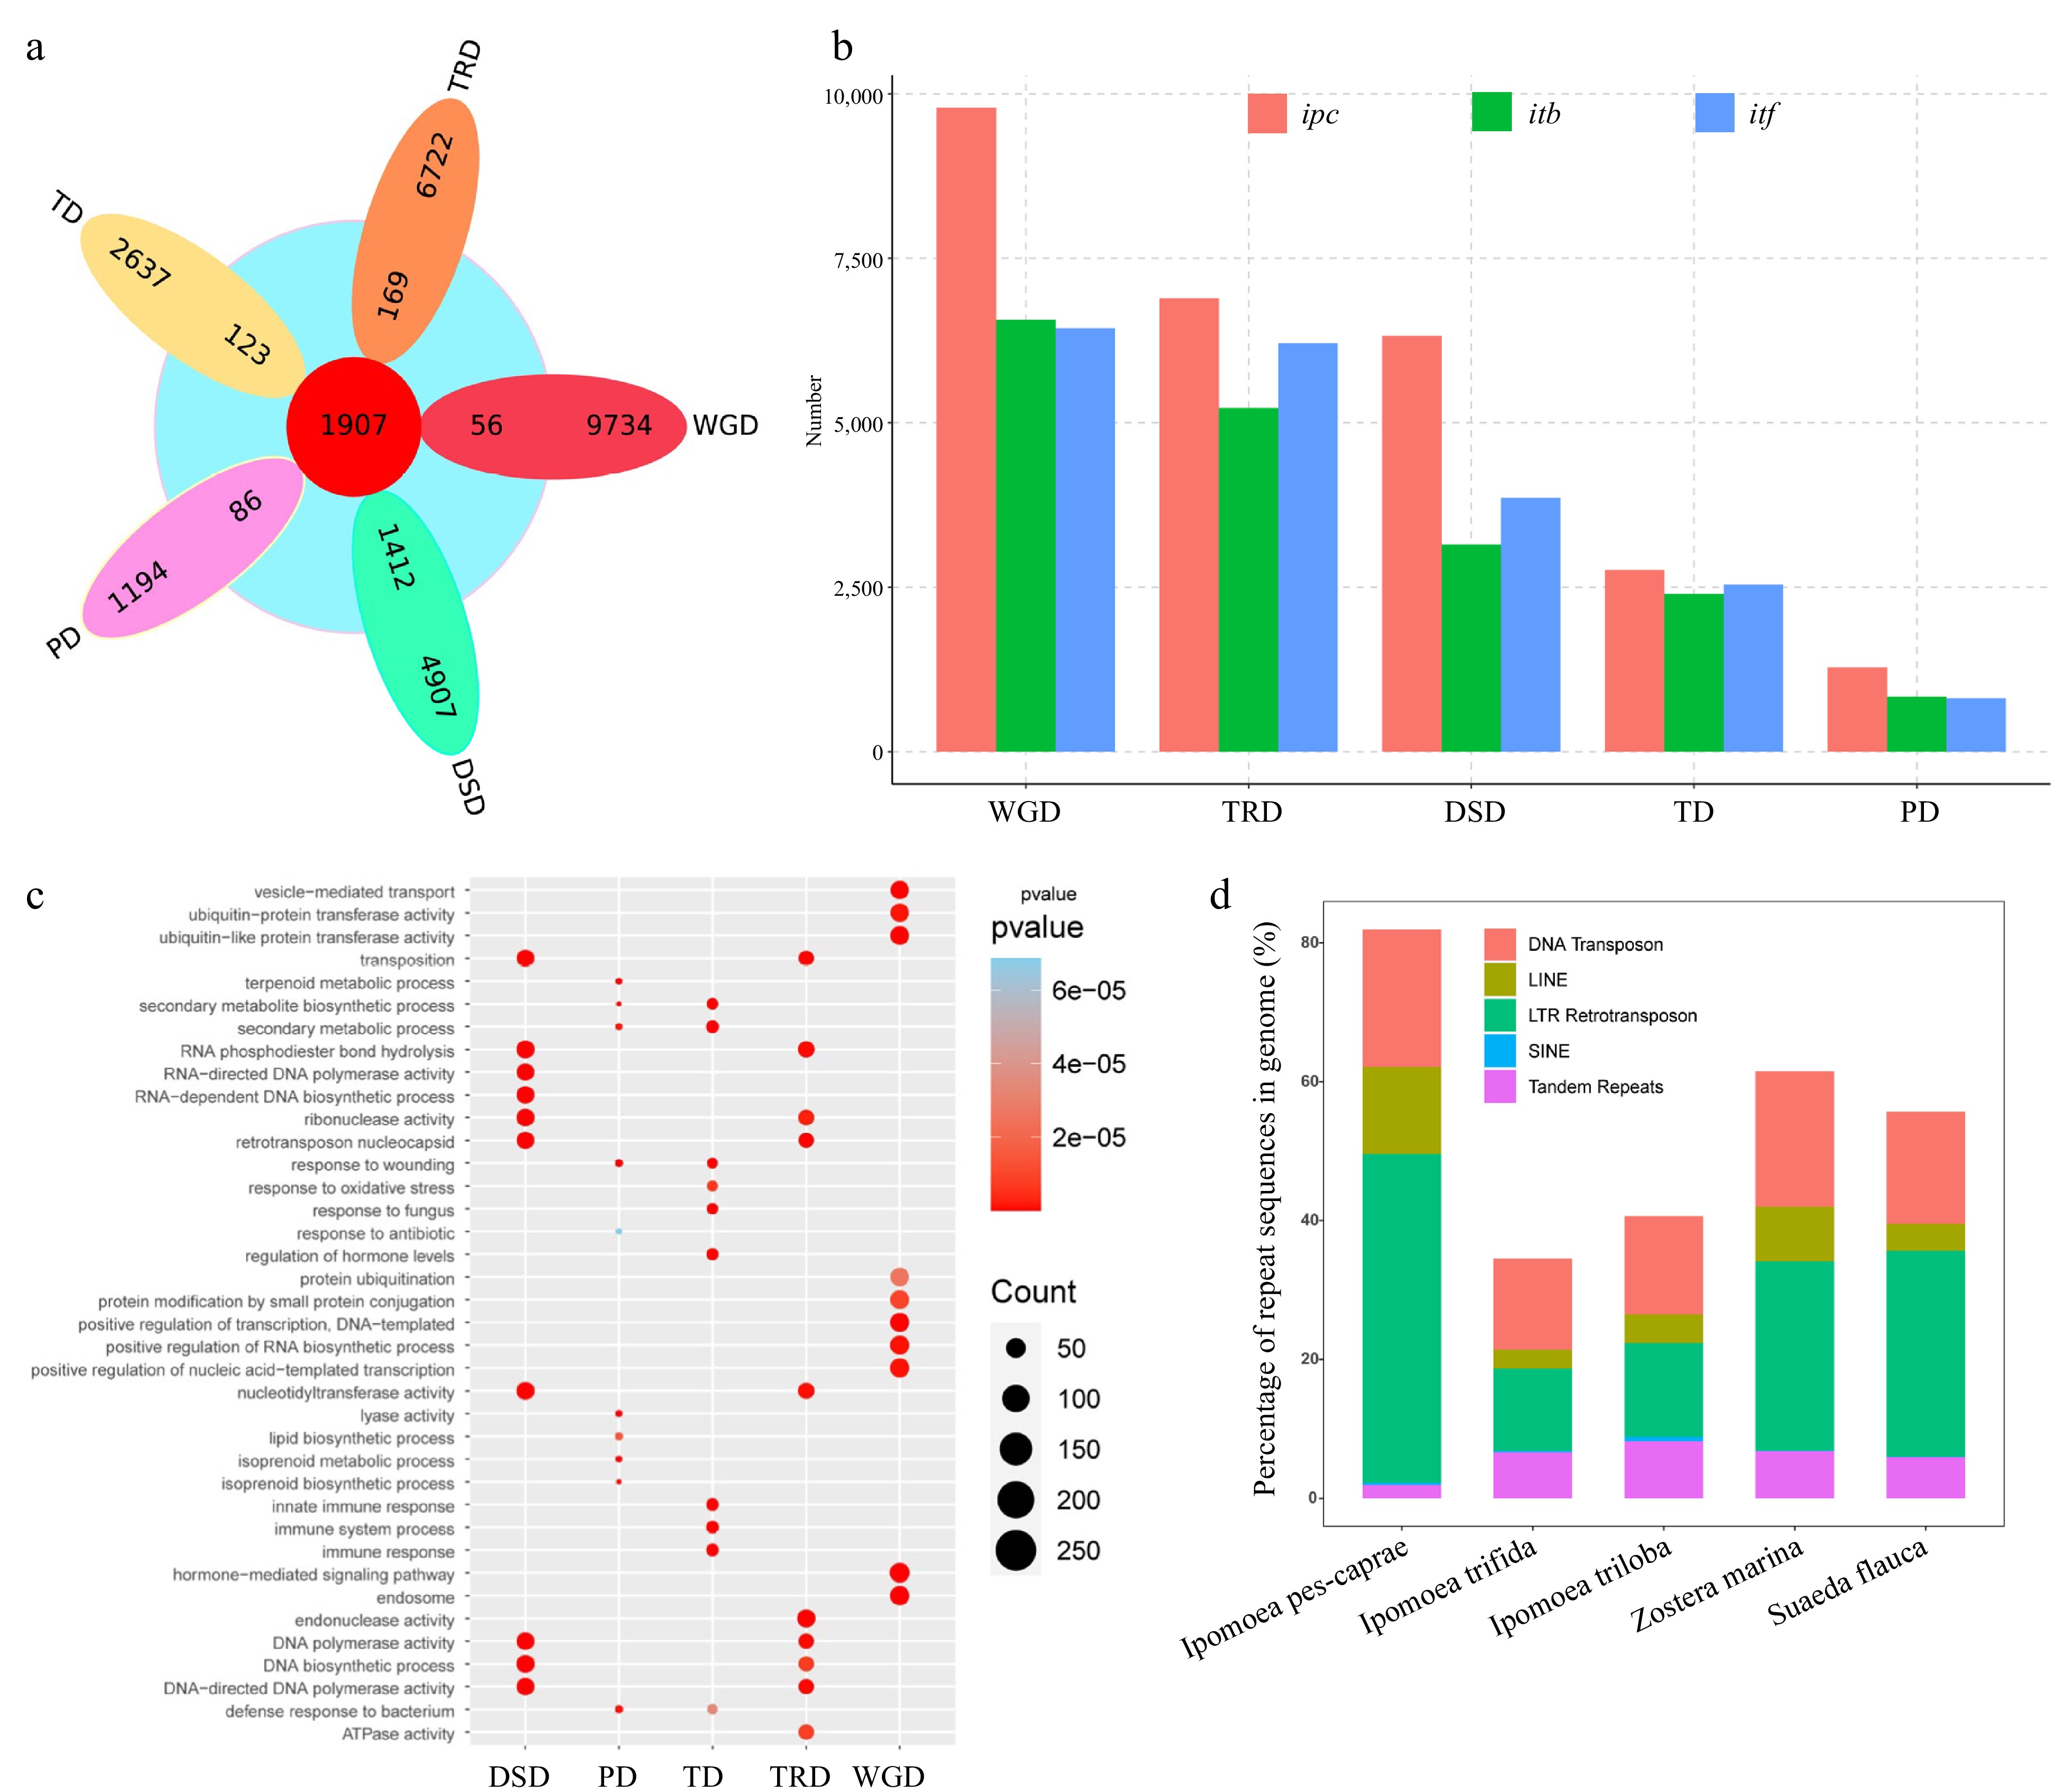
Figure 3.
Analysis of genome sequence repeats and gene repeats in IPC. (a) Venn diagram showing the overlap between expanded gene families and repeat gene families from different duplication events (WGD, TD, PD, TRD, and DSD). (b) Statistics of repeat genes from the five duplication modes in Ipomea pes-caprae (ipc), Ipomoea triloba (itb), and Ipomea trifida (itf). (c) Gene ontology (GO) terms enriched in different types of duplication genes. (d) Proportions of different repeat types in the genomes of the five species.
To gain insights into the salt tolerance mechanism of IPC from a gene duplication perspective, we analyzed the gene duplications in ITB and ITF, two salt-intolerant species in the genus Ipomoea. Our results revealed that the number of duplicated genes of all types in IPC was significantly higher than that in ITB and ITF. We performed Gene Ontology (GO) enrichment analysis based on duplication types. Our results show that TRD and DSD genes are mainly enriched in terms related to transposition and DNA/chromosome stability maintenance. Previous studies have demonstrated that salt stress can induce DNA damage[35−37]. Thus, the expansion of genes related to DNA/chromosome stability maintenance might be one of the mechanisms by which IPC adapts to salt-stressed environments. On the other hand, PD genes are mainly enriched in terms related to the biosynthesis and metabolism of secondary metabolites, such as terpenoids and isoprene, while TD genes are enriched in terms related to tissue immunity and biotic/abiotic stress response, and WGD genes are enriched in terms related to DNA transcription and protein modification, such as protein ubiquitination modification (Fig. 3c).
Expansion of IPC repeat genes is driven by Transposable Element (TE) events
-
To understand the cause of the expansion of repeat genes in IPC, we examined the genomes of three Ipomoea species: IPC, ITB, and ITF. While the species have the same chromosome number (2n = 30), their genome sizes differ significantly. IPC has a genome size of 1.05 GB, which is significantly larger than the genomes of ITB (461.83 MB) and ITF (492.38 MB). To investigate the reason for the larger genome of IPC, we annotated the repeat sequences in the genomes of the three species. The results revealed that a substantial portion of the IPC genome, equivalent to 83.81% or 871.63 MB, consisted of repetitive sequences. The primary contributors to these repetitive elements were transposable elements (TEs), collectively making up 82.81% of the genome sequences, encompassing both Class I and Class II TE categories. Among TE-related repeats, long terminal repeat (LTR) elements were the most prevalent, accounting for 47.37% of the genome, followed by DNA transposons at 19.79%, and non-LTR retrotransposons at 12.84%. Furthermore, 1.92% of the repeat sequences were tandem repeats, and an additional 1.28% of the genome sequence remained unidentified in terms of repeat classification. (Fig. 3d, Supplemental Table S13, Supplemental File 6).
To determine if the gene duplication in IPC was linked to transposon element activity, we conducted a genome-wide analysis of transposon elements in the 10 KB upstream and downstream of gene coding regions. Genes with the detected TEs in these regions were defined as TE-associated genes. Our findings indicated that 82.51% of the genes in the IPC genome were associated with transposable elements (TEs). Notably, 84.82% of duplicated genes exhibited TE associations, whereas only 77.44% of non-duplicated genes were identified as TE-associated. This demonstrates a higher prevalence of TE-associated genes within the duplicated gene group when compared to the non-duplicated gene group. (Supplemental Table S14). In addition, statistics of the nearest TEs upstream and downstream of gene coding regions indicated that duplicated genes tend to have TE elements located within 1,000 bp upstream of their gene coding regions. Furthermore, the first TE appeared close to the gene coding regions, as seen from the ratio of the first TE to the gene coding regions (Supplemental Fig. S5).
To further confirm the association between transposable events and gene duplication, All the TEs within 10 Kb upstream and downstream of the coding regions were statistically analyzed according to duplication types. Except for DSD, the TEs in the IPC genome displayed a position-dependent distribution, with fewer TEs detected closer to the gene coding regions. On average, the number of TEs near the gene coding region of WGD genes was less compared to other duplicated gene types (DSD, PD, TD, and TRD) and unduplicated genes (UD). The occurrence of TEs on TD and TRD duplicated genes was similar to that of unduplicated genes. However, the number of TEs near the coding regions of DSD and PD genes was higher compared to TD, TRD, and UD genes. Furthermore, the distribution of TEs near the coding regions of DSD genes was significantly higher, with a much greater number of TEs detected compared to other gene types. The distribution of TEs near the coding regions of PD genes showed two significant peaks at approximately 2,500 bp upstream and downstream of the coding regions. Given the potential of transposons to mediate gene duplication, and the higher distribution of TEs on PD and DSD genes compared to unduplicated genes (Fig. 4a), it can be concluded that the formation of PD and DSD duplicated genes in IPC is likely due to transposition events.
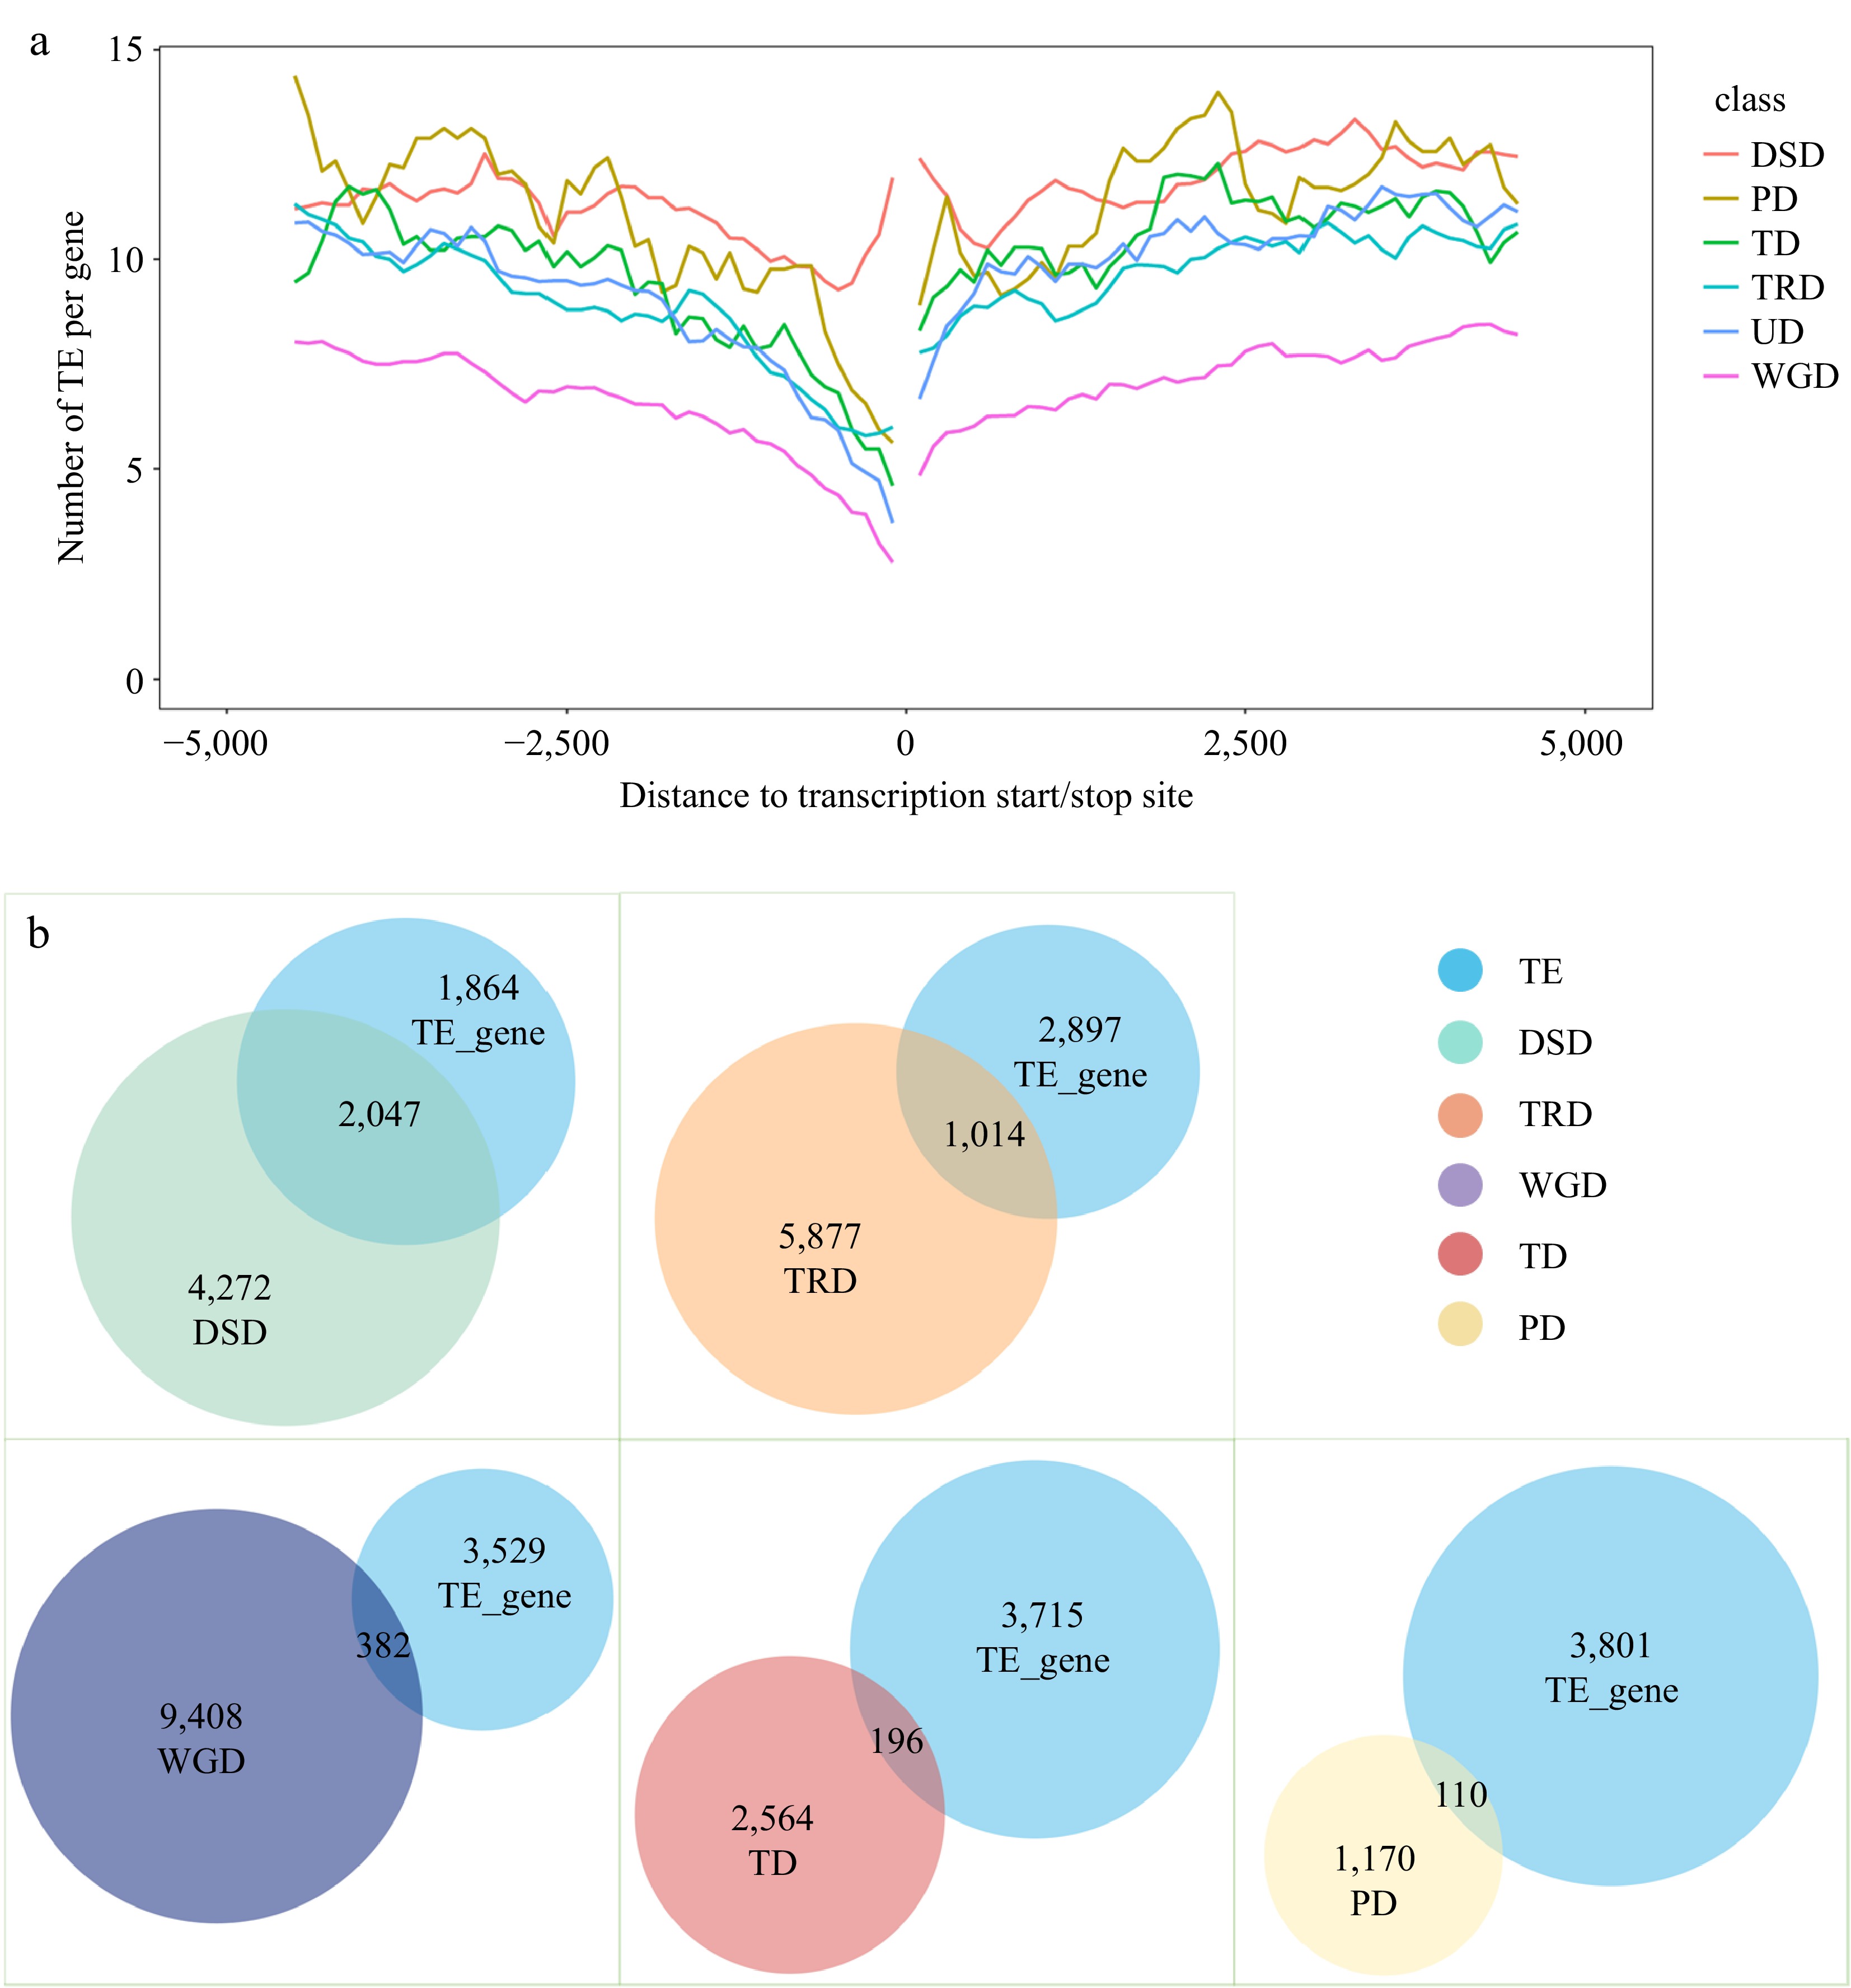
Figure 4.
Analysis of transposable element (TE) events associated with different types of repeat genes. (a) TE distribution in the upstream and downstream regions of coding sequences (CDS) for different types of duplicate genes. (b) Overlap of TE-associated genes with repeat genes of different duplication types.
The eukaryotic genome-wide TEs were investigated using the TEsoter software, which specifically identifies different TE types, especially LTR retrotransposons. The results showed a high abundance of TEs in the IPC genome, with LTRs being the most abundant type. It is known that TEs, particularly LTRs, can cause stable mutations within genes through insertion into or near functional genes. As such, the presence of TEs in the coding regions of IPC genes was analyzed. Of the 34,292 annotated genes, the coding regions of 3,911 genes were found to contain TEs, of which 3,096 were LTRs, 280 were LINEs, 373 were TIRs, 26 were Helitrons, and 136 were of other types (Supplemental Fig. S6, Supplemental Table S15). To better understand the relationship between repeat genes and TEs, the distribution of TE categories and duplication types was visualized using Venn diagrams. The results showed that TEs were detected more frequently in the coding regions of DSD and TRD genes, accounting for 32.39% and 14.71% respectively (Fig. 4b, Supplemental File 7). Similarly, DSD and TRD were the most abundant duplication types in TE-related genes, accounting for 52.19% and 25.93% of the total TE-related genes, respectively (Supplemental Table S16). This result confirms a strong association between DSD and TRD gene duplication and TE events.
Time-course salt-treatment analysis provides insight into the salt tolerance of IPC at the transcriptional level
-
In the absence of a reference genome for IPC, our group and Liu et al. de novo assembled the transcriptome and studied the responses of IPC to temperature extremes and salt treatment[19,20]. For this study, we downloaded the same RNA-seq data and extensively investigated it using our genome assembly as a reference[19]. GO and KEGG enrichment analysis at different time points revealed the response details of IPC roots and leaves to salt treatment (Supplemental Result S1, Supplemental Files 8 & 9). In the IPC roots and leaves, we obtained five main categories of enriched GO as summarized in Fig. 5a and b: response-related pathways, secondary metabolic process, small molecule catabolic process, ion transmembrane transportation-related functions, and phytohormone signaling pathways. Enrichment of the GO terms 'response to water deprivation' at all time points, both in roots and leaves, indicated that salt stress directly affects water absorption in the root systems. Enrichment of the GO terms 'response to oxidative stress' and 'response to reactive oxygen species' at most time points in roots and leaves is consistent with the previous observation that oxidative stress is the secondary toxicity to salinity. The results also showed that secondary metabolic and small molecule catabolic processes played important roles in IPC's response to salt stress. This tendency is more evident in leaves than in roots, with specific metabolites/molecules indicated, including monocarboxylic acid, cutin, suberin, fatty acid, and wax. Furthermore, transmembrane transportation of ions and organic compounds might play critical roles in IPC's adaptation to salt stress because of the enrichment of related GOs, especially in leaves (Fig. 5a, b). Phytohormone regulations also participate in IPC's response to salt stress. The participation of Abscisic acid (ABA), Ethylene (ET), Jasmonates (JA), Brassinosteroids (BR), and Salicylates (SA) was observed at the early stage of salt-treated roots. Only JA and ET signaling pathways were persistently activated at the later stages of roots under treatment. However, the involvement of phytohormone regulation in the IPC leaf responding to salt was not as significant as in the root, with only the ABA signaling pathway up-regulated at a very early stage after treatment (Fig. 5a, b; Supplemental File 10).
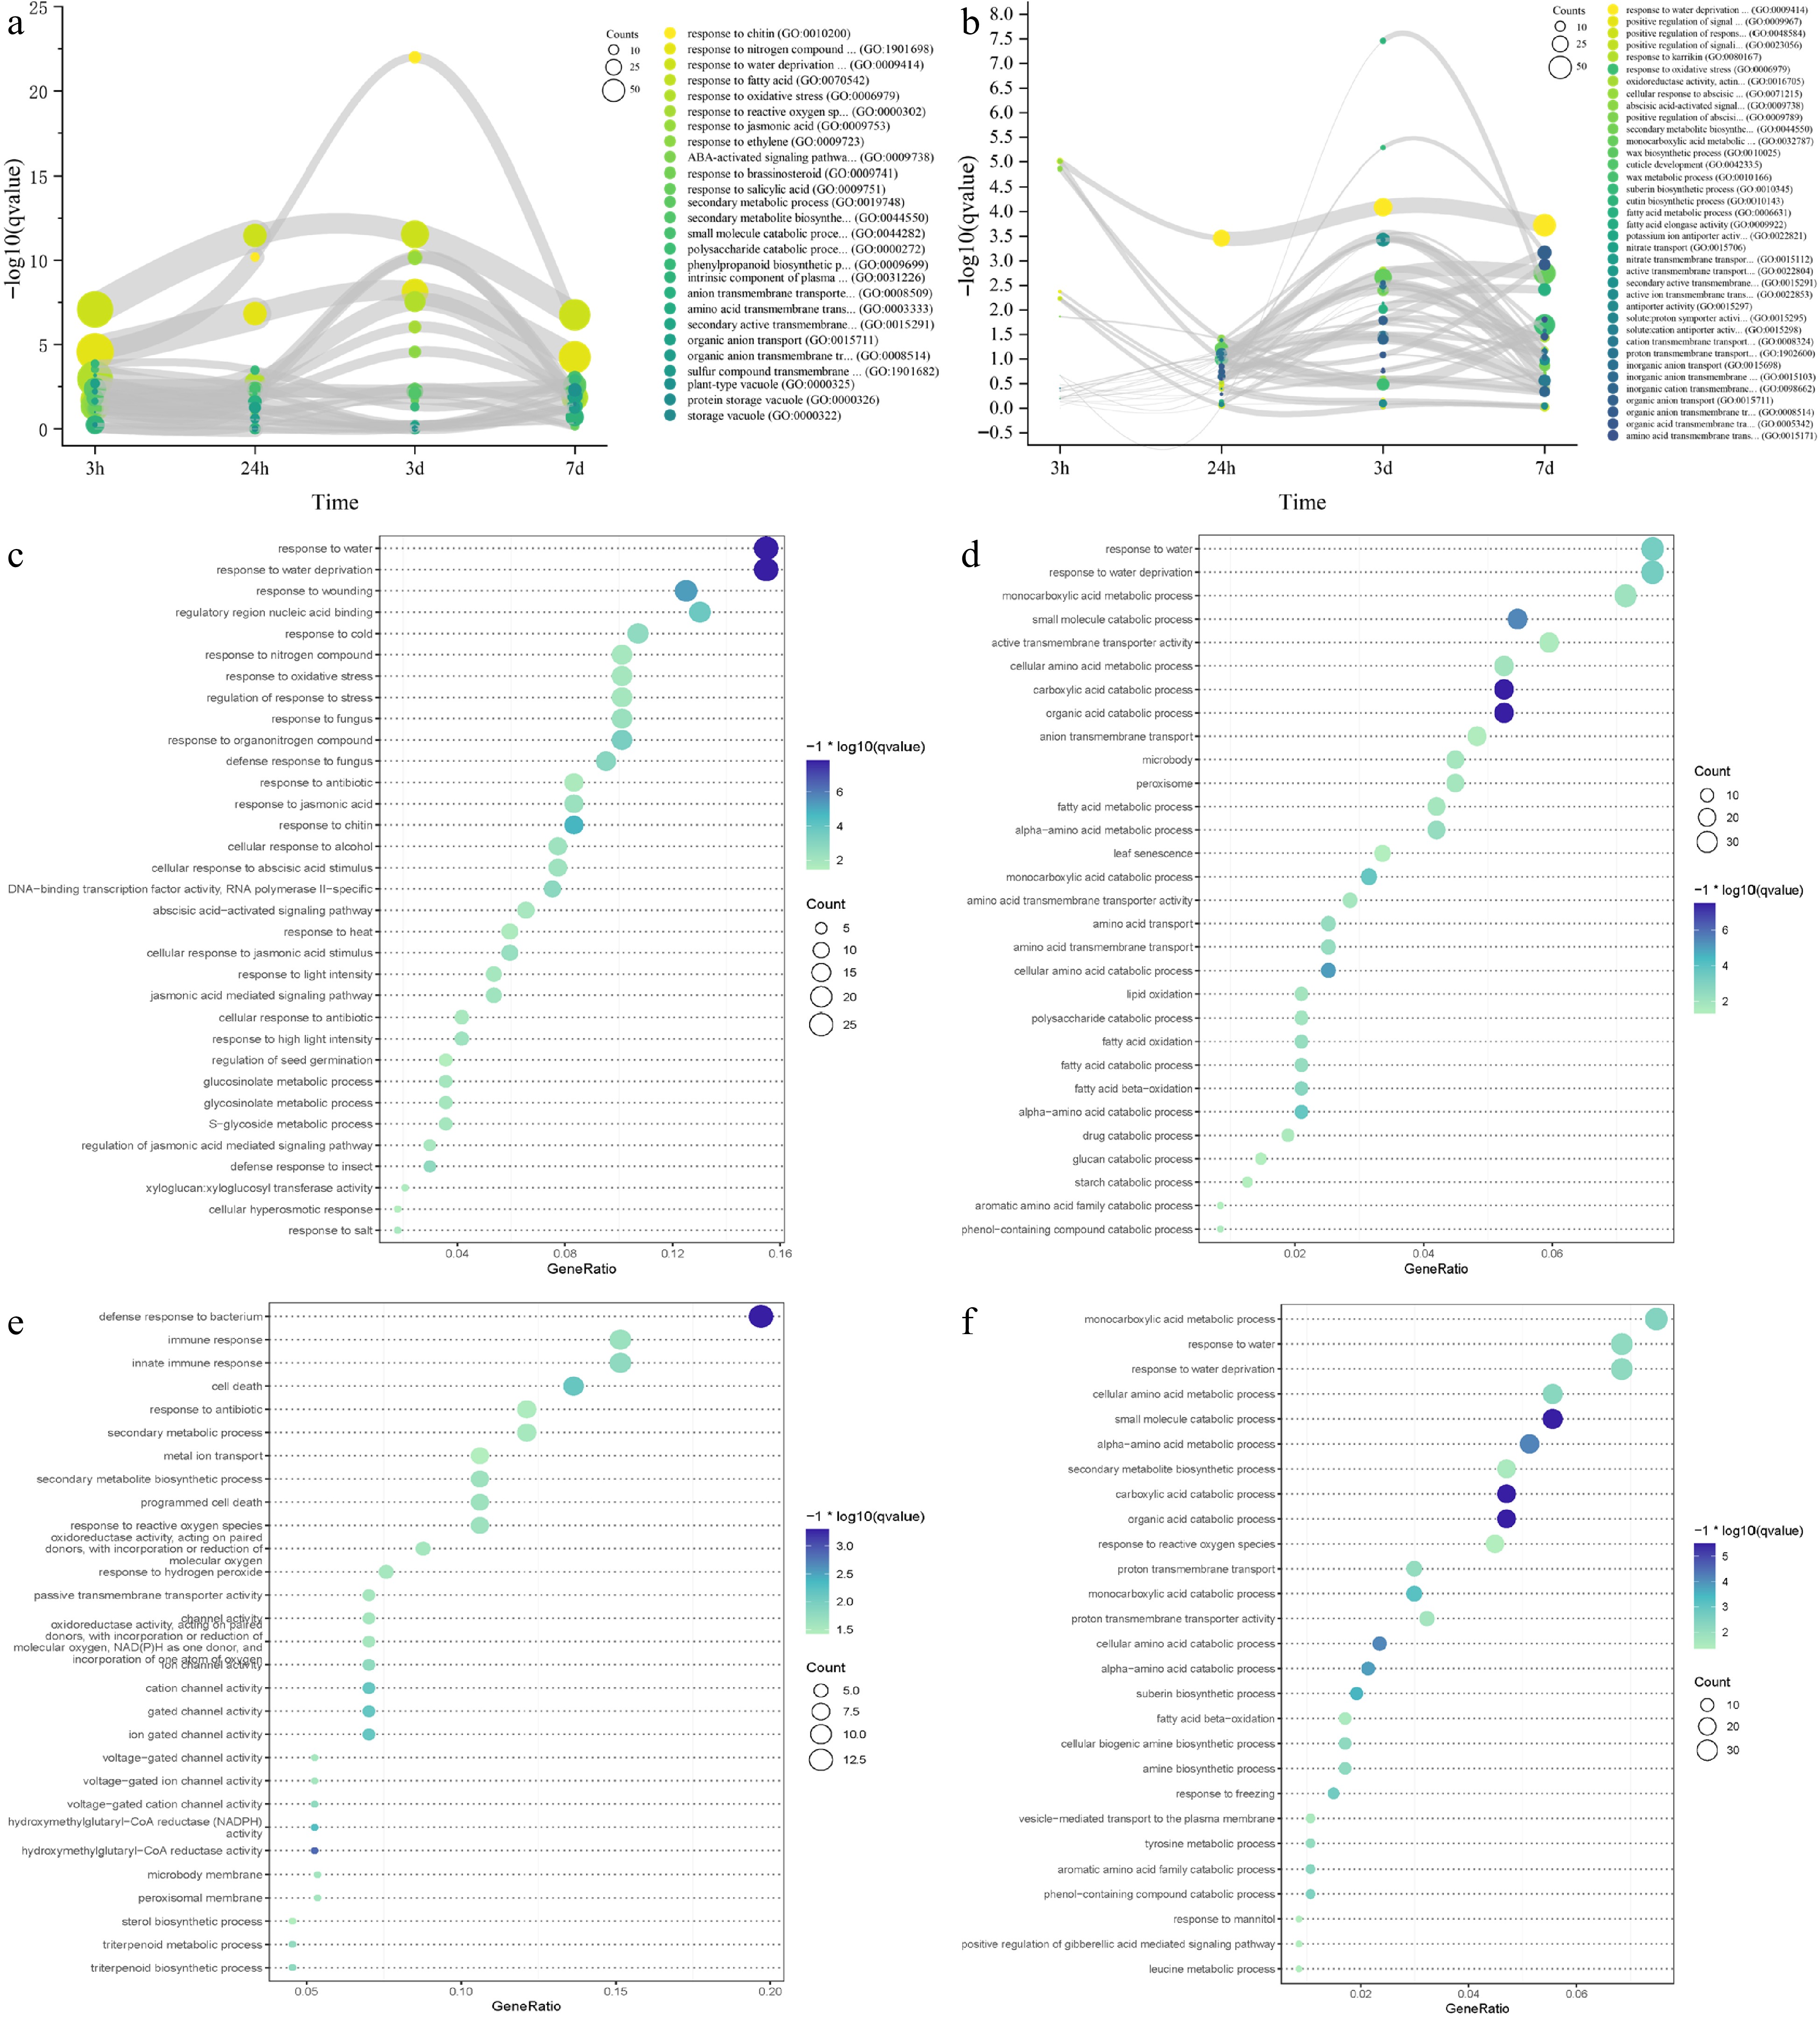
Figure 5.
Time-course RNA-seq analysis of IPC roots and leaves under salt treatment. (a, b) Gene ontology (GO) terms enriched in differentially expressed genes (DEGs) at 3 h, 24 h, 3 d, and 7 d of salt treatment in roots (a) and leaves (b). The circle size represents the number of DEGs, and the Y axis represents the p-value of the enrichment analysis. (c−f) Significantly enriched GO terms for transient-up (c, e) and transition-up (d, f) regulated genes in roots (c, d) and leaves (e, f) under salt treatment. Circle size indicates the number of DEGs used for enrichment analysis, and color indicates the significance of enrichment.
We analyzed the RNA-seq data over time using impulse DE to group differentially expressed genes in IPC into four categories: transient up, transient down, transition up, and transition down-regulated genes. The transient up-regulated genes represent the early response of IPC to salt-stress, while the transition up-regulated genes could be responsible for the permanent adaptation of IPC to salt treatment. We performed GO and KEGG term enrichment analyses on these gene groups to gain a deeper understanding of the response and tolerance of IPC to salt treatment (Supplemental Result S1). In roots, early-responsive genes are primarily involved in response to abiotic stress (Fig. 5c), while genes conferring long-term adaptation are related to small molecules and secondary metabolite synthesis (Fig. 5d). In addition to the responsive pathways, transmembrane transportation plays a critical role in the early response of IPC leaves to salt treatment (Fig. 5e). With the transition-up regulated genes in leaves, the monocarboxylic acid metabolic processes are the most enriched GO terms, while the amino acid metabolic/catabolic-related GOs are also frequently enriched, indicating the significance of monocarboxylic acid and amino acid in the leaf response to salt-stress in IPC (Fig. 5f). We generated DAG figures to reveal the critical GOs involved in the salt tolerance of IPC (Supplemental Result S1). The responsive pathways and amino acid catabolic process are the enriched biological processes for roots and leaves, while the fatty acid metabolic process is involved in the adaptation of IPC roots. The phenol-containing compound catabolic, alpha-amino acid catabolic, and suberin biosynthetic processes participate in the adaptation of IPC leaves.
Investigation of salinity-related genes provides a constitutive salt tolerance mechanism of IPC
-
The genes involved in salt-stress perception, signal transduction, and downstream response in IPC have been identified through genome analysis. Based on previously published research, the process of how these genes are involved in salt tolerance is illustrated in Fig. 6a. Plants percept salt stress through three stimuli: Na+, somatic stress, and mechanical pressures, with three different types of sensors. Compared to Arabidopsis, most of the sensors in IPC are significantly expanded, particularly OSCA1, one of the osmotic sensors. Expression analysis has shown that the Na+ sensors, RbohD and MOCA1, and the osmotic sensor, OSCA1, are significantly upregulated at the early stage of salt treatment, indicating their involvement in salinity tolerance in IPC. Among the transporter channels, CNGCs and ANN1 are responsible for the early Ca2+ influx from the outer side of the membrane, which is critical for initiating the salt-response pathways. The IPC genome contains 26 CNGCs and two ANN1, with relatively high expression levels of ANN1 in both IPC roots and leaves. Na+ efflux and K+ influx are fulfilled by SOS and AKT1, respectively, which are essential for plant tolerance to salt stress. Interestingly, seven SOS1 and four AKT1 genes were identified in the IPC genome, with significant expansion compared to Arabidopsis. The relatively high expression of SOS1 and AKT1 in IPC roots indicates that the expansion of these genes might confer Na+ efflux and salt tolerance in IPC. Other salt-tolerance genes, such as those involved in the SOS and PA pathways, were also expanded to some extent, and most of them were upregulated at an early stage under salt treatment, especially in the roots (Fig. 6).
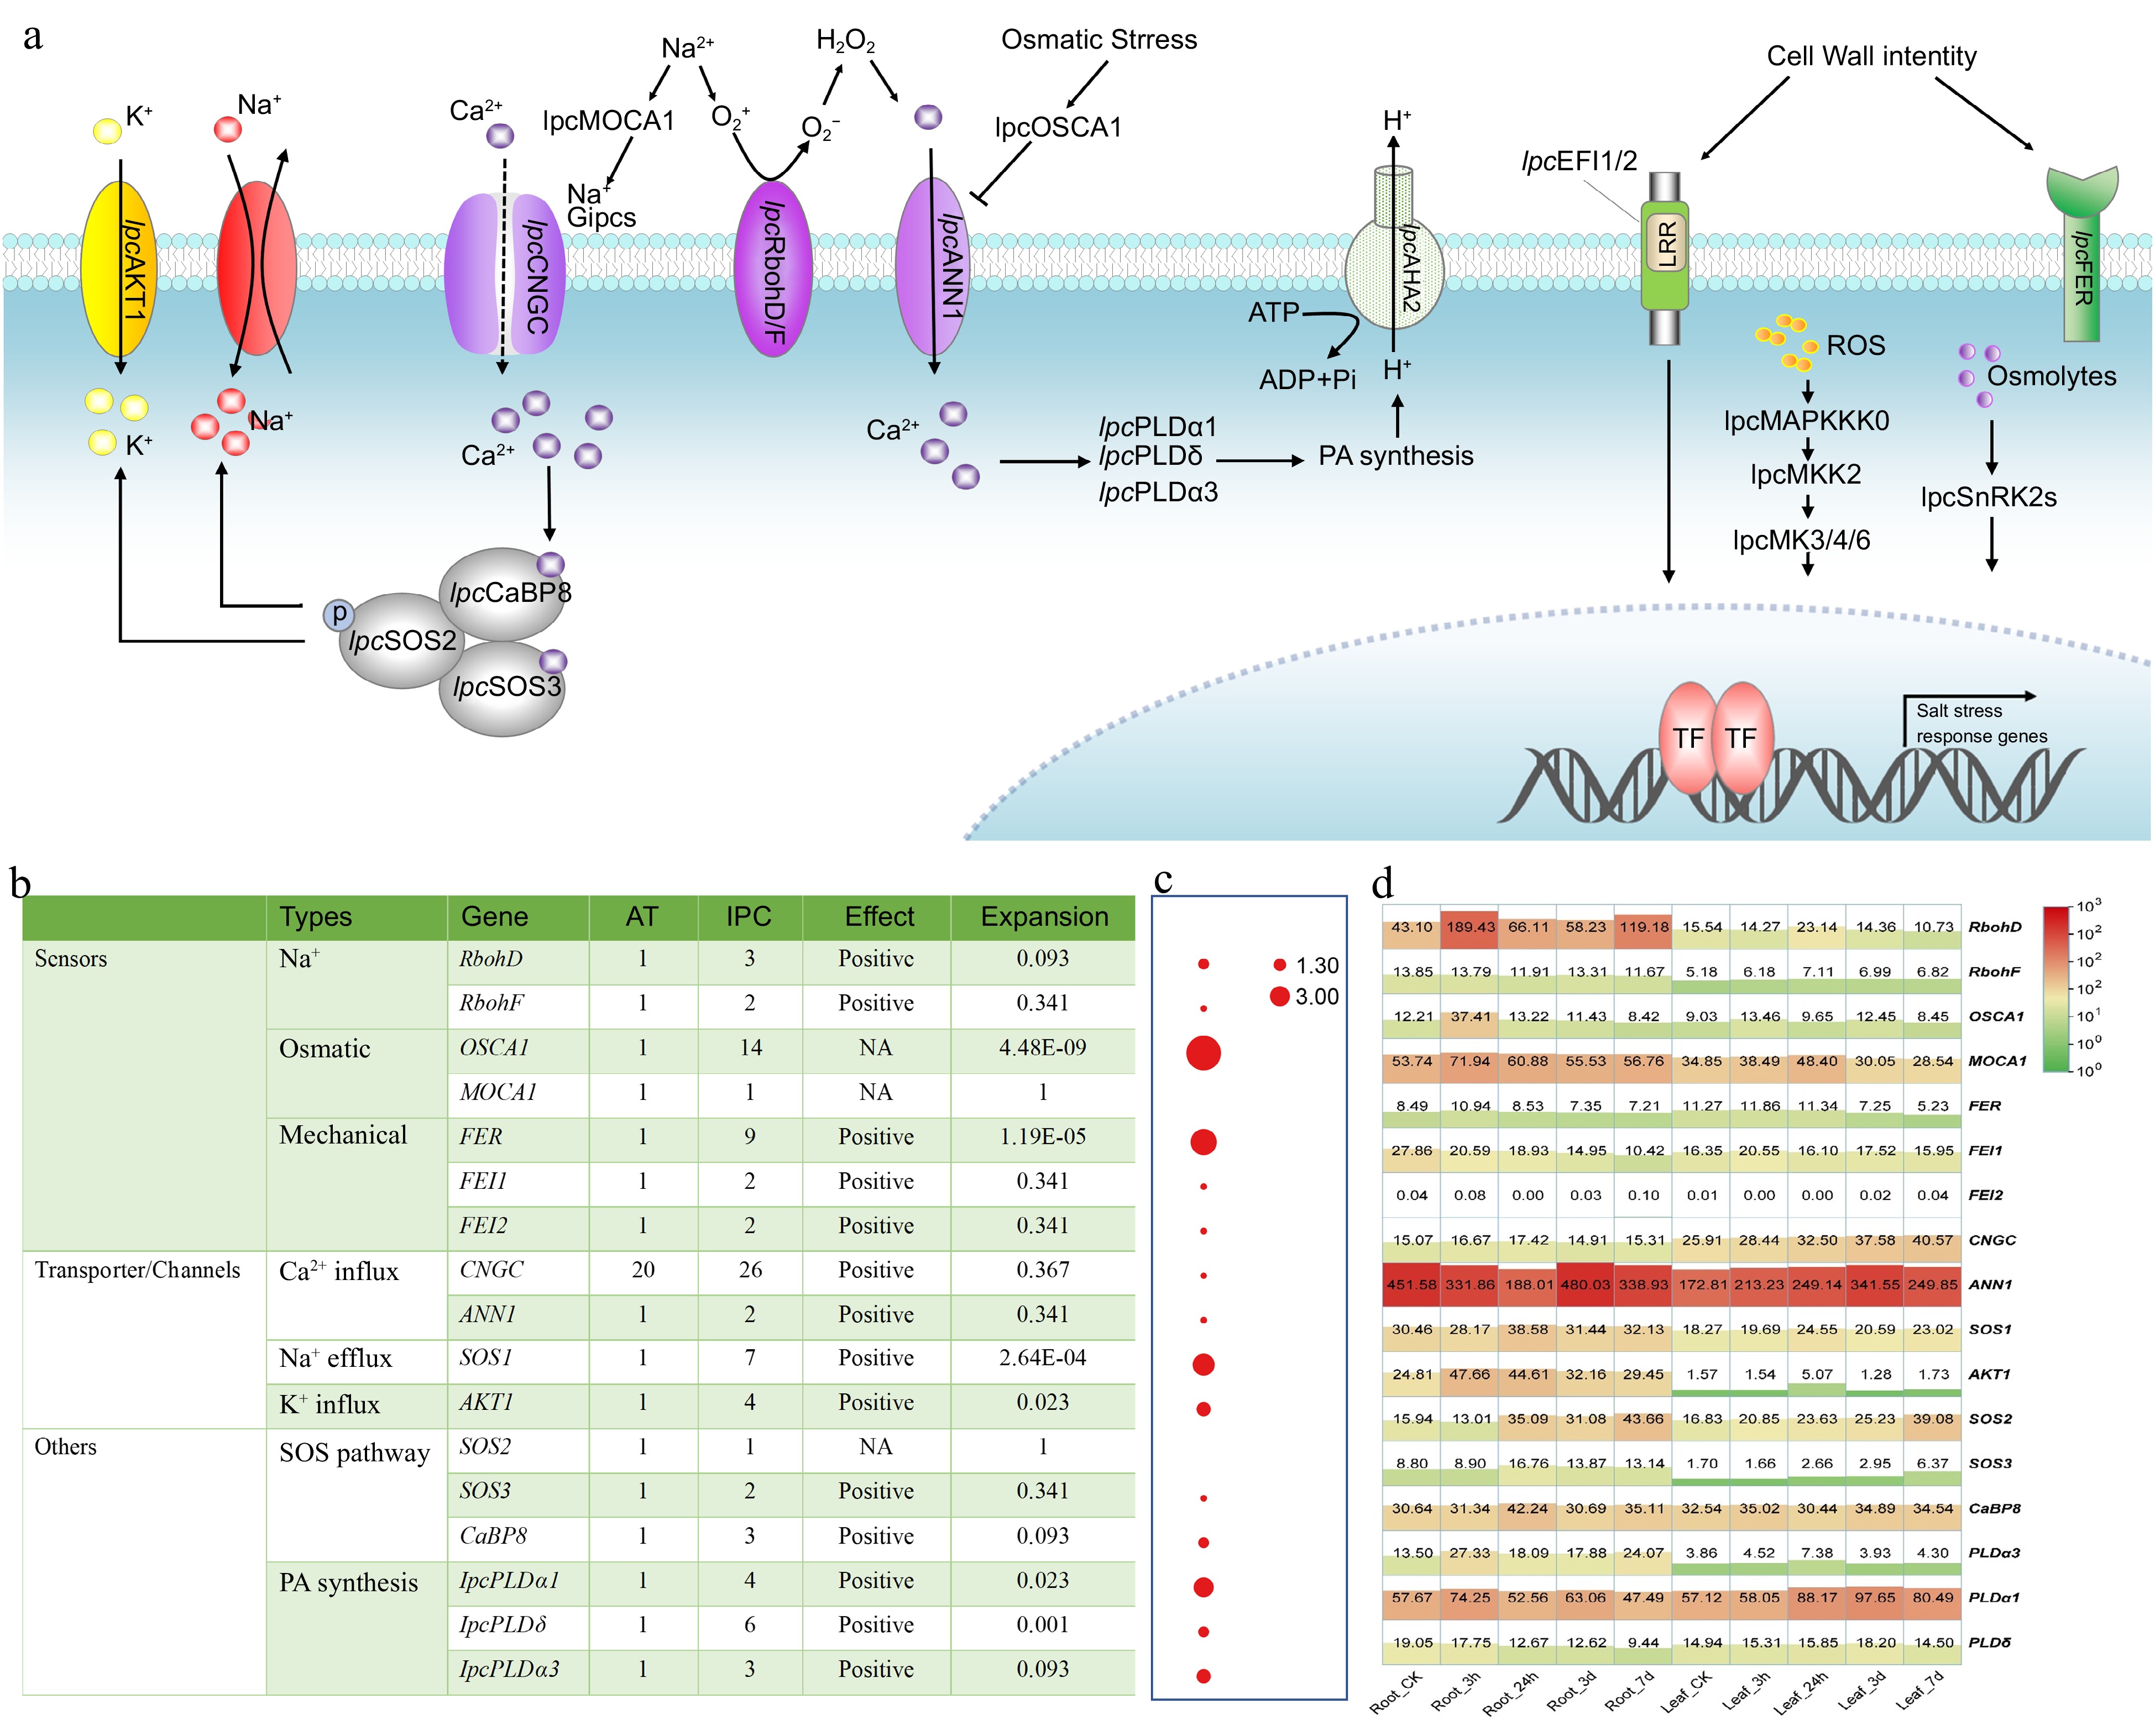
Figure 6.
Identification and expression of genes involved in stress perception, signal transduction, and responses to salinity in IPC. (a) Schematic model of the putative mechanisms of salinity perception, signal transduction, and response in IPC. (b) The number of genes involved in these processes identified in IPC and a comparison of gene numbers with Arabidopsis. (c) Significance of gene expansion in IPC compared to its relatives. (d) Expression levels of the genes involved in stress perception, signal transduction, and response in roots and leaves at different time points under salt treatment. Gene expansion in IPC is denoted by a significant, corrected p-value (p < 0.01), determined through a Chi-square test for overrepresentation, using all annotated genes as the background.
The genes involved in ion uptake, transportation, and sequestration were the subject of extensive investigation (Supplemental Fig. S7 & S8). Specifically, GLRs and AKT1, responsible for Na+ uptake, exhibit significant expansion in IPC, with 40 and five genes, respectively, compared to 20 and one in Arabidopsis. Additionally, members of the high-affinity K transporters (HAKs), which primarily function as K+ acquisition transporters, may also be involved in Na+ transport. Notably, a HAK from maize, ZmHAK4/ZmNC2, has been shown to act as a Na+-selective transporter[38]. Furthermore, HAK5 in Arabidopsis, initially identified as a K+ transporter responsive to low K+ signals[39,40], also mediates low-affinity Na+ uptake, regulated by external K+ concentrations[41]. These findings suggest that HAK5 may also play a role in Na+ uptake under saline conditions. In this study, seven HAK5s were identified with a significant expansion, as indicated by their p-value. The substantial expansion of Na+ uptake transporters implies that IPC tends to absorb Na+ from the soil, which aligns with previous research indicating that IPC's salt tolerance is not due to its ability to reject Na+. Moreover, the NHX and V-ATPase gene families, responsible for vascular Na+ sequestration, also display significant expansion in the IPC genome. This expansion likely contributes to IPC's salt tolerance by facilitating the transport of salt into vacuoles and its storage within plant cells, thus mitigating salt stress in the cytoplasm.
The synthesis of the primary medical component CQA was induced by salt-treatment
-
Several studies have demonstrated the bioactive components of IPC, which are primarily Isochlorogenic acids, including Isochlorogenic acid A (ISA), Isochlorogenic acid B (ISB), and Isochlorogenic acid C (ISC). ISA, also known as 3,5-Di-O-caffeoylquinic acid, is the main component of the aqueous ethanol extract of IPC's aerial part and has significant pain relief and anti-inflammatory effects[42,43]. Through the assembly and annotation of the IPC genome, the genes involved in the biosynthesis of caffeoylquinic acid (CQA) were identified, and their expressions in different organs or under salt-stressed conditions were investigated. Dicaffeoylquinic acid was identified as the primary medicinal component of IPC in previous studies, and two main competing pathways have been found in the process from phenylalanine to CQA, namely the biosynthesis of flavonoids and their isoforms and the biosynthetic pathway of lignin. To explain the accumulation of CQA in IPC, we constructed the CQA biosynthesis pathway according to the KEGG reactions using the Globe artichoke CQA as a reference. Subsequently, genes encoding the enzymes in the CQA pathway were identified, including five PALs, four C4Hs, three 4CLs, one HCT, and two HQTs (Fig. 7, Supplemental Table S17, Supplemental File 11). Since the flavonoids biosynthesis competes with the substrate of p-Coumaroyl-CoA with CQA biosynthesis, we also identified genes encoding enzymes for isoflavone and flavonoid synthesis that compete with the substrate of p-Coumaroyl-CoA with CQA biosynthesis, resulting in two CHSes and one CHI (Fig. 7, Supplemental Table S17). Additionally, quinic acid is a necessary substance for the synthesis of CQA, and its synthesis also determines the synthesis of CQA. To this end, we constructed the biosynthetic pathway of quinic acid and identified the genes involved in this pathway, resulting in four aroF-encoding candidate genes, three aroB candidate genes, five aroD candidate genes, and five QUIB candidate genes (Fig. 8, Supplemental Table S18).
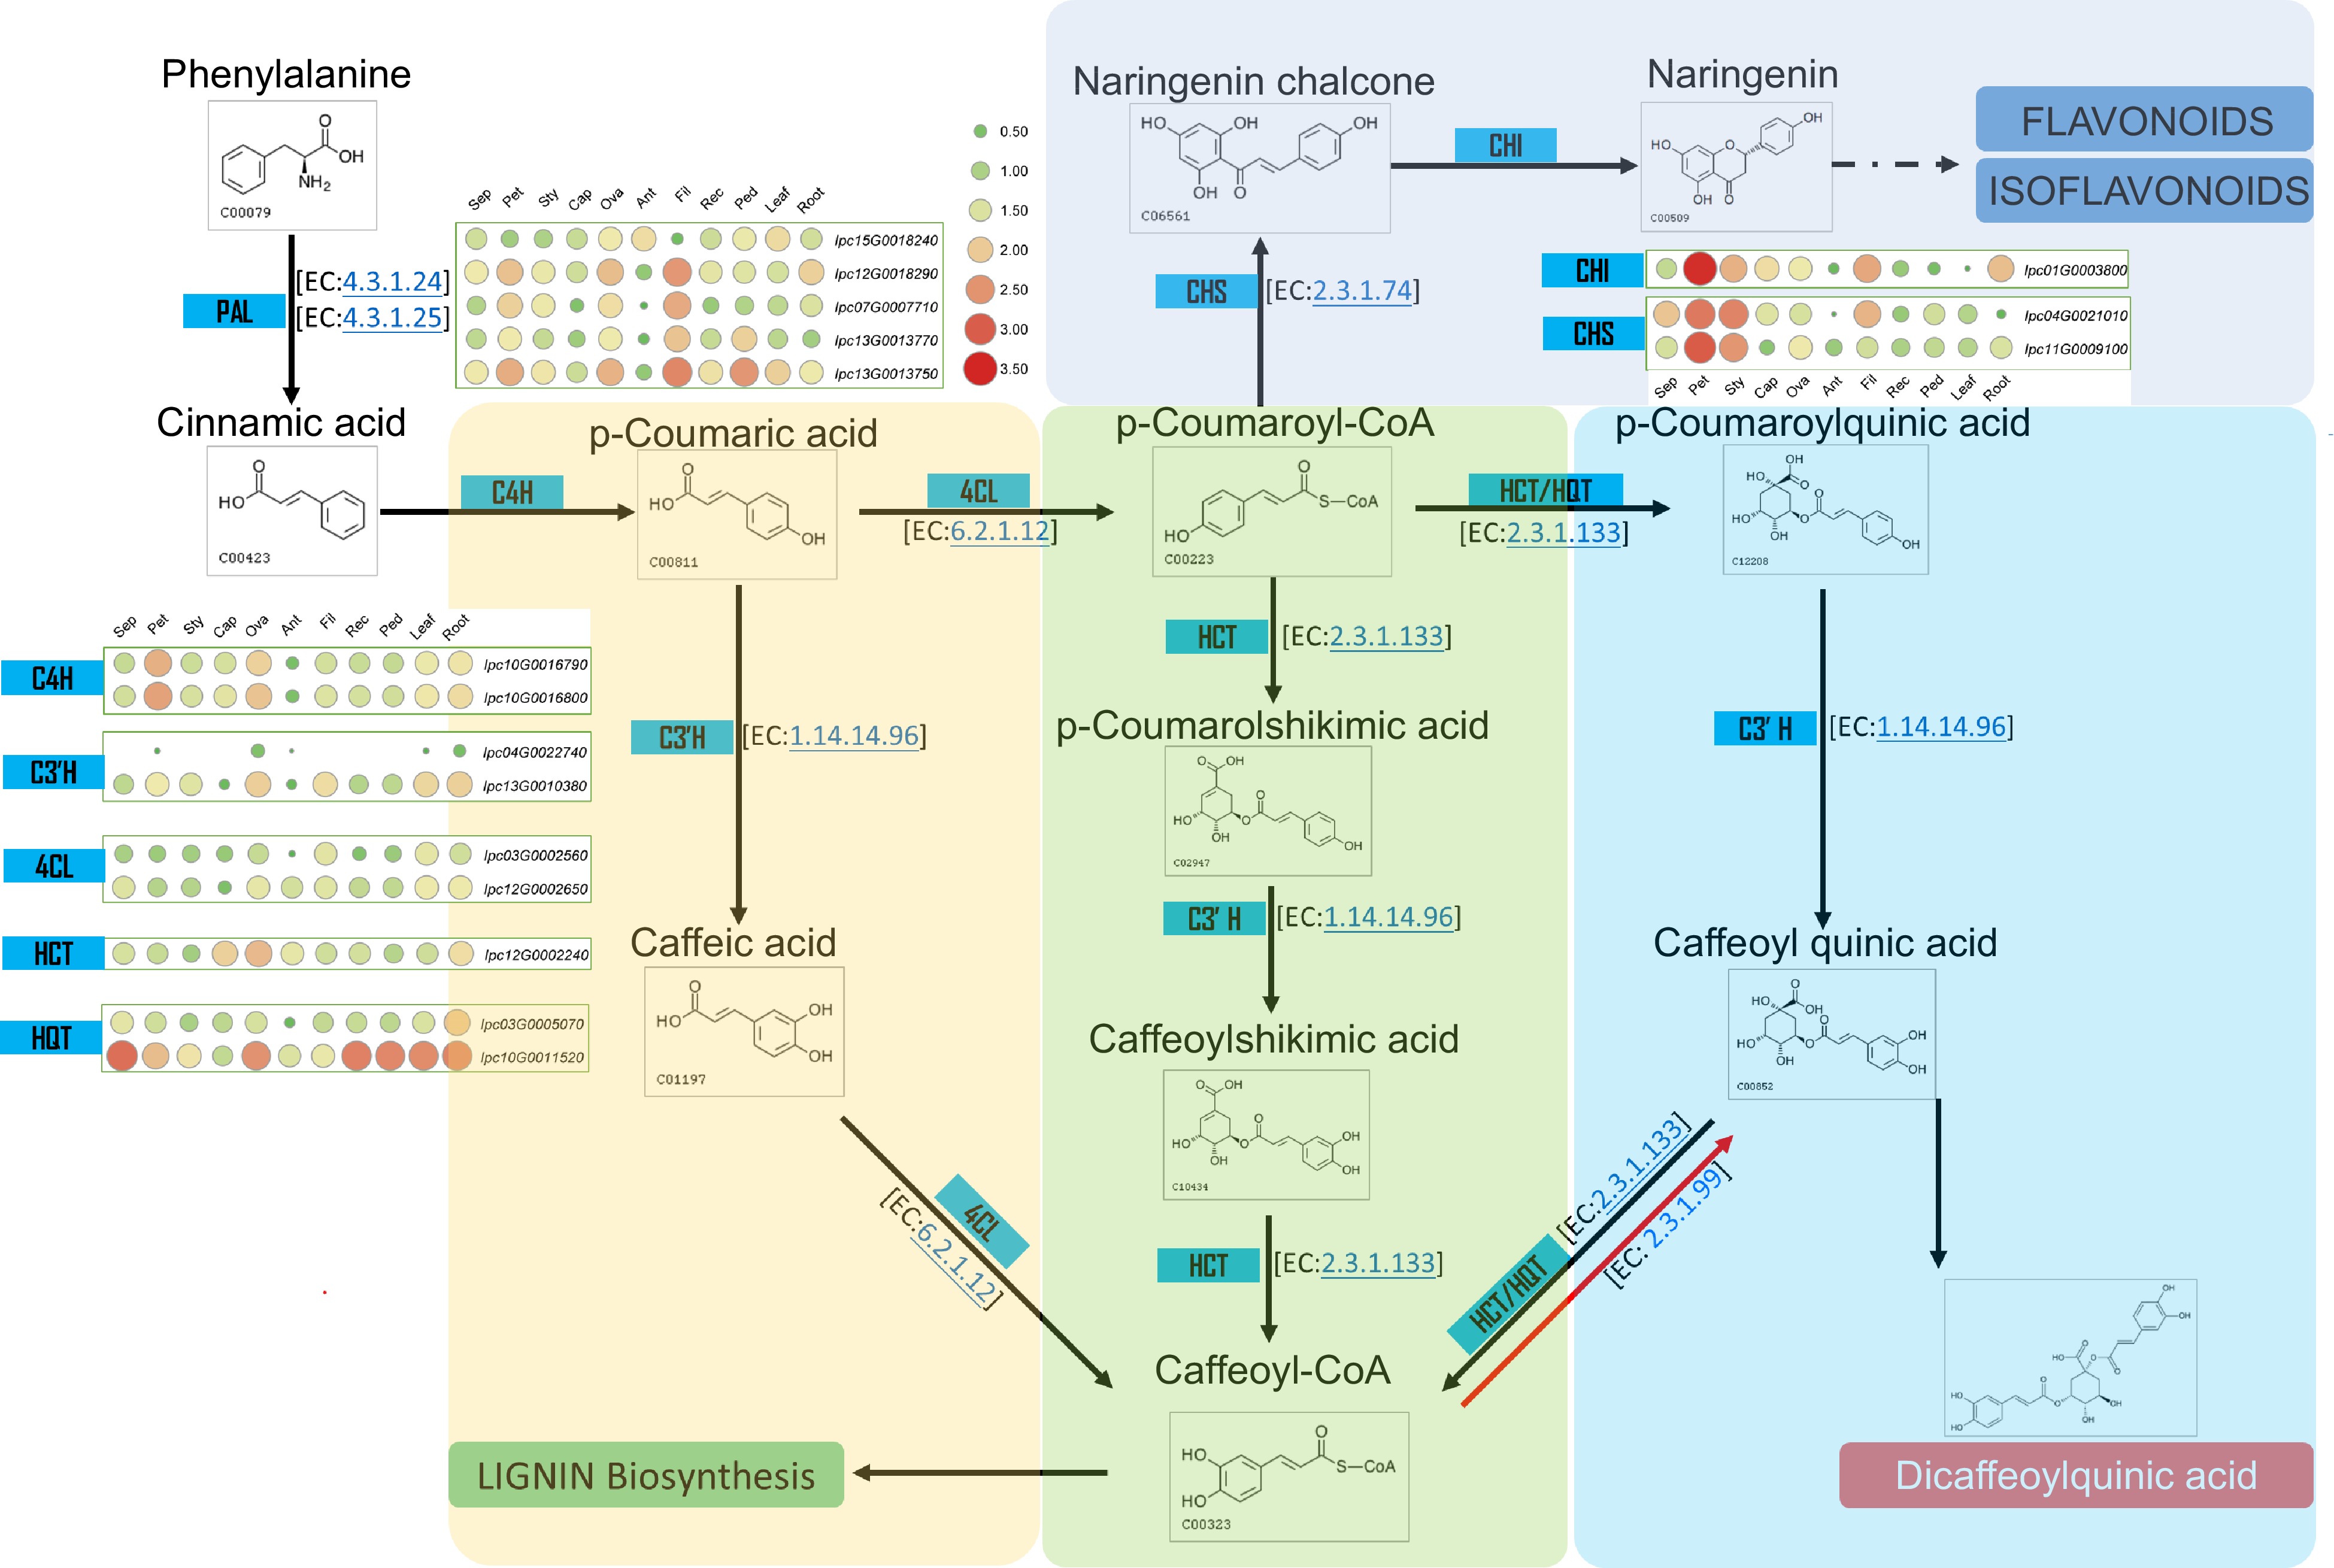
Figure 7.
Metabolic pathway and gene expression in CQA metabolism. This figure illustrates the metabolic pathway for CQA synthesis and displays the expression levels of genes encoding the relevant enzymes in various IPC tissues (Sep: sepal, Pet: petal, Sty: stigma, Cap: carpel, Ova: ovary, Ant: anther, Fil: filament, Rec: receptacle, Ped: pedicel).
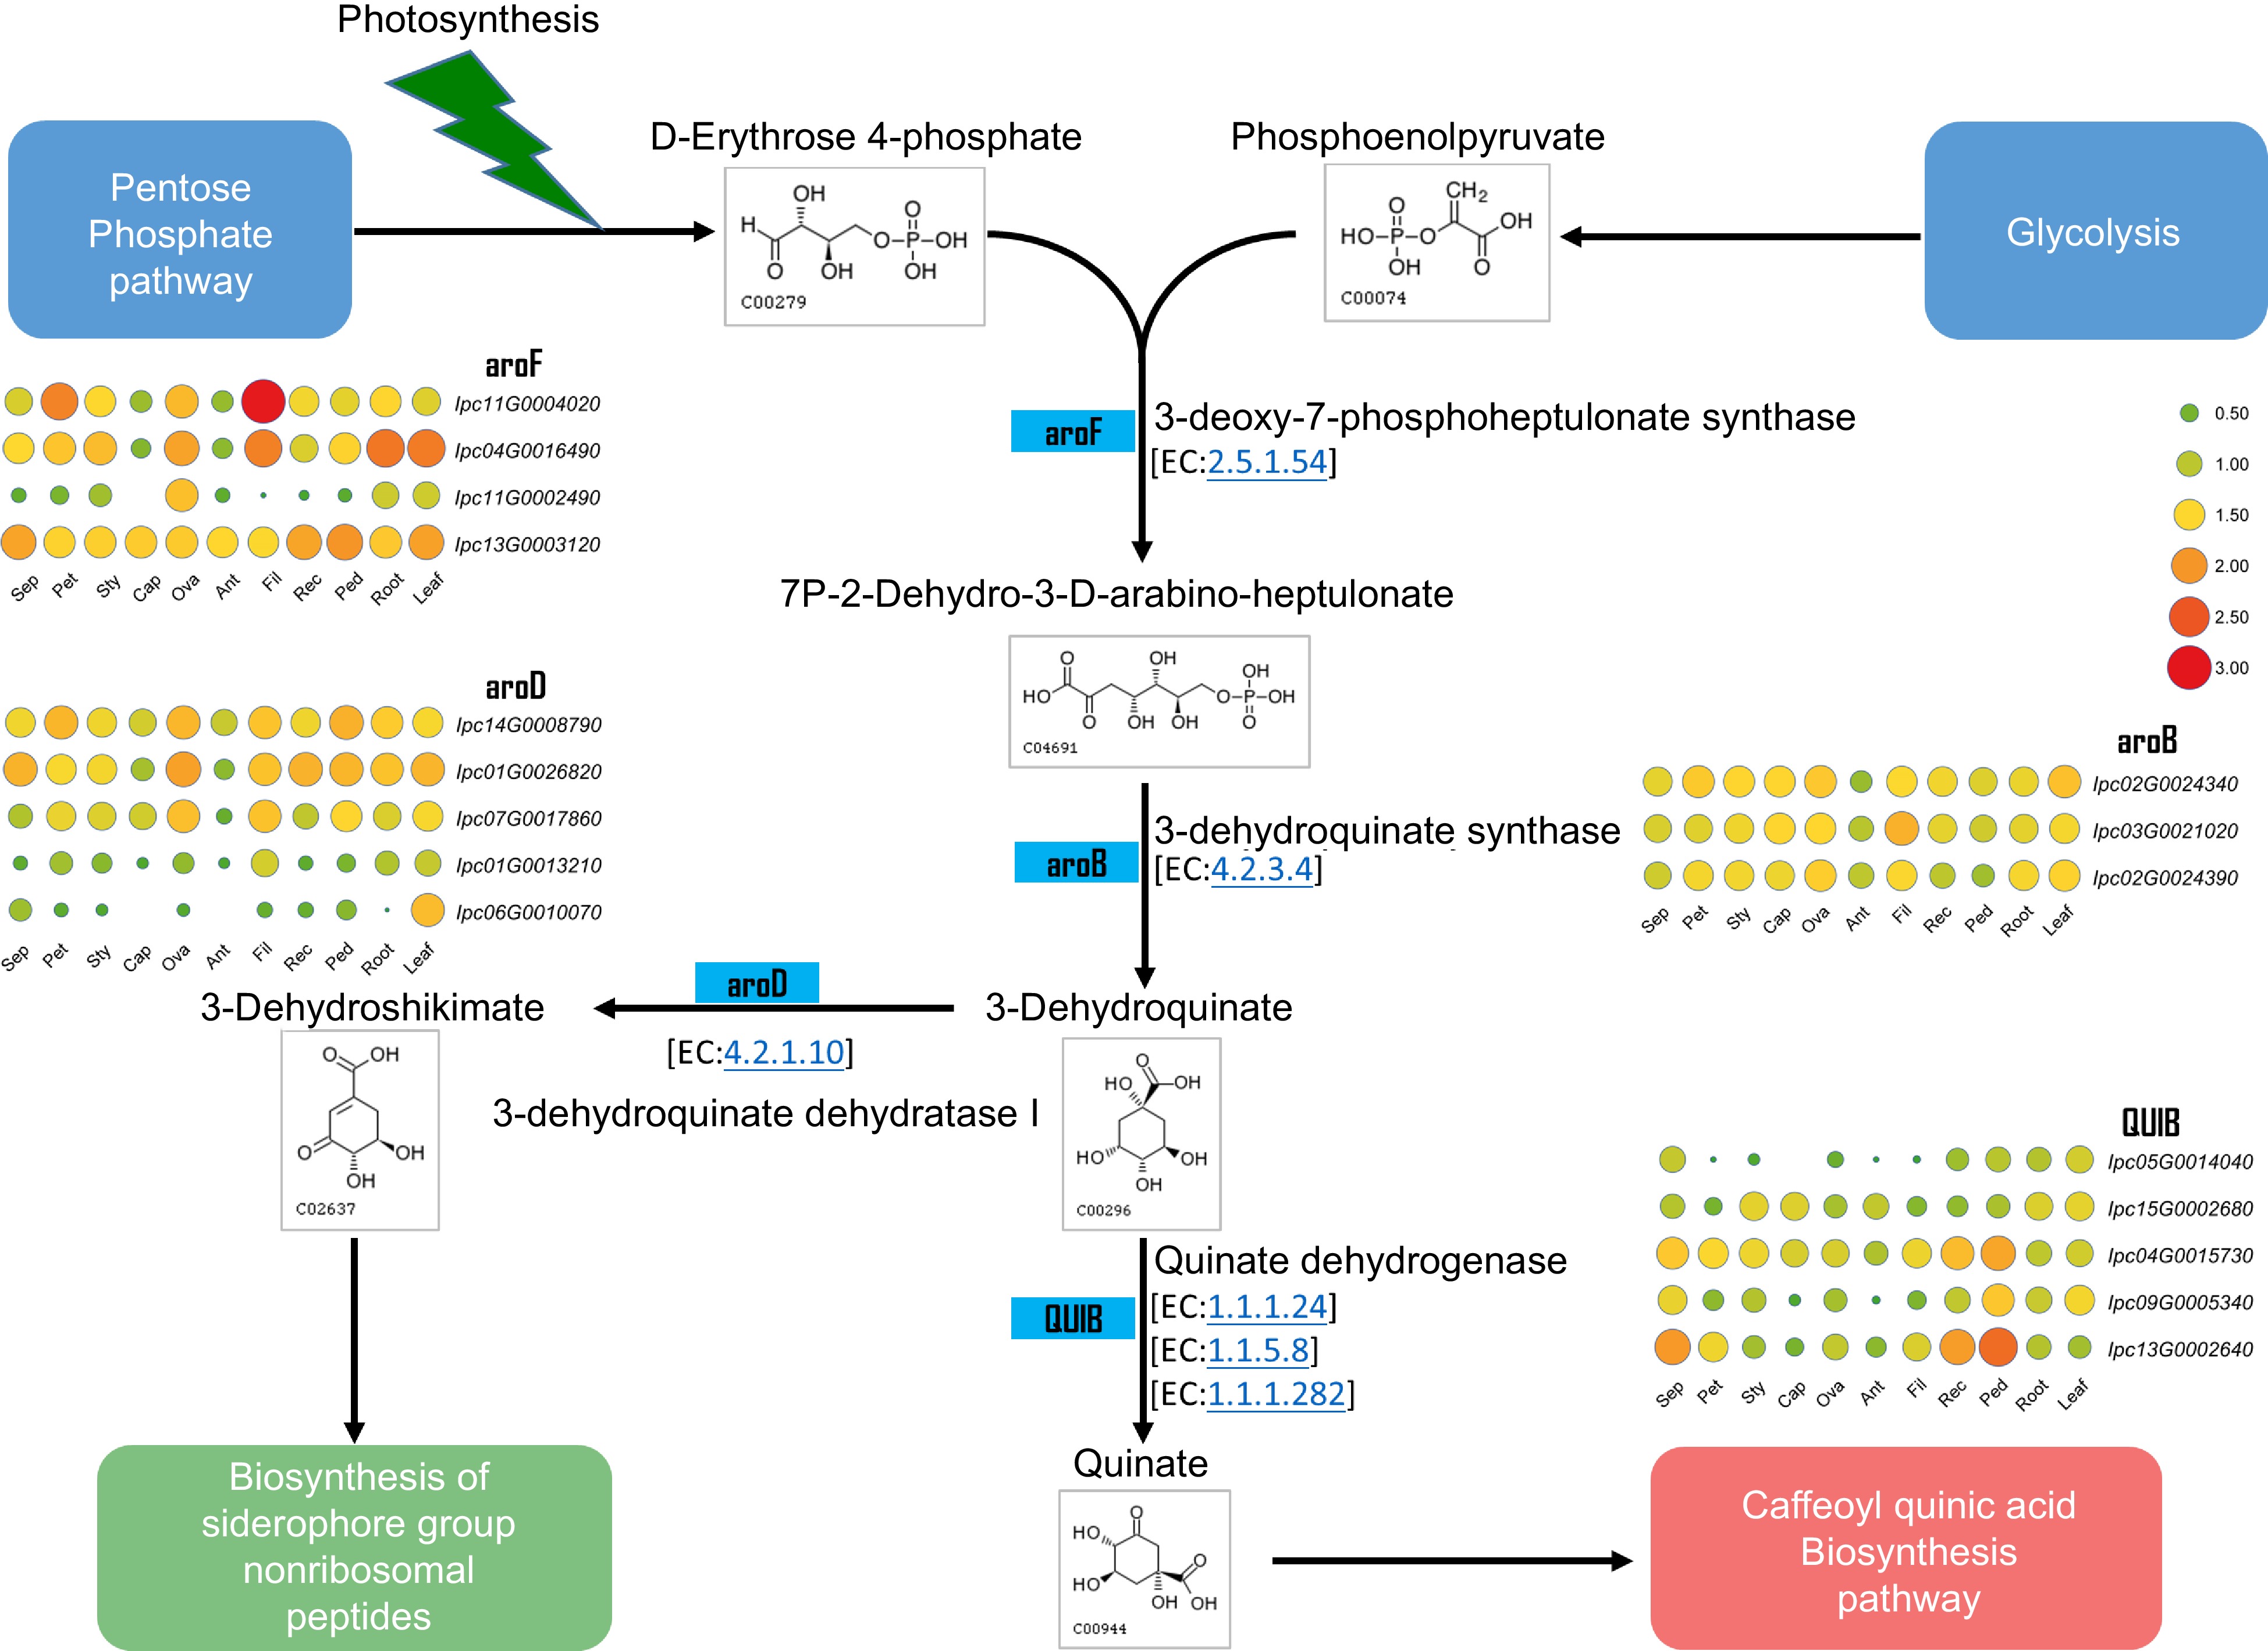
Figure 8.
Metabolic pathway and gene expression in quinate metabolism. This figure illustrates the metabolic pathway for quinate synthesis and displays the expression levels of genes encoding the relevant enzymes in various IPC tissues (Sep: sepal, Pet: petal, Sty: stigma, Cap: carpel, Ova: ovary, Ant: anther, Fil: filament, Rec: receptacle, Ped: pedicel).
To understand the biosynthesis regulation of CQA in IPC plants, the expression levels of identified genes involved in the biosynthesis pathway were investigated. PALs have the highest expression levels in filaments among the tissues examined, indicating active biosynthesis in filaments since cinnamic acid, a precursor for other biosynthesis pathways, is synthesized using phenylalanine as a substrate. Other genes in this pathway, C4Hs, 4CLs, HCT, and HQTs, have relatively higher expression in roots and leaves. HQT and 4CL are critical enzymes for the synthesis of CQA, and the genes encoding these two enzymes, IPC03G0005070 and IPC02G0011120, have higher expression levels in roots. The expression level of IPC10G0011520, HQT encoding gene, is also very high, although it is not specifically expressed in roots. HCT and HQT, encoding the enzymes responsible for the last two steps in this pathway, have the highest expression in roots, indicating that the main medicinal component, CQA, in IPC plants, may primarily accumulate in the roots of IPC (Fig. 7, Supplemental Fig. S9). Analysis of transcriptome data from salt-treated plants showed that in leaves, the genes encoding 4CL, C4H, and PAL are highly expressed within 24 h of salt treatment, while the expression levels of HQT and HCT-encoding genes increased gradually with increasing salt stress time. In roots, the expression levels of most of these genes increased after salt treatment. The expression levels of PAL, HQT, and HCT-encoding genes were up-regulated under salt treatment, while other genes were up-regulated in the early time points (Supplemental Fig. S10), indicating that salt treatment might enhance the secondary metabolic synthesis, as this trend is much more evident in the synthesis of the main medical component, CQA.
The synthesis of quinic acid is also significant for the synthesis of CQA and its derivatives. The expression levels of genes involved in quinic acid production were investigated in different organs (Fig. 8), and the results showed that their expression levels were relatively higher in leaves than in other tissues, indicating a stable and higher level of quinic acid production in leaves, which provides a stable substrate for the synthesis of CQA and its derivatives in leaves. The three genes encoding quinate isomerase (QUIB), IPC04G0015730, IPC09G0005340, and IPC13G0002640, were specifically highly expressed on the pedicel. At least one gene encoding aroF, aroB, and aroD also had relatively higher expression in the pedicel than in other tissues (Supplemental Fig. S11) indicating that the content of quinic acid in the pedicel might be at a relatively high level. Interestingly, IPC11G0004020 had remarkably high expression in filaments, indicating an active secondary metabolism process in the filaments. The expression of these genes in roots and leaves was also analyzed under salt treatment. The results revealed that several key genes, including IPC11G0004020, IPC04G0016490, IPC02G0024340, and IPC14G0008790, were found to be induced by salt treatment specifically in the roots (Supplemental Fig. S12).
-
IPC, a salt-tolerant pioneer plant found near seashores, has developed multiple adaptive mechanisms through long-term evolution[44]. Studies have shown evidence of gene exchange across oceans in IPC. Our research group has conducted biological studies on IPC and discovered specialized seed structures that support transoceanic dispersal[23]. IPC, as a dominant species in coastal regions worldwide, has evolved comprehensive salt tolerance mechanisms. Although complete genomes have been assembled for only five species in the Ipomoea genus: Ipomoea batatas[45], Ipomoea aquatica[46], Ipomoea nil[47], ITF[48], and Ipomoea triloba[49], the genome of IPC remains to be assembled. In this study, we utilized third-generation sequencing technology in combination with Hi-C-assisted assembly to construct the chromosome-level genome of IPC[50]. Subsequently, we conducted gene annotation and functional annotation on the assembled genome (Fig. 1). Furthermore, through genome and transcriptome analysis, we further investigated the formation of salt tolerance traits in IPC and its response mechanisms under salt stress. Therefore, this research not only provides a high-quality reference genome for further studies on IPC, but also lays the foundation for studying its salt tolerance traits.
The salt-tolerance of IPC was deciphered from multiple perspectives.
-
The expansion analysis of gene families often provides valuable insights into the adaptive strategies of plants to specific habitats over time[51]. Notably, the expanded gene families in IPC, when compared to salt-intolerant species, primarily participate in key processes such as immune response, vacuole composition, and plasma membrane composition (Supplemental Fig. S2). However, upon classifying the expanded genes based on their duplication origin, we observed that the most frequently expanded genes belonged to the DSD type (Fig. 3a). These genes exhibited significant enrichment in transposition-related terms and DNA/chromosome stability maintenance (Fig. 3c). Our previous study demonstrated that DNA/chromosome stability is a fundamental strategy for salt tolerance in Suaeda glauca[52]. Thus, it is tempting to conclude that the maintenance of DNA/chromosome stability could be a pivotal mechanism contributing to the salt tolerance of halophytes. This novel finding provides valuable insights into the mechanisms underlying salt tolerance in plants.
From a transcriptomic perspective, we conducted a detailed analysis of the response patterns of roots and leaves of IPC under salt treatment conditions using the genome we assembled (Supplemental Result S1). It is worth noting that under salt treatment conditions, the root of IPC exhibits a more pronounced response to salt stress. Firstly, the number of differentially expressed genes in the roots is significantly higher than in the leaves at the first time point after treatment (Supplemental Result S1). Moreover, from a phytohormone regulatory perspective, at 3 h after treatment, IPC activates signaling pathways including JA, ET, ABA, BR, and SA. In the subsequent periods, the ET and JA signaling pathways continue to be activated. In contrast, in the leaves of IPC, only a small number of genes related to the ABA pathway are detected at 3 and 24 h after treatment. In both the leaves and roots of IPC, genes related to ion transmembrane transportation are enriched in almost all periods (Fig. 5a & b). This indicates that proper handling of excessive salt ions is a crucial mechanism for IPC to tolerate high salt concentrations. Additionally, we observed the enrichment of genes related to the plant-type vacuole (storage) in both roots and leaves at different time points, suggesting that the sequestration of salt ions in vacuoles might be a major strategy for IPC to tolerate high salt concentrations.
We further delved into the genes associated with salt-stress perception, signal transduction, and downstream responses, as well as those involved in ion uptake, transportation, and sequestration[12], This analysis provided valuable insights into IPC's salt tolerance. Our results revealed that a majority of gene families with positive effects on salt tolerance were significantly expanded in IPC when compared to the model plant Arabidopsis. However, it's noteworthy that most of these genes did not exhibit significant inducible expression in response to salt stress. This suggests that IPC relies on a constitutive tolerance mechanism, characterized by gene expansion rather than inducible expression, in the context of both salt-stress perception, signal transduction, downstream responses, and ion uptake, transportation, and sequestration (Fig. 6, Supplemental Fig. S7 & S8).
In summary, it is worth emphasizing that, in addition to the inducible adaptation observed in both glycophytes and halophytes, where salt-tolerance related genes are up-regulated in response to salt stress, the constitutive salt tolerance mechanism plays a crucial role in conferring the halophytic characteristics of IPC. This constitutive mechanism relies on the expansion of key transporters and regulators responsible for ion uptake, transportation, and sequestration into vacuoles. Furthermore, the expansion of genes that facilitate cell tolerance to high internal salt concentrations is a critical component of this mechanism. Among these genes, the maintenance of DNA and chromosome stability emerges as a novel salt-tolerance mechanism in IPC. It is worth noting that this novel salt-tolerance mechanism was also observed in the study of another halophytic plant, Suaeda glauca[52].
The formation of salt tolerance of IPC during evolution
-
Plants, unlike animals, are unable to escape unfavorable environments through movement[53]. Consequently, plants have undergone extensive evolutionary processes to adapt to their specific habitats[54]. For instance, littoral plant IPC exhibits robust growth in coastal environments characterized by high salt concentrations[53]. Recent studies have indicated that gene family expansion, rather than rare and slow gene mutations, plays a significant role in plant adaptation to specific environments[55]. Comparative genomic analysis, particularly among closely related species, often elucidates the adaptive mechanisms employed by plants in distinct habitats[56]. Our previous analysis of gene family expansion in IPC has indeed uncovered the involvement of expanded gene families in known salt-tolerance pathways, alongside the identification of DNA/chromosome stability maintenance as a constitutive salt-tolerance mechanism observed in salt-tolerant plants. However, our research also explores the evolutionary mechanisms underlying salt tolerance in IPC. Through an extensive investigation of the newly assembled gene of IPC and also the comprehensively comparative analysis with its close relatives, the following observations were obtained: (1) The genes in significantly expanded families in IPC were mainly derived from dispersed duplicates (DSD); (2) DSD-derived expanded genes in IPC are associated with 'DNA/chromatin stability maintenance'; (3) Salt-tolerant plant species, including IPC, exhibit extensive genome duplication, with IPC's genome duplication predominantly resulting from transposition events; (4) DSD duplicate genes in IPC demonstrate a significant correlation with transposition events. Based on these conclusions, we have formulated a model elucidating the formation of salt tolerance in IPC (Fig. 9). The divergent of IPC from ITB and ITF was completed approximately 1.74 million years ago, during the rapid development of salt tolerance characteristics of IPC, salt stress acted as both a selective factor and an accelerator of evolution. On the one hand, salt stress served as an inducer, triggering increased transpositional activity. Consequently, genome duplication and gene duplication mostly of the DSD type occurred. Although gene duplication is non-directional, it provided evolutionary raw materials and gene resources for the salt-tolerance evolution of IPC. Among these duplicated genes, those advantageous for adapting to saline environments were retained under continuous salt stress selection. This corresponds to the expanded genes observed in IPC that contribute to salt tolerance. Hence, salt stress played a dual role as an inducer and a selection pressure in the evolution of salt tolerance in seashore plant IPC. The expanded genes we observe now are crucial for providing salt tolerance in IPC, and the duplicated genes in IPC (especially the DSD duplicate genes) are primarily associated with 'DNA/chromatin stability maintenance'. This study has uncovered novel mechanisms of salt tolerance in IPC and proposed a hypothetical model outlining the rapid formation of IPC's salt-tolerance characteristics. These findings provide valuable insights into salt tolerance in halophytic plants and present new perspectives for enhancing salt tolerance in crops through genetic improvement.
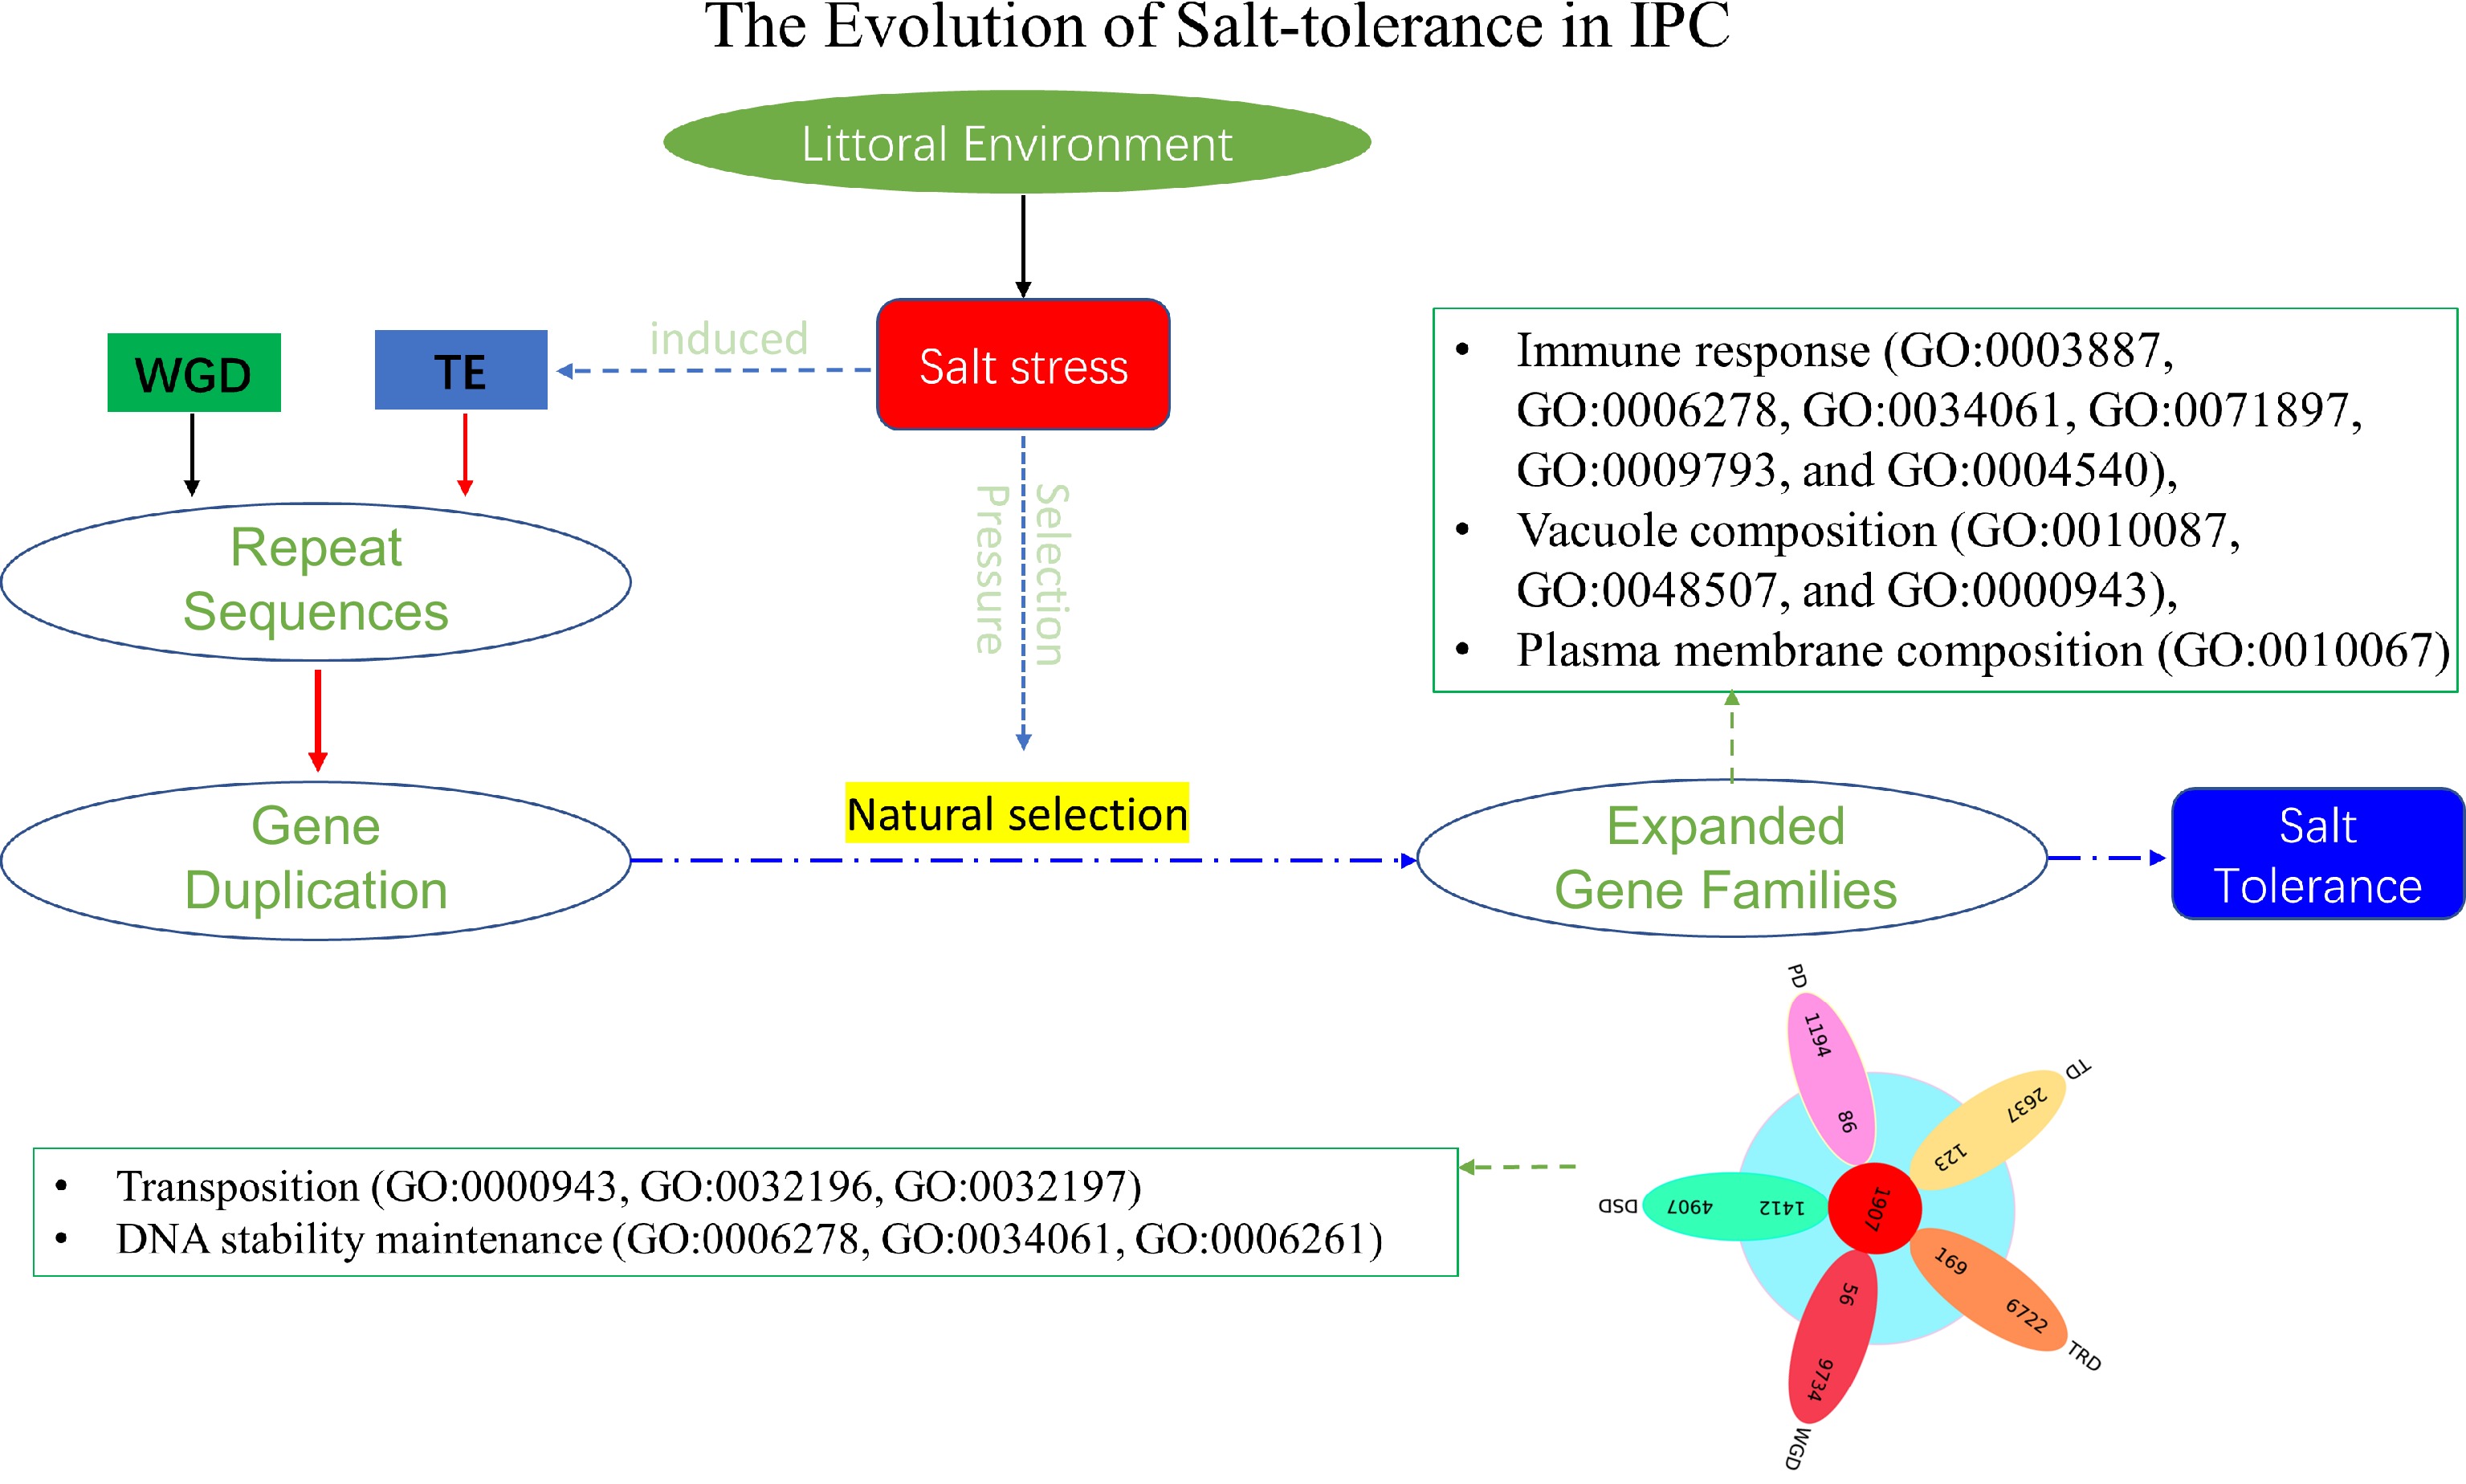
Figure 9.
The evolution of salt tolerance in IPC. The diagram illustrates the proposed mechanism of salt tolerance development as revealed by this study. Over a lengthy process of evolution, salt stress induces transposition events, resulting in repetitive gene duplications at the genomic level. These duplicated genes act as the raw materials for evolution. Furthermore, salt stress functions as a selective pressure, preserving genes that confer advantages in terms of salt tolerance through extended periods of natural selection. Most of these expanded genes contribute significantly to the salt tolerance of IPC. The listed GOs represent the enriched Gene Ontology categories associated with the significantly expanded genes, as well as the DSD-type significantly expanded genes in IPC compared to its salt-intolerant relatives.
-
The authors confirm contribution to the paper as follows: study conception and design: Cheng Y, Qin Y; genome assembly and annotation: Liao Z, Wang Y, and Sun J; bioinformatic analyses: Ye K, Hu B, Dong C, Li Z; experiments conduction: Deng F, Wang L, Cao S, Cai L; valuable insights providing & critical discussions participating: Wang H, Alsam M, Wang S, Cai L, Zheng P, Pan C; draft manuscript preparation: Cheng Y, Wang Y; manuscript revision: Alsam M, Wang S, Wang H, Qin Y. All authors contributed to the discussion of results, manuscript preparation, and approved the final version.
-
All data generated or analyzed during this study are included in this published article and its supplementary information files.
This work was supported by the National Natural Science Foundation of China (32170380), the Natural Science Foundation of Fujian Province (2023J01442), the Science and Technology Innovation Project of Pingtan Institute of Science and Technology (PT2021001), and the China Postdoctoral Science Foundation (2018M642550).
-
The authors declare that they have no conflict of interest. Yuan Qin is the Editorial Board member of Seed Biology who was blinded from reviewing or making decisions on the manuscript. The article was subject to the journal's standard procedures, with peer review handled independently of this Editorial Board member and the research groups.
- Supplemental Table S1 The flow cytometry analysis of the IPC leaf sample.
- Supplemental Table S2 Statistics of HiFi reads.
- Supplemental Table S3 Statistic of Ipomoea pes-caprae contig-level genome.
- Supplemental Table S4 Statistic of IPC haploid genome.
- Supplemental Table S5 The statistics of Hi-C data.
- Supplemental Table S6 The statistic of the anchored contigs within the chromosome of IPC.
- Supplemental Table S7 The statistic of RNA-seq data.
- Supplemental Table S8 Result of BUSCO.
- Supplemental Table S9 Annotation of genes in IPC genome.
- Supplemental Table S10 Statistic of different copy genes in 10 species.
- Supplemental Table S11 Statistic of gene family expansion and contraction in 10 species
- Supplemental Table S12 The number of duplicated genes in IPC, ITR, and ITF.
- Supplemental Table S13 TE classes and percentage in I. pes-caprae.
- Supplemental Table S14 Summary of TE-regulated genes and duplicated genes.
- Supplemental Table S15 Statistic of TE-associated genes.
- Supplemental Table S16 Statistic between duplicated gene and related gene.
- Supplemental Table S17 Genes encoding the enzymes in CAQ pathway.
- Supplemental Table S18 Genes encoding the enzymes in Quinic acid pathway.
- Supplemental Fig. S1 Hi-c integrating map of Ipomoea pes-caprae genome.
- Supplemental Fig. S2 Evolutionary and synteny analysis of the IPC genome.
- Supplemental Fig. S3 Analysis of ortholog group expansion and concentration in IPC and its relatives.
- Supplemental Fig. S4 Enriched GOs with significantly concentrated genes.
- Supplemental Fig. S5 Percentage of nearest TE to transcription start/stop site.
- Supplemental Fig. S6 The enriched GO with the TE-associated expanded genes.
- Supplemental Fig. S7 Identification of genes involved in ions uptake, transportation, and sequestration in IPC. The sketch shows the putative model of ions uptake, transport, and sequestration in IPC.
- Supplemental Fig. S8 Expansion and expression analysis of genes involved in ions uptake, transportation, and sequestration in IPC.
- Supplemental Fig. S9 The expressions of CAQ synthesis genes in different tissue.
- Supplemental Fig. S10 The expressions of CAQ synthesis genes in roots and leaves under salt treatment.
- Supplemental Fig. S11 The expressions of quinic acid synthesis genes in different tissue.
- Supplemental Fig. S12 The expressions of quinic acid synthesis genes in roots and leaves under salt treatment.
- Supplemental File1 IPC gene annotations (GO, KEGG, pFam).
- Supplemental File2 IPC gene annotations (GO, KEGG, pFam) and expressions (Fpkm).
- Supplemental File3 IPC gene annotation with AT gene descriptions.
- Supplemental File4 Orthogroups.
- Supplemental File5 The enriched GOs with expanded, contracted and positive selected family genes.
- Supplemental File6 The repetitive sequences in S. glauca and other 4 species.
- Supplemental File7 Duplicated gene and TE gene.
- Supplemental File8 The enriched GOs with DEGs in root under time-course salt-treatment.
- Supplemental File9 The enriched GOs with DEGs in leaf under time-course salt-treatment.
- Supplemental File10 Summary of GO enrichment result in root and leaves of S. glauca under salt-treatment.
- Supplemental File11 The identification and expression of the CQA synthesis genes.
- Supplemental Result 1 Time-course salt-treatment analysis provides insight into the salt tolerance of IPC at the transcriptional level.
- Copyright: © 2023 by the author(s). Published by Maximum Academic Press on behalf of Hainan Yazhou Bay Seed Laboratory. This article is an open access article distributed under Creative Commons Attribution License (CC BY 4.0), visit https://creativecommons.org/licenses/by/4.0/.
-
About this article
Cite this article
Cheng Y, Wang Y, Sun J, Liao Z, Ye K, et al. 2023. Unveiling the genomic blueprint of salt stress: insights from Ipomoea pes-caprae L.. Seed Biology 2:21 doi: 10.48130/SeedBio-2023-0021 

Unveiling the genomic blueprint of salt stress: insights from Ipomoea pes-caprae L.
- Received: 14 September 2023
- Accepted: 03 November 2023
- Published online: 04 December 2023
Abstract: Adverse environmental conditions often present challenges for organisms; however, they can also serve as selective pressures that propel adaptive evolution. In this study, we present the first chromosome-scale genome of Ipomoea pes-caprae L. (IPC), an exceptionally salt-tolerant plant species of considerable significance due to its medicinal, ecological, and biological attributes. The haplotype IPC genome comprises 15 chromosomes spanning 1.05 GB and includes 34,077 protein-coding genes, exhibiting an impressive completeness of 97.4%. Comparative genomic analysis with non-salt-tolerant Ipomoea species has highlighted the prevalence of highly duplicated sequences and genes within the IPC genome. Analysis of gene ortholog expansion, when compared in those Ipomoea species, reveals that expanded TRD (transposed duplication) and DSD (dispersed duplication) genes are predominantly associated with functions related to salt tolerance. Furthermore, our findings suggest strong correlations between DSD and TRD geness and transposable element (TE) events, implying that TE-induced expansion of repeat genes is a driving force behind gene diversification. Moreover, a time-course RNA-seq analysis unveils the salt response of IPC roots and leaves, showing the involvement of several key salt-tolerance genes exhibiting copy number expansion. These include genes responsible for ion uptake, transportation, and sequestration into vacuoles, as well as genes responsible for the maintenance of DNA and chromosome stability. Given the significant induction of TE events by salt stress in plant genomes, we propose a putative mechanism for the rapid evolution of salt tolerance in IPC. Additionally, this study delves into the metabolic pathway and regulatory mechanisms of Caffeoylquinic acids (CQAs), a medicinal component found in IPC.
-
Key words:
- Ipomoea pes-caprae L. /
- Genome /
- Salt-tolerance /
- TE /
- DNA/chromosome stability