


-
Pepper (Capsicum annuum L.) is a member of the Capsicum genus within the Solanaceae family, is either an annual or perennial herbaceous plant. It holds the distinction of being the vegetable with the most extensive cultivation and the highest output value in China[1]. Capsicum fruits are rich in nutrients and unique in flavor, and can be eaten fresh, boast a rich nutritional profile and a distinctive flavor, making them ideal for fresh consumption. They are also versatile in culinary applications, serving as the primary ingredient in an array of processed products including dried chilies, chili sauces, and chili oils. Beyond culinary uses, the compounds capsaicin and capsicum have significant applications in the medical, food, and industrial sectors, offering considerable economic and social benefits[2].
The flavor composition of chili fruits is relatively complex, resulting from the intricate interplay of taste (sugars, organic acids, etc), smell (VOCs), and pain (spicy taste caused by capsaicin substances) experienced during human consumption. The aroma of chili peppers determined by VOCs is an important indicator for measuring the flavor quality of chili peppers[3]. The sensory aroma of chili peppers can vary significantly, influenced by the diversity, relative abundance, and balance of the VOCs present[4]. Previous research has identified more than 300 types of VOCs in chili peppers, which are predominantly grouped into classes such as esters, pyrazines, aldehydes, alcohols, acids, phenols, and ketones[5]. Esters and terpenoids, in particular, make up a substantial share[6]. The intricate aroma profiles created by these various VOCs contribute to the rich and nuanced flavors characteristic of chili peppers. Pino et al.[7] employed GC and GC-MS techniques to detect and analyze VOCs in various types of Lantern Pepper. Their findings revealed that hexyl isovalerate, hexyl valerate, and hexyl 2-methylbutyrate were the primary components responsible for determining the aroma. Similarly, Ziino et al.[8] utilized HS-SPME-GC-MS technology to identify 64 volatile compounds in fully mature varieties of Calabria pepper. Their results indicated that alcohols, aldehydes, terpenes, and aliphatic branched chain hydrocarbons constituted the primary categories of VOCs present in the pepper fruits. Mazida et al.[9] found that during the ripening process, hexanal (green aroma) and Pyrazine, 2-methoxy-3-(2-methylpropyl)- (grass aroma) significantly decreased, and the sweet and fruity characteristics represented by compounds such as 2,3-butanedione, 3-carene, trans-2-hexenal, and linalool increased during the ripening process. Bogusz Junior et al.[10] analyzed the volatile compounds of three Brazilian chili peppers at different ripening stages using SPME and GC-MS techniques, and found that the types of volatile compounds gradually decreased with the maturity of the chili peppers, with most of the volatile flavor compounds disappearing during the ripening process. Prior researchers have demonstrated the diverse range and intricate composition of VOCs found in pepper, with their characteristics being influenced by factors such as genotype, cultivation environment, and storage conditions. China's prominence as a major producer and consumer of fresh chili peppers is well-established. With rising living standards, there is an increasing market demand for high-quality chili peppers. However, the investigation into the aroma constituents, which play a crucial role in determining the freshness of chili peppers, is currently in its nascent phase. The systematic identification and analysis of the primary VOCs responsible for aroma remain unexplored, thereby impeding the progress of further research in this domain.
Headspace solid-phase microextraction-gas chromatography-mass spectrometry (HS-SPME-GC-MS) is currently a commonly used technique for the detection of VOCs in fruits and vegetables[11,12]. This technique has a high sensitivity for the determination of high molecular weight substances[13], but there are certain limitations in the determination of low molecular weight substances and trace substances. Headspace solid phase microextraction-full two-dimensional gas chromatography-time of flight mass spectrometry (HS-SPME-GC × GC-TOFMS) has been increasingly adopted for the identification of VOCs with significant aromatic impact in various products, such as wine[14], green tea[15], aromatic rice[16], blueberry[11], pear[17] and honeysuckle[18]. Compared with GC, comprehensive GC × GC can provide significant signal enhancement and peak capacity improvement of several to tens of times[19,20]. At present, the application of HS-SPME-GC × GC-TOFMS in the detection of VOCs in chili peppers has not been reported.
Based on the above problems, this study employed two technical methods, HS-SPME-GC-MS and HS-SPME-GC × GC-TOFMS, to meticulously profile the VOCs in the green ripening stage of 'Qujiao 5' pepper fruits. The findings from both methods were compared and synthesized to provide a detailed analysis of the VOCs composition. The relative odor activity value (ROAV) method was used to screen and obtain the key VOCs that determine the main aroma and modified aroma of pepper fruits, clarifying the main sensory flavor characteristics of 'Qujiao 5' pepper. The insights gained lay a theoretical and technical groundwork for the breeding and cultivation of high-quality pepper varieties.
-
Ethanol was purchased from Aladdin (Shanghai, China). n-Hexyl-d13 Alcohol was obtained from C/D/N Isotopes INC (Quebec, Canada). n-Alkanes was purchased from SIGMA (USA). N-Hexane was purchased from Yonghua (Shanghai, China).
Test materials and sampling treatment
-
The pepper cultivar var 'Qujiao 5', with rich fruit flavor was chosen for experiments in the present study. This experiment was conducted in February 2023 at the Yangdu Experimental Base of Zhejiang Academy of Agricultural Sciences, China (120°2'E, 30°27'N). Twenty chili pepper seedlings at the five leaf and one heart stage were transplanted to the field (with a row spacing of 30 cm × 60 cm), unified irrigation and fertilization management were conducted, and then labelled during the flowering period. When the chili peppers matured, five evenly sized fruits were selected, cut into small pieces, quickly frozen in liquid nitrogen, and then stored at −80 °C until further use[21,22]. Three biological replicates for further volatile component analysis were set.
HS-SPME-GC × GC-TOFMS analysis
-
Stock solution with 1 mg/L of n-Hexyl-d13 alcohol was prepared in 50% ethanol and stored at 4 °C in a refrigerator. A stock solution with 1 mg/L of n-Alkanes was prepared in N-Hexane and stored at 4 °C in a refrigerator. 0.5 g of sample was taken in a 20 mL headspace vial; 10 μL of the ISTD solution was added to each sample; the samples were then incubated at 60 °C for 10 min. The SPME fiber to chamber was set at 270 °C for 10 min before the sample was extracted; the SPME was then transferred to the incubator at 60 °C for 30 min; the SPME fiber was desorbed at 250 °C for 5 min in a GC injector; the SPME fiber chamber was set at 270 °C for 10 min after the injection step. 10 μL of the n-Alkanes were then transferred into a 20 mL headspace vial, Incubation extraction and injection.
GC × GC analysis[23−25]
-
Analyses were carried out using a LECO Pegasus® 4D instrument (LECO, St. Joseph, MI, USA) consisting of an Agilent 8890A GC (Agilent Technologies, Palo Alto, CA, USA) system equipped with a split/splitless injector, and dual-stage cryogenic modulator (LECO) coupled with TOFMS detector (LECO). A Rxi-5Sil MS (30 m × 250 μm I.D., 0.25 μm) (Restek, USA) was used as the first dimension column (1D) and Rxi-17Sil MS (2.0 m × 150 μm I.D., 0.15 μm) (Restek, USA) was used as a second-dimension column (2D). The carrier gas was high-purity helium (> 99.999%) at a constant flow rate of 1.0 mL/min. The oven temperature was held at 50 °C for 2 min at first, then raised to 180 °C at the rate of 3 °C/min and held for 1 min, then raised to 220 °C at a rate of 10 °C/min and held for 2 min. The secondary oven temperature was operated at 5 °C higher than the first oven. The temperature of the modulator is always 15 °C higher than that of the second column. The modulator was operated with a 7.0 s modulation period. The GC injector temperature was 250 °C.
Mass spectrum conditions[23−25]
-
Flavor substance was performed on LECO Pegasus BT 4D. The transfer line and TOF MS ion source temperatures were set at 250 °C and 250 °C, respectively. The acquisition frequency was 200 spectra/s. The mass spectrometer was operated in the EI mode at 70 eV using a range of m/z 35−550 and the detector voltage of 2,039 V.
HS-SPME-GC-MS analysis
-
The samples were taken from the −80 °C refrigerator for liquid nitrogen grinding, vortex mixing, each sample weighed about 500 mg (1 mL) to a 20 mL head-space vial (Agilent, Palo Alto, CA, USA); the saturated NaCl solution and 20 μL (10 μg/mL) internal standard solution were added respectively. Automatic headspace solid-phase microextraction HS-SPME was used for sample extraction for GC-MS analysis.
At the time of SPME analysis, each vial was placed at 60 °C for 5 min, then a 120 µm DVB/CWR/PDMS fiber (Agilent) was exposed to the headspace of the sample for 15 min at 60 °C.
GC-MS conditions
-
After sampling, desorption of the VOCs from the fibre coating was carried out in the injection port of the GC apparatus (Model 8890; Agilent) at 250 °C for 5 min in the splitless mode. The identification and quantification of VOCs was carried out using an Agilent Model 8890 GC and a 7000D mass spectrometer (Agilent), equipped with a 30 m × 0.25 mm × 0.25 μm DB-5MS (5% phenyl-polymethylsiloxane) capillary column. Helium was used as the carrier gas at a linear velocity of 1.2 mL/min. The injector temperature was kept at 250 °C and the detector at 280 °C. The oven temperature was programmed from 40 °C (3.5 min), increasing at 10 °C/min to 100 °C, at 7 °C/min to 180 °C, at 25 °C/min to 280 °C, hold for 5 min. Mass spectra were recorded in electron impact (EI) ionisation mode at 70 eV. The quadrupole mass detector, ion source and transfer line temperatures were set, respectively, at 150, 230 and 280 °C. The MS selected ion monitoring (SIM) mode was used for the identification and quantification of analytes.
Data processing and analysis
GC × GC-TOFMS qualitative and quantitative analysis
-
Based on LECO Pegasus BT 4D GC × GC-TOFMS obtained the spectra of various flavor substances, and used the NIST2020 database to annotate the flavor substances in the offline raw data using Chroma TOF search software. Relevant information such as the name, retention time, retention index, CAS number, and peak area of each substance was obtained. Normalize the content of flavor substances based on the peak area of the internal standard substance deuterated n-hexanol d13 to obtain the relative content[26,27]. The calculation formula is: A/IS, where A is the flavor substance to be tested and IS is the peak area of the internal standard substance in a certain sample.
GC-MS qualitative and quantitative analysis
-
Based on multiple species, literature, partial standards, and retention index, a database based on the NIST 2020 spectral library was established (Wuhan Maiteweier Biotechnology Co., Ltd., China), which includes determined RT and qualitative and quantitative ions for selective ion detection mode for precise scanning. One quantitative ion and 2−3 qualitative ions were selected for each compound. All ions that need to be detected in each group shall be detected according to the peak order and in different stages. If the retention time detected is consistent with the standard reference and the selected ions appear in the sample quality spectrum after subtracting the background, it is determined that the material is the target material[28], and quantitative ions are selected for integration and correction, so as to enhance the accuracy of quantitative measurement.
Relative odor activity value (ROAV)
-
ROAV was calculated according to previous studies to determine the contribution of volatile substances to sample flavor.[29] The ROAV that contributes the most to the flavor of the sample among the selected compounds is 100, and the ROAV of the other components is calculated as follows: ROVA = Peak B × TA/Peak A × TB. The peak with the minimum order threshold is TA, with a peak area of Peak A and an ROVA value of 100. The threshold for other substances is TB, and the peak area is Peak B.
-
Upon analyzing the total ion chromatography (Fig. 1a) with the high-resolution mass spectrometry database (self-built library based on the NIST20 library) through HS-SPME-GC-MS analysis, 773 VOCs were identified (Supplemental Table S1), which can be divided into 15 categories, including terpenoids (164), esters (126), hydrocarbons (118), heterocyclic compounds (118), ketones (64), alcohols (60), aldehydes (55), acids (18), amines (18), phenols (14), nitrogen compounds (6), sulfur compounds (4), halogen compounds (4), others (3), and ethers (1) (Fig. 1d). Among them, the number of terpenoids, esters, hydrocarbons and heterocyclic compound substances have significantly higher quantities than other substances, accounting for more than 15% of the volatile compounds detected in this technology. These substances together account for 68.05% of the total VOCs (Fig. 1d), they play a crucial role in determining the composition of chili aroma. Aldehydes, alcohols, and ketones account for 7% to 9%, phenols, amines, and acids account for 1% to 3%, while other categories such as nitrogen compounds, halogen compounds, ethers, others, and sulfur compounds account for less than 1%.
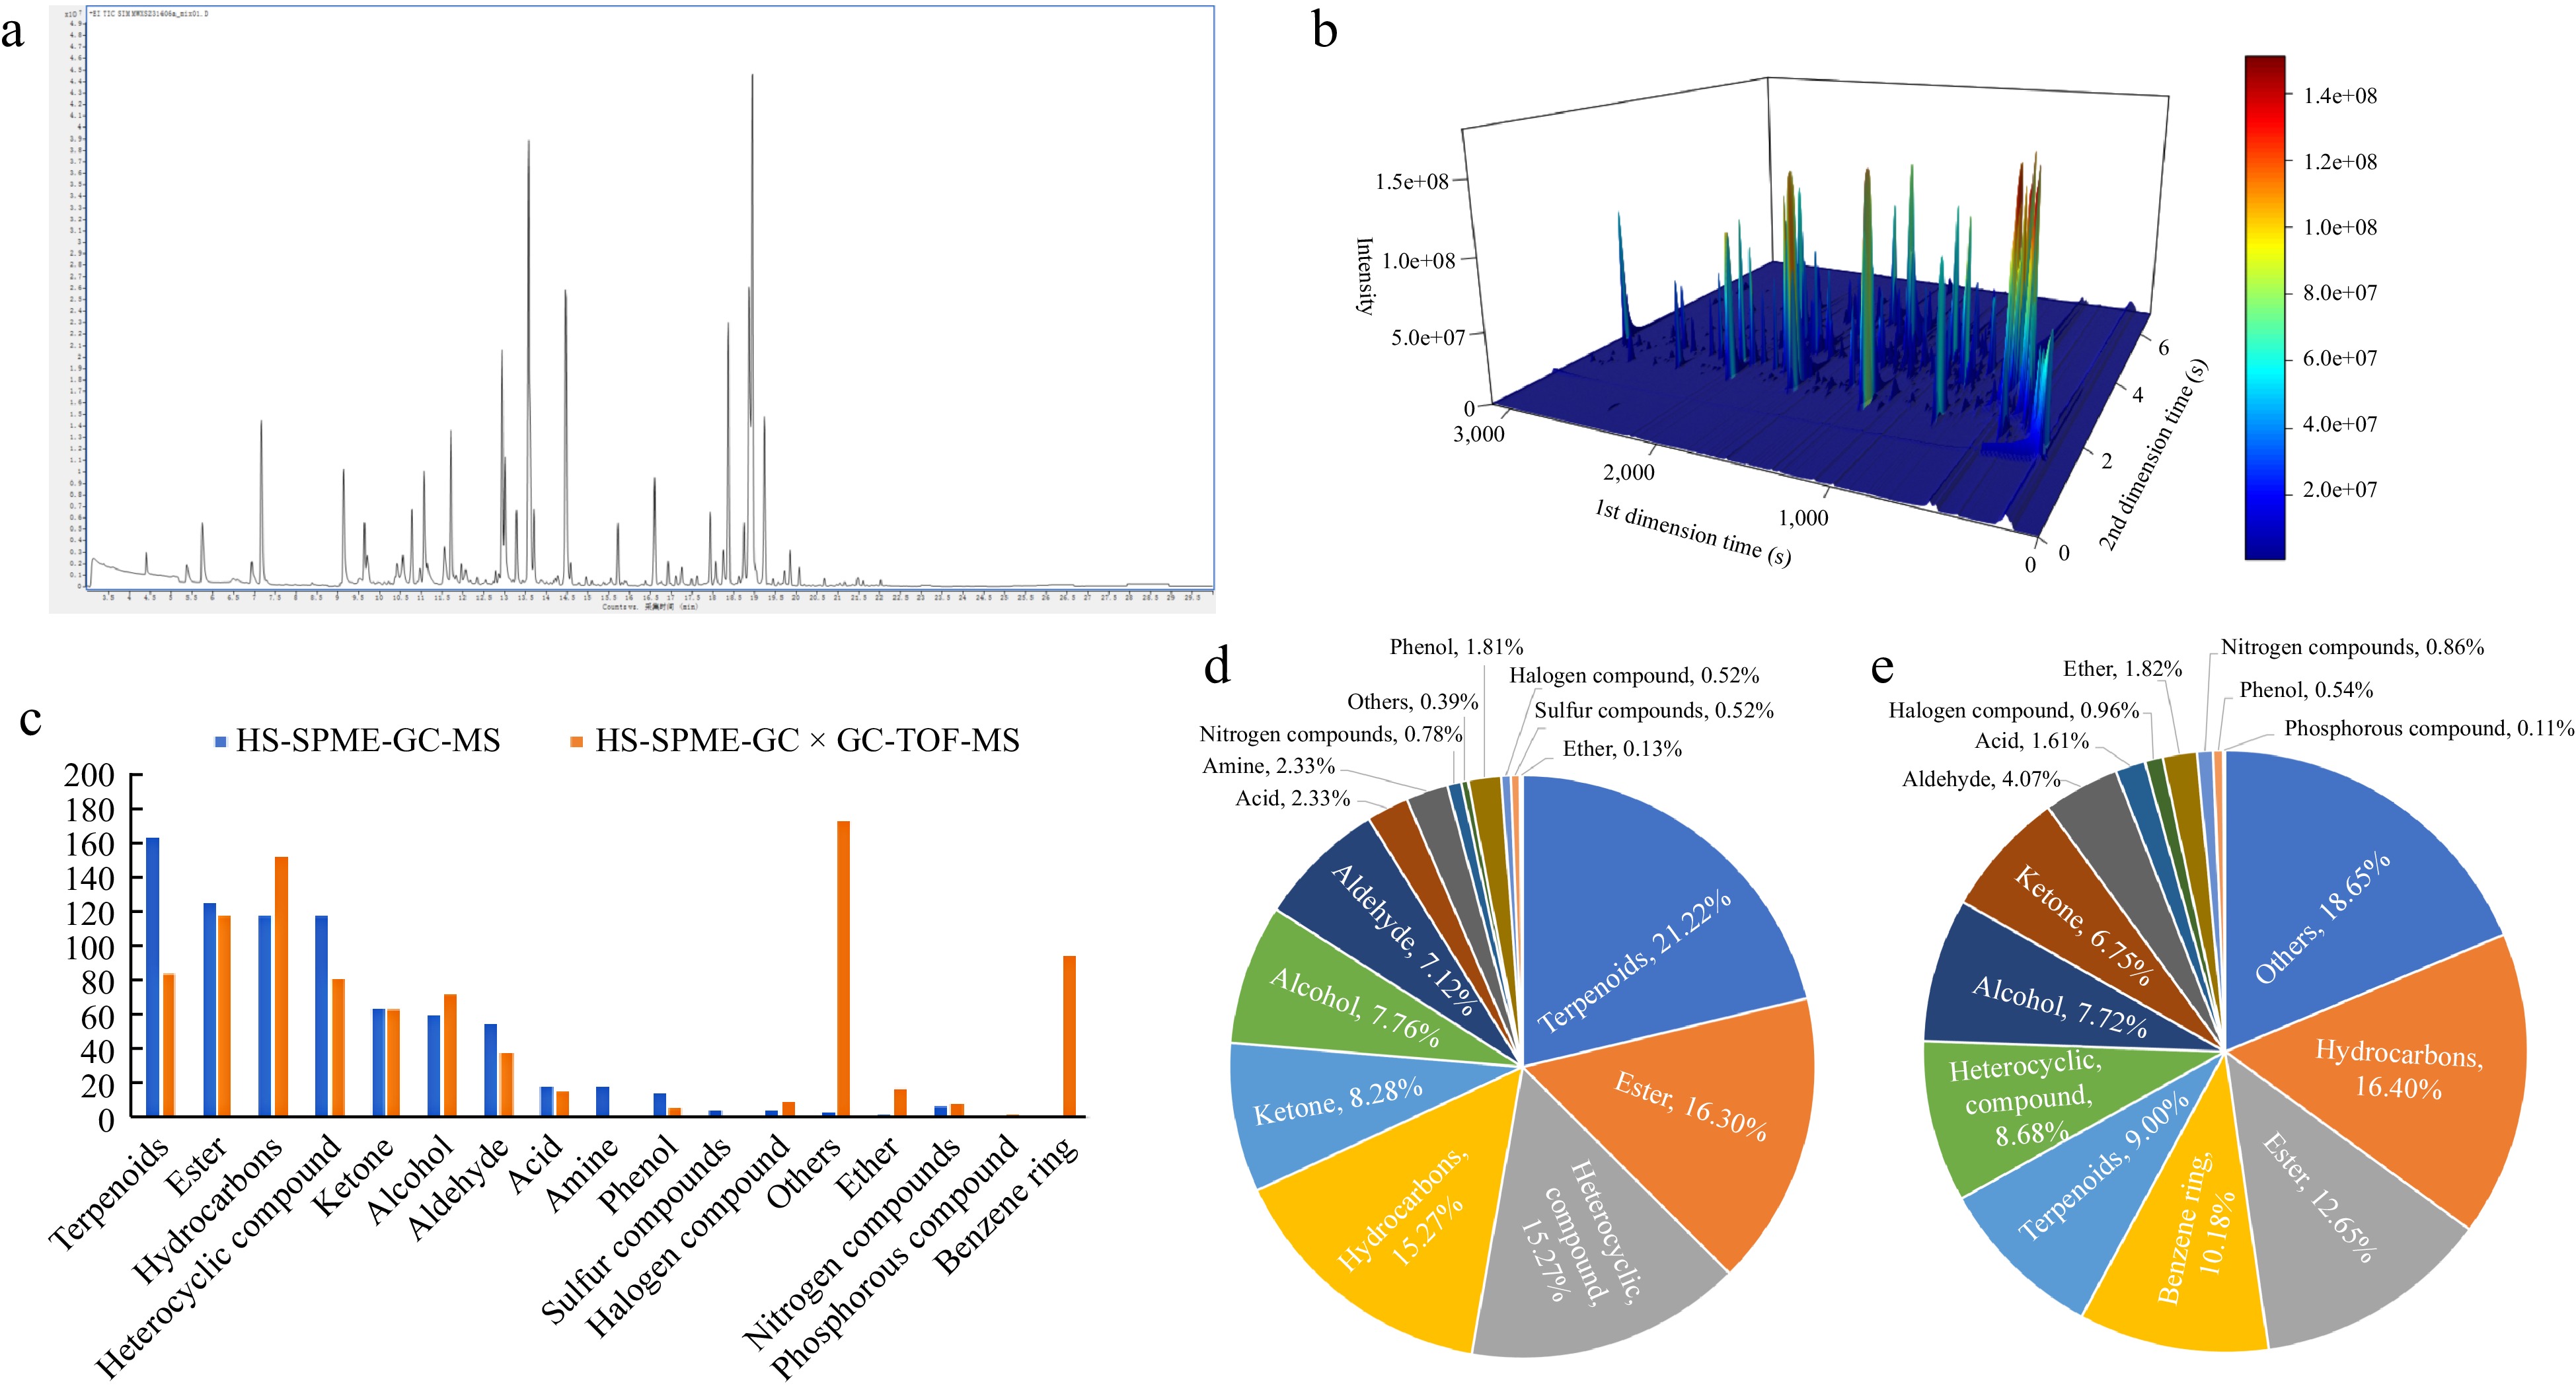
Figure 1.
Effect of different detection methods on VOCs of capsicum. (a) Total ion flow diagram of VOCs detected by HS-SPME-GC-MS; (b) 3D chromatogram obtained by HS-SPME-GC × GC-TOFMS detection; (c) number of different types of VOCs in the two identification methods; (d) proportion of VOCs detected by HS-SPME-GC-MS in various categories of substances; (e) proportion of VOCs detected by HS-SPME-GC × GC-TOFMS in various categories of substances.
A total of 933 VOCs were identified in the total ion chromatogram obtained by HS-SPME-GC × GC-TOFMS detection technology. (Fig 1b, Supplemental Table S1, which can be divided into 15 categories, including others (174), hydrocarbons (153), esters (118), benzene rings (95), terpenoids (84), heterocyclic compounds (81), alcohols (72), ketones (63), aldehydes (38), ethers (17), acids (15), halogen compounds (9), nitrogen compounds (8), phenols (5) and phosphorous compound (1). Among the VOCs identified in this detection technology, there are 125 substances whose classification is unclear, and these substances are temporarily classified into others. In addition, the proportion of hydrocarbon substances is higher than that of other substances, reaching 16.4%. The proportion of esters and benzene ring substances is also above 10%. The proportion of aldehydes, ketones, alcohols, heterocyclic compounds, and terpenoids is between 4% and 10%. Other categories such as ethers, acids, halogen compounds, nitrogen compounds, phenols, and phosphorus compounds are relatively low, all less than 2% (Fig. 1e).
Seventeen distinct categories of volatile compounds were identified utilizing two divergent technological approaches, with notable variations in the number of volatile compounds ascertained within each category by the respective technologies (Fig. 1c). Among them, amines and sulfur compounds were only detected and obtained by the HS-SPME-GC-MS technique, and phosphorus compounds and benzene ring-type compounds were only detected and obtained by HS-SPME-GC × GC-TOFMS technique. As can be seen from Fig. 1d & e, the compounds with the largest proportion of the number of compounds obtained by the HS-SPME-GC-MS method were terpenes, accounting for 21.22% of the total number of substances obtained by the method, while the proportion of the number of compounds of this group of substances identified by the HS-SPME-GC × GC-TOFMS method was only 9.0%. In the HS-SPME-GC × GC-TOFMS method, the compounds with the largest percentage of the quantity obtained by identification were hydrocarbons, which accounted for 16.4% of the total quantity of substances obtained by the method, while the percentage of compounds in this category identified by the HS-SPME-GC-MS method was 15.27%, which was close to the same percentage. In addition to the above volatile compound components, four types of compounds such as esters, ketones, aldehydes and alcohols exhibited similar proportions across the two distinct detection methods, with a variance of no more than 5%.
Through HS-SPME-GC-MS (773) and HS-SPME-GC × GC-TOFMS (933) obtained a total of 1,558 volatile compounds using two detection techniques, of which 150 were detected by both techniques (Supplemental Table S1), accounting for 9.63% of the total volatile compounds. HS-SPME-GC-MS detected 623 unique VOCs, accounting for 39.99% of the total VOCs, HS-SPME-GC × GC-TOFMS detected 783 unique VOCs, accounting for 50.26% of the total (Fig. 2a). Among a total of 150 volatile compounds, there are 39 hydrocarbons, 35 terpenoids, 23 esters, 17 aldehydes, 15 ketones, 13 alcohols, six heterocyclic compound, and two phenols. Hydrocarbons and terpenoids were the most abundant, comprising 26.00% and 23.33%, respectively. Esters, hydrocarbons, aldehydes, ketones, and alcohols each made up more than 8% of the total. Heterocyclic compounds represented 4.00%, while phenolic substances were the least, making up only 1.33% of the 150 VOCs (Fig. 2b).
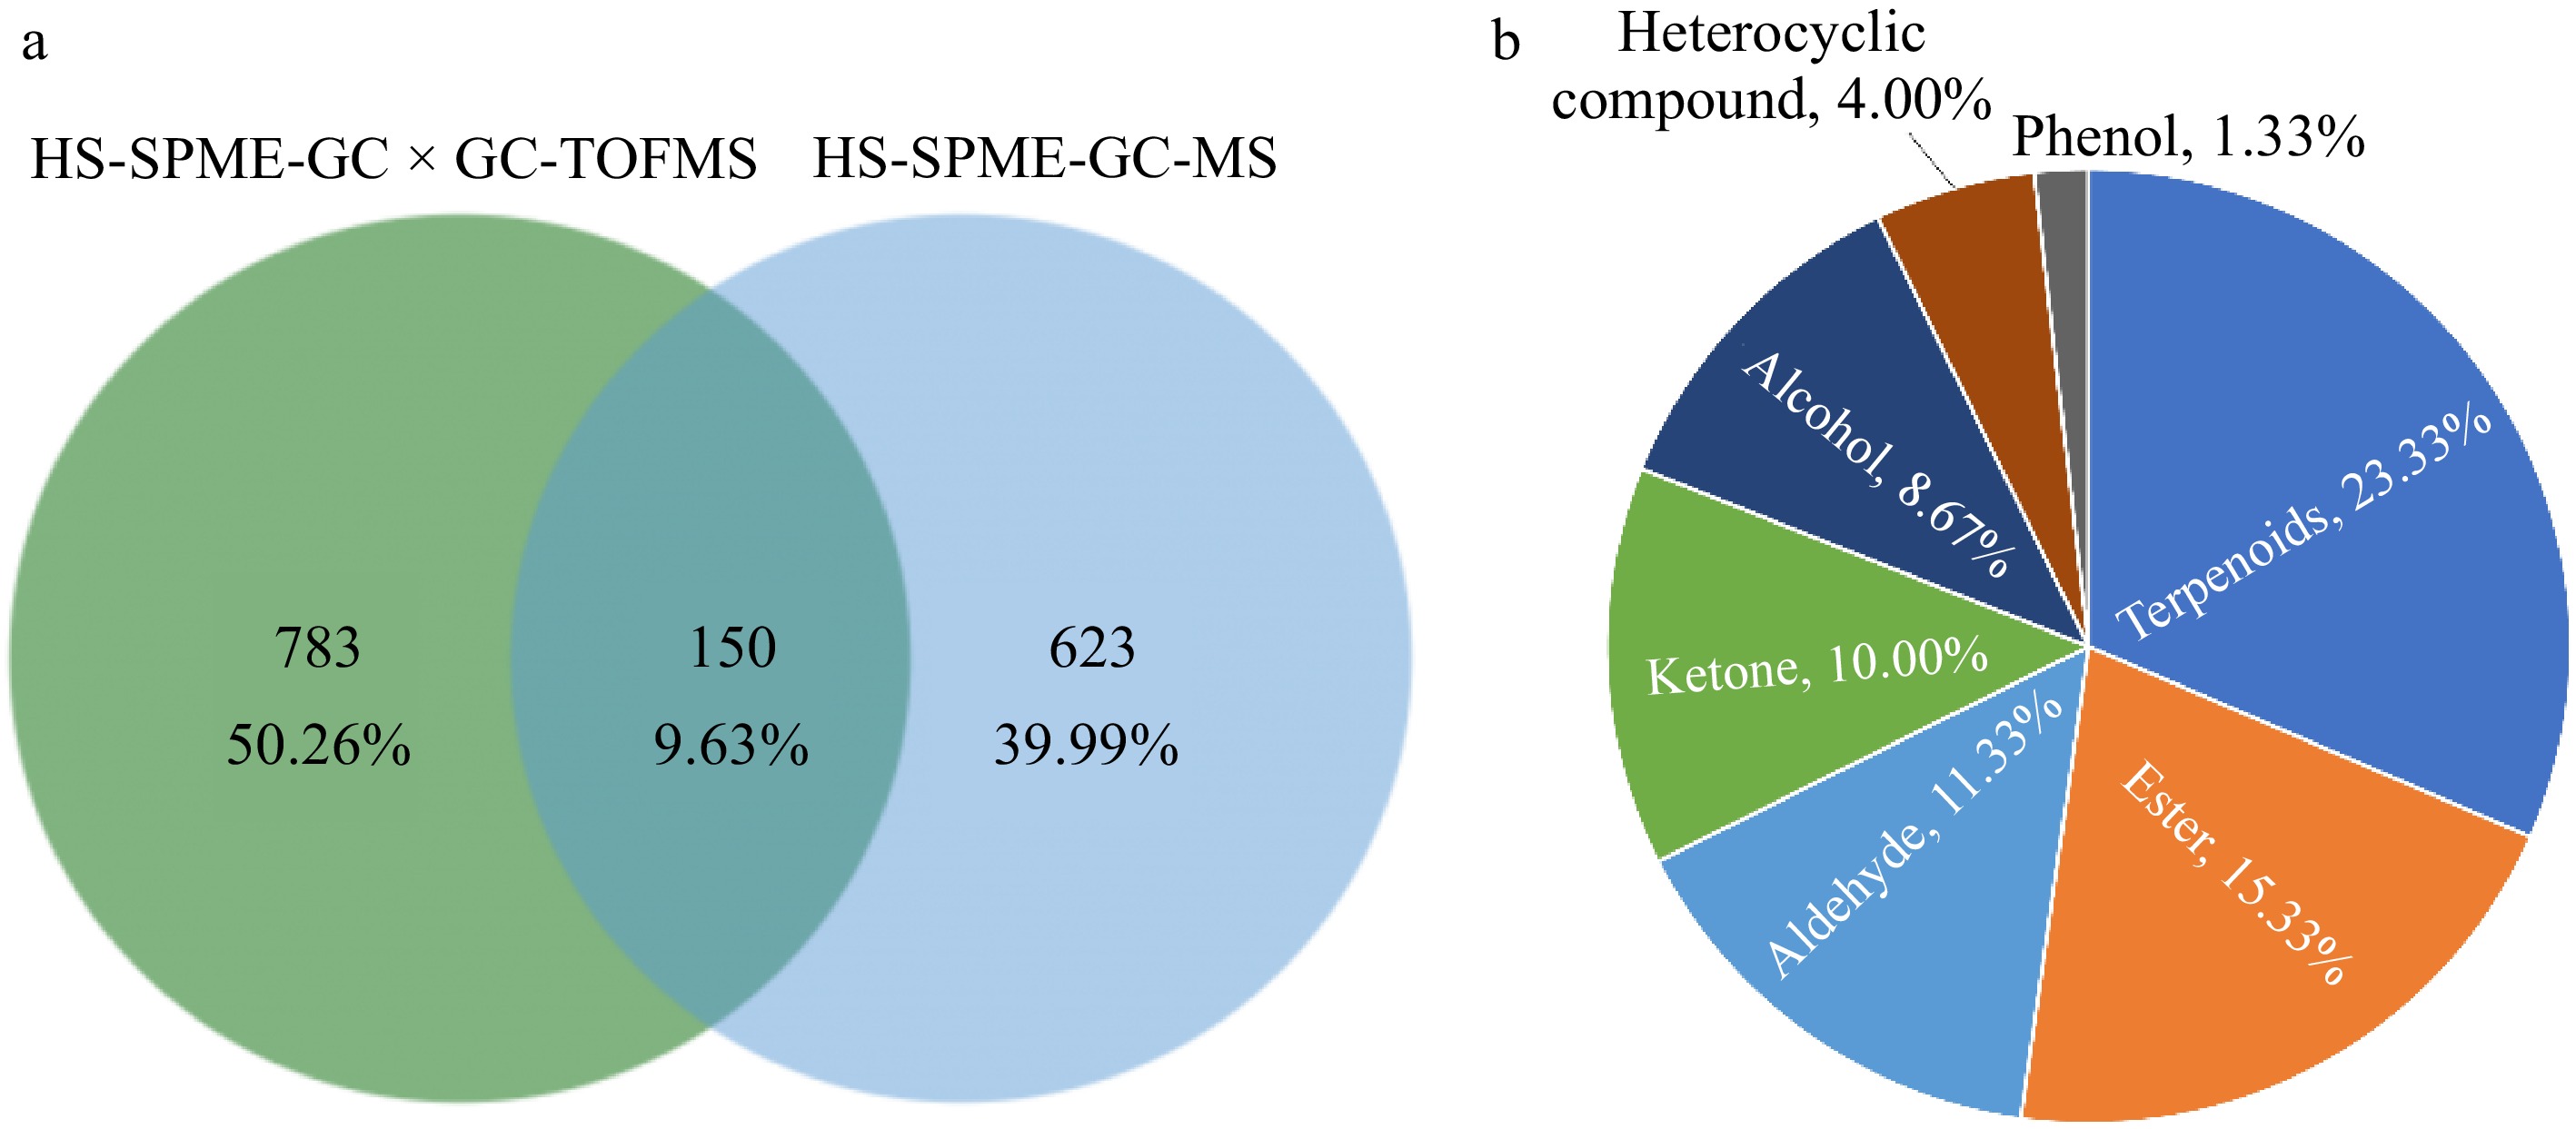
Figure 2.
Analysis of VOCs in chili peppers using different detection methods. (a) Differential Venn diagram of VOCs identified by two detection methods; (b) proportion of the total number of VOCs identified by two detection methods in each category.
Comparative analysis of relative content of VOCs in chili peppers identified by HS-SPME-GC-MS and HS-SPME-GC × GC-TOFMS techniques
-
To assess the variations in the volatile content within the headspace of chili peppers, a quantified internal standard was introduced to the samples, enabling the estimation of the relative concentrations of the identified compounds. This approach revealed discrepancies in the relative content of VOCs as measured by the different analytical techniques employed. In the HS-SPME-GC-MS identification results (Fig. 3a), the relative content of terpenoids accounted for 39.98% of the total volatile compound content, significantly higher than other compound categories, followed by heterocyclic compounds, hydrocarbons, and esters, accounting for 18.41%, 13.47%, and 12.36% of the total volatile compound content respectively, accounting for more than 10%. Alcohols, ketones, aldehydes, and phenols accounted for 1% to 5%, while others, amines, nitrogen compounds, acids, halogen compounds, sulfur compounds, and ethers are less than 1%, with ethers accounting for the smallest proportion, only 0.004% of the total volatile compound content. In the HS-SPME-GC × GC-TOFMS detection method (Fig. 3b), alcohols have the highest relative content of volatile compounds, accounting for 21.22% of the total volatile compound content, followed by aldehydes, esters, others and heterocyclic compounds, accounting for 17.95%, 14.67%, 10.72%, and 10.68% of the total volatile compound content, with relative content exceeding 10%. The proportion of hydrocarbons, benzene rings, terpenes, ketones, and acids are between 1% and 10%, while the proportion of ethers, nitrogen compounds, halogen compounds, phenols, and phosphorous compounds is less than 1%, with phosphorous compound accounting for only 0.02%.
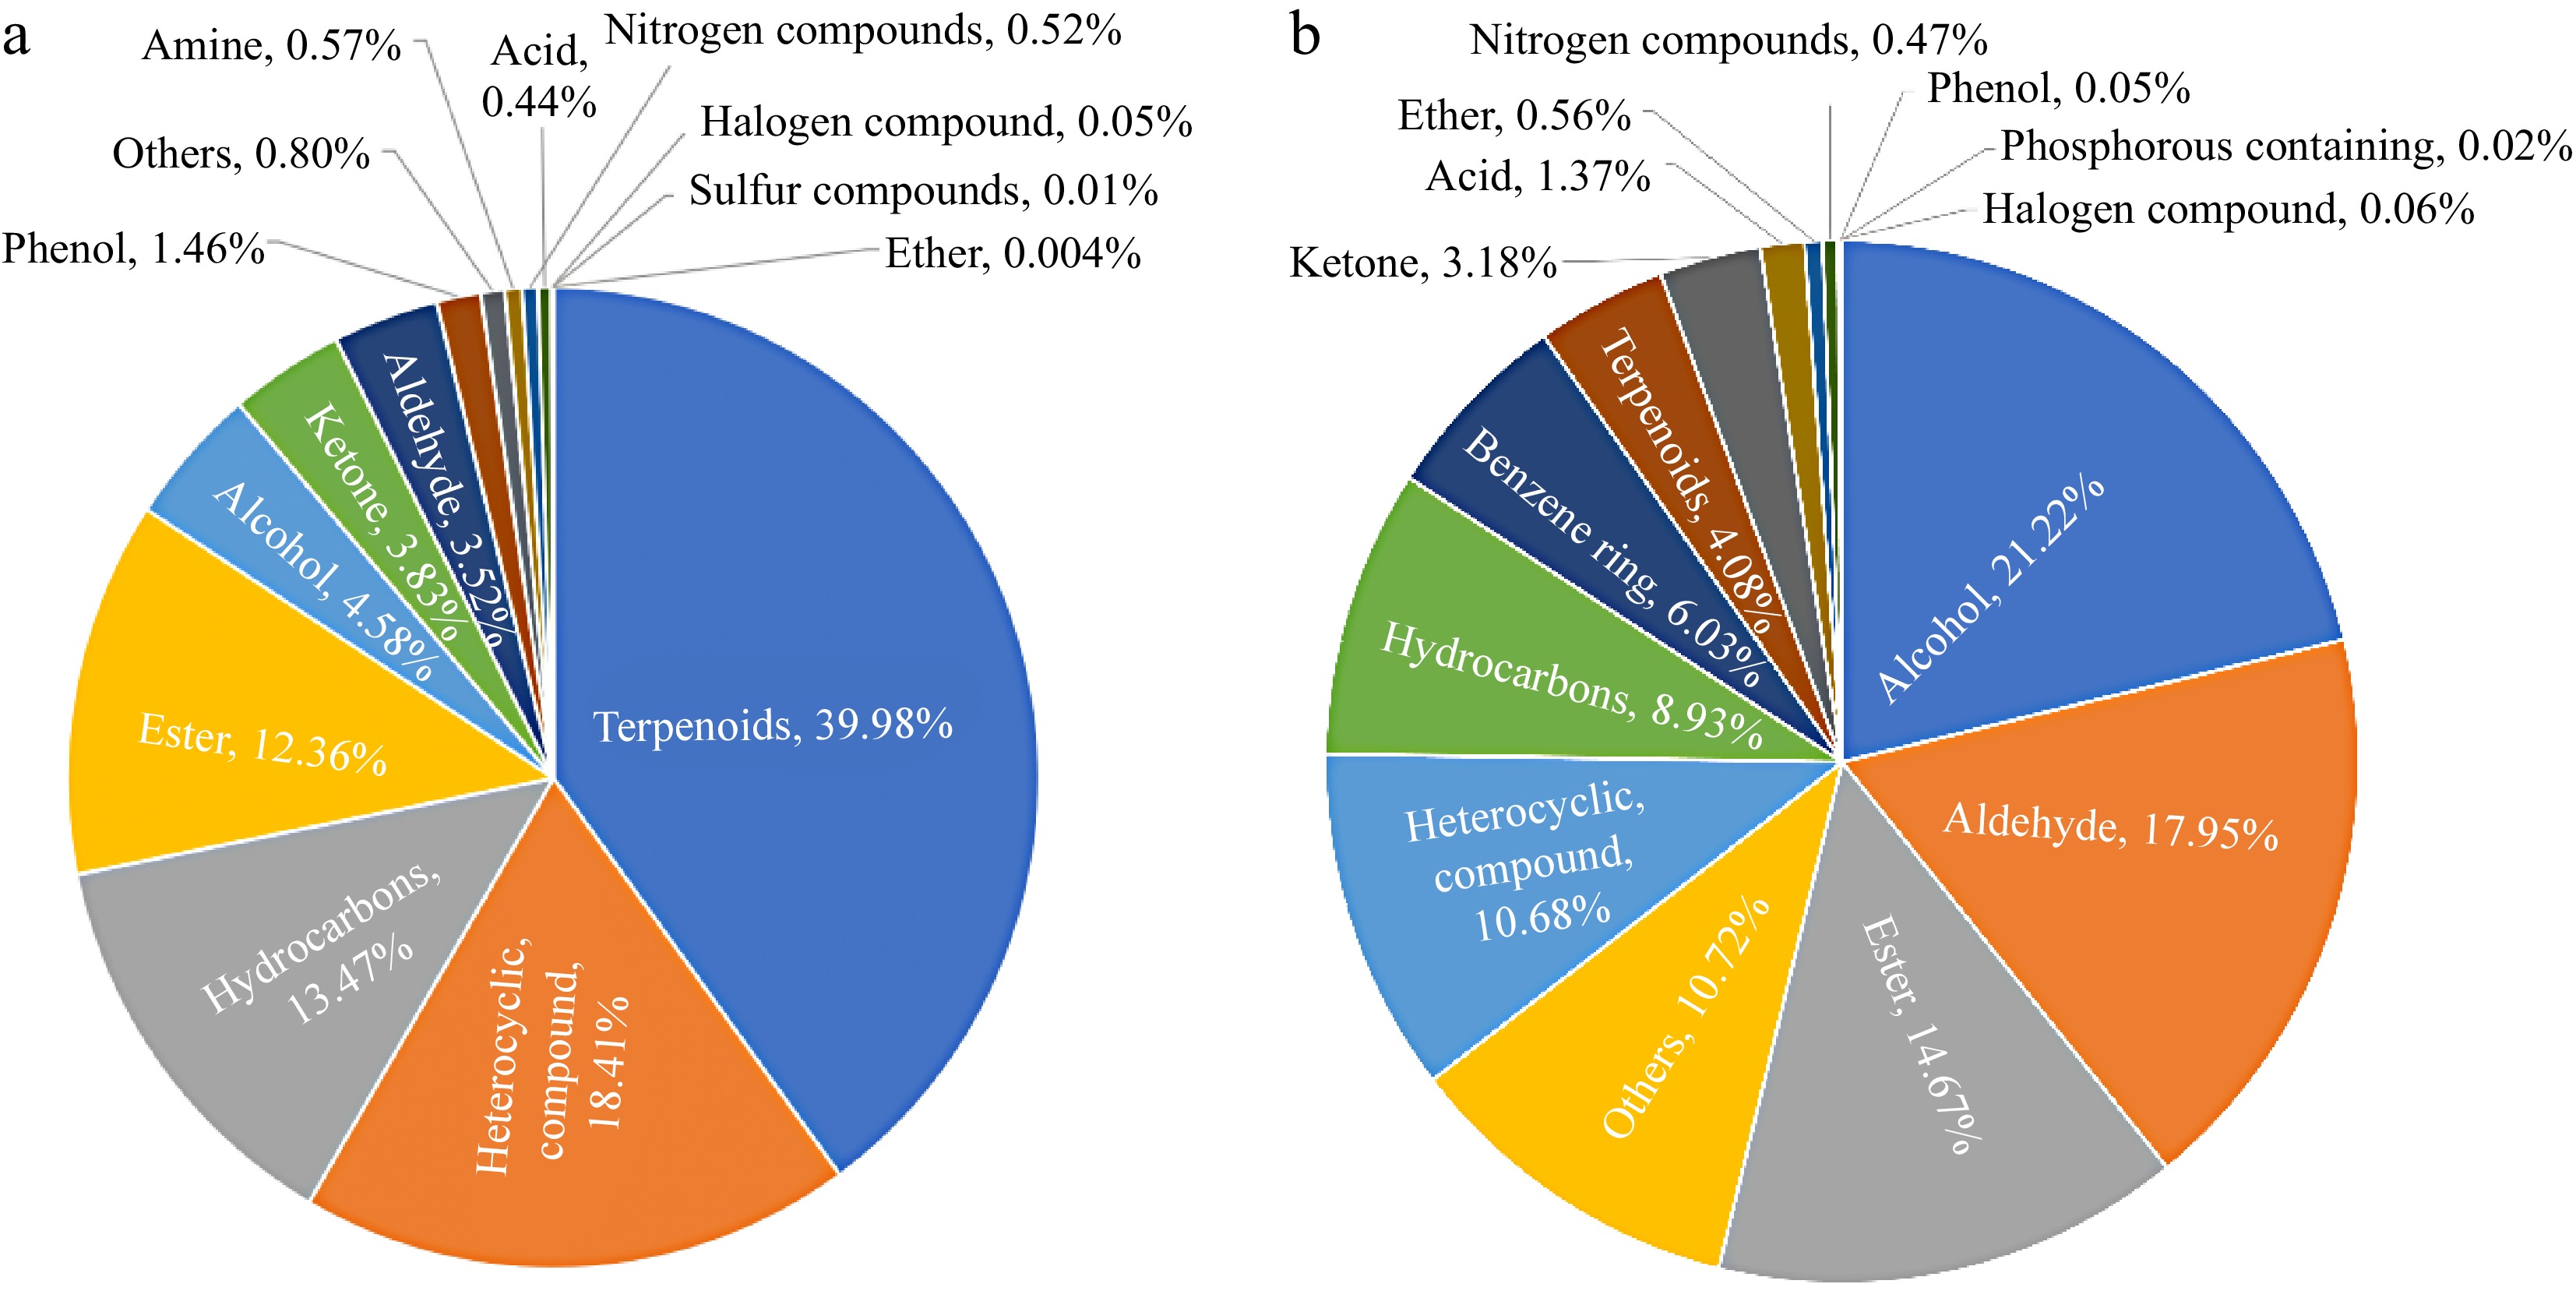
Figure 3.
The effect of different detection methods on the relative content of VOCs in capsicum. (a) Relative content of different categories of VOCs obtained by HS-SPME-GC-MS identification; (b) relative contents of VOCs of different categories identified by HS-SPME-GC × GC-TOFMS.
Upon examining the relative content of various categories of volatile compounds identified by the two methods, significant discrepancies were observed in the relative content of the same categories of volatile compounds when detected by different analytical techniques. In the HS-SPME-GC-MS detection method, the proportion of terpenoids in the total volatile compounds reached 39.98%, but this type of substance was found in the HS-SPME-GC × GC-TOFMS method identified only 4.08% of the total volatile compounds, and the relative content difference between the two detection techniques was 35.9%. In the HS-SPME-GC × GC-TOFMS method, alcohols accounted for 21.22% of the total volatile compounds, but in the HS-SPME-GC-MS method, the relative content only accounted for 4.58%, and the relative content difference between the two detection techniques was 16.65%. The relative content of aldehydes and heterocyclic compound detected in the two detection techniques also differed significantly, with 14.43% and 7.73%, respectively. Other categories such as esters, hydrocarbons, ketones, acids, and phenols had relatively small differences in the relative content of the two detection techniques, both of which were less than 5%.
Analysis of the total compositional components of chili pepper VOCs
-
Based on the two different detection methods in this study, the 1,558 pepper VOCs identified were comprehensively analyzed (Supplemental Table S1), and a total of 17 types of VOCs were found (Fig. 4a), including hydrocarbons (250), esters (224), terpenoids (219), heterocyclic compounds (192), others (164), alcohols (121), ketones (118), aldehydes (81), benzene rings (75), acids (33), amines (18), ethers (17), nitrogen compounds (14), phenols (14), halogen compounds (13), sulfur compounds (4), and phosphorous compounds (1). As shown in Fig. 4b, hydrocarbon VOCs were the most numerous, accounting for about 16.05% of the total, while esters, terpenes and heterocyclic compounds were not significantly different in number and accounted for more than 12% of the total volatile compounds. The quantity of others, alcohols, ketones and aldehydes accounted for between 5% and 12%, and the quantity of volatile compounds in the categories of benzene rings, acids, phenols, amines, ethers, nitrogen compounds, halogen compounds, sulphurous compounds, and phosphorus compounds was small and accounted for less than 5%, with nitrogen compounds, halogen compounds, sulphurous compounds, and phosphorus compounds accounting for less than 1%. Hydrocarbons, esters, terpenoids, heterocyclic, alcohols, ketones, and aldehydes emerged as the predominant volatile flavor constituents in chili fruits, collectively encompassing 1,205 species and representing 77.34% of the total VOCs identified. The remaining benzene rings, acids, phenols, amines, ethers, nitrogen compounds, halogen compounds, sulfur compounds, and phosphorus compounds amounted to 353 substances, constituting a mere 22.66% of the overall volatile compound profile.
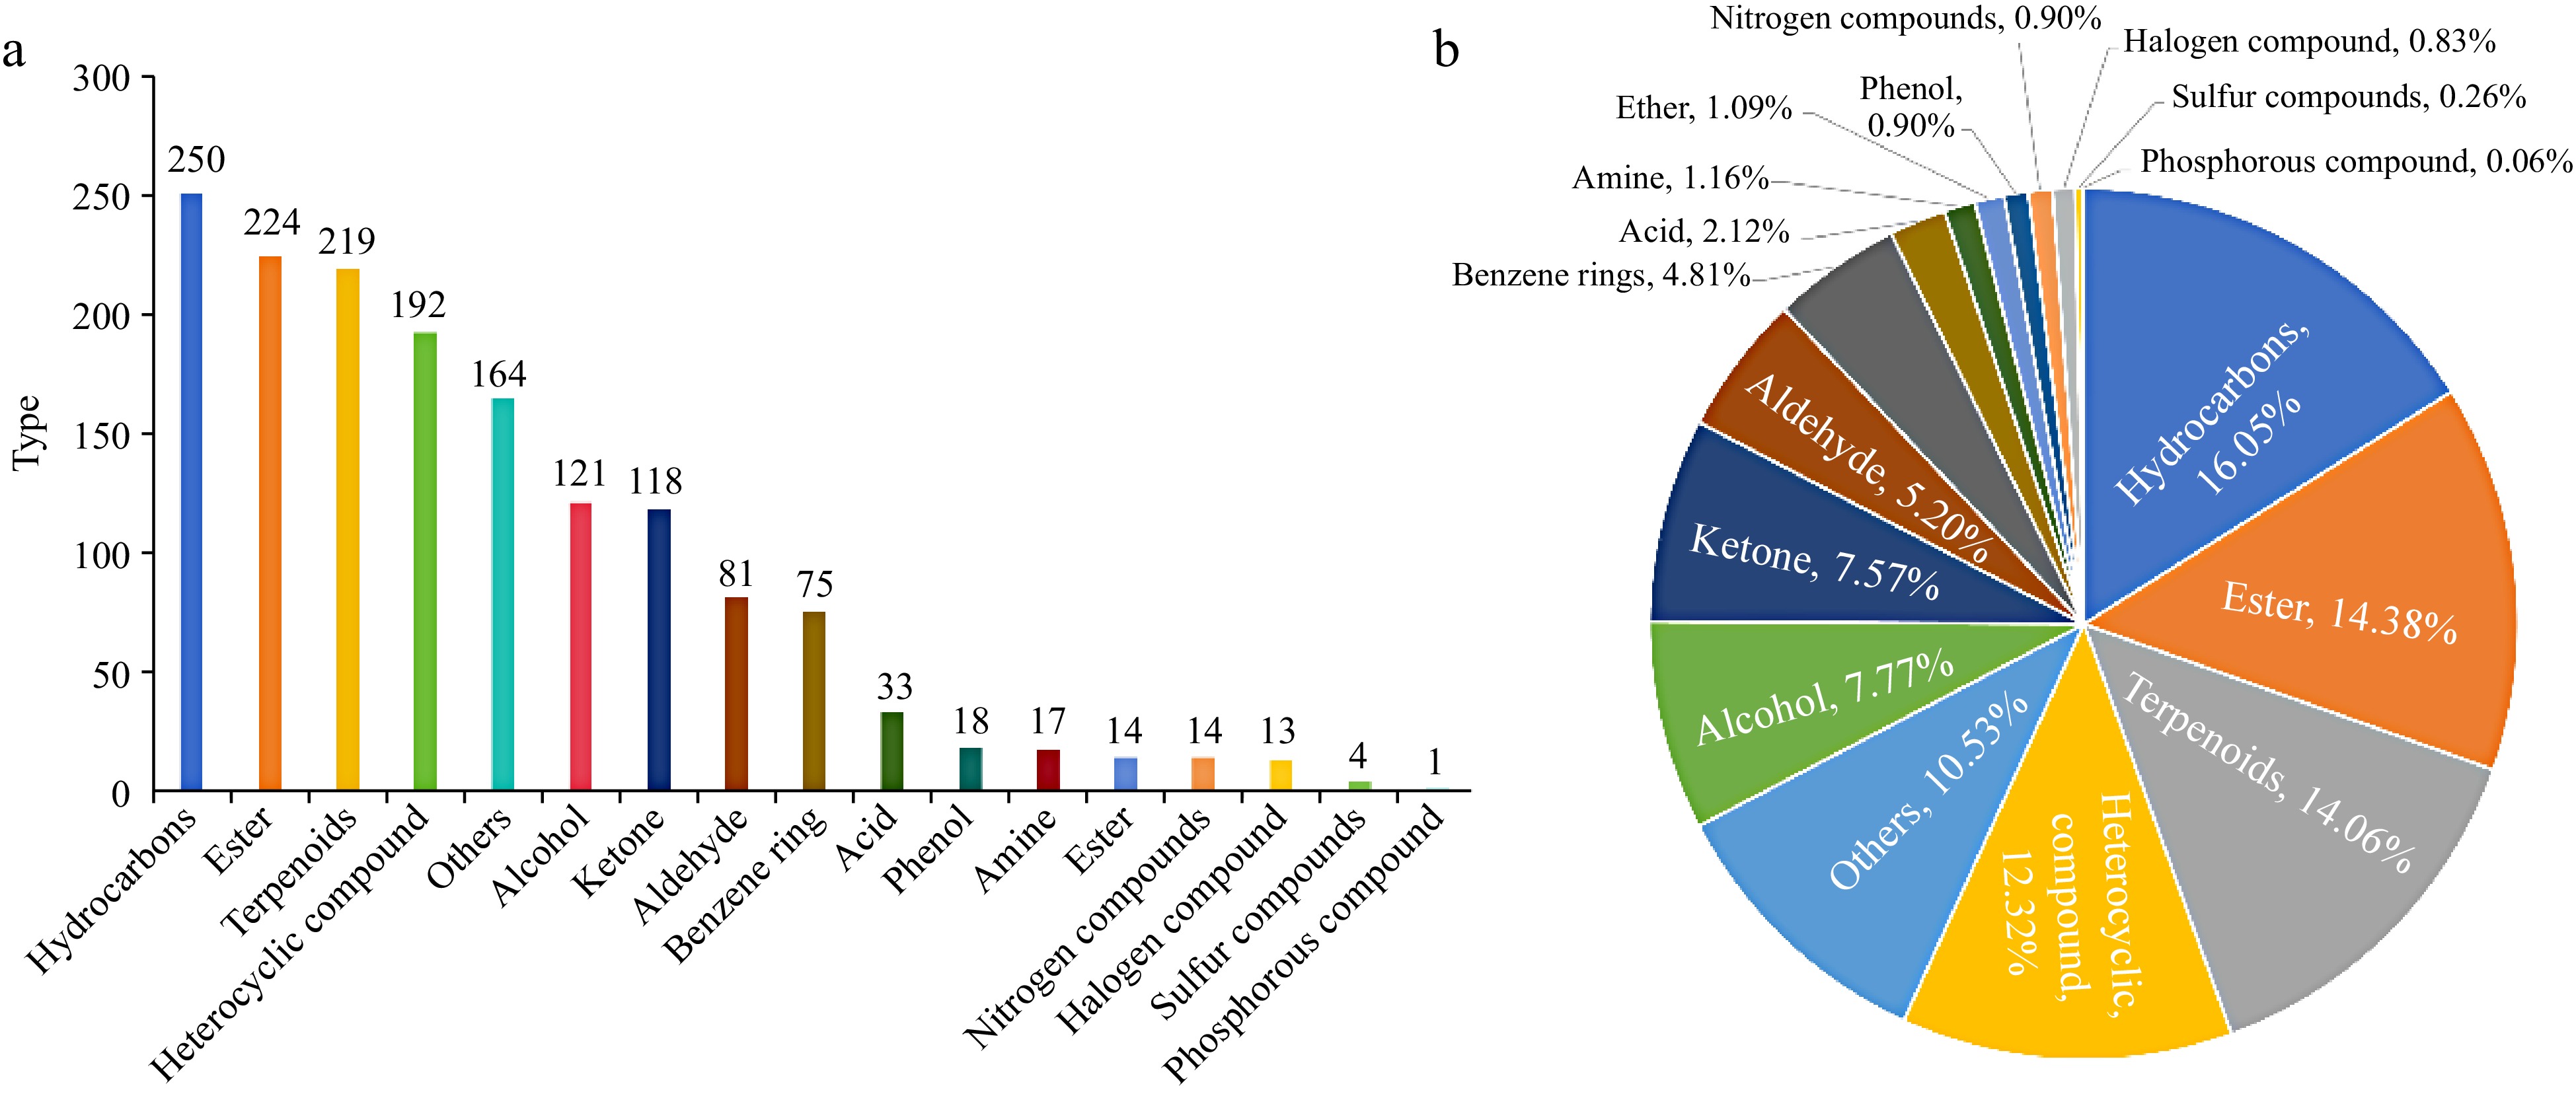
Figure 4.
Comprehensive analysis of volatile VOCs in chili peppers. (a) Number of substances in each category of VOCs in chili peppers; (b) percentage of the number of substances in each category of VOCs in chili peppers.
Identification of key VOCs and analysis of sensory flavor characteristics in chili peppers
-
A total of five key VOCs with ROAV > 1 obtained from pepper fruits were identified (Table 1), which play a major role in the formation of pepper aroma. Two volatile compounds, Pyrazine, 2-methoxy-3-(2-methylpropyl)- and β-ionone, were identified in VOCs with ROAV > 1 by HS-SPME-GC-MS. Among them, Pyrazine, 2-methoxy-3-(2-methylpropyl)- has the highest ROAV value (100.00), with sensory flavor characteristics of green bell pepper and pea types, and β-ionone has a ROAV value of 50.51, providing floral and woody sensory characteristics. There are four types of VOCs with ROAV > 1 identified by HS-SPME-GC × GC-TOFMS, including two aldehydes and two heterocyclic compounds. The ROAV value of 2-Nonenal, (E)- is the highest (100.00), significantly higher than the other three components, mainly providing flavor characteristics of fatty and cucumber types. The ROAV values of the three volatile compounds, Pyrazine, 2-methoxy-3-(2-methylpropyl)-, Furan, 2-pentyl-, and 2-Octenal, (E)-, are all between 10.00 and 16.00. It should be noted that both detection techniques have identified a ROAV value of over 15 for Pyrazine, 2-methoxy-3-(2-methylpropyl)-, indicating that this substance plays an important role in the composition of the green aroma flavor characteristics of chili fruits.
Table 1. Key volatile flavor substances.
technology Name Type Sensory flavor characteristics ROAV ROAV > 1 HS-SPME-GC-MS Pyrazine, 2-methoxy-3-(2-methylpropyl)- Heterocyclic compound Green bell pepper, pea 100.00 β-ionone Terpene Floral, woody 50.51 HS-SPME-GC ×
GC-TOFMS2-Nonenal, (E)- Aldehyde Fatty, cucumber 100.00 Pyrazine, 2-methoxy-3-(2-methylpropyl)- Heterocyclic compound Green bell pepper, pea 15.12 Furan, 2-pentyl- Heterocyclic compound Green beans, green 11.76 2-Octenal, (E)- Aldehyde Nuts, green, fatty 10.00 0.1 < ROAV < 1 HS-SPME-GC-MS 2-Thiophenemethanethiol Heterocyclic compound Coffee 0.76 Furaneol Heterocyclic compound Sweet, fruity 0.45 2,4-Decadienal, (E, E)- Aldehyde Fatty, waxy, 0.39 Cyclohexanone, 2,2,6-trimethyl- Ketone Thujone, sweet, floral 0.27 (2E,4Z)-2,4-Decadienal Aldehyde Fatty, green, waxy 0.19 Dodecanenitrile Nitrogenous compound Fruity, spicy 0.17 Dimethyl triSulfur compounds Sulfur-containing compound Sulfury, garlicy 0.12 3-Octen-2-one, (E)- Ketone Spicy, green, sweet, mushroom, fruity 0.11 HS-SPME-GC ×
GC-TOFMSHeptanal Aldehyde Citrus, fatty 0.98 1-Octen-3-one Ketone Mushroom 0.70 Pyrazine, 2-methoxy-3-(1-methylpropyl)- Heterocyclic compound Green, nut, pepper 0.27 2,6-Nonadienal, (E, Z)- Aldehyde Fruity, green 0.25 In addition, to more specifically explore the composition of pepper fruit aroma, volatile compounds with 0.1 < ROAV ≤ 1 was further analyzed in this study (Table 1). Twelve VOCs that modify the aroma profile of chili fruits were identified using two distinct analytical techniques. Eight VOCs with 0.1 < ROAV ≤ 1 are identified by the HS-SPME-GC-MS technique, including two heterocyclic compounds, two aldehydes, two ketones, one nitrogenous compound and one sulfur compound. They are 2-Thiophenemethanethiol, furaneol, 2,4-Decadienal, (E, E)-, (2E, 4Z)-2,4-Decadienal, cyclohexanone, 2,2,6-trimethyl-, 3-Octen-2-one, (E)-, dodeconitrile, and dimethyl trisulfur compounds. Four volatile substances with 0.1 < ROAV ≤ 1 are identified by HS-SPME-GC × GC-TOFMS technique, including two aldehydes, one heterocyclic compound, and one ketone, namely heptanal, 2,6-Nonadienal, (E, Z)-, Pyrazine, 2-methoxy-3-(1-methylpropyl)- and 1-octene-3-one, respectively. Heptanal, with a ROAV value nearing 1, imparts citrus and fatty flavor characteristics to the chili fruits.
The sensory flavor characteristics of the five volatile compounds with ROAV > 1, as identified by both HS-SPME-GC-MS and HS-SPME-GC × GC-TOFMS techniques, were analyzed. Flavor wheels were constructed to illustrate the correlation between these volatiles and their sensory perceptions (Fig. 5a). The primary aromatic notes of pepper fruit encompass eight distinct categories: cucumber, green, pea, fatty, woody, floral, nut, and green bell pepper. Among them, green, pea, and fatty correspond to two different volatile substances respectively, cucumber, green bell pepper, nut, floral and woody correspond to only one substance.
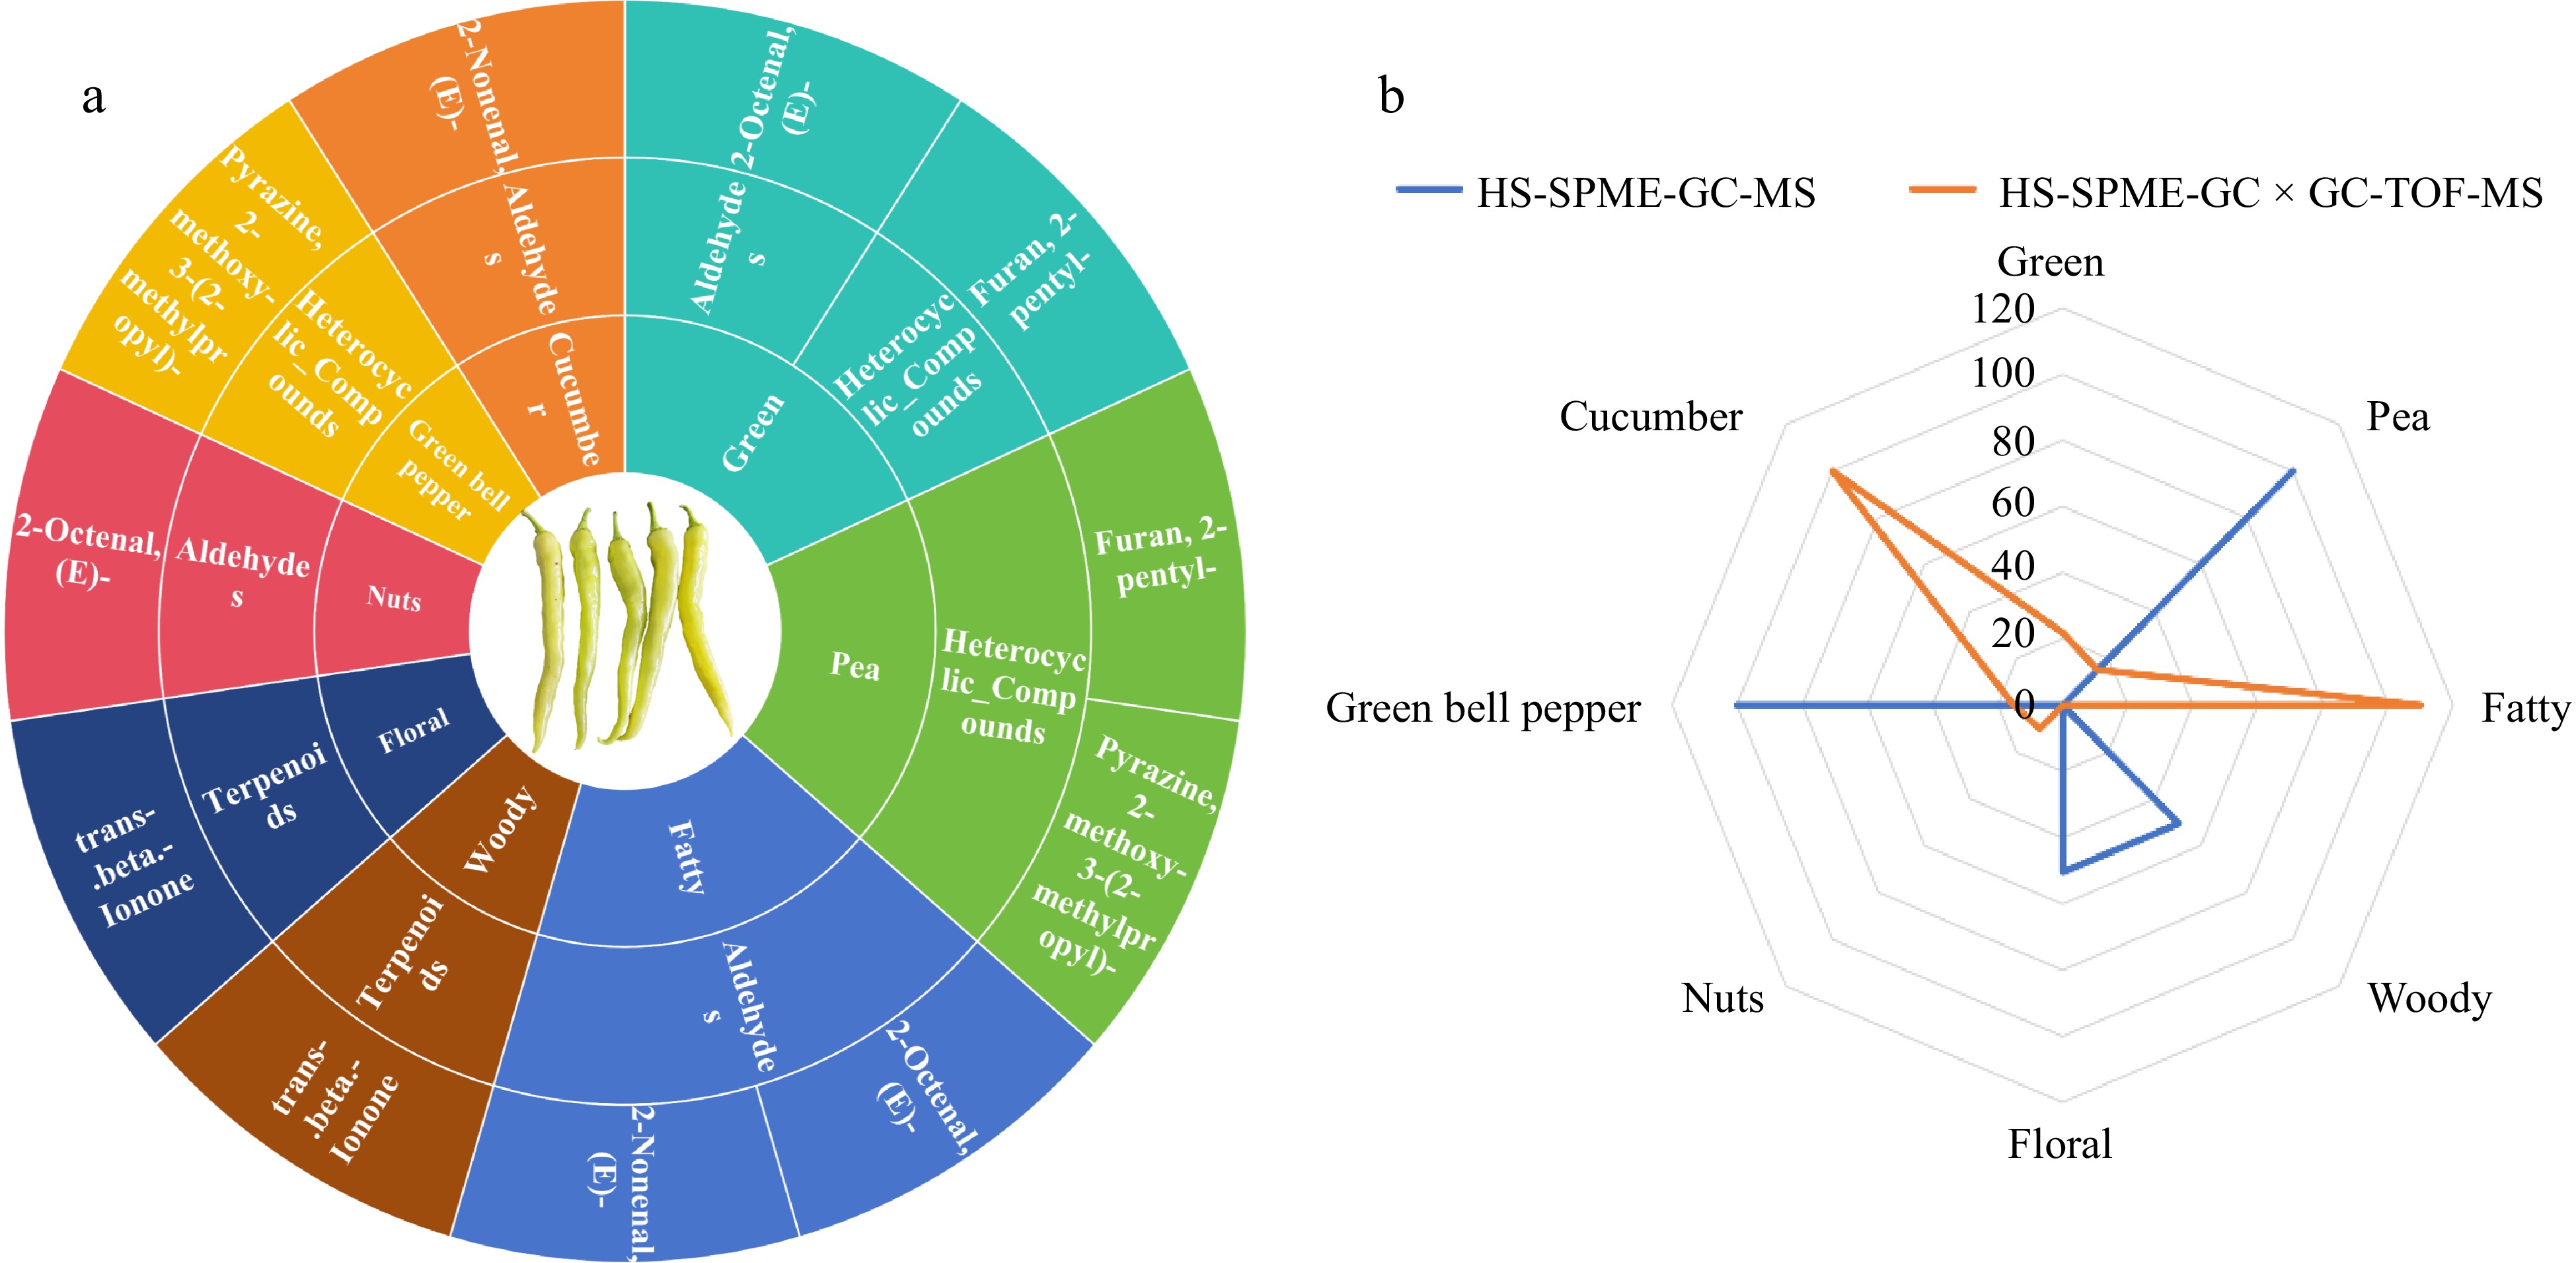
Figure 5.
Analysis of the five main aroma VOCs in capsicum. (a) Flavor wheel of the five main aroma VOCs in chili. The outermost ring represents the name of the volatile organic compound, the middle ring represents the corresponding classification of the volatile organic compound, and the innermost ring represents the aroma characteristics of the volatile organic compound. (b) Radar map for analysis of sensory flavor characteristics of the five main aroma VOCs in chili. The outermost ring represents the sensory flavor characteristics, and the broken line represents the cumulative contribution rate of ROAV of the corresponding type.
To delve deeper into the sensory flavor characteristics of chili fruits as revealed by two distinct detection methods, this study crafted a radar chart to map out the sensory flavor profiles (Fig. 5b) based on the ROAV contribution values of different flavor characteristics. Among the VOCs identified by the HS-SPME-GC × GC-TOFMS technique, the fatty aroma substance had the highest ROAV contribution with a cumulative contribution ROAV of 110.00, followed by cucumber (cumulative ROAV contribution of 100.00). Among the VOCs identified by HS-SPME-GC-MS technique, the largest ROAV contribution was for pea flavor and green bell pepper flavor substances, both of which had a cumulative ROAV contribution of 100.00, followed by woody and floral aromas (cumulative ROAV contribution of 50.51). The above results indicated that among the major aromas of chili fruits, fatty, pea, cucumber and green bell pepper flavors were the major aroma types.
To explore the aroma of chili fruits in more detail, 12 volatiles identified as 0.1 < ROAV ≤ 1 by two assays, HS-SPME-GC-MS and HS-SPME-GC × GC-TOFMS, were subjected to sensory flavor characterization, and the flavor wheels corresponding to volatile compounds, and their sensory flavors were established (Fig. 6a). As can be seen from the figure, the modified aroma of chili fruits was more diverse than the main aroma of chili fruits, with 13 main types of flavor profiles: fruity, green, fatty, sweet, spicy, mushroom, thujone, waxy, nut, garlicy, sulfury, floral, and coffee. In terms of the number of VOCs corresponding to different aroma types, the composition of fruity flavor was richer, corresponding to five volatile compounds, green flavor to four, and both fatty and sweet flavors to three substances. The coffee, floral, sulfury, garlicy and nut flavors were composed of only one substance. In terms of the composition of VOCs types for different flavor types, different types of compounds are covered by different flavor types. The fruity flavor profile of chili fruits is characterized by a complex composition that includes aldehydes, ketones, nitrogen compounds, and heterocyclic compounds. The green flavor profile is similarly composed of aldehydes, ketones, and heterocyclic compounds. In contrast, the fatty flavor profile is exclusively made up of aldehydes. It is noteworthy that unpleasant pungent, garlicky and sulfury flavors appeared in the modified aroma of chili fruits, and these unpleasant flavors were mainly determined by dodecanenitrile, 3-Octen-2-one, (E)-, and dimethyl trisulfide compounds.
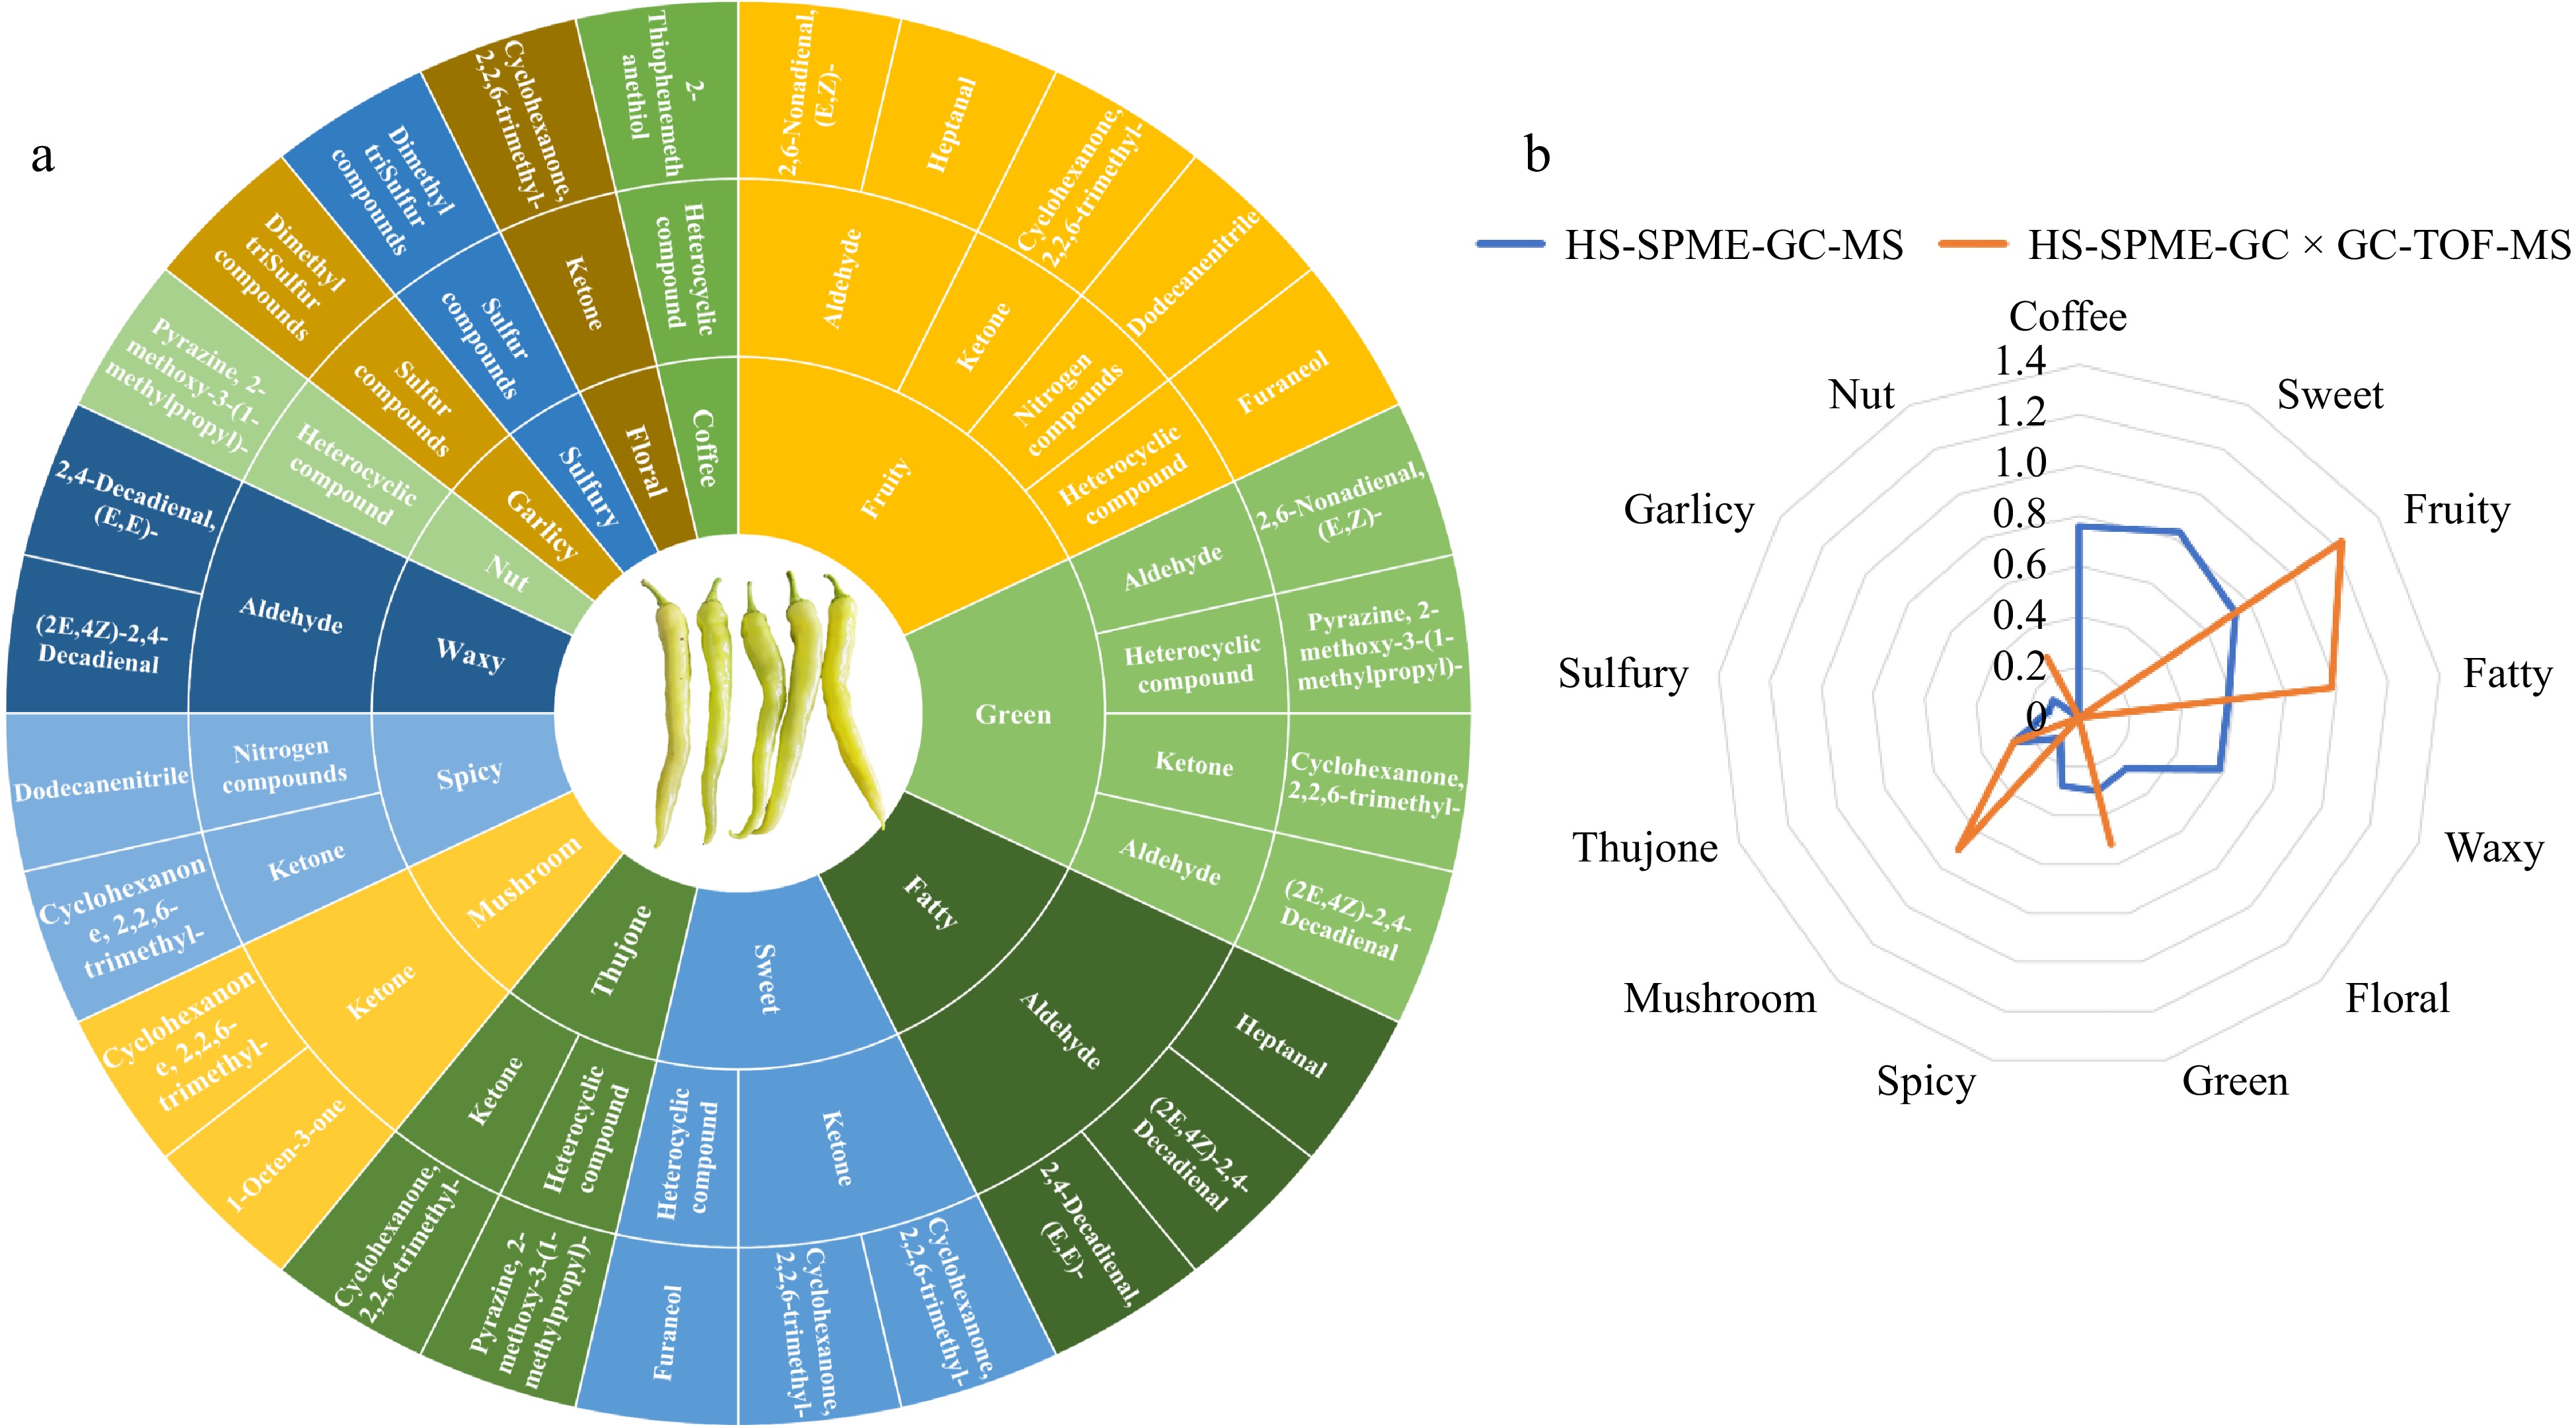
Figure 6.
Analysis of 12 kinds of modified aroma VOCs in chili. (a) Twelve flavor wheels that modify the aroma VOCs in chili peppers. The outermost ring represents the name of the volatile organic compound, the middle ring represents the corresponding classification of the volatile organic compound, and the innermost ring represents the aroma characteristics of the volatile organic compound. (b) Radar map for analysis of sensory flavor characteristics of 12 modified aroma VOCs in chili. The outermost ring represents the sensory flavor characteristics, and the broken line represents the cumulative contribution rate of ROAV of the corresponding type.
The investigation further scrutinized the 12 nuanced aromas unveiled by dual detection methodologies, and sensory flavor feature radar charts grounded on the ROAV contribution values of disparate flavor characteristics were crafted (Fig. 6b). Among the VOCs identified by the HS-SPME-GC × GC-TOFMS technique, those contributing to fruity aromas commanded the highest ROAV, with a collective contribution of 1.23, while fatty aroma compounds followed with a cumulative ROAV of 0.98. In contrast, the HS-SPME-GC-MS technique identified sweet aromas as having the foremost ROAV contribution at 0.83, succeeded by coffee and fruity aromas, which registered cumulative ROAVs of 0.76 and 0.73, respectively. This analysis reveals that fruity, fatty, and coffee aromas serve as the principal modifying aromas in chili pepper fruits, which, in synergy with the core aromas, forge the distinctive olfactory signature of the chili fruits.
-
The flavor profile of chili peppers is a composite of their taste and aroma[30]. The taste is primarily influenced by the presence of sugars, organic acids, and capsaicin within the fruit, with capsaicinoids being responsible for the characteristic spiciness[31]. The aroma is shaped by the variety, relative concentration, and synergistic interactions of VOCs[32]. Investigating the volatile compound composition in chili peppers is crucial for enhancing the fruit's flavor quality. In recent years, advancements in detection technologies have brought VOCs to the forefront of research interest. However, current research has focused on volatile flavor compounds in processed chili peppers such as chili powder[33], chili sauce[34], dried chili peppers[35], and fermented chili peppers[36,37]. Research into the composition and regulatory mechanisms of volatile flavor compounds in fresh chili peppers remain notably limited. To tackle this gap in research, our study conducted a systematic analysis of the VOCs profiles and aromatic sensory characteristics of pepper fruits. This study employed two distinct techniques for detecting volatile substances HS-SPME-GC-MS and HS-SPME-GC × GC-TOFMS, with the fruits of 'Qujiao 5' as the object.
GC-MS is a widely recognized technique for analyzing VOCs in samples[38,39], and HS-SPME is celebrated for its convenience as a VOC sampling instrument. Their increasing integration in fields like food and horticultural plant analysis underscores their utility[40]. Previous studies have utilized this technology to investigate the volatile flavor compounds present in various types of chili peppers. For instance, Sousa et al.[41] identified a total of 34 compounds in three different varieties of chili peppers, including hexyl valerate, dimethyl cyclohexanol, humulus ene, and butyrate. Similarly, Cuevas-Glory et al.[42] employed optimized extraction conditions to identify 53 compounds in Havana pepper. Additionally, Garruti et al.[43] detected a total of 35 odor substances. In this study, 773 types of VOCs were obtained from the detection of chili fruits using HS-SPME-GC-MS technology. This figure surpasses the variety and quantity reported in prior studies, indicating a notable advancement in detection capabilities. Three primary factors may account for this increase. The preliminary analysis suggests that the 'Qujiao 5' chili variety may possess a richer aromatic profile and a more diverse array of VOCs than previously studied chili types. Additionally, the advanced instrumentation employed in our HS-SPME-GC-MS analysis likely contributed to the detection of a wider spectrum of compounds. Furthermore, the substance identification in this research was supported by an expanded plant-specific target metabolite database, providing broader coverage and more precise identification capabilities than earlier reference databases. Moreover, this study employed cutting-edge HS-SPME-GC × GC-TOFMS technology to further dissect the volatile profile of the same samples. The combination of HS-SPME and GC × GC-TOFMS offers a robust analytical approach for dissecting the intricate array of volatiles across diverse matrices, delivering a heightened sensitivity that facilitates the direct comparison and detailed visualization of plant volatiles[44]. The qualitative substance count achieved through this method surpasses conventional GC-MS identifications by several to dozens of times. The findings aligned with expectations, revealing that HS-SPME-GC × GC-TOFMS identified 160 more VOC species than HS-SPME-GC-MS. Notably, however, only 150 substances were commonly detected by both techniques, constituting less than 10% of the total number of identified substances. This discrepancy diverges from our initial assumptions and may stem from variations in the databases utilized by each technique, as well as differences in the scope of their reference databases. This suggests that relying on a single detection method has its constraints when it comes to investigating VOC compositions. Therefore, employing multiple analytical platforms can provide a more thorough elucidation of the volatile flavor constituents in chili fruits.
Human olfactory perception of volatile compounds is influenced by the timing of their release from the matrix and the distinct odor profiles of the compounds themselves[45]. Despite the presence of numerous volatile compounds, only a select few significantly contribute to the overall perceived odor[46,47]. Moreover, these molecules vary in their impact on the sample's flavor profile, with the ROAV providing a more accurate assessment of an individual flavor component's contribution to the overall flavor. Components with a higher ROAV value have a more significant influence on the sample's overall flavor profile[48]. VOCs with a ROAV > 1 are typically regarded as the key flavor contributors in the samples[49], while those with an 0.1 < ROAV ≤ 1 serve as modifiers, subtly shaping the overall flavor nuances of the samples[50]. In this study, five main VOCs affecting the sensory aroma of chili fruits were screened by the criterion of ROAV > 1. In addition, 12 modifying VOCs affecting the background aroma of chili fruits were screened by the criterion of 0.1 < ROAV ≤ 1. The aromatic profile of chili fruits was meticulously examined through the creation of flavor wheels and the development of radar charts that depict the sensory characteristics of flavor, and it was found that the same class of substances had similar sensory flavors, aldehydes have fatty and green sensory flavor characteristics, β-ionone has floral and woody aromas[51], and ketones also have some pleasant aromas. The variety and concentration of volatile compounds differ among chili pepper species, leading to distinct aromas. It is posited that the characteristic scent of chili peppers emerges from the synergistic effects of multiple volatile elements. This study found that Pyrazine, 2-methoxy-3-(2-methylpropyl)- and 2-Nonenal, (E)- are two key VOCs in the formation of pepper fruit aroma. Among them, Pyrazine, 2-methoxy-3-(2-methylpropyl)- provides green bell pepper and pea aroma, while 2-Nonenal, (E)- provides fatty and cucumber aroma, both of which have a positive effect on improving pepper flavor. Pyrazine, 2-methoxy-3-(2-methylpropyl)- was detected in both technologies and has relatively high ROAV values. This compound is a significant contributor to the aroma of chili fruits, aligning with the findings of Buttery et al.[52], and is acknowledged as one of the quintessential volatile components of chili peppers. The flavor wheel and sensory radar charts reveal that the predominant aroma of 'Qujiao 5' chili pepper fruit is green, fatty and green bell pepper flavor, with both floral and sweet flavors.
-
The investigation of VOCs in pepper fruits holds considerable scientific value for enhancing flavor quality and breeding superior varieties. This study utilized the 'Qujiao 5' chili pepper as a subject, comparing and analyzing results from two detection methods: HS-SPME-GC-MS and HS-SPME-GC × GC-TOFMS. We systematically explored the sensory and aromatic characteristics of chili pepper fruits, identifying key VOCs: Pyrazine, 2-methoxy-3-(2-methylpropyl)- and 2-Nonenal, (E)-. It was found that the predominant aroma of 'Qujiao 5' chili pepper fruit is green, fatty, and green bell pepper flavor, with both floral and sweet flavors. Future research will focus on a more in-depth exploration and practical application of the principal VOCs uncovered in this study. The expected results of this study are set to lay a foundational framework for further exploration into the volatile flavor compounds, sensory qualities, and metabolic regulation of horticultural crops, with a particular focus on chili peppers. Additionally, this research seeks to provide theoretical insights and practical recommendations to improve breeding, cultivation, and production practices for high-quality chili peppers.
-
The authors confirm contributions to the paper as follows: study conception and design: Wang H, Cheng Y; wrote the manuscript: Ji C, Guan S; methodology and data analysis: Liu C, Yu C, Wan H; revised the manuscript: Yao Z, Ye Q, Zhou G. All authors reviewed the final version of this draft and granted approval for its publication.
-
All data generated or analyzed during this study are included in this published article and its supplementary information files.
This work was supported by the National Natural Science Foundation of China (32172555, 31772294), Key Research and Development Program of Zhejiang (2021C02052), Zhejiang Provincial major Agricultural Science and Technology Projects of New Varieties Breeding (2016C02051).
-
The authors declare that they have no conflict of interest.
-
# Authors contributed equally: Chenxi Ji, Sihui Guan
- Supplemental Table S1 (1) VOCs detected by HS-SPME-GC-MS technology; (2) VOCs detected by HS-SPME-GC × GC-TOFMS technology; (3) Common VOCs detected by HS-SPME-GC-MS and HS-SPME-GC × GC-TOFMS.
- Copyright: © 2024 by the author(s). Published by Maximum Academic Press, Fayetteville, GA. This article is an open access article distributed under Creative Commons Attribution License (CC BY 4.0), visit https://creativecommons.org/licenses/by/4.0/.
-
About this article
Cite this article
Ji C, Guan S, Liu C, Yu C, Yao Z, et al. 2024. Detection and analysis of VOCs in chili pepper based on HS-SPME-GC × GC-TOFMS and HS-SPME-GC-MS techniques. Vegetable Research 4: e021 doi: 10.48130/vegres-0024-0019 

Detection and analysis of VOCs in chili pepper based on HS-SPME-GC × GC-TOFMS and HS-SPME-GC-MS techniques
- Received: 27 March 2024
- Revised: 28 April 2024
- Accepted: 07 May 2024
- Published online: 05 July 2024
Abstract: Chili pepper (Capsicum annuum L.) is highly preferred by consumers owing to its distinctive flavor. Volatile organic compounds (VOCs) significantly influences the aromatic characteristics of chili peppers, thereby impacting their overall fruit quality. The study of chili pepper aroma remains at a nascent stage, with a notable gap in the literature regarding the composition and metabolic regulation of volatile flavor compounds in fresh chili peppers. This study focuses on the pepper cultivar var 'Qujiao 5' with rich fruit aroma, using headspace solid-phase microextraction full two-dimensional gas chromatography time of flight mass spectrometry (HS-SPME-GC × GC-TOFMS) and headspace solid-phase microextraction gas chromatography-mass spectrometry (HS-SPME-GC-MS) detection technology platforms to analyze the VOCs present in green ripe pepper. A total of 1,558 VOCs were successfully identified. Utilizing the HS-SPME-GC × GC-TOFMS method pinpointed 933 substances, whereas the HS-SPME-GC-MS approach detected 773 compounds. Moreover, the two methods together identified 150 substances. Through the meticulous analysis of relative odor activity values (ROAV), it was conclusively determined that Pyrazine, 2-methoxy-3-(2-methylpropyl)- and 2-Nonenal, (E)- serve as pivotal volatile flavor compounds in chili fruit. Through the analysis of sensory flavor characteristics of chili peppers, it was found that fresh chili peppers have the main aroma characteristics of fatty, green bell pepper, and green, while also possessing modified odors such as floral and sweet. This research undertook a thorough comparative analysis of two different detection methods. It also meticulously examined the compositional and sensory attributes of the pepper VOCs, providing an essential reference for subsequent studies on the development of pepper fruit flavor quality.
-
Key words:
- Chili peppers /
- VOCs /
- HS-SPME-GC×GC-TOFMS /
- HS-SPME-GC-MS /
- ROAV /
- Sensory aroma characteristics