COMMENTARY   Open Access    

Taiji loop composed of circadian component mediates photoperiodism in soybean

More Information
  • Received: 21 May 2024
    Revised: 08 July 2024
    Accepted: 22 July 2024
    Published online: 19 August 2024
    Seed Biology  3 Article number: e014 (2024)  |  Cite this article
  • Grapevines are among the most widely grown and economically important fruit crops globally. Grapes are used not only for wine making and juice, but also are consumed fresh and as dried fruit[1]. Additionally, grapes have been increasingly recognized as an important source of resveratrol (trans-3, 5,4'-trihydroxystilbene), a non-flavonoid stilbenoid polyphenol that in grapevine may act as a phytoalexin. In humans, it has been widely reported that dietary resveratrol has beneficial impacts on various aspects of health[2, 3]. Because of the potential value of resveratrol both to grapevine physiology and human medicine, resveratrol biosynthesis and its regulation has become an important avenue of research. Similar to other stilbenoids, resveratrol synthesis utilizes key enzymes of the phenylpropanoid pathway including phenylalanine ammonia lyase (PAL), cinnamate 4-hydroxylase (C4H), and 4-coumarate-CoA ligase (4CL). In the final steps, stilbene synthase (STS), a type II polyketide synthase, produces trans-resveratrol from p-coumaroyl-CoA and malonyl-CoA, while chalcone synthase (CHS) synthesizes flavonoids from the same substrates[4, 5]. Moreover, trans-resveratrol is a precursor for other stilbenoids such as cis-resveratrol, trans-piceid, cis-piceid, ε-viniferin and δ-viniferin[6]. It has been reported that stilbenoid biosynthesis pathways are targets of artificial selection during grapevine domestication[7] and resveratrol accumulates in various structures in response to both biotic and abiotic stresses[812]. This stress-related resveratrol synthesis is mediated, at least partialy, through the regulation of members of the STS gene family. Various transcription factors (TFs) participating in regulating STS genes in grapevine have been reported. For instance, MYB14 and MYB15[13, 14] and WRKY24[15] directly bind to the promoters of specific STS genes to activate transcription. VvWRKY8 physically interacts with VvMYB14 to repress VvSTS15/21 expression[16], whereas VqERF114 from Vitis quinquangularis accession 'Danfeng-2' promotes expression of four STS genes by interacting with VqMYB35 and binding directly to cis-elements in their promoters[17]. Aided by the release of the first V. vinifera reference genome assembly[18], genomic and transcriptional studies have revealed some of the main molecular mechanisms involved in fruit ripening[1924] and stilbenoid accumulation[8, 25] in various grapevine cultivars. Recently, it has been reported that a root restriction treatment greatly promoted the accumulation of trans-resveratrol, phenolic acid, flavonol and anthocyanin in 'Summer Black' (Vitis vinifera × Vitis labrusca) berry development during ripening[12]. However, most of studies mainly focus on a certain grape variety, not to investigate potential distinctions in resveratrol biosynthesis among different Vitis genotypes. In this study, we analyzed the resveratrol content in seven grapevine accessions and three berry structures, at three stages of fruit development. We found that the fruits of two wild, Chinese grapevines, Vitis amurensis 'Tonghua-3' and Vitis davidii 'Tangwei' showed significant difference in resveratrol content during development. These were targeted for transcriptional profiling to gain insight into the molecular aspects underlying this difference. This work provides a theoretical basis for subsequent systematic studies of genes participating in resveratrol biosynthesis and their regulation. Further, the results should be useful in the development of grapevine cultivars exploiting the genetic resources of wild grapevines. For each of the seven cultivars, we analyzed resveratrol content in the skin, pulp, and seed at three stages of development: Green hard (G), véraison (V), and ripe (R) (Table 1). In general, we observed the highest accumulation in skins at the R stage (0.43−2.99 µg g−1 FW). Lesser amounts were found in the pulp (0.03−0.36 µg g−1 FW) and seed (0.05−0.40 µg g−1 FW) at R, and in the skin at the G (0.12−0.34 µg g−1 FW) or V stages (0.17−1.49 µg g−1 FW). In all three fruit structures, trans-resveratrol showed an increasing trend with development, and this was most obvious in the skin. It is worth noting that trans-resveratrol was not detectable in the skin of 'Tangwei' at the G or V stage, but had accumulated to 2.42 µg g−1 FW by the R stage. The highest amount of extractable trans-resveratrol (2.99 µg g−1 FW) was found in 'Tonghua-3' skin at the R stage.
    Table 1.  Resveratrol concentrations in the skin, pulp and seed of berries from different grapevine genotypes at green hard, véraison and ripe stages.
    StructuresSpeciesAccessions or cultivarsContent of trans-resveratrol (μg g−1 FW)
    Green hardVéraisonRipe
    SkinV. davidiiTangweindnd2.415 ± 0.220
    V. amurensisTonghua-30.216 ± 0.0410.656 ± 0.0432.988 ± 0.221
    Shuangyou0.233 ± 0.0620.313 ± 0.0172.882 ± 0.052
    V. amurensis × V. ViniferaBeibinghong0.336 ± 0.0761.486 ± 0.1771.665 ± 0.100
    V. viniferaRed Global0.252 ± 0.0510.458 ± 0.0571.050 ± 0.129
    Thompson seedless0.120 ± 0.0251.770 ± 0.0320.431 ± 0.006
    V. vinifera × V. labruscaJumeigui0.122 ± 0.0160.170 ± 0.0210.708 ± 0.135
    PulpV. davidiiTangwei0.062 ± 0.0060.088 ± 0.009nd
    V. amurensisTonghua-30.151 ± 0.0660.324 ±0.1040.032 ± 0.004
    Shuangyou0.053 ± 0.0080.126 ± 0.0440.041 ± 0.017
    V. amurensis × V. ViniferaBeibinghong0.057 ± 0.0140.495 ± 0.0680.087 ± 0.021
    V. viniferaRed Global0.059 ± 0.0180.159 ± 0.0130.027 ± 0.004
    Thompson seedless0.112 ± 0.0160.059 ± 0.020nd
    V. vinifera × V. labruscaJumeigui0.072 ± 0.0100.063 ± 0.0170.359 ± 0.023
    SeedV. davidiiTangwei0.096 ± 0.0140.169 ± 0.0280.049 ± 0.006
    V. amurensisTonghua-30.044 ± 0.0040.221 ± 0.0240.113 ± 0.027
    Shuangyound0.063 ± 0.0210.116 ± 0.017
    V. amurensis × V. ViniferaBeibinghongnd0.077 ± 0.0030.400 ± 0.098
    V. viniferaRed Global0.035 ± 0.0230.142 ± 0.0360.199 ± 0.009
    Thompson seedless
    V. vinifera × V. labruscaJumeigui0.077 ± 0.0250.017 ± 0.0040.284 ± 0.021
    'nd' indicates not detected in samples, and '−' shows no samples are collected due to abortion.
     | Show Table
    DownLoad: CSV
    To gain insight into gene expression patterns influencing resveratrol biosynthesis in 'Tangwei' and 'Tonghua-3', we profiled the transcriptomes of developing berries at G, V, and R stages, using sequencing libraries representing three biological replicates from each cultivar and stage. A total of 142.49 Gb clean data were obtained with an average of 7.92 Gb per replicate, with average base Q30 > 92.5%. Depending on the sample, between 80.47%−88.86% of reads aligned to the V. vinifera reference genome (Supplemental Table S1), and of these, 78.18%−86.66% mapped to unique positions. After transcript assembly, a total of 23,649 and 23,557 unigenes were identified as expressed in 'Tangwei' and 'Tonghua-3', respectively. Additionally, 1,751 novel transcripts were identified (Supplemental Table S2), and among these, 1,443 could be assigned a potential function by homology. Interestingly, the total number of expressed genes gradually decreased from the G to R stage in 'Tangwei', but increased in 'Tonghua-3'. About 80% of the annotated genes showed fragments per kilobase of transcript per million fragments mapped (FPKM) values > 0.5 in all samples, and of these genes, about 40% showed FPKM values between 10 and 100 (Fig. 1a). Correlation coefficients and principal component analysis of the samples based on FPKM indicated that the biological replicates for each cultivar and stage showed similar properties, indicating that the transcriptome data was reliable for further analyses (Fig. 1b & c).
    Figure 1.  Properties of transcriptome data of 'Tangwei' (TW) and 'Tonghua-3' (TH) berry at green hard (G), véraison (V), and ripe (R) stages. (a) Total numbers of expressed genes with fragments per kilobase of transcript per million fragments mapped (FPKM) values; (b) Heatmap of the sample correlation analysis; (c) Principal component analysis (PCA) showing clustering pattern among TW and TH at G, V and R samples based on global gene expression profiles.
    By comparing the transcriptomes of 'Tangwei' and 'Tonghua-3' at the G, V and R stages, we identified 6,770, 3,353 and 6,699 differentially expressed genes (DEGs), respectively (Fig. 2a). Of these genes, 1,134 were differentially expressed between the two cultivars at all three stages (Fig. 2b). We also compared transcriptional profiles between two adjacent developmental stages (G vs V; V vs R) for each cultivar. Between G and V, we identified 1,761 DEGs that were up-regulated and 2,691 DEGs that were down-regulated in 'Tangwei', and 1,836 and 1,154 DEGs that were up-regulated or down-regulated, respectively, in 'Tonghua-3'. Between V and R, a total of 1,761 DEGs were up-regulated and 1,122 DEGs were down-regulated in 'Tangwei', whereas 2,774 DEGs and 1,287 were up-regulated or down-regulated, respectively, in 'Tonghua-3' (Fig. 2c). Among the 16,822 DEGs between the two cultivars at G, V, and R (Fig. 2a), a total of 4,570, 2,284 and 4,597 had gene ontology (GO) annotations and could be further classified to over 60 functional subcategories. The most significantly represented GO terms between the two cultivars at all three stages were response to metabolic process, catalytic activity, binding, cellular process, single-organism process, cell, cell part and biological regulation (Fig. 2d).
    Figure 2.  Analysis of differentially expressed genes (DEGs) at the green hard (G), véraison (V), and ripe (R) stages in 'Tangwei' (TW) and 'Tonghua-3' (TH). (a) Number of DEGs and (b) numbers of overlapping DEGs between 'Tangwei' and 'Tonghua-3' at G, V and R; (c) Overlap among DEGs between G and V, and V and R, for 'Tangwei' and 'Tonghua-3'; (d) Gene ontology (GO) functional categorization of DEGs.
    We also identified 57 Kyoto Encyclopedia of Genes and Genomes (KEGG) pathways that were enriched, of which 32, 28, and 31 were enriched at the G, V, and R stages, respectively. Seven of the KEGG pathways were enriched at all three developmental stages: photosynthesis-antenna proteins (ko00196); glycine, serine and threonine metabolism (ko00260); glycolysis/gluconeogenesis (ko00010); carbon metabolism (ko01200); fatty acid degradation (ko00071); cysteine and methionine metabolism (ko00270); and valine, leucine and isoleucine degradation (ko00280) (Supplemental Tables S3S5). Furthermore, we found that the predominant KEGG pathways were distinct for each developmental stage. For example, phenylpropanoid biosynthesis (ko00940) was enriched only at the R stage. Overall, the GO and KEGG pathway enrichment analysis showed that the DEGs in 'Tangwei' and 'Tonghua-3' were enriched for multiple biological processes during the three stages of fruit development. We then analyzed the expression of genes with potential functions in resveratrol and flavonoid biosynthesis between the two cultivars and three developmental stages (Fig. 3 and Supplemental Table S6). We identified 30 STSs, 13 PALs, two C4Hs and nine 4CLs that were differentially expressed during at least one of the stages of fruit development between 'Tangwei' and 'Tonghua-3'. Interestingly, all of the STS genes showed increasing expression with development in both 'Tangwei' and 'Tonghua-3'. In addition, the expression levels of STS, C4H and 4CL genes at V and R were significantly higher in 'Tonghua-3' than in 'Tangwei'. Moreover, 25 RESVERATROL GLUCOSYLTRANSFERASE (RSGT), 27 LACCASE (LAC) and 21 O-METHYLTRANSFERASE (OMT) DEGs were identified, and most of these showed relatively high expression at the G and V stages in 'Tangwei' or R in 'Tonghua-3'. It is worth noting that the expression of the DEGs related to flavonoid biosynthesis, including CHS, FLAVONOL SYNTHASE (FLS), FLAVONOID 3′-HYDROXYLASE (F3'H), DIHYDROFLAVONOL 4-REDUCTASE (DFR), ANTHOCYANIDIN REDUCTASE (ANR) and LEUCOANTHOCYANIDIN REDUCTASE (LAR) were generally higher in 'Tangwei' than in 'Tonghua-3'at G stage.
    Figure 3.  Expression of differentially expressed genes (DEGs) associated with phenylalanine metabolism. TW, 'Tangwei'; TH, 'Tonghua-3'. PAL, PHENYLALANINE AMMONIA LYASE; C4H, CINNAMATE 4-HYDROXYLASE; 4CL, 4-COUMARATE-COA LIGASE; STS, STILBENE SYNTHASE; RSGT, RESVERATROL GLUCOSYLTRANSFERASE; OMT, O-METHYLTRANSFERASE; LAC, LACCASE; CHS, CHALCONE SYNTHASE; CHI, CHALCONE ISOMERASE; F3H, FLAVANONE 3-HYDROXYLASE; FLS, FLAVONOL SYNTHASE; F3'H, FLAVONOID 3′-HYDROXYLASE; DFR, DIHYDROFLAVONOL 4-REDUCTASE; LAR, LEUCOANTHOCYANIDIN REDUCTASE; ANR, ANTHOCYANIDIN REDUCTASE; LDOX, LEUCOANTHOCYANIDIN DIOXYGENASE; UFGT, UDP-GLUCOSE: FLAVONOID 3-O-GLUCOSYLTRANSFERASE.
    Among all DEGs identified in this study, 757 encoded potential TFs, and these represented 57 TF families. The most highly represented of these were the AP2/ERF, bHLH, NAC, WRKY, bZIP, HB-HD-ZIP and MYB families with a total of 76 DEGs (Fig. 4a). We found that the number of downregulated TF genes was greater than upregulated TF genes at G and V, and 48 were differentially expressed between the two cultivars at all three stages (Fig. 4b). Several members of the ERF, MYB, WRKY and bHLH families showed a strong increase in expression at the R stage (Fig. 4c). In addition, most of the TF genes showed > 2-fold higher expression in 'Tonghua-3' than in 'Tangwei' at the R stage. In particular, a few members, such as ERF11 (VIT_07s0141g00690), MYB105 (VIT_01s0026g02600), and WRKY70 (VIT_13s0067g03140), showed > 100-fold higher expression in 'Tonghua-3' (Fig. 4d).
    Figure 4.  Differentially expressed transcription factor (TF) genes. (a) The number of differentially expressed genes (DEGs) in different TF families; (b) Number of differentially expressed TF genes, numbers of overlapping differentially expressed TF genes, and (c) categorization of expression fold change (FC) for members of eight TF families between 'Tangwei' and 'Tonghua-3' at green hard (G), véraison (V), and ripe (R) stages; (d) Heatmap expression profiles of the three most strongly differentially expressed TF genes from each of eight TF families.
    We constructed a gene co-expression network using the weighted gene co-expression network analysis (WGCNA) package, which uses a systems biology approach focused on understanding networks rather than individual genes. In the network, 17 distinct modules (hereafter referred to by color as portrayed in Fig. 5a), with module sizes ranging from 91 (antiquewhite4) to 1,917 (magenta) were identified (Supplemental Table S7). Of these, three modules (ivory, orange and blue) were significantly correlated with resveratrol content, cultivar ('Tonghua-3'), and developmental stage (R). The blue module showed the strongest correlation with resveratrol content (cor = 0.6, p-value = 0.008) (Fig. 5b). KEGG enrichment analysis was carried out to further analyze the genes in these three modules. Genes in the ivory module were significantly enriched for phenylalanine metabolism (ko00360), stilbenoid, diarylheptanoid and gingerol biosynthesis (ko00945), and flavonoid biosynthesis (ko00941), whereas the most highly enriched terms of the blue and orange modules were plant-pathogen interaction (ko04626), plant hormone signal transduction (ko04075) and circadian rhythm-plant (ko04712) (Supplemental Fig. S1). Additionally, a total of 36 genes encoding TFs including in 15 ERFs, 10 WRKYs, six bHLHs, two MYBs, one MADs-box, one HSF and one TRY were identified as co-expressed with one or more STSs in these three modules (Fig. 5c and Supplemental Table S8), suggesting that these TFs may participate in the STS regulatory network.
    Figure 5.  Results of weighted gene co-expression network analysis (WGCNA). (a) Hierarchical clustering tree indicating co-expression modules; (b) Module-trait relationship. Each row represents a module eigengene, and each column represents a trait. The corresponding correlation and p-value are indicated within each module. Res, resveratrol; TW, 'Tangwei'; TH, 'Tonghua-3'; (c) Transcription factors and stilbene synthase gene co-expression networks in the orange, blue and ivory modules.
    To assess the reliability of the RNA-seq data, 12 genes determined to be differentially expressed by RNA-seq were randomly selected for analysis of expression via real-time quantitative PCR (RT-qPCR). This set comprised two PALs, two 4CLs, two STSs, two WRKYs, two LACs, one OMT, and MYB14. In general, these RT-qPCR results strongly confirmed the RNA-seq-derived expression patterns during fruit development in the two cultivars. The correlation coefficients between RT-qPCR and RNA-seq were > 0.6, except for LAC (VIT_02s0154g00080) (Fig. 6).
    Figure 6.  Comparison of the expression patterns of 12 randomly selected differentially expressed genes by RT-qPCR (real-time quantitative PCR) and RNA-seq. R-values are correlation coefficients between RT-qPCR and RNA-seq. FPKM, fragments per kilobase of transcript per million fragments mapped; TW, 'Tangwei'; TH, 'Tonghua-3'; G, green hard; V, véraison; R, ripe.
    Grapevines are among the most important horticultural crops worldwide[26], and recently have been the focus of studies on the biosynthesis of resveratrol. Resveratrol content has previously been found to vary depending on cultivar as well as environmental stresses[27]. In a study of 120 grape germplasm cultivars during two consecutive years, the extractable amounts of resveratrol in berry skin were significantly higher in seeded cultivars than in seedless ones, and were higher in both berry skin and seeds in wine grapes relative to table grapes[28]. Moreover, it was reported that total resveratrol content constantly increased from véraison to complete maturity, and ultraviolet-C (UV-C) irradiation significantly stimulated the accumulation of resveratrol of berry during six different development stages in 'Beihong' (V. vinifera × V. amurensis)[9]. Intriguingly, a recent study reported that bud sport could lead to earlier accumulation of trans-resveratrol in the grape berries of 'Summer Black' and its bud sport 'Nantaihutezao' from the véraison to ripe stages[29]. In the present study, resveratrol concentrations in seven accessions were determined by high performance liquid chromatography (HPLC) in the seed, pulp and skin at three developmental stages (G, V and R). Resveratrol content was higher in berry skins than in pulp or seeds, and were higher in the wild Chinese accessions compared with the domesticated cultivars. The highest resveratrol content (2.99 µg g−1 FW) was found in berry skins of 'Tonghua-3' at the R stage (Table 1). This is consistent with a recent study of 50 wild Chinese accessions and 45 cultivars, which reported that resveratrol was significantly higher in berry skins than in leaves[30]. However, we did not detect trans-resveratrol in the skins of 'Tangwei' during the G or V stages (Table 1). To explore the reason for the difference in resveratrol content between 'Tangwei' and 'Tonghua-3', as well as the regulation mechanism of resveratrol synthesis and accumulation during berry development, we used transcriptional profiling to compare gene expression between these two accessions at the G, V, and R stages. After sequence read alignment and transcript assembly, 23,649 and 23,557 unigenes were documented in 'Tangwei' and 'Tonghua-3', respectively. As anticipated, due to the small number of structures sampled, this was less than that (26,346) annotated in the V. vinifera reference genome[18]. Depending on the sample, 80.47%−88.86% of sequence reads aligned to a single genomic location (Supplemental Table S1); this is similar to the alignment rate of 85% observed in a previous study of berry development in Vitis vinifera[19]. Additionally, 1751 novel transcripts were excavated (Supplemental Table S2) after being compared with the V. vinifera reference genome annotation information[18, 31]. A similar result was also reported in a previous study when transcriptome analysis was performed to explore the underlying mechanism of cold stress between Chinese wild Vitis amurensis and Vitis vinifera[32]. We speculate that these novel transcripts are potentially attributable to unfinished V. vinifera reference genome sequence (For example: quality and depth of sequencing) or species-specific difference between Vitis vinifera and other Vitis. In our study, the distribution of genes based on expression level revealed an inverse trend from G, V to R between 'Tangwei' and 'Tonghua-3' (Fig. 1). Furthermore, analysis of DEGs suggested that various cellular processes including metabolic process and catalytic activity were altered between the two cultivars at all three stages (Fig. 2 and Supplemental Table S3S5). These results are consistent with a previous report that a large number of DEGs and 100 functional subcategories were identified in 'Tonghua-3' grape berries after exposure to UV-C radiation[8]. Resveratrol biosynthesis in grapevine is dependent on the function of STSs, which compete with the flavonoid branch in the phenylalanine metabolic pathway. Among the DEGs detected in this investigation, genes directly involved in the resveratrol synthesis pathway, STSs, C4Hs and 4CLs, were expressed to significantly higher levels in 'Tonghua-3' than in 'Tangwei' during V and R. On the other hand, DEGs representing the flavonoid biosynthesis pathway were upregulated in 'Tangwei', but downregulated in 'Tonghua-3' (Fig. 3 and Supplemental Table S6). These expression differences may contribute to the difference in resveratrol content between the two cultivars at these stages. We note that 'Tangwei' and 'Tonghua-3' are from two highly diverged species with different genetic backgrounds. There might be some unknown genetic differences between the two genomes, resulting in more than 60 functional subcategories being enriched (Fig. 2d) and the expression levels of genes with putative roles in resveratrol biosynthesis being significantly higher in 'Tonghua-3' than in 'Tangwei' during V and R (Fig. 3). A previous proteomic study also reported that the expression profiles of several enzymes in the phenylalanine metabolism pathway showed significant differences between V. quinquangularis accession 'Danfeng-2' and V. vinifera cv. 'Cabernet Sauvignon' at the véraison and ripening stages[33]. In addition, genes such as RSGT, OMT and LAC involved in the production of derivatized products of resveratrol were mostly present at the G and V stages of 'Tangwei', potentially resulting in limited resveratrol accumulation. However, we found that most of these also revealed relatively high expression at R in 'Tonghua-3' (Fig. 3). Despite this situation, which does not seem to be conducive for the accumulation of resveratrol, it still showed the highest content (Table 1). It has been reported that overexpression of two grapevine peroxidase VlPRX21 and VlPRX35 genes from Vitis labruscana in Arabidopsis may be involved in regulating stilbene synthesis[34], and a VqBGH40a belonging to β-glycoside hydrolase family 1 in Chinese wild Vitis quinquangularis can hydrolyze trans-piceid to enhance trans-resveratrol content[35]. However, most studies mainly focus on several TFs that participate in regulation of STS gene expression, including ERFs, MYBs and WRKYs[13, 15, 17]. For example, VvWRKY18 activated the transcription of VvSTS1 and VvSTS2 by directly binding the W-box elements within the specific promoters and resulting in the enhancement of stilbene phytoalexin biosynthesis[36]. VqWRKY53 promotes expression of VqSTS32 and VqSTS41 through participation in a transcriptional regulatory complex with the R2R3-MYB TFs VqMYB14 and VqMYB15[37]. VqMYB154 can activate VqSTS9/32/42 expression by directly binding to the L5-box and AC-box motifs in their promoters to improve the accumulation of stilbenes[38]. In this study, we found a total of 757 TF-encoding genes among the DEGs, including representatives of the MYB, AP2/ERF, bHLH, NAC, WRKY, bZIP and HB-HD-ZIP families. The most populous family was MYB, representing 76 DEGs at G, V and R between 'Tangwei' and 'Tonghua-3' (Fig. 4). A recent report indicated that MYB14, MYB15 and MYB13, a third uncharacterized member of Subgroup 2 (S2), could bind to 30 out of 47 STS family genes. Moreover, all three MYBs could also bind to several PAL, C4H and 4CL genes, in addition to shikimate pathway genes, the WRKY03 stilbenoid co-regulator and resveratrol-modifying gene[39]. VqbZIP1 from Vitis quinquangularis has been shown to promote the expression of VqSTS6, VqSTS16 and VqSTS20 by interacting with VqSnRK2.4 and VqSnRK2.6[40]. In the present study, we found that a gene encoding a bZIP-type TF (VIT_12s0034g00110) was down-regulated in 'Tangwei', but up-regulated in 'Tonghua-3', at G, V and R (Fig. 4). We also identified 36 TFs that were co-expressed with 17 STSs using WGCNA analysis, suggesting that these TFs may regulate STS gene expression (Fig. 5 and Supplemental Table S8). Among these, a STS (VIT_16s0100g00880) was together co-expressed with MYB14 (VIT_07s0005g03340) and WRKY24 (VIT_06s0004g07500) that had been identified as regulators of STS gene expression[13, 15]. A previous report also indicated that a bHLH TF (VIT_11s0016g02070) had a high level of co-expression with STSs and MYB14/15[15]. In the current study, six bHLH TFs were identified as being co-expressed with one or more STSs and MYB14 (Fig. 5 and Supplemental Table S8). However, further work needs to be done to determine the potential role of these TFs that could directly target STS genes or indirectly regulate stilbene biosynthesis by formation protein complexes with MYB or others. Taken together, these results identify a small group of TFs that may play important roles in resveratrol biosynthesis in grapevine. In summary, we documented the trans-resveratrol content of seven grapevine accessions by HPLC and performed transcriptional analysis of the grape berry in two accessions with distinct patterns of resveratrol accumulation during berry development. We found that the expression levels of genes with putative roles in resveratrol biosynthesis were significantly higher in 'Tonghua-3' than in 'Tangwei' during V and R, consistent with the difference in resveratrol accumulation between these accessions. Moreover, several genes encoding TFs including MYBs, WRKYs, ERFs, bHLHs and bZIPs were implicated as regulators of resveratrol biosynthesis. The results from this study provide insights into the mechanism of different resveratrol accumulation in various grapevine accessions. V. davidii 'Tangwei', V. amurensis × V. Vinifera 'Beibinghong'; V. amurensis 'Tonghua-3' and 'Shuangyou'; V. vinifera × V. labrusca 'Jumeigui'; V. vinifera 'Red Globe' and 'Thompson Seedless' were maintained in the grapevine germplasm resource at Northwest A&F University, Yangling, Shaanxi, China (34°20' N, 108°24' E). Fruit was collected at the G, V, and R stages, as judged by skin and seed color and soluble solid content. Each biological replicate comprised three fruit clusters randomly chosen from three plants at each stage. About 40−50 representative berries were separated into skin, pulp, and seed, and immediately frozen in liquid nitrogen and stored at −80 °C. Resveratrol extraction was carried out as previously reported[8]. Quantitative analysis of resveratrol content was done using a Waters 600E-2487 HPLC system (Waters Corporation, Milford, MA, USA) equipped with an Agilent ZORBAX SB-C18 column (5 µm, 4.6 × 250 mm). Resveratrol was identified by co-elution with a resveratrol standard, and quantified using a standard curve. Each sample was performed with three biological replicates. Three biological replicates of each stage (G, V and R) from whole berries of 'Tangwei' and 'Tonghua-3' were used for all RNA-Seq experiments. Total RNA was extracted from 18 samples using the E.Z.N.A. Plant RNA Kit (Omega Bio-tek, Norcross, GA, USA). For each sample, sequencing libraries were constructed from 1 μg RNA using the NEBNext UltraTM RNA Library Prep Kit for Illumina (New England Biolabs, Ipswich, MA, USA). The library preparations were sequenced on an Illumina HiSeq2500 platform (Illumina, San Diego, CA, USA) at Biomarker Technologies Co., Ltd. (Beijing, China). Raw sequence reads were filtered to remove low-quality reads, and then mapped to the V. vinifera 12X reference genome[18, 31] using TopHat v.2.1.0[41]. The mapped reads were assembled into transcript models using Stringtie v2.0.4[42]. Transcript abundance and gene expression levels were estimated as FPKM[43]. The formula is as follows:
    FPKM =cDNA FragmentsMapped Fragments(Millions)× Transcript Length (kb)
    Biological replicates were evaluated using Pearson's Correlation Coefficient[44] and principal component analysis. DEGs were identified using the DEGSeq R package v1.12.0[45]. A false discovery rate (FDR) threshold was used to adjust the raw P values for multiple testing[46]. Genes with a fold change of ≥ 2 and FDR < 0.05 were assigned as DEGs. GO and KEGG enrichment analyses of DEGs were performed using GOseq R packages v1.24.0[47] and KOBAS v2.0.12[48], respectively. Co-expression networks were constructed based on FPKM values ≥ 1 and coefficient of variation ≥ 0.5 using the WGCNA R package v1.47[49]. The adjacency matrix was generated with a soft thresholding power of 16. Then, a topological overlap matrix (TOM) was constructed using the adjacency matrix, and the dissimilarity TOM was used to construct the hierarchy dendrogram. Modules containing at least 30 genes were detected and merged using the Dynamic Tree Cut algorithm with a cutoff value of 0.25[50]. The co-expression networks were visualized using Cytoscape v3.7.2[51]. RT-qPCR was carried out using the SYBR Green Kit (Takara Biotechnology, Beijing, China) and the Step OnePlus Real-Time PCR System (Applied Biosystems, Foster, CA, USA). Gene-specific primers were designed using Primer Premier 5.0 software (PREMIER Biosoft International, Palo Alto, CA, USA). Cycling parameters were 95 °C for 30 s, 42 cycles of 95 °C for 5 s, and 60 °C for 30 s. The grapevine ACTIN1 (GenBank Accession no. AY680701) gene was used as an internal control. Each reaction was performed in triplicate for each of the three biological replicates. Relative expression levels of the selected genes were calculated using the 2−ΔΔCᴛ method[52]. Primer sequences are listed in Supplemental Table S9. This research was supported by the National Key Research and Development Program of China (2019YFD1001401) and the National Natural Science Foundation of China (31872071 and U1903107).
  • The authors declare that they have no conflict of interest.
  • [1]

    Song YH, Shim JS, Kinmonth-Schultz HA, Imaizumi T. 2015. Photoperiodic flowering: time measurement mechanisms in leaves. Annual Review of Plant Biology 66:441−64

    doi: 10.1146/annurev-arplant-043014-115555

    CrossRef   Google Scholar

    [2]

    Shim JS, Kubota A, Imaizumi T. 2017. Circadian clock and photoperiodic flowering in Arabidopsis: CONSTANS is a hub for signal integration. Plant Physiology 173:5−15

    doi: 10.1104/pp.16.01327

    CrossRef   Google Scholar

    [3]

    Bu TT, Lu SJ, Wang K, Dong LD, Li SL, et al. 2021. A critical role of the soybean evening complex in the control of photoperiod sensitivity and adaptation. Proceedings of the National Academy of Sciences of the United States of America 118:e2010241118

    doi: 10.1073/pnas.2010241118

    CrossRef   Google Scholar

    [4]

    Zhao X, Li H, Wang L, Wang J, Huang Z, et al. 2024. A critical suppression feedback loop determines soybean photoperiod sensitivity. Developmental Cell 59:1750−1763.E4

    doi: 10.1016/j.devcel.2024.04.004

    CrossRef   Google Scholar

    [5]

    Qin C, Li H, Zhang S, Lin X, Jia Z, et al. 2023. GmEID1 modulates light signaling through the Evening Complex to control flowering time and yield in soybean. Proceedings of the National Academy of Sciences of the United States of America 120:e2212468120

    doi: 10.1073/pnas.2212468120

    CrossRef   Google Scholar

    [6]

    Lin X, Dong L, Tang Y, Li H, Cheng Q, et al. 2022. Novel and multifaceted regulations of photoperiodic flowering by phytochrome A in soybean. Proceedings of the National Academy of Sciences of the United States of America 119:e2208708119

    doi: 10.1073/pnas.2208708119

    CrossRef   Google Scholar

    [7]

    Sawa M, Nusinow DA, Kay SA, Imaizumi T. 2007. FKF1 and GIGANTEA complex formation is required for day-length measurement in Arabidopsis. Science 318:261−65

    doi: 10.1126/science.1146994

    CrossRef   Google Scholar

    [8]

    Han SH, Yoo SC, Lee BD, An G, Paek NC. 2015. Rice FLAVIN-BINDING, KELCH REPEAT, F-BOX 1 (OsFKF1) promotes flowering independent of photoperiod. Plant Cell And Environment 38:2527−40

    doi: 10.1111/pce.12549

    CrossRef   Google Scholar

    [9]

    Li D, Yang C, Li X, Gan Q, Zhao X, et al. 2009. Functional characterization of rice OsDof12. Planta 229:1159−69

    doi: 10.1007/s00425-009-0893-7

    CrossRef   Google Scholar

    [10]

    Lu S, Zhao X, Hu Y, Liu S, Nan H, et al. 2017. Natural variation at the soybean J locus improves adaptation to the tropics and enhances yield. Nature Genetics 49:773−79

    doi: 10.1038/ng.3819

    CrossRef   Google Scholar

    [11]

    Lu S, Dong L, Fang C, Liu S, Kong L, et al. 2020. Stepwise selection on homeologous PRR genes controlling flowering and maturity during soybean domestication. Nature Genetics 52:428−36

    doi: 10.1038/s41588-020-0604-7

    CrossRef   Google Scholar

  • Cite this article

    Wang X, He Y, Xu H, Wang L. 2024. Taiji loop composed of circadian component mediates photoperiodism in soybean. Seed Biology 3:e014 doi: 10.48130/seedbio-0024-0013
    Wang X, He Y, Xu H, Wang L. 2024. Taiji loop composed of circadian component mediates photoperiodism in soybean. Seed Biology 3:e014 doi: 10.48130/seedbio-0024-0013

Figures(1)

Article Metrics

Article views(1795) PDF downloads(248)

Other Articles By Authors

COMMENTARY   Open Access    

Taiji loop composed of circadian component mediates photoperiodism in soybean

Seed Biology  3 Article number: e014  (2024)  |  Cite this article
  • Accurate and suitable flowering time is the basis for plants to survive, and procreate as well as adapt to the local environment. Flowering in plants, which indicates the transition from the vegetative stage to the reproductive stage, is co-regulated by various external and endogenous factors, such as photoperiod, temperature, and hormones[1]. Specifically, the morphogenesis and flowering time of soybean are precisely regulated by the photoperiod, which determines yield potential and restricts soybean cultivars to a narrow latitude range. Consequently, the molecular basis for photoperiod recognition has sparked broad interest among experts from various fields. Nowadays, many photoreceptors and circadian clock homologs, such as phytochrome A (phyA), FLAVIN-BINDING, KELCH REPEAT, F-BOX 1 (FKF1), GIGANTA (GI), Pseudo Response Regulator (PRRs) and components of Evening Complex (EC: composed of ELF3, ELF4 and LUX) are identified and characterized as being involved in the photoperiod sensitivity in angiosperms, including rice, wheat, soybean, corn, and Arabidopsis, while their regulatory mechanisms dramatically vary among the different crops[1,2,3]. A recent study by Zhao et al. revealed a dynamic transcriptional and translational suppression feedback loop between FKF1/GI-EC to determine photoperiod sensitivity in soybean[4], which provides new insights for understanding latitude adaptability and night-break response in soybean.

  • In the concept of Taiji, Yin and Yang represent two antagonistic yet interdependent relationships that forms a dynamic balanced cycle. Zhao et al. described how the photoperiodic Taiji loop, E2, the homologous protein of Arabidopsis GI, interacts with a E3 ligase FKF1 in vitro and in vivo confirmed by pull-down, yeast two-hybrid, and co-immunoprecipitation, then targets J/ELF3 protein for degradation, symbolizing Yang as it occurs during the daytime. When night arrives, the expression of E2 not FKF1 increased in j and lux1 lux2 mutants compared with Williams 82. Furthermore, J protein forms EC complex with GmLUX, reciprocally repressing the transcription of E2 through binding to its genomic region, which was confirmed by ChIP-qPCR assay, symbolizing Yin as it occurs at night. Simultaneously, both E2 and EC functions genetically rely on each other. The balance between Yin and Yang is crucial for soybean photoperiod sensitivity[4]. When the function of components is lost from either part of Yin or Yang, the balance will be disturbed, leading to a reduction in sensitivity to changes in photoperiod. For example, fkf1a fkf1b, and e2 e2la e2lb mutants stand to outcompete Yin, causing plants to be insensitive to photoperiod and exhibit early flowering time phenotypes. Notably, E3/GmphyA3 and E4/GmphyA2, which encode phytochrome A homologs are previously shown to promote the degradation both of J and LUX protein[5,6], thus the early flowering phenotype of e3 e4 mutants show outcompeting of Yin is inconsistent with the Taiji loop[4]. Accordingly, the loss of function of GmEID1, the positive regulator of J protein will lead to late flowering[5]. Therefore, it is exciting to investigate whether the phenotype of other factors involved in regulating the activity of FKF1, E2, and EC are in conformity with the photoperiodic Taiji loop. If it matches, the photoperiodic Taiji loop will provide an easy way to speculate the approximate flowering time of soybean.

  • To survive, plants have to evolve complex mechanisms to rapidly respond to their daily and seasonal changing environments. In Arabidopsis, the circadian component GI interacts with ZTL, FKF1, and COP1 in a time-dependent manner to control the stability of CO protein from different layers, to finely regulate the transcriptional level of FT[2]. Importantly, the coincidence of GI with FKF1 is regulated by photoperiod, leading to differential degradation of CDF1 (CYCLING DOF FACTOR 1) and differential transcriptional levels of CO between LD and SD conditions, which is a way for Arabidopsis to recognize photoperiod[7]. Interestingly, there is an OsGI/OsFKF1-OsCDF1 molecular module in rice, however, this module appears to be opposite to that of Arabidopsis. Firstly, the downstream target genes of the module in rice are specific, namely Ehd2, Ghd7, and Ehd1[8]. Secondly, OsCDF1 may help the OsFKF1/OsGI complex promote flowering instead of antagonizing its function[9]. Excitingly, Zhao et al.[4] revealed that the homologs of GI, namely E2, E2La, and E2Lb, collectively determine photoperiod sensitivity in soybean by repressing the expression of the gene E1. Mechanically, E2 can recruit GmFKF1a and GmFKF1b, and target EC complex component J/ELF3 protein for degradation under non-inductive LD photoperiod. Genetically, the flowering phenotype of fkf1a fkf1b e2 triple mutant is similar to the e2 single mutant, suggesting FKF1s act upstream of E2. Therefore, J/ELF3 is identified as a specific target of the GmFKF1s/E2 complex in soybean, as GI didn't participate in regulating ELF3 stability in Arabidopsis. Interestingly, Zhao et al. analyzed the daily expression of J protein in E2 and e2 background as well as in FKF1a FKF1b, and fkf1a fkf1b backgrounds through immunoblot assay, and found that J protein accumulates only in LD conditions in e2 mutants but accumulates under both LD and SD conditions in fkf1a fkf1b background, indicating E2 functions as a scaffold linking GmFKF1 with J and promotes the degradation of the latter only under LD conditions. Nevertheless, their study did not give a clear explanation of E2's effect on J protein under SD conditions[4], which awaits being fully explored in the future.

    Taken together, it seems that there is a conserved FKF1-GI interaction in different species. However, the function and downstream targets which determine flowering time are considerably different.

  • In summary, Zhao et al. have established a novel transcriptional-translational suppression feedback loop in soybean to determine photoperiod sensitivity, which enriches the photoperiodic flowering network (Fig. 1). Zhao et al. focused on the function of E2 and its two homologs in the photoperiod-mediated flowering pathway and raised the focus of E2 in other undefined biological processes. Moreover, they surprisingly found that E2 can physically interact with J but not with LUX, and promotes the degradation of J. This provides a new regulatory factor on EC activity. Subsequently, they detected and proved the interaction of E2 with FKF1s acting like the complex of GI-FKF1 in Arabidopsis, which are blue light-activated and photoperiod regulated[7]. Also, the expression of E2 is regulated by EC in LD. Together, the two parts of the FKF1/E2-EC photoperiod feedback loop can responsd to environmental light signals.
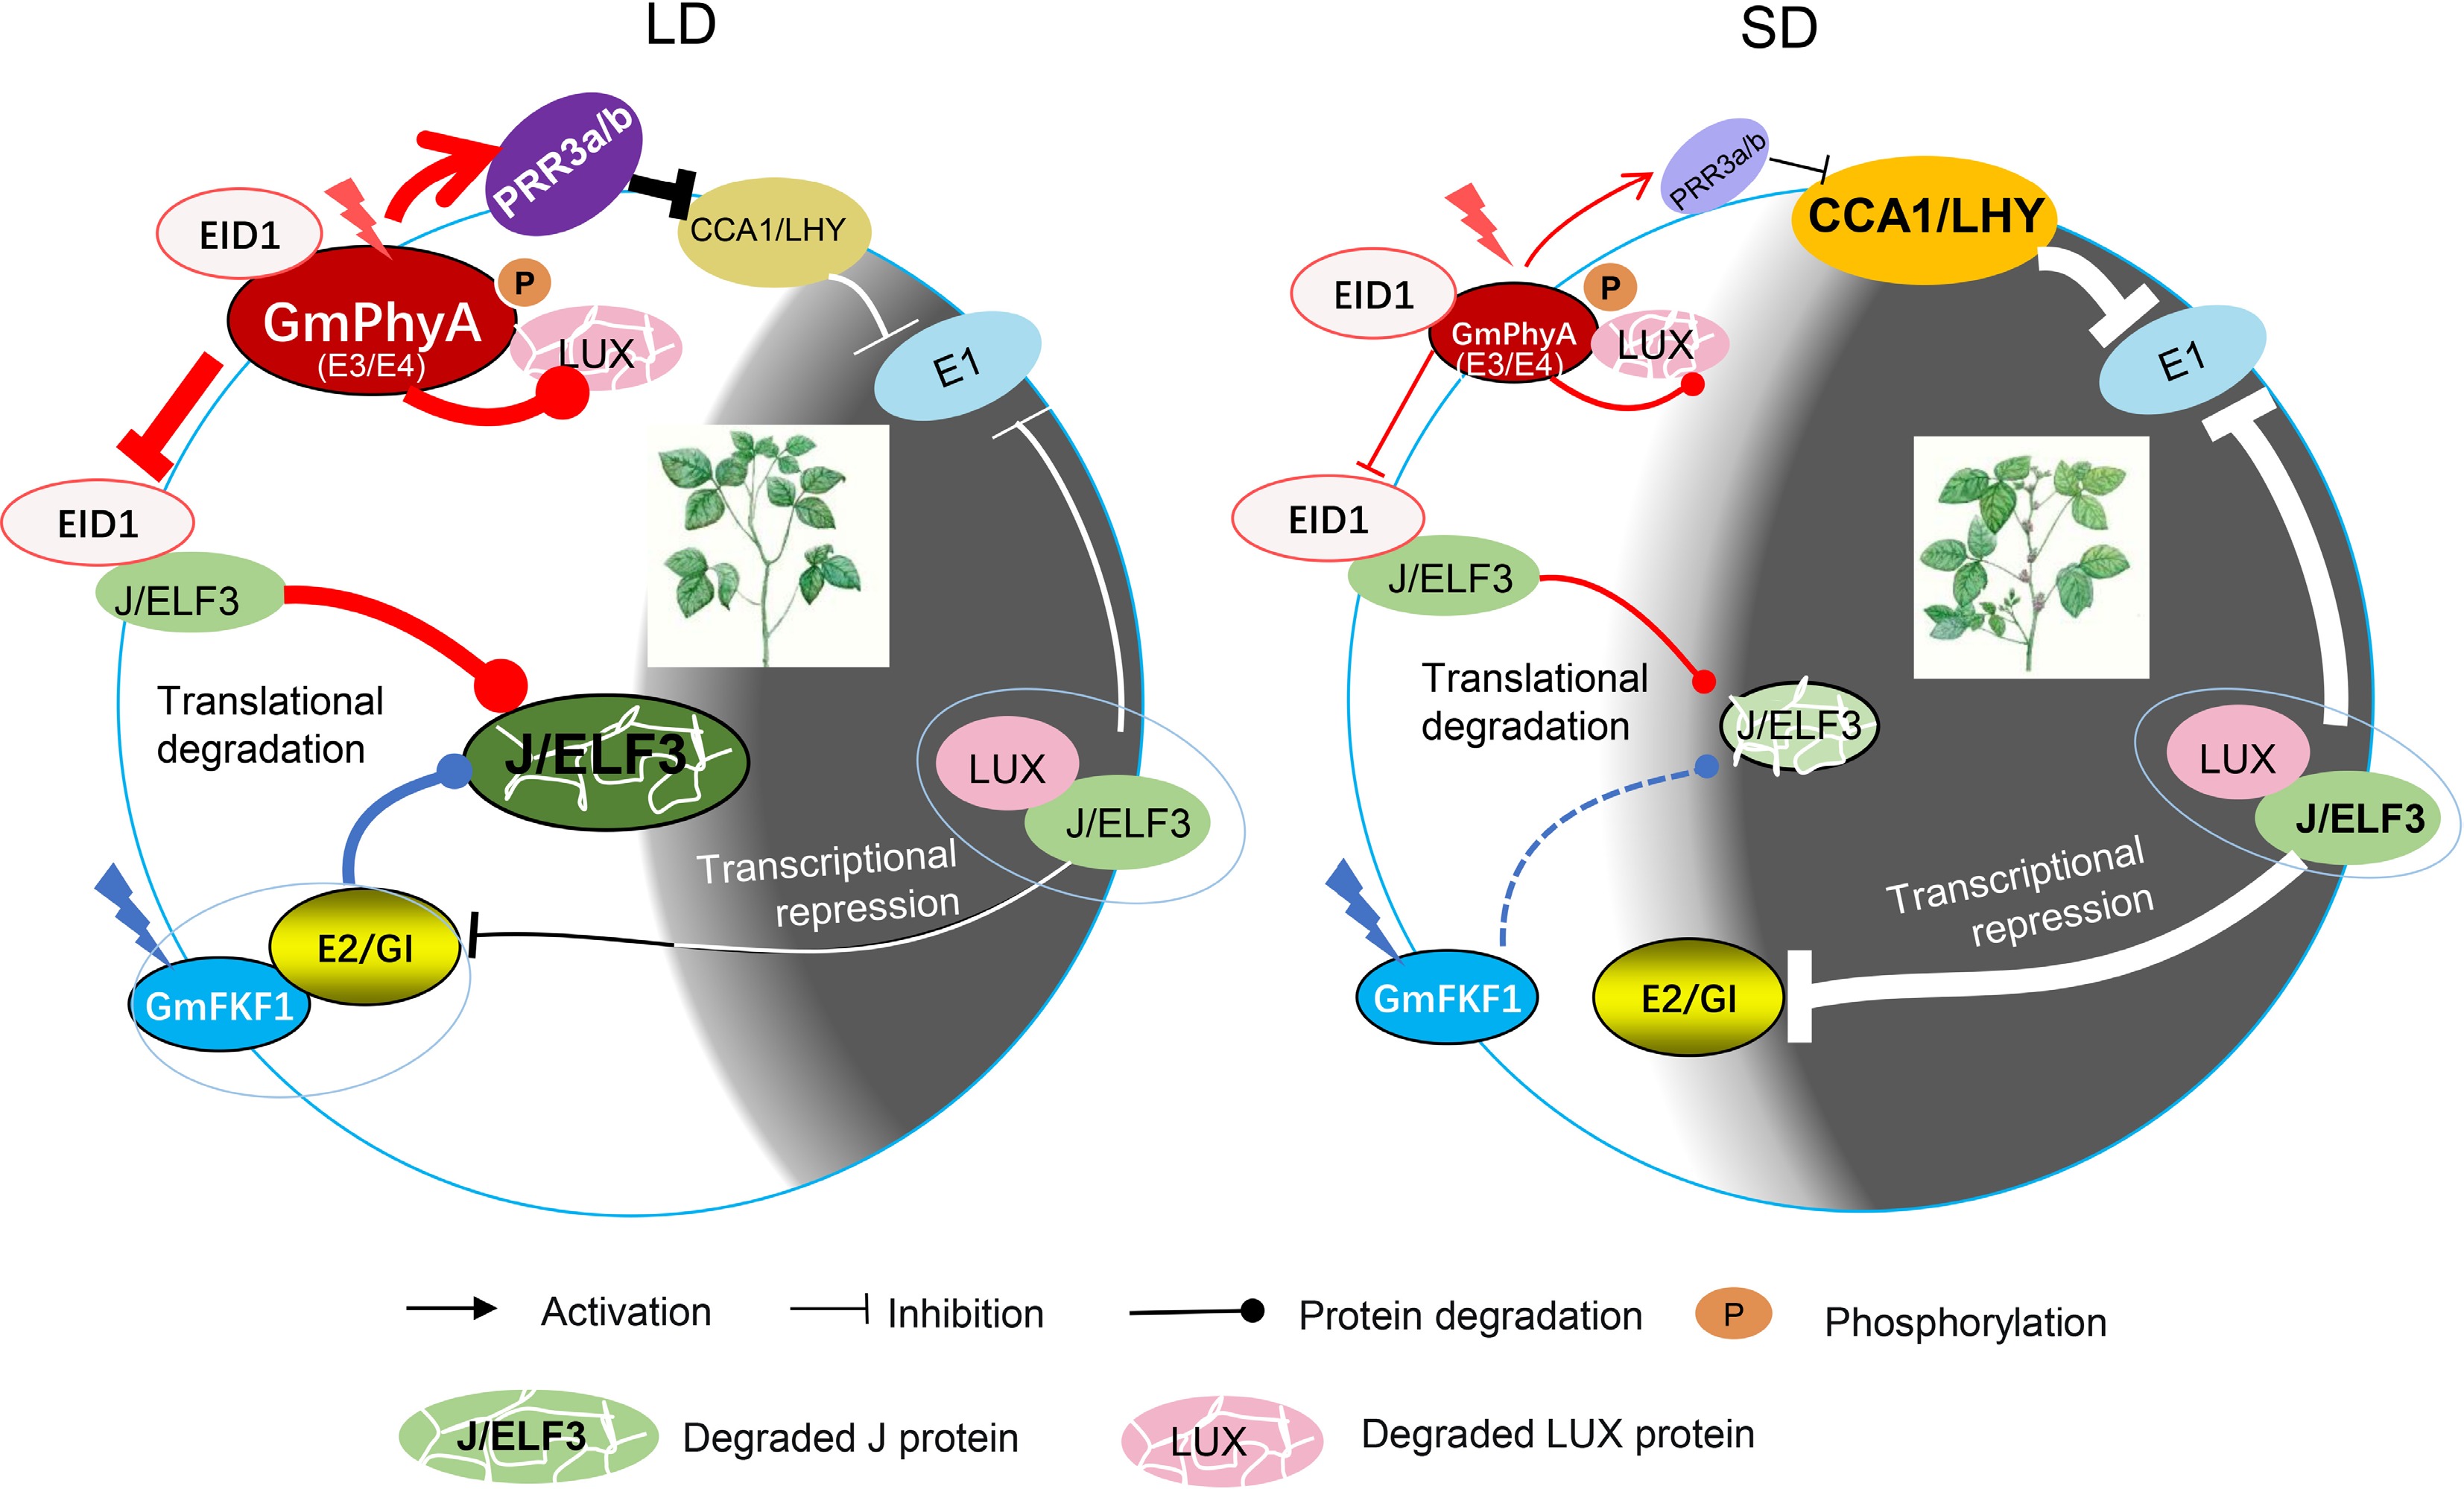
    Figure 1. 

    Photoperiodic flowering network in soybean. Under LD conditions, photoexcited FKF1 interact with E2 and target J protein to degradation. Also, photoexcited E3/E4 interact with GmEID1, acting as a competitive interaction inhibitor of GmEID1 and J, which also leads to degradation of J. Photoexcited E3/E4 also interact and promote the degradation of LUX. E3/E4 can promote the expression of PRR3a/PRR3b to inhibit CCA1 and LHY, the repressor of E1. Together, E1 is highly expressed and delays flowering of soybean under LD conditions. Under SD conditions, the functions of E3 and E4 are compromised, which may indirectly promote the accumulation of J, LUX and CCA1/LHY, therefore effectively inhibit the expression of E1. Moreover, although FKF1 can somehow promote the degradation of J protein, the degradation of J by E2 and the transcription regulation of E2 by EC disappear. Hence, E1 is highly repressed and promotes flowering under SD condition.

    Except for photoperiod sensitivity, as discussed by Zhao et al., the photoperiodic Taiji loop also contributes to understanding of latitude adaptability. In SD conditions, J represses the expression of E1, releasing the repressive activity of E1 on FT, thereby promoting flowering in soybean. Consequently, the natural mutation of J will result in a relatively long vegetable phase and enhance yield, which is helpful for soybean cultivars possessing mutated J, adapted to low latitude regions. Soybean cultivars possessing e2 are usually adapted to high latitudes[3,10]. Tof11 and Tof12, two homologs of the PRR3 protein, have been shown to be beneficial in promoting the expansion of soybean to middle and high latitudes mainly by repressing the expression of LHY homologs, a repressor of E1[11]. It is an open question whether Tof11 and Tof12 participate in regulating both E2 and EC as PRRs family proteins do in Arabidopsis.

    Meanwhile, the model explains the night break as light intervals at night will stimulate the formation of the E2-FKF1 complex and activate phyA, thereby degrading J and LUX proteins, releasing E1 and delaying flowering[5,6]. Although the delayed flowering phenotype makes a steady fit with the explanation, it is controversial whether light intervals can make enough E2-FKF1 complex to degrade J protein, since it is also unclear the effect of light intervals on the expression pattern of E2 and FKF1.

  • The authors confirm contribution to the paper as follows: draft manuscript preparation: Wang X, He Y, Wang L; diagram drawing: Wang X, Xu H; manuscript revise: Wang L. All authors approved the final version of the manuscript.

  • Data sharing is not applicable to this article as no new data were created or analyzed in this study.

    • This work was supported by the National Key Research and Development Program of China (2023YFF100300) and Science & Technology Specific Projects in Agricultural High-tech Industrial Demonstration Area of the Yellow River Delta (2022SZX13) to Wang L.

    • The authors declare that they have no conflict of interest.

    • Copyright: © 2024 by the author(s). Published by Maximum Academic Press on behalf of Hainan Yazhou Bay Seed Laboratory. This article is an open access article distributed under Creative Commons Attribution License (CC BY 4.0), visit https://creativecommons.org/licenses/by/4.0/.
Figure (1)  References (11)
  • About this article
    Cite this article
    Wang X, He Y, Xu H, Wang L. 2024. Taiji loop composed of circadian component mediates photoperiodism in soybean. Seed Biology 3:e014 doi: 10.48130/seedbio-0024-0013
    Wang X, He Y, Xu H, Wang L. 2024. Taiji loop composed of circadian component mediates photoperiodism in soybean. Seed Biology 3:e014 doi: 10.48130/seedbio-0024-0013
  • Catalog

    • About this article

    /

    DownLoad:  Full-Size Img  PowerPoint
    Return
    Return