2024 Volume 1
Article Contents
About this article
ARTICLE   Open Access    

Responses of microbial communities to drought stress and humic acid fertilizer in maize

  • # Authors contributed equally: Mingfei Sun, Lin Zhang

More Information
  • Humic acid (HA) fertilizer was previously considered to be able to enlarge the effective absorption area of roots and promote plant root growth. Recent evidence suggests that certain root-associated microbes might be able to mitigate the negative responses of drought stress. In this study, the abundance and diversity of root-associated bacterial communities under HA fertilizer and drought stress treatments were explored. Rhizosphere microbiomes of three groups (HA, drought, and control) and microbiomes from bulk soil were collected during the flowering period in maize. Using Illumina Hiseq2500, the bacterial data for the V4 region of the 16S rRNA gene was obtained. Analysis of the sequencing data from 40 bacteria phyla revealed the abundance levels of the 12 bacterial communities were significantly different in the rhizosphere of the drought-treated samples compared to the controls. Two of these phyla, Actinobacteria and Bacteroidetes, were also significantly enriched or depleted in HA fertilizer-treated samples. The results underscore the dynamics of the rhizosphere microbiomes under drought stress and indicate the association between HA and rhizosphere microbiomes. However, more studies are warranted to understand the effect of HA fertilizer and beneficial microbiomes in responding to drought.
  • Aquaporins (AQPs) constitute a large family of transmembrane channel proteins that function as regulators of intracellular and intercellular water flow[1,2]. Since their first discovery in the 1990s, AQPs have been found not only in three domains of life, i.e., bacteria, eukaryotes, and archaea, but also in viruses[3,4]. Each AQP monomer is composed of an internal repeat of three transmembrane helices (i.e., TM1–TM6) as well as two half helixes that are formed by loop B (LB) and LE through dipping into the membrane[5]. The dual Asn-Pro-Ala (NPA) motifs that are located at the N-terminus of two half helixes act as a size barrier of the pore via creating an electrostatic repulsion of protons, whereas the so-called aromatic/arginine (ar/R) selectivity filter (i.e., H2, H5, LE1, and LE2) determines the substrate specificity by rendering the pore constriction site diverse in both size and hydrophobicity[59]. Based on sequence similarity, AQPs in higher plants could be divided into five subfamilies, i.e., plasma membrane intrinsic protein (PIP), tonoplast intrinsic protein (TIP), NOD26-like intrinsic protein (NIP), X intrinsic protein (XIP), and small basic intrinsic protein (SIP)[1017]. Among them, PIPs, which are typically localized in the cell membrane, are most conserved and play a central role in controlling plant water status[12,1822]. Among two phylogenetic groups present in the PIP subfamily, PIP1 possesses a relatively longer N-terminus and PIP2 features an extended C-terminus with one or more conserved S residues for phosphorylation modification[5,15,17].

    Tigernut (Cyperus esculentus L.), which belongs to the Cyperaceae family within Poales, is a novel and promising herbaceous C4 oil crop with wide adaptability, large biomass, and short life period[2327]. Tigernut is a unique species accumulating up to 35% oil in the underground tubers[2830], which are developed from stolons and the process includes three main stages, i.e., initiation, swelling, and maturation[3133]. Water is essential for tuber development and tuber moisture content maintains a relatively high level of approximately 85% until maturation when a significant drop to about 45% is observed[28,32]. Thereby, uncovering the mechanism of tuber water balance is of particular interest. Despite crucial roles of PIPs in the cell water balance, to date, their characterization in tigernut is still in the infancy[21]. The recently available genome and transcriptome datasets[31,33,34] provide an opportunity to address this issue.

    In this study, a global characterization of PIP genes was conducted in tigernut, including gene localizations, gene structures, sequence characteristics, and evolutionary patterns. Moreover, the correlation of CePIP mRNA/protein abundance with water content during tuber development as well as subcellular localizations were also investigated, which facilitated further elucidating the water balance mechanism in this special species.

    PIP genes reported in Arabidopsis (Arabidopsis thaliana)[10] and rice (Oryza sativa)[11] were respectively obtained from TAIR11 (www.arabidopsis.org) and RGAP7 (http://rice.uga.edu), and detailed information is shown in Supplemental Table S1. Their protein sequences were used as queries for tBLASTn[35] (E-value, 1e–10) search of the full-length tigernut transcriptome and genome sequences that were accessed from CNGBdb (https://db.cngb.org/search/assembly/CNA0051961)[31,34]. RNA sequencing (RNA-seq) reads that are available in NCBI (www.ncbi.nlm.nih.gov/sra) were also adopted for gene structure revision as described before[13], and presence of the conserved MIP (major intrinsic protein, Pfam accession number PF00230) domain in candidates was confirmed using MOTIF Search (www.genome.jp/tools/motif). To uncover the origin and evolution of CePIP genes, a similar approach was also employed to identify homologs from representative plant species, i.e., Carex cristatella (v1, Cyperaceae)[36], Rhynchospora breviuscula (v1, Cyperaceae)[37], and Juncus effusus (v1, Juncaceae)[37], whose genome sequences were accessed from NCBI (www.ncbi.nlm.nih.gov). Gene structure of candidates were displayed using GSDS 2.0 (http://gsds.gao-lab.org), whereas physiochemical parameters of deduced proteins were calculated using ProtParam (http://web.expasy.org/protparam). Subcellular localization prediction was conducted using WoLF PSORT (www.genscript.com/wolf-psort.html).

    Nucleotide and protein multiple sequence alignments were respectively conducted using ClustalW and MUSCLE implemented in MEGA6[38] with default parameters, and phylogenetic tree construction was carried out using MEGA6 with the maximum likelihood method and bootstrap of 1,000 replicates. Systematic names of PIP genes were assigned with two italic letters denoting the source organism and a progressive number based on sequence similarity. Conserved motifs were identified using MEME Suite 5.5.3 (https://meme-suite.org/tools/meme) with optimized parameters as follows: Any number of repetitions, maximum number of 15 motifs, and a width of 6 and 250 residues for each motif. TMs and conserved residues were identified using homology modeling and sequence alignment with the structure resolved spinach (Spinacia oleracea) SoPIP2;1[5].

    Synteny analysis was conducted using TBtools-II[39] as described previously[40], where the parameters were set as E-value of 1e-10 and BLAST hits of 5. Duplication modes were identified using the DupGen_finder pipeline[41], and Ks (synonymous substitution rate) and Ka (nonsynonymous substitution rate) of duplicate pairs were calculated using codeml in the PAML package[42]. Orthologs between different species were identified using InParanoid[43] and information from synteny analysis, and orthogroups (OGs) were assigned only when they were present in at least two species examined.

    Plant materials used for gene cloning, qRT-PCR analysis, and 4D-parallel reaction monitoring (4D-PRM)-based protein quantification were derived from a tigernut variety Reyan3[31], and plants were grown in a greenhouse as described previously[25]. For expression profiling during leaf development, three representative stages, i.e., young, mature, and senescing, were selected and the chlorophyll content was checked using SPAD-502Plus (Konica Minolta, Shanghai, China) as previously described[44]. Young and senescing leaves are yellow in appearance, and their chlorophyll contents are just half of that of mature leaves that are dark green. For diurnal fluctuation regulation, mature leaves were sampled every 4 h from the onset of light at 8 a.m. For gene regulation during tuber development, fresh tubers at 1, 5, 10, 15, 20, 25, and 35 d after tuber initiation (DAI) were collected as described previously[32]. All samples with three biological replicates were quickly frozen with liquid nitrogen and stored at −80 °C for further use. For subcellular localization analysis, tobacco (Nicotiana benthamiana) plants were grown as previously described[20].

    Tissue-specific expression profiles of CePIP genes were investigated using Illumina RNA-seq samples (150 bp paired-end reads) with three biological replicates for young leaf, mature leaf, sheath of mature leaf, shoot apex, root, rhizome, and three stages of developmental tuber (40, 85, and 120 d after sowing (DAS)), which are under the NCBI accession number of PRJNA703731. Raw sequence reads in the FASTQ format were obtained using fastq-dump, and quality control was performed using fastQC (www.bioinformatics.babraham.ac.uk/projects/fastqc). Read mapping was performed using HISAT2 (v2.2.1, https://daehwankimlab.github.io/hisat2), and relative gene expression level was presented as FPKM (fragments per kilobase of exon per million fragments mapped)[45].

    For qRT-PCR analysis, total RNA extraction and synthesis of the first-strand cDNA were conducted as previously described[24]. Primers used in this study are shown in Supplemental Table S2, where CeUCE2 and CeTIP41[25,33] were employed as two reference genes. PCR reaction in triplicate for each biological sample was carried out using the SYBR-green Mix (Takara) on a Real-time Thermal Cycler Type 5100 (Thermal Fisher Scientific Oy). Relative gene abundance was estimated with the 2−ΔΔCᴛ method and statistical analysis was performed using SPSS Statistics 20 as described previously[13].

    Raw proteomic data for tigernut roots, leaves, freshly harvested, dried, rehydrated for 48 h, and sprouted tubers were downloaded from ProteomeXchange/PRIDE (www.proteomexchange.org, PXD021894, PXD031123, and PXD035931), which were further analyzed using Maxquant (v1.6.15.0, www.maxquant.org). Three dominant members, i.e., CePIP1;1, -2;1, and -2;8, were selected for 4D-PRM quantification analysis, and related unique peptides are shown in Supplemental Table S3. Protein extraction, trypsin digestion, and LC-MS/MS analysis were conducted as described previously[46].

    For subcellular localization analysis, the coding region (CDS) of CePIP1;1, -2;1, and -2;8 were cloned into pNC-Cam1304-SubN via Nimble Cloning as described before[30]. Then, recombinant plasmids were introduced into Agrobacterium tumefaciens GV3101 with the helper plasmid pSoup-P19 and infiltration of 4-week-old tobacco leaves were performed as previously described[20]. For subcellular localization analysis, the plasma membrane marker HbPIP2;3-RFP[22] was co-transformed as a positive control. Fluorescence observation was conducted using confocal laser scanning microscopy imaging (Zeiss LMS880, Germany): The wavelength of laser-1 was set as 730 nm for RFP observation, where the fluorescence was excited at 561 nm; the wavelength of laser-2 was set as 750 nm for EGFP observation, where the fluorescence was excited at 488 nm; and the wavelength of laser-3 was set as 470 nm for chlorophyll autofluorescence observation, where the fluorescence was excited at 633 nm.

    As shown in Table 1, a total of 14 PIP genes were identified from eight tigernut scaffolds (Scfs). The CDS length varies from 831 to 882 bp, putatively encoding 276–293 amino acids (AA) with a molecular weight (MW) of 29.16–31.59 kilodalton (kDa). The theoretical isoelectric point (pI) varies from 7.04 to 9.46, implying that they are all alkaline. The grand average of hydropathicity (GRAVY) is between 0.344 and 0.577, and the aliphatic index (II) ranges from 94.57 to 106.90, which are consistent with the hydrophobic characteristic of AQPs[47]. As expected, like SoPIP2;1, all CePIPs include six TMs, two typical NPA motifs, the invariable ar/R filter F-H-T-R, five conserved Froger's positions Q/M-S-A-F-W, and two highly conserved residues corresponding to H193 and L197 in SoPIP2;1 that were proven to be involved in gating[5,48], though the H→F variation was found in CePIP2;9, -2;10, and -2;11 (Supplemental Fig. S1). Moreover, two S residues, corresponding to S115 and S274 in SoPIP2;1[5], respectively, were also found in the majority of CePIPs (Supplemental Fig. S1), implying their posttranslational regulation by phosphorylation.

    Table 1.  Fourteen PIP genes identified in C. esculentus.
    Gene name Locus Position Intron no. AA MW (kDa) pI GRAVY AI TM MIP
    CePIP1;1 CESC_15147 Scf9:2757378..2759502(–) 3 288 30.76 8.82 0.384 95.28 6 47..276
    CePIP1;2 CESC_04128 Scf4:3806361..3807726(–) 3 291 31.11 8.81 0.344 95.95 6 46..274
    CePIP1;3 CESC_15950 Scf54:5022493..5023820(+) 3 289 31.06 8.80 0.363 94.57 6 49..278
    CePIP2;1 CESC_15350 Scf9:879960..884243(+) 3 288 30.34 8.60 0.529 103.02 6 33..269
    CePIP2;2 CESC_00011 Scf30:4234620..4236549(+) 3 293 31.59 9.27 0.394 101.57 6 35..268
    CePIP2;3 CESC_00010 Scf30:4239406..4241658(+) 3 291 30.88 9.44 0.432 98.97 6 31..266
    CePIP2;4 CESC_05080 Scf46:307799..309544(+) 3 285 30.44 7.04 0.453 100.32 6 28..265
    CePIP2;5 CESC_05079 Scf46:312254..314388(+) 3 286 30.49 7.04 0.512 101.68 6 31..268
    CePIP2;6 CESC_05078 Scf46:316024..317780(+) 3 288 30.65 7.68 0.475 103.06 6 31..268
    CePIP2;7 CESC_05077 Scf46:320439..322184(+) 3 284 30.12 8.55 0.500 100.00 6 29..266
    CePIP2;8 CESC_14470 Scf2:4446409..4448999(+) 3 284 30.37 8.30 0.490 106.90 6 33..263
    CePIP2;9 CESC_02223 Scf1:2543928..2545778(–) 3 283 30.09 9.46 0.533 106.47 6 31..262
    CePIP2;10 CESC_10007 Scf27:1686032..1688010(–) 3 276 29.16 9.23 0.560 106.05 6 26..256
    CePIP2;11 CESC_10009 Scf27:1694196..1696175(–) 3 284 29.71 9.10 0.577 105.49 6 33..263
    AA: amino acid; AI: aliphatic index; GRAVY: grand average of hydropathicity; kDa: kilodalton; MIP: major intrinsic protein; MW: molecular weight; pI: isoelectric point; PIP: plasma membrane intrinsic protein; Scf: scaffold; TM: transmembrane helix.
     | Show Table
    DownLoad: CSV

    To uncover the evolutionary relationships, an unrooted phylogenetic tree was constructed using the full-length protein sequences of CePIPs together with 11 OsPIPs and 13 AtPIPs. As shown in Fig. 1a, these proteins were clustered into two main groups, corresponding to PIP1 and PIP2 as previously defined[10,49], and each appears to have evolved into several subgroups. Compared with PIP1s, PIP2s possess a relatively shorter N-terminal but an extended C-terminal with one conserved S residue (Supplemental Fig. S1). Interestingly, a high number of gene repeats were detected, most of which seem to be species-specific, i.e., AtPIP1;1/-1;2/-1;3/-1;4/-1;5, AtPIP2;1/-2;2/-2;3/-2;4/-2;5/-2;6, AtPIP2;7/-2;8, OsPIP1;1/-1;2/-1;3, OsPIP2;1/-2;4/-2;5, OsPIP2;2/-2;3, CePIP1;1/-1;2, CePIP2;2/-2;3, CePIP2;4/-2;5/-2;6/-2;7, and CePIP2;9/-2;10/-2;11, reflecting the occurrence of more than one lineage-specific whole-genome duplications (WGDs) after their divergence[50,51]. In Arabidopsis that experienced three WGDs (i.e. γ, β, and α) after the split with the monocot clade[52], AtPIP1;5 in the PIP1 group first gave rise to AtPIP1;1 via the γ WGD shared by all core eudicots[50], which latter resulted in AtPIP1;3, -1;4, and -1;2 via β and α WGDs; AtPIP2;1 in the PIP2 group first gave rise to AtPIP2;6 via the γ WGD, and they latter generated AtPIP2;2, and -2;5 via the α WGD (Supplemental Table S1). In rice, which also experienced three WGDs (i.e. τ, σ, and ρ) after the split with the eudicot clade[51], OsPIP1;2 and -2;3 generated OsPIP1;1 and -2;2 via the Poaceae-specific ρ WGD, respectively. Additionally, tandem, proximal, transposed and dispersed duplications also played a role on the gene expansion in these two species (Supplemental Table S1).

    Figure 1.  Structural and phylogenetic analysis of PIPs in C. esculentus, O. sativa, and A. thaliana. (a) Shown is an unrooted phylogenetic tree resulting from full-length PIPs with MEGA6 (maximum likelihood method and bootstrap of 1,000 replicates), where the distance scale denotes the number of amino acid substitutions per site. (b) Shown are the exon-intron structures. (c) Shown is the distribution of conserved motifs among PIPs, where different motifs are represented by different color blocks as indicated and the same color block in different proteins indicates a certain motif. (At: A. thaliana; Ce: C. esculentus; PIP: plasma membrane intrinsic protein; Os: O. sativa).

    Analysis of gene structures revealed that all CePIP and AtPIP genes possess three introns and four exons in the CDS, in contrast to the frequent loss of certain introns in rice, including OsPIP1;2, -1;3, -2;1, -2;3, -2;4, -2;5, -2;6, -2;7, and -2;8 (Fig. 1b). The positions of three introns are highly conserved, which are located in sequences encoding LB (three residues before the first NPA), LD (one residue before the conserved L involved in gating), and LE (18 residues after the second NPA), respectively (Supplemental Fig. S1). The intron length of CePIP genes is highly variable, i.e., 109–993 bp, 115–1745 bp, and 95–866 bp for three introns, respectively. By contrast, the exon length is relatively less variable: Exons 2 and 3 are invariable with 296 bp and 141 bp, respectively, whereas Exons 1 and 4 are of 277–343 bp and 93–132 bp, determining the length of N- and C-terminus of PIP1 and PIP2, respectively (Fig. 1b). Correspondingly, their protein structures were shown to be highly conserved, and six (i.e., Motifs 1–6) out of 15 motifs identified are broadly present. Among them, Motif 3, -2, -6, -1, and -4 constitute the conserved MIP domain. In contrast to a single Motif 5 present in most PIP2s, all PIP1s possess two sequential copies of Motif 5, where the first one is located at the extended N-terminal. In CePIP2;3 and OsPIP2;7, Motif 5 is replaced by Motif 13; in CePIP2;2, it is replaced by two copies of Motif 15; and no significant motif was detected in this region of CePIP2;10. PIP1s and PIP2s usually feature Motif 9 and -7 at the C-terminal, respectively, though it is replaced by Motif 12 in CePIP2;6 and OsPIP2;8. PIP2s usually feature Motif 8 at the N-terminal, though it is replaced by Motif 14 in CePIP2;2 and -2;3 or replaced by Motif 11 in CePIP2;10 and -2;11 (Fig. 1c).

    As shown in Fig. 2a, gene localization of CePIPs revealed three gene clusters, i.e., CePIP2;2/-2;3 on Scf30, CePIP2;4/-2;5/-2;6/-2;7 on Scf46, and CePIP2;10/-2;11 on Scf27, which were defined as tandem repeats for their high sequence similarities and neighboring locations. The nucleotide identities of these duplicate pairs vary from 70.5% to 91.2%, and the Ks values range from 0.0971 to 1.2778 (Table 2), implying different time of their birth. According to intra-species synteny analysis, two duplicate pairs, i.e., CePIP1;1/-1;2 and CePIP2;2/-2;4, were shown to be located within syntenic blocks (Fig. 2b) and thus were defined as WGD repeats. Among them, CePIP1;1/-1;2 possess a comparable Ks value to CePIP2;2/-2;3, CePIP1;1/-1;3, and CePIP2;4/-2;8 (1.2522 vs 1.2287–1.2778), whereas CePIP2;2/-2;4 harbor a relatively higher Ks value of 1.5474 (Table 2), implying early origin or fast evolution of the latter. While CePIP1;1/-1;3 and CePIP2;1/-2;8 were characterized as transposed repeats, CePIP2;1/-2;2, CePIP2;9/-2;10, and CePIP2;8/-2;10 were characterized as dispersed repeats (Fig. 2a). The Ks values of three dispersed repeats vary from 0.8591 to 3.0117 (Table 2), implying distinct times of origin.

    Figure 2.  Duplication events of CePIP genes and synteny analysis within and between C. esculentus, O. sativa, and A. thaliana. (a) Duplication events detected in tigernut. Serial numbers are indicated at the top of each scaffold, and the scale is in Mb. Duplicate pairs identified in this study are connected using lines in different colors, i.e., tandem (shown in green), transposed (shown in purple), dispersed (shown in gold), and WGD (shown in red). (b) Synteny analysis within and between C. esculentus, O. sativa, and A. thaliana. (c) Synteny analysis within and between C. esculentus, C. cristatella, R. breviuscula, and J. effusus. Shown are PIP-encoding chromosomes/scaffolds and only syntenic blocks that contain PIP genes are marked, i.e., red and purple for intra- and inter-species, respectively. (At: A. thaliana; Cc: C. cristatella; Ce: C. esculentus; Je: J. effusus; Mb: megabase; PIP: plasma membrane intrinsic protein; Os: O. sativa; Rb: R. breviuscula; Scf: scaffold; WGD: whole-genome duplication).
    Table 2.  Sequence identity and evolutionary rate of homologous PIP gene pairs identified in C. esculentus. Ks and Ka were calculated using PAML.
    Duplicate 1 Duplicate 2 Identity (%) Ka Ks Ka/Ks
    CePIP1;1 CePIP1;3 78.70 0.0750 1.2287 0.0610
    CePIP1;2 CePIP1;1 77.20 0.0894 1.2522 0.0714
    CePIP2;1 CePIP2;4 74.90 0.0965 1.7009 0.0567
    CePIP2;3 CePIP2;2 70.50 0.1819 1.2778 0.1424
    CePIP2;4 CePIP2;2 66.50 0.2094 1.5474 0.1353
    CePIP2;5 CePIP2;4 87.30 0.0225 0.4948 0.0455
    CePIP2;6 CePIP2;5 84.90 0.0545 0.5820 0.0937
    CePIP2;7 CePIP2;6 78.70 0.0894 1.0269 0.0871
    CePIP2;8 CePIP2;4 72.90 0.1401 1.2641 0.1109
    CePIP2;9 CePIP2;10 76.40 0.1290 0.8591 0.1502
    CePIP2;10 CePIP2;8 64.90 0.2432 3.0117 0.0807
    CePIP2;11 CePIP2;10 91.20 0.0562 0.0971 0.5783
    Ce: C. esculentus; Ka: nonsynonymous substitution rate; Ks: synonymous substitution rate; PIP: plasma membrane intrinsic protein.
     | Show Table
    DownLoad: CSV

    According to inter-species syntenic analysis, six out of 14 CePIP genes were shown to have syntelogs in rice, including 1:1, 1:2, and 2:2 (i.e. CePIP1;1 vs OsPIP1;3, CePIP1;3 vs OsPIP1;2/-1;1, CePIP2;1 vs OsPIP2;4, CePIP2;2/-2;4 vs OsPIP2;3/-2;2, and CePIP2;8 vs OsPIP2;6), in striking contrast to a single one found in Arabidopsis (i.e. CePIP1;2 vs AtPIP1;2). Correspondingly, only OsPIP1;2 in rice was shown to have syntelogs in Arabidopsis, i.e., AtPIP1;3 and -1;4 (Fig. 2b). These results are consistent with their taxonomic relationships that tigernut and rice are closely related[50,51], and also imply lineage-specific evolution after their divergence.

    As described above, phylogenetic and syntenic analyses showed that the last common ancestor of tigernut and rice is more likely to possess only two PIP1s and three PIP2s. However, it is not clear whether the gene expansion observed in tigernut is species-specific or Cyperaceae-specific. To address this issue, recently available genomes were used to identify PIP subfamily genes from C. cristatella, R. breviuscula, and J. effuses, resulting in 15, 13, and nine members, respectively. Interestingly, in contrast to a high number of tandem repeats found in Cyperaceae species, only one pair of tandem repeats (i.e., JePIP2;3 and -2;4) were identified in J. effusus, a close outgroup species to Cyperaceae in the Juncaceae family[36,37]. According to homologous analysis, a total of 12 orthogroups were identified, where JePIP genes belong to PIP1A (JePIP1;1), PIP1B (JePIP1;2), PIP1C (JePIP1;3), PIP2A (JePIP2;1), PIP2B (JePIP2;2), PIP2F (JePIP2;3 and -2;4), PIP2G (JePIP2;5), and PIP2H (JePIP2;6) (Table 3). Further intra-species syntenic analysis revealed that JePIP1;1/-1;2 and JePIP2;2/-2;3 are located within syntenic blocks, which is consistent with CePIP1;1/-1;2, CePIP2;2/-2;4, CcPIP1;1/-1;2, CcPIP2;3/-2;4, RbPIP1;1/-1;2, and RbPIP2;2/-2;5 (Fig. 2c), implying that PIP1A/PIP1B and PIP2B/PIP2D were derived from WGDs occurred sometime before Cyperaceae-Juncaceae divergence. After the split with Juncaceae, tandem duplications frequently occurred in Cyperaceae, where PIP2B/PIP2C and PIP2D/PIP2E/PIP2F retain in most Cyperaceae plants examined in this study. By contrast, species-specific expansion was also observed, i.e., CePIP2;4/-2;5, CePIP2;10/-2;11, CcPIP1;2/-1;3, CcPIP2;4/-2;5, CcPIP2;8/-2;9, CcPIP2;10/-2;11, RbPIP2;3/-2;4, and RbPIP2;9/-2;10 (Table 3 & Fig. 2c).

    Table 3.  Twelve proposed orthogroups based on comparison of representative plant species.
    Orthogroup C. esculentus C. cristatella R. breviuscula J. effusus O. sativa A. thaliana
    PIP1A CePIP1;1 CcPIP1;1 RbPIP1;1 JePIP1;1 OsPIP1;3 AtPIP1;1, AtPIP1;2,
    AtPIP1;3, AtPIP1;4,
    AtPIP1;5
    PIP1B CePIP1;2 CcPIP1;2, CcPIP1;3 RbPIP1;2 JePIP1;2
    PIP1C CePIP1;3 CcPIP1;4 RbPIP1;3 JePIP1;3 OsPIP1;1, OsPIP1;2
    PIP2A CePIP2;1 CcPIP2;1 RbPIP2;1 JePIP2;1 OsPIP2;1, OsPIP2;4,
    OsPIP2;5
    AtPIP2;1, AtPIP2;2,
    AtPIP2;3, AtPIP2;4,
    AtPIP2;5, AtPIP2;6
    PIP2B CePIP2;2 CcPIP2;2 RbPIP2;2 JePIP2;2 OsPIP2;2, OsPIP2;3
    PIP2C CePIP2;3 CcPIP2;3 RbPIP2;3, RbPIP2;4
    PIP2D CePIP2;4, CePIP2;5 CcPIP2;4, CcPIP2;5 RbPIP2;5
    PIP2E CePIP2;5 CcPIP2;5 RbPIP2;6
    PIP2F CePIP2;6 CcPIP2;6
    PIP2G CePIP2;7 CcPIP2;7 RbPIP2;7 JePIP2;3, JePIP2;4
    PIP2H CePIP2;8 CcPIP2;8, CcPIP2;9 RbPIP2;8 JePIP2;5 OsPIP2;6 AtPIP2;7, AtPIP2;8
    PIP2I CePIP2;9, CePIP2;10,
    CePIP2;11
    CcPIP2;10, CcPIP2;11 RbPIP2;9, RbPIP2;10 JePIP2;6 OsPIP2;7, OsPIP2;8
    At: A. thaliana; Cc: C. cristatella; Ce: C. esculentus; Je: J. effuses; Os: O. sativa; Rb: R. breviuscula; PIP: plasma membrane intrinsic protein.
     | Show Table
    DownLoad: CSV

    Tissue-specific expression profiles of CePIP genes were investigated using transcriptome data available for young leaf, mature leaf, sheath, root, rhizome, shoot apex, and tuber. As shown in Fig. 3a, CePIP genes were mostly expressed in roots, followed by sheaths, moderately in tubers, young leaves, rhizomes, and mature leaves, and lowly in shoot apexes. In most tissues, CePIP1;1, -2;1, and -2;8 represent three dominant members that contributed more than 90% of total transcripts. By contrast, in rhizome, these three members occupied about 80% of total transcripts, which together with CePIP1;3 and -2;4 contributed up to 96%; in root, CePIP1;1, -1;3, -2;4, and -2;7 occupied about 84% of total transcripts, which together with CePIP2;1 and -2;8 contributed up to 94%. According to their expression patterns, CePIP genes could be divided into five main clusters: Cluster I includes CePIP1;1, -2;1, and -2;8 that were constitutively and highly expressed in all tissues examined; Cluster II includes CePIP2;2, -2;9, and -2;10 that were lowly expressed in all tested tissues; Cluster III includes CePIP1;2 and -2;11 that were preferentially expressed in young leaf and sheath; Cluster IV includes CePIP1;3 and -2;4 that were predominantly expressed in root and rhizome; and Cluster V includes remains that were typically expressed in root (Fig. 3a). Collectively, these results imply expression divergence of most duplicate pairs and three members (i.e. CePIP1;1, -2;1, and -2;8) have evolved to be constitutively co-expressed in most tissues.

    Figure 3.  Expression profiles of CePIP genes in various tissues, different stages of leaf development, and mature leaves of diurnal fluctuation. (a) Tissue-specific expression profiles of 14 CePIP genes. The heatmap was generated using the R package implemented with a row-based standardization. Color scale represents FPKM normalized log2 transformed counts, where blue indicates low expression and red indicates high expression. (b) Expression profiles of CePIP1;1, -2;1, and -2;8 at different stages of leaf development. (c) Expression profiles of CePIP1;1, -2;1, and -2;8 in mature leaves of diurnal fluctuation. Bars indicate SD (N = 3) and uppercase letters indicate difference significance tested following Duncan's one-way multiple-range post hoc ANOVA (p< 0.01). (Ce: C. esculentus; FPKM: Fragments per kilobase of exon per million fragments mapped; PIP: plasma membrane intrinsic protein)

    As shown in Fig. 3a, compared with young leaves, transcriptome profiling showed that CePIP1;2, -2;3, -2;7, -2;8, and -2;11 were significantly down-regulated in mature leaves, whereas CePIP1;3 and -2;1 were up-regulated. To confirm the results, three dominant members, i.e., CePIP1;1, -2;1, and -2;8, were selected for qRT-PCR analysis, which includes three representative stages, i.e., young, mature, and senescing leaves. As shown in Fig. 3b, in contrast to CePIP2;1 that exhibited a bell-like expression pattern peaking in mature leaves, transcripts of both CePIP1;1 and -2;8 gradually decreased during leaf development. These results were largely consistent with transcriptome profiling, and the only difference is that CePIP1;1 was significantly down-regulated in mature leaves relative to young leaves. However, this may be due to different experiment conditions used, i.e., greenhouse vs natural conditions.

    Diurnal fluctuation expression patterns of CePIP1;1, -2;1, and -2;8 were also investigated in mature leaves and results are shown in Fig. 3c. Generally, transcripts of all three genes in the day (8, 12, 16, and 20 h) were higher than that in the night (24 and 4 h). During the day, both CePIP1;1 and -2;8 exhibited an unimodal expression pattern that peaked at 12 h, whereas CePIP2;1 possessed two peaks (8 and 16 h) and their difference was not significant. Nevertheless, transcripts of all three genes at 20 h (onset of night) were significantly lower than those at 8 h (onset of day) as well as 12 h. In the night, except for CePIP2;1, no significant difference was observed between the two stages for both CePIP1;1 and -2;8. Moreover, their transcripts were comparable to those at 20 h (Fig. 3c).

    To reveal the expression patterns of CePIP genes during tuber development, three representative stages, i.e., 40 DAS (early swelling stage), 85 DAS (late swelling stage), and 120 DAS (mature stage), were first profiled using transcriptome data. As shown in Fig. 4a, except for rare expression of CePIP1;2, -2;2, -2;9, and -2;10, most genes exhibited a bell-like expression pattern peaking at 85 DAS, in contrast to a gradual decrease of CePIP2;3 and -2;8. Notably, except for CePIP2;4, other genes were expressed considerably lower at 120 DAS than that at 40 DAS. For qRT-PCR confirmation of CePIP1;1, -2;1, and -2;8, seven stages were examined, i.e., 1, 5, 10, 15, 20, 25, and 35 DAI, which represent initiation, five stages of swelling, and maturation as described before[32]. As shown in Fig. 4b, two peaks were observed for all three genes, though their patterns were different. As for CePIP1;1, compared with the initiation stage (1 DAI), significant up-regulation was observed at the early swelling stage (5 DAI), followed by a gradual decrease except for the appearance of the second peak at 20 DAI, which is something different from transcriptome profiling. As for CePIP2;1, a sudden drop of transcripts first appeared at 5 DAI, then gradually increased until 20 DAI, which was followed by a gradual decrease at two late stages. The pattern of CePIP2;8 is similar to -1;1, two peaks appeared at 5 and 20 DAI and the second peak was significantly lower than the first. The difference is that the second peak of CePIP2;8 was significantly lower than the initiation stage. By contrast, the second peak (20 DAI) of CePIP2;1 was significantly higher than that of the first one (1 DAI). Nevertheless, the expression patterns of both CePIP2;1 and -2;8 are highly consistent with transcriptome profiling.

    Figure 4.  Transcript and protein abundances of CePIP genes during tuber development. (a) Transcriptome-based expression profiling of 14 CePIP genes during tuber development. The heatmap was generated using the R package implemented with a row-based standardization. Color scale represents FPKM normalized log2 transformed counts, where blue indicates low expression and red indicates high expression. (b) qRT-PCR-based expression profiling of CePIP1;1, -2;1, and -2;8 in seven representative stages of tuber development. (c) Relative protein abundance of CePIP1;1, -2;1, and -2;8 in three representative stages of tuber development. Bars indicate SD (N = 3) and uppercase letters indicate difference significance tested following Duncan's one-way multiple-range post hoc ANOVA (p < 0.01). (Ce: C. esculentus; DAI: days after tuber initiation; DAS: days after sowing; FPKM: Fragments per kilobase of exon per million fragments mapped; PIP: plasma membrane intrinsic protein).

    Since protein abundance is not always in agreement with the transcript level, protein profiles of three dominant members (i.e. CePIP1;1, -2;1, and -2;8) during tuber development were further investigated. For this purpose, we first took advantage of available proteomic data to identify CePIP proteins, i.e., leaves, roots, and four stages of tubers (freshly harvested, dried, rehydrated for 48 h, and sprouted). As shown in Supplemental Fig. S2, all three proteins were identified in both leaves and roots, whereas CePIP1;1 and -2;8 were also identified in at least one of four tested stages of tubers. Notably, all three proteins were considerably more abundant in roots, implying their key roles in root water balance.

    To further uncover their profiles during tuber development, 4D-PRM-based protein quantification was conducted in three representative stages of tuber development, i.e., 1, 25, and 35 DAI. As expected, all three proteins were identified and quantified. In contrast to gradual decrease of CePIP2;8, both CePIP1;1 and -2;1 exhibited a bell-like pattern that peaked at 25 DAI, though no significant difference was observed between 1 and 25 DAI (Fig. 4c). The trends are largely in accordance with their transcription patterns, though the reverse trend was observed for CePIP2;1 at two early stages (Fig. 4b & Fig. 4c).

    As predicted by WoLF PSORT, CePIP1;1, -2;1, and -2;8 may function in the cell membrane. To confirm the result, subcellular localization vectors named pNC-Cam1304-CePIP1;1, pNC-Cam1304-CePIP2;1, and pNC-Cam1304-CePIP2;8 were further constructed. When transiently overexpressed in tobacco leaves, green fluorescence signals of all three constructs were confined to cell membranes, highly coinciding with red fluorescence signals of the plasma membrane marker HbPIP2;3-RFP (Fig. 5).

    Figure 5.  (a) Schematic diagram of overexpressing constructs, (b) subcellular localization analysis of CePIP1;1, -2;1, and -2;8 in N. benthamiana leaves. (35S: cauliflower mosaic virus 35S RNA promoter; Ce: C. esculentus; EGFP: enhanced green fluorescent protein; kb: kilobase; NOS: terminator of the nopaline synthase gene; RFP: red fluorescent protein; PIP: plasma membrane intrinsic protein).

    Water balance is particularly important for cell metabolism and enlargement, plant growth and development, and stress responses[2,19]. As the name suggests, AQPs raised considerable interest for their high permeability to water, and plasma membrane-localized PIPs were proven to play key roles in transmembrane water transport between cells[1,18]. The first PIP was discovered in human erythrocytes, which was named CHIP28 or AQP1, and its homolog in plants was first characterized in Arabidopsis, which is known as RD28, PIP2c, or AtPIP2;3[3,7,53]. Thus far, genome-wide identification of PIP genes have been reported in a high number of plant species, including two model plants Arabidopsis and rice[10,11,1317,5456]. By contrast, little information is available on Cyperaceae, the third largest family within the monocot clade that possesses more than 5,600 species[57].

    Given the crucial roles of water balance for tuber development and crop production, in this study, tigernut, a representative Cyperaceae plant producing high amounts of oil in underground tubers[28,30,32], was employed to study PIP genes. A number of 14 PIP genes representing two phylogenetic groups (i.e., PIP1 and PIP2) or 12 orthogroups (i.e., PIP1A, PIP1B, PIP1C, PIP2A, PIP2B, PIP2C, PIP2D, PIP2E, PIP2F, PIP2G, PIP2H, and PIP2I) were identified from the tigernut genome. Though the family amounts are comparative or less than 13–21 present in Arabidopsis, cassava (Manihot esculenta), rubber tree (Hevea brasiliensis), poplar (Populus trichocarpa), C. cristatella, R. breviuscula, banana (Musa acuminata), maize (Zea mays), sorghum (Sorghum bicolor), barley (Hordeum vulgare), and switchgrass (Panicum virgatum), they are relatively more than four to 12 found in eelgrass (Zostera marina), Brachypodium distachyon, foxtail millet (Setaria italic), J. effuses, Aquilegia coerulea, papaya (Carica papaya), castor been (Ricinus communis), and physic nut (Jatropha curcas) (Supplemental Table S4). Among them, A. coerulea represents a basal eudicot that didn't experience the γ WGD shared by all core eudicots[50], whereas eelgrass is an early diverged aquatic monocot that didn't experience the τ WGD shared by all core monocots[56]. Interestingly, though both species possess two PIP1s and two PIP2s, they were shown to exhibit complex orthologous relationships of 1:1, 2:2, 1:0, and 0:1 (Supplemental Table S5). Whereas AcPIP1;1/AcPIP1;2/ZmPIP1;1/ZmPIP1;2 and ZmPIP2;1/AcPIP2;1 belong to PIP1A and PIP2A identified in this study, AcPIP2;2 and ZmPIP2;2 belong to PIP2H and PIP2I, respectively (Supplemental Table S5), implying that the last common ancestor of monocots and eudicots possesses only one PIP1 and two PIP2s followed by clade-specific expansion. A good example is the generation of AtPIP1;1 and -2;6 from AtPIP1;5 and -2;1 via the γ WGD, respectively[17].

    In tigernut, extensive expansion of the PIP subfamily was contributed by WGD (2), transposed (2), tandem (5), and dispersed duplications (3). It's worth noting that, two transposed repeats (i.e., CePIP1;1/-1;3 and CePIP2;1/-2;8) are shared by rice, implying their early origin that may be generated sometime after the split with the eudicot clade but before Cyperaceae-Poaceae divergence. By contrast, two WGD repeats (i.e., CePIP1;1/-1;2 and CePIP2;2/-2;4) are shared by C. cristatella, R. breviuscula, and J. effusus but not rice and Arabidopsis, implying that they may be derived from WGDs that occurred sometime after Cyperaceae-Poaceae split but before Cyperaceae-Juncaceae divergence. The possible WGD is the one that was described in C. littledalei[58], though the exact time still needs to be studied. Interestingly, compared with Arabidopsis (1) and rice (2), tandem/proximal duplications played a more important role in the expansion of PIP genes in tigernut (5) as well as other Cyperaceae species tested (5–6), which were shown to be Cyperaceae-specific or even species-specific. These tandem repeats may play a role in the adaptive evolution of Cyperaceae species as described in a high number of plant species[14,41]. According to comparative genomics analyses, tandem duplicates experienced stronger selective pressure than genes formed by other modes (WGD, transposed duplication, and dispersed duplication) and evolved toward biased functional roles involved in plant self-defense[41].

    As observed in most species such as Arabidopsis[10,1417], PIP genes in all Cyperaceae and Juncaceae species examined in this study, i.e., tigernut, C. cristatella, R. breviuscula, and J. effuses, feature three introns with conserved positions. By contrast, zero to three introns was not only found in rice but also in other Poaceae species such as maize, sorghum, foxtail millet, switchgrass, B. distachyon, and barley[54,55], implying lineage/species-specific evolution.

    Despite the extensive expansion of PIP genes (PIP2) in tigernut even after the split with R. breviuscula, CePIP1;1, -2;1, and -2;8 were shown to represent three dominant members in most tissues examined in this study, i.e., young leaf, mature leaf, sheath, rhizome, shoot apex, and tuber, though the situation in root is more complex. CePIP1;1 was characterized as a transposed repeat of CePIP1;3, which represents the most expressed member in root. Moreover, its recent WGD repeat CePIP1;2 was shown to be lowly expressed in most tested tissues, implying their divergence. The ortholog of CePIP1;1 in rice is OsPIP1;3 (RWC-3), which was shown to be preferentially expressed in roots, stems, and leaves, in contrast to constitutive expression of OsPIP1;1 (OsPIP1a) and -1;2[5961], two recent WGD repeats. Injecting the cRNA of OsPIP1;3 into Xenopus oocytes could increase the osmotic water permeability by 2–3 times[60], though the activity is considerably lower than PIP2s such as OsPIP2;2 and -2;2[6163]. Moreover, OsPIP1;3 was shown to play a role in drought avoidance in upland rice and its overexpression in lowland rice could increase root osmotic hydraulic conductivity, leaf water potential, and relative cumulative transpiration at the end of 10 h PEG treatment[64]. CePIP2;8 was characterized as a transposed repeat of CePIP2;1. Since their orthologs are present in both rice and Arabidopsis (Supplemental Table S3), the duplication event is more likely to occur sometime before monocot-eudicot split. Interestingly, their orthologs in rice, i.e., OsPIP2;1 (OsPIP2a) and -2;6, respectively, are also constitutively expressed[61], implying a conserved evolution with similar functions. When heterologously expressed in yeast, OsPIP2;1 was shown to exhibit high water transport activity[62,6466]. Moreover, root hydraulic conductivity was decreased by approximately four folds in OsPIP2;1 RNAi knock-down rice plants[64]. The water transport activity of OsPIP2;6 has not been tested, however, it was proven to be an H2O2 transporter that is involved in resistance to rice blast[61]. More work especially transgenic tests may improve our knowledge of the function of these key CePIP genes.

    Leaf is a photosynthetic organ that regulates water loss through transpiration. In tigernut, PIP transcripts in leaves were mainly contributed by CePIP1;1, -2;1, and -2;8, implying their key roles. During leaf development, in contrast to gradual decrease of CePIP1;1 and -2;8 transcripts in three stages (i.e. young, mature, and senescing) examined in this study, CePIP2;1 peaked in mature leaves. Their high abundance in young leaves is by cell elongation and enlargement at this stage, whereas upregulation of CePIP2;1 in mature leaves may inform its possible role in photosynthesis[67]. Thus far, a high number of CO2 permeable PIPs have been identified, e.g., AtPIP2;1, HvPIP2;1, HvPIP2;2, HvPIP2;3, HvPIP2;5, and SiPIP2;7[6870]. Moreover, in mature leaves, CePIP1;1, -2;1, and -2;8 were shown to exhibit an apparent diurnal fluctuation expression pattern that was expressed more in the day and usually peaked at noon, which reflects transpiration and the fact that PIP genes are usually induced by light[11,7173]. In rice, OsPIP2;4 and -2;5 also showed a clear diurnal fluctuation in roots that peaked at 3 h after the onset of light and dropped to a minimum 3 h after the onset of darkness[11]. Notably, further studies showed that temporal and dramatic induction of OsPIP2;5 around 2 h after light initiation was triggered by transpirational demand but not circadian rhythm[74].

    As an oil-bearing tuber crop, the main economic goal of tigernut cultivation is to harvest underground tubers, whose development is highly dependent on water available[32,75]. According to previous studies, the moisture content of immature tigernut tubers maintains more than 80.0%, followed by a seed-like dehydration process with a drop of water content to less than 50% during maturation[28,32]. Thereby, the water balance in developmental tubers must be tightly regulated. Like leaves, the majority of PIP transcripts in tubers were shown to be contributed by CePIP1;1, -2;1, and -2;8, which was further confirmed at the protein level. In accordance with the trend of water content during tuber development, mRNA, and protein abundances of CePIP1;1, -2;1, and -2;8 in initiation and swelling tubers were considerably higher than that at the mature stage. High abundances of CePIP1;1, -2;1, and -2;8 at the initiation stage reflects rapid cell division and elongation, whereas upregulation of CePIP1;1 and -2;1 at the swelling stage is in accordance with cell enlargement and active physiological metabolism such as rapid oil accumulation[28,30]. At the mature stage, downregulation of PIP transcripts and protein abundances resulted in a significant drop in the moisture content, which is accompanied by the significant accumulation of late embryogenesis-abundant proteins[23,32]. The situation is highly distinct from other tuber plants such as potato (Solanum tuberosum), which may contribute to the difference in desiccation resistance between two species[32,76]. It's worth noting that, in one study, CePIP2;1 was not detected in any of the four tested stages, i.e., freshly harvested, dried, rehydrated for 48 h, and sprouted tubers[23]. By contrast, it was quantified in all three stages of tuber development examined in this study, i.e., 1, 25, and 35 DAI (corresponding to freshly harvested tubers), which represent initiation, swelling, and maturation. One possible reason is that the protein abundance of CePIP2;1 in mature tubers is not high enough to be quantified by nanoLC-MS/MS, which is relatively less sensitive than 4D-PRM used in this study[30,46]. In fact, nanoLC-MS/MS-based proteomic analysis of 30 samples representing six tissues/stages only resulted in 2,257 distinct protein groups[23].

    Taken together, our results imply a key role of CePIP1;1, -2;1, and -2;8 in tuber water balance, however, the mechanism underlying needs to be further studied, e.g., posttranslational modifications, protein interaction patterns, and transcriptional regulators.

    To our knowledge, this is the first genome-wide characterization of PIP genes in tigernut, a representative Cyperaceae plant with oil-bearing tubers. Fourteen CePIP genes representing two phylogenetic groups or 12 orthogroups are relatively more than that present in two model plants rice and Arabidopsis, and gene expansion was mainly contributed by WGD and transposed/tandem duplications, some of which are lineage or even species-specific. Among these genes, CePIP1;1, -2;1, and -2;8 have evolved to be three dominant members that are constitutively expressed in most tissues, including leaf and tuber. Transcription of these three dominant members in leaves are subjected to development and diurnal regulation, whereas in tubers, their mRNA and protein abundances are positively correlated with the moisture content during tuber development. Moreover, their plasma membrane-localization was confirmed by subcellular localization analysis, implying that they may function in the cell membrane. These findings shall not only provide valuable information for further uncovering the mechanism of tuber water balance but also lay a solid foundation for genetic improvement by regulating these key PIP members in tigernut.

    The authors confirm contribution to the paper as follows: study conception and design, supervision: Zou Z; analysis and interpretation of results: Zou Z, Zheng Y, Xiao Y, Liu H, Huang J, Zhao Y; draft manuscript preparation: Zou Z, Zhao Y. All authors reviewed the results and approved the final version of the manuscript.

    All the relevant data is available within the published article.

    This work was supported by the Hainan Province Science and Technology Special Fund (ZDYF2024XDNY171 and ZDYF2024XDNY156), China; the National Natural Science Foundation of China (32460342, 31971688 and 31700580), China; the Project of Sanya Yazhou Bay Science and Technology City (SCKJ-JYRC-2022-66), China. The funders had no role in study design, data collection and analysis, decision to publish, or preparation of the manuscript.

  • The authors declare that they have no conflict of interest.

  • Supplementary Fig. S1 Heatmap of the bacteria phylum (A) as well as Shannon’s diversity (B&C) represented in the control soil (S), control (C), drought (D) and HA (H) rhizosphere microbiome.
    Supplementary Fig. S2 Wilcoxon Signed Rank Test for percent relative abundance of the abundant bacterial phylum in Control Soil, Control rhizosphere (Control Rhizo) and drought rhizosphere (Drought Rhizo) groups.
    Supplementary Fig. S3 Summary statistics of phenotypes.
    Supplementary Fig. S4 Wilcoxon Signed Rank Test for relative abundance of the abundant bacterial phyla in control soil, control rhizosphere and Humic Acid rhizosphere groups.
    Supplementary Fig. S5 Summary statistics of relative abundance of the top 12 of the most abundant baterial families.
    Supplementary Fig. S6 Summary analyses of LEfSe among control soil (S), control (C), drought (D) and HA (H) rhizosphere conditions.
  • [1]

    Rahman KM, Zhang D. 2018. Effects of fertilizer broadcasting on the excessive use of inorganic fertilizers and environmental sustainability. Sustainability 10:759

    doi: 10.3390/su10030759

    CrossRef   Google Scholar

    [2]

    Li Y, Fang F, Wei J, Wu X, Cui R, et al. 2019. Humic acid fertilizer improved soil properties and soil microbial diversity of continuous cropping peanut: a three-year experiment. Scientific Reports 9:12014

    doi: 10.1038/s41598-019-48620-4

    CrossRef   Google Scholar

    [3]

    Chen X, Kou M, Tang Z, Zhang A, Li H, Wei M. 2017. Responses of root physiological characteristics and yield of sweet potato to humic acid urea fertilizer. PLoS One 12:e0189715

    doi: 10.1371/journal.pone.0189715

    CrossRef   Google Scholar

    [4]

    Lahbouki S, Fernando AL, Rodrigues C, Ben-Laouane R, Ait-El-Mokhtar M, et al. 2023. Effects of Humic Substances and Mycorrhizal Fungi on Drought-Stressed Cactus: Focus on Growth, Physiology, and Biochemistry. Plants 12:4156

    doi: 10.3390/plants12244156

    CrossRef   Google Scholar

    [5]

    Naylor D, Coleman-Derr D. 2018. Drought stress and root-associated bacterial communities. Frontiers in Plant Science 8:2223

    doi: 10.3389/fpls.2017.02223

    CrossRef   Google Scholar

    [6]

    Naylor D, DeGraaf S, Purdom E, Coleman-Derr D. 2017. Drought and host selection influence bacterial community dynamics in the grass root microbiome. The ISME Journal 11:2691−704

    doi: 10.1038/ismej.2017.118

    CrossRef   Google Scholar

    [7]

    Liu H, Wang Q, Chen M, Ding Y, Yang X, et al. 2020. Genome-wide identification and analysis of heterotic loci in three maize hybrids. Plant Biotechnology Journal 18(1):185−94

    doi: 10.1111/pbi.13186

    CrossRef   Google Scholar

    [8]

    Xua L, Naylora D, Donga Z, Simmonsa T, Pierroza G, et al. 2018. Drought delays development of the sorghum root microbiome and enriches for monoderm bacteria. Proceedings of the National Academy of Sciences of the United States of America 115:E4284−E4293

    doi: 10.1073/pnas.1717308115

    CrossRef   Google Scholar

    [9]

    Magoč T, Salzberg SL. 2011. FLASH: fast length adjustment of short reads to improve genome assemblies. Bioinformatics 27:2957−63

    doi: 10.1093/bioinformatics/btr507

    CrossRef   Google Scholar

    [10]

    Edgar RC. 2013. UPARSE: highly accurate OTU sequences from microbial amplicon reads. Nature Methods 10:996−98

    doi: 10.1038/nmeth.2604

    CrossRef   Google Scholar

    [11]

    Dray S, Dufour AB. 2007. The ade4 Package: Implementing the Duality Diagram for Ecologists. Journal of Statistical Software 22:1

    doi: 10.18637/jss.v022.i04

    CrossRef   Google Scholar

    [12]

    Oksanen J, Simpson GL, Blanchet FG, Kindt R, Legendre P, et al. 2024. Vegan: Community Ecology Package. R Package Version 2.6-8. https://rdrr.io/cran/vegan/

    [13]

    Benjamini Y, Hochberg Y. 1995. Controlling the False Discovery Rate: A Practical and Powerful Approach to Multiple Testing. Journal of the Royal Statistical Society: Series B (Methodological) 57:289−300

    doi: 10.1111/j.2517-6161.1995.tb02031.x

    CrossRef   Google Scholar

    [14]

    da Silva MSRdA, Huertas Tavares OC, Ribeiro TG, da Silva CSRdA, da Silva CSRdA, et al. 2021. Humic acids enrich the plant microbiota with bacterial candidates for the suppression of pathogens. Applied Soil Ecology 168:104146

    doi: 10.1016/j.apsoil.2021.104146

    CrossRef   Google Scholar

    [15]

    Aguiar NO, Medici LO, Olivares FL, Dobbss LB, Torres-Netto A, et al. 2016. Metabolic profile and antioxidant responses during drought stress recovery in sugarcane treated with humic acids and endophytic diazotrophic bacteria. Annals of Applied Biology 168:203−13

    doi: 10.1111/aab.12256

    CrossRef   Google Scholar

    [16]

    Rui R, Hei J, Li Y, Al Farraj DA, Noor F, et al. 2024. Effects of humic acid fertilizer on the growth and microbial network stability of Panax notoginseng from the forest understorey. Scientific Reports 14:17816

    doi: 10.1038/s41598-024-68949-9

    CrossRef   Google Scholar

    [17]

    George NM, Hany-Ali G, Abdelhaliem E, Abdel-Haleem M. 2024. Alleviating the drought stress and improving the plant resistance properties of Triticum aestivum via biopriming with aspergillus fumigatus. BMC Plant Biology 24:150

    doi: 10.1186/s12870-024-04840-z

    CrossRef   Google Scholar

    [18]

    Chen Q, Qu Z, Ma G, Wang W, Dai J, et al. 2022. Humic acid modulates growth, photosynthesis, hormone and osmolytes system of maize under drought conditions. Agricultural Water Management 263:107447

    doi: 10.1016/j.agwat.2021.107447

    CrossRef   Google Scholar

  • Cite this article

    Sun M, Zhang L, Zhu H, Kang C, Li X, et al. 2024. Responses of microbial communities to drought stress and humic acid fertilizer in maize. Genomics Communications 1: e006 doi: 10.48130/gcomm-0024-0006
    Sun M, Zhang L, Zhu H, Kang C, Li X, et al. 2024. Responses of microbial communities to drought stress and humic acid fertilizer in maize. Genomics Communications 1: e006 doi: 10.48130/gcomm-0024-0006

Figures(5)

Article Metrics

Article views(851) PDF downloads(139)

ARTICLE   Open Access    

Responses of microbial communities to drought stress and humic acid fertilizer in maize

Genomics Communications  1 Article number: e006  (2024)  |  Cite this article

Abstract: Humic acid (HA) fertilizer was previously considered to be able to enlarge the effective absorption area of roots and promote plant root growth. Recent evidence suggests that certain root-associated microbes might be able to mitigate the negative responses of drought stress. In this study, the abundance and diversity of root-associated bacterial communities under HA fertilizer and drought stress treatments were explored. Rhizosphere microbiomes of three groups (HA, drought, and control) and microbiomes from bulk soil were collected during the flowering period in maize. Using Illumina Hiseq2500, the bacterial data for the V4 region of the 16S rRNA gene was obtained. Analysis of the sequencing data from 40 bacteria phyla revealed the abundance levels of the 12 bacterial communities were significantly different in the rhizosphere of the drought-treated samples compared to the controls. Two of these phyla, Actinobacteria and Bacteroidetes, were also significantly enriched or depleted in HA fertilizer-treated samples. The results underscore the dynamics of the rhizosphere microbiomes under drought stress and indicate the association between HA and rhizosphere microbiomes. However, more studies are warranted to understand the effect of HA fertilizer and beneficial microbiomes in responding to drought.

    • Climate change and soil erosion have provided unprecedented challenges to meet the rising demand for higher-quality food for the world's growing population. Over the past decades, maize productivity has experienced continuous improvement owing to technological innovations. The application of inorganic fertilizers has contributed to the intensity of agricultural production such as maize productivity[1]. The overuse of inorganic fertilizers, such as chemical nitrogen (N) fertilizer, can have adverse effects on both soil and groundwater[1]. Rather than relying on inorganic fertilizers derived from fossil fuels, using organic matter presents a promising alternative to remineralize depleted soil, enhance soil fertility, and ultimately increase crop productivity without adding to the environmental burden.

      Humic acid (HA) is an organic matter produced and accumulated by plants and animals. It is a residual substance through the decomposition of microorganisms accompanied by geochemistry processes[2]. A previous study suggested HA fertilizer could expand the effective absorption area of roots and enhance root growth[3]. Therefore, HA fertilizer promotes the recruitment of nutritional resources such as carbon (C) and N from both the fertilizer and bulk soil. Under water stress, studies showed that HA fertilization stimulates root development, i.e., increased root length and root dry weight, thereby delaying the drought stress responses[4]. However, the connections between HA and drought resistance, especially at the rhizosphere microbiome level, remain unclear.

      Recent evidence suggests that certain root-associated microbes likely mitigate the negative responses of drought stress, such as Actinobacteria and Firmicutes[5,6]. To test the hypothesis that HA delays negative drought responses in root development through enriching or depleting certain root-associated microbes, in this study, experiments were conducted to explore the effects of root-associated bacterial communities on several phenotypes during maize development and to determine how HA and drought influences the composition of root-associated microbial communities. Phenotypic traits for maize hybrids were collected during the flowering period under three different treatments (HA, drought, and control). The bacterial community was characterized from rhizospheres and bulk soils for the V4 region of the 16S rRNA gene using Illumina Hiseq2500 sequencer. A total of 18 samples (six individual plants per treatment) were collected for rhizosphere microbiome sampling, and six samples from the control were used for bulk soil microbiome sampling, resulting in ~763 million reads. Across all the samples, 40 bacterial phyla were detected in these four sample types (rhizosphere microbiomes from the control, HA, and drought group, as well as bacterial microbiomes of bulk soil from the control group).

    • The experiment was conducted on the Shandong Agricultural University research farm (Shandong, China). The soil was collected manually with sterile shovels from the farm and was then allocated equally into pots. Before planting, the soil was treated with commercial compound fertilizer (normal fertilization, N15-P15-K15) and commercial organic HA fertilizer (N15-P15-K15 + HA fertilization). Then, Xianyu335, a commercial maize hybrid, was planted with three treatments: (1) control group with normal fertilizer and conventional growth conditions; (2) HA group with HA fertilizer and conventional growth conditions; and (3) drought group with the normal fertilizer as that in the control group and moderate drought growth conditions (45% soil water content, SWC). The experiment was conducted following a completely randomized design with six replications per treatment.

    • The number of leaves (#Leaf) were counted on days 43, 49, 56, and 71 after sowing. Plant height (PH) was measured from the ground to the top of each plant, as described previously[7]. Days to silking (DTS) and days to pollen shed (DTP) were recorded for each plant.

    • Root samples were collected manually using a sterile shovel to a depth of approximately 20−30 cm, following a previously described method[8]. Sample collection was conducted during the flowering stage. Root samples were vortexed in sterile phosphate-buffered saline (PBS) buffer (Catalog No. E607008; Sangon Biotech, Shanghai, China) for 10 min at 14,000× g and centrifuged to obtain rhizosphere soil pellet after removing the root tissue. DNA extraction was performed using the FastDNA™ SPIN Kit for Soil (Catalog No. 116560200; FastDNA™, Solon, OH, USA) following the manufacturer's protocol. In brief, up to 500 mg of soil sample were added to a Lysing Matrix E tube with Sodium Phosphate Buffer, then were homogenized and centrifuged at 14,000× g for 10 min. The supernatant was transferred to a new microcentrifuge tube with a protein precipitation solution. After mixing, the tube was centrifuged at 14,000× g for 5 min. The supernatant was transferred and resuspended with binding matrix suspension to allow the binding of DNA. Finally, after quality checking the DNA by using a NanoDrop-2000 (Therml Fisher Scientific), the purified DNA was stored at −80 °C for further analysis.

    • After the quality checking of the DNA sample, all the qualified DNA was used to construct the 16S library. Briefly, the qualified DNA samples were amplified using a dual-indexed primer specific to the V4 region (515F (5'-GTGCCAGCMGCCGCGGTAA-3') and 806R (5'-GGACTACHVGGGTWTCTAAT-3')), and the PCR product was converted into blunt ends with T4 DNA polymerase, Klenow fragment, and T4 polynucleotide kinase. Then, after A tailing of the 3' end of each fragment, adapters were added. Then, AMPureXP beads (Beckman-Coulter, West Sacramento, CA, USA) was used to remove fragments that were too short. Finally, libraries quality checked by a Qubit 3.0 fluorometer (Life Technologies) were sequenced with paired-end 250-bp reads using Illumina Hiseq2500.

    • After sequencing, the raw data were cleaned by removing low-quality reads and reads contaminated by adapters, with a maximum of three bases mismatch allowed. The paired-end reads with overlap were merged into tags using FastLength Adjustment of Short reads (FLASH, v1.2.11)[9] with a minimal overlap length of 15 bp and the mismatching ratio of an overlapped region less than or equal to 0.1. Tags were then clustered into the operational taxonomic unit (OTU) using USEARCH (v7.0.1.1090)[10]. Principal component analysis (PCA) was then used to summarize factors mainly responsible for the differences of OTU composition in different samples, the similarity is high if two samples are closely located. Based on the OTU abundance information, the relative abundance of each OTU in each sample was be calculated, and the PCA of OTU was carried out with the relative abundance value. The Bray-Curtis distance matrix was used to assess the dissimilarity between samples. The software used in this step was package 'ade4' of the software[11] in R. To assess the statistical significance of the clustering observed in PCA, a PERMANOVA (Permutational Multivariate Analysis of Variance) was performed using the 'vegan' package[12] in R.

    • Student's t-test for phenotypic traits was used to determine the difference between different groups. The abundance differences of microbial communities between groups were detected by Wilcoxon signed-rank test and the p values were adjusted using the FDR approach[13]. Meanwhile, Linear Discriminant Analysis Effect Size (LEfSe) was incorporated to identify key taxa contributing to differences between conditions.

    • To investigate the potential effect of drought on plant growth and root-associated microbiomes, the plants were subjected to drought treatment (45% SWC). The rhizosphere and bulk soil samples were collected from maize hybrids to characterize microbial communities using next-generation sequencing (Fig. 1a). The phenotypic results revealed dramatic differences in plant height and root traits between control and drought conditions (Fig. 1b). The weights of both fresh (p < 0.01) and dry roots (p < 0.05) were significantly greater in the control group than drought group at the same stage (Fig. 1b bottom left, Fig. 1c & d). The plant height of the drought group was significantly shorter than that of the control group during the flowering stage (Fig. 1b middle left, Fig. 2a). Plant height was measured on days 43, 49, and 56 after planting. The results indicated that plant height at stages d49 and d56 was significantly decreased due to drought stress (Fig. 2a, p < 0.001). Meanwhile, the number of leaves were measured on days 43, 49, 56, and 71. The number of leaves were significantly higher in the control group at the earlier stage, however, more leaves were observed at the later stage in the drought group, and DTP were significantly delayed in the drought group (Fig. 2a, p < 0.05), which may indicate compensatory and delayed growth of plants due to drought stress.
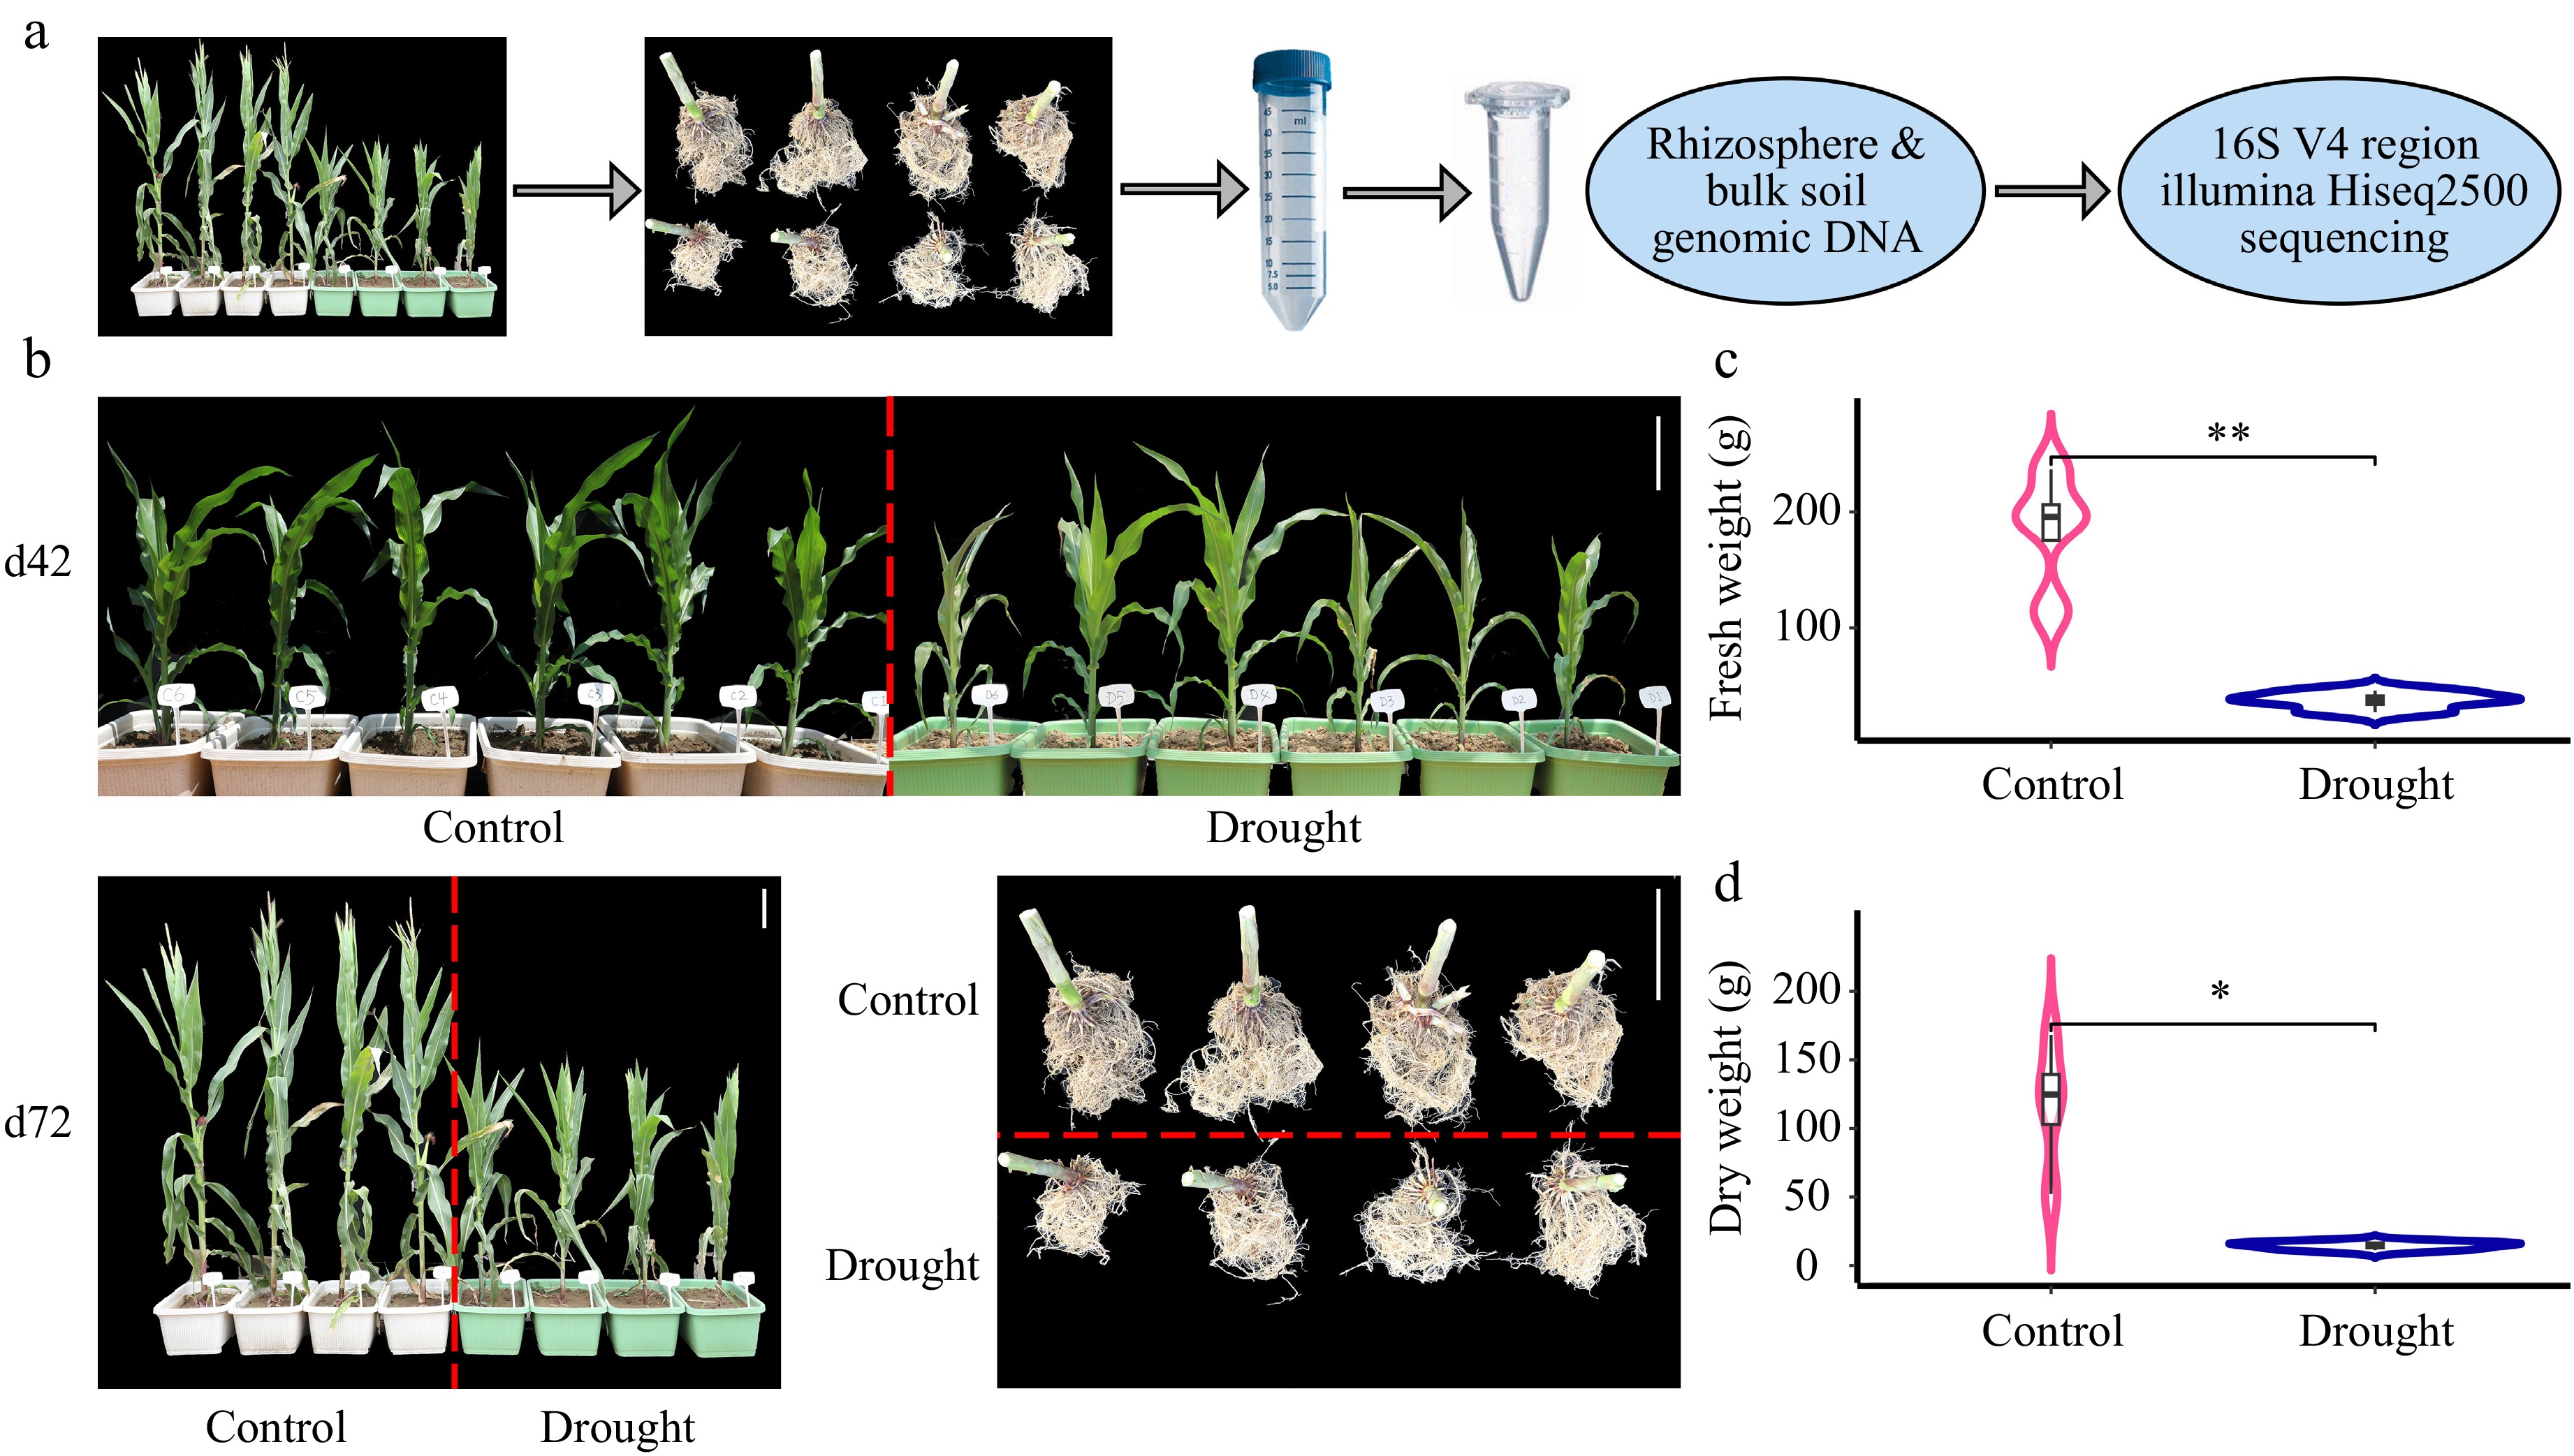
      Figure 1. 

      Root performs significantly differently under drought stress vs normal conditions. (a) Flowchart of the study performed from the field work to the next generation sequencing. (b) The plant growth at days 42 (d42) and harvest at d72, as well as the root harvest at d72 under control and drought conditions, the scale bar is 20 cm. Statistics of the weight of (c) fresh roots, and (d) dry roots using R/Student's t test between each two of the control and drought groups. ** indicates p < 0.01, * indicates p < 0.05.
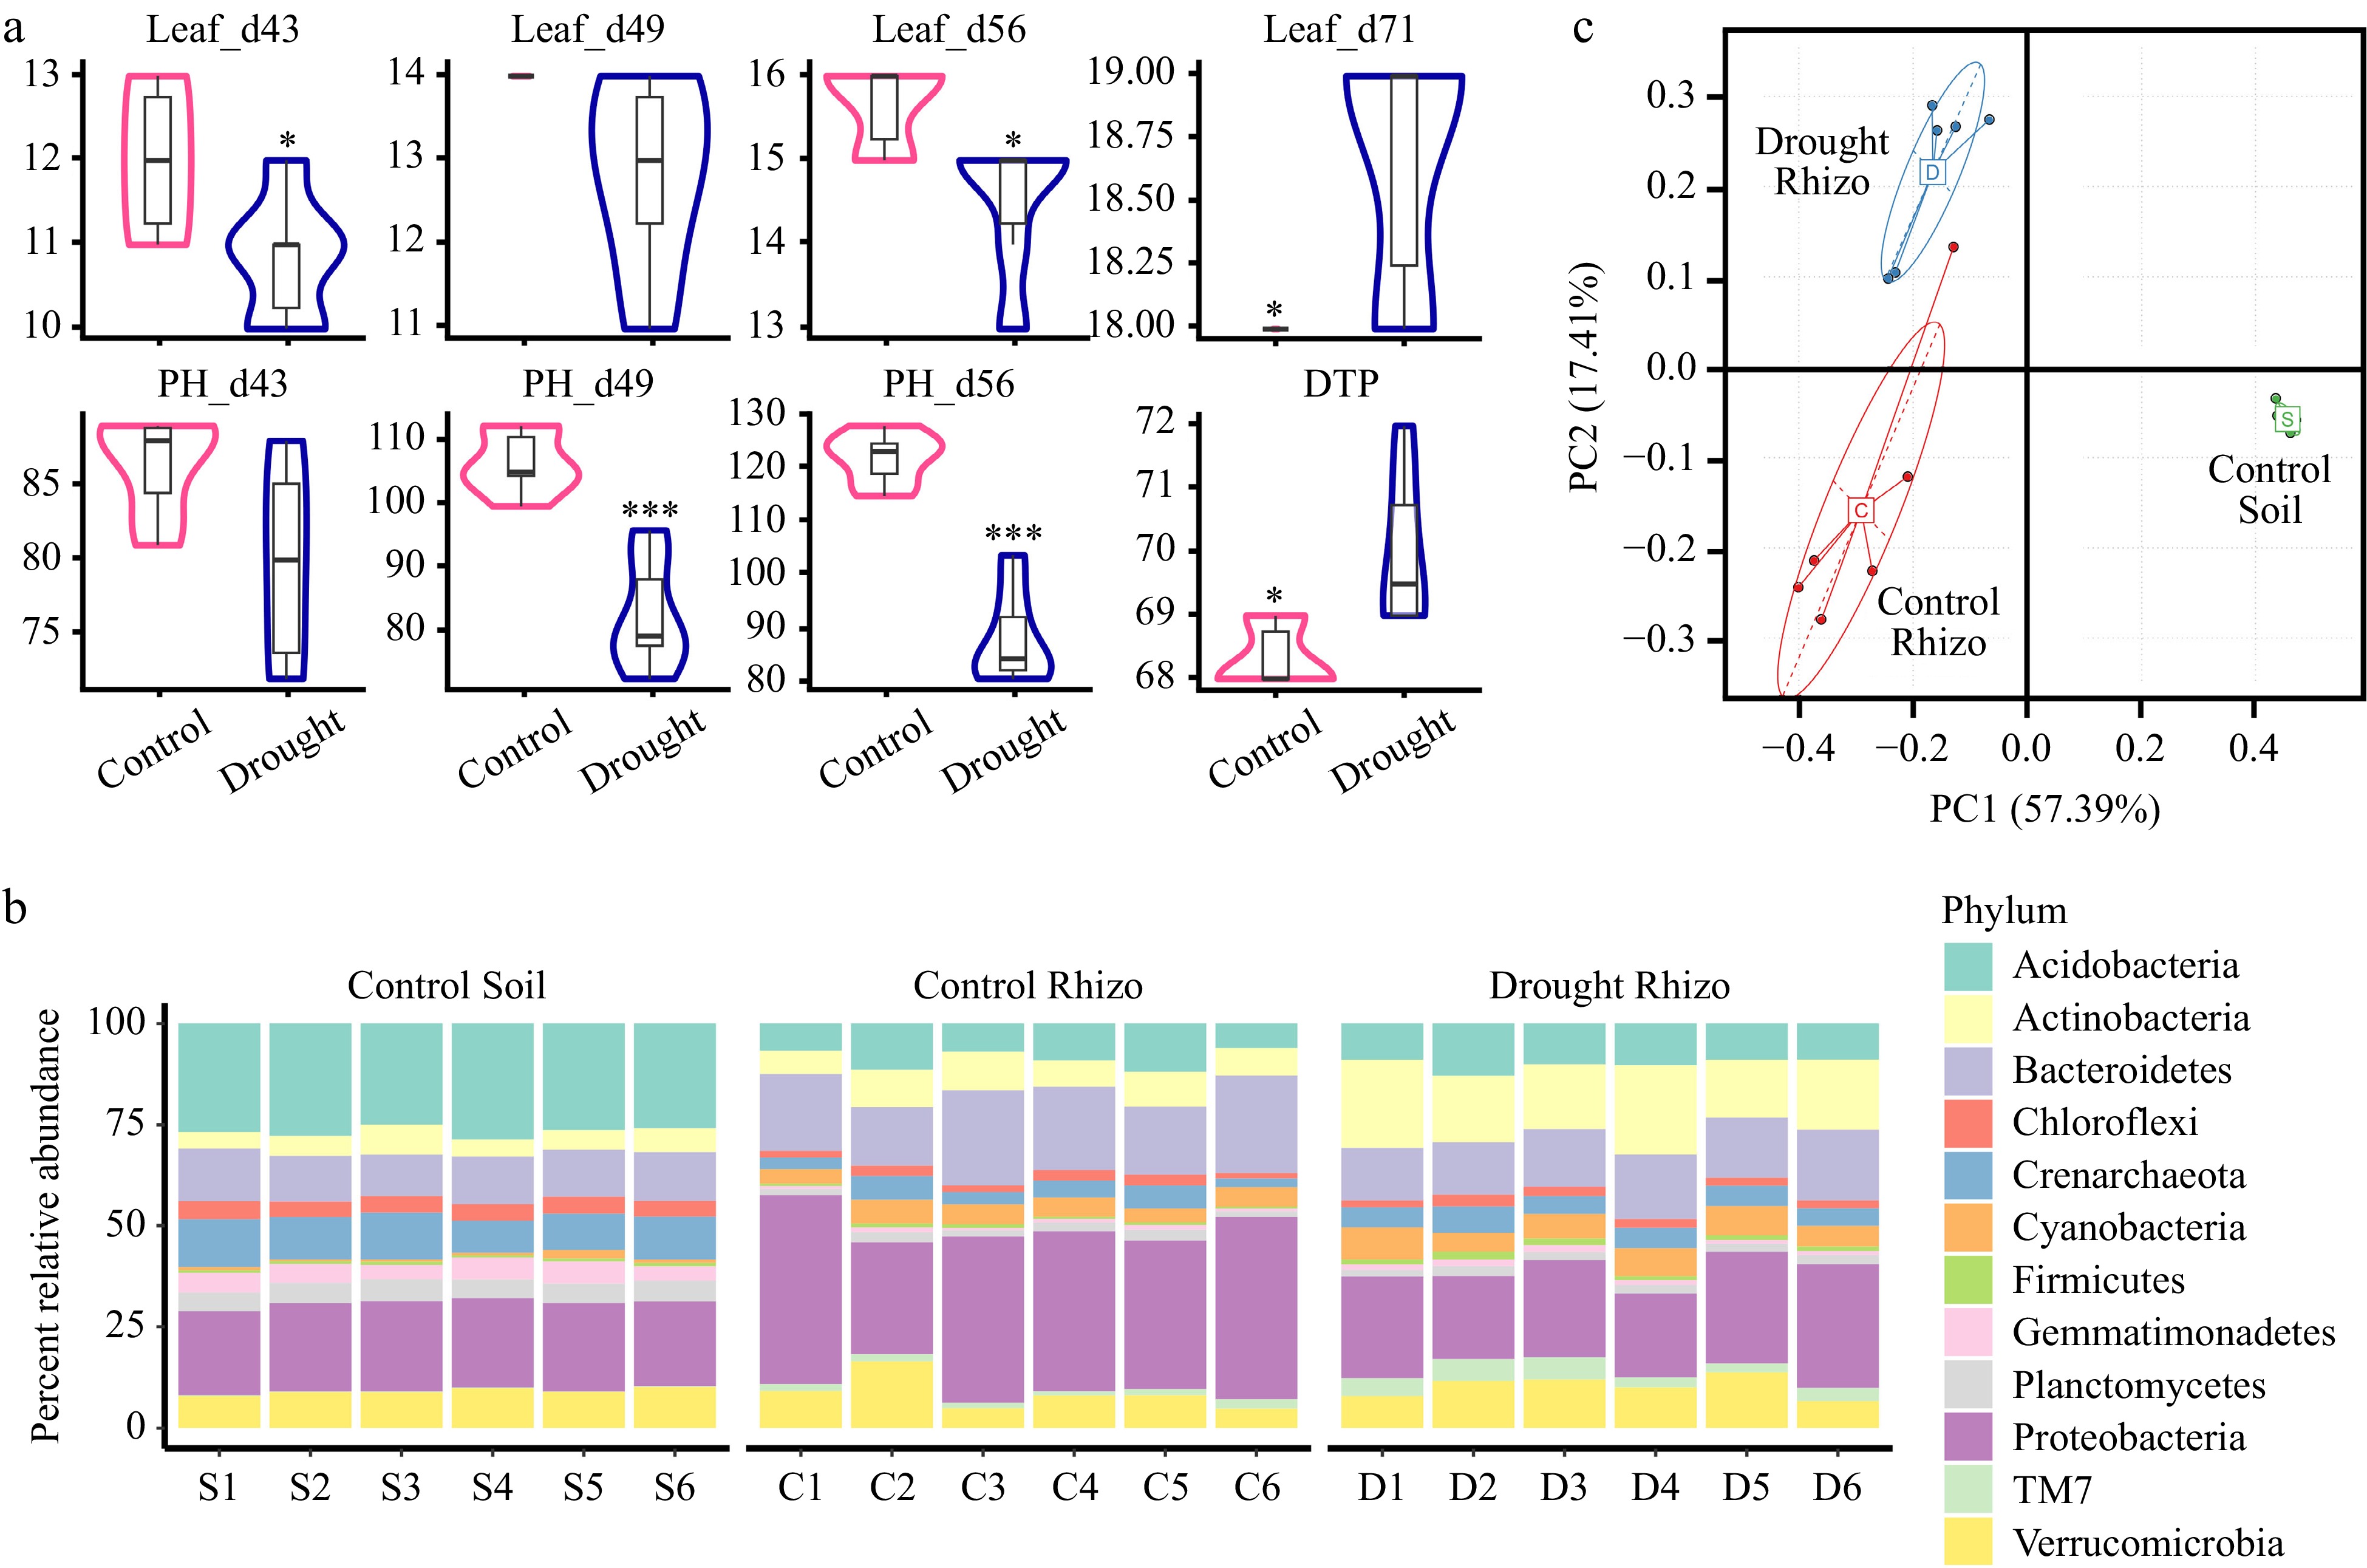
      Figure 2. 

      Summary statistics of phenotypes and relative abundance of the top 12 of the most abundant bacterial phyla. (a) Summary statistics of number of leaves (#Leaf) on days 43, 49, 56, and 71 after sowing, plant height (PH, cm) at days 43, 49, and 56 after sowing, and days to pollen shed (DTP, days) using Student's t test between cotrol and drought groups. * indicates p < 0.05, *** indicates p < 0.001. (b) Percent relative abundance of the most abundant phyla for control, drought treatments in rhizospheres and for control in bulk soils. All individuals were arranged in order within each group along the x axis. (c) Principal component analysis across the phyla from the Control Soil, control rhizosphere (Control Rhizo), and drought rhizosphere (Drought Rhizo) microbiome data.

    • A previous study on sorghum reported that drought delayed the development of the root microbiome and led to a higher abundance and greater activity of monoderm bacteria[13]. In this study, the effect of drought on root-associated microbial communities in maize was explored. As expected, the bulk soil microbiomes and maize rhizosphere microbiomes showed different patterns (Supplementary Fig. S1). The present results suggested that the composition of the rhizosphere at the phylum level caused by drought treatment differed significantly from that of the control (Figs 2b, 3; Supplementary Fig. S2). PCA was used to explore the differences in OTU composition across the samples. The PCA plot (Fig. 2c) showed a clear clustering of the samples based on their OTU profiles. Samples that were more similar in the drought group are located closer together, and similar patterns were observed in the control rhizosphere group, and the control soil group. The PERMANOVA results confirmed that the clustering observed in the PCA was statistically significant (p < 0.001). Consistent with the previous report on sorghum[13], the relative abundance of Actinobacterial and Firmicutes were significantly enriched and the relative abundance of the Proteobacterial and Fibrobacteres were significantly depleted in the rhizosphere microbiome of the drought group compared to the controls (Fig. 3a, p < 0.01). In addition, compared with the control group, some other microbes at the phylum level were significantly over-represented in the rhizosphere of the drought group, such as Euryarchaeota, Chlorobi, while some microbes at the phylum level were significantly depleted, such as Tenericutes (Fig. 3a, p < 0.01). LEfSe analysis was further conducted to identify key microbial taxa that were differentially abundant between the control and drought groups. These taxa, including Actinobacterial and Firmicutes, were visualized using a cladogram (Fig. 3b). The results indicated that these specific microbial groups were more prevalent under drought conditions, suggesting their potential role in shaping the microbial community structure in response to drought conditions.
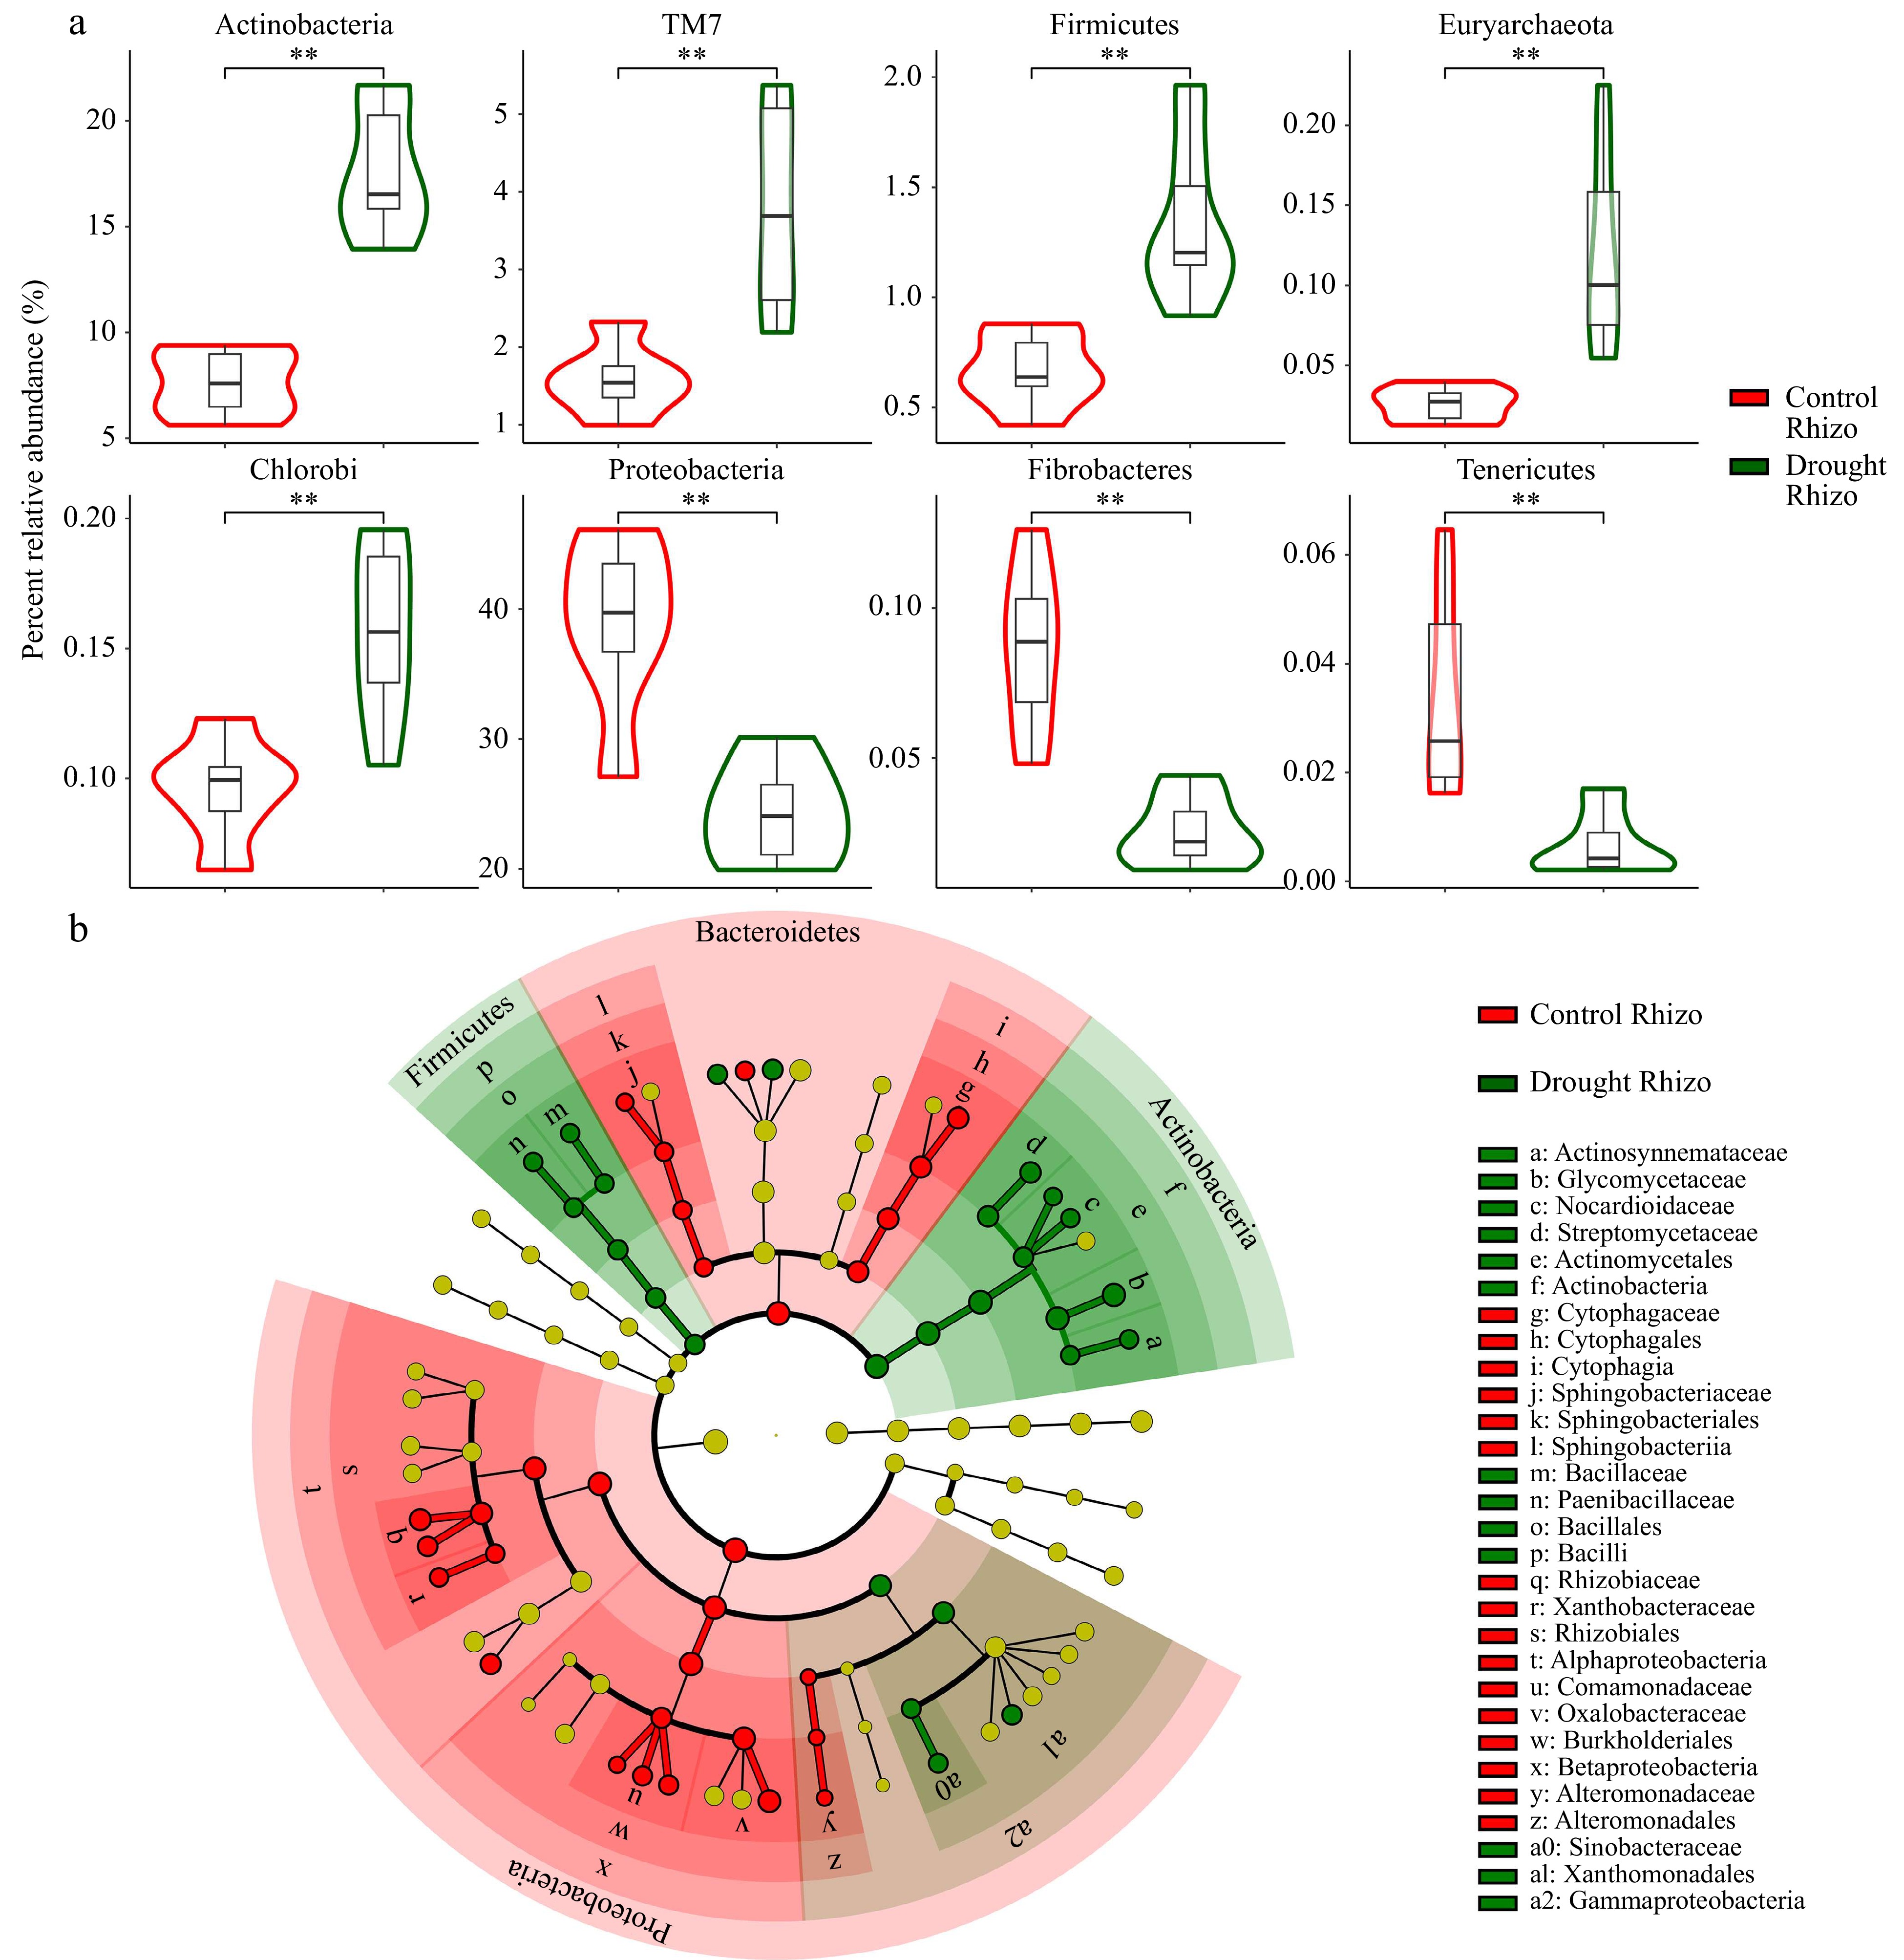
      Figure 3. 

      (a) Wilcoxon Signed Rank Test for relative abundance of the abundant bacterial phyla, and (b) LEfSe analysis in control (red) and drought (darkgreen) groups. ** indicates p < 0.01.

    • Previous studies suggested that HA regulates plant growth by altering the root exudation profile[14] and played a role in protecting plants against water stress when co-inoculated with bacteria[15]. To further test the hypothesis that HA has a greater influence on the development of the root microbiome compared to the control during the flowering period, commercial compound fertilizers and organic HA fertilizer treatments were utilized. During the flowering stage, the HA group exhibited better-developed lateral roots compared to the control (Fig. 4a bottom left), although there were no statistically significant differences in both fresh and dry root weights between the two groups (Fig. 4b & c). Meanwhile, most of the phenotypes detected in this study showed minor differences between the control and HA group, except that the plant height at the earlier stage was significantly higher in the HA group (Supplementary Fig. S3). This result indicates that HA may play a potential role on belowground root traits but have little effect on aboveground traits.
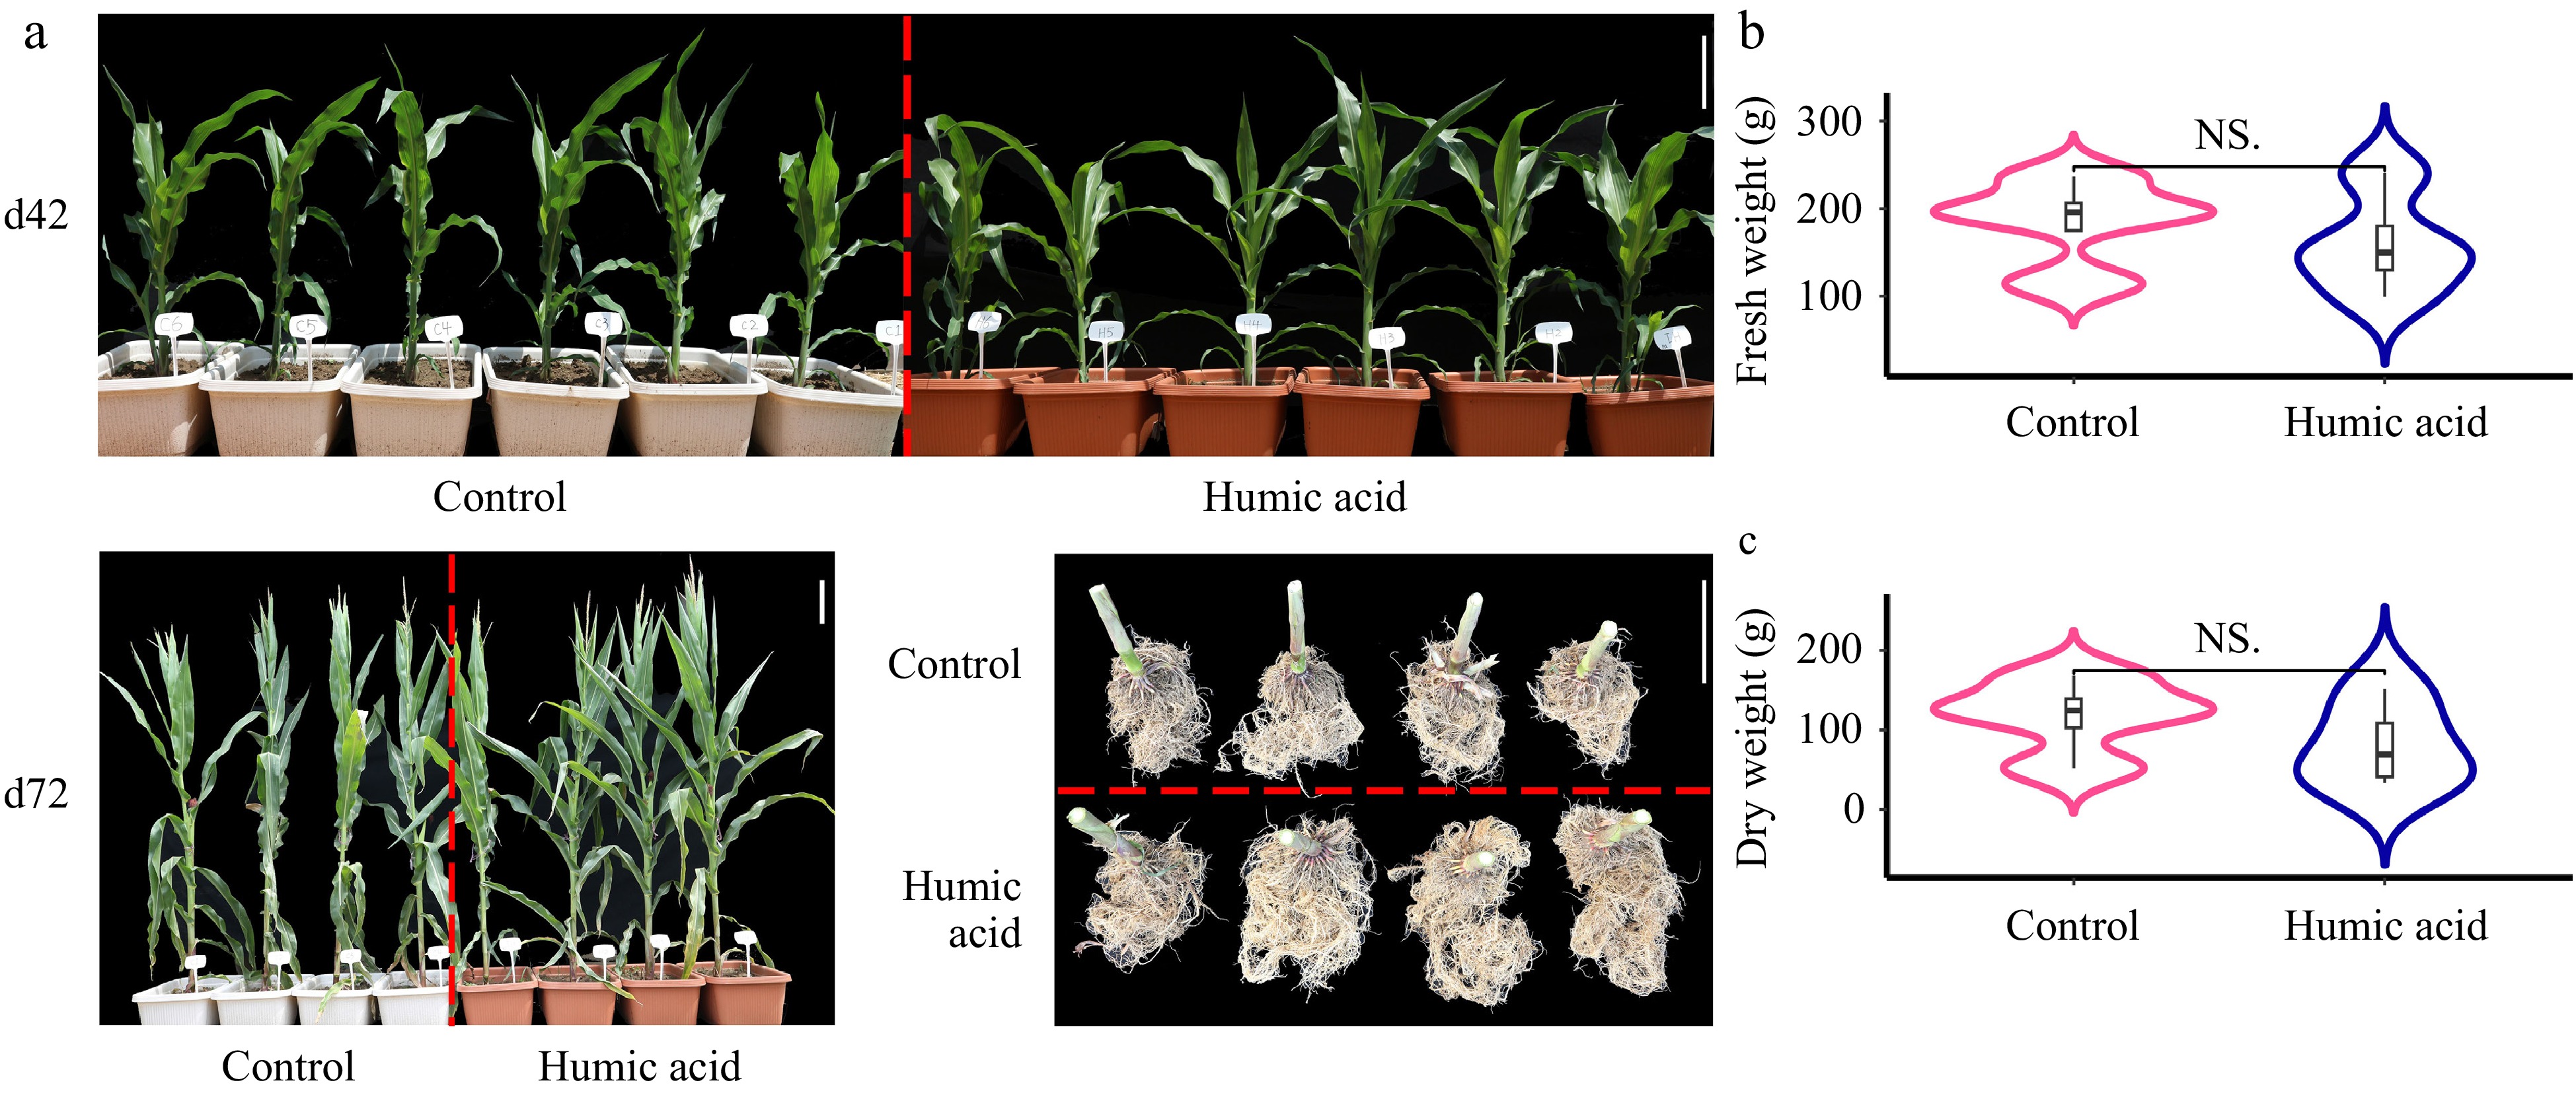
      Figure 4. 

      Humic acid potentially benefits root growth vs normal conditions. (a) The plants grown on days 42 (d42) and harvested at d72, as well as the roots harvested on d72 under control and humic acid conditions, the scale bar = 20 cm. Statistics of the weight of (b) fresh roots, and (c) dry roots using R/Student's t test between the control and humic acid conditions. 'NS' indicates not significant.

      To better understand the potential role of HA fertilization on the root microbiome, the root microbiome under HA fertilization was determined. Phylum-level relative abundance of Acidobacteria, Acitinobacteria, Bacteroidetes, Crenarchaeota, Cyanobacteria, and Proterobacteria revealed that the rhizosphere microbiomes exhibited a different composition compared to the control (Fig. 5a, 'Control Rhizo' and 'Humic Acid Rhizo'; results of statistical analyses were shown in Supplementary Fig. S4). While the above results suggest a different pattern for an abundance of these rhizosphere microbiomes on the phylum level during the development of the root microbiome under HA-treated environments. Evidence of the root rhizosphere microbiome is observable in these microbial lineages when a finer taxonomic resolution was used, as illustrated by family-level changes (Fig. 5b; results of statistical analyses are shown in Supplementary Fig. S5).
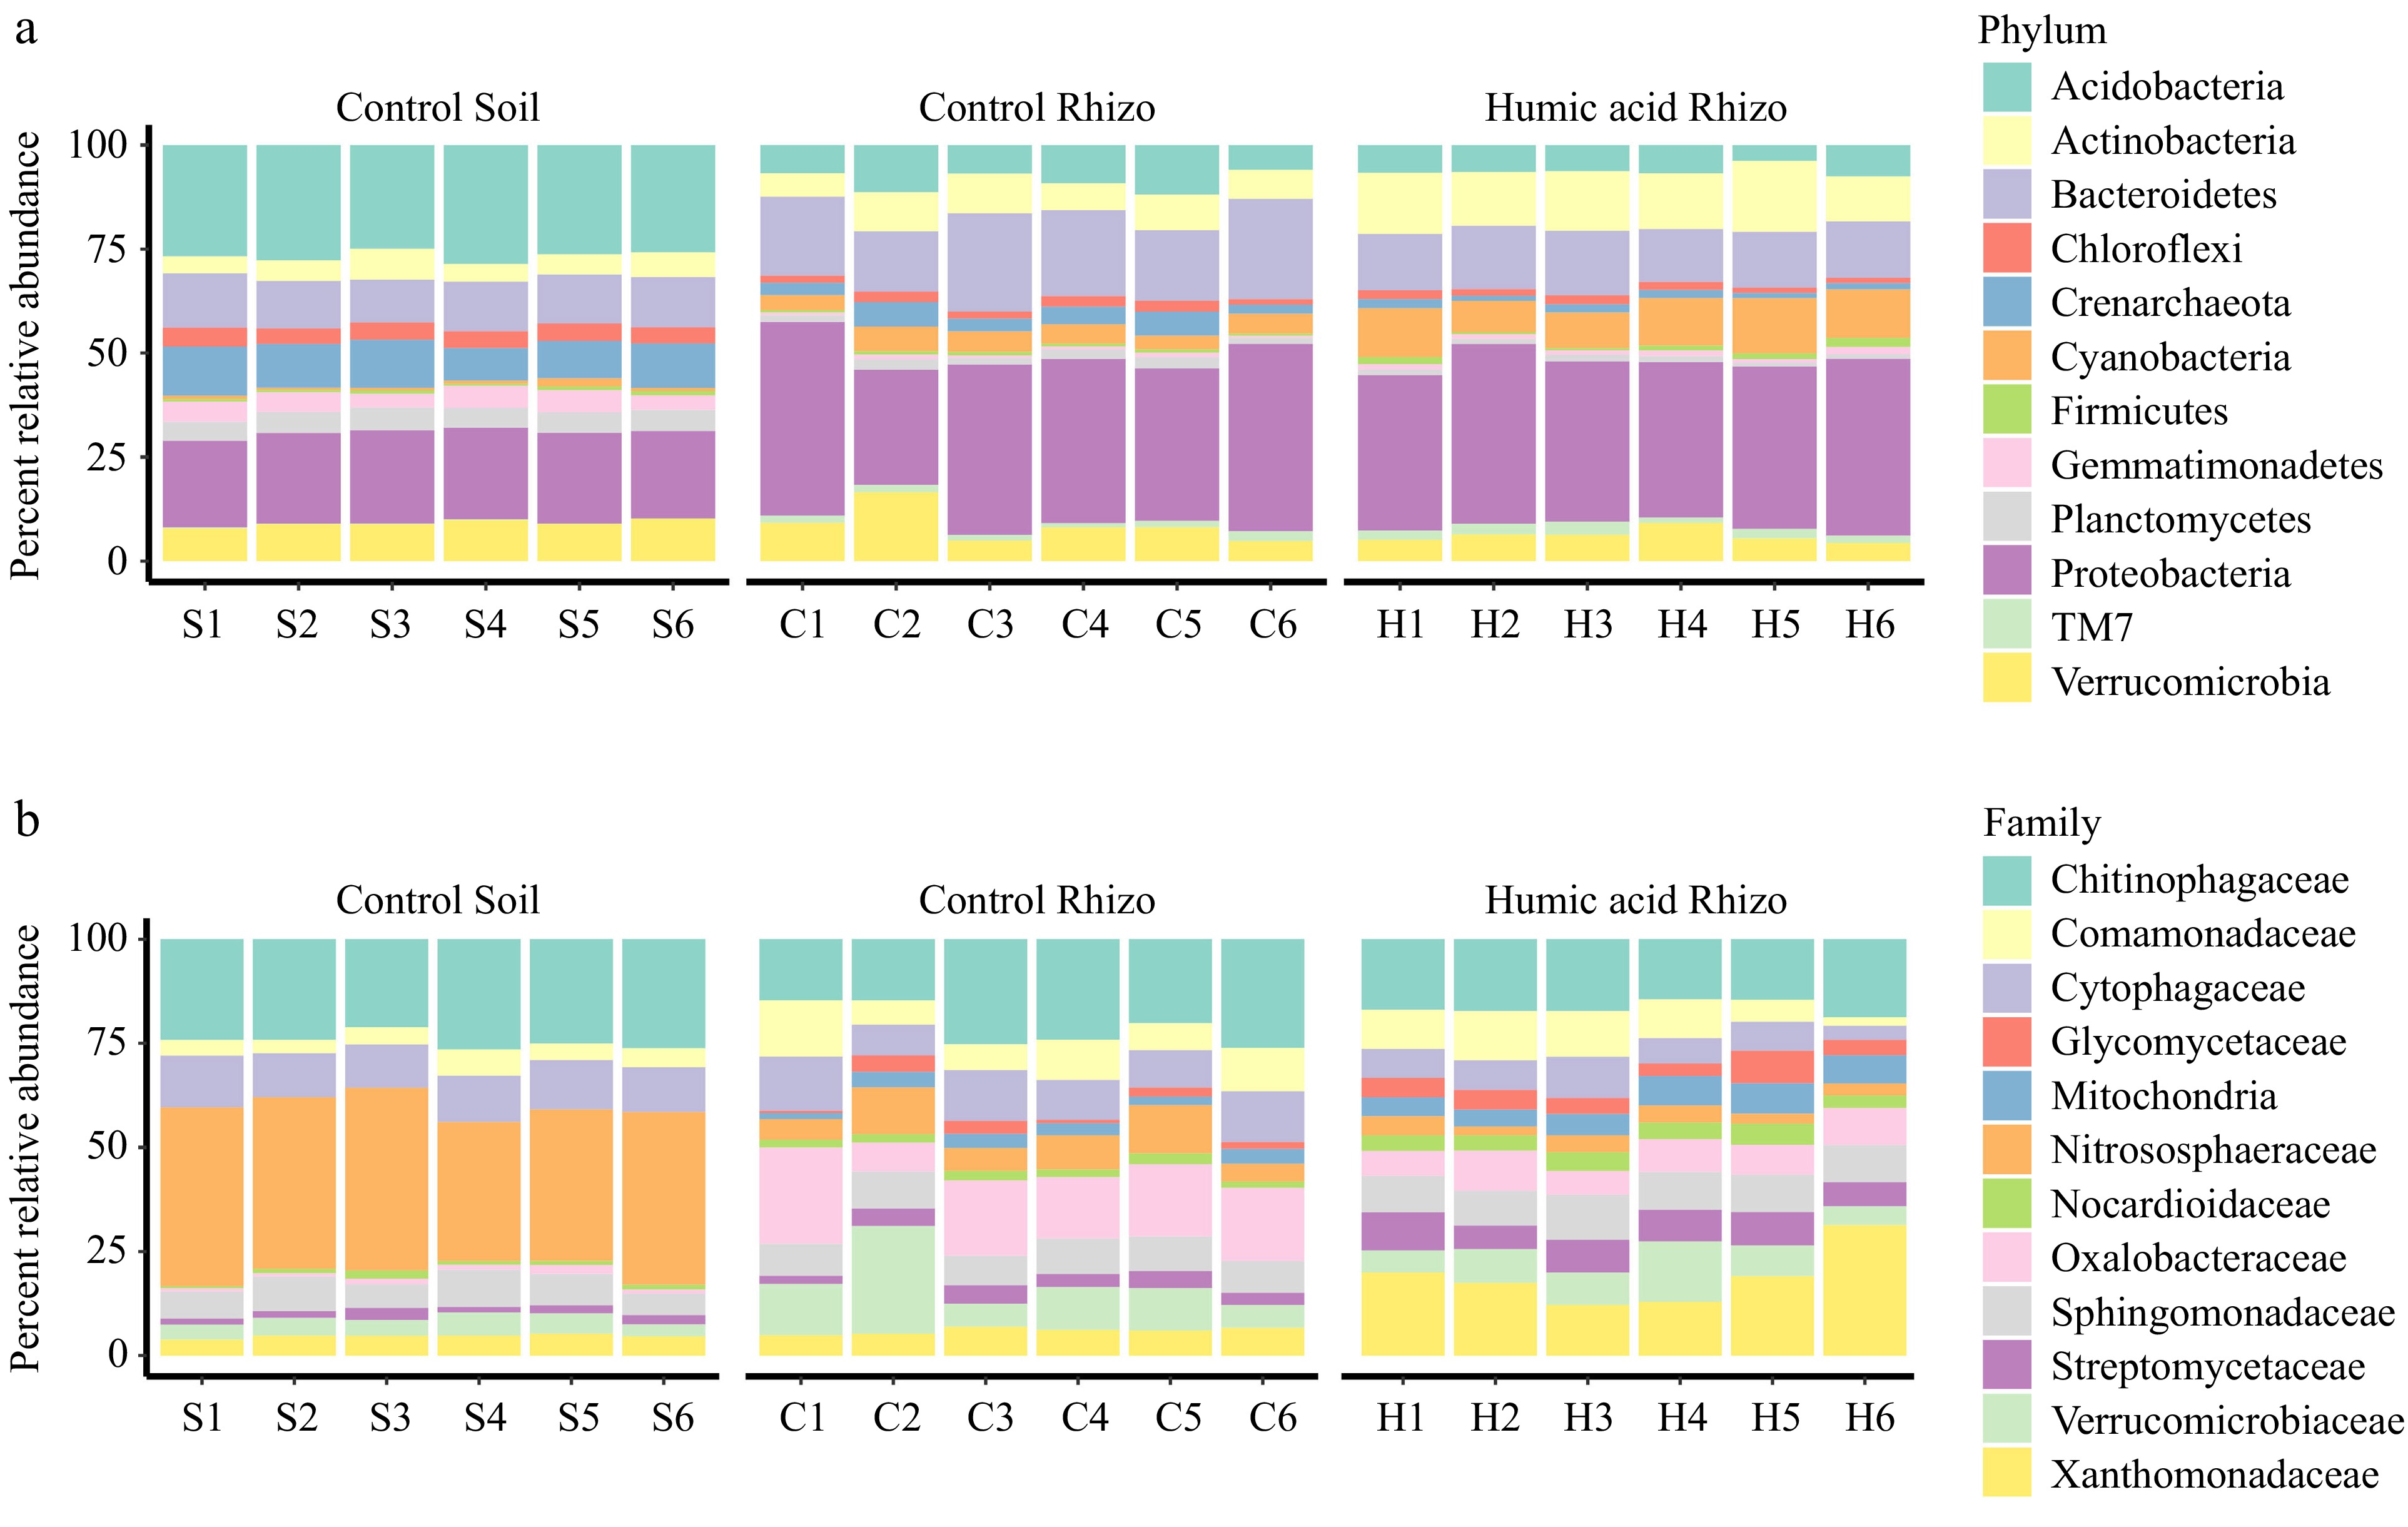
      Figure 5. 

      Relative abundance of the top 12 of the most abundant bacterial phyla and families. Percent relative abundance of the (a) most abundant phyla, and (b) family for (c) control, humic acid (H) treatments in rhizospheres and for control in bulk soils (S). All individuals were arranged in order within each group along the x axis.

    • This study identified 40 bacteria phyla across soil, control rhizosphere, drought-induced, and HA-induced rhizosphere bacteria. The diversity of 12 out of 40 bacterial communities at the phyla level significantly varied in their resistance to drought stress (Supplementary Fig. S2). Among these, Actinobacteria and Bacteroidetes were notably enriched and depleted, respectively, in HA fertilizer-treated samples (Supplementary Fig. S4), which was consistent with a previous study[16]. In this study, the increased abundance of Actinobacteria might be caused by the HA increase in the N content in the soil, further enhancing the rate of nitrogen cycling[16]. Actiomyces are known for their ability to produce enzymes that degrade complex organic matter, which could enhance the availability of nutrient uptake. This nutrient enrichment might synergize with HA, thus improving plant growth and resistance under stress conditions. While the present study primarily focused on the most abundant bacterial phyla and families, it is crucial to consider the role of low-abundant yet core microbial taxa. These taxa, although present at lower relative abundances, often contribute significantly to ecosystem stability and plant health. Low-abundance microbial communities can serve as keystone species, providing essential functions such as nutrient cycling, production of growth-promoting hormones, and suppression of pathogenic organisms. Targeted approaches in further studies, such as metagenomics or metatranscriptomics, could help elucidate the specific roles of these low-abundant microbial taxa in shaping plant phenotypes and contributing to overall plant fitness under varying environmental conditions.

      To improve maize drought resistance and harness the benefits of HA for agricultural productivity, manipulating the root microbiome provides a promising opportunity. However, it is essential to understand the causes and consequences of shifts in the soil and root microbiome induced by drought and HA. In the current study, drought delayed plant development, measured by the number of leaves and plant height. However, as plants under normal conditions began reproductive growth and experience senescence, the drought-treated plants showed a significantly higher leaf count, consistent with previous observations[17]. Drought conditions were found to alter the microbial diversity, leading to an increase in drought-resistant phyla such as Actinobacteria and Firmicutes and a decrease in drought-sensitive phyla such as Bacteroidetes and Proteobacteria (Supplementary Fig. S2). These shifts could significantly impact crop performance by influencing nutrient availability and stress resistance. Understanding these microbial shifts could provide valuable insights into how the microbiome could contribute to adaptation to environmental changes. A previous study on physiological and molecular mechanisms of HA influencing drought resistance in maize, demonstrated that the application of HA under drought conditions improved the proportion of soil macro-aggregates (e.g., P, K, Fe, and Mg), increased ATP synthase activity, enhanced the content of IAA, and the concentration of osmotically active solutes[18]. This previous study also showed that maize yields were improved with HA treatments under drought stress. However, how HA fertilization impacts belowground root traits and microbiome diversity remains largely unknown. In this study, HA demonstrated a potential positive effect on root architecture, leading to more extensive root development. However, it is important to understand why these changes in root structure did not translate to statistically significant differences in root biomass. A possible reason may be due to the physiological mechanisms influenced by HA. Previous studies[4,18] suggest that HA can enhance root elongation and branching without necessarily increasing total root weight. The improvements in root architecture may be related to changes in root surface area, which facilitates nutrient and water uptake, rather than an increase in root mass. This improvement may not significantly affect overall root weight within the short-term duration of the present study.

      The current study did not perform the HA treatment under drought stress. Whether these potentially beneficial microbiomes will be recruited with HA treatments under drought conditions needs to be tested with additional experiments. Nevertheless, the results indicate that HA affects the abundance and composition of rhizosphere microbiome and underscore the importance of root-associated microbiomes in responding to drought stress (Supplementary Fig. S6).

      • We would like to thank Dr. Fupeng Song for assistance in soil water content determination. We appreciate the constructive suggestions from anonymous reviewers. This study was funded by the National Key Research and Development Program of China to H. Liu (2022YFD1201700), the National Natural Science Foundation of China to X. Yang (32101705), and the Youth Innovation team project to Xuerong Yang.

      • The authors confirm contribution to the paper as follows: study conception and design: Yang X; experiment conduction: Sun M, Zhang L, Kang C, Li X, Sun Y, Zeng X, Dong L; data analysis: Yang X, Zhu H, Liu H; draft manuscript preparation: Yang X, Liu H. All authors critically revised and provided final approval of this manuscript.

      • The datasets used and/or analyzed during the current study are available from the corresponding author on reasonable request.

      • The authors declare that they have no conflict of interest.

      • # Authors contributed equally: Mingfei Sun, Lin Zhang

      • Supplementary Fig. S1 Heatmap of the bacteria phylum (A) as well as Shannon’s diversity (B&C) represented in the control soil (S), control (C), drought (D) and HA (H) rhizosphere microbiome.
      • Supplementary Fig. S2 Wilcoxon Signed Rank Test for percent relative abundance of the abundant bacterial phylum in Control Soil, Control rhizosphere (Control Rhizo) and drought rhizosphere (Drought Rhizo) groups.
      • Supplementary Fig. S3 Summary statistics of phenotypes.
      • Supplementary Fig. S4 Wilcoxon Signed Rank Test for relative abundance of the abundant bacterial phyla in control soil, control rhizosphere and Humic Acid rhizosphere groups.
      • Supplementary Fig. S5 Summary statistics of relative abundance of the top 12 of the most abundant baterial families.
      • Supplementary Fig. S6 Summary analyses of LEfSe among control soil (S), control (C), drought (D) and HA (H) rhizosphere conditions.
      • Copyright: © 2024 by the author(s). Published by Maximum Academic Press, Fayetteville, GA. This article is an open access article distributed under Creative Commons Attribution License (CC BY 4.0), visit https://creativecommons.org/licenses/by/4.0/.
    Figure (5)  References (18)
  • About this article
    Cite this article
    Sun M, Zhang L, Zhu H, Kang C, Li X, et al. 2024. Responses of microbial communities to drought stress and humic acid fertilizer in maize. Genomics Communications 1: e006 doi: 10.48130/gcomm-0024-0006
    Sun M, Zhang L, Zhu H, Kang C, Li X, et al. 2024. Responses of microbial communities to drought stress and humic acid fertilizer in maize. Genomics Communications 1: e006 doi: 10.48130/gcomm-0024-0006

Catalog

  • About this article

/

DownLoad:  Full-Size Img  PowerPoint
Return
Return