


-
The rapid growth in plastics production is extraordinary, establishing it as the largest and most widespread synthetic material. In recent years, a large amount of plastic waste has been scattered into the environment[1,2]. Plastic waste in the environment gradually degrades into fragments with a diameter smaller than 5 mm through factors such as ultraviolet (UV) radiation, thermal oxidation, hydrolysis, mechanical wear, and biodegradation[3]. These degradation products are defined as nanoplastics (NPs, diameter < 100 nm)[4]. Undoubtedly, NPs have substantial adverse effects on human health[5]. For example, pollution caused by polystyrene nanoplastics (PsNPs), a typical nanoplastic, poses significant risks to the ecosystem[6].
Several previous studies have shown that MPs/NPs can penetrate plant roots, migrate to aboveground parts, and ultimately enter the food chain[7]. MPs/NPs exert diverse effects on terrestrial plants in terms of morphology, physiology, and even plant community structure[8]. MPs/NPs can be absorbed into tobacco BY2 cells through clathrin-dependent and clathrin-independent endocytosis[9]. Polystyrene MPs/NPs can be absorbed and accumulate in the Arabidopsis root column[10]. Therefore, NP also has certain beneficial effects on plant growth and development. Recently, multi-omics analysis revealed the NPs toxicity-induced metabolic shifts in Populus × euramericana, providing a useful framework to elucidate the involvement and functions of biochemical pathways in woody plant responses to MP/NP toxicity[11].
PsNPs are widely spread in all environments and have negative effects on cell and plant physiology[12]. Toxicological effects and molecular metabolic impacts of PsNPs on soybean were carefully analyzed using non-targeted metabolomics. The phytotoxicity of PsNPs affects seed germination and biomass production, induces oxidative stress, impacts cell membrane integrity, and alters gene expression in plants[13]. The extent to which PsNPs accumulate significantly affects the physiology, nutrient uptake, and root system architecture of aeroponically grown citrus plants[14]. Moreover, silver nanoparticles (AgNPs) are currently widely used nano-materials with properties that render them resistant to bacteria, fungi, and some pests[15,16]. AgNPs have been utilized in a wide range of applications in the chemistry, optics, and medicine industries. Due to their mass production and use, AgNPs are inevitably discharged into the environment[17,18]. AgNPs, when present in high concentrations, accumulate in Eichhornia crassipes tissues and roots, interfering with metabolic activity, reducing plant growth, and ultimately leading to necrosis[19]. AgNPs cause an increase in ROS levels, impacting the antioxidant systems in the aquatic plant Spirodela polyrhiza[20]. Hence, evaluating the environmental hazards presented by AgNPs is of immense importance.
Taxus mairei, a typical member of the Taxaceae family and Taxus genus, is an evergreen subtropical coniferous tree mainly endemic to southern China[21]. T. mairei is rich in chemical compounds that have a wide range of pharmacological properties and an extremely high medicinal value[22]. The diterpenoid compound paclitaxel contained in the tree body is considered one of the most widely used drugs against cancer in clinical practice[23]. In addition to taxane terpenoids, T. mairei also contains various bioactive compounds, such as flavonoids, which are widely present in plants and possess properties such as antioxidant, antibacterial, antiviral, anti-inflammatory, and tumor growth-inhibiting activity[24,25]. The great commercial value of Taxol has resulted in considerable denudation and eradication of the wild Taxus population[26].
The growth and secondary metabolism of T. mairei trees can be significantly affected by changes in environmental conditions[27,28]. In recent years, T. mairei was widely cultivated in various southern provinces, thus facing increasingly serious nanoplastic pollution. Both PsNPs and AgNPs can trigger oxidative stress in plants; however, the responses of T. mairei trees to these two types of nano-pollutants have not been investigated. The effects of these two distinct types of nano-pollutants on T. mairei were comprehensively elucidated through physiological, transcriptome, metabolome, and molecular regulation analyses. Furthermore, a comparative analysis of their toxicity mechanisms was conducted. Our data provide an experimental basis for clarifying the toxicity mechanism and impact of PsNPs and AgNPs on woody plants.
-
Three-year-old T. mairei seedlings were grown in a greenhouse at Hangzhou Normal University, Hangzhou, China. The T. mairei seedlings were planted in 15 cm × 20 cm pots filled with 3 kg of nutrient substrate. The plants were grown at 28/23 °C and 10,000 lx (light and dark cycle 12:12 h). PsNPs and AgNPs were purchased from Huge Biotechnology (Shanghai, China). PsNPs and AgNPs were dissolved in a small amount of ethanol, then were added with ddH2O to their working concentrations, respectively. The working concentration for PsNPs is 0.1 mg/mL and for AgNPs is 0.01 mg/mL. Four groups, including the control, AgNPs, PsNPs, and AgNPs + PsNPs groups, were used in this study. Three biological repeats were used for each group. For PsNP treatment, the PsNPs were sprayed onto the T. mairei seedlings through a small spray. Approximately one seedling was sprayed with 0.1 g PsNPs. For AgNP treatment, AgNPs were sprayed onto the T. mairei seedlings through a small spray. For AgNPs + PsNPs treatment, the two types of nanomaterials mentioned were sprayed together. A total of six biological experiments were conducted for each treatment. After 7 d treatment, all samples were harvested for biochemical analysis.
Biochemical assays
-
The activities of three oxidoreductases, including superoxide dismutase (SOD), peroxidase (POD), and catalase (CAT), were quantified in accordance with a published study[29]. The SOD activity was quantified using the Photochemical Nitroblue Tetrazolium (NBT) method. In detail, twigs of T. mairei were extracted with 5 mL of extraction buffer containing 50 mM phosphate at 4 °C. Photoreduction of NBT was determined with a detection buffer containing 26 mM L-methionine, 750 μM NBT, 1 μM ethylene diamine Tetraacetic acid, 50 mM phosphate, and 20 μM riboflavin at a 560 nm wavelength. POD activity was assessed by adding guaiacol to homogenized twig samples as a substrate. Subsequently, a reaction mixture solution containing 50 mM phosphate buffer solution (PBS) (pH 6.1), 1% guaiacol, and 0.4% H2O2 was added. The activity of CAT was determined in PBS, supplemented with 10 mM H2O2. The sample extract solutions were used, and their absorbance was measured at 470 nm. Malondialdehyde (MDA) concentrations were determined using the 2-thiobarbituric acid (TBA) method. Twig samples were homogenized in a TBA solution containing 0.25% TBA and 10% trichloroacetic acid. The supernatant was then collected, and its absorbance was measured at 532 and 600 nm. O2− and H2O2 contents were measured using determination BestBio kits (Shanghai, China) according to the manufacturer's instructions.
RNA extraction, library construction, and sequencing
-
Total RNA from 12 T. mairei samples was extracted using an OminiPlant RNA Kit (Jiangsu Cowin Biotech Co., Ltd, Taizhou, China). The RNA concentration was measured with a Qubit 2.0 fluorometer (Thermo Fisher Scientific, San Diego, CA, USA), and the RNA integrity was measured with the Agilent 2100 Bioanalyzer (Agilent Technologies, Palo Alto, CA, USA) and 1% agarose gel electrophoresis. The MGIEasy RNA library preparation kit (MGI, Shenzhen, China) was used to construct cDNA libraries for sequencing, and their quality was assessed using the Agilent 2100 Bioanalyzer (Agilent Technologies, Palo Alto, CA, USA). A double-stranded PCR library was purified, denatured, and then circularized to form single-stranded DNA. High-throughput sequencing was conducted on the MGI DNBSEQ T7 sequencing platform (MGI, Shenzhen, China) with a sequencing read length of PE150.
Data processing, comparison, and gene expression determination
-
The generated raw data were processed by removing low-quality read segments containing splices or primers, and HISAT2 was used to align high-quality read segments on the reference genome to obtain positional information. The expression levels of transcripts were calculated using the fragments per kilobase per million mapped reads (FPKM) method[30]. Differentially expressed genes (DEGs) were determined by analyzing the differential expression between the four treatment groups using DESeq2. DEGs were defined as genes with greater than 2-fold expression differences and an FDR < 0.05.
Metabolite extraction
-
Fifty mg of each sample was weighed separately. Then, 1,000 μL of an internal standard extraction solution, prepared at a concentration of 20 mg/L, containing methanol, acetonitrile, and water (volume ratio = 2:2:1), was added. The mixture was vortexed for 30 s. After processing using a grinder for 10 min, the samples were then sonicated in an ice bath for 10 min and in a 20 °C water bath for 1 h. The samples were then centrifuged at 4 °C and 12,000 g for 15 min. A total of 500 μL of supernatant was dried in a tube with a vacuum concentrator. After drying, 160 μL of acetonitrile and water solution (volume ratio = 1:1) was added to dissolve the extract. The samples were vortexed for 30 s, sonicated in an ice water bath for 10 min, and then centrifuged at 4 °C and 12,000 g for 15 min. Then, 120 μL of supernatant was placed into a 2 mL injection bottle, 10 μL of which was used for metabolite detection by the equipment.
Mass spectrum (MS) parameter settings and data acquisition
-
Liquid chromatography-MS (LC-MS) was used for untargeted metabolomic analysis. The LC-MS system comprised the Waters Acquity I-Class PLUS ultra-high performance LC coupled with the Waters Xevo G2-XS QTOF high-resolution MS. The Waters Acquity UPLC HSS T3 column (18 μm, 21 mm × 100 mm) was utilized. In the positive ion mode, mobile phase A consisted of a 0.1% formic acid aqueous solution, while mobile phase B was a 0.1% acetonitrile formate solution. In the negative ion mode, mobile phase A was a 0.1% formic acid aqueous solution, and mobile phase B was a 0.1% acetonitrile formate solution. The sample volume used was 1 μL.
The original data was generated using the MassLynx V42 program. Several data parameters, such as peak extraction and comparison, were obtained using the Progenesis QI software. Subsequently, identification was performed through the Progenesis QI online METLIN database and Biomark in-house database. Theoretical fragment identification and mass deviation were maintained within 100 ppm. Following the normalization of the original peak area data by the total peak area, principal component analysis (PCA) and Spearman correlation analysis were performed to assess the repeatability of the experimental and quality control samples within each group. Threshold values of p < 0.05 and VIP > 1 were established to identify differential metabolites and their enrichment in Kyoto Encyclopedia of Genes and Genomes (KEGG) pathways.
Pearson correlation analyses
-
Pearson correlation was used to assess metabolite-gene correlations with the 'corrplot' package, which can be accessed in the OmicStudio system (
www.omicstudio.cn ). Significant correlations were identified using a Pearson correlation coefficient cut-off of 0.9 and a p value < 0.05. To identify the oxidation reduction-TFs, all TF genes and oxidation reduction-related metabolites were used for Pearson correlation analysis. To identify the energy metabolism-related TFs, all TF genes and energy metabolism-related metabolites were used for Pearson correlation analysis.Promoter cis-element analysis and transcriptional regulatory network prediction
-
Genomic DNA was extracted from the T. mairei twigs using the classical Cetyltrimethylammonium Bromide (CTAB) method. The 1500-bp promoter sequences of the CHI and FRF genes were PCR-cloned based on the T. mairei genome. Subsequently, the promoter sequences were examined using the PlantCARE program. Several typical promoter cis-regulatory elements were screened, including MRE, W-box, ARBE, MYC, GATA, and AuxRE. Based on the cis-regulatory elements, transcription regulation networks were predicted and drawn using Cytoscape software (ver. 3.10.2).
Gene cloning and dual-luciferase reporter assay
-
Two gene promoters, namely pCHI and pFRF, were randomly selected from the transcription regulatory networks. These two promoter sequences were cloned and inserted into the pGreenII0800-LUC vector as reporters. The full-length coding sequences of the four TF genes were cloned and inserted into the pGreenII62-SK vector as effectors. GAL4-BD and VP16 were utilized as positive and negative controls, respectively. All assembled constructs were transiently expressed in tobacco (Nicotiana tabacum) leaf cells. The ratio of firefly luciferase (LUC) and Renilla luciferase (REN) activities was determined using a dual-luciferase assay kit (Promega, Madison, USA). All the primer sequences are listed in Supplementary Table S1.
-
Two widely detected nano-materials/nano-pollutants, PsNPs and AgNPs, were used individually and/or in combination to treat T. mairei seedlings (Fig. 1a). To investigate the T. mairei responses to PsNPs and AgNPs, six important stress-related physiological parameters, SOD, POD, and CAT activities, and MDA, O2−, and H2O2 contents, were determined. PsNPs treatment resulted in a significant reduction of the SOD activity from 29.1 to 10.9 U·g−1 (Fig. 1b). On the other hand, AgNPs treatment significantly induced the POD activity from 827.3 to 1,519.8 U·g−1 (Fig. 1c), while AgNPs significantly decreased the CAT activity from 5.0 to 3.5 U·g−1 (Fig. 1d). Interestingly, all three treatments, including AgNPs, PsNPs, and AgNPs + PsNPs, resulted in the significant reduction in MDA content (Fig. 1e). PsNPs and AgNPs + PsNPs treatments significantly reduced the contents of O2− (Fig. 1f). AgNPs and AgNPs + PsNPs treatments significantly up-regulated the contents of H2O2 (Fig. 2g). Thus, based on our findings, T. mairei exhibited different physiological responses to the two nano-material/nano-pollutant treatments.
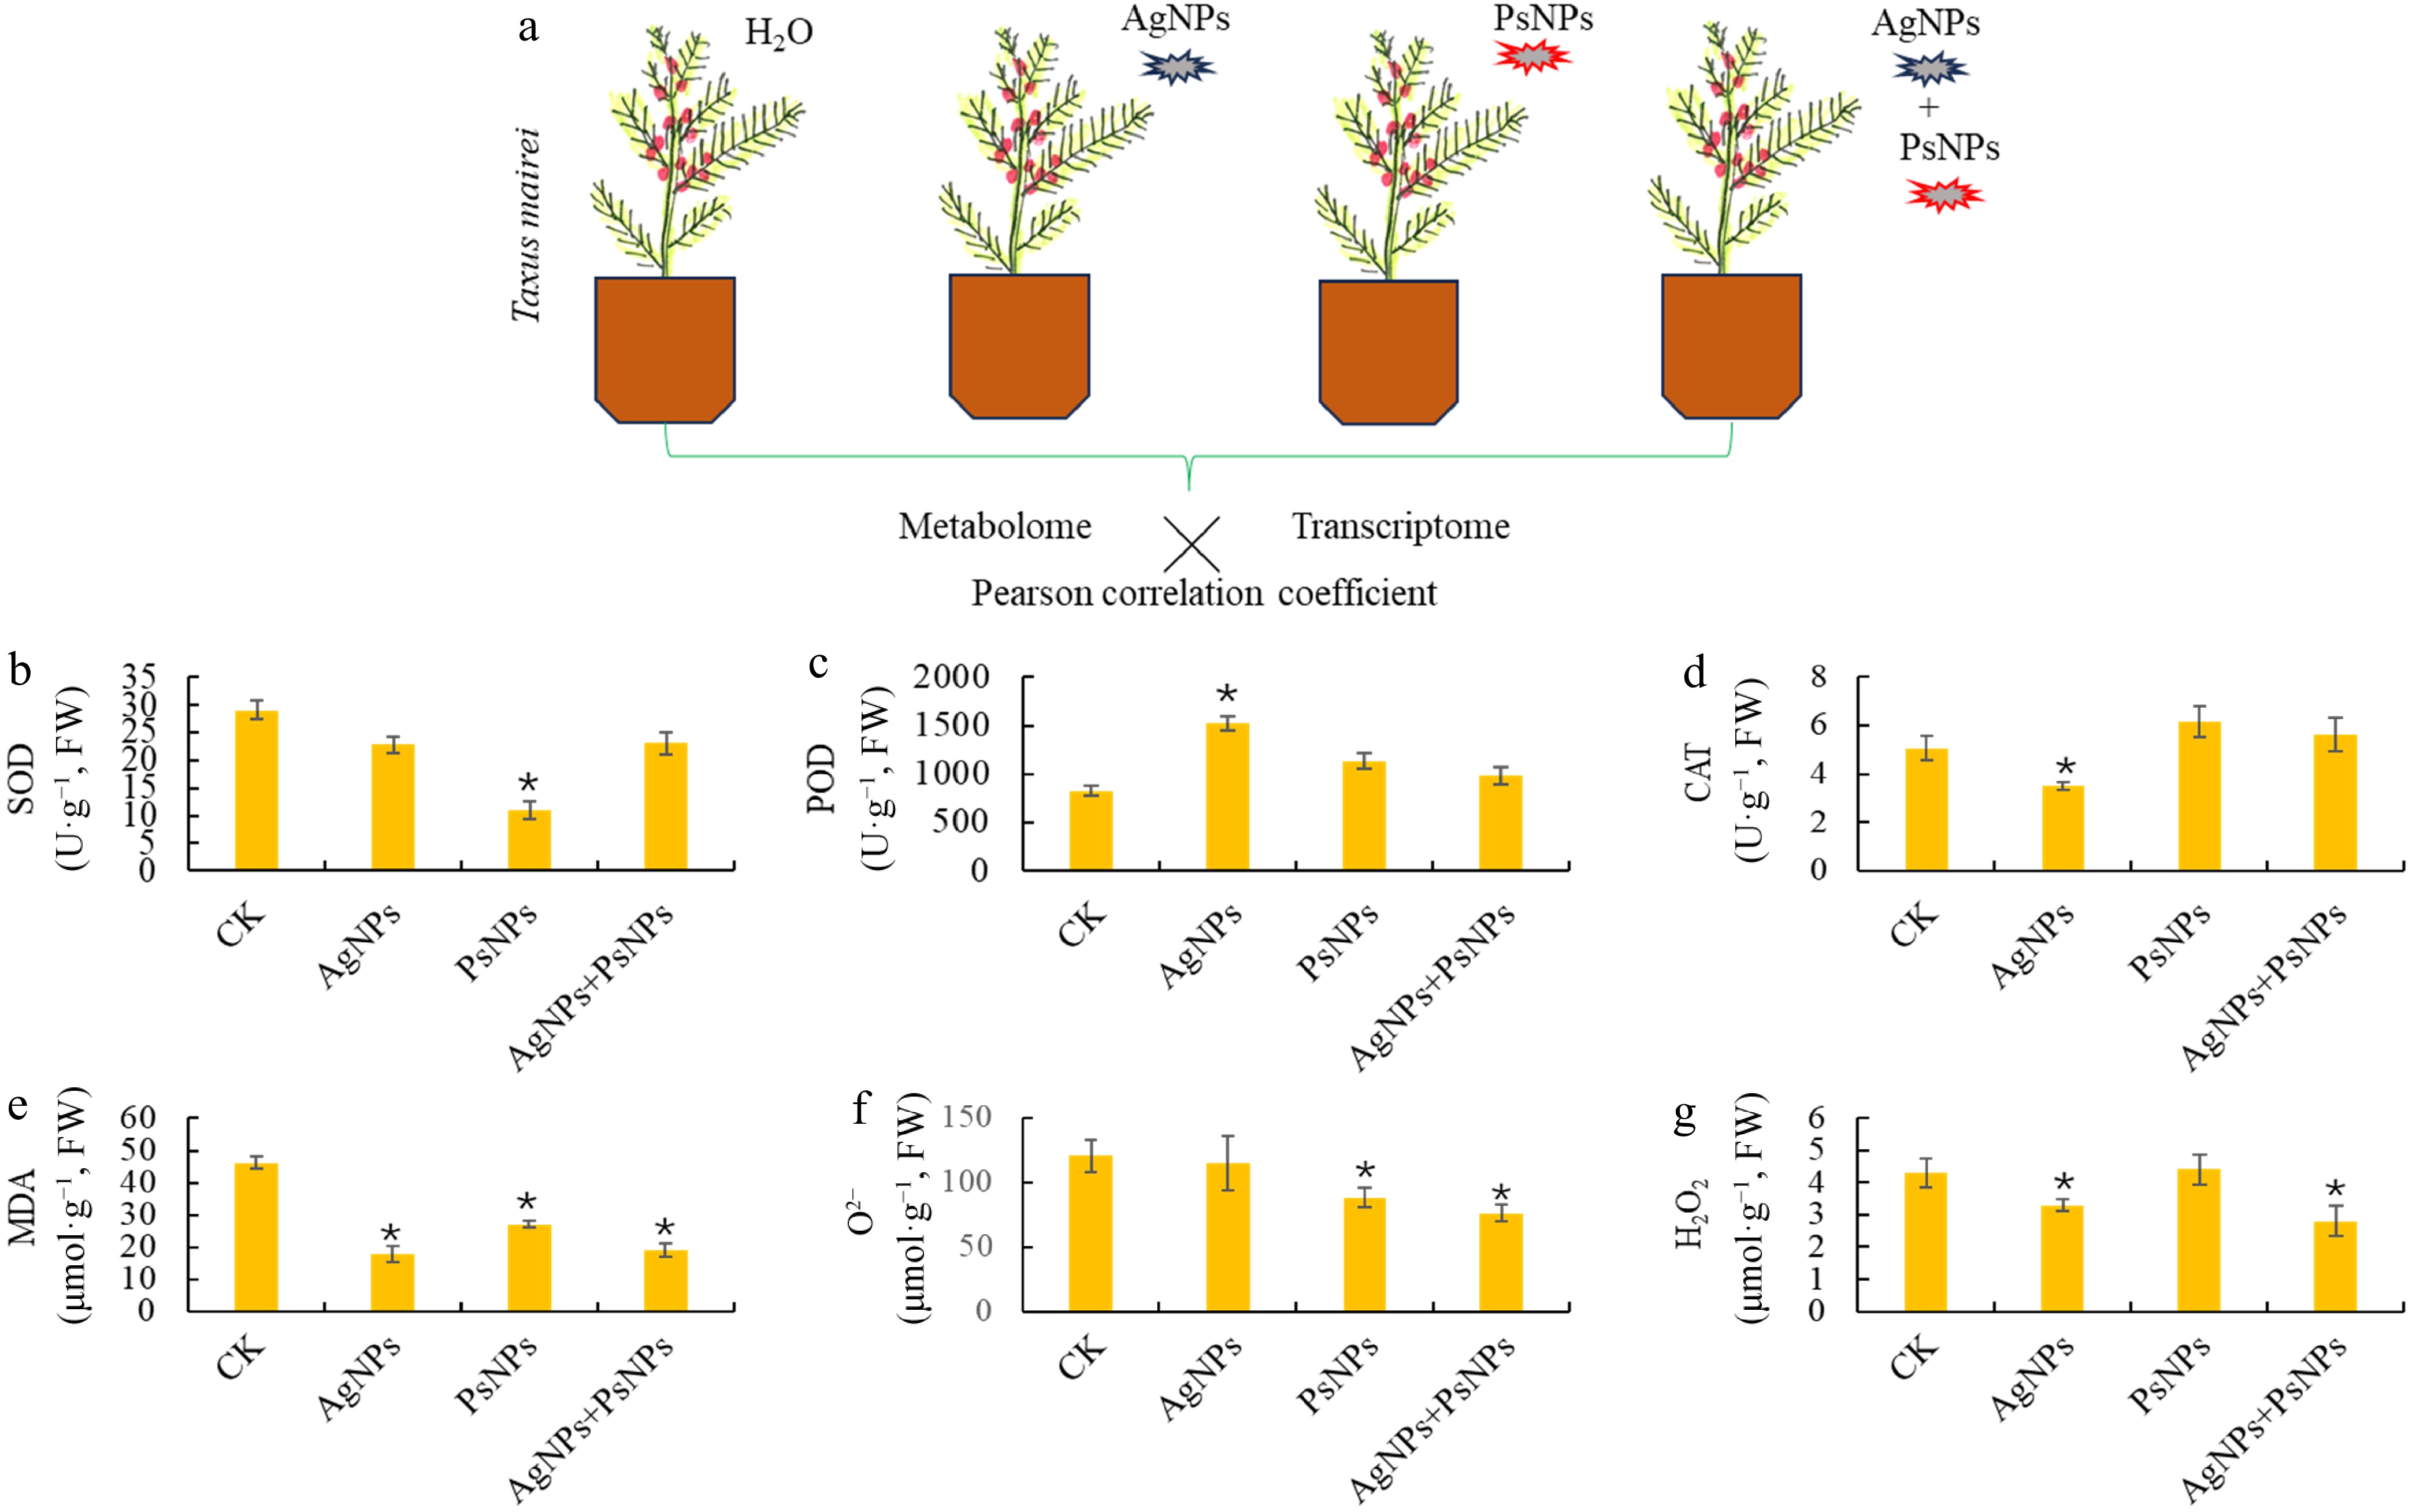
Figure 1.
Physiological responses of T. mairei to two different nanoparticulate pollutants. (a) Schematic diagram of experimental design. Two nanoparticulate pollutants, polystyrene nanoplastics (PsNPs), and silver nanoparticles (AgNPs), were used to treat the T. mairei seedlings. Six major stress-related physiological parameters, (b) SOD, (c) POD, (d) CAT, (e) MDA, (f) O2−, and (g) H2O2, were determined under different treatments. Statistical significance is denoted by * at a p value < 0.05.
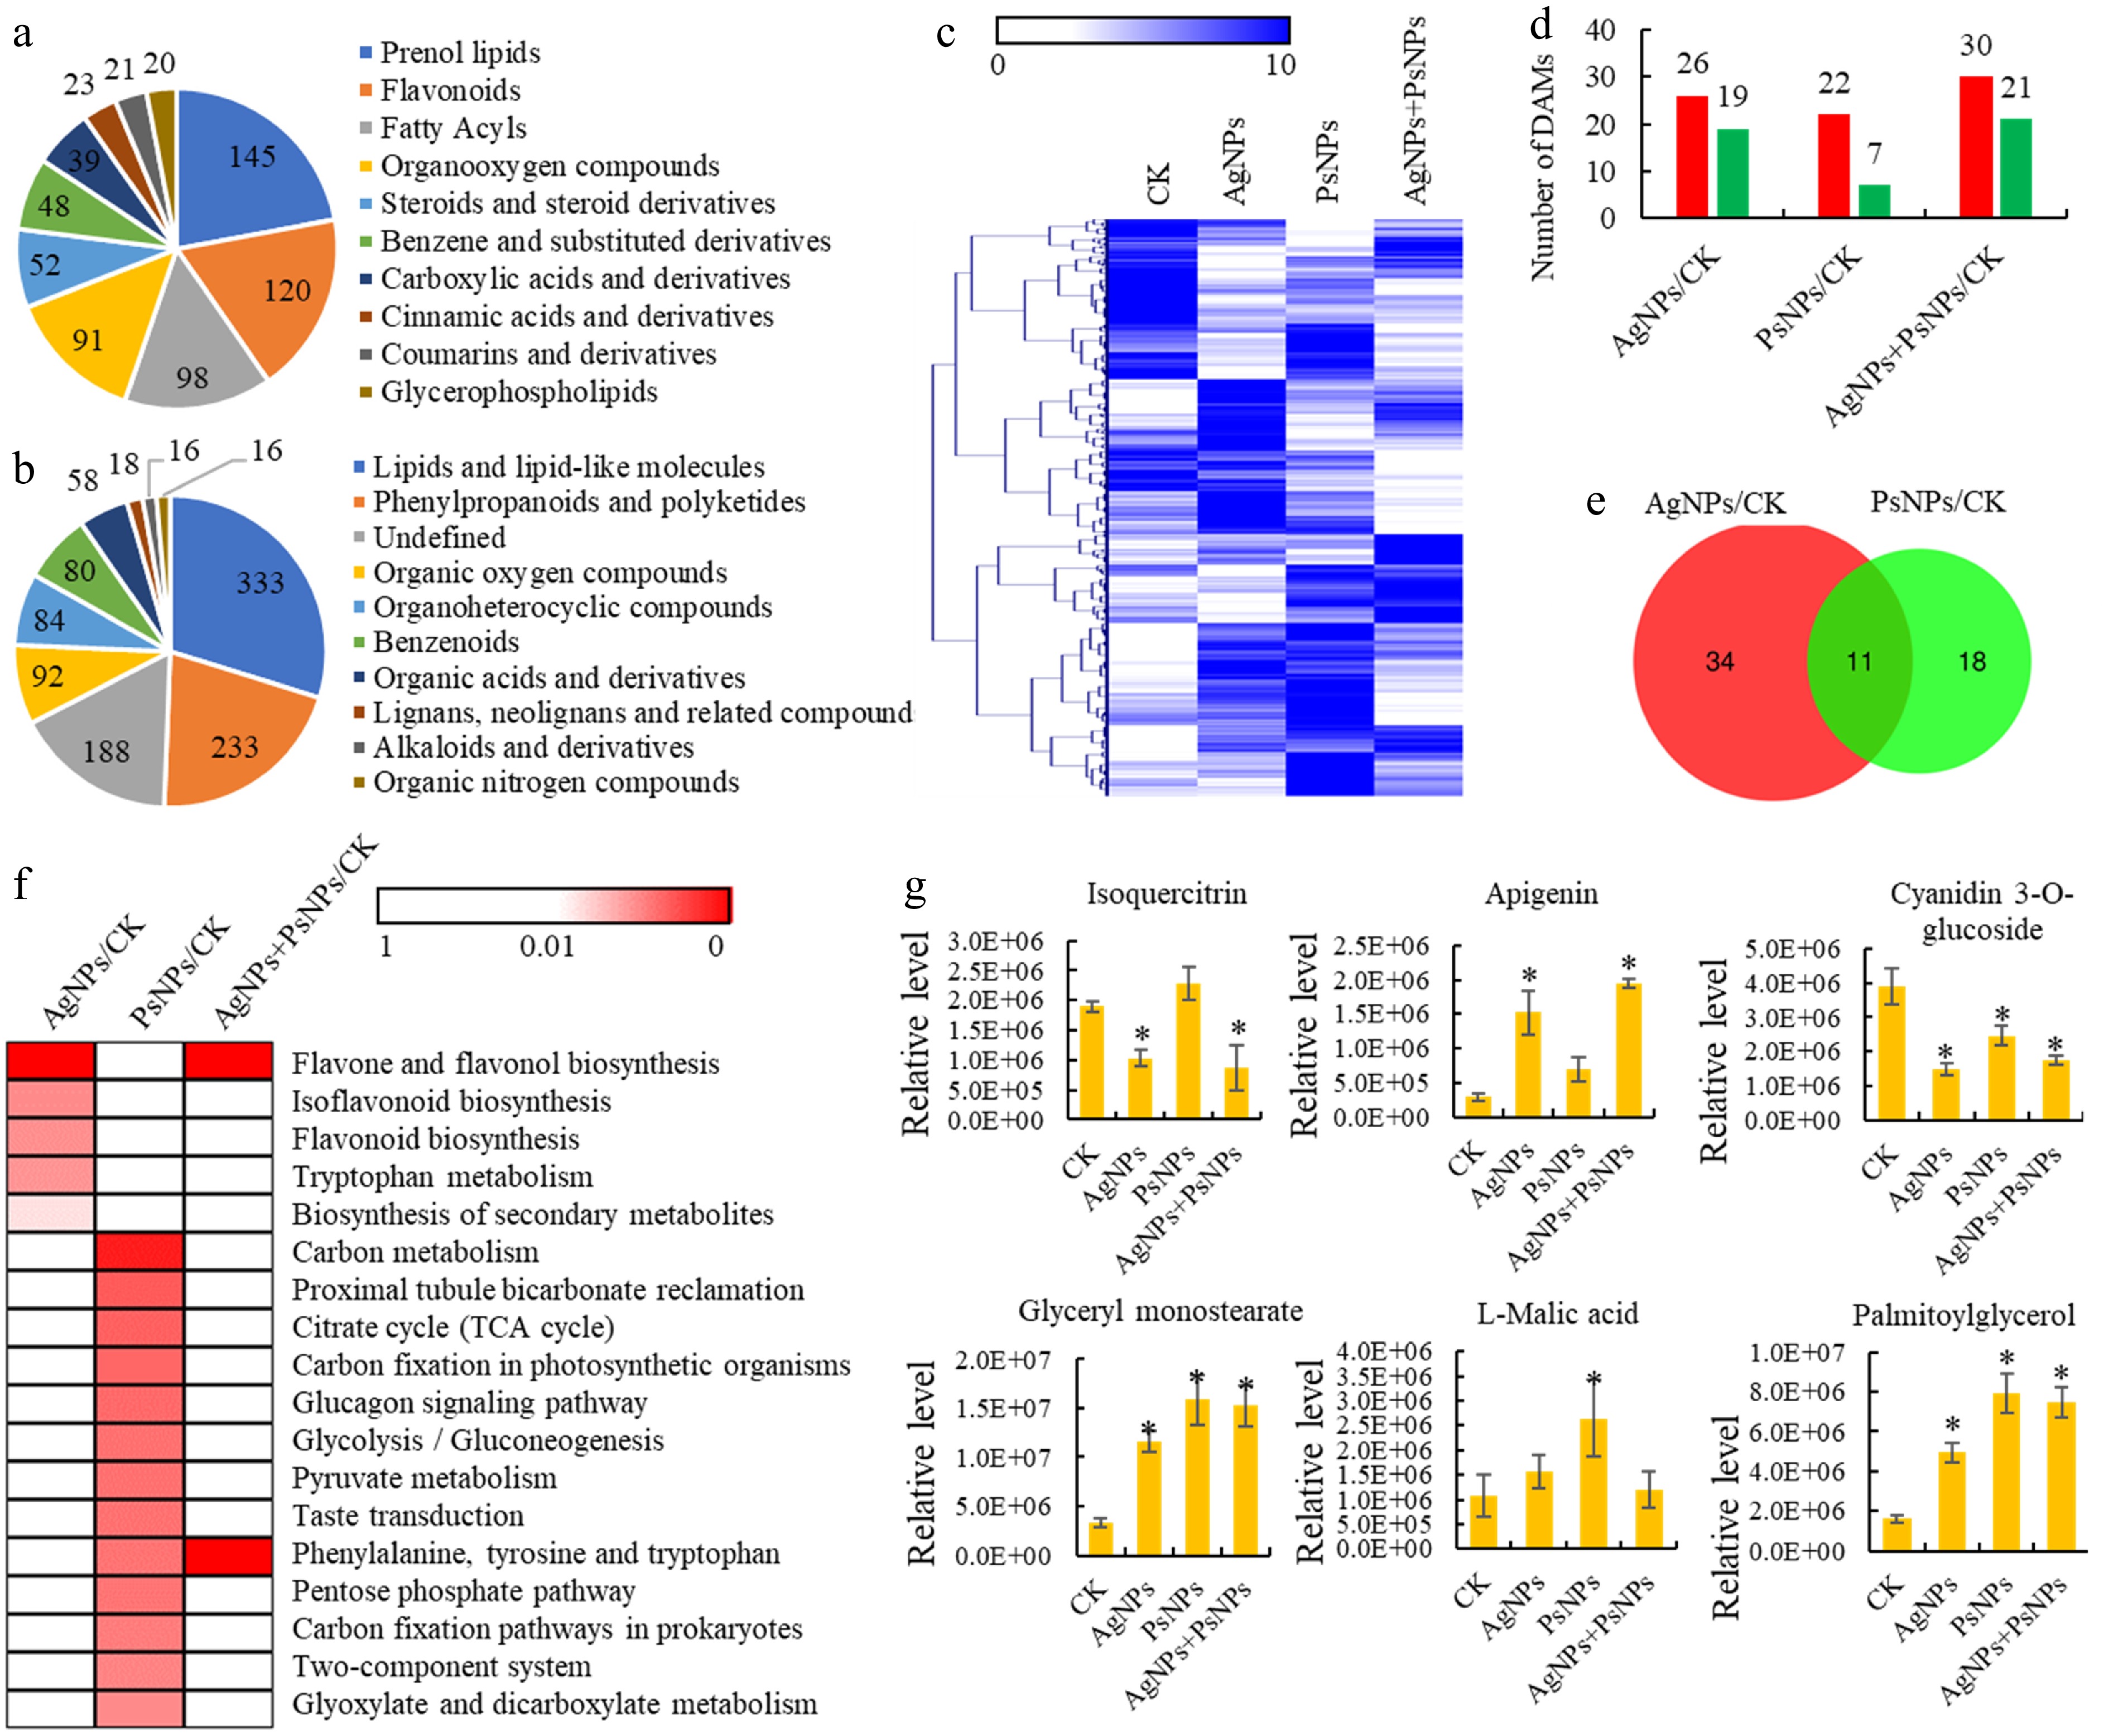
Figure 2.
Metabolomics analyses of T. mairei seedlings under AgNPs and PsNPs treatments. (a) All identified metabolites grouped into major categories. (b) All identified metabolites grouped into superclasses. (c) The metabolite profiles of different treatment groups. The heatmap scale ranges from 0 to 10 on a log2 scale. (d) The number of differentially accumulated metabolites (DAMs) in different treatment comparisons. (e) Venn diagram analysis of the shared DAMs between AgNPs/CK and PsNPs/CK comparisons. (f) KEGG enrichment analysis of the DAMs in different treatment comparisons. The significant P values of each KEGG term in the three comparisons are illustrated by a heatmap. The heatmap scale ranges from 1 to 0. (g) The accumulation levels of six typical metabolites in different treatment groups. Statistical significance is denoted by * at a p value < 0.05.
Overview of T. mairei metabolomes under different treatments
-
An untargeted metabolomic analysis was conducted on four treatment groups, identifying 1,124 annotated metabolites from 20,894 ion features (Supplementary Table S2). To assess the quality of the metabolite data obtained, ion chromatograms, sample correlation, and PCA were evaluated, indicating that the raw data met the established standards (Supplementary Fig. S1). All annotated metabolites could be classified into 10 categories, including 145 prenol lipids, 120 flavonoids, 98 fatty acyls, 91 organooxygen, and 52 steroids (steroid derivatives) (Fig. 2a). According to the Superclass classification, 'lipids and lipid-like molecules' (333 metabolites), 'phenylpropanoids and polyketides' (233 metabolites), and 'organic oxygen compounds' (92 metabolites) were the most abundant metabolite classes (Fig. 2b).
Effects of PsNPs and AgNPs on metabolite accumulation in T. mairei
-
Metabolite profiling of the different treatment groups indicated a significant impact of PsNPs and AgNPs on metabolite accumulations in T. mairei (Fig. 2c). In the AgNPs/CK comparison, 45 differentially accumulated metabolites (DAMs), including 26 up- and 19-down regulated metabolites, were identified; in the PsNPs/CK comparison, 29 DAMs, including 22 up- and seven down-regulated metabolites, were identified; and in the AgNPs + PsNPs/CK comparison, 51 DAMs, including 30 up- and 21 down-regulated metabolites (Fig. 2d). A total of 11 DAMs were shared between these two treatments (Fig. 2e).
The results of the KEGG analysis of the differential metabolites in various comparisons are shown in Supplementary Table S3. KEGG pathway enrichment analysis revealed that several secondary metabolism-related pathways, such as the 'flavone and flavonol biosynthesis', 'isoflavonoid biosynthesis', 'flavonoid biosynthesis', and 'biosynthesis of secondary metabolites' pathways, were significantly affected by AgNPs treatment. On the other hand, various energy metabolism-related pathways, such as the 'carbon metabolism', 'citrate cycle', 'carbon fixation in photosynthetic organisms', and 'glycolysis/gluconeogenesis' pathways, were significantly affected by the PsNPs treatment. Interestingly, under the combined PsNPs + AgNPs treatment, only the 'flavone and flavonol biosynthesis', 'phenylalanine, tyrosine, and tryptophan' pathways exhibited significant differences (Fig. 2f). The accumulation levels of three secondary metabolism-related DAMs and three energy metabolism-related DAMs were assessed. Isoquercitrin and apigenin significantly differentially accumulated under the AgNP treatment, while L-malic acid significantly differentially accumulated under the PsNP treatment (Fig. 2g).
Effects of PsNPs and AgNPs on gene expression of T. mairei
-
A transcriptomic analysis was performed to comprehensively assess the impact of PsNPs and AgNPs on gene expression in T. mairei, yielding a total of 21,310 transcribed genes (Supplementary Table S4). Gene expression profiling of different treatment groups suggested a significant impact of PsNPs and AgNPs on the transcriptome of T. mairei (Fig. 3a). In the AgNPs/CK comparison, 1,682 DEGs, including 686 up- and 996 down-regulated genes were identified, while in the NPs/CK comparison, 2,198 DEGs, including 1,175 up- and 1,014 down-regulated genes, were identified. Finally, in the PsNPs + AgNPs/CK comparison, 917 DEGs were identified, among which 390 were up-regulated, and 527 were down-regulated (Fig. 3b). A total of 538 DEGs were shared between the AgNPs/CK and PsNPs/CK comparison groups (Fig. 3c).
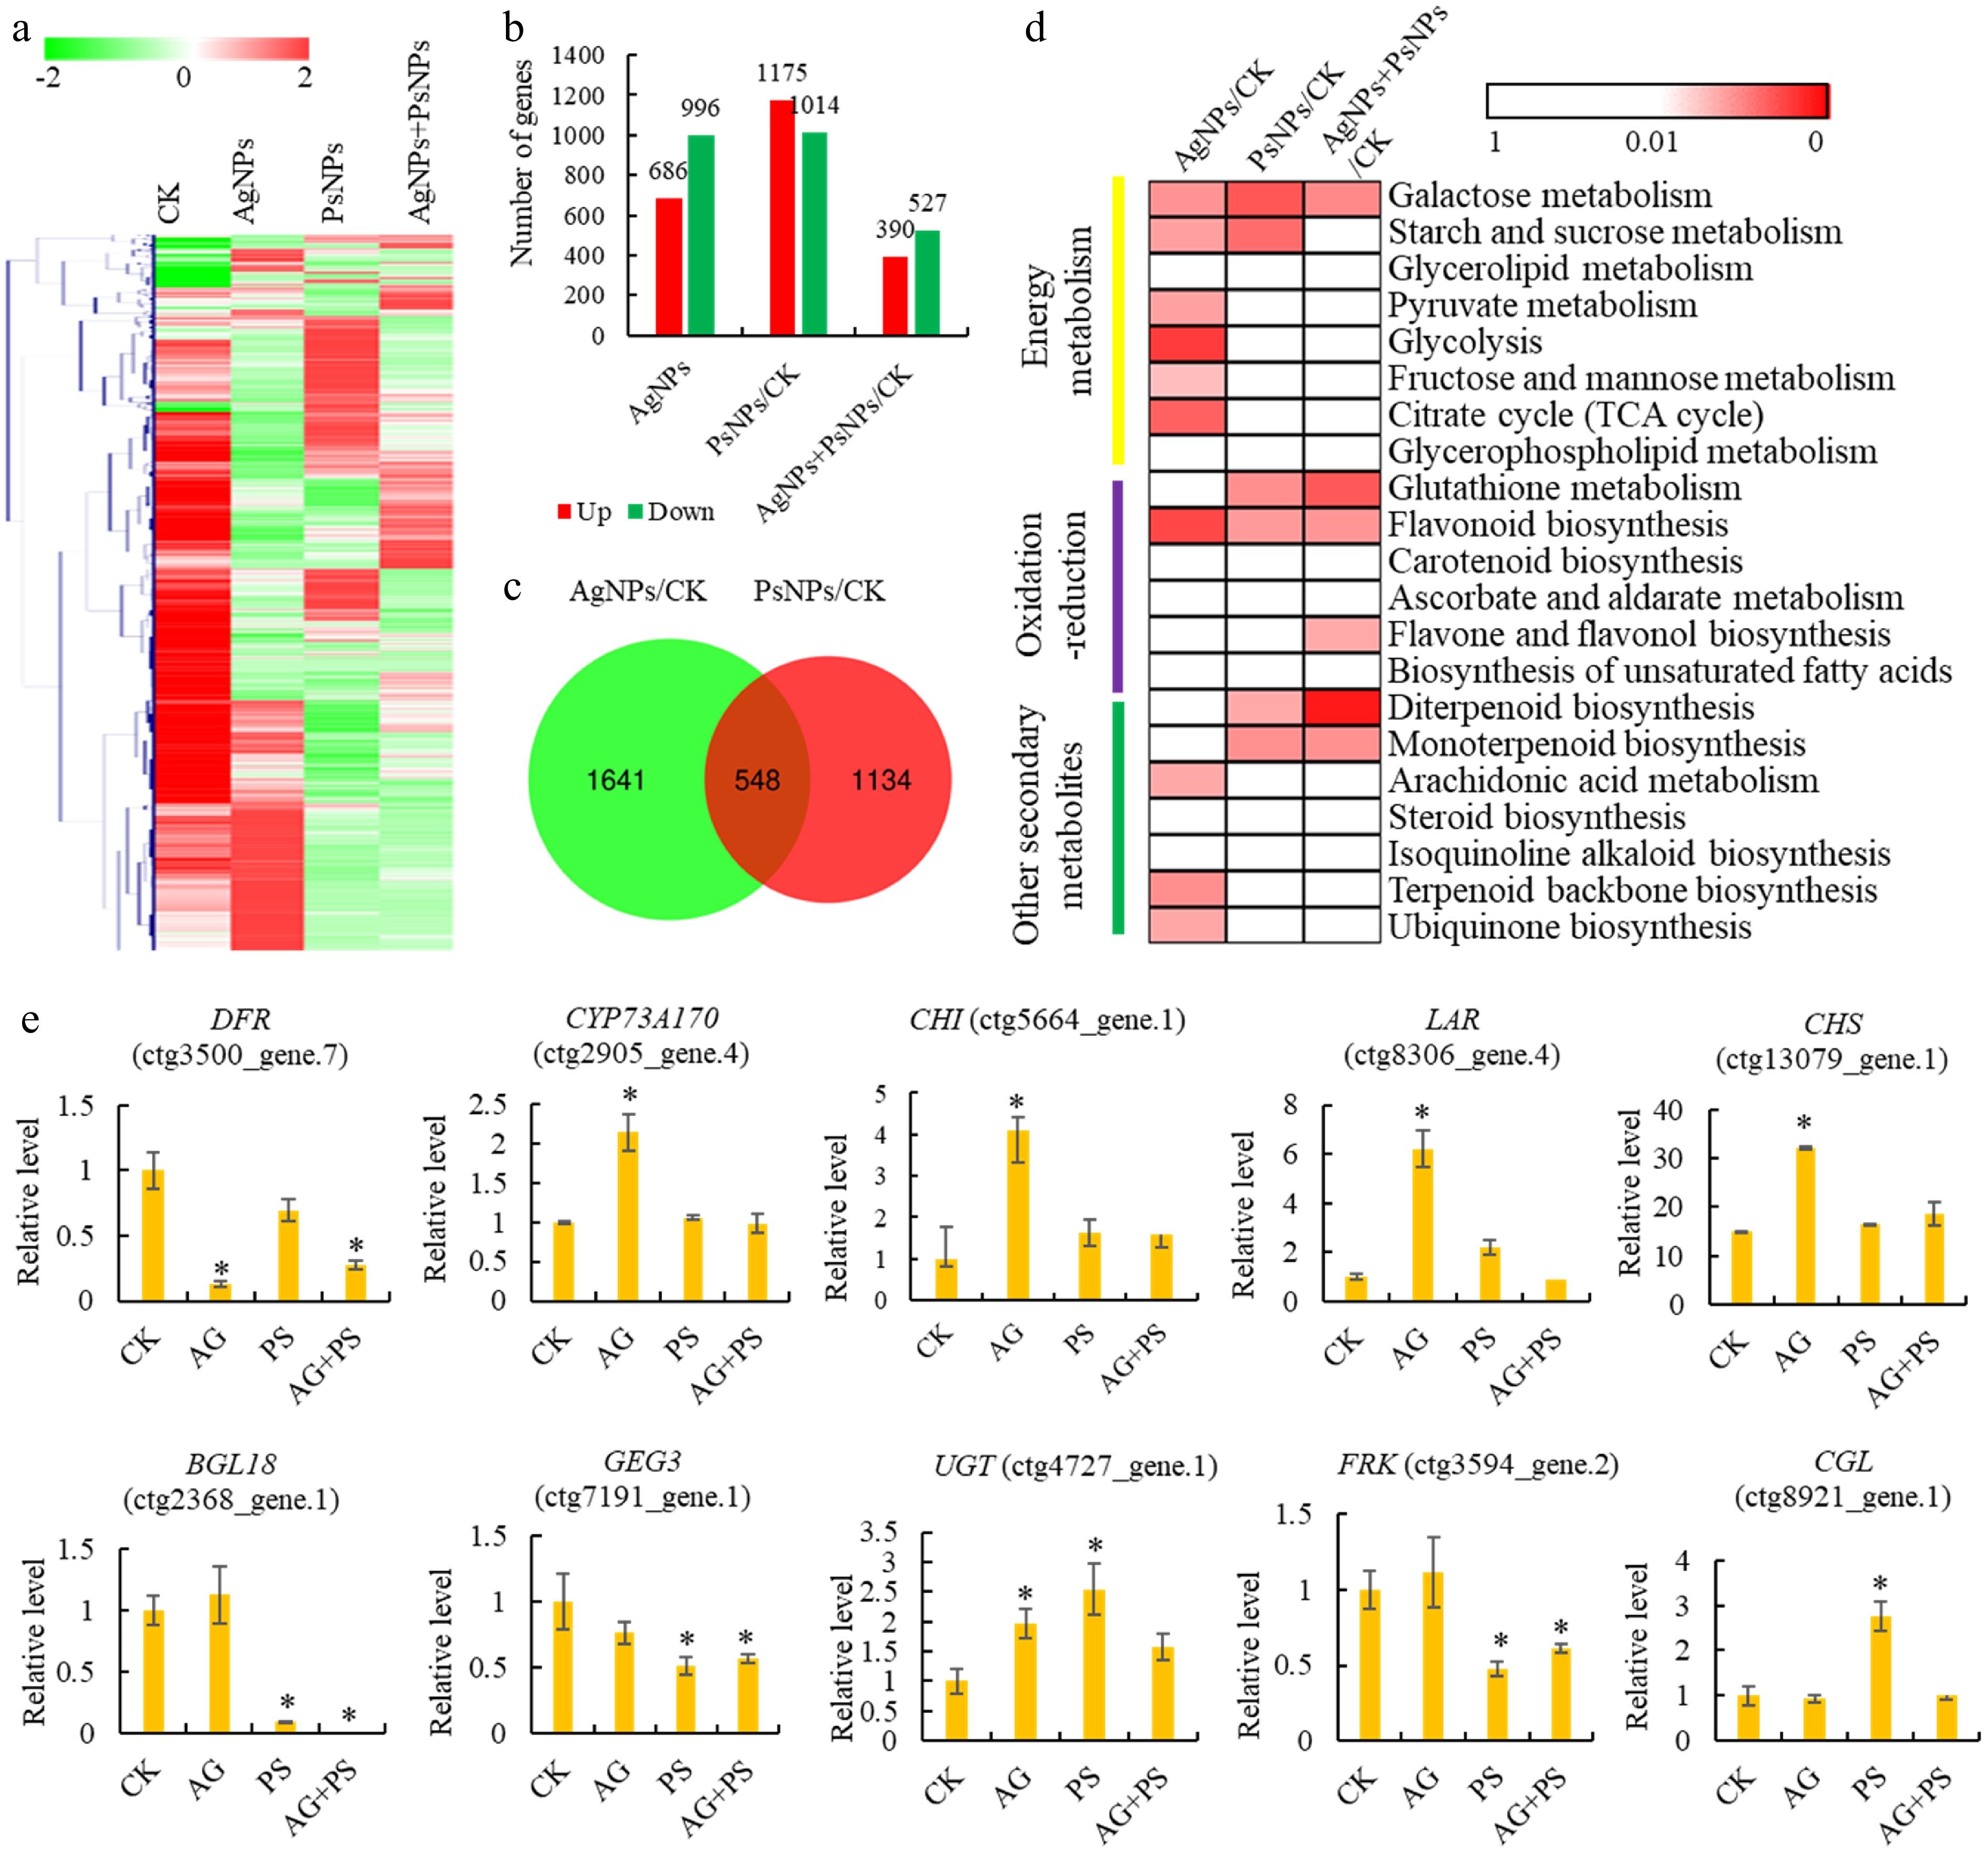
Figure 3.
Transcriptomic analysis of T. mairei seedlings under AgNPs and PsNPs treatments. (a) Gene expression profiles of different treatment groups. The heatmap scale ranges from −2 to 2 on a log2 scale. (b) The number of differentially expressed genes (DEGs) in different treatment comparisons. (c) Venn diagram analysis of the shared DEGs between AgNPs/CK and PsNPs/CK comparisons. (d) KEGG enrichment analysis of the DEGs in different treatment comparisons. The significant P values of each KEGG term in the three comparisons are illustrated by a heatmap. The heatmap scale ranges from 1 to 0. (e) The expression levels of 10 typical genes in different treatment groups. Statistical significance is denoted by * at a p value < 0.05.
KEGG enrichment analysis revealed that six energy metabolism-related pathways were enriched in the AgNPs/CK treatment comparison. The 'flavonoid biosynthesis' pathway was enriched in both AgNPs and PsNPs treatment groups (Fig. 3d). The expression levels of five flavonoid biosynthesis-related genes, namely DFR (ctg3500_gene.7), CYP73A170 (ctg2905_gene.4), CHI (ctg5664_gene.1), LAR (ctg8306_gene.4), and CHS (ctg13079_gene.1), were significantly altered under the AgNPs treatment. Similarly, the expression levels of five energy metabolism-related genes, namely BGL18 (ctg2368_gene.1), GEG3 (ctg7191_gene.1), UGT (ctg4727_gene.1), FRK (ctg3594_gene.2), and CGL (ctg8921_gene.1), were significantly altered under the PsNPs treatment (Fig. 3e).
Differential expression analysis of transcription factor (TF) genes
-
In plants, TFs regulate the expression of specific genes or a group of genes by binding to their promoters[31]. A total of 736 TF genes were identified using the plant TF database. Among them, 19 MADS genes, 10 NAC genes, 32 bZIP genes, 14 GATA genes, 20 ARF genes, 114 MYB genes, 34 WRKY genes, 91 AP2 genes, and 22 bHLH genes were identified (Fig. 4a).
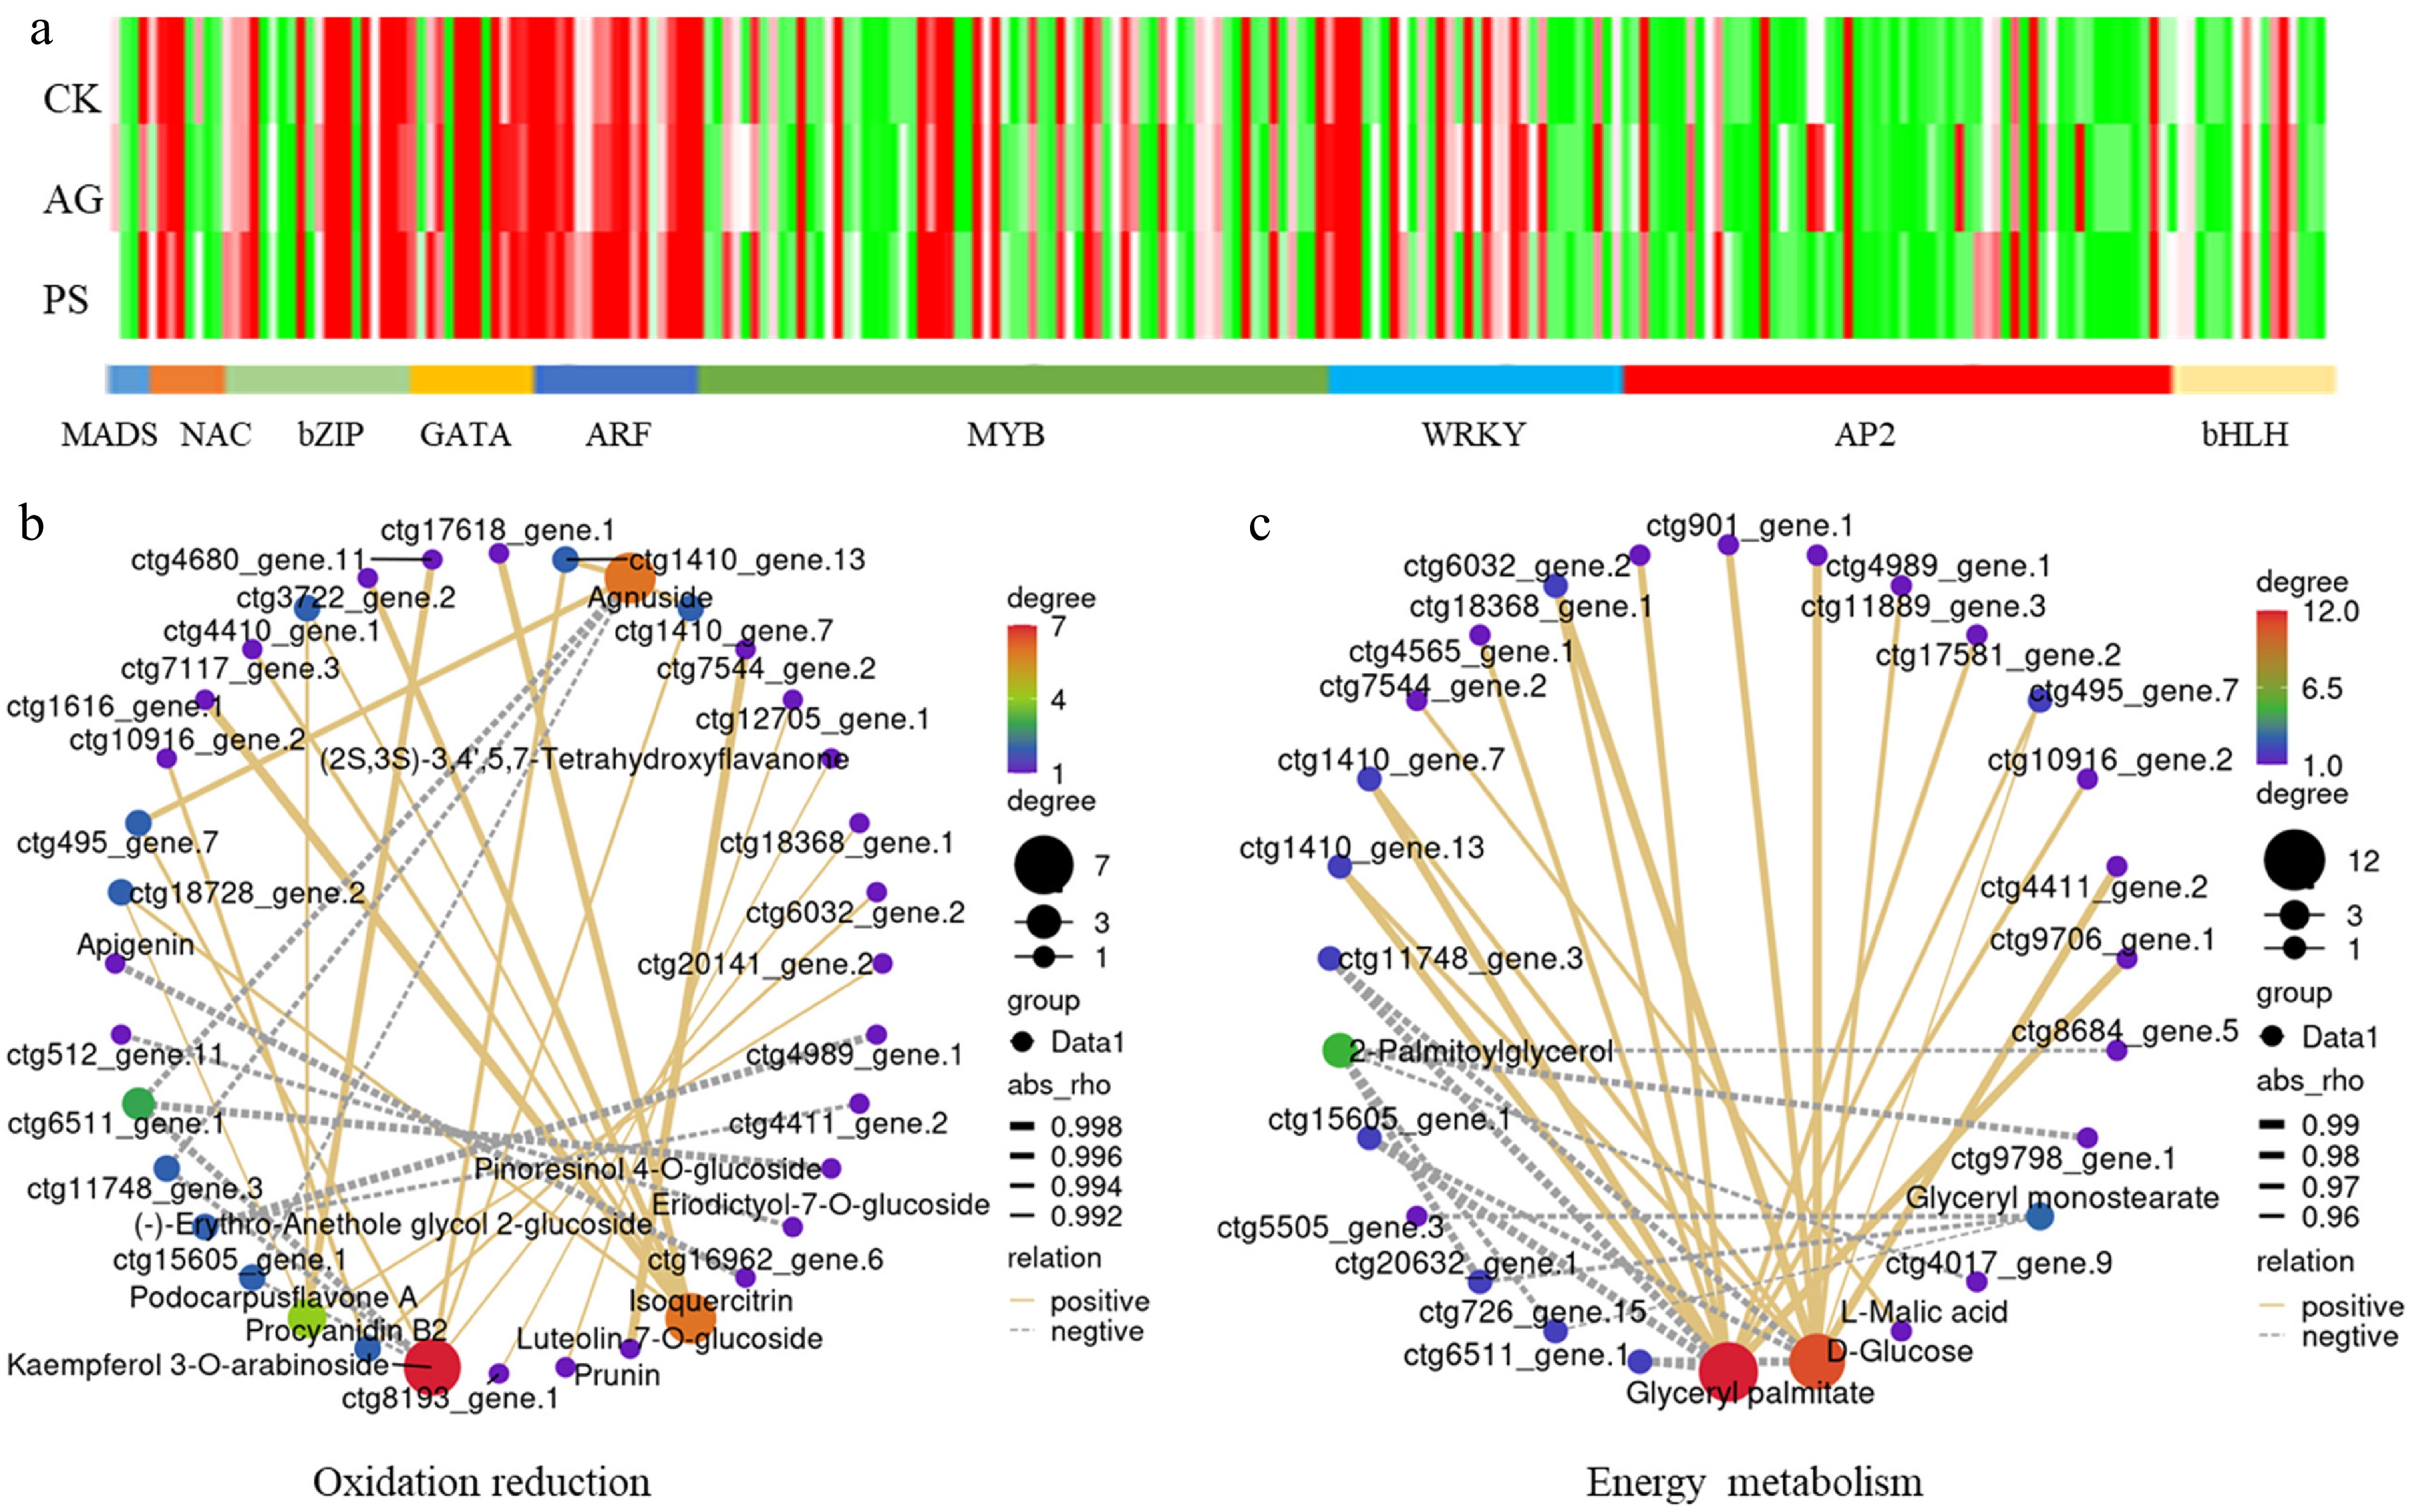
Figure 4.
Analysis of differentially expressed transcription factor (TF) genes. (a) The expression profiles of TF encoding genes, including the members belonging to MADS, NAC, bZIP, GATA, ATF, MYB, WRKY, AP2, and bHLH families. (b) Pearson correlation analysis of TFs and oxidation reduction-related DAMs. (c) Pearson correlation analysis of TFs and energy metabolism-related DAMs.
The relationship between the differentially expressed TFs and DAMs was analyzed using the Pearson correlation method. Pearson correlation analysis identified 34 oxidation reduction-related TFs that were correlated, including Agnuside-related WRKY (ctg6511_gene.1), bHLH (ctg495_gene.7), and AP2 (ctg11748_gene.3), Isoquercitrin-related ARF (ctg3722_gene.2 and ctg4410_gene.1), and Apigenin-related MYB (ctg16962_gene.6) (Fig. 4b). Furthermore, 33 energy metabolism-related TFs were identified, such as D-Glucose-related AP2 (ctg11748_gene.3), WRKY (ctg6511_gene.1), bHLH (ctg495_gene.7), and MYB (ctg901_gene.1), and glyceryl palmitate-related GATA (ctg10916_gene.2), bHLH (ctg17581_gene.2), and NAC (ctg4565_gene.1) (Fig. 4c).
Prediction of transcriptional regulation networks
-
The promoters of nine oxidation reduction-related genes and 12 energy metabolism-related genes were extracted from the T. mairei genome, and analyses were performed to predict and model potential transcriptional regulatory networks. Based on the analyses, MREs were commonly detected in all the promoters, suggesting a ubiquitous function of the MYB family in transcriptional regulation. Notably, more than two W-box elements were detected in the promoters of CYP75A77 (ctg364_gene.5), DFR (ctg3500_gene.7), CYP73A170 (ctg2905_gene.4), and CHI (ctg5664_gene.1), and more than two GATA elements were detected in the promoters of CYP75A77 (ctg364_gene.5) and FRF (ctg4639_gene.1). On the other hand, AuxRE elements were only detected in the promoters of CHS (ctg13079_gene.1) and BGL40 (ctg4141_gene.2) (Fig. 5a).
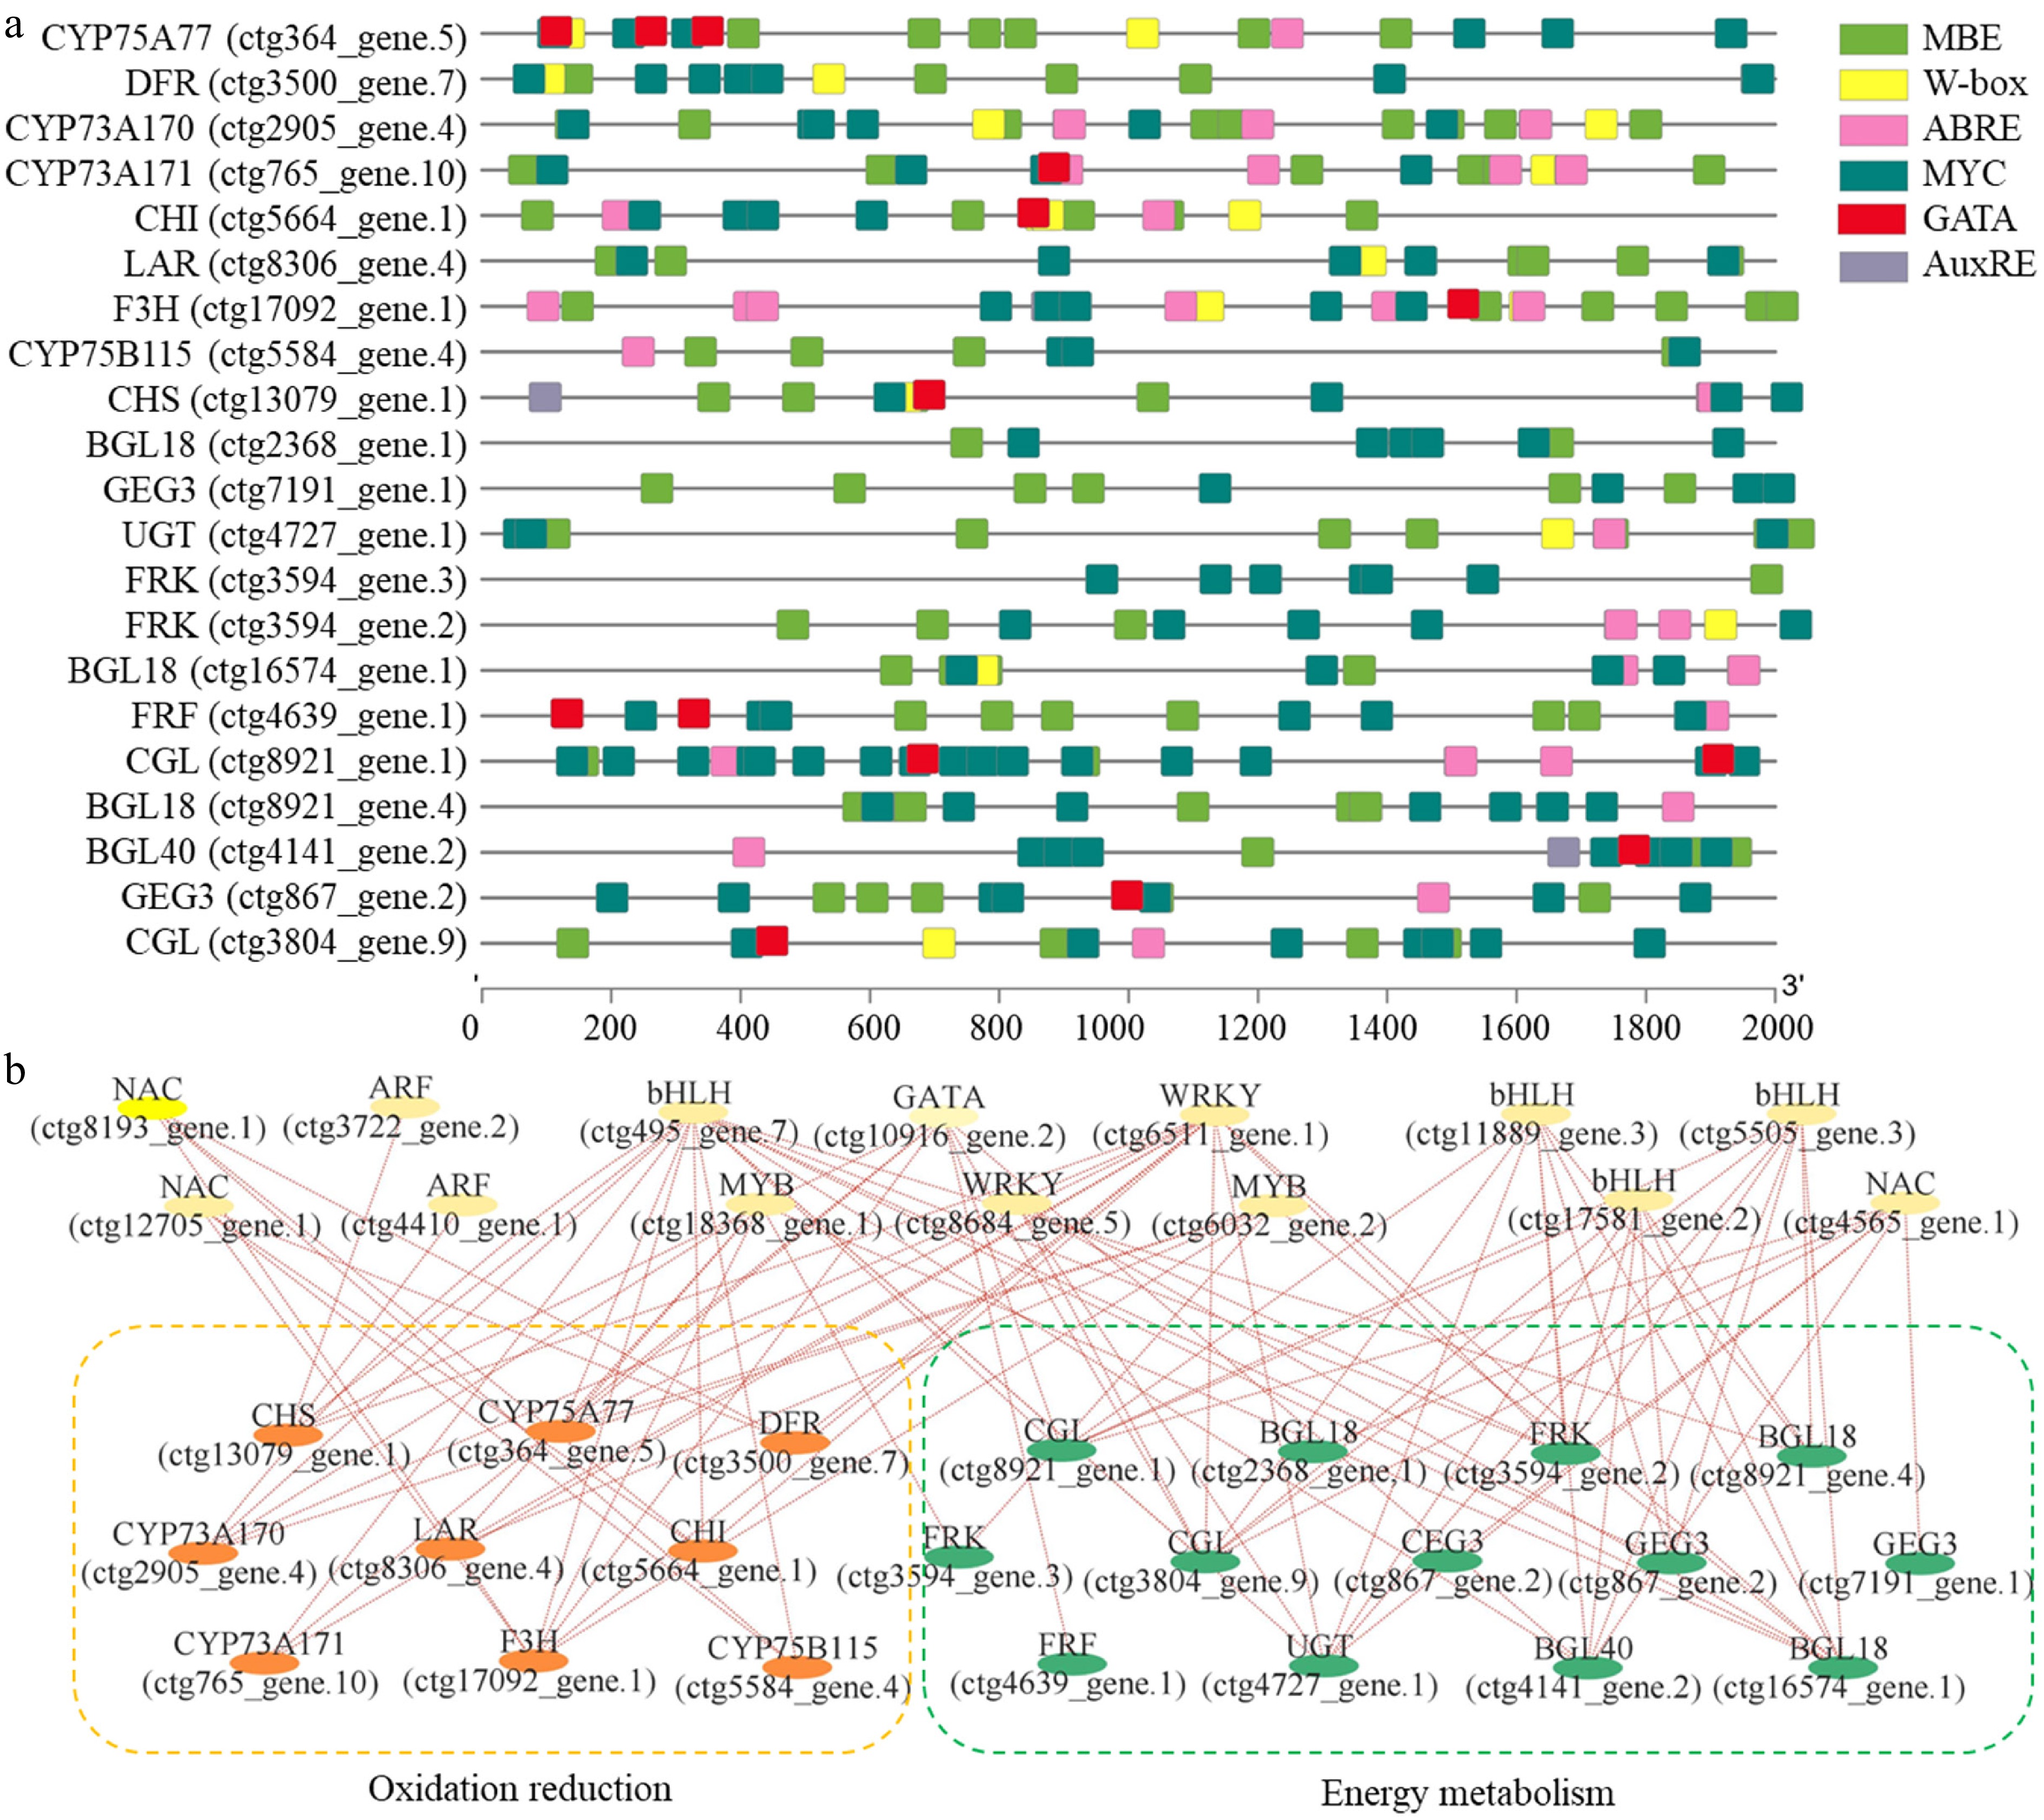
Figure 5.
Prediction of transcriptional regulatory networks. (a) Promoter analysis of nine oxidation reduction-related genes and 12 energy metabolism-related genes. Different color boxes indicate different cis-elements, including MBE, W-box, ABRE, MYC, GATA, and AuxRE. (b) A potential regulatory network as predicted by the Pearson correlation analysis method.
Based on two screening criteria, Pearson correlation, and matching binding cis-elements, a potential regulatory network was predicted (Fig. 5b). Specifically, 14 TF genes, including three NACs, two ARFs, four bHLHs, two MYBs, two WRKYs, and one GATA, were predicted to be the regulators involved in the metabolic responses of T. mairei under the PsNPs and AgNPs treatments.
Functions of TFs in the metabolic responses of T. mairei to PsNPs/AgNPs treatments
-
According to correlation analysis, four potential regulators, including GATA (ctg10916_gene.2), bHLH (ctg495_gene.7), MYB (ctg6032_gene.2), and NAC (ctg8193_gene.1), were selected to validate their functional activities. The full-length CDS of four key TF genes, GATA (ctg10916_gene.2), bHLH (ctg495_gene.7), MYB (ctg18368_gene.1), and NAC (ctg8193_gene.1), were cloned and inserted into expression vectors. Expression analysis showed that GATA (ctg10916_gene.2) was significantly down-regulated under the AgNPs treatment. The expressions of bHLH (ctg495_gene.7) and MYB (ctg18368_gene.1) were decreased under all the treatments. The expression of NAC (ctg8193_gene.1) was significantly up-regulated by the AgNPs + PsNPs treatment. The 1500-bp promoter sequence of CHI (ctg5664_gene.1) and FRK (ctg3594_gene.2) genes were also cloned. To determine the transcriptional activation capacity of GATA (ctg10916_gene.2), bHLH (ctg495_gene.7), MYB (ctg18368_gene.1), and NAC (ctg8193_gene.1), a dual-LUC reporter assay was carried out using a tobacco transient expression system. Based on the results, GATA (ctg10916_gene.2), bHLH (ctg495_gene.7), and NAC (ctg8193_gene.1) significantly induced the expression of CHI (ctg5664_gene.1) and FRK (ctg3594_gene.2) genes, while MYB (ctg18368_gene.1) only significantly induced the expression of FRK (ctg3594_gene.2) gene (Fig. 6a).
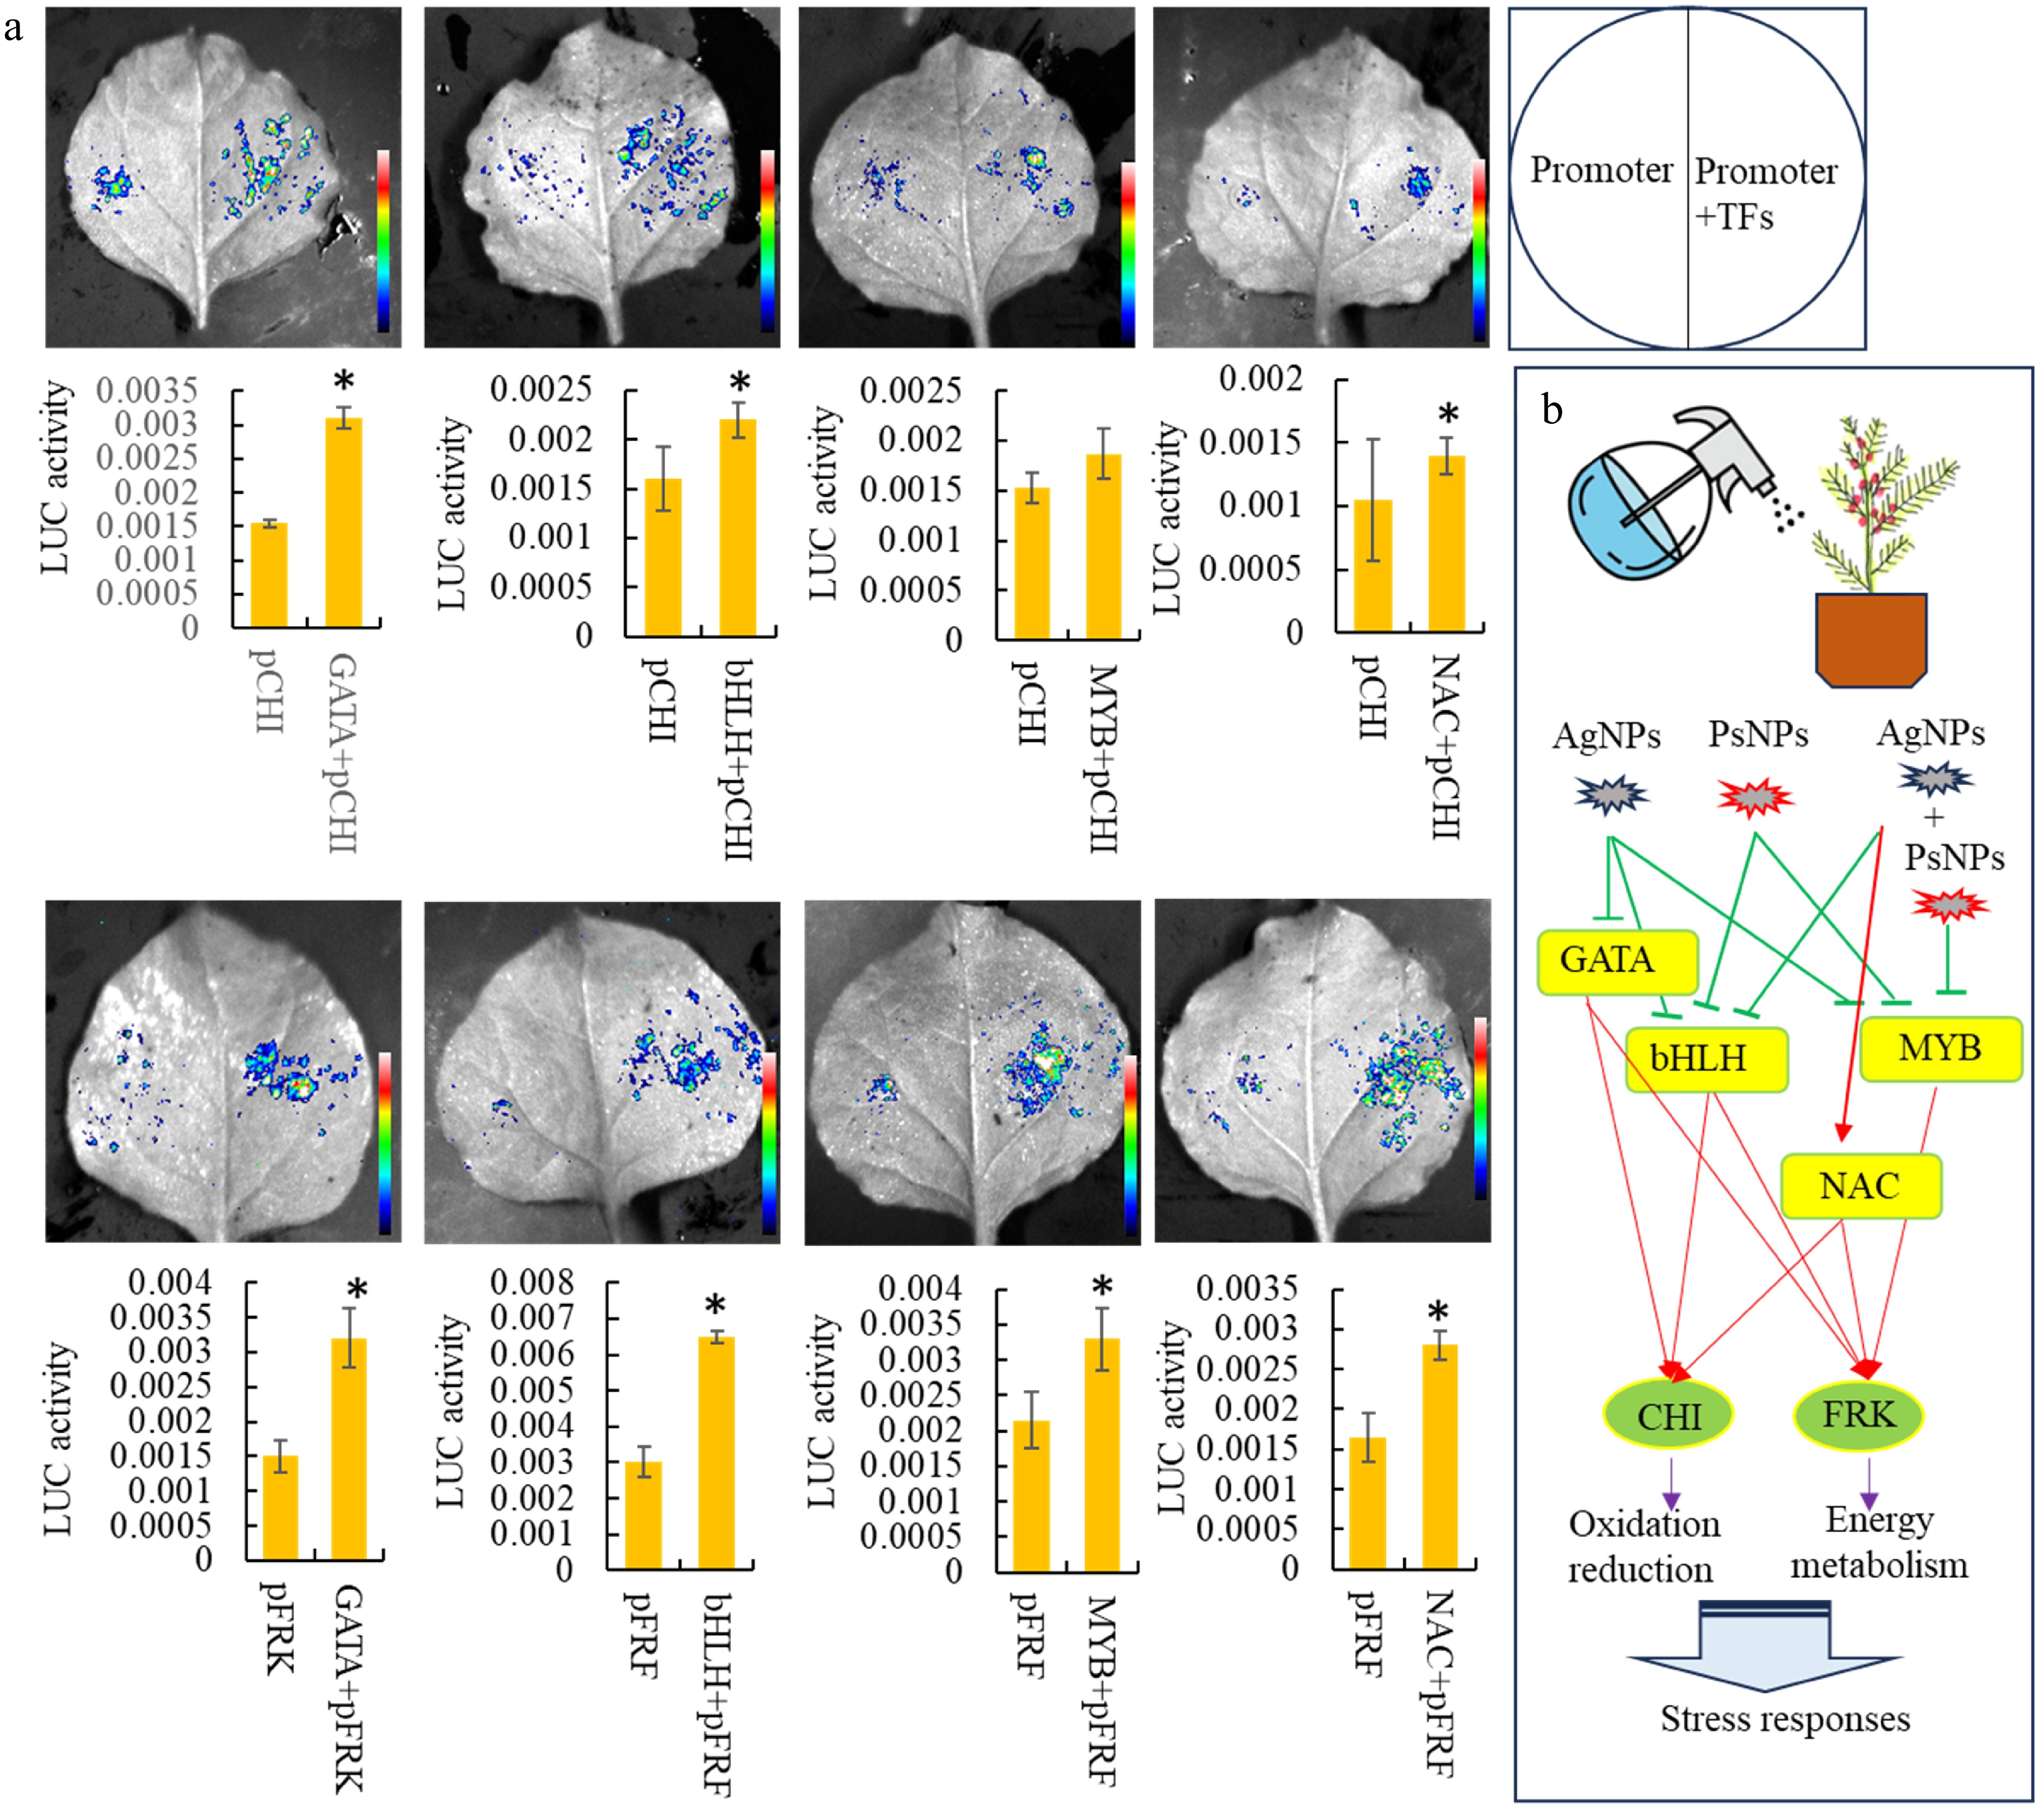
Figure 6.
Analysis of downstream target genes of various differentially expressed TFs. (a) Dual-luciferase assays in tobacco leaves demonstrating that the co-transformation of TFs activates the promoters of two important downstream target genes. Statistical significance is denoted by * at a p value < 0.05. (b) A predicted model of transcription regulation associated with the responses to nanoparticulate pollutants.
-
Nano-material pollution in the environment is considered an irreversible threat to terrestrial and aquatic ecosystems[32,33]. Nano-material pollution can also cause oxidative stress and inhibit photosynthesis in plants[34]. However, the impact of nano-material pollution on plant primary and secondary metabolism has not been comprehensively investigated.
Several enzymes, including SOD, CAT, and POX, play crucial roles in maintaining ROS homeostasis within organisms[35]. Although POD activity was induced by the AgNPs treatment, the activities of SOD and CAT were decreased by the AgNPs and PsNPs treatments, respectively. Our data showed that different antioxidant pathways exhibit distinct response patterns under nanomaterial treatments. Abiotic stresses affect the photosynthesis and electron transport in plants by elevating ROS levels[36]. Several types of harmful by-products, such as H2O2, O2−, and superoxide radicals, are detrimental under stress treatments[37]. In T. mairei, both H2O2 and O2− were down-regulated by the AgNPs + PsNPs treatment, suggesting that nanoparticles-induced stress significantly reduced the ROS levels.
To enhance the adaptability of Taxus trees, various omics analyses have been performed to reveal the genes and metabolites that are responsive to various environmental stresses. Transcriptome profiling of T. chinensis identified several TF families, such as NAC, WRKY, bZIP, MYB, and ERF, whose expression was induced under cold stress[38]. In our study, 45 AgNPs- and 29 PsNPs-responsive metabolites were identified by untargeted metabolomic analysis, suggesting that AgNPs/PsNPs-induced stress significantly and differentially altered the T. mairei metabolome. Furthermore, 1,682 AgNPs- and 2,198 PsNPs-responsive genes were identified by the transcriptomic analysis, providing a wealth of genetic information revealing the underlying stress response mechanisms to nano-material exposure.
Previous studies have demonstrated that PsNPs significantly impact the metabolic pathways in various plants[39]. While polylactic acid PsNPs do not exhibit noticeable toxicity on soybean seedling growth, they do significantly affect the amino acid metabolism pathway[40]. PsNPs trigger stronger plant defense responses by down-regulating the content of reducing agents and up-regulating sugar metabolism in rice[41]. Organic acids, such as succinic and fumaric acids, are notably reduced in rice seedlings after exposure to MPs/NPs[42]. Recently, PsNPs have also been found to play a role in regulating metabolism and ascorbic acid, terpenoid, and flavonoid content in rice root exudates[43]. Our study has identified several secondary metabolites responsive to AgNPs/PsNPs treatments, confirming a significant metabolic response of T. mairei to nano-pollutants. In T. mairei, the pathways involved in flavonoid metabolism were greatly impacted by AgNPs, while several primary metabolism pathways were affected by PsNPs, indicating that T. mairei exhibits differential responses to different types of contaminants.
Nanoparticles have been suggested to have toxic effects on plants. In addition to enzymatic antioxidants, several non-enzymatic antioxidants, such as flavonoids, phenolic compounds, carotenoids, ascorbate, and glutathione, also play a vital role in maintaining plant redox balance[44,45]. In Caralluma tuberculate, selenium nanoparticles augmented enzymatic antioxidant activities and increased the total flavonoid content[46]. The application of various concentrations of AgNPs on Ocimum basilicum plants significantly increased the contents of anthocyanins, carotenoids, and total phenols[47]. In T. mairei, AgNPs exerted a slightly greater impact on flavonoid metabolism than PsNPs, suggesting a higher toxicity of AgNPs. CHS and CHI are key enzymes that catalyze the first two committed steps of the flavonoid pathway in land plants[48]. Transcriptomic analysis demonstrated that the expression of the CHI gene was significantly up-regulated by AgNPs, indicating that they activate the flavonoid pathway in T. mairei.
PsNP accumulation in plant cells was shown to cause significant changes in the sugar metabolism, glycolysis, and starch metabolism pathways[49]. In peanut, polyvinyl chloride-MPs/polybutylene adipate-MPs activated the pathways of starch and sucrose metabolism, alanine, aspartate, glutamate metabolism, and photosynthesis[50]. In T. mairei, PsNPs significantly induced several basic and energy metabolism pathways. According to our findings, the two pollutants influence the stress responses of T. mairei through the regulation of two distinct metabolic pathways. FRK activates fructose and sends the phosphorylated fructose into energy metabolism[51]. Expression analysis showed that PsNPs resulted in significant changes in the expression of the FRK gene, suggesting an inhibitory effect of PsNPs on the energy metabolism of T. mairei.
To date, the transcription regulatory network involved in the response of plants to nanoparticulate pollutants has not been adequately explored. In rice, several ethylene response TFs (AP2/ERFs) were considered to be involved in the TCA cycle under PS-MP stress[52]. Transcriptomic analyses identified that WRKY24, WRKY53, and various MYB family genes regulate rice seedlings' carbon metabolism and phenylpropanoid biosynthesis in response to nanoparticulate pollutants[53]. Our study revealed a complex transcriptional regulation network involved in primary and secondary metabolism under nanoparticle-related stress. In T. mairei, a transcriptional regulatory network related to primary and secondary metabolisms was predicted, comprising several TFs responsive to nanoparticulate pollutants. Interestingly, three shared TFs, GATA (ctg10916_gene.2), bHLH (ctg495_gene.7), and NAC (ctg8193_gene.1), were identified in both the oxidation-reduction and energy metabolism pathways suggesting a universal transcriptional regulatory mechanism under nanoparticulate pollutant-induced stresses. A predicted mode of transcription regulation involved in the responses to nano pollutants is shown in Fig. 6b. In the future, these TFs can be utilized to enhance the tolerance of T. mairei to nanoparticulate pollutants through genetic improvement.
In conclusion, the effects of nanoparticulate pollutants on the primary and secondary metabolism of T. mairei were explored using a multi-omics analysis. Two different nano-pollutants, AgNPs, and PsNPs, significantly affected several secondary and energy metabolism-related pathways, respectively. Furthermore, a transcriptional regulatory network was identified and predicted to be involved in the responses of T. mairei to nano-pollutants. Our study uncovered a regulatory mechanism underlying the responses of T. mairei to nano-pollutants and can contribute to the breeding of Taxus species with superior resilience to environmental stresses.
This work was funded by the National Natural Science Foundation of China (32271905); the Zhejiang Provincial Natural Science Foundation of China under (Grant Nos LY23C160001 and LY22C020001); the Joint Funds of the Zhejiang Provincial Natural Science Foundation of China under (Grant No. LHZY24C140001). The authors are also grateful to LC Sciences Company (Hangzhou, China) for transcriptomic analysis.
-
The authors confirm contribution to the paper as follows: writing – original draft, conceptualization: Yu C, Shen C; writing – review & editing: Yu C, Jiang Y, Zhang P, Wei Y, Shen C; funding acquisition: Zhang P, Shen C, Yu C; project administration: Zhang P, Shen C; investigation: Fang Z, Zhang L, Zhang Y, Ma R; data curation: Yu C, Jiang Y, Zhang P, Wei Y; resources: Lin W, Wang Y, Pi E; supervision: Jiang Y, Zhang P, Wei Y. All authors reviewed the results and approved the final version of the manuscript.
-
The datasets generated during and/or analyzed during the current study are available from the corresponding author on reasonable request.
-
The authors declare that they have no conflict of interest.
-
# Authors contributed equally: Zhijing Wang, Pengcheng Zhang
- Supplementary Table S1 The primer sequences used in the present study.
- Supplementary Table S2 A list of ion features from the untargeted metabolome.
- Supplementary Table S3 KEGG analysis of the differential metabolites in various comparisons.
- Supplementary Table S4 The expression level of all the detected genes.
- Supplementary Fig. S1 The quality analysis of the untargeted metabolomes. (a) Ion chromatograms for the metabolites from different sample groups, (b) Sample correlation. (c) PCA of data from different sample groups.
- Copyright: © 2025 by the author(s). Published by Maximum Academic Press, Fayetteville, GA. This article is an open access article distributed under Creative Commons Attribution License (CC BY 4.0), visit https://creativecommons.org/licenses/by/4.0/.
-
About this article
Cite this article
Wang Z, Zhang P, Wei Y, Fang Z, Zhang L, et al. 2025. Metabolic and transcriptomic responses of Taxus mairei to nano-pollutants: insights into AgNPs and PsNPs impact. Medicinal Plant Biology 4: e010 doi: 10.48130/mpb-0025-0007 

Metabolic and transcriptomic responses of Taxus mairei to nano-pollutants: insights into AgNPs and PsNPs impact
- Received: 23 December 2024
- Revised: 26 February 2025
- Accepted: 07 March 2025
- Published online: 15 April 2025
Abstract: There is a growing global concern regarding the pervasive issue of nano-pollutants. Typical nano-materials, such as polystyrene nanoplastics (PsNPs) and silver nanoparticles (AgNPs), pose significant risks to ecosystems and human health. Taxus mairei is a well-known gymnosperm widely planted in South China and has great medicinal qualities. However, the effects of nano pollutants on the primary and secondary metabolism of Taxus plants have not been sufficiently explored. We investigated the responses of T. mairei to different nano-pollutants via physiological, transcriptomic, and metabolomic analyses. AgNPs and PsNPs significantly affected several secondary and energy metabolism-related pathways, respectively. In T. mairei, AgNPs greatly impacted flavonoid metabolism by regulating the expression of the CHI gene, while PsNPs significantly impacted energy metabolism by regulating the expression of FRK genes. Furthermore, a transcriptional regulation network, including GATA (ctg10916_gene.2), bHLH (ctg495_gene.7), MYB (ctg18368_gene.1), and NAC (ctg8193_gene.1), was predicted to be associated with the responses of T. mairei to nano-pollutants. The present study elucidated a regulatory mechanism underlying the responses of T. mairei to nano-pollutants, which has the potential to aid in the breeding of Taxus species with high environmental adaptability.