


-
E'se tea is processed by the leaf buds of the wild E'se tree (Malus toringoides (Rehd.) Hughes), a species that thrives predominantly at altitudes exceeding 3,000 m in southwestern China, notably Sichuan and Tibet[1,2]. After plucking, fresh tea leaves typically undergo pan-frying, sun-drying or piling to process E'se green tea or E'se dark tea. Once brewed, the tea infusion exhibits a distinct refreshing flavor, complemented by a lingering freshness and sweet aftertaste. While E'se tea follows similar processing methods as conventional tea production, it is derived from a distinct botanical species (Malus toringoides), unlike the traditional tea plant (Camellia sinensis), which typically grows at lower altitudes and serves as the primary source for widely consumed tea varieties such as green tea, black tea, and oolong tea. Furthermore, traditional local records indicate that E'se tea has been used to treat various diseases, including indigestion, hypertension, hyperlipidemia, liver damage, diabetes, etc. Previous research indicated that the E'se tea extract could alleviate acetaminophen-induced acute liver injury in mice by inhibiting inflammatory response and reducing oxidative stress[2]. Another study revealed that the extract of E'se tea exhibited significant efficacy in enhancing glycogen accumulation and mitigating renal fibrosis in diabetic rats. Moreover, E'se tea extract effectively modulated the accumulation of fat droplets in the liver and diminished the size of the fat cells in the high-fat diet-fed rats, suggesting its potential as a dietary supplement for blood lipid-lowering[3].
According to previous reports, polyphenols, caffeine, amino acids, and sugars have been identified in E'se tea, contributing to its sensory attributes and potential nutritional value. Among them, polyphenols are considered to be the main metabolites that bring bitter taste and astringency to tea soup. For example, in green tea made of Camellia sinensis, catechins such as epigallocatechin-3-gallate (EGCG) are the primary polyphenol metabolites that play a pivotal role in contributing to the characteristic astringency and bitterness of the tea infusion[4]. However, unlike Camellia sinensis, it is reported that the main polyphenol of E'se tea is flavonoid glycoside, such as phlorizin, hyperoside, and quercitrin[5]. Amino acids play a pivotal role in shaping the diverse taste of tea soup, contributing to its umami, sweet, and bitter nuances. Notably, theanine, glutamic acid, glutamine, and aspartic acid are uniquely endowed with a pronounced umami taste, enhancing the savory aspect of the beverage. On the other hand, amino acids such as cysteine, proline, alanine, serine, and threonine tend to exhibit a sweet taste, lending a pleasant sweetness to the tea infusion. Conversely, isoleucine, tyrosine, and histidine contribute to a bitter taste, adding to the complexity of the overall flavor profile[6]. To date, no study has been conducted to profile the amino acid composition of E'se tea.
Given that the ongoing research on chemical profiles of E'se tea leaves remains very limited, particularly in distinguishing volatile and non-volatile compounds across different maturity stages, this study employs high-performance liquid chromatography (HPLC), gas chromatography-mass spectrometry (GC-MS), and non-targeted metabolomics analysis to quantify and characterize key metabolites in tender and mature leaves, including volatile and non-volatile compounds. Additionally, sensory evaluations were conducted to assess differences in flavor attributes. By integrating chemical and sensory data, this study provides a theoretical basis for optimizing the use of E'se tea at different maturity stages in functional food formulations, such as tea-based beverages, dietary supplements, or herbal-infused functional snacks.
-
Fresh E'se tender leaves (top two leaves with bud) and older leaf materials were plucked and collected from Ganzi, Sichuan, and were subsequently authenticated, dried and gifted from the Tea College of Mianyang, Sichuan (China). A voucher specimen has been deposited in the Department of Tea Science, Zhejiang Agriculture and Forestry University (Zhejiang, China) (Accession Number: TSD2023–07–15), and samples were named E'se tender tea (EST) and E'se older tea (ESO). Acetonitrile, phosphoric acid (chromatography grade) and n-Alkanes standard solution were purchased from Sigma Aldrich (MO, USA). Gallic acid, glucose, ninhydrin hydrate, 3,5-dinitrosalicylic acid (DNS), folinol, sodium acetate buffer, ferric chloride, ferrous sulfate, and ethylenediaminetetraacetic acid (EDTA) were purchased from Sinopharm Group (Shanghai, China). Derivative reagent 6-aminoquinoline-N-hydroxysuccinimate (AQC), phosphate buffer, borate buffer and polyphenol standards (caffeic acid, p-coumaric acid, rutin, hypericin, isoquercetin, quercetin, phloridzin, trilobin, quercetin, phloretin; chromatography grade) and amino acid standards (aspartic acid, serine, glutamic, histidine, glycine, arginine, threonine, alanine, proline, theanine, cystine, tyrosine, valine, methionine, lysine, isoleucine, leucine and phenylalanine; chromatography grade) were purchased from Yuan Ye Bio-Technology (Shanghai, China).
Sample preparation
-
The EST and ESO samples were ground into powder using a pulverizer (Lingsum, Shanghai, China) and stored at 4 °C. Subsequently, dried EST and ESO samples (1.5 g) were extracted using 250 mL of boiling water in a conical flask. The flask was then placed in a water bath (SR-HH, VRERA, Changzhou, China) maintained at 100 °C for 45 min and agitated every 15 min. After extraction, the supernatants were filtered and collected using a Brinell funnel assisted by a circulating filter device (SHZ-III, ShangYi, Shanghai, China) for further analysis.
Determination of general non-volatile chemical compounds
-
The levels of general non-volatile compounds of EST and ESO were tested according to previous methods[7]. The concentration of free amino acids was determined using the ninhydrin method, and the absorbance of samples was measured at 570 nm. The content of total polyphenols was quantified via the Folin-Ciocalteu method, measuring absorbance at 765 nm. The DNS method was employed to determine the amount of reducing sugars, with absorbance recorded at 540 nm. Additionally, the quantity of soluble proteins was assessed using the Coomassie Brilliant Blue G-250 method, recording the absorbance at 595 nm.
Determination of polyphenol constituents
-
The concentrations of the phenolic compounds (caffeic acid, p-coumaric acid, rutin, hypericin, isoquercetin, quercetin, phloridzin, trilobin, phloretin) in EST and ESO were measured using the high-performance liquid chromatography (HPLC) (1260 Infinity, Agilent Technologies, CA, USA) with the ZORBAX SB-C18 column (250 mm × 4.6 mm, 5 μm). The column temperature was maintained at 30 °C, with a sample injection volume of 10 μL, and the detection wavelength was set specifically at 340 nm. Acetonitrile served as mobile phase A, while 0.1% (v/v) phosphoric acid was used as mobile phase B, with a constant flow rate maintained at 0.7 mL/min. The elution gradients were set as follows: 0−5 min, 88%−85% B; 5−15 min, 85%−80% B; 15−28 min, 80% B; 28−48 min, 80%−58% B; 48−50 min, 58%−50% B and 50−55 min, 50%−88% B, respectively.
Determination of amino acids constituents
-
The amino acids (aspartic acid, serine, glutamic, histidine, glycine, arginine, threonine, alanine, proline, theanine, cystine, tyrosine, valine, methionine, lysine, isoleucine, leucine and phenylalanine) of EST and ESO were determined by high-performance liquid chromatography (HPLC) (1260 Infinity, Agilent Technologies, CA, USA) following the methods of Zhao et al., with some modifications[8]. AQC powder (5.7 mg) was dissolved in 2 mL of acetonitrile through vortex mixing and heating at 55 °C until complete dissolution occurred, resulting in the preparation of an AQC derivative solution with a concentration of 2.85 mg/mL. EST and ESO solution (60 μL) were then mixed with borate buffer (420 μL) and AQC derivative solution (120 μL), respectively. After incubating at 55 °C for 10 min, samples were cooled to room temperature for further analysis. The temperature of the C18 column (ZORBOX, Agilent Technologies, CA, USA, 250 mm × 4.6 mm, 5 μm) was set at 37 °C. The excitation and emission wavelength for fluorescence detection were adjusted to 250 and 395 nm, respectively. Acetonitrile was used as mobile phase A, a mixture of phosphate buffer solution and water (1:10, v/v) was used as mobile phase B and ultra-pure water was used as mobile phase C. The flow rate was maintained at 2 mL/min. The elution gradients were as follows: 0 min: 100% B; 22 min: 5% A, 91% B, 4% C; 29 min: 17% A, 80% B, 3% C; 37 min: 25% A, 65% B, 10% C; 39 min: 25% A, 65% B, 10% C; 40 min: 50% A, 50% C; 42 min: 50% A, 50% C; 44 min: 100% B; 50 min: 100% B.
Non-targeted metabolomics analysis
-
Non-targeted metabolomics analysis was performed using an Ultra-high-performance liquid chromatography system coupled with a Fourier transform high-resolution mass spectrometer (UHPLC-MS/MS, Thermo Scientific, MA, USA)[9]. Chromatographic separation was achieved using an ACQUITY UPLC HSS T3 column (100 mm × 2.1 mm inner diameter, 1.8 μm particle size, Waters, MA, USA). Mobile phase A consisted of 95% water, 5% acetonitrile, and 0.1% formic acid; mobile phase B consisted of 47.5% acetonitrile, 47.5% isopropanol, 5% water, and 0.1% formic acid. The injection volume of samples was 2 μL, and the column temperature was maintained at 40 °C. The mass spectrometry signal acquisition adopted the positive and negative ion scanning mode, and the mass scanning range was 70−1,050 m/z.
Raw data were processed using Progenesis QI software (Waters, MA, USA) for peak extraction, alignment, and normalization. Metabolite identification was performed by matching retention times, m/z values, and fragmentation patterns against reference standards or entries in public databases (HMDB:
www.hmdb.ca ; METLIN:http://metlin.scripps.edu/ ) and the self-built Majorbio database (www.majorbio.com ). Quality control (QC) samples were analyzed throughout the experiment to ensure data stability. Metabolites with a coefficient of variation (CV) exceeding 30% were excluded. After normalization to total peak intensity, multivariate statistical analysis was conducted using the R package ropls (version 1.6.2) and the Python scipy module (version 1.0.0).Determination of volatile constituents
-
The volatile compounds of EST and ESO were determined by the headspace solid-phase microextraction and gas chromatography-mass spectrometry (HS-SPME-GC-MS, 6890N, Agilent Technologies, CA, USA) according to the methodology of Lin et al., with some modifications[7]. Boiling water (5 mL) and 10 μL ethyl caprate (internal standard, 10 mg/L) were added to the dried EST and ESO samples (0.5 g). The vial was immediately sealed and allowed to equilibrate for 5 min. A divinylbenzene/carboxen/polydimethylsiloxane (DVB/CAR/PDMS)-coated fiber (Supelco, Sigma-Aldrich, Shanghai, China) was exposed to the sample headspace at 60 °C for 60 min to absorb volatiles.
The fiber was then transferred into the GC inlet to parse the volatiles for 5 min at 250 °C. Volatile compounds were then separated by the DB-5MS quartz capillary column (30 m × 0.25 mm × 0.25 μm, Agilent Technologies, CA, USA). High-purity helium (99.999%) was used as the carrier gas at a flow rate of 1 mL/min. The column temperature programme was as follows: initially maintained at 40 °C for 2 min, then increased at 2°C/min to 85 °C and held for 2 min, followed by 2.5 °C/min to 180 °C and held for 2 min, and finally 10 °C/min to 230 °C where it remained stable for 2 min. For the MS conditions, the ion source was electron ionization (EI) with an ionization energy of 70 eV. The ion source temperature was maintained at 230 °C, and the acquisition range for mass-to-charge ratio (m/z) was set from 40 to 400. Retention indices (RIs) of the volatile compounds were calculated using a homologous series of C6–C24 n-alkanes as reference standards. The RI values were determined by the equation:
$ \mathrm{R}\mathrm{I}=100\mathrm{n}+100\left(\dfrac{{\mathrm{t}}_{\mathrm{i}}-{\mathrm{t}}_{\mathrm{n}}}{{\mathrm{t}}_{\mathrm{n}+1}-{\mathrm{t}}_{\mathrm{n}}}\right) $ (1) where n is the carbon number of n-alkanes, ti is the retention time of the target compound, and tn, tn+1 are the retention times of n-alkanes eluting immediately before and after the target compound.
Experimental RI values were cross-referenced with the NIST 14.1 database and published literature RI values, with matches accepted under a tolerance of ± 20 RI units and a minimum spectral similarity index of ≥ 80%[7].
Quantitative analysis was performed using a semi-quantitative method with ethyl decanoate as the internal standard. The relative content of each volatile compound (Ci, μg/g) was calculated using the formula:
$ {\mathrm{C}}_{\mathrm{i}}=\dfrac{{\mathrm{A}}_{\mathrm{i}}{\mathrm{w}}_{\mathrm{s}}}{{\mathrm{A}}_{\mathrm{s}}\mathrm{w}} $ (2) where Ai and As are the peak areas of the target compound and internal standard, respectively, and w and ws represent the masses of the sample (g) and internal standard (g). Peak integration and compound identification were conducted using MassHunter software (Agilent, CA, USA).
Sensory evaluation
-
The sensory evaluation of EST and ESO tea infusion was performed according to the national standard GB/T 21733–2008 and the methodology of Yin et al.[10]. The dried EST and ESO tea samples (3 g) were individually infused with 150 mL of boiling water in special tasting utensils for 4 min. Afterwards, the samples were evaluated for infusion color, aroma and taste by ten qualified group members (five men and five women, aged 25−50 years) with certified senior tea sensory evaluation qualifications obtained from the Tea Scientific Society of China, each possessing at least five years expertise in tea tasting. The assessment of diverse sensory attributes, including sweetness, bitterness, astringency, sweet aftertaste, and thickness, is conducted using a comprehensive 10-point scale. Scores ranging from 1 to 4 signify a weak intensity, 5 to 7 indicate a moderate level, while ratings from 8 to 10 denote a strong and pronounced intensity. To ensure the reproducibility and reliability of the results, the samples were assessed in a double-blinded manner, and randomly coded with numbers. All participants conducted the assessments independently and repeated the process in three parallel trials, each conducted on separate days.
Color determination
-
The color of the tea infusion was determined using a colorimeter (CM3500d, Konica Minolta, Shenzhen, China), with reference to the previous method[10]. Specifically, L* signified the luminance scale, with positive values (+L) indicating brightness and negative values (−L) indicating darkness. Meanwhile, a* captured the red-green axis, where positive values (+a) denoted redness and negative values (−a) represented greenness. Lastly, b* reflected the yellow-blue dimension, with positive values (+b) corresponding to yellowness and negative values (−b) signifying blueness.
Statistical analysis
-
All experiments were performed in triplicates and expressed as mean ± SD. Origin software (2021 version, MA, USA) was used to produce the figures. Results were analyzed using the IBM SPSS Statistics (IL, USA). Meanwhile, the independent sample T-test was used to determine the differences between groups and p < 0.05 was considered statistically significant. The SIMCA (version 14.1, Umea, Sweden) was employed for the analysis of key aroma compounds.
-
The general chemical compositions of EST and ESO were analyzed, and the obtained results were presented in Table 1. It was revealed that polyphenols emerged as the dominant compounds in both EST and ESO, and the polyphenol content in EST tea was significantly elevated compared to that of ESO (175.49 mg/g vs 151.98 mg/g, EST vs ESO, p < 0.05). Polyphenols play a pivotal role in imparting a distinctive flavor profile to food, notably characterized by their unique astringency and subtle bitterness, which contribute to the overall sensory experience. Meanwhile, polyphenols possess various physiological activities, such as antioxidant, anti-inflammatory, anti-hypoglycemic, cancer-preventive, etc.[4]. Wei et al. revealed that the combination of green tea polyphenol epigallocatechin gallate (EGCG) and chlorogenic acid can synergistically mitigate gut ageing induced by D-galactose, achieved through the regulation of tight junction proteins and restoration of microbial homeostasis[11]. Free amino acids play a pivotal role in contributing to the taste characteristics of tea infusions. Herein, EST exhibited a notably higher free amino acid content of 39.06 mg/g, approximately tripling that of ESO at 14.06 mg/g (p < 0.01). This finding aligns with the tendency observed in tea plants (Camelia Sinesis), where amino acids are predominantly concentrated in the tender leaves[10]. In addition, there were no significant differences in the content of soluble proteins (68.94 mg/g vs 64.42 mg/g, EST vs ESO) and reducing sugars (58.25 mg/g vs 60.86 mg/g, EST vs ESO). Overall, EST and ESO share a commonality in their non-volatile components, albeit at varying concentrations.
Table 1. The contents of major non-volatile compounds of EST and ESO (mg/g).
Compound class EST ESO Free amino acids 39.06 ± 1.41 14.06 ± 0.13** Polyphenols 175.49 ± 10.50 151.98 ± 2.40* Soluble proteins 68.94 ± 1.42 64.42 ± 2.66 Reducing sugars 58.25 ± 3.90 60.86 ± 1.41 * indicates p < 0.05. ** indicates p < 0.01. EST and ESO represent the tender leaf and older leaf of E'se tea, respectively. Furthermore, through UHPLC-MS/MS analysis, a total of 2,492 metabolites were identified in EST and ESO samples (Supplementary Table S1), including 582 primary metabolites (23.35%), 1,104 secondary metabolites (44.30%), and 806 unclassified metabolites (32.34%). The composition analysis of primary metabolites showed that lipid compounds accounted for the highest proportion (47.77%), followed by carbohydrates and their derivatives (30.76%) and amino acid substances (15.46%). Among secondary metabolites, flavonoids dominated (35.14%), followed by terpenes (25.18%) and phenolic acids and their derivatives (11.78%) (Supplementary Fig. S1). Based on the criteria of p-value<0.05 and variable importance projection (VIP) > 1, a total of 807 common differential metabolites were identified, among them, 534 metabolites were significantly upregulated in EST, while 273 metabolites were significantly downregulated, as compared to ESO (Fig. 1a). Multivariate statistical analysis further confirmed that the metabolic characteristics of the two groups were significantly different. The principal component analysis (PCA) score plot presented a clear separation trend between samples (Fig. 1b).
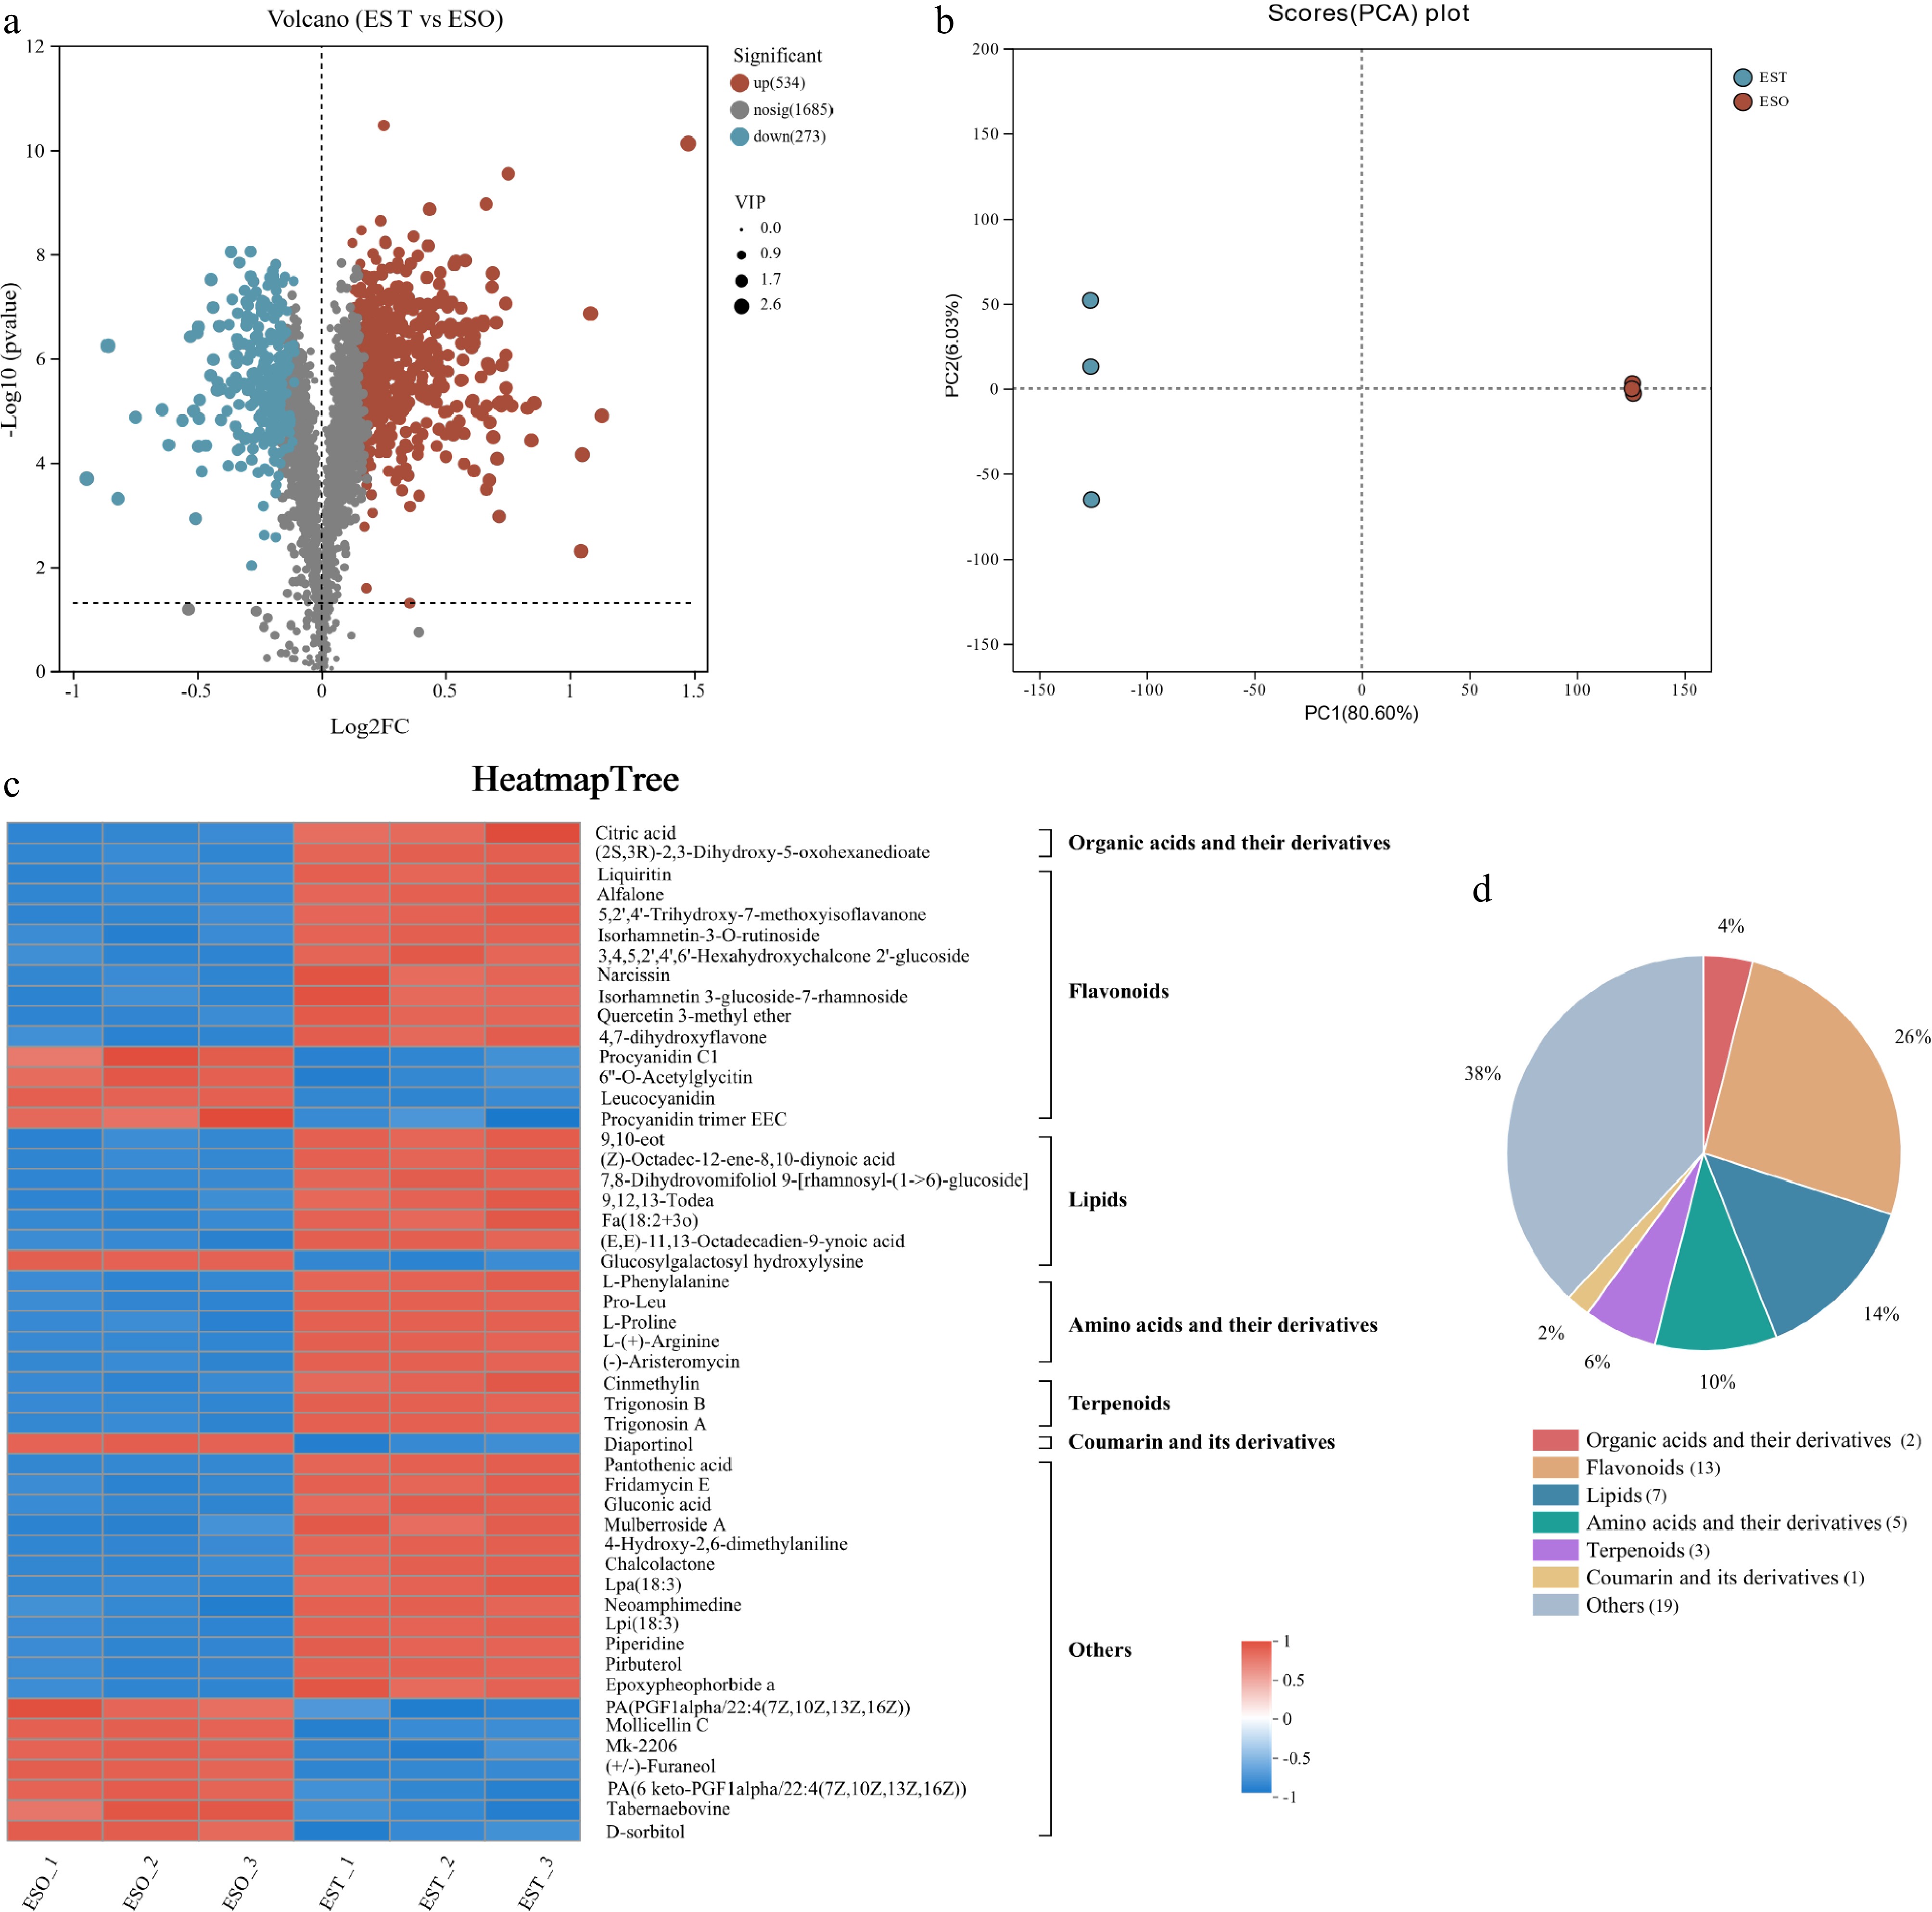
Figure 1.
Non-targeted metabolomics analysis of EST and ESO. (a) Volcano plot displaying metabolite abundance variations. Each point represents an individual metabolite, with point size scaled according to its variable importance in projection (VIP) score. Red and blue markers denote significantly upregulated and downregulated metabolites, respectively (VIP > 1, p < 0.05). (b) Principal component analysis (PCA) of all metabolites identified from EST and ESO. (c) Heatmap of top 50 differential metabolites between EST and ESO. (d) Phytochemical classification of the top 50 differential metabolites between EST and ESO and their species quantity ratio. EST and ESO represent the tender leaf and older leaf of E'se tea, respectively.
Clustering analysis of the top 50 metabolites with significant differences (VIP > 1, p < 0.05) between EST and ESO, using a heat map, revealed that they are mainly categorized into organic acids and their derivatives, flavonoids, lipids, amino acids and their derivatives, terpenoids, and others (Fig. 1c). Among these, two organic acids and their derivatives account for 4%, 13 flavonoids account for 26%, seven lipid compounds account for 14%, five amino acids and their derivatives account for 10%, three terpenoids account for 6%, one coumarin and its derivatives account for 2%, and 19 other types of metabolites account for 38%, respectively (Fig. 1d). Among organic acids, levels of citric acid and (2S,3R)-2,3-dihydroxy-5-oxohexanedioate were upregulated in EST and are key components contributing to the acidity and freshness of tea[12]. Citric acid enhances acidity and balances bitterness, while (2S,3R)-2,3-dihydroxy-5-oxohexanedioate, typically present in trace amounts in plants, has a structure similar to citric acid compounds, providing a sour taste and contributing potential bitterness to the soup flavor[13]. For flavonoids, levels of liquiritin, alfalone, 5,2',4'-trihydroxy-7-methoxyisoflavanone, isorhamnetin-3-O-rutinoside, 3,4,5,2',4',6'-hexahydroxychalcone 2'-glucoside, narcissin, isorhamnetin 3-glucoside-7-rhamnoside, quercetin 3-methyl ether and 4,7-dihydroxyflavone were higher in EST, while levels of procyanidin C1, 6''-o-acetylglycitin, leucocyanidin and procyanidin trimer EEC were relatively lower, compared to ESO. In addition, flavonoid glycosides (liquiritin, narcissin, isorhamnetin-3-O-rutinoside and isorhamnetin 3-glucoside-7-rhamnoside) and isoflavones (alfalone and 5,2',4'-trihydroxy-7-methoxyisoflavanone) are associated with astringency and bitterness[14,15]. Meanwhile, 3,4,5,2',4',6'-hexahydroxychalcone 2'-glucoside typically reduces irritation and enhances floral aftertaste[14]. Furthermore, quercetin 3-methyl ether, as a methylated flavonoid, although increasing bitterness, may also stabilize volatile aromatic compounds[16]. Hydroxyflavone (4,7-dihydroxyflavone) inhibits lipid oxidation through its antioxidant properties, indirectly maintaining the freshness of the tea[17]. The downregulated biflavonoid (procyanidin C1) in EST indicates a reduction in astringency in mature leaves, consistent with their mild flavor characteristics[18]. Research shows that isoflavones (6''-O-acetylglycitin) are present in black tea, and their content has a significant impact on the bitterness and astringency. During processing or aging, these compounds undergo transformation and degradation, aligning with the downregulation trend observed in EST[19]. Leucocyanidin can promote the biosynthesis of anthocyanins and proanthocyanidins in grains such as red rice by regulating secondary metabolic pathways. The reduction in the content of procyanidin trimer (procyanidin trimer EEC) is significantly negatively correlated with the decrease in astringency and bitterness of the tea infusion. The dual downregulation of the aforementioned metabolic pathways can synergistically reduce the sensory irritation of polyphenolic substances, thereby forming a mild and mellow flavor characteristic of the tea infusion[20]. The upregulated fatty acyls (9,10-EOT, (E,E)-11,13-octadecadien-9-ynoic acid, and (Z)-octadec-12-ene-8,10-diynoic acid) are precursors to volatile aldehydes and ketones, which are crucial for the green and grassy aroma of young leaves[21]. In contrast, the downregulated lipid glucosylgalactosyl hydroxylysine in ESO may reflect lipid degradation, promoting the development of earthy notes in aged tea[22]. Moreover, amino acids and their derivatives, such as L-phenylalanine, L-Proline and L-(+)-arginine (upregulated in EST) are precursors to aromatic volatiles and Maillard reaction products, enhancing floral and roasted aromas when high-drying temperatures are applied[23]. Dipeptides (pro-leu) may regulate umami and sweetness, synergistically working with theanine to create a soup-like mouthfeel[24]. Meanwhile, the monoterpenes (cinmethylin) and diterpenes (trigonosin A and trigonosin B) in EST are associated with floral and herbal aromas[25]. The downregulated coumarin (diaportinol) in ESO indicates a decline in sweet grassy aroma[26]. Among other metabolites, vitamin B5 (pantothenic acid) mediates lipid oxidation regulation by promoting the biosynthesis of acetyl-CoA, which can synergistically enhance the umami intensity and storage stability in seafood products[27]. Gluconic acid enhances the refreshing sensation of tea soup by modulating taste receptors[13]. Piperidine and pirbuterol, as characteristic alkaloids of medicinal plants, interact with neurotransmitter receptors to form the pharmacological activity basis[28]. Mulberroside A, as a stilbene compound, significantly prolongs the sensory duration of the refreshing taste of tea soup through a dual mechanism of scavenging free radicals and inhibiting lipid peroxidation, all of which are upregulated in EST[29]. In summary, the overall upregulation trend of metabolites in EST indicates that the young leaves possess more diversity of substances, which may endow the tea broth with more complexity in flavor as compared to ESO.
Differences in phenolic constituents
-
It has been previously reported that E'se tea is rich in phenolic compounds[1]. In the present study, the phenolic constituents of EST and ESO were compared (Supplementary Table S2). Among the monomers, the contents of isoquercitrin, quercitrin, phloridzin, rutin, hyperoside, and phloretin in the two samples were significantly different (p < 0.01) and higher than 1 mg/g. As depicted in Fig. 2a, the content of isoquercitrin (5.68 mg/g) was markedly lower than that of ESO (6.14 mg/g, p < 0.01). Isoquercitrin, a compound found in various medicinal herbs, fruits, vegetables, and plant-derived products, has exhibited remarkable efficacy in combating oxidative stress, cancer, cardiovascular diseases, diabetes, and allergies[30]. The content of quercitrin in EST (4.35 mg/g) was also significantly lower than that in ESO (5.54 mg/g, p < 0.01). Quercitrin, a prevalent constituent in the average human diet, is increasingly being incorporated into food supplements due to its demonstrated positive effects on immune enhancement and reduction of mutagenesis[5]. Phloridzin accounted for 151.95 mg/g and 132.33 mg/g in EST and ESO, respectively. In a similar study, Yang et al. identified phloridzin as the principal flavonoid in the fresh leaves of sweet tea (Lithocarpus polystachyus Rehd.) and found that it decreased with increasing leaf maturity[31]. Although there were significant differences in the content of rutin, hyperoside, and phloretin between EST and ESO (p < 0.01), the contents of all three were below 5 mg/g. Rutin and phloretin were more abundant in EST compared to ESO, whereas the opposite trend is observed for hyperoside. Among them, rutin, a naturally occurring flavonoid abundant in apples, citrus fruits, tea leaves, and red wine, has proven efficacy in addressing varicose veins and mitigating internal bleeding. Hyperoside, the primary phenolic compound found in blueberry leaves, exerts a pivotal regulatory influence on reactive oxygen species (ROS). By mitigating the harmful effects of ROS, it safeguards cells from undergoing apoptosis, thereby preserving the vital functionality of hematopoietic stem cells and contributing to overall cellular health. Phloretin, a compound originally discovered in Irish apple pomace, possesses a plethora of biological activities, including potent antioxidant, vasoprotective, and antitumor properties[32].
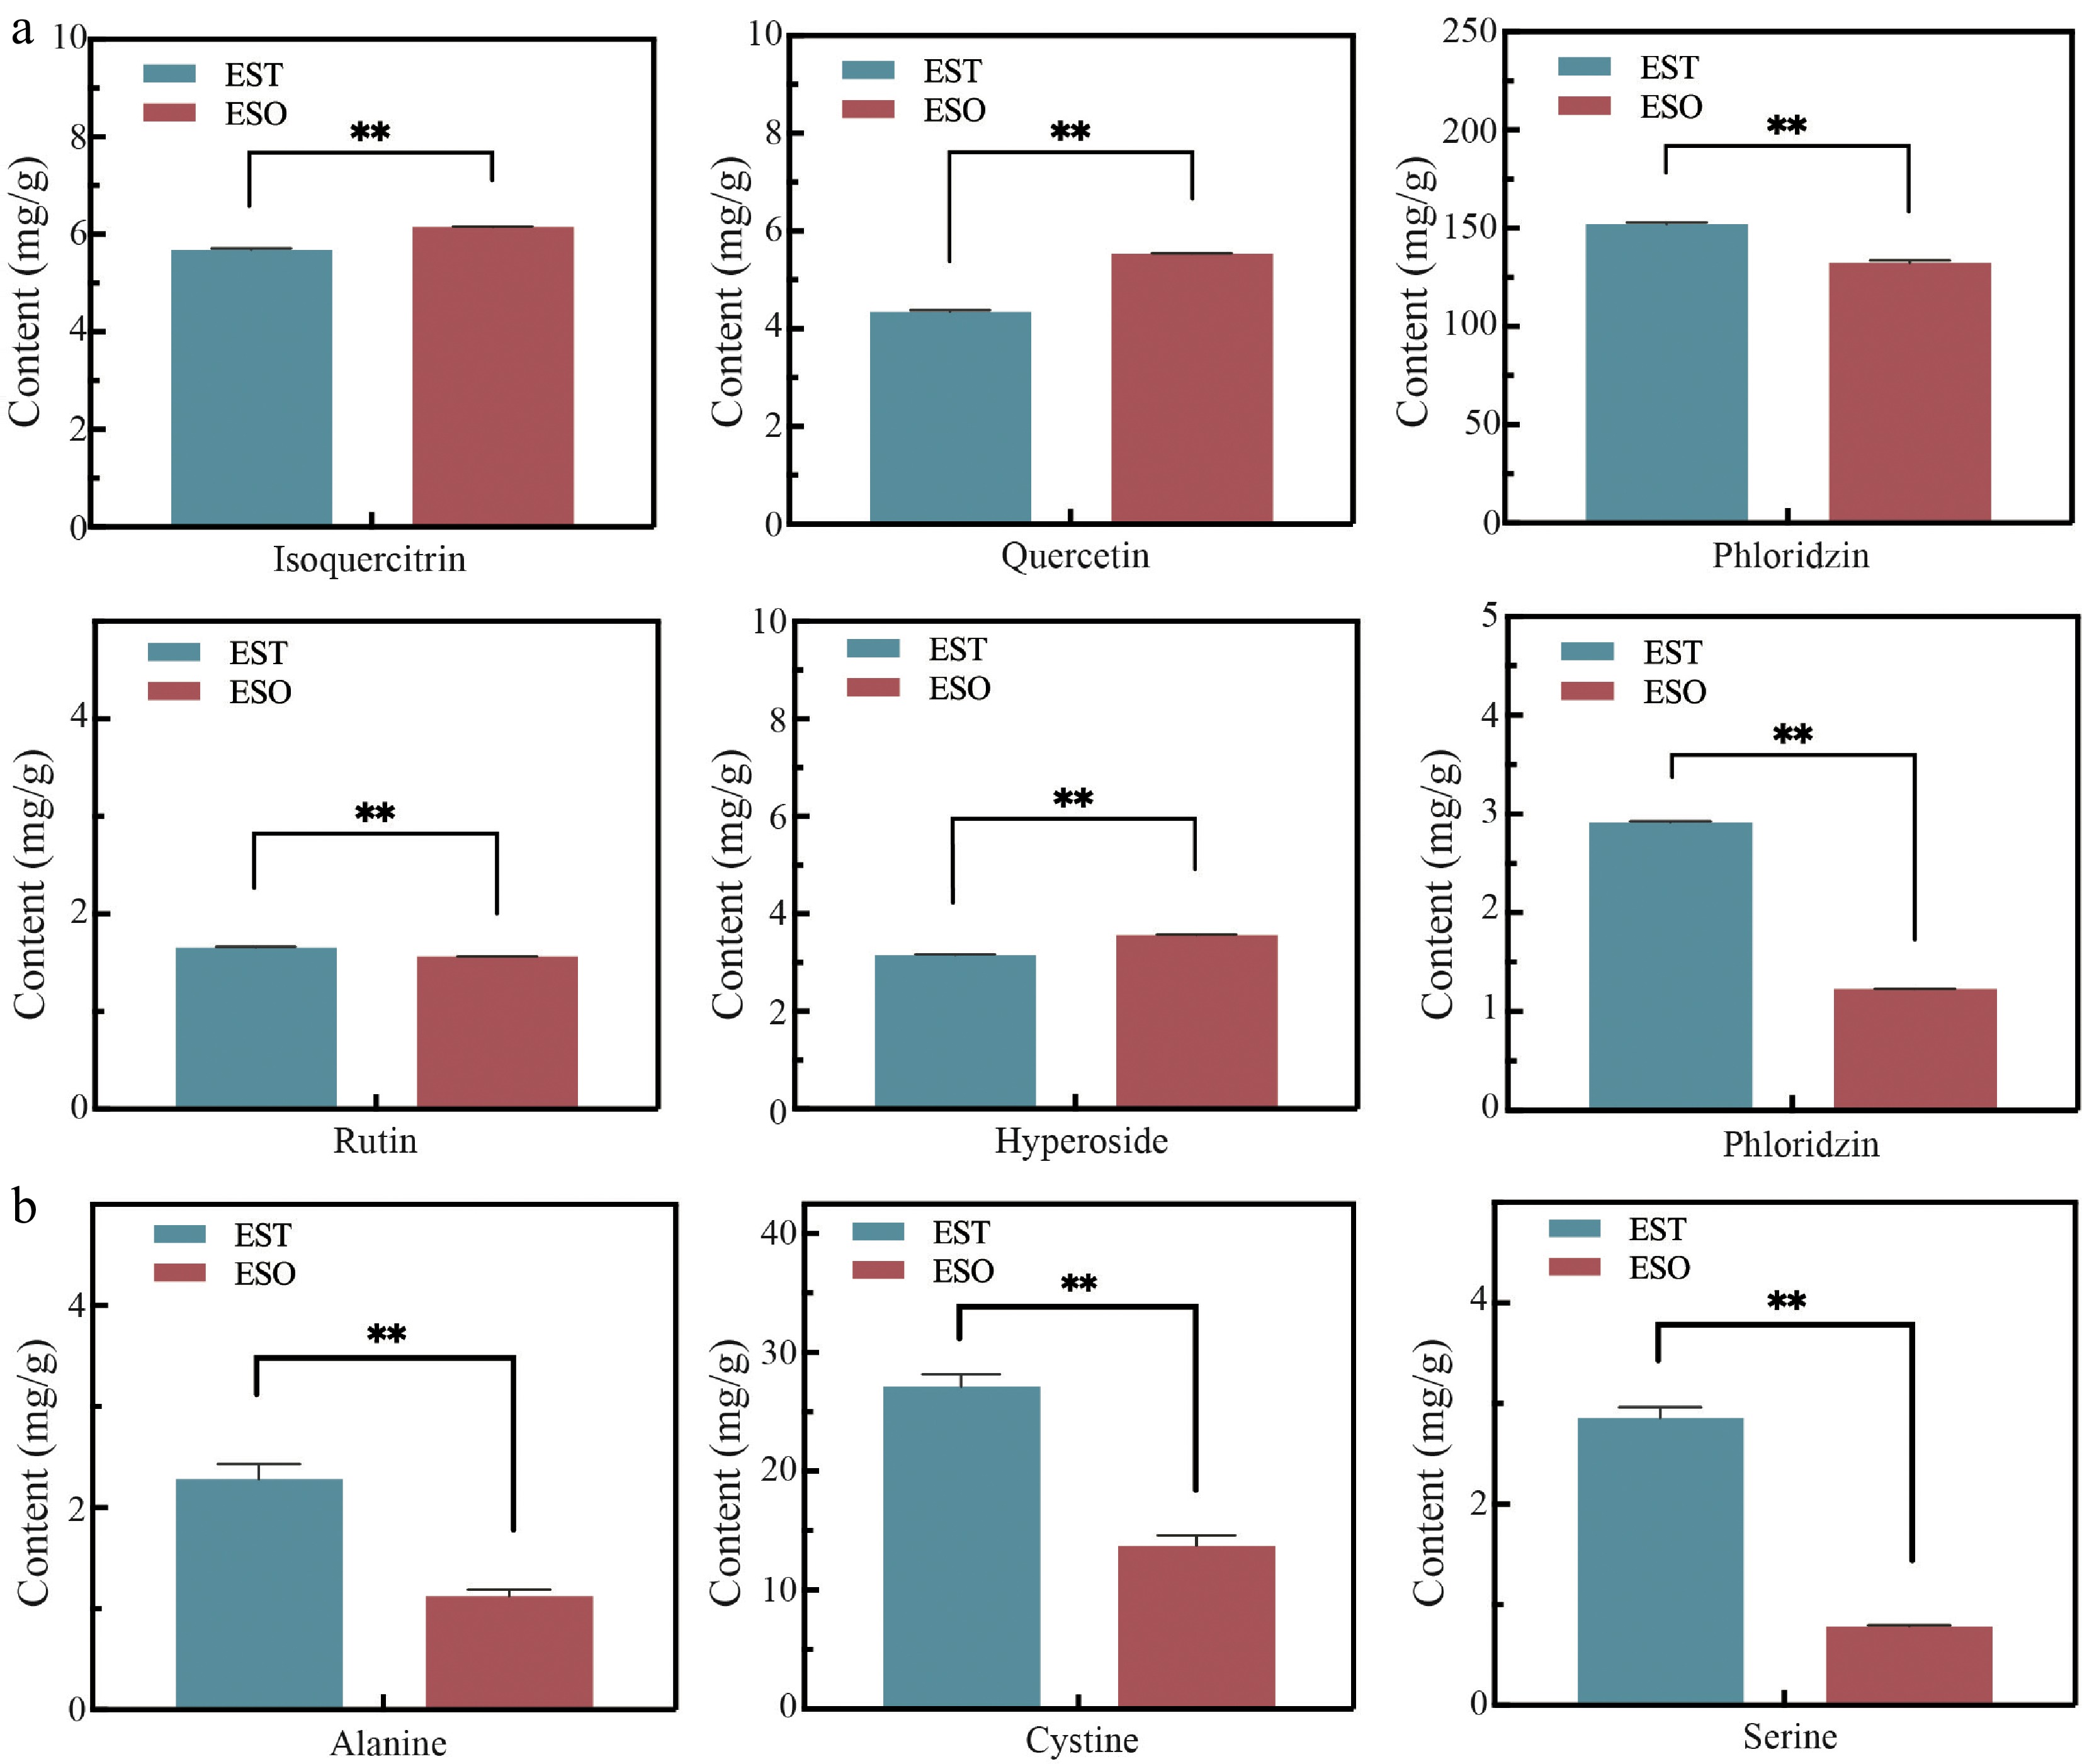
Figure 2.
Phenolic and amino acids compounds in EST and ESO. (a) The contents of phenolic compounds in EST and ESO. (b) The contents of alanine, cystine and serine in EST and ESO. * indicates p < 0.05. ** indicates p < 0.01. EST and ESO represent the tender leaf and older leaf of E'se tea, respectively.
Differences in amino acids constituents
-
To date, there has been a lack of comprehensive information regarding the amino acid composition of E'se tea. Therefore, in this study, the HPLC was utilized to accurately determine the amino acid monomers present in both EST and ESO. Overall, a total of 16 amino acids were detected in EST, and 14 amino acids were detected in ESO (Supplementary Table S3). Among them, three of these amino acids, present in both EST and ESO, had concentrations exceeding 0.8 mg/g, namely alanine, cysteine, and serine (Fig. 2b). Specifically, the content of alanine in EST was higher than that of ESO (2.28 mg/g vs 1.12 mg/g, p < 0.01). The heightened presence of alanine in EST, known for its inherently high sweetness, provides an explanation for the slight sweetness perceived in EST compared to ESO[33]. Among all the amino acid monomers, cysteine exhibited the highest proportion in both EST and ESO (27.10 mg/g vs 13.71 mg/g, p < 0.01, EST vs ESO). Cysteine serves as a precursor for the synthesis of aroma components during plant ripening. Besides, Wu et al. have suggested that an increase in cysteine levels may contribute to the sweet and umami taste characteristics of oolong tea[34]. Additionally, the content of serine in EST was also notably elevated, reaching 2.86 mg/g compared to 0.80 mg/g in ESO (p < 0.01). Serine, as one of the sweet-tasting amino acids, imparts a heightened sweetness to green tea and is generally recognized as a significant contributor to its overall flavor profile[35]. Therefore, the potentially higher content of alanine, cysteine and serine in EST could be the reason behind its slightly higher sweet taste[36].
Differences in volatile compositions
-
To investigate the difference in volatiles between EST and ESO, GC-MS analysis was conducted. During this study, 61 aroma compounds were detected in EST and 43 aroma compounds were detected in ESO (Table 2, Fig. 3a). In detail, EST was found to contain 14 aldehydes (29.07%), 15 esters (10.34%), five alcohols (5.36%), nine ketones (26.48%), 15 hydrocarbons (19.45%), and three other volatiles (1.94%). ESO contained a total of 10 aldehydes (32.01%), 11 esters (11.90%), three alcohols (3.73%), nine ketones (22.38%), nine hydrocarbons (16.93%), and others (0.69%) (Fig. 3b). In comparison to ESO, EST exhibited a higher relative abundance of alcohols, ketones and hydrocarbons, whereas the relative abundances of aldehydes and esters were lower. Nevertheless, both samples share aldehydes as their primary volatile components. Notably, butanal, 2-methyl- (39.73 µg/g), pentanal (27.77 µg/g), benzaldehyde, 4-methyl- (85.33 µg/g), pentamethylbenzaldehyde (46.87 µg/g) were only detected in EST. Similarly, several esters were uniquely detected in EST, including hexanoic acid, methyl ester (74.19 µg/g), 2-hexenoic acid, methyl ester (50.40 µg/g) and 9,12,15-octadecatrienoic acid, ethyl ester, (Z,Z,Z)- (41.80 µg/g). In terms of alcohol, 1-penten-3-ol (70.28 µg/g) and phytol (30.29 µg/g) were only detected in EST. Moreover, for ketones, 1-penten-3-one has been exclusively detected in ESO (31.22 µg/g), whereas ethanone, 1-(2-hydroxy-5-methylphenyl)- (39.28 µg/g) was only identified in EST. Regarding hydrocarbon substances, decane (33.17 µg/g), ethanone, 1-(2-methyl-1-cyclopenten-1-yl)- (59.36 µg/g), dodecane, 4,6-dimethyl- (44.23 µg/g), tridecane (44.47 µg/g), acenaphthylene (37.03 µg/g), and octadecane (46.81 µg/g) were exclusively detected in EST.
Table 2. The contents of volatile substances of EST and ESO (µg/g).
Classification Sequence Compound name CAS Formula RIa RIb RIc Contents (μg/g) VIP value EST ESO Aldehydes 1 Butanal, 2-methyl- 96-17-3 C5H10O 663.83 658.81 659 39.73 ± 22.88 N.D.* 1.02 2 Pentanal 110-62-3 C5H10O 699.24 699.07 699 27.77 ± 13.36 N.D.* 1.04 3 Hexanal 66-25-1 C6H12O 801.06 800.76 802 202.84 ± 45.50 124.08 ± 48.10 0.95 4 2-Hexenal, (E)- 6728-26-3 C6H10O 858.57 850.21 854 143.52 ± 51.39 707.80 ± 306.43* 1.02 5 Heptanal 111-71-7 C7H14O 901.73 901.37 903 34.00 ± 6.11 32.04 ± 11.10 0.72 6 Benzaldehyde 100-52-7 C7H6O 962.46 957.41 957 1535.05 ± 206.71 416.20 ± 186.34** 1.10 7 Octanal 124-13-0 C8H16O 1,002.61 1,002.21 1,004 44.72 ± 7.63 50.70 ± 16.89 0.75 8 2,4-Heptadienal, (E,E)- 4313-03-5 C7H10O 1,010.36 1,008.97 1,011 153.91 ± 32.61 216.59 ± 86.91 0.83 9 Benzeneacetaldehyde 122-78-1 C8H8O 1,043.45 1,039.58 1,041 108.45 ± 20.08 26.33 ± 12.11** 1.09 10 Benzaldehyde, 4-methyl- 104-87-0 C8H8O 1,067.53 1,064.10 − 9.36 ± 0.94 N.D.** 1.01 11 Nonanal 124-19-6 C9H18O 1,104.13 1,103.70 1,105 194.04 ± 31.29 210.46 ± 82.07 0.72 12 1,3-Cyclohexadiene-1-carboxaldehyde, 2,6,6-trimethyl- 116-26-7 C10H14O 1,194.33 1,193.73 1,195 104.27 ± 12.27 35.72 ± 16.94** 1.09 13 1-Cyclohexene-1-carboxaldehyde, 2,6,6-trimethyl- 432-25-7 C10H16O 1,215.01 1,213.91 1,222 127.58 ± 17.37 66.52 ± 31.60* 1.01 14 Pentamethylbenzaldehyde 17432-38-1 C12H16O 1,409.73 1,409.20 − 46.87 ± 10.35 N.D.** 1.11 Esters 1 Hexanoic acid, methyl ester 106-70-7 C7H14O2 926.63 922.59 922 74.19 ± 12.81 N.D.** 1.11 2 2-Hexenoic acid, methyl ester 2396-77-2 C7H12O2 967.90 963.09 − 50.40 ± 8.28 N.D.** 1.12 3 Pentanoic acid,
2-methyl-, anhydride63169-61-9 C12H22O3 987.03 984.51 − 67.50 ± 11.41 42.25 ± 19.33 0.94 4 3-Hexen-1-ol, acetate, (Z)- 3681-71-8 C8H14O2 1,005.16 1,004.44 − 35.02 ± 5.41 31.28 ± 9.67 0.75 5 2(3H)-Furanone, 5-ethyldihydro- 695-06-7 C6H10O2 1,051.99 1,048.05 − 44.69 ± 29.18 34.01 ± 17.74 0.74 6 Formic acid, octyl ester 112-32-3 C9H18O2 1,073.33 1,070.22 − 61.31 ± 10.57 60.23 ± 23.38 0.71 7 Methyl salicylate 119-36-8 C8H8O3 1,187.60 1,186.30 1,187 244.17 ± 39.33 81.14 ± 35.00** 1.08 8 2(3H)-Furanone, dihydro-5-pentyl- 104-61-0 C9H16O2 1,355.93 1,354.07 1,356 32.00 ± 2.65 72.90 ± 35.48 0.94 9 2(3H)-Furanone, 5-hexyldihydro- 706-14-9 C10H18O2 1,461.12 1,459.61 1,461 50.77 ± 10.07 31.71 ± 10.18 0.97 10 2-Propenoic acid, 3-phenyl-,
ethyl ester103-36-6 C11H12O2 1,462.92 1,461.52 − 49.76 ± 17.18 173.87 ± 119.76 0.92 11 Phthalic acid,
hept-4-yl isobutyl ester1000356-78-3 C19H28O4 1,860.30 1,859.57 − 35.14 ± 7.03 46.66 ± 14.42 0.85 12 Hexadecanoic acid, methyl ester 112-39-0 C17H34O2 1,926.78 1,926.42 1,959 37.45 ± 7.61 N.D.** 1.11 13 Dibutyl phthalate 84-74-2 C16H22O4 1,951.26 1,950.86 1,951 37.90 ± 7.96 47.41 ± 13.80 0.81 14 Hexadecanoic acid, ethyl ester 628-97-7 C18H36O2 1,993.27 1,993.06 1,993 145.83 ± 28.04 86.18 ± 30.90 0.98 15 9,12,15-Octadecatrienoic acid, ethyl ester, (Z,Z,Z)- 1191-41-9 C20H34O2 2,165.00 2,164.77 − 41.80 ± 11.28 N.D.* 1.10 Alcohols 1 1-Penten-3-ol 616-25-1 C5H10O 682.97 679.69 − 70.28 ± 29.24 N.D.* 1.06 2 1-Octen-3-ol 3391-86-4 C8H16O 982.03 978.76 980 136.67 ± 20.08 77.23 ± 36.63 0.98 3 Benzyl alcohol 100-51-6 C7H8O 1,035.95 1,032.34 1,037 148.49 ± 11.40 98.17 ± 52.48 0.90 4 Phenylethyl alcohol 60-12-8 C8H10O 1,109.06 1,108.13 1,110 136.22 ± 8.91 50.54 ± 25.53** 1.09 5 Phytol 150-86-7 C20H40O 2,106.76 2,106.59 2,114 30.29 ± 5.97 N.D.** 1.11 Ketones 1 1-Penten-3-one 1629-58-9 C5H8O 684.47 681.49 685 N.D. 31.22 ± 19.43 1.00 2 5-Hepten-2-one, 6-methyl- 110-93-0 C8H14O 985.79 983.01 986 105.83 ± 14.24 52.51 ± 20.88* 1.05 3 Cyclohexanone, 2,2,6-trimethyl- 2408-37-9 C9H16O 1,034.38 1,030.89 1,036 162.51 ± 24.52 45.36 ± 23.28** 1.09 4 Isophorone 78-59-1 C9H14O 1,058.47 1,054.61 1,117 102.99 ± 14.88 43.41 ± 21.29* 1.06 5 Acetophenone 98-86-2 C8H8O 1,064.14 1,060.46 1,061 516.27 ± 102.90 146.12 ± 43.68** 1.09 6 3,5-Octadien-2-one 38284-27-4 C8H12O 1,070.34 1,067.00 1,063 116.26 ± 19.42 56.08 ± 26.68* 1.02 7 Ethanone, 1-(2-hydroxy-5-methylphenyl)- 1450-72-2 C9H10O2 1,303.94 1,303.68 − 39.28 ± 1.19 N.D.** 1.13 8 2-Cyclopenten-1-one, 3-methyl-2-(2-pentenyl)-, (Z)- 488-10-8 C11H16O 1,390.18 1,389.47 1,395 643.02 ± 73.72 257.02 ± 104.84** 1.08 9 3-Buten-2-one, 4-(2,6,6-trimethyl-1-cyclohexen-1-yl)- 14901-07-6 C13H20O 1,474.31 1,473.09 1,474 715.00 ± 125.99 557.37 ± 278.34 0.79 10 3-Buten-2-one, 4-(2,2,6-trimethyl-7-oxabicyclo[4.1.0]hept-1-yl)- 23267-57-4 C13H20O2 1,476.97 1,475.89 − 182.11 ± 12.51 143.07 ± 63.12 0.82 Hydrocarbons 1 Toluene 108-88-3 C7H8 766.16 759.73 752 56.73 ± 8.68 156.03 ± 87.15 0.94 2 Oxime-, methoxy-phenyl- 1000222-86-6 C8H9NO2 913.62 911.19 892 916.26 ± 223.44 559.84 ± 450.15 0.84 3 2-Hexene, 3,5,5-trimethyl- 26456-76-8 C9H18 975.48 971.38 975 64.21 ± 9.54 31.61 ± 15.70* 1.02 4 Decane 124-18-5 C10H22 999.59 999.51 1000 33.17 ± 4.39 N.D.** 1.12 5 Nonane, 4,5-dimethyl- 17302-23-7 C11H24 1,062.77 1,059.06 1,056 60.96 ± 14.18 25.60 ± 11.07* 1.04 6 Ethanone, 1-(2-methyl-1-cyclopenten-1-yl)- 3168-90-9 C8H12O 1,100.12 1,100.10 1,182 59.36 ± 6.66 N.D.* 1.12 7 Naphthalene 91-20-3 C10H8 1,178.43 1,176.41 1,171 81.16 ± 14.01 33.84 ± 16.21* 1.05 8 Dodecane 112-40-3 C12H26 1,199.40 1,199.36 1,202 36.40 ± 6.21 28.62 ± 15.23 0.78 9 Pentadecane 629-62-9 C15H32 1,275.42 1,273.68 − 244.89 ± 57.07 95.73 ± 45.34* 1.04 10 Dodecane, 4,6-dimethyl- 61141-72-8 C14H30 1,288.32 1,287.35 1,276 44.23 ± 7.09 N.D.** 1.12 11 Tridecane 629-50-5 C13H28 1,299.29 1,299.21 1,301 44.47 ± 9.72 N.D.** 1.11 12 Hexadecane, 2,6,11,15-tetramethyl- 504-44-9 C20H42 1,321.26 1,320.04 − 116.06 ± 28.06 49.78 ± 20.75* 1.03 13 Acenaphthylene 208-96-8 C12H8 1,438.07 1,436.62 − 37.03 ± 6.73 N.D.* 1.11 14 Octadecane 593-45-3 C18H38 1,495.82 1,495.56 − 46.81 ± 13.45 N.D.* 1.09 15 Hexadecane, 2,6,10,14-tetramethyl- 638-36-8 C20H42 1,739.86 1,748.07 − 47.36 ± 7.86 31.84 ± 2.93* 1.03 Others 1 Furan, 2-ethyl- 3208-16-0 C6H8O 700.49 700.37 703 N.D. 41.32 ± 20.95* 1.04 2 Furan, 2-methoxy- 25414-22-6 C5H6O2 796.81 795.82 − 55.39 ± 13.18 N.D.* 1.10 3 1-Pentanone, 1-(2-furanyl)- 1192-62-7 C6H6O2 907.38 905.95 − 96.44 ± 15.84 N.D.** 1.12 4 Eugenol 97-53-0 C10H12O2 1,348.24 1,346.39 1,364 37.68 ± 3.15 N.D.** 1.12 * indicates p < 0.05. ** indicates p < 0.01. N.D. indicates that the substance has not been detected. EST and ESO represent the tender leaf and older leaf of E'se tea, respectively. RIa: The retention index was determined in this study. RIb: The retention index, sourced from the NIST library. RIc: Reference retention index of compounds[7,48,49]. 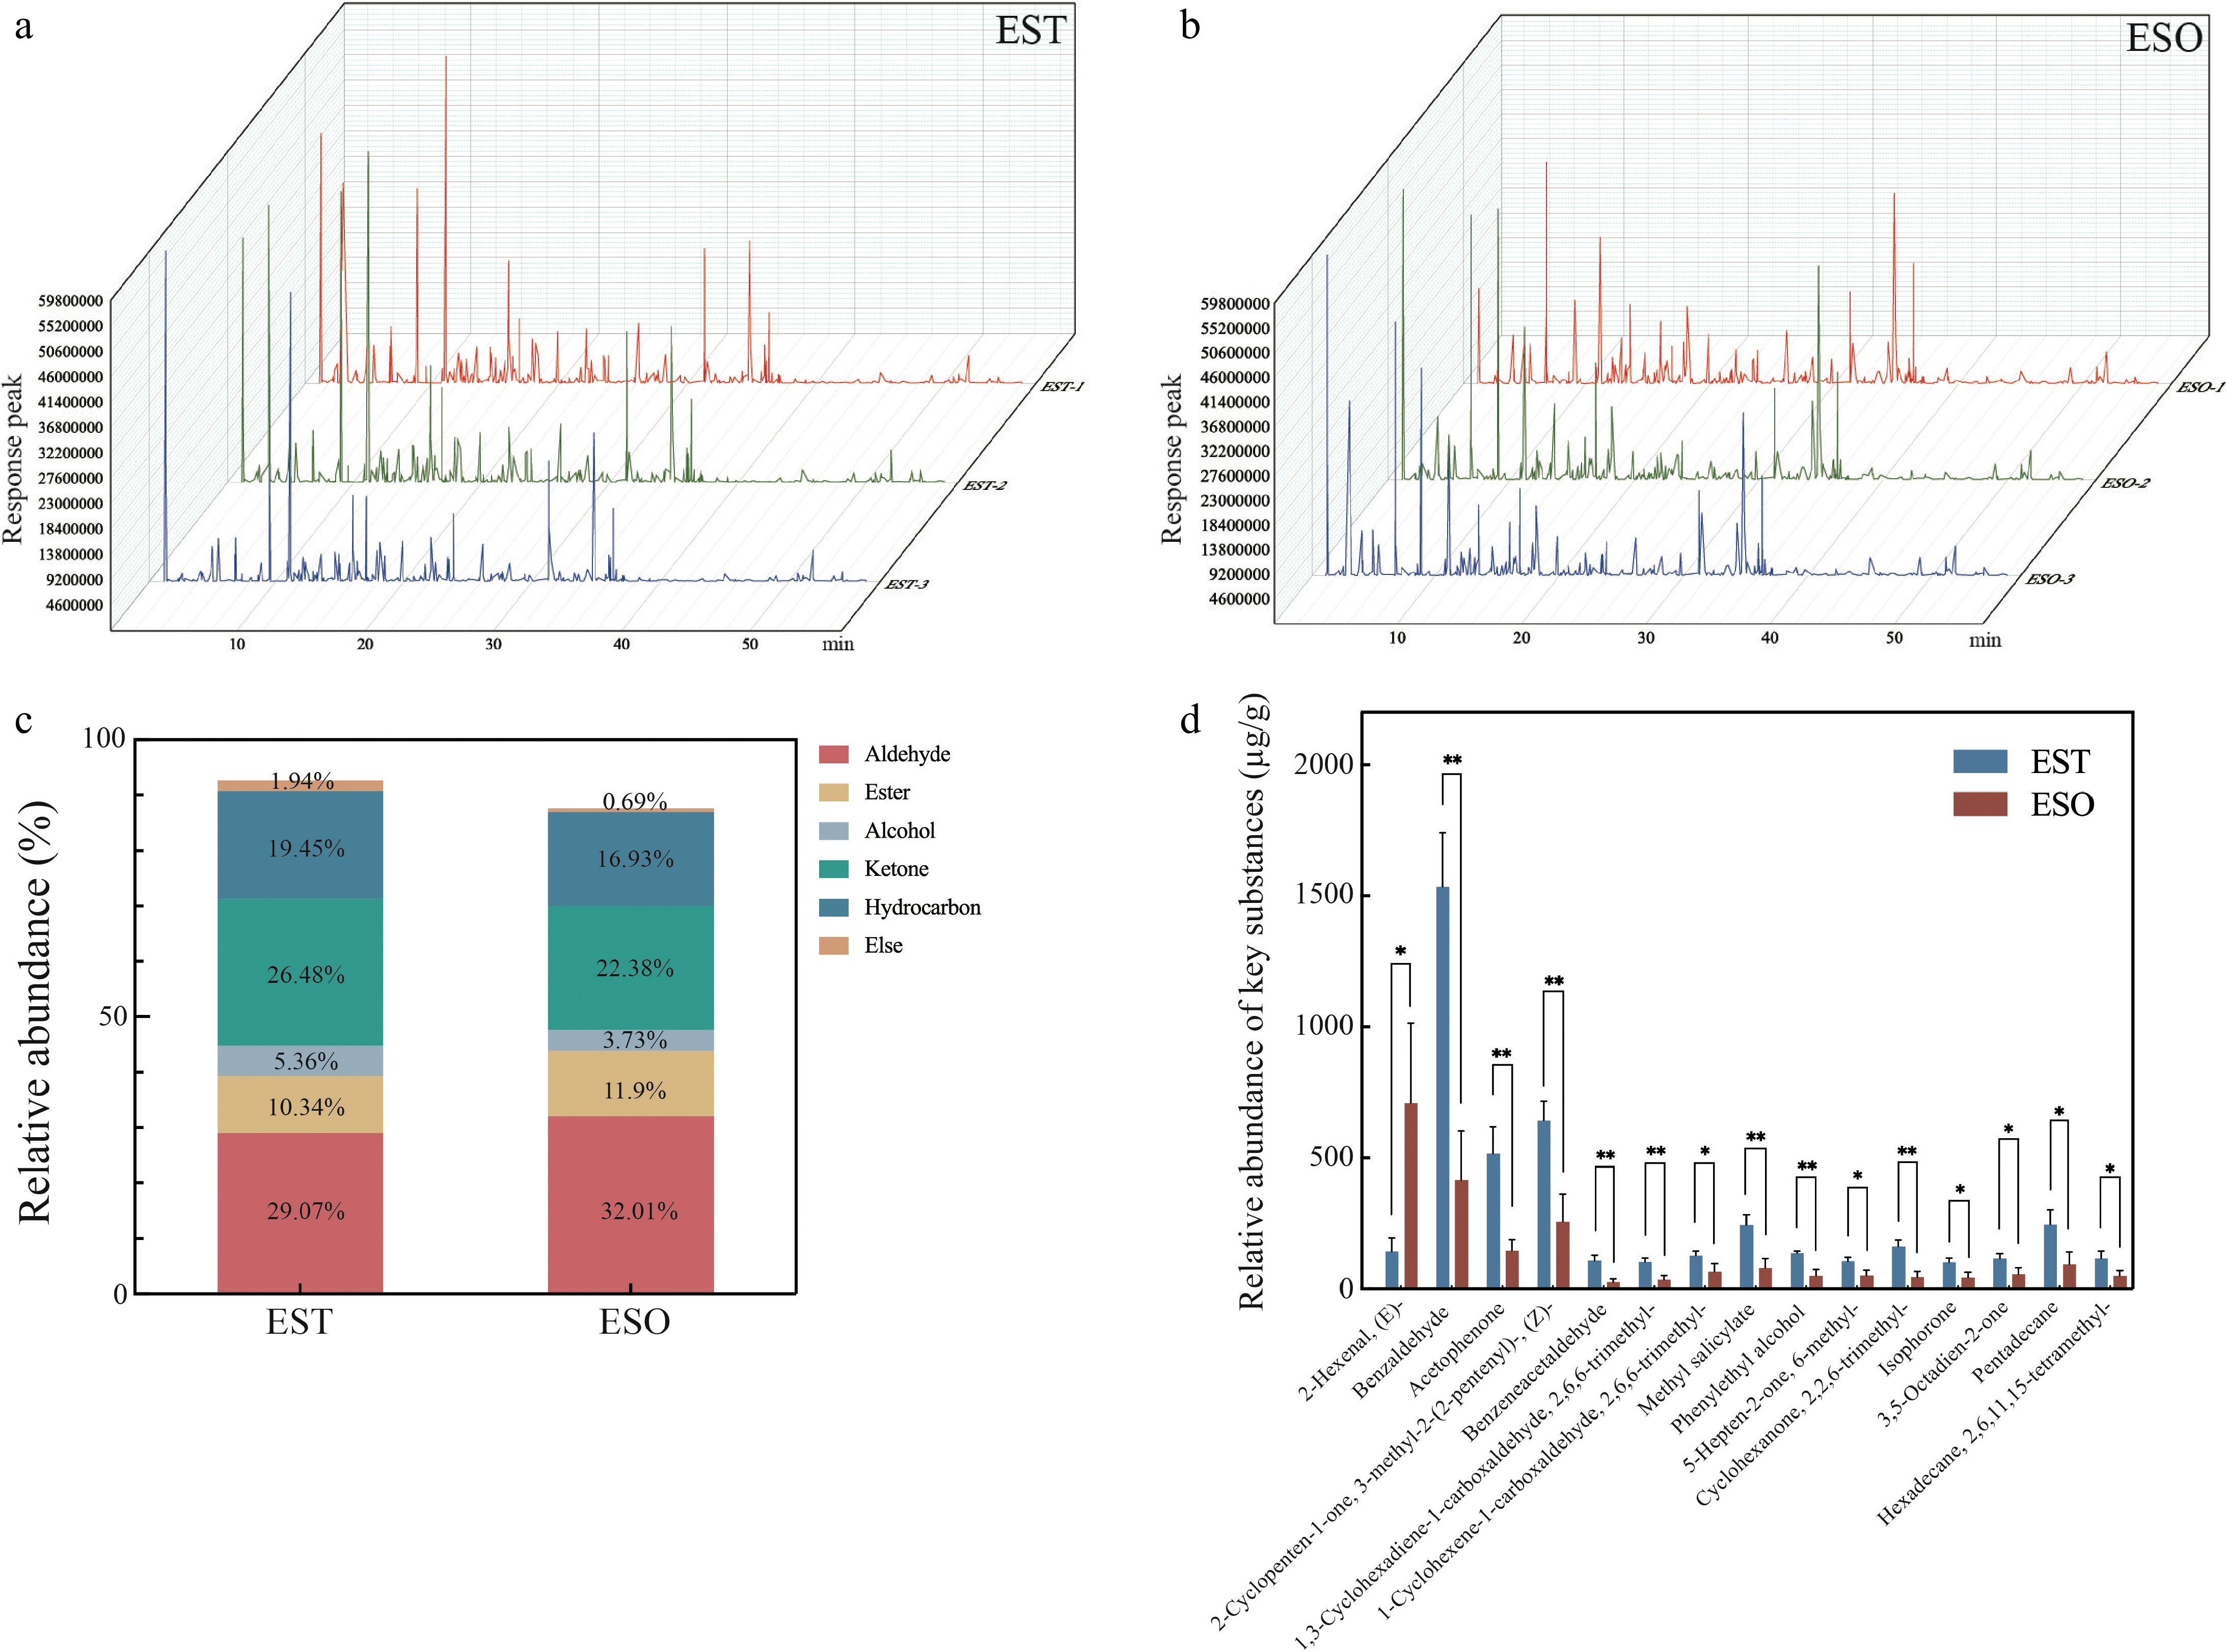
Figure 3.
Volatile compounds in EST and ESO. (a) The chromatograms of volatile compounds in EST and ESO. (b) The percentages of various types of volatile compounds present in EST and ESO. (c) The concentrations of key volatile compounds in EST and ESO. * indicates p < 0.05. ** indicates p < 0.01. EST and ESO represent the tender leaf and older leaf of E'se tea, respectively.
By integrating the significance threshold of p < 0.05, the criterion of the variable importance in the projection (VIP) value exceeding 1, and the condition that the content of either EST or ESO exceeds 100 µg/g, a total of 15 crucial volatile compounds were consistently identified across both samples, including 2-hexenal,(E)-, benzaldehyde, acetophenone,2-cyclopenten-1-one, 3-methyl-2-(2-pentenyl)-(Z)-, benzeneacetaldehyde, 1,3-cyclohexadiene-1-carboxaldehyde, 2,6,6-trimethyl-, 1-cyclohexene-1-carboxaldehyde, 2,6,6-trimethyl-, methyl salicylate, phenylethyl alcohol, 5-hepten-2-one, 6-methyl-, cyclohexanone, 2,2,6-trimethyl-, isophorone, 3,5-octadien-2-one, pentadecane, hexadecane, 2,6,11,15-tetramethyl- (Fig. 3c). Among them, 2-hexenal, (E)- was the most abundant aldehyde in ESO (707.80 µg/g, p < 0.05), nearly five times higher than in EST (143.52 µg/g). The 2-hexenal, (E)-, previously detected in Lu'an Guapian green tea, exhibits a fresh and herbal characteristic aroma reminiscent of green apples or grass leaves. Conversely, EST exhibited a significantly higher benzaldehyde content of 1535.05 µg/g compared to ESO, which has a content of 416.20 µg/g, (p < 0.01). The benzaldehyde level correlates positively with the tenderness of tea leaves and contributes to the almond and burnt sugar notes in tea infusions. It activates the olfactory receptors 52D1 and 1G1, enhancing perception of the fresh and stimulating flavor of tea soup[37]. Acetophenone (516.27 µg/g vs 146.12 µg/g, EST vs ESO, p < 0.01) and 2-cyclopenten-1-one, 3-methyl-2-(2-pentenyl)-, (Z)- (643.02 µg/g vs 257.02 µg/g, EST vs ESO, p < 0.01) were also more abundant in EST. Fang et al. reported that acetophenone, a compound in Qingzhuan tea, possesses a unique aroma profile that blends musty, floral, and almond-like notes, while 2-cyclopenten-1-one, 3-methyl-2-(2-pentenyl)-, (Z)- imparts a sweet, floral aroma, characteristic of jasmine tea[38]. Benzeneacetaldehyde was discovered in EST at a concentration of 108.45 µg/g, while in ESO, it was present at a significantly lower level of 26.33 µg/g (p < 0.01). This floral-scented fragrant substance stands out as a pivotal aroma compound in green tea, adding to its rich and complex flavor profile[36]. The compound 1,3-cyclohexadiene-1-carboxaldehyde, 2,6,6-trimethyl-, which was previously reported to be abundant in saffron and known for its distinctive herbal aroma, was detected in EST at a concentration of 104.27 µg/g and in ESO at 35.72 µg/g (p < 0.01). This compound has been utilized to enrich the aroma profile and enhance the flavor complexity of teas, including the esteemed Longjing green tea[39]. Furthermore, the compound 1-cyclohexene-1-carboxaldehyde, 2,6,6-trimethyl-, recognized for its woody aroma and status as a crucial aroma component in Pu-erh tea, was found to be present in EST at 127.58 µg/g and in ESO at 66.52 µg/g (p < 0.05). Intriguingly, the content of this compound increases as Pu-erh tea ages, contributing to the tea's evolving and complex flavor profile over time[40]. Methyl salicylate stands out as the ester with the highest concentration in EST, measured at 244.17 µg/g, surpassing the amount found in ESO by approximately three times (81.14 µg/g, p < 0.01). This compound is prevalent in a diverse range of teas, including green tea, black tea, and oolong tea, significantly contributing to the distinctive herbal aroma and refreshing sensation that these teas are renowned for, enhancing their overall flavor profile and sensory experience[41]. A molecular docking study on coffee leaves indicated that the fresh and floral aroma generated by methyl salicylate may be due to its high affinity for olfactory receptor 1G1[42]. Phenylethyl alcohol was more abundant in EST (136.22 µg/g) than in ESO (50.54 µg/g, p < 0.01). Known for its rose-like scent, it is a key alcohol in black tea[40]. Research on Longjing tea further reveals that phenylethyl alcohol has a lower binding energy with olfactory receptors such as olfactory receptors 1G1, 2W1, and 5M3 by hydrogen bonding and hydrophobic interactions[43]. Moreover, 5-Hepten-2-one, 6-methyl- (105.83 µg/g vs 52.51 µg/g, EST vs ESO, p < 0.01), cyclohexanone, 2,2,6-trimethyl- (162.51 µg/g vs 45.36 µg/g, EST vs ESO, p < 0.01), isophorone (102.99 µg/g vs 43.41 µg/g, EST vs ESO, p < 0.05), 3,5-octadien-2-one (116.26 µg/g vs 56.08 µg/g, EST vs ESO, p < 0.05) are ketones to be detected with higher concentrations in EST (105.83 µg/g) compared to ESO. 5-Hepten-2-one, 6-methyl- was found to be associated with imparting a distinctive flavor blend of fruity and floral notes in osmanthus black tea. In vine tea (Ampelopsis grossedentata), cyclohexanone, 2,2,6-trimethyl- and 3,5-octadien-2-one were simultaneously detected, with the former two imparting a delightful citrusy and honey-like aroma, while 3,5-octadien-2-one added a refreshing fruity, green, and grassy flavor to the tea[44]. Additionally, isophorone, a fragrant compound known for its woody and sweet aroma notes, has been previously reported in Fu Brick tea, further enriching the tea's bouquet[45]. In addition, pentadecane (244.89 µg/g vs 95.73 µg/g, EST vs ESO, p < 0.05) and hexadecane, 2,6,11,15-tetramethyl- (116.06 µg/g vs 49.78 µg/g, EST vs ESO, p < 0.05) were also present in significant amounts in both EST and ESO. The interaction of pentadecane with various other alkanes during the roasting or fermentation process of tea produces specific aroma characteristics such as woody, fruity, or subtle floral notes, adding rich layers and depth to the flavor of black tea[46]. Hexadecane, 2,6,11,15-tetramethyl- is a compound that is commonly detected in various parts of plants, including roots, stems, and leaves. For example, the fresh Manihot esculenta roots, which are rich in this compound, contribute significantly to enhancing the overall sensory experience by imparting a complex blend of herbal and woody nuances, thereby adding depth and sophistication to the aroma profile[47].
Differences in sensory properties
-
Subsequently, the sensory evaluation of EST and ESO was further conducted. The leaves of EST exhibited a tight and compact binding, whereas the ESO leaves appeared relatively loose. After brewing, the interior sensory quality of the tea infusion was analyzed. The infusion of EST displayed a vibrant golden-yellow color, whereas the ESO soup exhibited a comparatively lighter hue (Fig. 4a). The data from the colorimeter is consistent with the visual results. It was found that the L* value of EST was lower than that of ESO, indicating that the color of the ESO soup was brighter. In addition, the EST samples were analyzed with a slightly higher a* value than the ESO, and the b* value of those two were basically similar, indicating a warmer red-yellow color of EST (Fig. 4b). In terms of taste perception, the infusion of EST exhibited a more pronounced bitterness, astringency, and thickness, followed by a transition into a robust and lingering sweetness. Conversely, ESO offered a milder taste profile, with reduced bitterness, astringency, and thickness, along with a weaker sweetness and a fainter sweet aftertaste (Fig. 4c).
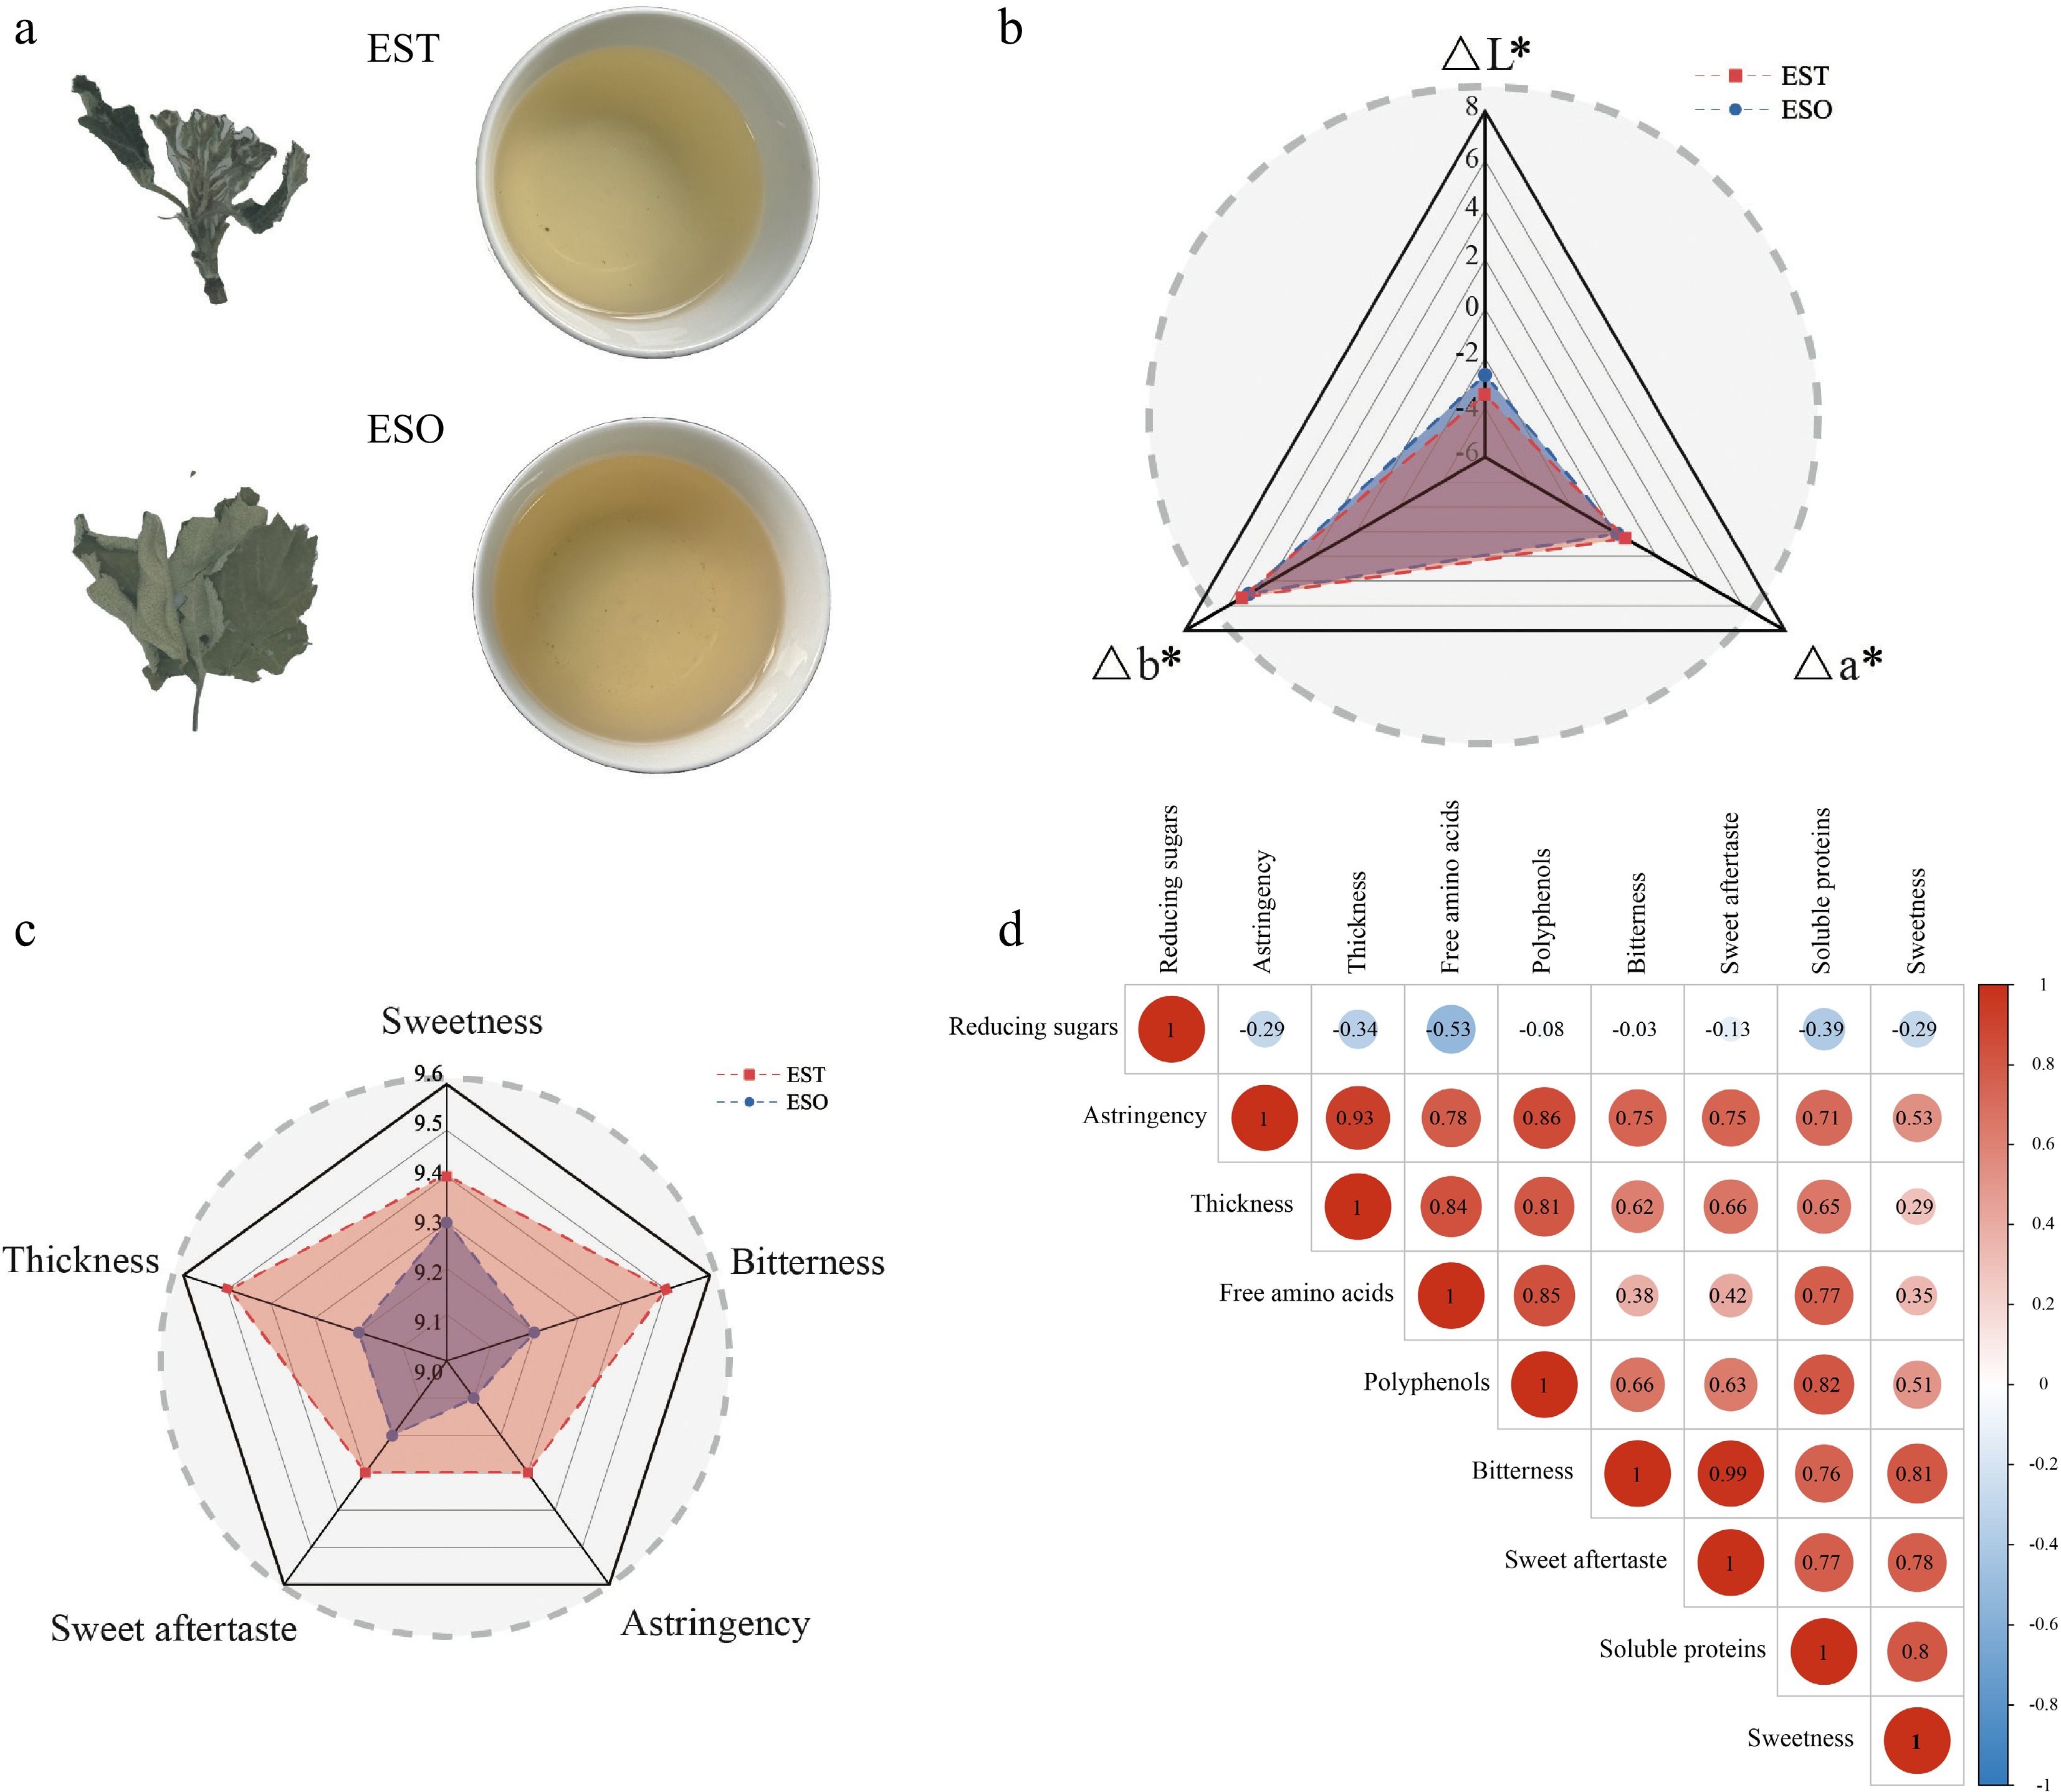
Figure 4.
Sensory taste and color assessment of EST and ESO. (a) Images of leaves and liquor color of EST and ESO. (b) Rader map of liquor color of EST and ESO, ΔL* corresponds to the level of brightness (+) and darkness (−), Δa* indicates the intensity of redness (+) and greenness (−), and Δb* signifies the intensity of yellowness (+) and blueness (−). (c) Rader map of taste attributes of EST and ESO. (d) Correlation analysis of sensory quality and non-volatile compounds. Blue and red color indicate negative and positive correlations, respectively. EST and ESO represent the tender leaf and older leaf of E'se tea, respectively.
To elucidate the relationship between non-volatile compounds and the sensory attributes of E'se tea, a correlation analysis was conducted (Fig. 4d). As anticipated, there exists a positive correlation between thickness and the levels of polyphenols, free amino acids, as well as soluble proteins, which are crucial components of aqueous extracts. In addition, the results indicated a significant positive correlation between polyphenols and bitterness, astringency, thickness and sweet aftertaste. In line with previous research findings, the accumulation of flavonoids can lead to an increase in bitterness and astringency in Paochung oolong tea[50]. Furthermore, although three sweet amino acids were identified at higher concentrations in EST, the free amino acids overall exhibited a positive correlation with thickness and astringency. Similarly, research on yellow tea prepared by various roasting methods revealed that, despite the sweet amino acids (Thr, Ser, Gly, Ala, Cys, Pro) being present at relatively high concentrations, their sweetness manifestation is not prominent. In earlier studies, it has been well reported that the presence of astringent compounds, such as polyphenols, can inhibit the perception of sweetness[51]. It has been reported that the increasing concentration of polyphenols may not only bind to bitter receptors, inducing a short-lived sensation of bitterness, but also suppress the calcium signaling pathway of sweet taste receptor cells, thereby affecting the stability of sweet receptors[52]. Besides, polyphenols will aggregate with oral proteins, including salivary proline-rich proteins, damaging the lubricity of the oral cavity[53]. Meanwhile, bitter compounds further activate the central and prefrontal brain regions, generating unfavorable emotions, which in turn weaken the perception of sweetness[54,55]. Additionally, in terms of the sweetness of E'se tea, it shows a slight negative correlation with reducing sugars. A previous study on black tea revealed that reducing sugars, such as glucose, fructose, and galactose, may have no discernible effect on the overall taste quality of the tea infusion, but rather, they could slightly augment the sweetness of the brew[56].
Notably, the overall flavor of tea cannot be formed by non-volatile compounds alone. Both volatile and non-volatile compounds complement and balance each other, resulting in a richer overall flavor. Non-volatile components, such as tea polyphenols, can effectively interact with aroma components through hydrophobic interactions or hydrogen bonding to form complexes and regulate the olfactory threshold of odorants[57]. For instance, ketones such as β-violeteone and isophorone in Fuzhuan tea can lower the olfactory threshold, thereby allowing for a sustained perception of woodiness during consumption[58]. Therefore, the sensory characteristics of E'se tea are the result of the combined action of its non-volatile substances and volatile substances, and the internal formation mechanism still requires further in-depth exploration.
-
In this study, the volatile and non-volatile chemical profiles, as well as sensory characteristics of both EST and ESO, were identified. Overall, EST and ESO were analyzed with similar non-volatile components, including polyphenols, free amino acids, soluble protein, and reducing sugars, albeit in different proportions. Polyphenols, phloridzin in particular, were more enriched in EST, contributing to its strong astringency, bitterness and sweet aftertaste compared to ESO. Similarly, EST exhibits a higher presence of cystine, along with alanine and serine. Furthermore, EST demonstrated greater diversity and a higher content of aroma compounds than ESO, which can be attributed to the availability of a broader range of chemical classes, such as alcohols, ketones, and hydrocarbons. In addition, owing to its abundant content of both volatile and non-volatile compounds, EST displayed an overall higher sensory acceptability than ESO. These findings not only offer theoretical insights into optimizing raw material tenderness and harvesting strategies but also underscore EST's superior potential as a key ingredient in functional beverage development. Nevertheless, the health-promoting properties of E'se tea should be further explored, and efforts should be made to establish correlations between these properties and its internal chemical components.
This work was supported by funds from the Key Research and Development Program of Zhejiang Province (Grant No. 2023C04028) to Ran Wei.
-
The authors confirm contribution to the paper as follows: investigation, data curation, writing - original draft: Wang Y; conceptualization, visualization: Walayat N; resources, software: Zhang W, Zheng J; formal analysis: Wang Y, Zheng J; methodology: Zhang W; project administration: Su Z, Wei R; supervision: Su Z; funding acquisition, writing-review & editing: Wei R. All authors reviewed the results and approved the final version of the manuscript.
-
The datasets generated during and/or analyzed during the current study are available from the corresponding author on reasonable request.
-
The authors declare that they have no conflict of interest.
- Supplementary Table S1 Statistical table for total ion number and identification.
- Supplementary Table S2 The contents of phenolic constituents of E'Se tea samples (mg/g).
- Supplementary Table S3 The contents of free amino acid components of E'Se tea samples (mg/g).
- Supplementary Fig. S1 Classification of the whole metabolites, classification of primary metabolites, and classification of secondary metabolites in both EST and ESO. EST and ESO represent the tender leaf or older leaf of E'Se tea, respectively.
- Copyright: © 2025 by the author(s). Published by Maximum Academic Press, Fayetteville, GA. This article is an open access article distributed under Creative Commons Attribution License (CC BY 4.0), visit https://creativecommons.org/licenses/by/4.0/.
-
About this article
Cite this article
Wang Y, Walayat N, Zhang W, Zheng J, Su Z, et al. 2025. Characterization of volatile and non-volatile compounds in E'se tea across different maturity levels and their correlation with sensory attributes. Beverage Plant Research 5: e017 doi: 10.48130/bpr-0025-0023 

Characterization of volatile and non-volatile compounds in E'se tea across different maturity levels and their correlation with sensory attributes
- Received: 19 March 2025
- Revised: 12 May 2025
- Accepted: 23 May 2025
- Published online: 24 June 2025
Abstract: In this study, the volatile and non-volatile profiles of tender (EST) and old (ESO) leaves of E'se tea were compared. The results indicated that both EST and ESO were enriched with similar components but in differing proportions. Notably, EST exhibited a significantly higher polyphenol concentration compared to ESO, with phloridzin as the primary phenolic compound in both, albeit at a higher level in EST (151.95 mg/g vs 132.33 mg/g, p < 0.05). Additionally, EST displayed a markedly higher amino acid content, particularly cystine, which was the most abundant amino acid (27.10 mg/g vs 13.71 mg/g, p < 0.01). In parallel, EST contained a more diverse and abundant array of volatile compounds than ESO. Specifically, 15 pivotal volatile compounds (VIP > 1, p < 0.05) were identified in both EST and ESO, including 2-hexenal, (E)-, benzaldehyde, and acetophenone. Sensory evaluation further revealed that the EST infusion possessed a more pronounced astringency, thickness, bitterness, and a lingering sweetness, which could be attributed to its higher concentrations of phenolic compounds, free amino acids, and soluble proteins. Overall, EST demonstrated a notable enrichment in both volatile and non-volatile compounds, coupled with a highly favourablE'sensory acceptance, underscoring its promising potential for application in the food industry.
-
Key words:
- E'se tea /
- Volatile /
- Non-volatile /
- Sensory /
- Maturity