


-
Apple (Malus domestica Borkh.), a member of the family Rosaceae and genus Malus Mill., is a globally significant deciduous fruit tree[1−3]. Apple has strong storage resistance, a long supply cycle, and the fruit contains a higher proportion of free polyphenols that are easily absorbed by the human body, which has good antioxidant, anti-tumor, and prevention of cardiovascular and cerebrovascular diseases, and has high nutritional value[4−8]. Apple trees are cultivated across a wide range of regions, from high-latitude areas such as Siberia and northeastern China to equatorial regions such as Colombia. This broad distribution highlights the species' high adaptability, ease of cultivation, and early domestication in varied environments[9−11]. Cultivated apples are believed to have originated from Malus sieversii in Kazakhstan. During the domestication process in Xinjiang, China, M. sieversii underwent extensive introgression from Malus sylvestris. Chinese apple cultivars evolved from M. sieversii, which was primarily distributed in southern Xinjiang before spreading to regions such as Gansu, Shaanxi, Shanxi, Hebei, and Shandong. Notably, M. sieversii represents an isolated ecotype with a relatively homogeneous genetic background, making it a potentially valuable genetic resource for apple improvement[12−14].
A primary focus of apple breeding programs is to elucidate genetic variation, enrich the existing germplasm pool, and support the sustainable development of the apple industry[15,16]. Accurate identification of germplasm resources is essential for effective breeding[17]. In recent years, DNA molecular marker technologies have been widely used to assess the genetic diversity of apple germplasm[18−21]. However, phenotypic trait analysis remains fundamental and intuitive for such studies. Morphological evaluations are among the most direct methods for investigating genetic diversity. For instance, a study on floral phenotypes in 133 apple germplasm accessions examined variations in 17 floral traits across dimensions of organ number, size, and shape in both wild and cultivated crabapples[22]. Another analysis involving 44 traits in 142 apple germplasm resources demonstrated that floral phenotypic variation can help clarify genetic relationships within the Malus genus, indicating the taxonomic value of such traits[23]. Similarly, correlation and principal component analyses of 48 traits in 45 oriental apple accessions revealed that pomological and leaf characteristics can be used to infer genetic relationships and distinguish among the apple accessions[24]. Phenotypic characterization has become an indispensable part of biological research. Without comprehensive phenotypic data, it is impossible to fully understand the biological attributes of apple germplasms or the mechanisms underlying breeding traits, even with the support of genomic and transcriptomic data. Moreover, plant phenotypes are not isolated from environmental influences[25,26]. In this study, eight fruit traits—single fruit weight, fruit firmness, soluble solids, soluble sugar, titratable acidity, vitamin C, sugar-acid ratio, and solid-acid ratio—were selected as evaluation indicators for apple fruits. The selection of these traits were based on their biological and economic significance: single fruit weight reflects yield and economic value; fruit firmness indicates texture, taste, and suitability for storage and transport; soluble solids and soluble sugar primarily represent sweetness and flavor; titratable acidity reflects fruit acidity, which, together with sweetness, determines overall taste; vitamin C serves as an important nutritional quality indicator; and sugar-acid ratio and solid-acid ratio collectively reflect sweetness–acidity balance, overall flavor intensity, and degree of ripeness. Collectively, these eight traits provide a comprehensive characterization of apple fruit yield, flavor, nutritional value, and postharvest suitability, offering a scientific basis for phenotypic diversity analysis and breeding.
A comprehensive assessment of apple germplasm diversity enables the detection of phenotypic variation both within and among germplasm types. Understanding how these traits have evolved during the domestication process is essential for germplasm conservation and for breeding high-quality, high-yield, and stress-adapted cultivars. In the present study, eight fruit traits were evaluated across 1,217 apple germplasm resources. By comparing phenotypic trait variation among species and germplasm types, the extent of genetic diversity underlying apple fruit characteristics were revealed. These findings provide a theoretical basis and foundational dataset for future research on apple fruit quality, while also supporting the efficient utilization of apple germplasm resources in breeding programs.
-
The data of the eight fruit phenotypic traits were collected, sorted, and analyzed with the 1,217 apple germplasm resources, including wild germplasms, landraces, and cultivars, preserved in the 'National Repository Pear and Apple Germplasm Resources (Xingcheng)' from 2020 to 2022. According to the physiological maturation of the fruits of each germplasm, 5 kg of fruits were randomly collected from four directions of three trees for identification.
Fruit phenotypic identification
-
Single fruit weight, fruit firmness, soluble solid content, vitamin C content, soluble sugar content, and titratable acidity were measured as described by Nie and Wang et al.[27,28]. Briefly, fruit weight was determined using an ACS-30A electronic balance, and fruit firmness was measured with a GY-4 digital fruit firmness tester. Soluble solid content and soluble sugar content were determined using an ATAGO digital refractometer and a spectrophotometer, respectively. Titratable acidity and vitamin C content were measured using acid–base titration and 2,6-dichloroindophenol titration methods, respectively, with a 905 Titrando fully automated potentiometric titrator. In addition, the sugar-acid ratio was calculated as the ratio of soluble sugar content to titratable acidity. The solid-acid ratio was calculated as the ratio of total soluble solids to titratable acidity, which reflects the overall flavor intensity and degree of ripeness of the fruit.
Statistical analysis
-
Data were analyzed using IBM SPSS Statistics 25.0 to calculate the following: mean, standard deviation, CV, ANOVA, Shannon-Wiener diversity, and frequency distribution. In addition, a nested analysis of variance and principal component analysis (PCA) were performed. A two-way analysis of variance was performed to evaluate the effects of two independent factors (e.g., germplasm type and year) and their interaction on the measured phenotypic traits. Prior to analysis, data were tested for normality and homogeneity of variance using the Shapiro–Wilk and Levene's tests, respectively. When significant effects (p < 0.05) were observed, post hoc multiple comparisons were conducted using Tukey's honest significant difference (HSD) test. The R packages 'NbClust', 'factoextra', and 'igraph' were used for a hierarchical cluster analysis, after which 'ggtree' was used to visualize the clustering results.
The SD and CV were calculated using the following formulas:
$ \text{SD}=\sqrt{\dfrac{\displaystyle\sum \nolimits_{i=1}^{n}({x}_{i}-\overline{x}{)}^{2}}{n-1}} $ $ \mathrm{CV}\;({\text{%}})=\dfrac{\text{SD}}{\overline{x}}\times 100 $ where, xi is the individual observation,
$ \overline{x} $ The Shannon–Wiener diversity index (H′) was calculated to assess phenotypic diversity:
$ {H}^{'}=-\sum \limits_{i=1}^{s}{p}_{i}\ln ({p}_{i}) $ where, s is the number of phenotypic categories, and pi is the proportion of observations in the i-th category.
-
Eight fruit-related phenotypic traits were evaluated over a three-year period (2020–2022), including fruit weight, firmness, soluble solids, titratable acidity, vitamin C, soluble sugar, sugar-acid ratio, and solid-acid ratio. Descriptive statistics and one-way ANOVA results are presented (Table 1), and the probability density distributions for each trait across years are visualized (Fig. 1). Shannon-Wiener diversity index (H′) for most traits ranged from 1.15 to 1.97, indicating a high degree of phenotypic variability across the evaluated germplasm resource. Among them, fruit weight showed high coefficients of variation (CV: 0.88–1.02), and a significant difference among years (p = 0.001), with the highest average in 2021 (100.20 g), and the lowest in 2022 (80.84 g). Titratable acidity also exhibited a statistically significant difference (p = 0.003), with moderate CVs (0.62−0.71). Soluble sugar content and sugar-acid ratio showed significant interannual variation (p = 0.010), while the solid-acid ratio approached significance (p = 0.074). In contrast, firmness, and vitamin C content remained relatively stable across years, showing no significant differences (p = 0.950 and 0.261, respectively) and lower CVs. The Shannon–Wiener diversity index for most traits ranged from 1.15 to 1.97, indicating considerable phenotypic diversity within the population.
Table 1. Variations in fruit traits among germplasm resources in 2020, 2021, and 2022.
Year Trait Mean Std SE Min Max CV H′ ANOVA p-value 2020 Fruit weight (g) 82.63 82.05 3.62 0.71 354.00 0.99 1.68 0.001 2021 100.20 87.88 3.88 0.62 409.60 0.88 1.71 2022 80.84 82.79 3.50 0.42 392.29 1.02 1.61 2020 Firmness (kg/cm2) 7.52 2.65 0.12 1.88 15.78 0.35 1.99 0.950 2021 7.75 2.62 0.12 1.71 17.53 0.34 1.89 2022 5.79 2.48 0.11 1.06 16.00 0.43 1.77 2020 Soluble solids (%) 13.90 4.34 0.19 7.71 37.24 0.31 1.51 0.100 2021 13.75 3.88 0.17 8.44 37.30 0.28 1.40 2022 14.33 5.37 0.23 7.13 36.53 0.38 1.64 2020 Titratable acidity (%) 0.89 0.55 0.02 0.08 4.15 0.62 1.54 0.003 2021 0.81 0.53 0.02 0.11 5.47 0.66 1.19 2022 0.93 0.66 0.03 0.09 3.88 0.71 1.74 2020 Vitamin C (mg/100g) 8.21 5.55 0.25 0.20 55.08 0.68 1.28 0.261 2021 8.73 5.79 0.26 0.75 44.34 0.66 1.49 2022 8.76 6.95 0.29 1.54 71.47 0.79 0.93 2020 Soluble sugar (%) 8.44 2.85 0.13 1.04 26.73 0.34 1.49 0.010 2021 9.63 2.38 0.11 2.23 17.07 0.25 1.84 2022 4.75 1.93 0.08 0.74 11.50 0.41 1.97 2020 Sugar-acid ratio 15.08 13.86 0.61 0.83 106.89 0.92 1.27 0.010 2021 18.51 15.00 0.66 0.84 88.12 0.81 1.65 2022 8.15 7.67 0.32 0.43 64.72 0.94 1.15 2020 Solid-acid ratio 23.19 19.52 0.86 3.98 163.11 0.84 1.15 0.074 2021 25.03 18.78 0.83 3.42 122.22 0.75 1.54 2022 22.57 16.44 0.70 4.05 139.68 0.73 1.27 Std: Standard deviation; SE: Standard error; Min: Minimum; Max: Maximum; CV: Coefficient of variation; H′: Shannon-Wiener diversity index. 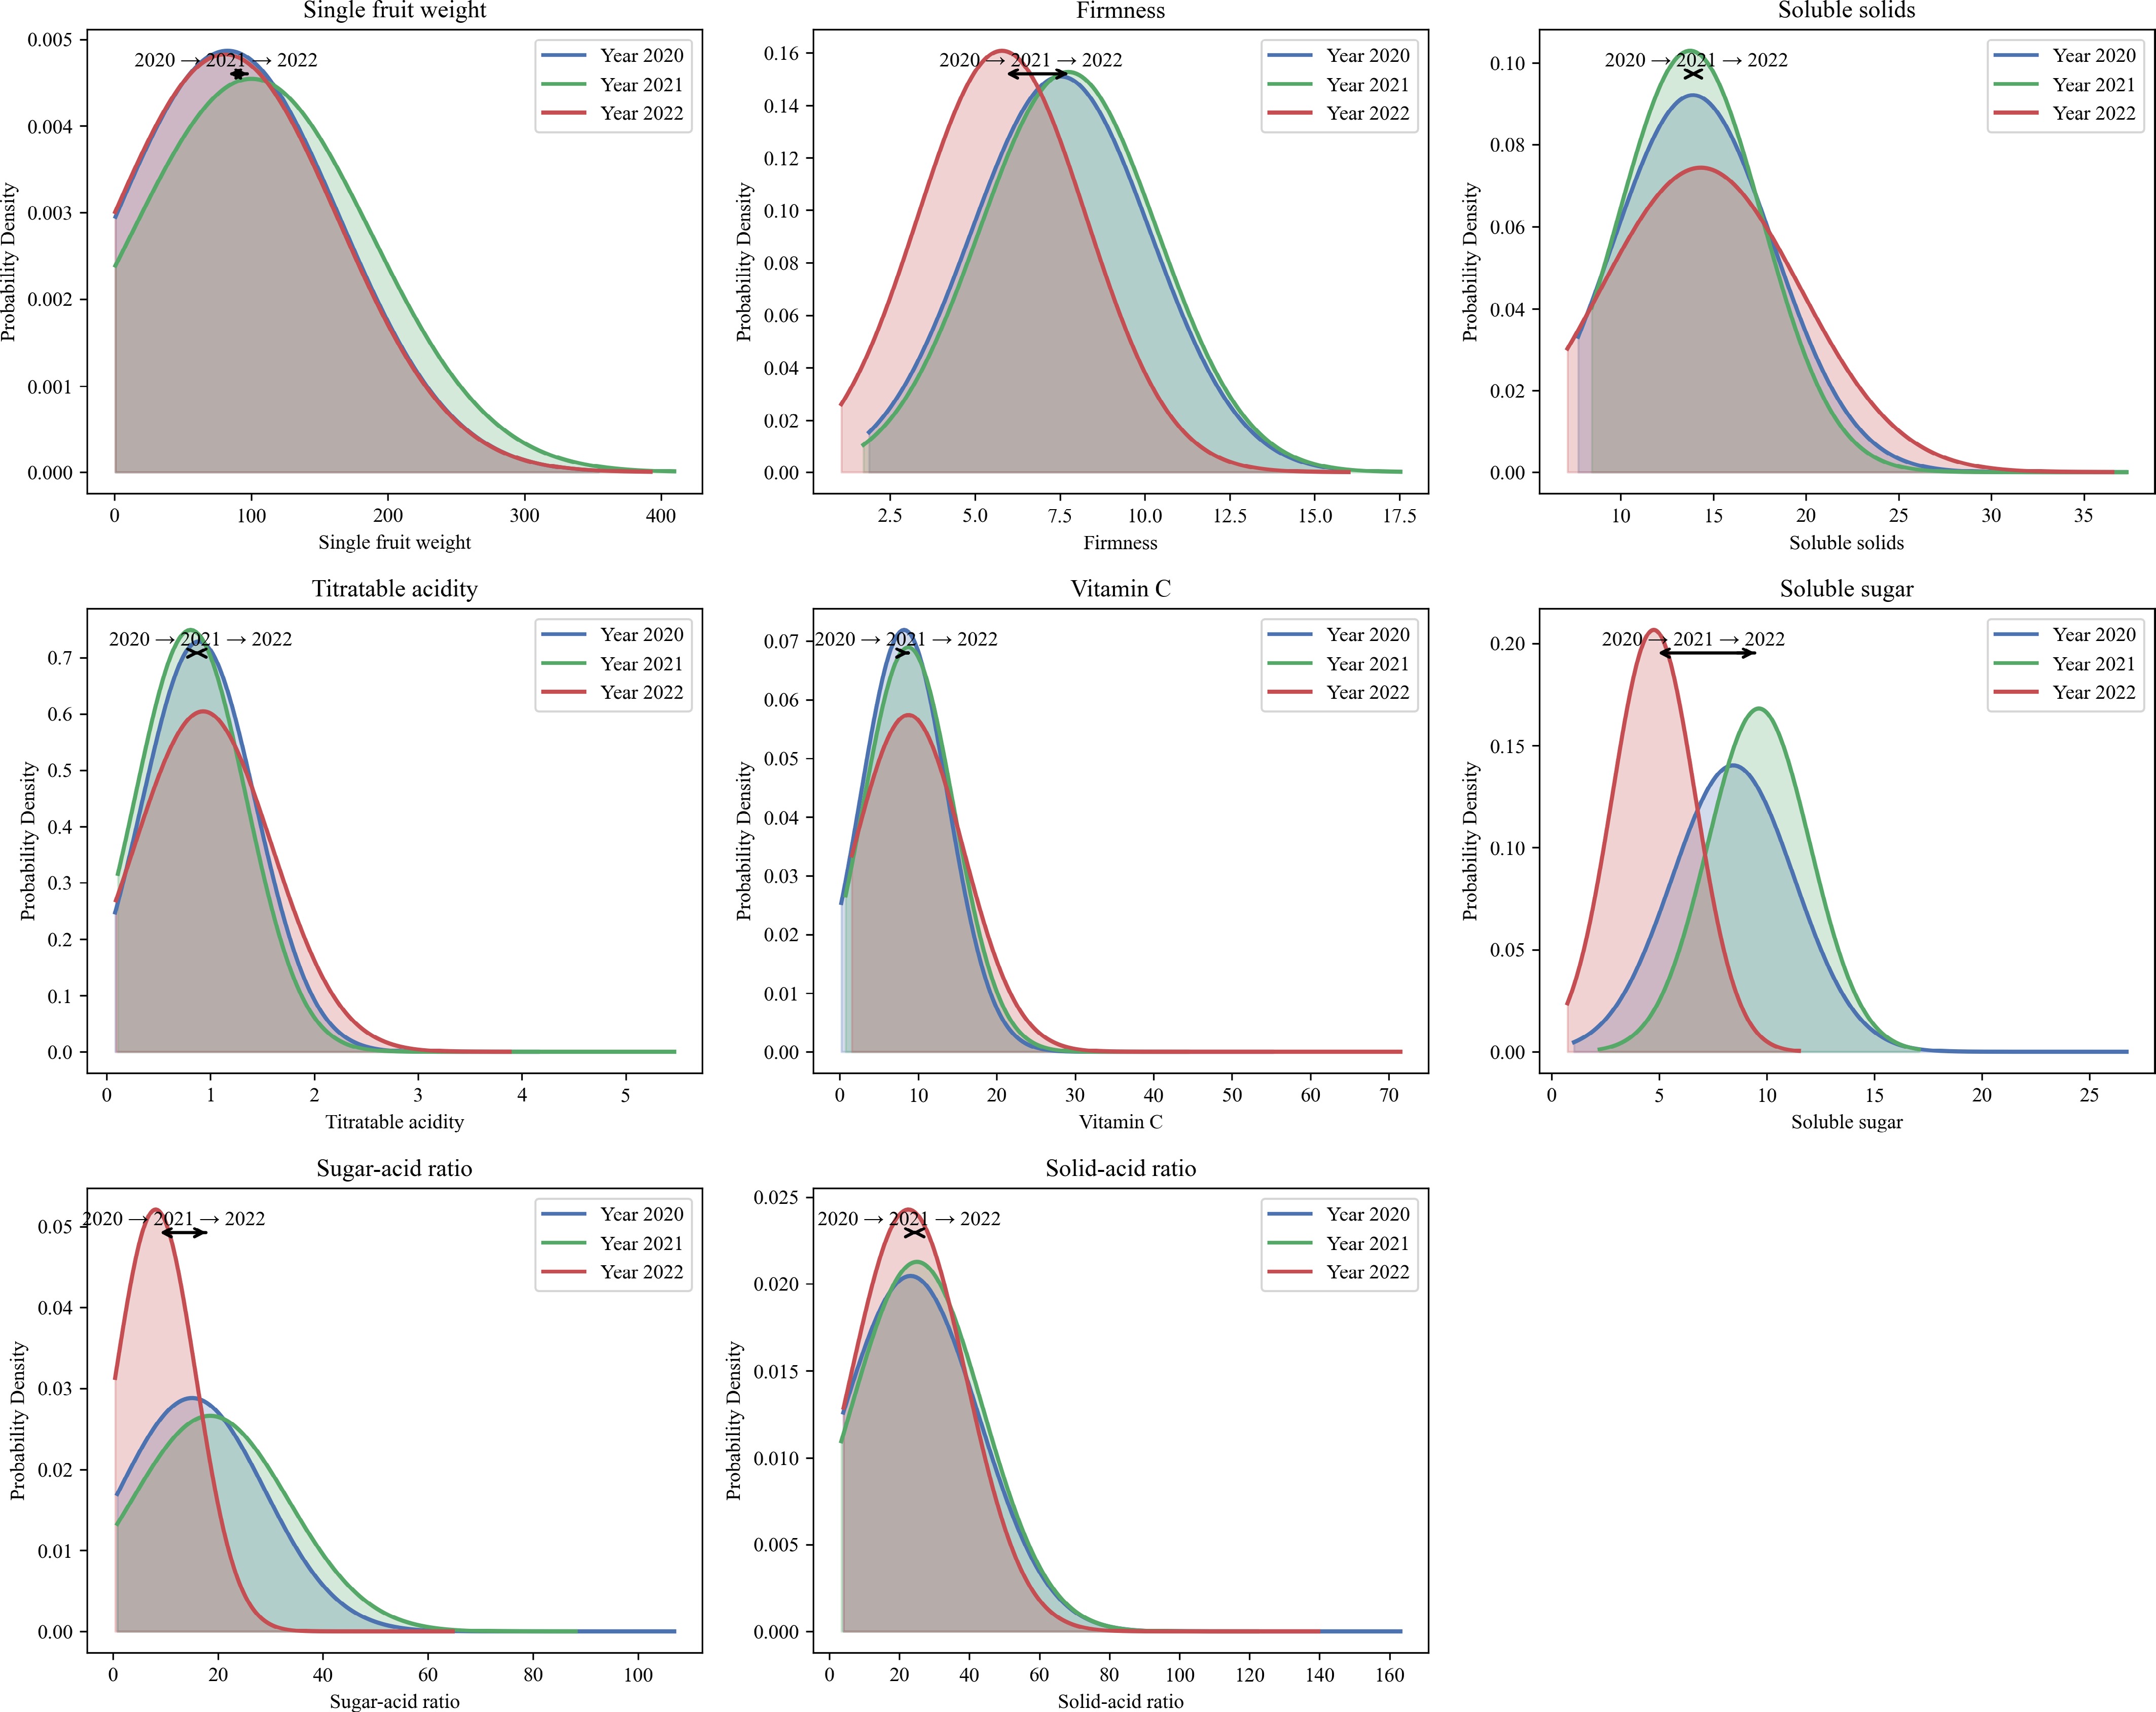
Figure 1.
Probability density curves for eight apple fruit phenotypic traits across three years (2020–2022). Note: Each subplot shows the fitted normal distribution of the trait for each year (2020: blue, 2021: green, 2022: red). Curves are shaded to visualize the distribution range. Arrow annotations mark the mean value shift among years, indicating trends in trait changes over time.
Correlation heatmap of eight apple fruit phenotypic traits
-
The correlation heatmap showed clear interrelationships among the eight apple fruit traits (Fig. 2). Sugar-acid ratio exhibited a strong positive correlation with solid-acid ratio (r = 0.88), and moderate positive correlations with soluble sugar content (r = 0.46) and fruit weight (r = 0.41). Similarly, fruit weight was positively associated with solid-acid ratio (r = 0.41), but negatively correlated with titratable acidity (r = −0.51). Titratable acidity showed significant negative correlations with sugar-acid ratio (r = −0.58) and solid-acid ratio (r = −0.62), indicating an inverse relationship. Vitamin C displayed weak correlations with all traits (|r| < 0.4), suggesting relative independence.
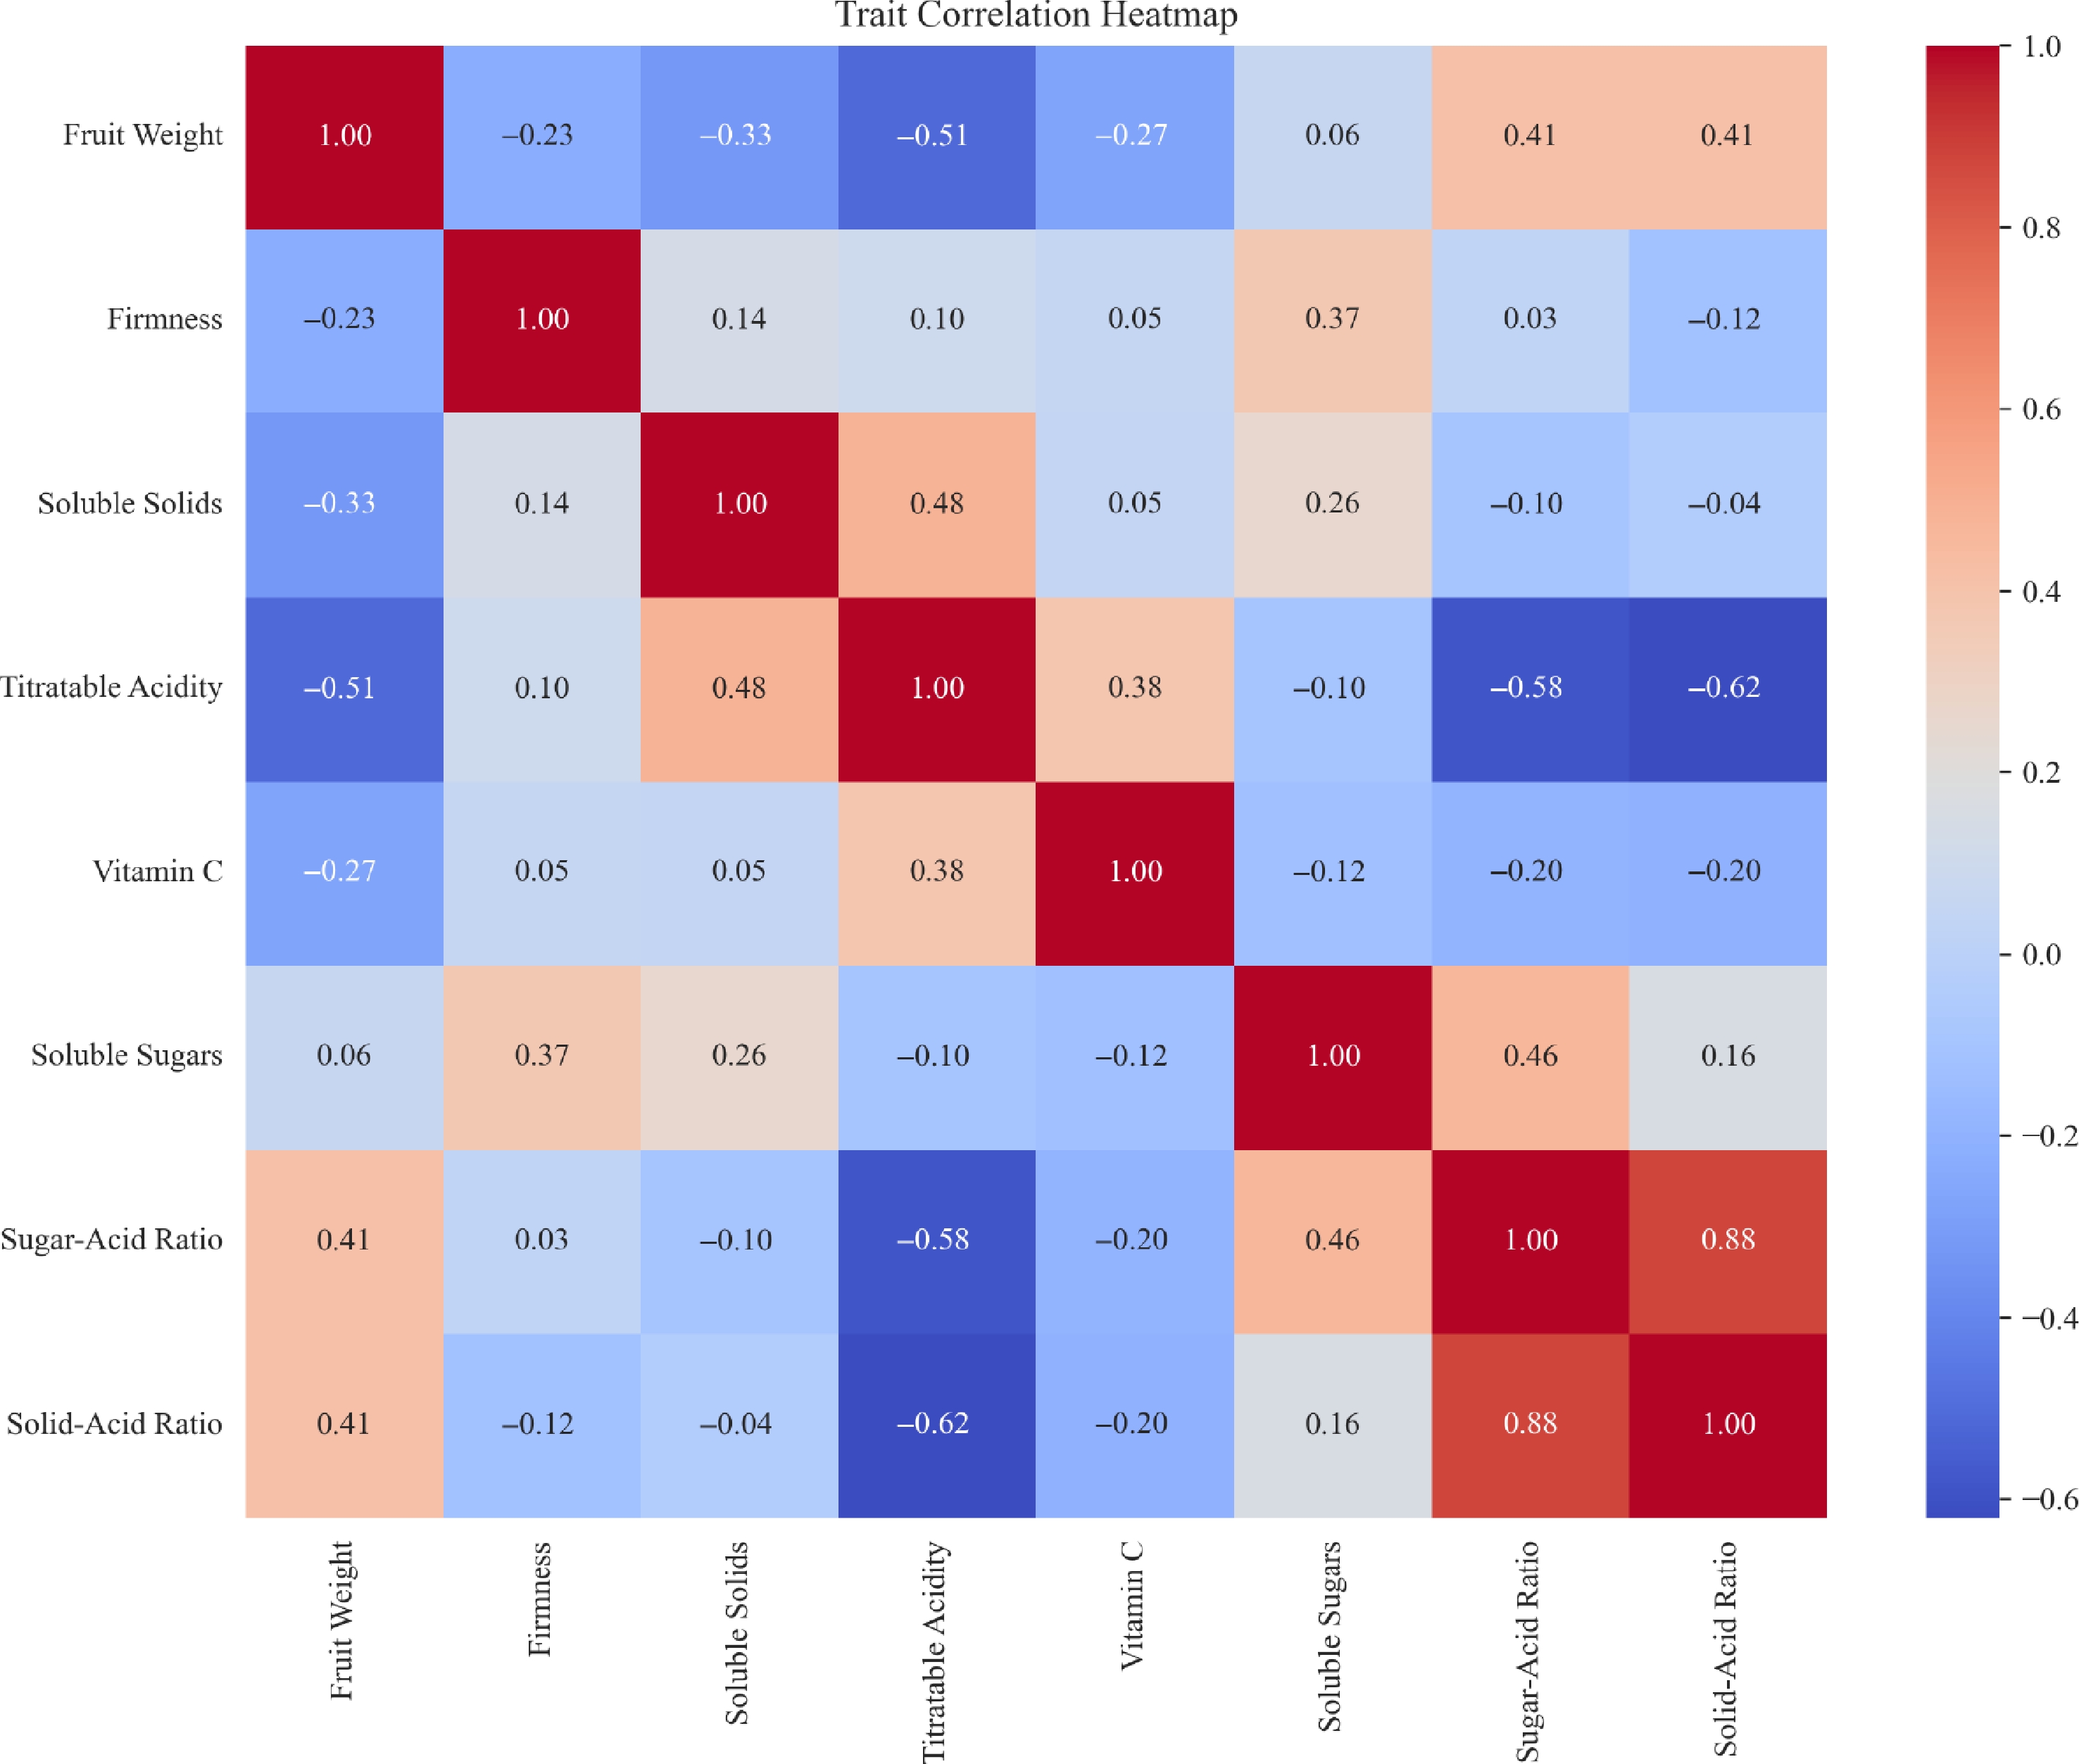
Figure 2.
Correlation heatmap of eight apple fruit phenotypic traits.
Principal component analysis of eight apple fruit phenotypic traits
-
Principal component analysis (PCA) was performed on eight fruit traits, including eigenvectors, eigenvalues, the proportion of variance explained by each principal component (PC), and cumulative variance (Table 2). The first four PCs together accounted for 82.87% of the total phenotypic variation, indicating that they effectively summarize the majority of trait variability. PC1 contributed the most to the total variance (38.22%), and was primarily associated with fruit weight, sugar-acid ratio, and solid-acid ratio, suggesting that it represents overall fruit size and quality. PC2, explaining 21.14% of the variance, was strongly influenced by soluble sugar, firmness, and soluble solids, likely reflecting attributes related to internal composition and sweetness. PC3 and PC4 captured additional variation, particularly associated with vitamin C, titratable acidity, and firmness, indicating their roles in nutritional and sensory properties.
Table 2. Principal component analysis of eight apple fruit phenotypic traits.
Trait Eigenvector of the principal component PC1 PC2 PC3 PC4 PC5 PC6 PC7 PC8 Fruit weight (g) 0.394 −0.208 −0.046 −0.070 0.714 −0.534 0.003 0.002 Firmness (kg/cm2) −0.079 0.498 −0.583 0.291 −0.212 −0.524 0.039 0.005 Soluble solids (%) −0.201 0.476 0.498 −0.419 −0.006 −0.332 −0.403 −0.191 Titratable acidity (%) −0.488 0.138 0.219 −0.075 0.228 −0.114 0.776 0.147 Vitamin C (mg/100g) −0.252 0.008 0.368 0.826 0.233 −0.019 −0.252 −0.014 Soluble sugar (%) 0.158 0.613 −0.154 −0.030 0.468 0.520 −0.083 0.280 Sugar-acid ratio 0.491 0.270 0.215 0.183 −0.084 0.102 0.383 −0.665 Solid-acid ratio 0.480 0.119 0.396 0.110 −0.337 −0.188 0.128 0.649 Eigenvalue 3.059 1.693 0.965 0.917 0.614 0.465 0.249 0.042 Contributive percentage (%) 38.216 21.143 12.053 11.459 7.673 5.814 3.114 0.527 Total cumulative (%) 38.216 59.359 71.412 82.871 90.544 96.358 99.473 100.000 Variations among different germplasm types
Coefficients of variation for different germplasm types
-
The coefficients of variation (CV) for eight fruit-related traits across three germplasm types: wild germplasms, landraces, and cultivars over a three-year period (Table 3). Wild germplasms consistently exhibited the highest mean CV values, ranging from 62.36% to 74.11%, followed by landraces (53.68%–54.72%) and cultivars (39.46%–45.27%). The CVs of fruit weight, fruit firmness, soluble solids, vitamin C, and soluble sugars were higher for wild germplasms than for landraces and cultivars, whereas the CVs for titratable acidity were lower for wild germplasms than for the other two germplasm types. These results highlight distinct levels of trait variability among the three germplasm groups.
Table 3. Coefficient of variation (%) of eight fruit traits of three apple germplasm types.
Germplasm type Year Fruit weight Firmness Soluble solids Titratable acidity Vitamin C Soluble sugars Sugar-acid
ratioSolid-acid
ratioMean Wild germplasms 2020 97.67 37.12 40.88 50.46 68.81 44.86 90.45 78.99 63.66 2021 114.03 38.38 39.58 47.33 62.01 32.74 88.77 76.00 62.36 2022 131.92 42.22 47.22 55.00 88.17 39.28 109.53 79.55 74.11 Landraces 2020 91.80 35.76 25.78 44.75 61.19 30.46 77.49 70.51 54.72 2021 98.65 29.31 22.07 71.22 58.15 20.76 65.63 63.67 53.68 2022 87.31 41.53 26.52 50.60 55.86 36.19 73.96 57.96 53.74 Cultivars 2020 40.36 28.86 14.64 55.60 56.38 20.89 72.15 73.29 45.27 2021 38.69 28.62 12.18 51.39 44.08 14.78 63.36 62.62 39.46 2022 37.55 28.14 12.35 55.44 47.07 40.61 81.63 58.52 45.16 Multiple comparisons of different germplasm types
-
The multiple comparison results for eight apple fruit traits across three germplasm types over three consecutive years (Table 4). Cultivars exhibited significantly higher fruit weight than both landraces and wild germplasms in all years, with mean values exceeding 170 g. Landraces generally showed the highest firmness and soluble sugar content, while wild germplasms maintained the highest levels of titratable acidity and vitamin C. Notably, sugar-acid ratio and solid-acid ratio were consistently higher in cultivars, reflecting their sweeter flavor profiles. These results reveal clear differences in fruit quality attributes among germplasm types.
Table 4. Multiple comparison results for eight apple fruit traits in different years.
Germplasm type Year Fruit weight
(g)Firmness
(kg/cm2)Soluble solids
(%)Titratable acidity
(%)Vitamin C
(mg/100g)Soluble sugars
(%)Sugar-acid
ratioSolid-acid
ratioWild germplasms 2020 29.87± 29.17 7.46 ± 2.77 13.96 ± 5.71 1.21 ± 0.61 9.94 ± 6.84 7.57 ± 3.4 8.58 ± 7.76 14.84 ± 11.72 2021 35.64 ± 40.64 7.60 ± 2.92 13.79 ± 5.46 1.15 ± 0.54 12.0 ± 7.44 8.42 ± 2.76 9.79 ± 8.69 15.12 ± 11.49 2022 27.13 ± 35.79 5.79 ± 2.45 16.05 ± 7.58 1.39 ± 0.77 11.38 ± 10.04 4.76 ± 1.87 5.19 ± 5.69 14.89 ± 11.84 Landraces 2020 35.96 ± 33.01 8.47 ± 3.03 15.38 ± 3.97 0.85 ± 0.38 7.38 ± 4.52 8.75 ± 2.67 13.59 ± 10.53 22.90 ± 16.14 2021 34.71 ± 34.24 9.27 ± 2.72 15.86 ± 3.5 0.86 ± 0.61 7.75 ± 4.51 11.10 ± 2.30 17.29 ± 11.35 24.23 ± 15.43 2022 31.81 ± 27.77 7.12 ± 2.96 15.30 ± 4.06 0.93 ± 0.47 8.12 ± 4.53 5.57 ± 2.02 7.59 ± 5.62 19.80 ± 11.47 Cultivars 2020 169.91 ± 68.57 6.98 ± 2.01 12.87 ± 1.88 0.56 ± 0.31 6.85 ± 3.86 9.18 ± 1.92 23.09 ± 16.66 32.42 ± 23.77 2021 174.24 ± 67.42 7.31 ± 2.09 12.94 ± 1.58 0.53 ± 0.27 6.56 ± 2.89 10.04 ± 1.48 25.72 ± 16.29 33.01 ± 20.67 2022 171.53 ± 64.41 4.72 ± 1.33 11.89 ± 1.47 0.49 ± 0.27 6.78 ± 3.19 4.08 ± 1.66 11.42 ± 9.33 32.14 ± 18.81 Two-way ANOVA
-
The two-way ANOVA revealed that most fruit traits were significantly affected by germplasm type, while the effect of year and year × germplasm interactions varied among traits (Table 5). Fruit weight was strongly influenced by germplasm type (F = 1591.183, p < 0.001), whereas the effects of year and interaction were not significant. Firmness was significantly affected by both year (F = 117.838, p < 0.001) and germplasm type (F = 72.583, p < 0.001), with a marginal interaction effect (p = 0.055). Soluble solids showed a significant year effect (p < 0.001), and a significant year × germplasm interaction (p = 0.040), but no significant germplasm effect. In contrast, titratable acidity was significantly affected only by germplasm type (p < 0.001). Vitamin C was influenced by all three factors, with germplasm and interaction effects reaching statistical significance (p < 0.05). Soluble sugar and sugar-acid ratio were significantly affected by year, germplasm type, and their interaction (all p < 0.001), indicating strong genotype-by-environment interactions. Solid-acid ratio was influenced only by germplasm type (F = 185.583, p < 0.001), with no significant year or interaction effects.
Table 5. Two-way ANOVA results for eight fruit traits across different germplasm types and three years.
Trait Index sum_sq df F PR (> F) Fruit weight Year 5,259.154 2 1.089 0.337 Population 76,809,08.927 2 1,591.183 0.000 Year × population 2,054.331 4 0.213 0.931 Firmness Year 1,439.233 2 117.838 0.000 Population 886.503 2 72.583 0.000 Year × population 56.664 4 2.320 0.055 Soluble solids Year 37.591 2 0.710 0.492 Population 3,538.400 2 66.813 0.000 Year × population 266.875 4 2.520 0.040 Titratable acidity Year 1.274 2 2.127 0.120 Population 201.086 2 335.626 0.000 Year × population 1.944 4 1.622 0.166 Vitamin C Year 275.571 2 3.892 0.021 Population 5,781.692 2 81.648 0.000 Year × population 397.030 4 2.803 0.025 Soluble sugar Year 7,394.789 2 700.748 0.000 Population 524.423 2 49.696 0.000 Year × population 428.014 4 20.280 0.000 Sugar acid ratio Year 25,811.178 2 106.270 0.000 Population 50,140.245 2 206.437 0.000 Year × population 6,321.958 4 13.014 0.000 Solid acid ratio Year 454.807 2 0.844 0.430 Population 99,950.577 2 185.583 0.000 Year × population 924.909 4 0.859 0.488 Index: Source of variation year, population, and their interaction (year × population); sum_sq: Sum of squares, indicating the contribution of each factor to total variation; df: Degrees of freedom; F: F-statistic used for significance testing; PR (> F): p-value, with values less than 0.05 considered statistically significant. Linear discriminant analysis of different germplasm types
-
The linear discriminant analysis (LDA) plot shows clear separation among the three germplasm types based on the first two linear discriminants (Fig. 3). Wild germplasms and cultivars are well-separated along the LD1 axis, while landraces appear to occupy an intermediate position between them. Samples collected across three years (2020, 2021, and 2022) are distributed consistently within each germplasm type, as indicated by the overlapping shapes.
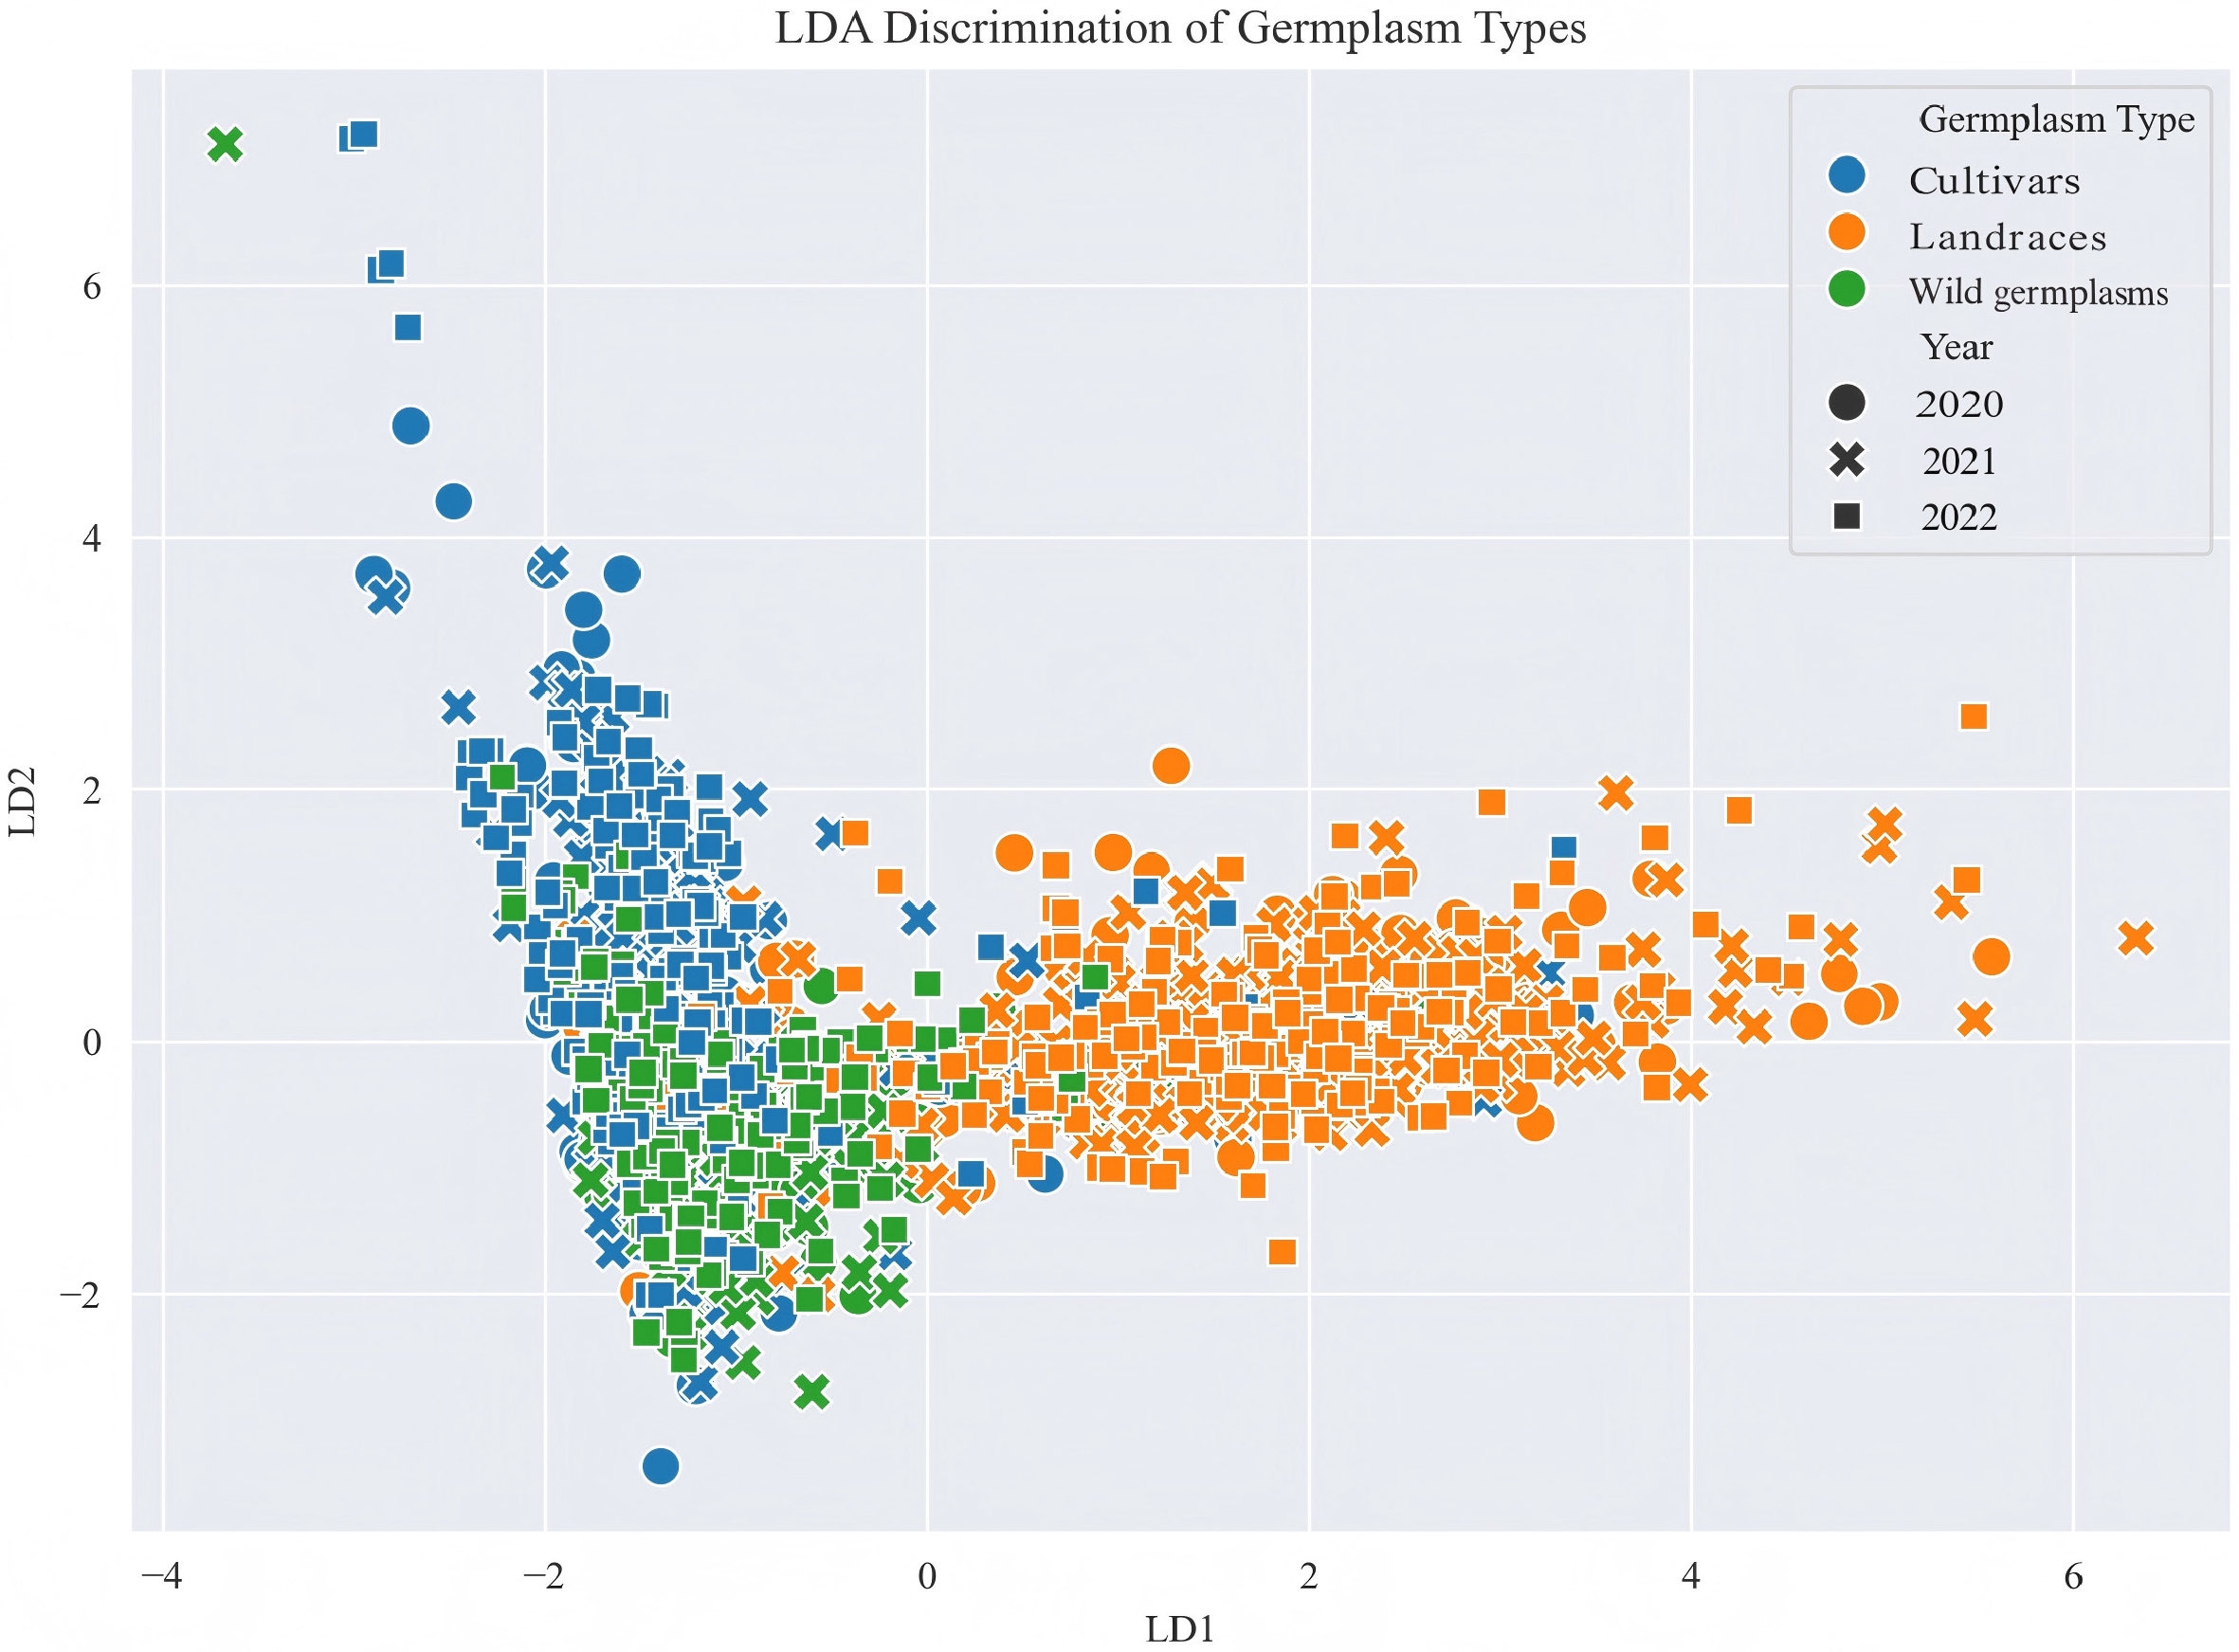
Figure 3.
Results of a LDA of the phenotypic traits of apple germplasm resources in three years.
LDA reveals the discriminative power and direction of each trait in separating germplasm types. Figure 4 illustrates the contribution weights of various fruit traits in distinguishing among three germplasm types using LDA. The results indicate that fruit weight is the most influential trait for distinguishing cultivars, showing a strong positive weight. Titratable acidity plays a key role in identifying wild germplasms, while solid-acid ratio contributes moderately to the differentiation of landraces. Other traits, such as soluble solids and vitamin C, have relatively minor effects.
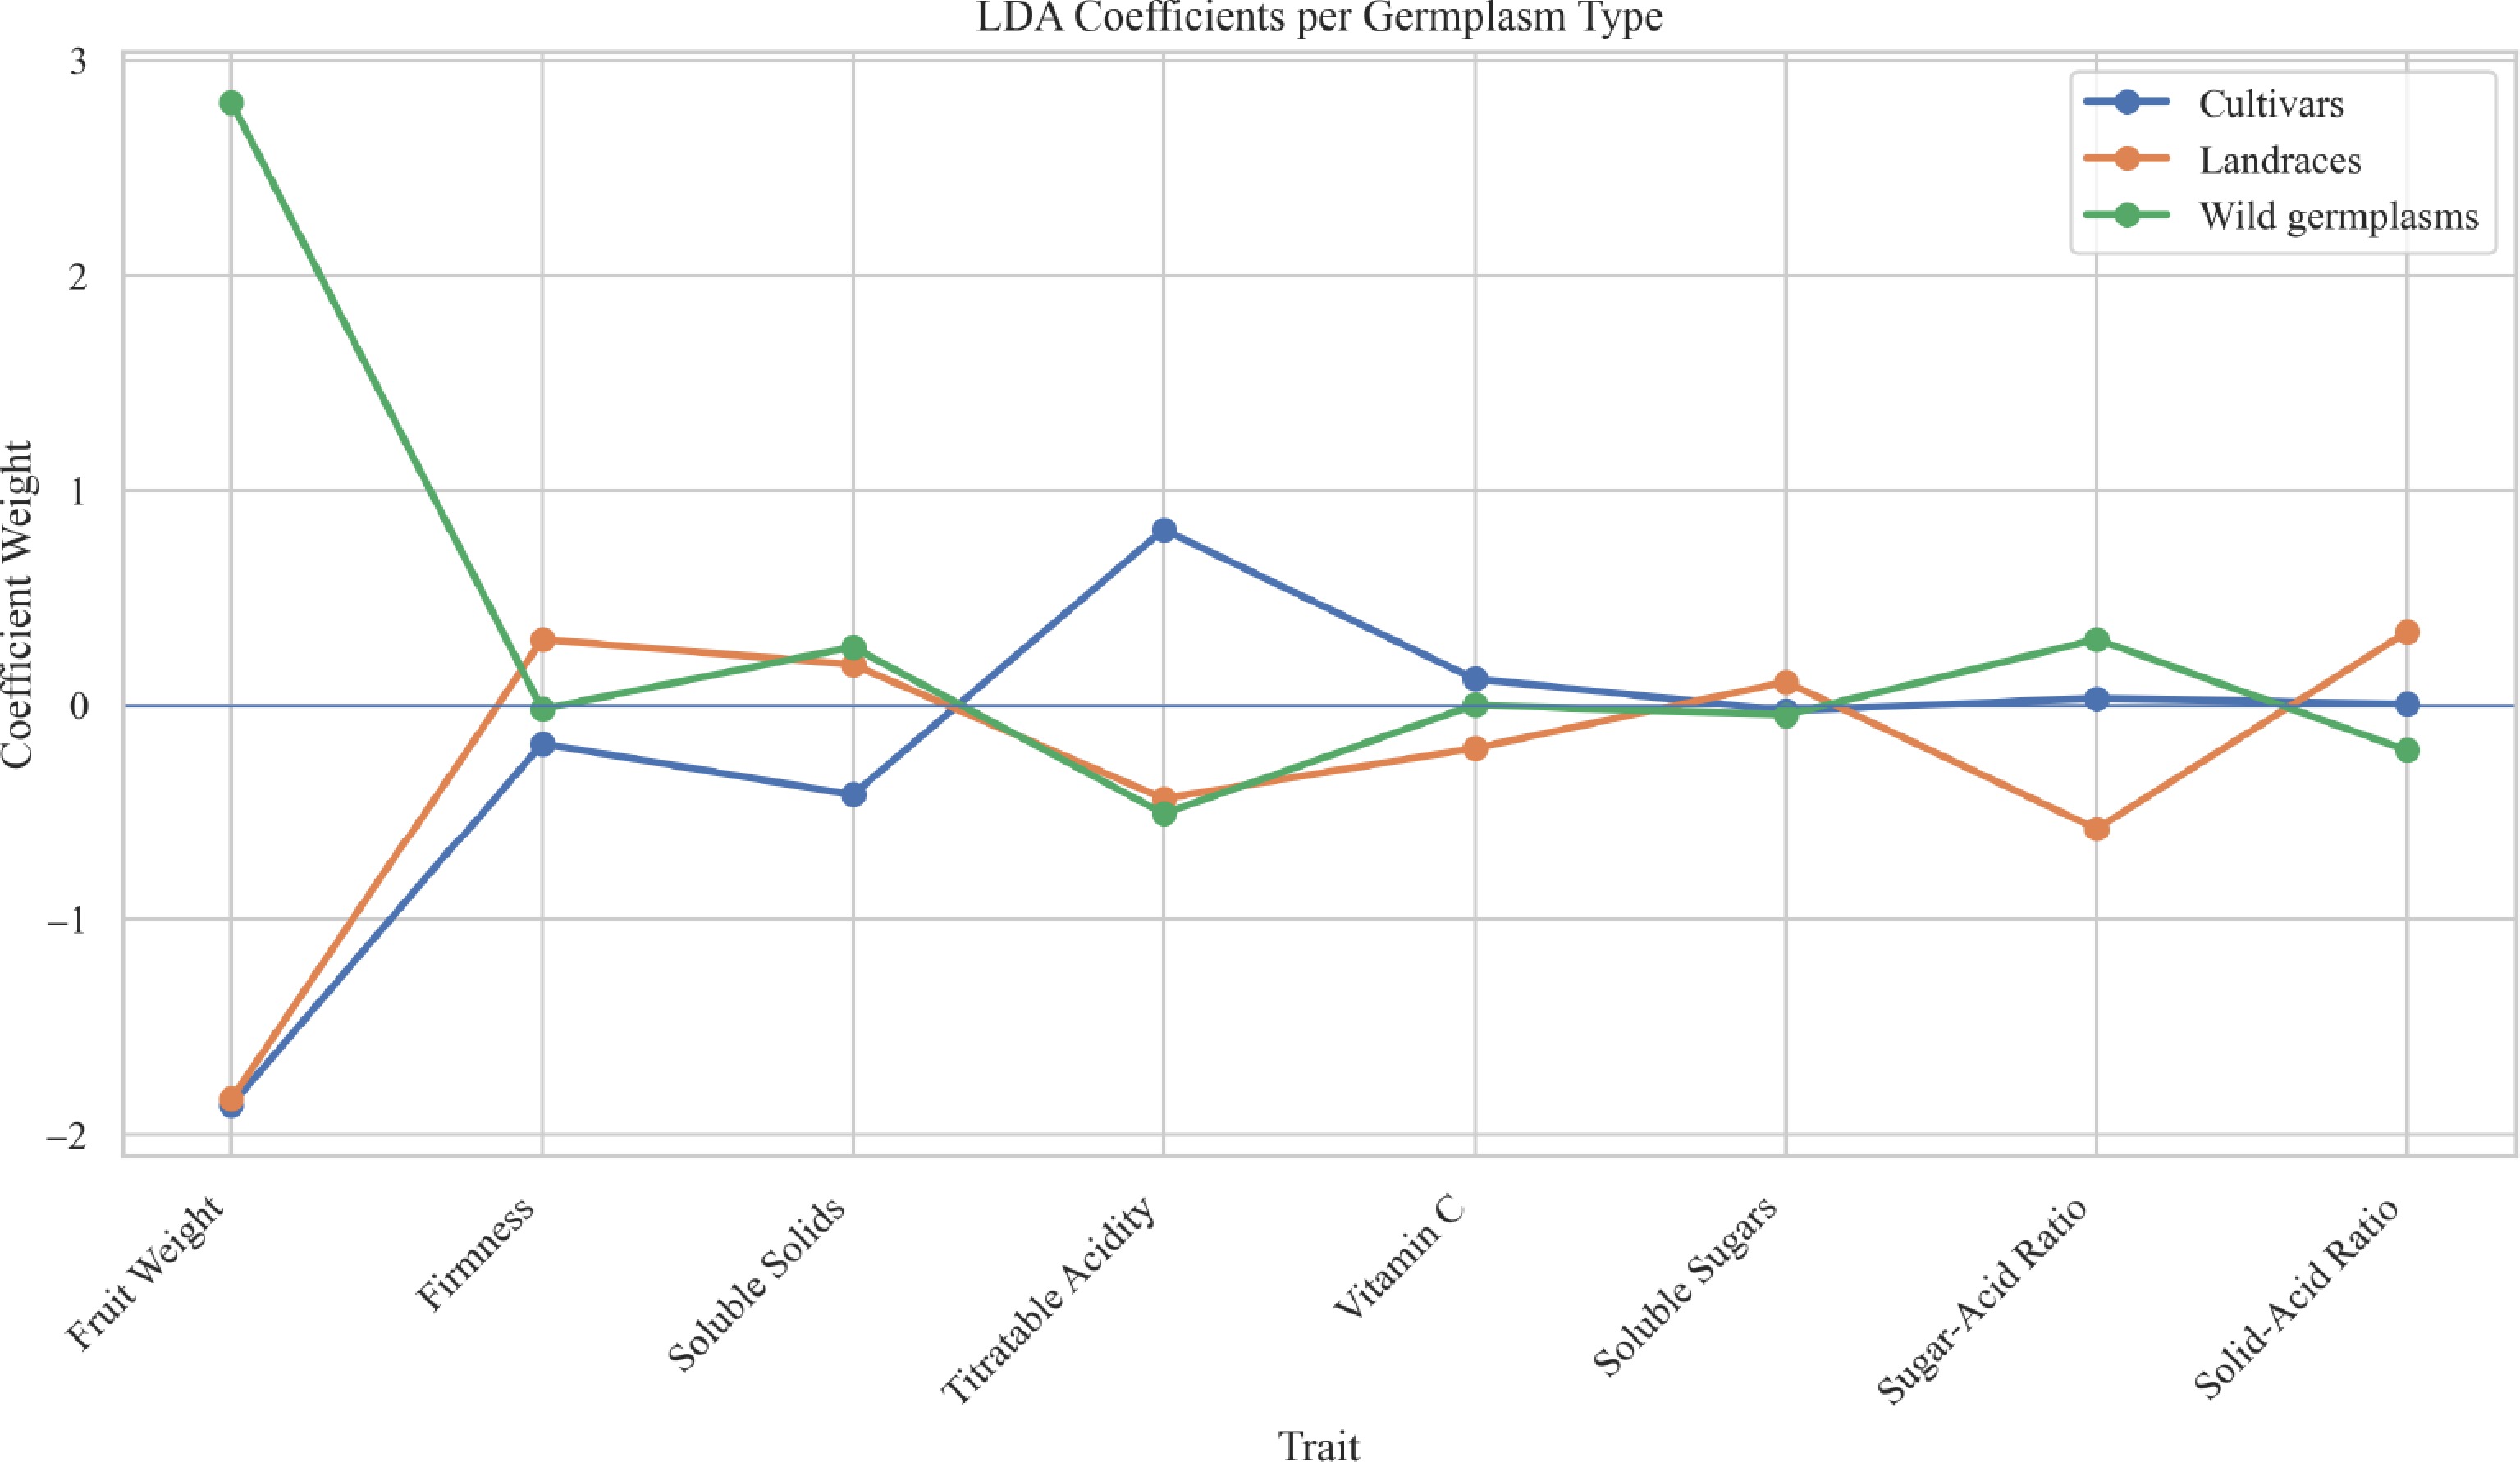
Figure 4.
LDA coefficients per germplasm type.
Cluster analysis of phenotypic traits
-
Through cluster analysis with a uniform distance threshold of 20 across three consecutive years (2020, 2021, and 2022), the data were clustered into six groups in 2020 and 2022, but into five groups in 2021 (Fig. 5 and Supplementary Table S1). Analyzing the clustering results over the three years, it was found that Cluster 1 mainly consists of cultivars, but there are some wild resources. These wild germplasms mainly come from Malus sieversii. By analyzing their phenotypes, it was discovered that the Malus sieversii from Huocheng has larger fruits, with a fruit weight exceeding 100 g, and relatively high contents of soluble sugar and soluble solids; the fruits from Xinyuan County are smaller, with a fruit weight of less than 50 g, but more than 35 g, and have high contents of vitamin C and titratable acid. In 2020, most of Cluster 2 and in 2021, most of Cluster 4 are Malus baccata from Yunnan, China. From 2020 to 2022, Cluster 3 and in 2020 and 2022, Cluster 4 is mainly composed of landraces and wild germplasms from Xinjiang and Hebei regions; in 2020, Cluster 5 mainly consists of cultivars.
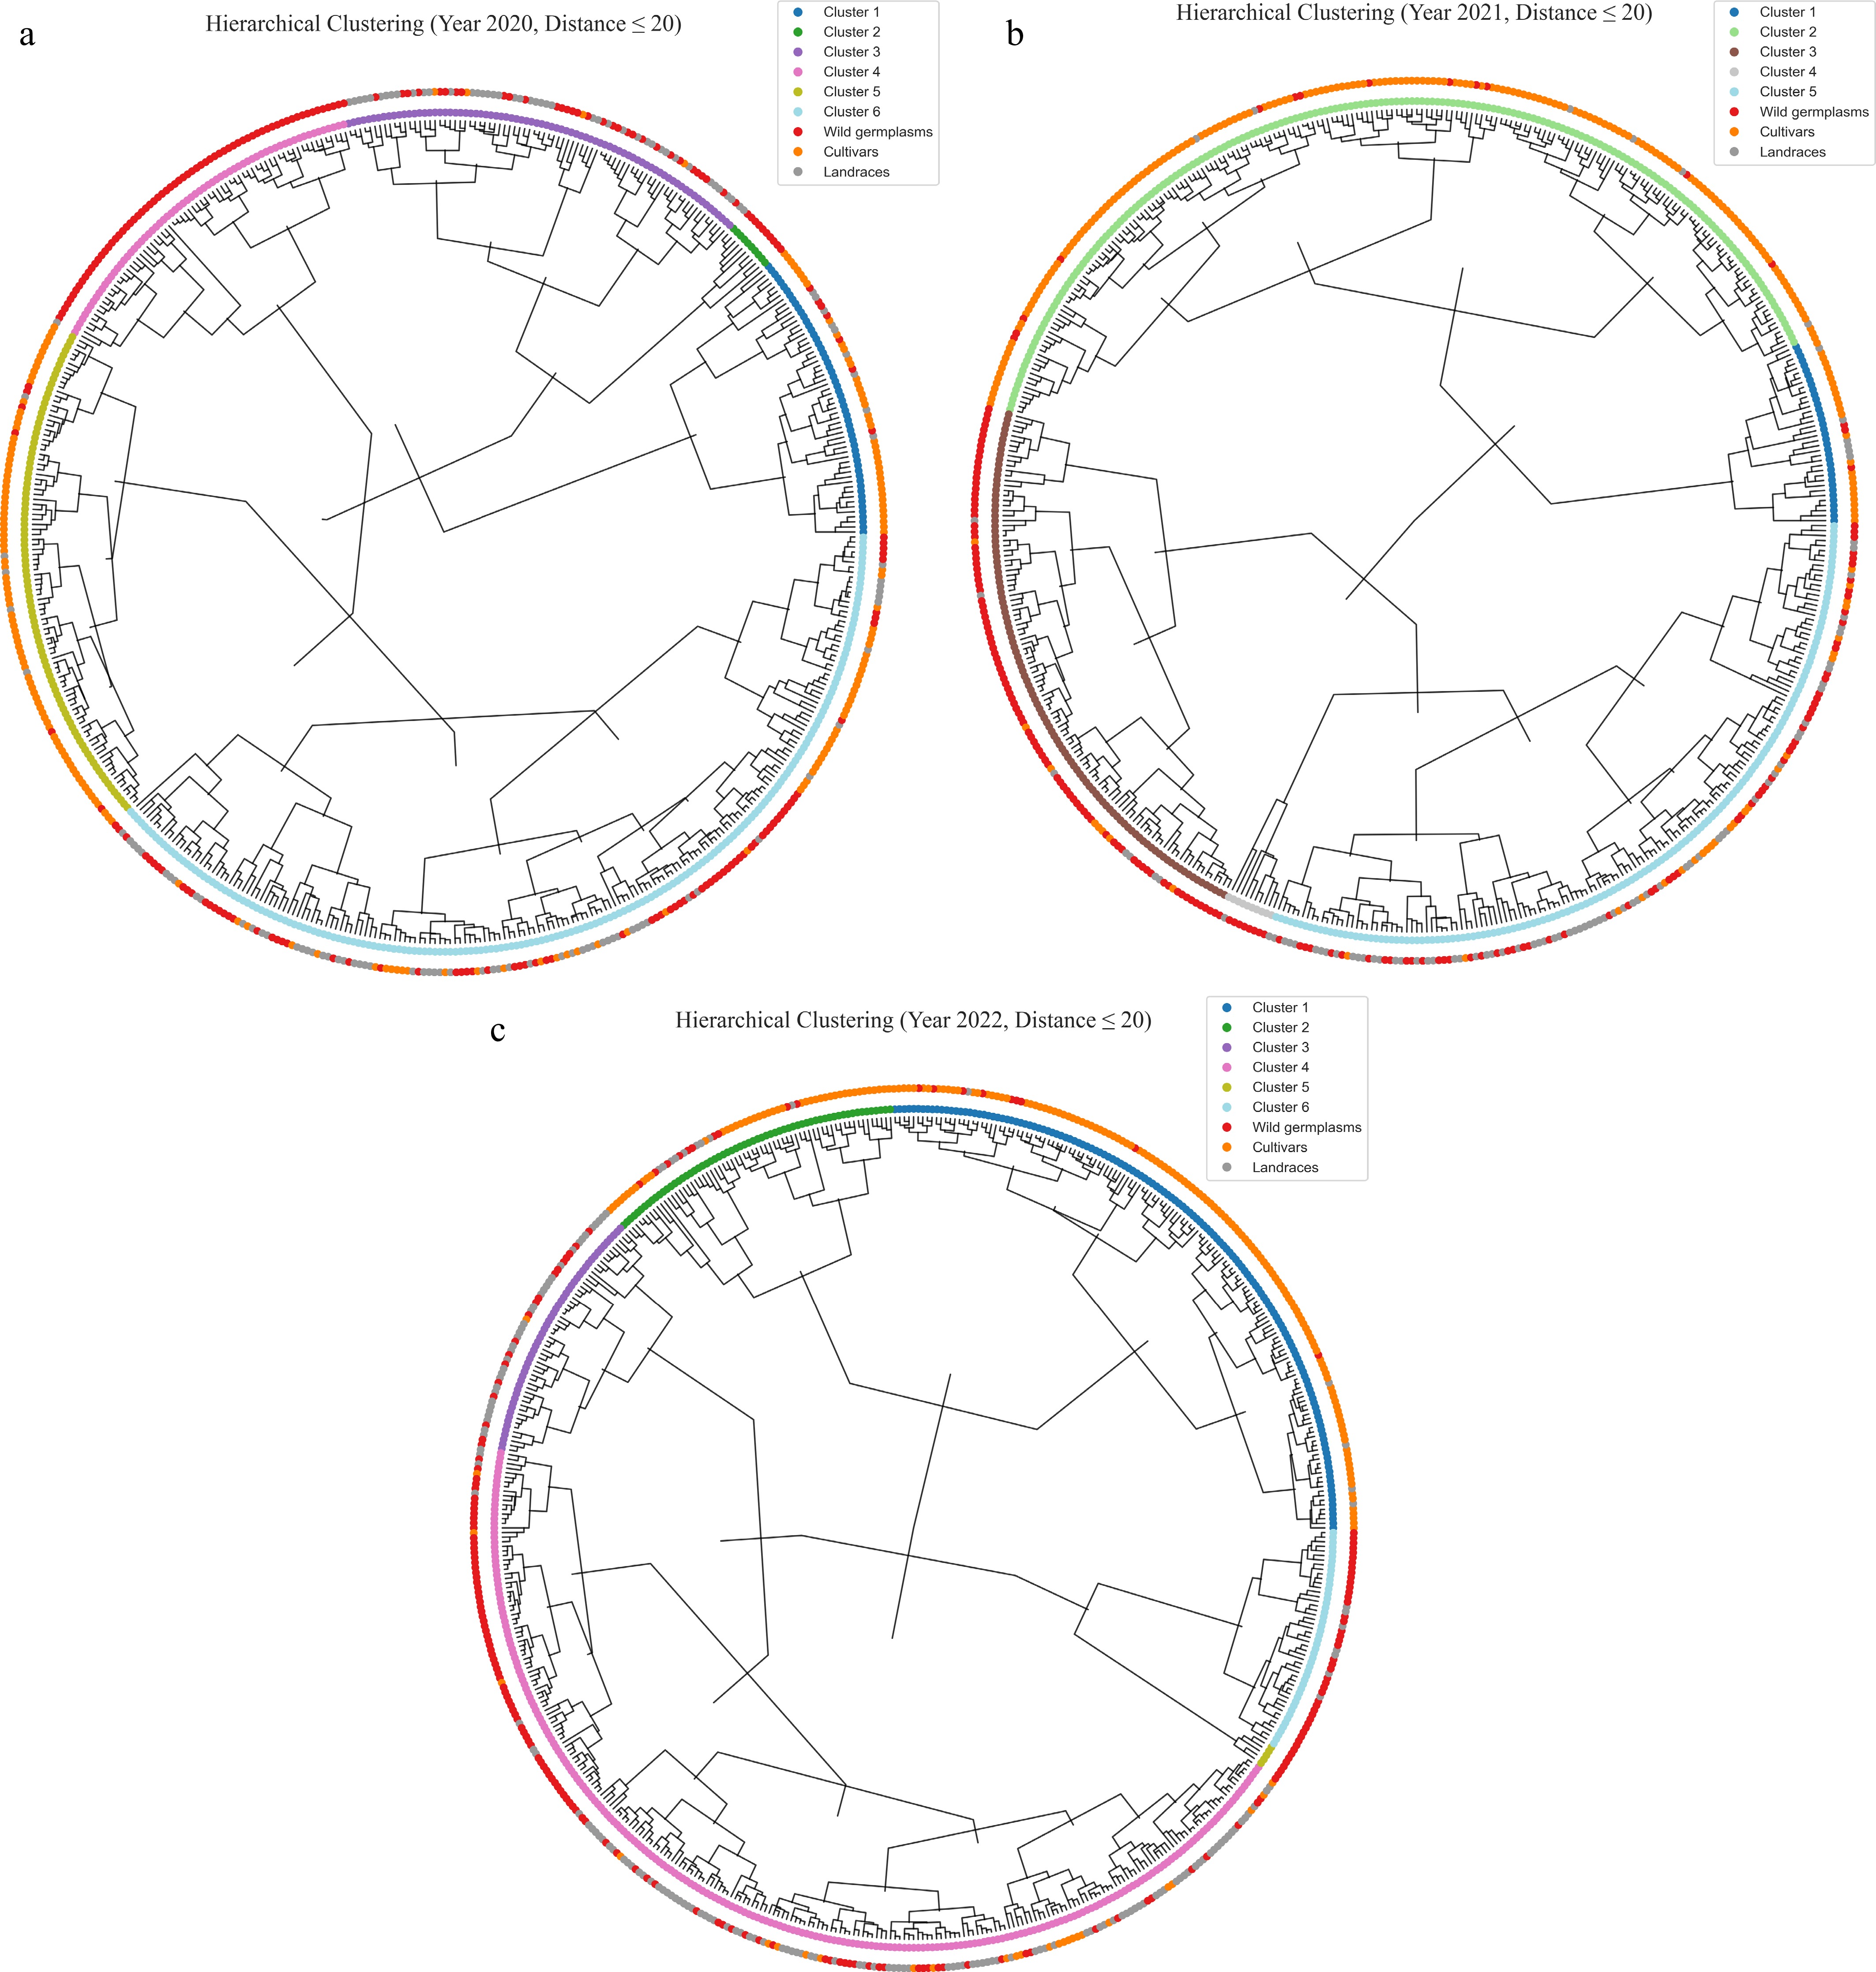
Figure 5.
Circular hierarchical clustering tree based on phenotypic traits. (a) 2020; (b) 2021; (c) 2022.
-
Apple germplasm resources exhibit substantial genetic diversity. In this study, 1,217 experimental accessions representing a wide range of apple germplasms were collected between 2020 and 2022. To date, no comprehensive studies have reported the phenotypic diversity of apple fruit traits using such a large sample size in China. The fruit weight, fruit firmness, soluble solids, titratable acidity, vitamin C, soluble sugar, sugar-acid ratio, and solid-acid ratio of these germplasm resources were systematically evaluated over three consecutive years. Combined statistical analysis reveals distinct patterns of interannual variation in apple fruit traits, highlighting key considerations for future breeding strategies, germplasm selection, and efficient resource management.
The coefficient of variation (CV) is a key indicator of trait diversity, with higher values reflecting substantial variability and a diverse genetic background, which can be advantageous for breeding and cultivar improvement because of the associated broad range of traits to be selected and enhanced[13,29,30]. In this study, several traits showed high coefficients of variation (CV > 0.9) and high Shannon–Wiener diversity (H′ > 1.5 for most traits), indicating extensive genetic variation across the germplasm panel. Particularly high diversity was observed for traits such as fruit weight, sugar content, and acidity, making them promising targets for selection in breeding programs focused on enhancing fruit quality, flavor, and environmental adaptability.
Phenotypic traits in plants often exhibit interdependence rather than adapting in isolation to environmental influences[29]. In apples, the correlation analysis revealed that flavor-related indices—such as the sugar-acid and solid-acid ratios—are primarily driven by the interplay between sugars and acids, with titratable acidity exerting a dominant negative effect. The strong inverse relationships between acidity and sweetness indices suggest that moderating acidity levels may enhance flavor perception. In contrast, the weak correlation between vitamin C and other traits indicates its potential for independent genetic improvement, allowing breeders to enhance nutritional quality without affecting the balance of sweetness and acidity[31]. These insights provide a basis for targeted trait selection to improve apple fruit quality. Fruit firmness and vitamin C content exhibited relatively stable distributions over the study period, with non-significant results in the ANOVA analysis, suggesting that these traits are predominantly under genetic control and minimally influenced by environmental variation. Their year-to-year consistency underscores their reliability as phenotypic markers for germplasm characterization and supports their use in multi-environment selection trials.
The eigenvectors reveal how each trait contributes to the principal components and highlight the relationships among traits. Fruit weight has a strong positive loading in PC1, suggesting it plays a dominant role in fruit size and yield-related characteristics. In contrast, titratable acidity has a strong negative loading in PC1, indicating a potential trade-off with fruit weight and sugar-acid balance. In PC2, traits like soluble sugar and firmness show high positive loadings, emphasizing their importance in fruit texture and sweetness. Vitamin C loads heavily in PC4, suggesting it varies independently from other traits and may be regulated by specific developmental or genetic factors. Overall, the PCA effectively reduces data dimensionality, reveals meaningful trait groupings, and provides a solid foundation for comprehensive trait assessment and the selection of superior germplasm.
Apple trees have been widely cultivated for over 2,000 years, during which long-term domestication has introduced distinct phenotypic characteristics to cultivated varieties[32]. Compared with their wild counterparts, domesticated landraces typically produce fruits of higher quality and with more desirable flavors[9,13,14]. However, this early domestication—primarily through the selection of wild individuals under natural conditions—also resulted in a reduction in genetic diversity relative to wild germplasm populations[33]. Genomic resequencing and selective sweep analyses across wild germplasms, landraces, and cultivars have revealed clear signatures of domestication, particularly in traits such as soluble solids content and fruit firmness, which were under selection pressure during both early and recent domestication stages[33−35].
To explore the effects of domestication on fruit quality traits, apple germplasm resources were categorized into three groups: wild germplasms, landraces, and cultivars. Phenotypic evaluation across eight fruit-related traits revealed significant variation both within and among these groups. Notably, wild germplasms exhibited the highest coefficients of variation, indicating substantial phenotypic diversity likely driven by broad genetic backgrounds and minimal human selection[36]. This diversity serves as a valuable reservoir of traits—including fruit size, nutritional content, and flavor attributes—that can be leveraged for future breeding efforts. Landraces displayed intermediate levels of variation, reflecting the combined influence of natural evolution and traditional cultivation practices. In contrast, cultivars, having undergone intensive selection for uniformity and market preferences, demonstrated limited variation across most traits. While such uniformity supports consistent commercial production, it may constrain the genetic potential for ongoing improvement. Therefore, the strategic incorporation of diverse wild germplasms and landraces into breeding programs is essential for expanding the genetic base and enhancing the resilience and adaptability of cultivated apples[37,38].
ANOVA results further underscored the pivotal role of genetic background in shaping key fruit traits[39]. Significant and consistent differences among germplasm types were observed for fruit weight, solid-acid ratio, and titratable acidity—traits that also exhibited high stability across years, making them reliable targets for genetic selection. Conversely, traits such as firmness, soluble solids, and vitamin C content were more environmentally sensitive, as reflected by significant year and genotype-by-year interaction effects. Particularly, soluble sugar content and sugar-acid ratio were highly influenced by both genetic and environmental factors, underscoring the complex nature of flavor traits[40,41]. These findings highlight the need for multi-year and multi-environment evaluations and emphasize the importance of simultaneously considering genotypic diversity and environmental responsiveness when selecting elite germplasms and designing effective breeding strategies for fruit quality enhancement. The results of the linear discriminant analysis (LDA) demonstrate its effectiveness in discriminating among germplasm types based on the selected phenotypic features. The clear separation between wild germplasms and cultivars suggests distinct underlying genetic or phenotypic characteristics, whereas the intermediate placement of landraces indicates a potential transitional group or shared traits with both extremes. The absence of distinct clustering by sampling year suggests minimal temporal variation, indicating that environmental or year-specific effects are not major confounding factors in the analysis.
A hierarchical cluster analysis conducted over three consecutive years (2020–2022) using a consistent distance threshold of 20 revealed dynamic changes in the number of clusters across years—six clusters in both 2020 and 2022, and five in 2021. These subtle annual differences suggest that the population structure of apple germplasm resources may be influenced by factors such as genetic expression variability and genotype–environment interactions. Cluster 1 predominantly comprised cultivated varieties, but also included wild germplasms such as Malus sieversii from Xinjiang. Notably, distinct phenotypic differentiation was observed among wild apples from different localities: accessions from Huocheng bore larger fruits (over 100 g) with higher sugar and soluble solids content, while those from Xinyuan exhibited smaller fruit size (35–50 g) but elevated levels of vitamin C and titratable acidity. These findings highlight the shaping effect of geographic origin on wild germplasm phenotypes and suggest potential introgression of wild genomic fragments into cultivated varieties, thereby preserving valuable genetic foundations for future improvement[42]. Distinct clustering patterns were also observed for specific germplasm groups. For example, Malus baccata accessions from Yunnan consistently formed stable clusters (e.g., Cluster 2 in 2020 and Cluster 4 in 2021), underscoring the regional uniqueness and genetic coherence of these resources. Similarly, Cluster 3 and Cluster 4 (in 2020 and 2022) were dominated by landraces and wild germplasms from Xinjiang and Hebei, reflecting genetic divergence shaped by geographic isolation and distinct domestication trajectories. In contrast, Cluster 5 in 2020 mainly comprised cultivated varieties, consistent with their more uniform genetic background resulting from prolonged directional breeding.
-
This study provides a comprehensive phenotypic evaluation of 1,217 apple germplasm accessions, encompassing wild germplasms, landraces, and cultivars, across three consecutive years. The analysis of eight key fruit traits revealed extensive genetic variation, particularly in fruit weight, sugar content, and acidity. High coefficients of variation and Shannon-Wiener indices underscore the value of these traits for breeding and genetic improvement. Correlation and PCA analyses demonstrated the complex interplay among flavor-related traits and highlighted vitamin C as an independently regulated trait. Comparative analysis among germplasm types showed that wild resources maintain the highest phenotypic diversity, while cultivars exhibit uniformity due to directional breeding. ANOVA results confirmed the predominant genetic control of certain traits, such as titratable acidity and solid-acid ratio, and the environmental sensitivity of others, like soluble sugar and firmness. Clustering analyses further revealed geographic influences and genotype-by-environment interactions, particularly among accessions from Xinjiang and Yunnan. Overall, the findings provide valuable insights into the genetic architecture of apple fruit quality traits, emphasizing the strategic importance of utilizing diverse wild germplasms and landraces. These results lay a solid foundation for trait-targeted breeding, elite germplasm selection, and long-term conservation of apple genetic resources.
This work was supported by the National Key R&D Program of China (2023YFD1200100), 'Xingliao Talent Program' Project of Liaoning Province (XLYC2203177), and the Agricultural Science and Technology Innovation Program (CAAS-ASTIP-2022-RIP-02).
-
The authors confirm contribution to the paper as follows: study conception and design: Gao Y, Li Z; data collection: Wang K, Sun S, Wang D; analysis and interpretation of results: Tian W, Liu Z, Guo H, Shang W; draft manuscript preparation: Li Z, Wang L, Sun Y. All authors reviewed the results and approved the final version of the manuscript.
-
The datasets generated and/or analyzed during the current study are not publicly available due to the fact that some germplasm resources have not yet been officially registered and deposited, but are available from the corresponding author upon reasonable request.
-
The authors declare that they have no conflict of interest.
- Supplementary Table S1 Circular hierarchical clustering.
- Copyright: © 2026 by the author(s). Published by Maximum Academic Press, Fayetteville, GA. This article is an open access article distributed under Creative Commons Attribution License (CC BY 4.0), visit https://creativecommons.org/licenses/by/4.0/.
-
About this article
Cite this article
Li Z, Sun S, Wang D, Wang K, Tian W, et al. 2026. Phenotypic variations in fruit traits among different Malus germplasm types. Fruit Research 6: e006 doi: 10.48130/frures-0025-0041 

Phenotypic variations in fruit traits among different Malus germplasm types
- Received: 30 June 2025
- Revised: 26 November 2025
- Accepted: 10 December 2025
- Published online: 04 February 2026
Abstract: Apple germplasm resources exhibit substantial genetic and phenotypic diversity, offering great potential for fruit quality improvement. In this study, 1,217 apple accessions representing wild germplasms, landraces, and cultivars were systematically evaluated over three consecutive years (2020–2022) for eight key fruit traits, including fruit weight, firmness, soluble solids, titratable acidity, vitamin C, soluble sugar, sugar-acid ratio, and solid-acid ratio. High coefficients of variation and Shannon-Wiener indices were observed for several traits, particularly fruit weight, soluble sugar, and titratable acidity, reflecting rich genetic variation. Correlation analysis revealed strong interdependence among flavor-related traits, while vitamin C appeared genetically independent. PCA and LDA effectively differentiated germplasm types and highlighted key trait contributions. Wild germplasms showed the highest diversity, while cultivars exhibited more uniform traits due to intensive breeding. ANOVA confirmed significant genetic effects on key traits, with certain traits (e.g., titratable acidity, fruit weight) showing high interannual stability, while others (e.g., soluble sugar, firmness) were environmentally influenced. Hierarchical clustering revealed genotype-environment interactions and geographic differentiation, such as distinct trait patterns among Malus germplasms from different regions. This comprehensive phenotypic assessment provides valuable insights for apple breeding, germplasm selection, and genetic resource conservation, emphasizing the importance of wild germplasms and landraces in expanding the genetic base of cultivars.
-
Key words:
- Malus /
- Germplasm resources /
- Fruit traits