


-
Apple (Malus domestica Borkh.), one of China's most widely cultivated fruit tree species, is valued for its remarkable adaptability, nutritional richness, diverse utility, and extended market availability. These attributes underscore its considerable ecological and economic importance, earning strong recognition from both producers and consumers[1−4]. Apple fruit quality is determined by many individual traits, most of which are quantitative traits controlled by minor polygenes or oligogenes[5−7]. Developing new apple varieties with superior fruit quality is a primary objective in breeding programs, although current research has predominantly focused on specific characteristics such as disease resistance and flavor profiles[8,9]. Systematic evaluation of trait variation between parental lines and their hybrids provides a fundamental basis for analyzing the genetic predisposition of key traits and selecting superior cultivars. This approach holds substantial significance for advancing the high-quality development of the apple industry.
Exploring genetic variation patterns is a foundational prerequisite and critical component of plant crossbreeding, which remains the most widely used and effective method for developing new varieties[10]. Genetic diversity, defined as the extent of genetic variability among individuals within a species or population, arises from various biological processes including genetic recombination, mutations, gene flow, and genetic drift[11,12]. Analyzing fruit trait diversity not only informs crossbreeding strategies but also facilitates the development of molecular markers and the identification of key genes[13]. Most plant traits are quantitative, governed by polygenic inheritance, and influenced by environmental interactions. Extensive research has been conducted on the correlation and inheritance of fruit traits in sweet cherry[14], chestnut[15], pomegranate[16], Camellia oleifera[17], and jujube[18]. These studies enhance the understanding of complex trait inheritance and provide valuable insights into crop improvement. However, comprehensive investigations into hereditary patterns and systematic evaluation of fruit qualitative traits in apple hybrid populations remain scarce. Therefore, a systematic assessment of fruit characteristics in F1 hybrid populations will facilitate the elucidation of pigmentation regulatory mechanisms, establish a theoretical foundation for breeding new apple varieties with excellent color, enhanced stress tolerance, and superior quality, and ultimately advance apple breeding efforts.
To develop new germplasm with early maturation, high yield, and premium quality traits, this study conducted crossbreeding using the elite cultivars 'MATO' and 'Royal Gala' as parents, obtaining 63 F1 hybrids. Comprehensive phenotypic characterization revealed substantial variation across 12 quantitative, and 12 qualitative fruit traits. Based on a comprehensive analysis of fruit quality traits, a multi-trait integrated evaluation model was developed. Utilizing the established selection framework, ten superior hybrids with outstanding overall performance were selected. Among them, genotype '40-9' has passed the National Forest Tree Variety Certification (No.: National S-SV-MD-009-2023), officially named 'Luli', and designated as a leading cultivar by the Ministry of Agriculture and Rural Affairs. This research provides an optimized selection framework and theoretical foundation for apple quality breeding, demonstrating the effectiveness of targeted hybridization strategies.
-
In 2003, 'MATO' and 'Royal Gala' were used as parental lines for crossbreeding. In 2005, 1,575 seedlings from the 'MATO' × 'Royal Gala' cross were obtained. Of these, 115 hybrid seedlings exhibiting stable phenotypic performance were transplanted in 2011 to the Tianpinghu Base of the Shandong Institute of Pomology, located in Daiyue District, Tai'an, Shandong (36°13′ N, 117°01′ E). All seedlings were grafted onto the same rootstock (M9T337), planted at a spacing of 0.5 m × 2 m, and maintained under standard horticultural practices. From 2022 to 2023, 'MATO', 'Royal Gala', and 63 stable flowering and fruiting lines were used as experimental materials to investigate fruit traits. The sampling period for apple fruits is from July to August every year. Fruits at similar maturity stages around the crown of each plant were selected for evaluation.
Diversity analysis and comprehensive evaluation of apple fruit traits
-
A comprehensive phenotypic evaluation was conducted following the standardized protocols outlined in the 'Guidelines for the Conduct of Tests for Distinctness, Uniformity and Stability—Apple (Malus domestica Borkh.) (NY/T 2424-2013)'. At least ten mature fruits with normal development, uniform size, and no diseases or pests from each hybrid for investigation and measurement. This evaluation of morphological and biochemical traits included peel color (PC), flesh color (FC), single fruit weight (SFW), longitudinal diameter (LD), transverse diameter (TD), fruit shape index (FSI), fruit shape (FS), color covering area (CCA), stem depression rust (SDR), fruit lenticel density (FLD), fruit lenticel size (FLS), fruit firmness (FF), soluble sugar content (SS), total phenol content (TP), total flavonoid content (TF), anthocyanin content, fruit maturity period (FMP), fruit flavor (FFL), and other characteristics.
Following fruit harvest at maturity, trained personnel systematically evaluated qualitative traits, including PC, FC, FS, SDR, FLD, FLS, and FFL. Quantitative measurements were performed using standardized methodologies. SFW was measured using a precision electronic balance. LD and TD were recorded with digital Vernier calipers, enabling calculation of FSI (LD/TD). FF was measured using a TA.XT plus texture analyzer (Stable Micro Systems, Godalming, UK). The specific method is to use a cylindrical flat-head probe with a diameter of 2 mm and puncture perpendicularly along the equatorial part of the fruit at a test rate of 1 mm/s. After piercing the fruit peel, the probe continued to penetrate the flesh to a depth of 10 mm, and the maximum pressure value during the process was recorded, expressed in g. Color parameters were measured using a colorimeter (WSC-1B; Shanghai, China). The L* value indicates brightness, with positive values reflecting whiteness and negative values indicating darker, blackish hues. The a* value represents the red–green spectrum, with positive values denoting red and negative values indicating green tones. Similarly, the b* value measures the yellow–blue spectrum, where positive values correspond to yellow and negative values represent blue tones. SS was determined using a Plant Soluble Sugar Content Assay Kit (Solarbio, Beijing, China). TP was determined by the Total Phenol (TP) Test Kit (Grace Biotechnology, Suzhou, China). TF was determined by the Total Flavonoids (TF) Kit (Grace Biotechnology, Suzhou, China). The anthocyanin contents of the fruits were measured using a Plant Anthocyanin Content Assay Kit (Grace Biotechnology, Suzhou, China). All assays using the kit were performed according to the manufacturer's protocols.
Data were collated using Microsoft Office Excel 2010 and analyzed according to previously reported methods[19]. Parental values (P1 and P2), maternal phenotypic variance (VP1), paternal phenotypic variance (VP2), and mid-parent (MP) values for key economic traits were calculated. Genetic parameters for the hybrid progeny population, including mean value (F), standard deviation (S), variance (VH), range (R), coefficient of variation (CV), genetic transmissibility of cross combinations (Ta), heterosis rate (H), broad-sense heritability (Hb2), and Shannon–Weaver diversity index (SWDI, H′), were calculated using the following equations:
$ {CV}\; {({\text{%}} )={\rm S}/{\rm F}\times 100} $ $ \mathit{T} _{ \mathit{a} } \;{({\text{%}})=\rm F/MP\times 100} $ $ \mathit{H}\; {({\text{%}})=\rm [(F-MP)/MP]\times 100} $ $ \mathit{H}_{\mathit{b}}^{\mathit{\mathrm{\mathit{2}}}}\; (\text{%})=[V_{\mathrm{H-}}\mathrm{(V}_{\mathrm{P1}}\mathrm{+V}_{\mathrm{P2}}\mathrm{)/2]/V}_{\mathrm{H}}\mathrm{\times100} $ $ \mathit{H}' \mathrm{\approx C/N(NlgN-\Sigma^ n_{i=1}=n}_{ \mathrm{i}} \mathrm{lgn}_{ \mathrm{i}} \mathrm{)} $ where, C is converted from log10 to log2 (C = 3.322), N is the total number of individuals, and ni is the number of individuals of genus i.
Quantitative traits were classified into grades: grade 1 < mean − 2 S, grade 10 ≥ mean + 2 S, with each interval representing 0.5 S, where S is the standard deviation[20,21]. Fruit trait frequency distribution maps and principal component analyses of hybrids were generated using Origin 2021 (OriginLab Corp., Northampton, MA, USA).
Genetic model analysis
-
Genetic analysis of 12 quantitative traits in the F1 hybrid apple population (pseudo-F2 generation) was conducted using the mixed major gene plus polygene inheritance model for plant quantitative traits[22]. The optimal genetic model was selected based on the minimum Akaike information criterion (AIC) value. Subsequently, the least squares method was used to estimate the corresponding major gene effects.
Statistical analysis
-
All experiments were performed at least three times. The results are presented as the mean ± standard error of the mean. Differences among samples were analyzed using one-way analysis of variance followed by Tukey's test, performed with SPSS Statistics software (SPSS Inc., Chicago, IL, USA).
-
A hybrid population comprising 63 F1 individuals was established from the 'MATO' × 'Royal Gala' cross (Fig. 1). Comprehensive genetic and diversity assessments were conducted for 24 fruit traits (12 quantitative and 12 qualitative). The hybrid progenies exhibited extensive segregation and rich variation in FSI, PC, FF, etc. (Fig. 2). The Kolmogorov–Smirnov (K–S) test indicated that the 12 quantitative fruit traits in the hybrids followed normal distributions, consistent with typical quantitative inheritance patterns.
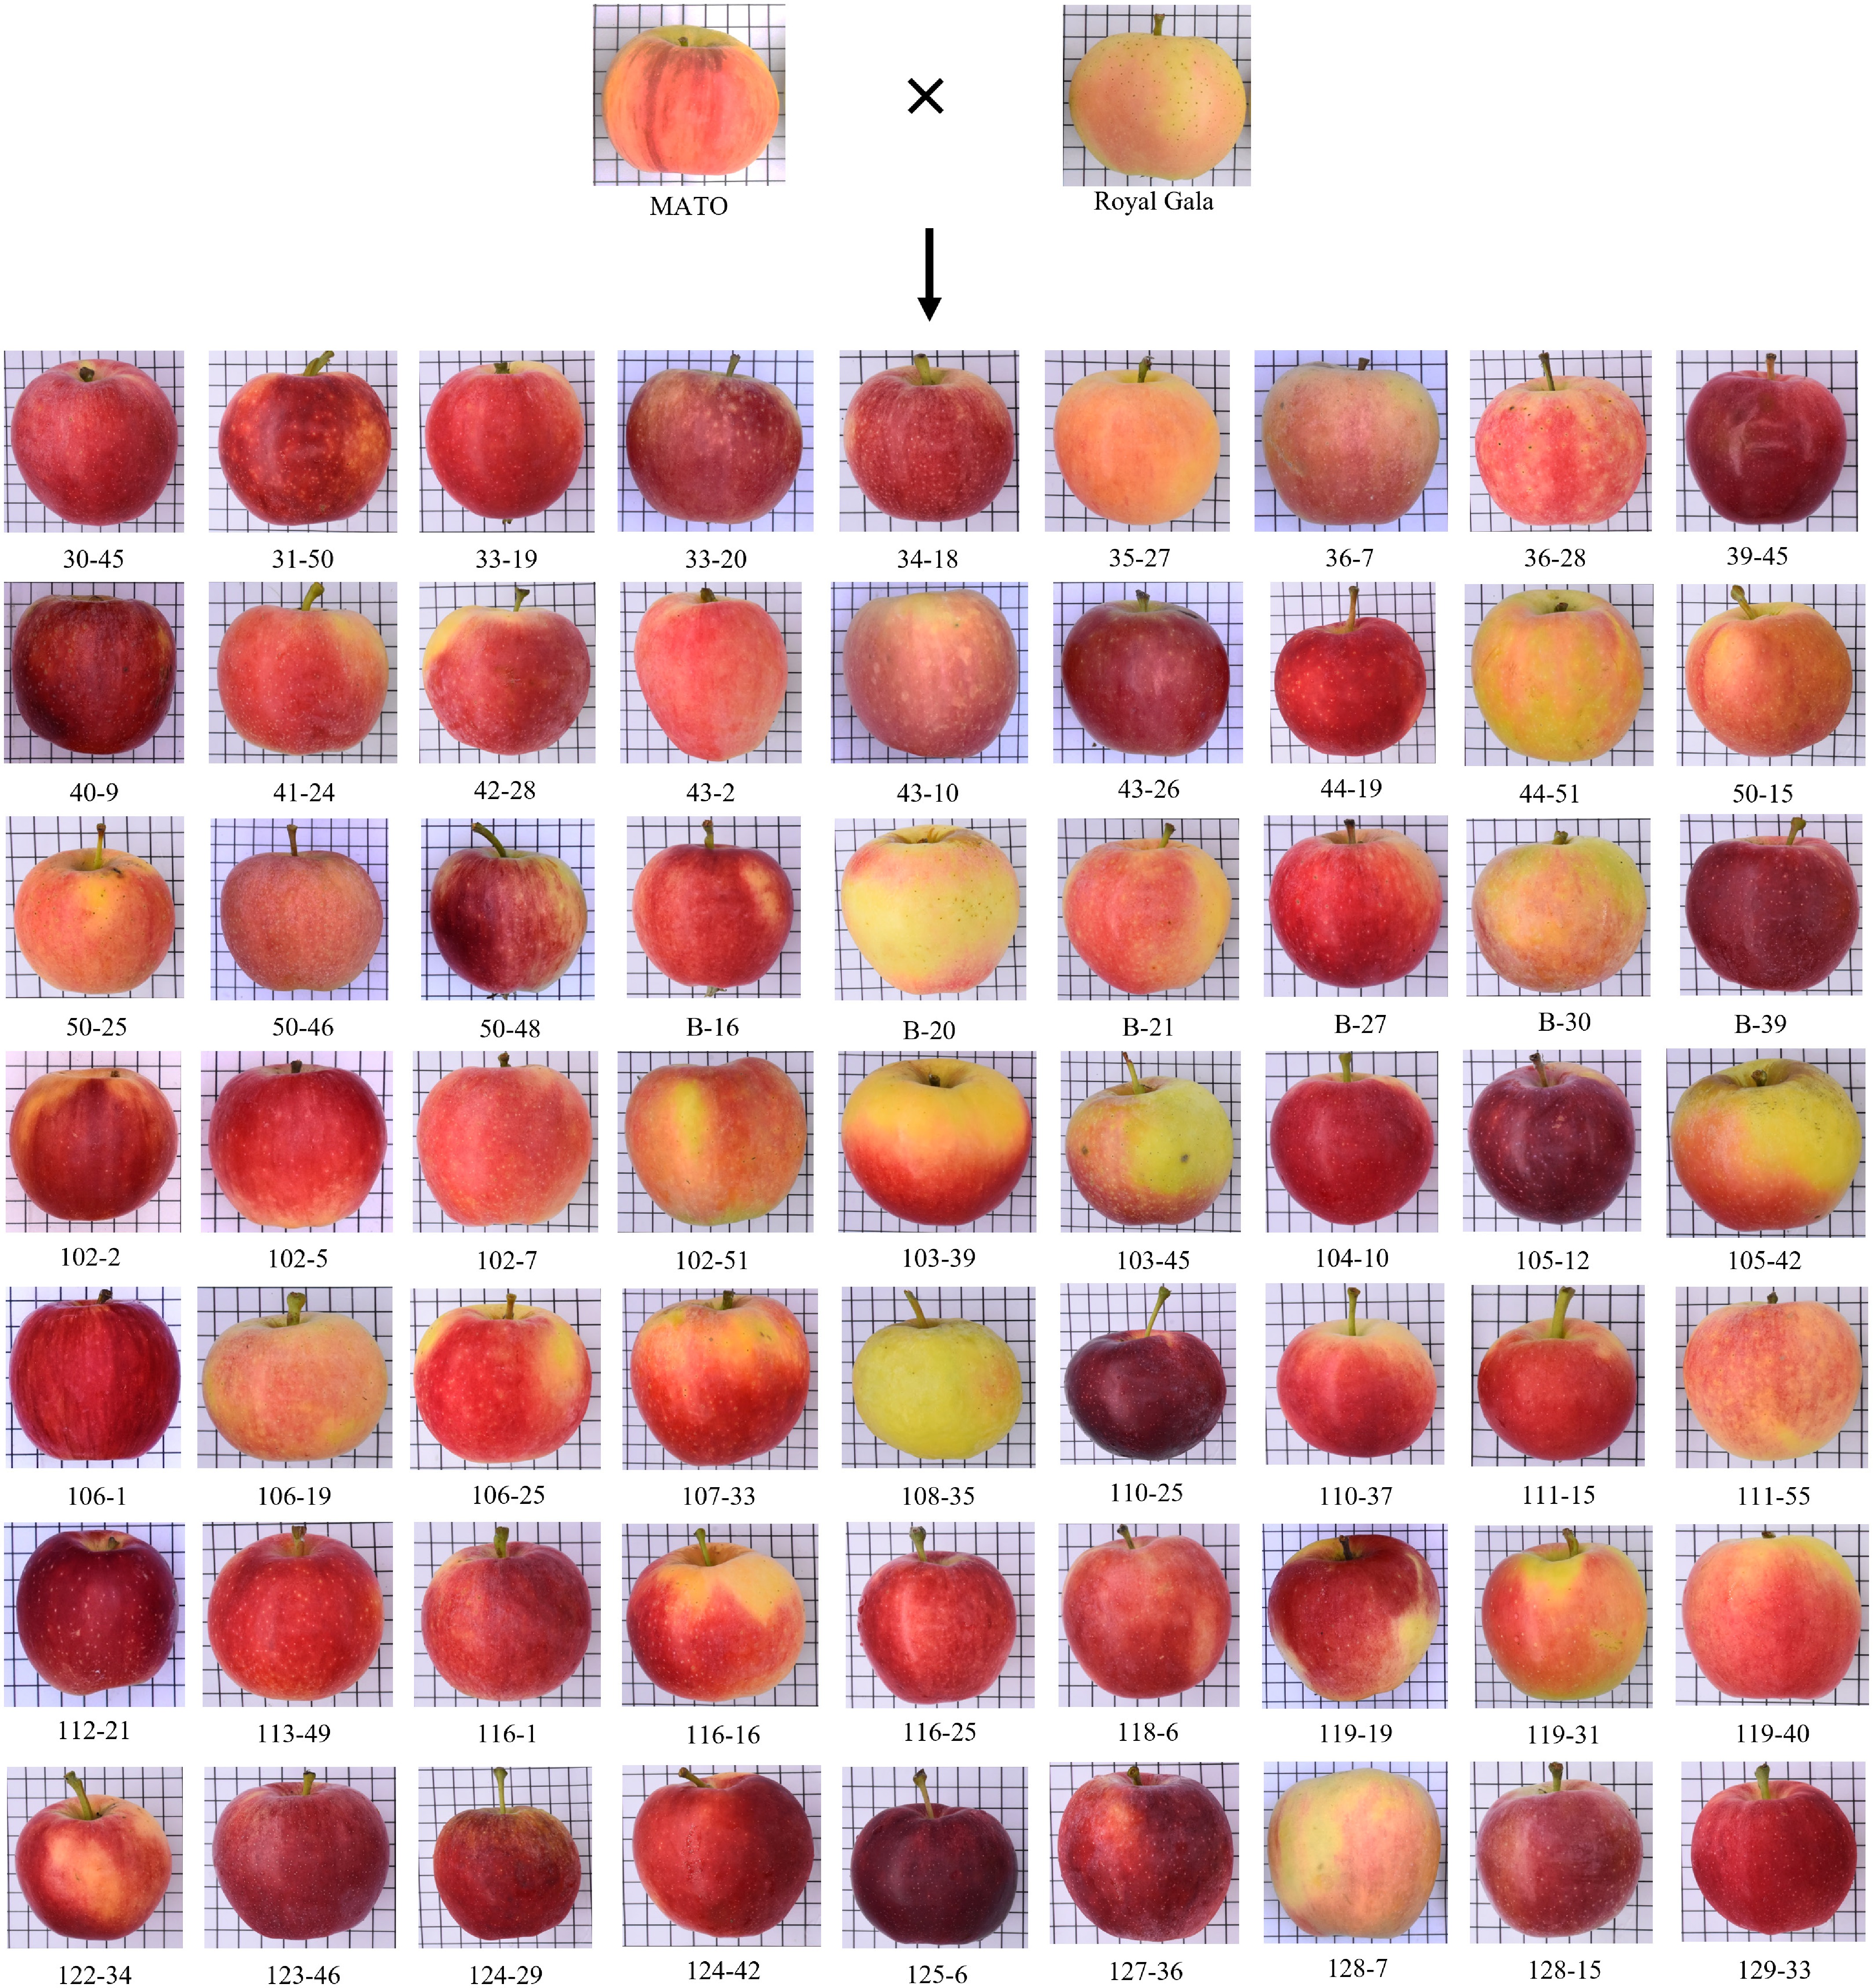
Figure 1.
The fruit phenotypes of F1 hybrids derived from 'MATO' × 'Royal Gala'. The side length of one grid in the white grid background pattern is 1 cm.
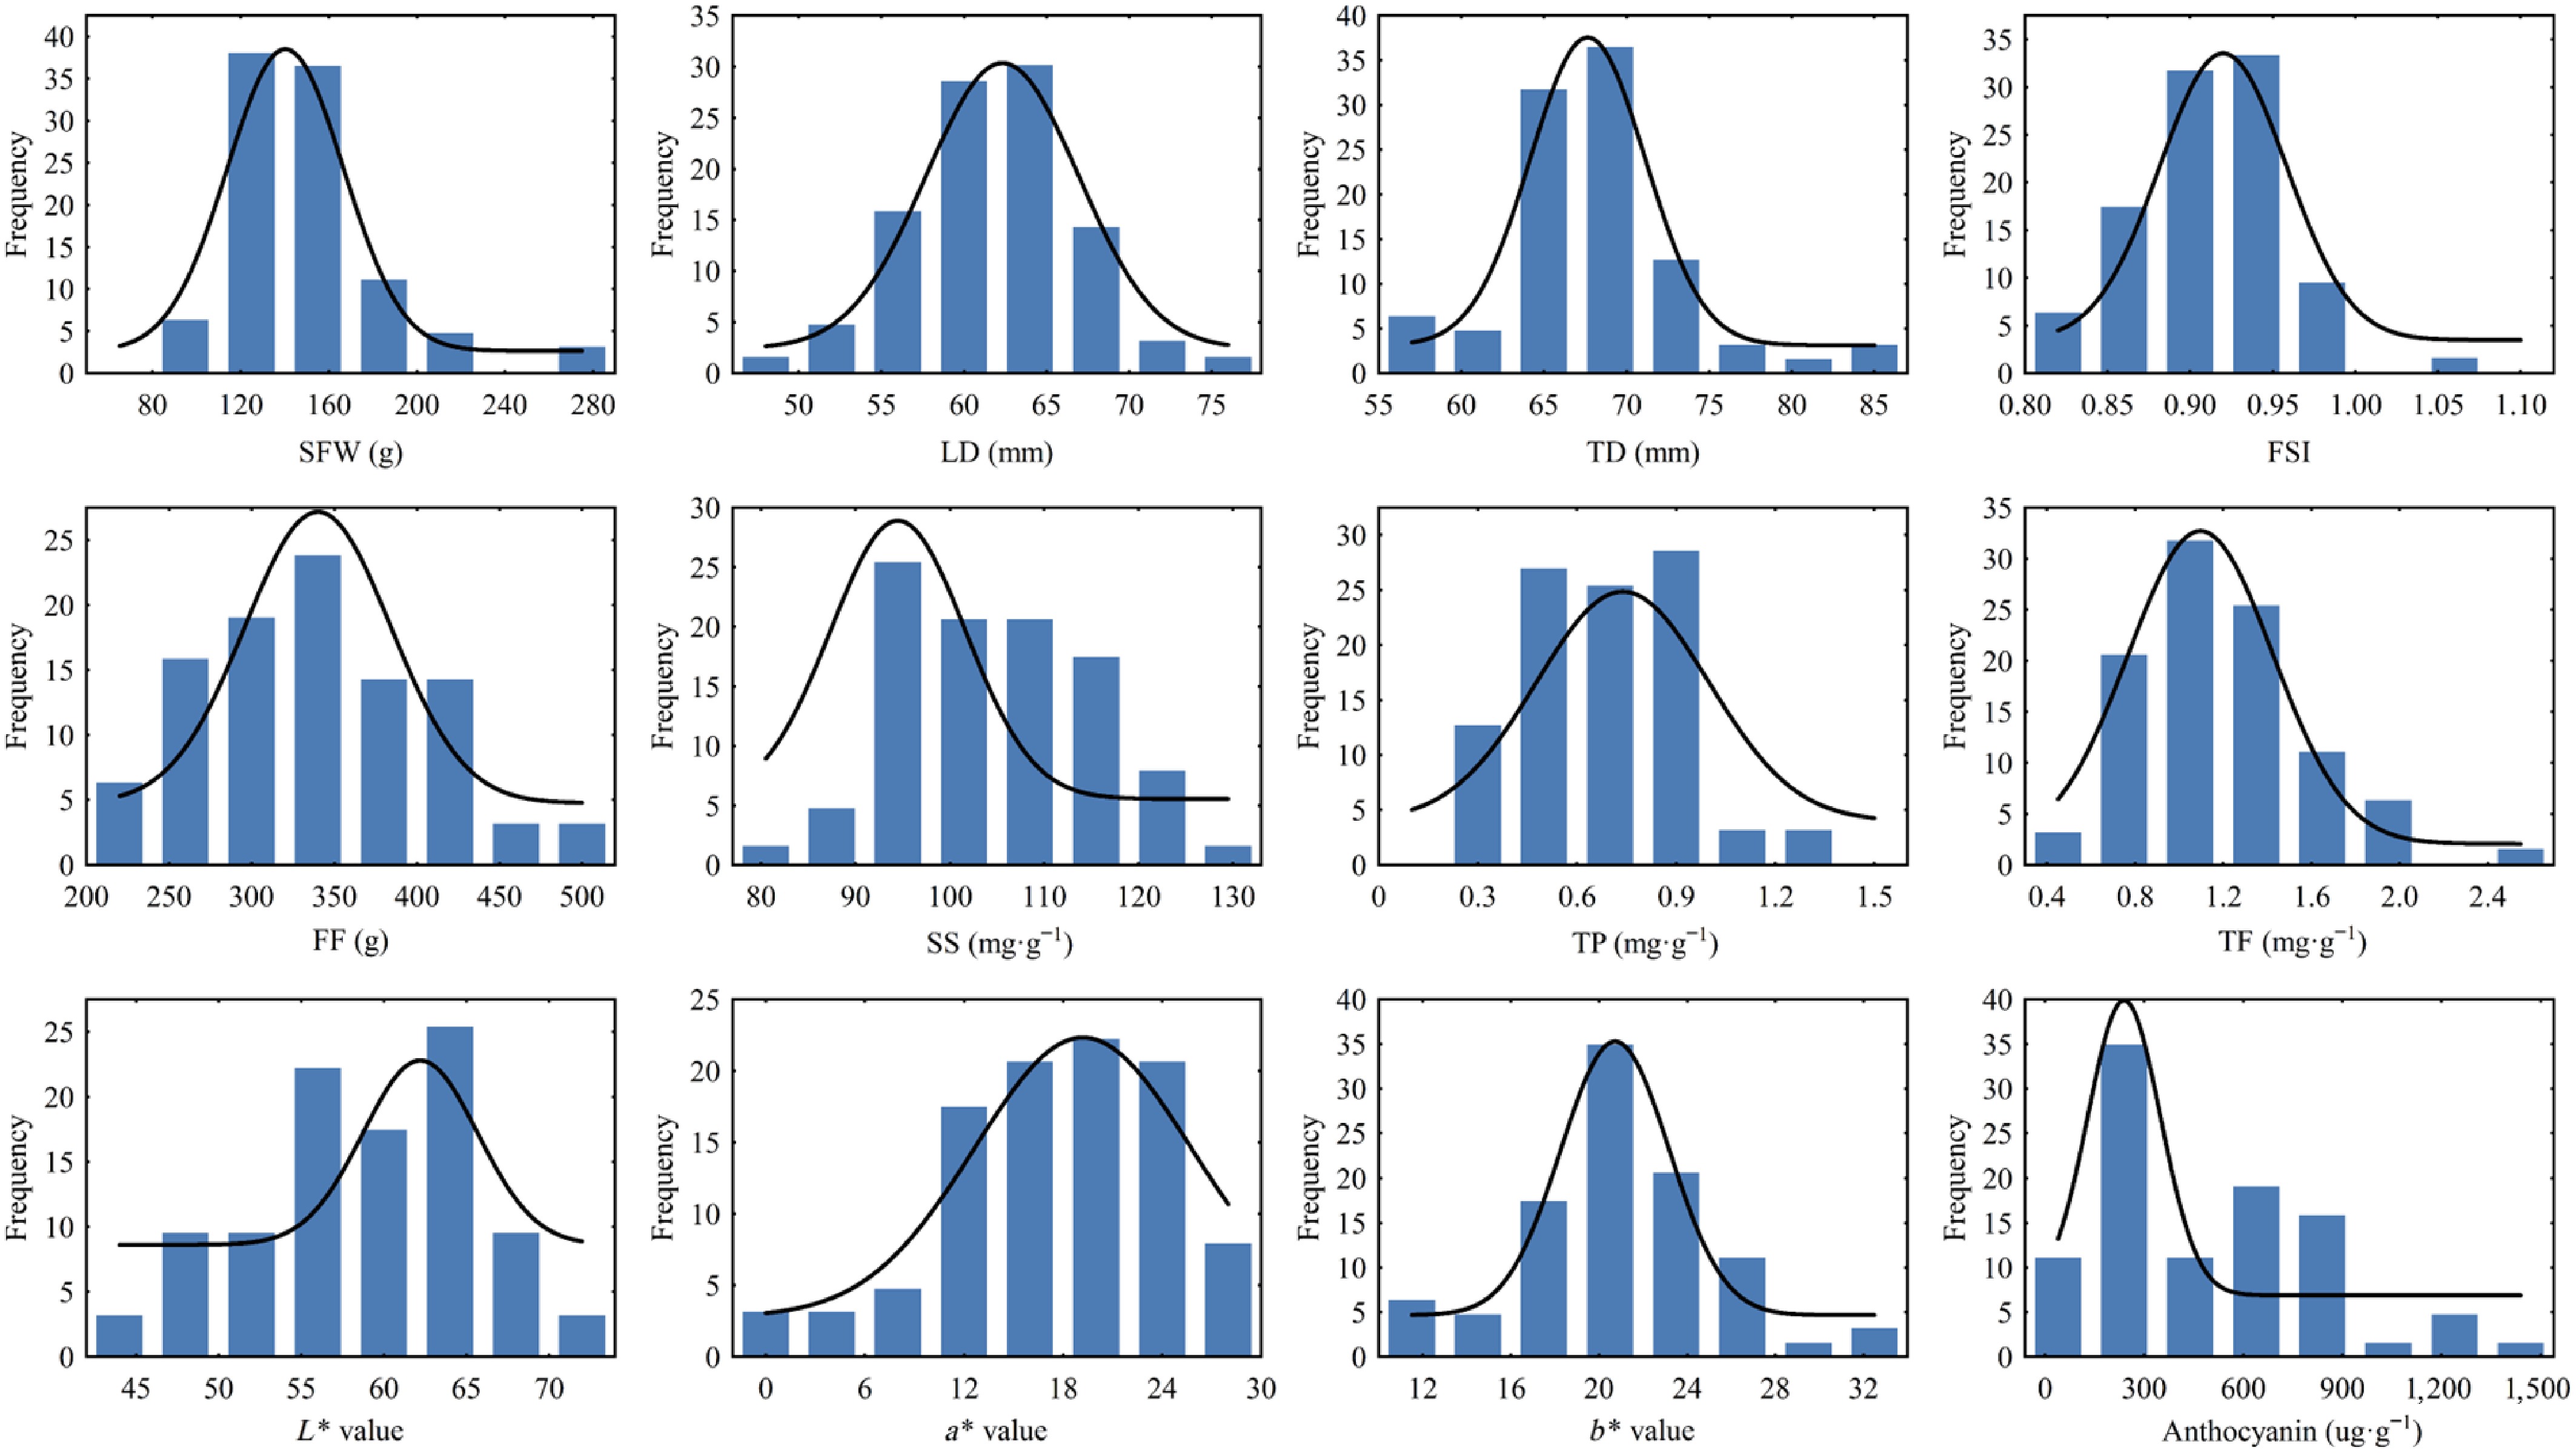
Figure 2.
Frequency distributions of fruit characters in the F1 progenies derived from 'MATO' × 'Royal Gala'. SFW: Single fruit weight; LD: Longitudinal diameter; TD: Transverse diameter; FSI: Fruit shape index; FF: Fruit firmness; SS: Soluble sugar; TP: Total phenol; TF: Total flavonoid.
Comprehensive evaluation of fruit size parameters—SFW, LD, TD, and FSI—revealed substantial phenotypic variation (Table 1). The F1 population showed significant transgressive segregation, with SFW, LD, and FSI exceeding MP values. Specifically, 17 transgressive individuals were identified. In contrast, the mean TD fell below the MP value, suggesting a tendency toward smaller fruit size inheritance. Hb2 analysis indicated strong genetic control over size traits with minimal environmental influence. Furthermore, Ta values demonstrated stable inheritance from parents to progeny, highlighting the potential for genetic improvement through selection. These results indicate predictable inheritance patterns for fruit size traits in this hybrid population.
Table 1. The heritable variation of quantitative traits in the F1 hybrids derived from 'MATO' × 'Royal Gala'.
Traits Parents Hybrids MT RG MP Average Range CV (%) Ta (%) H (%) Hb2 (%) H′ p χ2 SFW (g) 145.00 ± 31.82 146.20 ± 15.27 145.60 148.69 88.40–266.88 23.92 102.12 2.12 50.77 2.78 < 0.01 7.59 LD (mm) 59.40 ± 4.06 61.42 ± 2.70 60.41 61.76 49.43–75.71 8.25 102.24 2.24 54.22 2.98 0.986 7.47 TD (mm) 67.98 ± 4.40 68.73 ± 2.88 68.36 68.15 57.28–84.32 8.05 99.70 −0.30 54.03 2.75 0.030 6.06 FSI 0.87 ± 0.04 0.89 ± 0.04 0.88 0.91 0.80–1.07 5.15 102.56 2.56 11.48 2.94 0.216 0.37 FF (g) 217.32 ± 41.23 261.16 ± 47.01 239.24 335.21 204.48–498.25 21.09 140.11 40.11 60.54 2.94 0.262 1.35 SS (mg·g−1) 106.39 ± 3.97 91.59 ± 2.33 98.99 104.60 79.60–130.31 10.04 105.67 5.67 90.40 2.94 0.617 4.59 TP (mg·g−1) 0.52 ± 0.11 0.50 ± 0.08 0.51 0.68 0.22–1.39 36.20 132.67 32.67 85.49 2.93 0.387 4.63 TF (mg·g−1) 1.36 ± 0.12 0.78 ± 0.12 1.07 1.18 0.44–2.63 34.01 110.22 10.22 90.76 2.88 0.031 0.58 L* value 68.85 ± 2.52 73.65 ± 2.88 71.25 58.90 43.41–72.26 11.04 82.67 −17.33 82.72 2.91 0.570 5.60 a* value −6.80 ± 6.59 −1.20 ± 5.20 −4.00 17.84 −0.46–28.08 35.40 −445.70 −545.70 11.66 2.81 0.040 1.29 b* value 39.00 ± 4.83 33.43 ± 3.13 36.21 20.99 12.54–33.81 20.68 57.96 −42.04 12.27 2.84 0.188 2.00 Anthocyanin (μg·g−1) 47.65 ± 23.61 33.70 ± 8.42 40.67 501.10 76.39–1,401.46 66.22 1,231.99 1,131.99 99.71 2.67 < 0.01 15.61 MT: MATO; RG: Royal Gala; MP: Mid-parent mean; CV: Coefficient of variation; Ta: Genetic transmitting ability of cross combinations; H: Heterosis; Hb2: Broad-sense heritability; H': Shannon-Weaver diversity index SFW: Single fruit weight; LD: Longitudinal diameter; TD: Transverse diameter; FSI: Fruit shape index; FF: Fruit firmness; SS: Soluble sugar; TP: Total phenol; TF: Total flavonoid. FF is closely associated with storability. In this study, the F1 hybrids exhibited higher mean FF than the MP value, indicating a genetic tendency toward improved texture. The CV suggested moderate phenotypic variability, with several individuals showing transgressive segregation. Low CV reflects trait stability, whereas high CV implies greater selection potential. Genetic parameter estimates—including Hb2, Ta, and H—collectively indicate strong genetic control and high potential for effective phenotypic selection of FF in F1 hybrids (Table 1).
Quantitative analysis of SS, TP, and TF in F1 hybrids revealed that mean concentrations significantly exceeded MP levels (Table 1). This transgressive segregation pattern indicates a strong genetic predisposition for enhanced accumulation of these bioactive compounds. The CV values suggest that variation in SS within the F1 generation is primarily genetically controlled, with negligible environmental influence, indicating excellent potential for genetic improvement through selective breeding.
PC, a key determinant of apple appearance quality, was quantitatively assessed using the CIELAB color space system in F1 hybrids (Table 1). Colorimetric analysis revealed distinct inheritance patterns: the mean L* value (brightness) was lower than MP, while the a* value (red–green spectrum) significantly exceeded MP, indicating enhanced red pigmentation (CV = 35.40%). In contrast, the b* value (yellow–blue spectrum) averaged below MP and exhibited low Hb2, suggesting greater environmental influence on this parameter. Anthocyanin content, the primary pigment responsible for red color, showed considerable variation among hybrids, with the population mean surpassing both parental lines, indicating a strong genetic tendency toward high anthocyanin accumulation. The population exhibited high variability, as reflected by CV. High Ta and Hb2 values confirmed strong genetic control over anthocyanin accumulation, indicating excellent potential for targeted breeding. These findings provide valuable insights into the complex inheritance of color traits in apple breeding.
Genetic and diversity analyses of fruit qualitative traits in 'MATO' × 'Royal Gala' F1 hybrids
-
Both 'MATO' and 'Royal Gala' are mid-maturing apple varieties. The F1 hybrid population exhibited significant variation in FMP, with a 41-d range among progeny (Table 2). The high H′ value suggests complex genetic control of maturation timing.
Table 2. The heritable variation of qualitative traits in the F1 hybrids derived from 'MATO' × 'Royal Gala'.
Traits Parents Grading standards and separation proportion of F1 hybrids (%) MT RG 1 2 3 4 5 6 7 H′ FMP(d) 91 112 92 (28.57) 96 (12.70) 100 (1.59) 110 (26.98) 117 (6.35) 120 (14.29) 133 (9.52) 2.48 PC Red Orange red Pink (12.70) Orange-red (12.70) Red (57.14) Purple-red (17.46) 1.66 FC White Cream-white Cream-white (39.68) White (55.56) Light-yellow (4.76) 1.21 FS Oblate Conical Conical (44.44) Oblate (14.29) Ovoid (6.35) Subcircular (12.70) Short cone (12.70) Long cone (9.52) 2.25 SDR No No No (61.90) Yes (38.10) 0.96 CCA Small Small Big (88.89) Medium (11.11) 0.50 FLD Medium Medium Sparse (31.75) Medium (33.33) Dense (34.92) 1.58 FLS Small Small Big (9.52) Medium (15.87) Small (74.60) 1.06 FFL Sweet-sour Sweet-sour Sweet (14.29) Sour-sweet (41.27) Sweet-sour (44.44) 1.45 FO No No No (85.71) Yes (14.29) 0.59 FT Hard-brittle Friability Friability (60.32) Hard-brittle (20.63) Spongy (6.35) Soft (12.70) 1.54 FJ Medium More Medium (46.03) More (46.03) Less (7.94) 1.32 MT: MATO; RG: Royal Gala; H′: Shannon-Weaver diversity index. The parental cultivars exhibited distinct but limited PC. Their F1 hybrids showed significant segregation in PC, producing four distinct phenotypes, with red being predominant (Table 2). FC also segregated distinctly, with three types observed, and white being the most prevalent. These results indicate polygenic inheritance of both peel and flesh pigmentation, providing breeders with predictable segregation patterns for targeted color selection.
'MATO' and 'Royal Gala' exhibited distinct fruit morphologies. Their F1 hybrids showed significant segregation in FS, resulting in six distinct morphological classes (Table 2). Quantitative analysis of FSI values revealed a predominant inheritance of the conical shape from 'Royal Gala', though with substantial variation, suggesting polygenic control.
Both parents are rust-free. Phenotypic analysis of progeny revealed segregation, with 61.90% maintaining rust-free status and 38.10% developing SDR (Table 2). Surface morphology differed: 'MATO' has smoother surfaces with medium-density, small round lenticels, while 'Royal Gala' has smooth epidermis with uniformly distributed, small lenticels. Hybrids retained smooth surfaces but showed variation in lenticel morphology, with small lenticels predominating. Lenticel density also segregated, with the dense phenotype being most common.
Both parents exhibit a sweet–sour flavor. In the hybrid population, FFL segregated significantly: 44.44% maintained the sweet–sour balance, while others showed a genetic tendency toward enhanced sweetness. Fruit odor (FO) analysis revealed that 85.71% of hybrids lacked detectable fragrance, suggesting recessive inheritance. These findings indicate partial dominance of sweetness and strong suppression of aromatic compounds.
FT analysis revealed significant textural variation, with friable texture being predominant (Table 2). Fruit juice (FJ) content showed continuous distribution, with medium and high FJ content being most prevalent, suggesting incomplete dominance for this trait.
Analysis of genetic patterns of apple fruit quantitative traits
-
Genetic model selection was based on the minimum AIC value, with the three best-fitting models (lowest AIC values) selected as candidates for each trait (Table 3). Candidate models for all 12 traits passed rigorous fitness evaluations, including uniformity tests (U12, U22, U32), Smirnov test (nW2), and Kolmogorov test (Dn), with the model having the lowest AIC value identified as optimal. Genetic architecture analysis revealed that anthocyanin content followed a one-major-gene additive (1MG-A) inheritance pattern, while the other traits (except LD) exhibited more complex genetic control through two-major-gene models: equal additive (2MG-EA), additive-dominance (2MG-AD), or additive (2MG-A) patterns, providing crucial insights into the quantitative inheritance of these characteristics.
Table 3. Candidate genetic models of fruit characters and their maximum log likelihood values and AIC values.
Trait Model MLV AIC value SFW 2MG-EA −298.2462 602.4923 2MG-A −304.7744 617.5489 2MG-AD −303.1634 618.3269 LD 0MG −191.5009 387.0018 1MG-A −191.3861 388.7721 2MG-EA −191.3871 388.7742 TD 2MG-A −179.6264 367.2528 2MG-AD −182.0884 376.1767 2MG-EA −186.3908 378.7816 FSI 2MG-EA 106.8332 −207.6664 2MG-A 106.6215 −205.2429 2MG-AD 107.7765 −203.553 FF 2MG-EA −354.9463 715.8926 1MG-A −354.9687 715.9375 2MG-AD −351.9761 715.9523 SS 2MG-AD −223.0391 458.0782 2MG-EA −234.3122 474.6244 2MG-A −233.6495 475.299 TP 2MG-EA 6.3401 −6.6802 2MG-AD 6.2536 −0.5071 0MG −0.3227 4.6453 TF 2MG-EA −32.3398 70.6797 1MG-A −32.4283 70.8565 2MG-A −31.9198 71.8397 L* value 2MG-AD −195.5202 403.0404 2MG-A −203.5801 415.1602 1MG-A −205.8905 417.7809 a* value 2MG-AD −195.324 402.6481 2MG-A −199.0068 406.0136 1MG-A −200.9154 407.8309 b* value 2MG-EA −174.2779 354.5559 2MG-AD −173.1875 358.375 1MG-A −182.5144 371.0288 Anthocyanin 1MG-A −440.5951 887.1901 2MG-AD −438.1598 888.3196 2MG-A −440.5729 889.1458 MG: Major gene; A: Additive; AD: Additive-dominant; EA: Equal additive; MLV: Log max likelihood Value; The bond digits are the best genetic models. SFW: Single fruit weight; LD: Longitudinal diameter; TD: Transverse diameter; FSI: Fruit shape index; FF: Fruit firmness; SS: Soluble sugar; TP: Total phenol; TF: Total flavonoid. Genetic parameter estimation using optimal models revealed distinct inheritance patterns (Table 4). Eleven traits exhibited positive additive effects from major genes, excluding LD, with anthocyanin content controlled by a single major gene. For SS, L*, and a* values, the first major gene showed significantly stronger additive effects than the second, indicating its dominant influence. Conversely, TD showed greater additive effects from the second major gene, highlighting its regulatory role. Negative dominant effects characterized both major genes governing SS and a* values. The da values were observed only for SFW, FSI, FF, TP, TF, and b* value, indicating that major gene A enhances phenotypic expression. These results elucidate the interplay of additive and dominant effects in shaping key apple fruit traits.
Table 4. Estimation of genetic parameters for main fruit characters as the optimal genetic model.
Trait Model da db ha hb SFW 2MG-EA 31.1795 / / / LD 0MG / / / / TD 2MG-A 1.6402 3.5504 / / FSI 2MG-EA 0.0419 / / / FF 2MG-EA 50.4602 / / / SS 2MG-AD 7.3242 3.9858 −2.697 −3.844 TP 2MG-EA 0.2098 / / / TF 2MG-EA 0.1279 / / / L* value 2MG-AD 5.9602 1.4847 0.7166 5.7453 a* value 2MG-AD 6.2488 2.6734 −0.4882 −0.1502 b* value 2MG-EA 4.0578 / / / Anthocyanin 1MG-A 330.5695 / / / da, db: Additive effect of major gene A and B; ha and hb: Dominant effect of major gene A and B. SFW: Single fruit weight; LD: Longitudinal diameter; TD: Transverse diameter; FSI: Fruit shape index; FF: Fruit firmness; SS: Soluble sugar; TP: Total phenol; TF: Total flavonoid. Comprehensive evaluation of fruit traits in 'MATO' × 'Royal Gala' F1 hybrids
-
Principal component analysis (PCA) of the F1 hybrid population identified eight principal components (PCs) with eigenvalues > 1, accounting for a cumulative variance of 73.43% (Table 5). PC1 (eigenvalue = 5.28, 21.99%) was strongly associated with a* value and anthocyanin content. PC2 (12.21%) primarily represented fruit size traits (SFW, LD, and TD). PC3 (9.96%) showed high loading for TP. PC4 (7.64%) demonstrated a negative correlation with FLD. PC5 (6.30%) was dominated by PC. PC6 (5.37%) was primarily determined by FS. PC7 (5.30%) showed a strong positive correlation with SS. PC8 (4.85%) exhibited a large positive coefficient with FT. This multivariate analysis reveals the underlying structure of covariation of fruit qualitative traits, identifying distinct yet interrelated phenotypic modules governing appearance, texture, and biochemical composition.
Table 5. Principal component analysis of fruit traits in the F1 hybrids derived from 'MATO' × 'Royal Gala'.
Traits Eigenvector of principal component PC1 PC2 PC3 PC4 PC5 PC6 PC7 PC8 SFW −0.63 0.62 0.34 0.08 0.11 0.01 −0.08 0.01 LD −0.43 0.59 0.55 0.24 0.18 −0.13 0.08 −0.05 TD −0.69 0.58 0.25 0.06 0.07 0.05 −0.10 0.05 FSI 0.36 0.08 0.47 0.28 0.18 −0.30 0.28 −0.17 FF 0.21 −0.51 0.14 −0.41 0.26 0.03 0.01 0.03 SS 0.06 −0.32 0.01 −0.17 0.54 −0.21 0.52 0.08 TP −0.11 −0.50 0.62 0.07 0.00 0.28 −0.21 −0.40 TF 0.20 −0.56 0.50 0.31 0.18 0.25 −0.13 −0.27 L* value −0.78 −0.32 −0.23 0.25 0.07 −0.04 0.03 −0.03 a* value 0.88 0.28 0.11 −0.08 0.06 0.14 −0.07 −0.03 b* value −0.78 −0.34 −0.20 −0.05 0.13 −0.04 0.24 0.02 Anthocyanin 0.82 0.28 0.08 −0.16 −0.08 −0.02 −0.03 0.14 FMP 0.39 −0.23 0.02 0.43 −0.28 −0.12 0.30 0.08 PC 0.02 0.35 −0.23 0.02 0.56 0.46 0.13 −0.07 FC 0.38 −0.18 −0.14 0.47 0.03 0.26 −0.38 0.39 FS 0.20 −0.23 0.14 −0.12 0.20 −0.57 −0.29 −0.16 SDR 0.72 0.13 0.02 0.17 0.27 0.02 0.23 0.24 CCA 0.38 0.43 −0.09 −0.34 0.20 0.12 −0.04 −0.27 FLD 0.12 0.09 0.03 −0.65 −0.31 −0.03 0.01 −0.29 FLS 0.46 0.13 0.06 0.32 0.03 −0.06 −0.04 −0.17 FFL 0.11 0.15 0.43 0.08 −0.52 −0.11 0.33 0.06 FO 0.06 −0.03 0.27 −0.15 0.31 −0.39 −0.43 0.36 FT −0.31 −0.16 0.46 −0.28 −0.07 0.03 −0.06 0.46 FJ −0.02 −0.19 0.59 −0.34 −0.05 0.42 0.23 0.31 Eigenvalue 5.28 2.93 2.39 1.83 1.51 1.29 1.23 1.16 Contribution rate (%) 21.99 12.21 9.96 7.64 6.30 5.37 5.11 4.85 Cumulative contribution rate (%) 21.99 34.21 44.17 51.81 58.10 63.47 68.58 73.43 SFW: Single fruit weight; LD: Longitudinal diameter; TD: Transverse diameter; FSI: Fruit shape index; FF: Fruit firmness; SS: Soluble sugar; TP: Total phenol; TF: Total flavonoid.; FMP: Fruit maturity period; PC: Peel color; FC: Flesh color; FS: Fruit shape; SDR: Stem depression rust; CCA: Color covering area; FLD: Fruit lenticel density; FLS: Fruit lenticel size; FFL: Fruit flavor; FO: Fruit odor; FT: Flesh texture; FJ: Fruit juice. A multivariate evaluation model was developed for the F1 hybrid population by incorporating the relative contribution rates of the eight PCs as weighted coefficients: F = 0.300F1 + 0.166F2 + 0.136F3 + 0.104F4 + 0.086F5 + 0.073F6 + 0.070F7 + 0.066F8. After standardizing fruit trait data for each hybrid, comprehensive scores were calculated (Fig. 3, Supplementary Table S1).
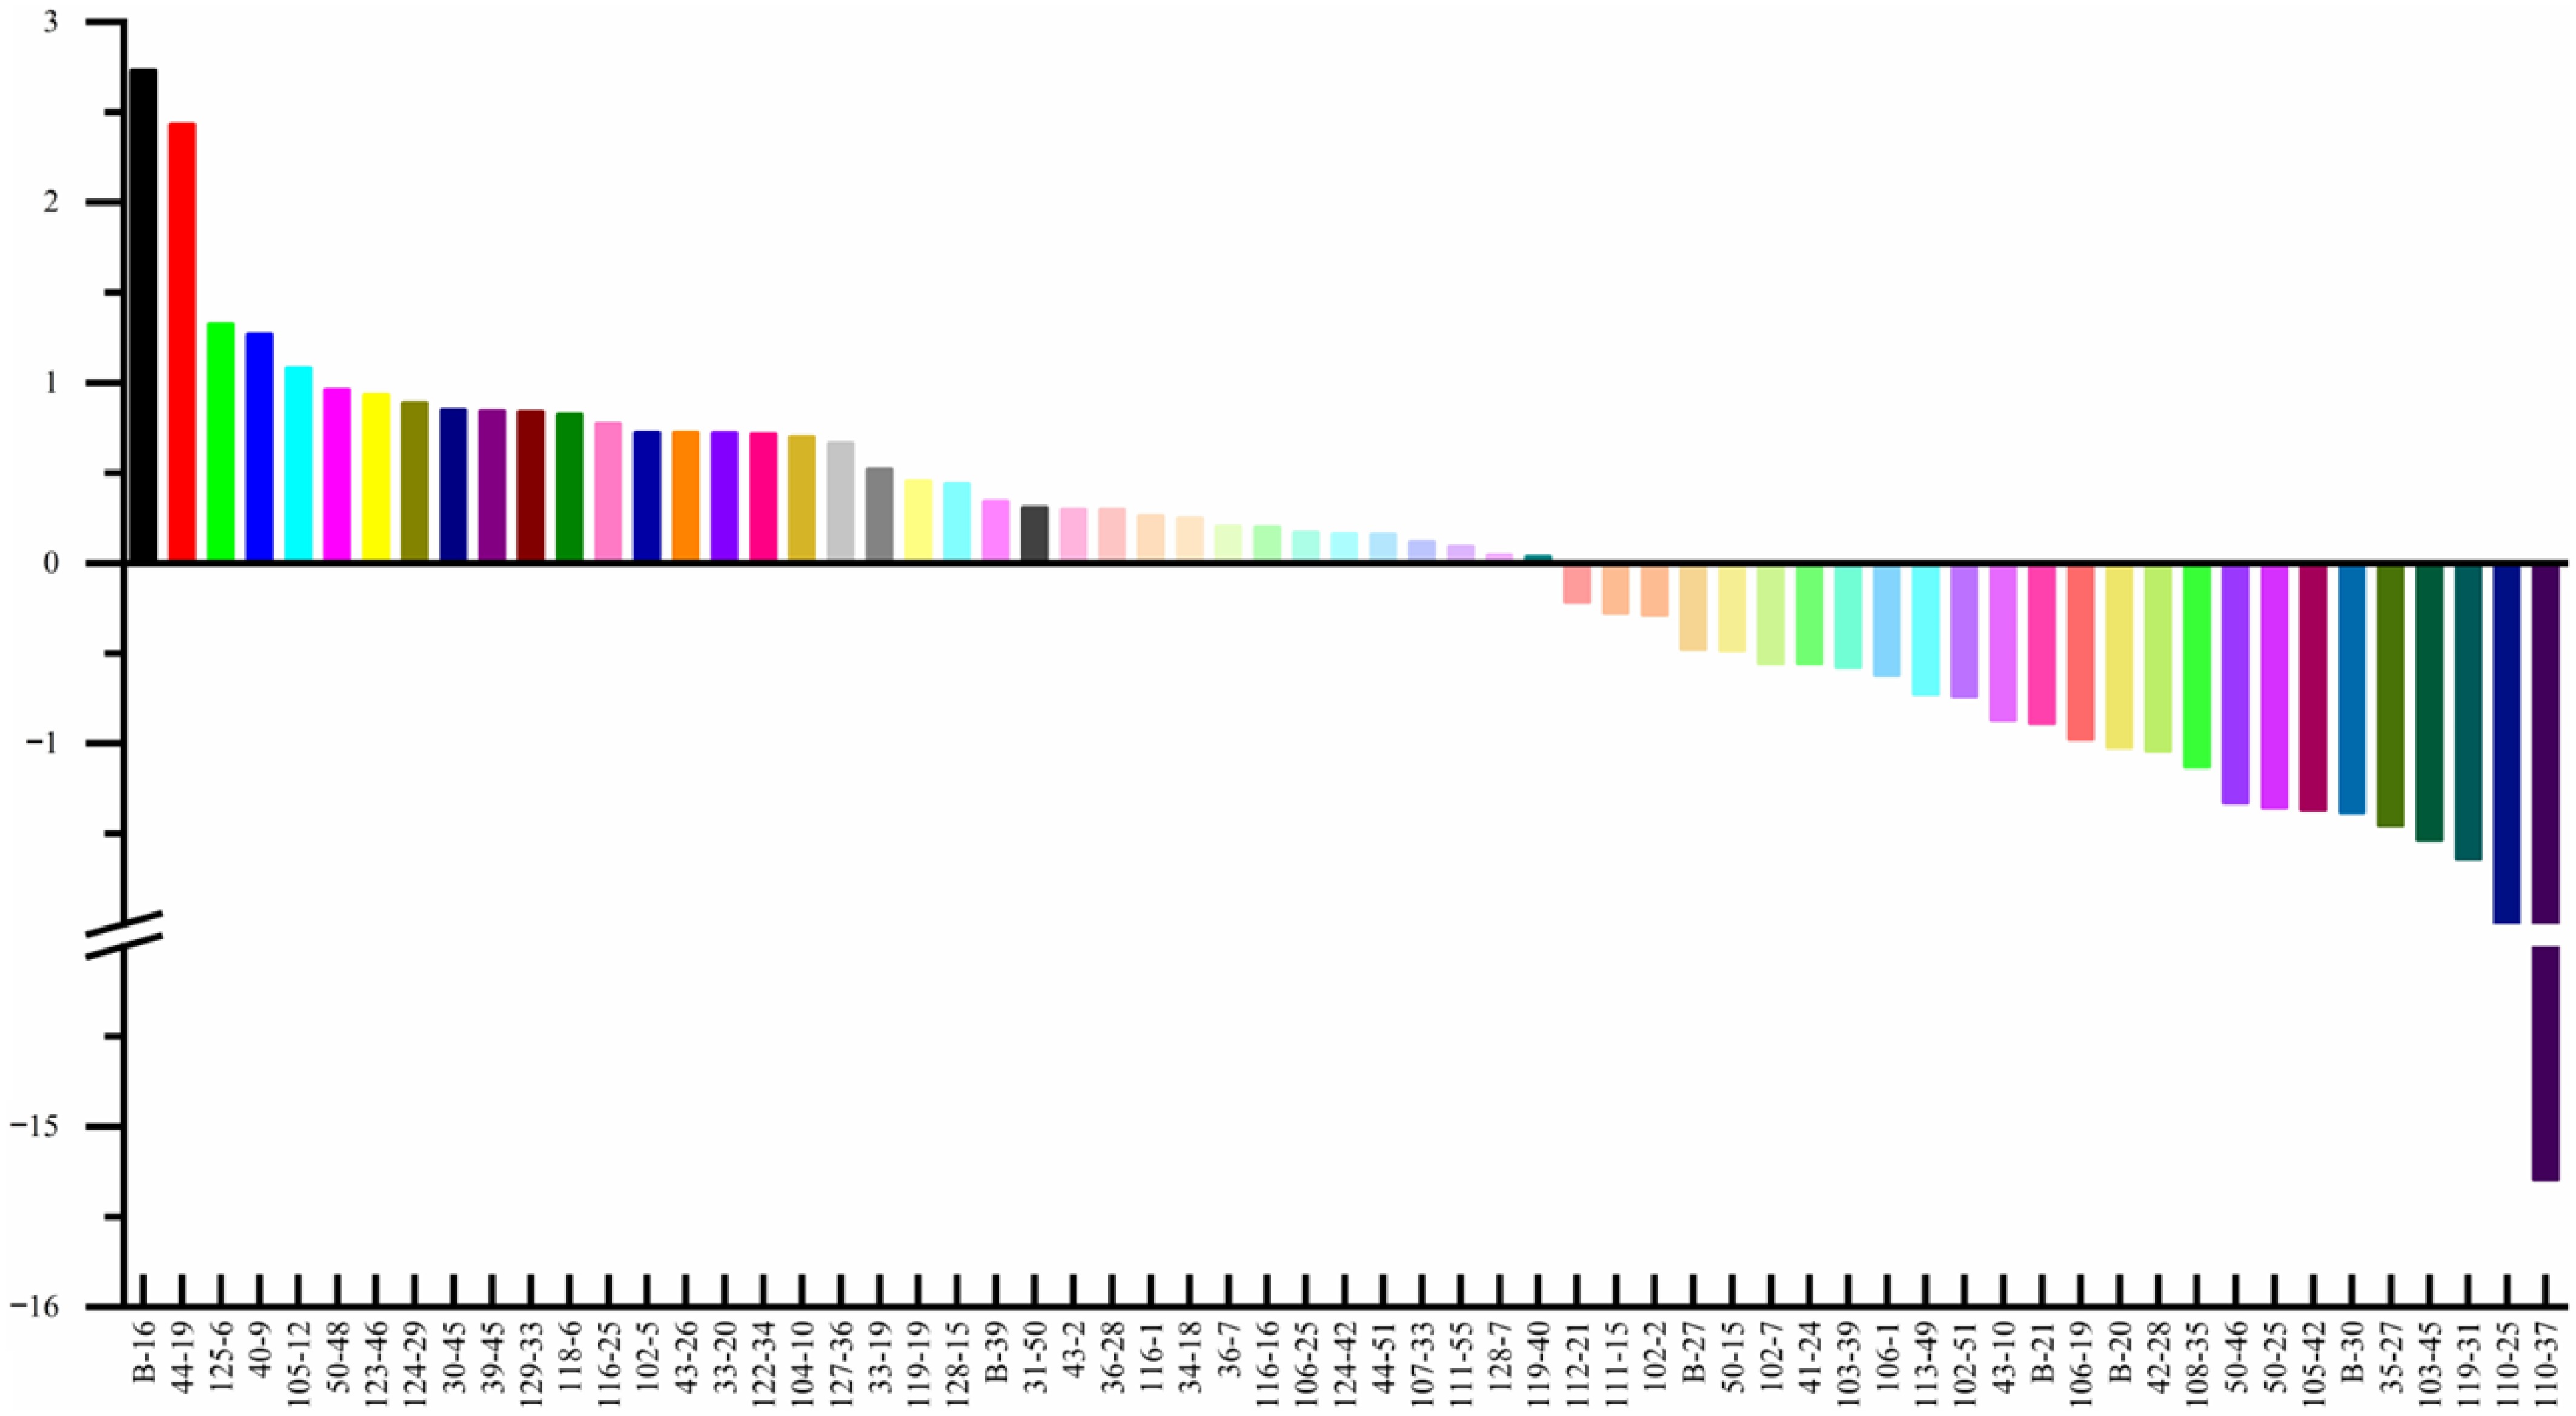
Figure 3.
Ranking of each hybrid derived from 'MATO' × 'Royal Gala' F1 population. The horizontal coordinate is the hybrid number, and the vertical coordinate is the principal components score.
Ten elite hybrids were selected from 'MATO' × 'Royal Gala' F1 population
-
Using the established selection framework, comprehensive scores were calculated for each hybrid. Combining field observations and cultivation performance, ten elite individuals exhibiting superior phenotypic performance across quality parameters were identified (Table 6). Among these, '40-9', officially termed 'Luli', has obtained the National Forest Tree Variety Registration and Certification (No.: National S-SV-MD-009-2023). All ten hybrids exhibited higher FSI, FF, anthocyanin content, and a* value than either parent, with PC ranging from red to purple-red. All selected hybrids had lower L* and b* values than the parental lines. Three genotypes (40-9, 124-29, and 30-45) had higher SFW. Enhanced SS was observed in four hybrids (B-16, 125-6, 40-9, and 105-12). TP content was superior in eight hybrids (excluding 50-48 and 124-29). Regarding TF content, eight hybrids exceeded 'Royal Gala'. These high-performing recombinants exhibited optimal combinations of size, color, biochemical composition, and texture, making them prime candidates for advanced selection and cultivar development.
Table 6. Fruit traits of the 10 selected hybrids from 'MATO' × 'Royal Gala' F1 population.
Traits Parents Progenies MT RG B-16 44-19 125-6 40-9 105-12 50-48 123-46 124-29 30-45 39-45 SFW (g) 145.00 ± 31.82 146.20 ± 15.27 145.35 ± 36.83 110.76 ± 9.17 131.18 ± 16.26 156.12 ± 26.66 120.36 ± 16.40 142.16 ± 11.67 119.89 ± 16.01 170.58 ± 30.3 184.67 ± 13.80 88.40 ± 8.55 LD (mm) 59.40 ± 4.06 61.42 ± 2.70 64.58 ± 6.46 56.33 ± 3.17 59.26 ± 2.26 65.13 ± 2.69 59.71 ± 2.98 63.41 ± 2.40 60.12 ± 4.31 67.46 ± 4.87 67.87 ± 2.56 53.61 ± 2.03 TD (mm) 67.98 ± 4.40 68.73 ± 2.88 68.97 ± 6.12 62.87 ± 1.84 65.67 ± 3.08 68.34 ± 4.64 63.31 ± 3.58 66.83 ± 1.67 63.87 ± 3.09 69.68 ± 3.43 74.32 ± 2.74 58.68 ± 2.03 FSI 0.87 ± 0.04 0.89 ± 0.04 0.94 ± 0.03 0.90 ± 0.04 0.90 ± 0.05 0.95 ± 0.04 0.94 ± 0.05 0.95 ± 0.04 0.94 ± 0.05 0.97 ± 0.04 0.91 ± 0.03 0.91 ± 0.03 FF (g) 217.32 ± 41.23 261.16 ± 47.01 409.08 ± 57.08 330.27 ± 70.23 252.24 ± 29.52 359.17 ± 50.81 354.26 ± 56.52 310.30 ± 35.65 404.00 ± 71.79 379.56 ± 42.43 272.98 ± 43.32 280.92 ± 36.56 SS (mg·g−1) 106.39 ± 3.97 91.59 ± 2.33 112.12 ± 10.32 105.95 ± 10.65 117.77 ± 7.97 122.12 ± 4.97 108.84 ± 12.86 95.30 ± 14.71 98.02 ± 6.11 96.48 ± 4.89 98.82 ± 2.78 89.94 ± 2.11 TP (mg·g−1) 0.52 ± 0.11 0.50 ± 0.08 0.85 ± 0.10 0.55 ± 0.09 0.54 ± 0.06 0.67 ± 0.09 0.74 ± 0.27 0.33 ± 0.04 0.79 ± 0.10 0.44 ± 0.06 0.61 ± 0.07 0.64 ± 0.08 TF (mg·g−1) 1.36 ± 0.12 0.78 ± 0.12 1.72 ± 0.13 0.97 ± 0.11 1.56 ± 0.09 1.21 ± 0.11 1.78 ± 0.54 0.64 ± 0.06 1.35 ± 0.20 0.66 ± 0.13 1.43 ± 0.07 1.14 ± 0.09 L* value 68.85 ± 2.52 73.65 ± 2.88 55.83 ± 12.91 54.62 ± 11.57 44.30±9.94 43.41 ± 11.07 48.26 ± 10.96 56.35 ± 11.62 48.98 ± 10.51 53.86 ± 11.58 56.70 ± 12.84 52.14 ± 12.47 a* value −6.80 ± 6.59 −1.20 ± 5.20 24.69 ± 12.34 23.92 ± 9.48 26.85 ± 6.45 25.29 ± 7.02 26.00 ± 8.34 21.54 ± 8.06 26.77 ± 8.48 23.09 ± 9.53 24.47 ± 14.27 25.71 ± 9.61 b* value 39.00 ± 4.83 33.43 ± 3.13 19.46 ± 5.71 13.37 ± 5.70 12.69 ± 5.61 12.65 ± 7.04 12.66 ± 5.38 17.56 ± 5.36 17.36 ± 7.58 19.62 ± 6.61 17.53 ± 5.79 12.54 ± 5.52 Anthocyanin
(μg·g−1)47.65 ±
23.6133.70 ±
8.42636.83 ±
134.11612.05 ±
92.041,253.46 ±
349.971,238.07 ±
151.221,401.46 ±
102.13911.00 ±
65.181,221.55 ±
136.58809.76 ±
66.56565.72 ±
103.351,050.84 ±
242.21FMP(d) 91 112 92 110 92 110 92 96 96 110 92 92 PC Red Orange red Red Red Purple red Purple red Purple red Red Purple red Red Red Purple red FC White Cream-white White White White Cream-white White White White Cream-white White White FS Oblate Conical Long cone Conical Oblate Conical Conical Long cone Conical Ovoid Conical Subcircular SDR No No No No No No No No No No No No CCA Small Small Big Big Big Big Big Big Big Big Big Big FLD Medium Medium Sparse Dense Dense Dense Dense Sparse Medium Dense Medium Dense FLS Small Small Small Small Small Small Medium Small Small Small Small Small FFL Sweet-sour Sweet-sour Sour-sweet Sweet-sour Sweet-sour Sweet-sour Sour-sweet Sweet-sour Sweet-sour Sour-sweet Sour-sweet Sour-sweet FO No No Yes No No No No No No No No No FT Friability Friability Hard and brittle Hard and brittle Friability Friability Hard and brittle Hard and brittle Friability Hard and brittle Friability Friability FJ Medium More Medium More Medium More Medium Medium More More Medium Medium MT: MATO; RG: Royal Gala; SFW: Single fruit weight; LD: Longitudinal diameter; TD: Transverse diameter; FSI: Fruit shape index; FF: Fruit firmness; SS: Soluble sugar; TP: Total phenol; TF: Total flavonoid; FMP: Fruit maturity period; PC: Peel color; FC: Flesh color; FS: Fruit shape; SDR: Stem depression rust; CCA: Color covering area; FLD: Fruit lenticel density; FLS: Fruit lenticel size; FFL: Fruit flavor; FO: Fruit odor; FT: Flesh texture; FJ: Fruit juice. -
Plant genetics and breeding have advanced significantly in recent years[23]. Crossbreeding is a fundamental strategy for germplasm innovation and cultivar development, where systematic evaluation of fruit traits provides the theoretical basis for parental selection and hybrid design[24,25]. Fruit phenotype reflects genetic variation[26,27]. This study analyzed 12 quantitative and 12 qualitative fruit traits in 'MATO' × 'Royal Gala' F1 hybrids, revealing significant variation between parents and the progeny. The investigated traits exhibited predictable quantitative inheritance patterns, with offspring genetically inheriting parental characteristics. These findings provide a theoretical foundation for breeding superior varieties and improving fruit quality. Higher CV values indicate greater dispersion[28,29], with CV >10% indicating substantial germplasm diversity[30]. The hybrid population—grown under uniform conditions—demonstrates that large fruit size (LD, TD, and FSI) reflects good genetic potential[31]. The 'MATO' × 'Royal Gala' F1 population exhibited particularly high anthocyanin variability, with other quantitative traits showing moderate-to-high diversity (10.04–36.20%), except LD, TD, and FSI (CV < 10%). Parental selection is critical in breeding; crosses can be complementary or transgressive, where progeny outperform both parents[32]. In this study, high Hb2 values indicate that using 'MATO' and 'Royal Gala' as parents generates significant genetic variation, enhancing breeding potential for targeted quality traits. These findings highlight substantial diversity and breeding promise, supporting germplasm development and optimizing cross directions in apple breeding.
Qualitative fruit traits significantly influence consumer perception, especially visual appeal[7,33]. In this study, nine traits—PC, FC, FS, SDR, FLS, FFL, FO, FT, and FJ—showed high phenotypic conservation, suggesting stable inheritance. Apple ripening is a quantitative trait controlled by multiple genes[34]. One major-effect QTL associated with fruit ripening was located in LG3 (LOD = 4.7) using 'Fiesta' × 'Discovery' hybrid populations. Future research indicated that the QTL originated from the early ripening parent 'Discovery' and explained 16% of the phenotypic variability[35]. Notably, FMP in this study showed pronounced paternal influence, supporting the strategic use of early-maturing paternal lines to improve breeding efficiency for precocious cultivars. These segregation patterns serve as valuable markers for parental selection and predictive breeding.
Inheritance patterns of major fruit traits in 'MATO' × 'Royal Gala' F1 population
-
Apple, a highly heterozygous perennial with complex genetics, exhibits extensive segregation in F1 progeny, resembling F2 generations of inbred crops due to outcrossing. Liu et al.[36,37] studied fruit qualitative traits in 'Fuji' hybrids, showing that fruit weight, total sugar, and soluble solids are polygenic quantitative traits. Nearly 100 QTLs for apple fruit weight have been reported (LOD: 2.97–10.98), distributed across nearly all 17 chromosomes[35,38−41]. FS is a quantitative trait controlled by minor polygenes. Brown[42] observed that the fruit shape index was close to the parental median value. Previous studies have shown that the fruit shape index of the apple is a quantitative trait controlled by five pairs of genes[43]. Sugar content, a key flavor indicator, is a quantitative trait governed by minor genes[44,45]. Hybrid sugar content shows normal distribution with means near the parental median, indicating additive genetic control[46]. Over 70 QTLs for sugar content have been detected across at least 15 chromosomes (LOD: 1.9–12.6)[7]. Total phenols—mainly tannins and phenolic acids—are polygenic quantitative traits. QTLs associated with phenols were located in LG1, LG8, and LG13; in 'Prima' × 'Fiesta' hybrids, 33 metabolite QTLs for peel phenolics and 17 for flesh phenolics were found on LG16[47]. Red pigmentation of apple fruit is primarily due to anthocyanins, which are color-producing secondary metabolites accumulating in plant tissues[48]. The major gene MdMYB1 was the first gene identified to control the presence or absence of red pigmentation in the peel[49]. Comparative genomics revealed a gypsy-like long terminal repeat retrotransposon inserted 3,297 bp upstream of MdMYB1, activating its expression and controlling peel redness[50]. In this study, the single segregation generation (F2) model within the mixed major gene plus polygene inheritance system was used. The results showed that anthocyanin content is controlled solely by additive major gene effects, while other traits exhibited both additive and dominant effects, suggesting exploitable heterosis. Although single-generation analysis limits the distinction between polygenic and environmental effects, major gene identification provides critical insights into genetic control. These findings support future molecular mapping and precision breeding.
Rich diversity of fruit traits in 'MATO' × 'Royal Gala' F1 population
-
SWDI, a robust measure of phenotypic richness and evenness, is widely used in trait diversity assessment[51,52]. In sugarcane, 11 traits in 135 F1 hybrids from the cross of 'Yacheng 9446' and 'ROC22' were evaluated and statistically analyzed. The H′ of the traits ranged from 2.64 to 2.98, with an average value of 2.89, indicating that the trait diversity was high after the cross of 'Yacheng 9446' and 'ROC22' and may generate phenotypically overdominant to traits in the parents' progeny[53]. In brinjal, H′ values for all traits ranged from 0.27 for fruit curvature to 1.67 for fruit length-to-breadth ratio. A high H', with an average value of 73%, was obtained, demonstrating significant diversity among the brinjal landraces. Traits such as fruit length-to-breadth ratio, leaf blade color, fruit shape, and petiole color exhibited notable variations among the genotypes[54]. In this study, statistical analysis of 63 'MATO' × 'Royal Gala' F1 hybrids revealed substantial phenotypic diversity. Quantitative traits showed high variation indices (H′ = 2.67–2.98), particularly in LD, FSI, FF, and SS, while qualitative traits exhibited broad diversity (H′ = 0.50–2.48), especially in the maturity period and FS. The population demonstrates exceptional genetic variability in key phytochemical and morphological traits, with significant breeding potential for maturity scheduling and fruit morphology improvement. These hybrids represent valuable resources for marker-assisted selection in apple breeding programs.
Selection of superior lines from 'MATO' × 'Royal Gala' F1 population
-
The development of new plant varieties is a lengthy process requiring large seedling populations for selection. Since the initiation of planned crossbreeding in China, over 300 apple varieties have been developed, more than 140 through conventional hybridization. Liu et al.[36,37] conducted research on the genetic trends of fruit appearance and internal quality traits in the hybrids from 12 combinations of 'Fuji', among which 11 combinations consisted of fewer than 50 individuals, providing guidance for cultivar selection. High-quality varieties can be selected from small populations. For example, the Zhengzhou Fruit Research Institute of the Chinese Academy of Agricultural Sciences bred 'Huashuai' ('Fuji' × 'Starkrimson') from 14 seedlings and 'Huafei' ('Huafu' × 'Golden Delicious') from 67 seedlings. Shanxi Agricultural University successfully bred 'Chixia' ('Tsugaru' × 'Senshu') from 25 seedlings[55]. In this study, fruit traits showed stable performance, ensuring reliable analysis. These findings guide superior cultivar selection and hybrid configuration.
Apple fruit quality involves complex physiological and biochemical interactions, necessitating multivariate evaluation. While individual traits offer specific insights, they fail to capture integrated quality. PCA is effective in dimensionality reduction in breeding, condensing trait correlations into interpretable components[56,57]. In Spanish apple (Malus × domestica Borkh.) grown under Ebro Valley conditions, PCA revealed the main sources of variability, with eight PCs explaining 85% of variance, informing agronomic, morphological, and fruit quality traits[31]. In oriental apple (Malus orientalis Uglitzk.), PCA showed 13 PCs accounted for 83.30% of variance, with fruit-related characters being the most effective traits for separating and identifying the studied accessions[58]. In tomato, PCA of 15 traits in 33 germplasms led to the selection of the top performers Nos 76, 137, and 97[59]. Principal component analysis of eight quality indices in 'MATO' × 'Royal Gala' hybrids explained 73.43% of total variance, enabling the construction of weighted evaluation models. After standardizing F1 trait data, comprehensive scores were calculated and ranked. Individuals with the highest scores were selected. This method has been applied in phenotyping and classification of other crops[14−18,26]. By integrating standardized trait data with field performance and market requirements, we developed integrated evaluation models and established an optimized selection protocol for hybrid progeny. Utilizing the established selection framework for apple hybrid progeny, ten superior hybrids (B-16, 44-19, 125-6, 40-9, 105-12, 50-48, 123-46, 124-29, 30-45, and 39-45) were selected. The performance of these hybrids highlights the success of integrating multivariate statistics with field evaluation and market-oriented goals, emphasizing key traits such as anthocyanin content, SS, TP, TF, and FS. The selected '40-9', registered as 'Luli', exhibits superior commercial traits, including complete bag-free red color, sweet aromatic flavor, disease resistance, extended storability, precocity, and high yield, and represents a significant breakthrough in mid-early season apple breeding. This study provides a methodological framework for multivariate selection and genetic resources for developing improved cultivars with enhanced phytochemical profiles.
-
This study conducted comprehensive genetic analyses of 24 fruit traits in 63 F1 hybrids from 'MATO' × 'Royal Gala', revealing significant transgressive inheritance. Quantitative trait evaluation showed that nine key characteristics—SFW, LD, FSI, FF, SS, TP, TF, a* value, and anthocyanin—consistently exceeded MP values. Notably, anthocyanin content, SS, TF, and TP exhibited high Hb2 and Ta, indicating strong genetic control. Qualitative traits showed 42 distinct phenotypic segregations, demonstrating abundant variation and breeding potential. To validate genetic parameter estimation, linear mixed-effects models were developed for quantitative traits, providing essential data on polygenic architecture. Based on multivariate analysis, integrated evaluation models and an optimized selection protocol were established. Using this framework, ten superior hybrids excelling in multiple quality parameters were selected. Among them, genotype '40-9' was officially released as 'Luli' (No.: National S-SV-MD-009-2023). These findings establish a solid foundation for targeted cultivar development and provide valuable insights into apple breeding programs.
This work was supported by the Key Technology Research and Development Program of Shandong Province (Grant No. 2023LZGCQY009), the Research and Innovation Program Youth Project of Shandong Institute of Pomology (Grant No. 2023GSKY02), and the Earmarked Fund for China Agriculture Research System (Grant No. CARS-27).
-
The authors confirm contributions to the paper as follows: study conception and design, draft manuscript preparation: He X, Meng Z; data collection: Meng Z, Wang W; analysis and interpretation of results: He X, Meng Z, Wang W, Zhang X, Wang S; resources: Wang H, He P, Chang Y, Wang CZ, Zheng W, Wang Y; manuscript writing and revising: He X, Wang C, Li L. All authors reviewed the results and approved the final version of the manuscript.
-
All data generated or analyzed during this study are included in this published article and its supplementary information files.
-
The authors declare that they have no conflict of interest.
-
# Authors contributed equally: Zhihao Meng, Wenhui Wang, Xu Zhang
- Supplementary Table S1 Comprehensive phenotypic evaluation of fruit traits in F1 hybrids derived from 'MATO' × 'Royal Gala'.
- Copyright: © 2026 by the author(s). Published by Maximum Academic Press, Fayetteville, GA. This article is an open access article distributed under Creative Commons Attribution License (CC BY 4.0), visit https://creativecommons.org/licenses/by/4.0/.
-
About this article
Cite this article
Meng Z, Wang W, Zhang X, Wang H, He P, et al. 2026. Genetic analysis and comprehensive evaluation of fruit traits in F1 population from 'MATO' × 'Royal Gala'. Fruit Research 6: e007 doi: 10.48130/frures-0025-0045 

Genetic analysis and comprehensive evaluation of fruit traits in F1 population from 'MATO' × 'Royal Gala'
- Received: 28 October 2025
- Revised: 25 November 2025
- Accepted: 02 December 2025
- Published online: 09 February 2026
Abstract: Comprehensive investigations into genetic predisposition, heritability, and systematic evaluation of fruit quality traits are essential for reflecting plant characteristics and achieving crop breeding objectives. However, such studies remain limited in apple. In this study, hereditary variation, genetic inheritance patterns, and comprehensive phenotypic data were analyzed for 24 fruit traits in 63 F1 hybrids derived from the cross 'MATO' × 'Royal Gala'. Values exceeded the mid-parent levels for quantitative traits, including average single fruit weight, longitudinal diameter, shape index, firmness, soluble sugar, total phenol, total flavonoid, a* value, and anthocyanin. Anthocyanin, total phenol, total flavonoid, and a* value exhibited significant heterosis, high variability, strong genetic transmissibility, and high broad-sense heritability. Among 12 qualitative traits, 42 distinct character segregations were observed, indicating substantial phenotypic variation and potential for breeding superior varieties. The F1 hybrids displayed rich diversity, with a diversity index ranging from 2.67 to 2.98 for quantitative traits, and 0.50 to 2.48 for qualitative traits. To validate the accuracy of genetic parameter estimation, linear mixed-effects models were developed for quantitative fruit traits in the F1 population, generating critical data for elucidating polygenic architecture. Based on multivariate analysis of fruit quality traits, integrated evaluation models were developed, and an optimized selection protocol was established for hybrid progeny. Using this framework, ten superior hybrids excelling in multiple quality parameters were selected. These findings provide a foundation for targeted cultivar development and offer valuable insights into postharvest trait evaluation and apple breeding programs.
-
Key words:
- MATO /
- Royal gala /
- F1 hybrids /
- Fruit traits /
- Genetic analysis /
- Comprehensive evaluation