











-
As biodiversity supports ecosystem function and resilience, extensive research has focused on identifying the ecological forces shaping diversity across spatial scales[1,2]. While ecologists have long recognized predictable shifts in species diversity along environmental gradients, much of this work has centered on plants, animals, and soil microbes[1,3−6]. As an important component of aboveground microorganisms, phyllosphere fungi, including epiphytes living on leaf surfaces and endophytes living inside leaves, are of high species diversity and have important ecological functions[7−9]. These fungal symbionts shape patterns of plant community assembly, productivity, and ecosystem stability[10−14]. In return, plants may affect the phyllosphere fungal community via specificity and supply of carbon resources from hosts[9,15,16]. Although latitudinal gradients in plant diversity are well-established, the mechanisms driving the latitudinal diversity pattern of phyllosphere fungal communities remain unclear. Therefore, understanding these microbial biogeographic patterns is essential for uncovering the forces that govern biodiversity and for enhancing our ability to predict how ecological communities will respond to climate change-driven disturbances and their ecological consequences.
The fungal diversity distribution in different ecosystems may be driven by plant and abiotic factors, such as temperature and precipitation[9,17,18]. There are many studies concerning the alpha and beta diversity distribution of soil fungi in ecosystems, and some have found various latitudinal patterns, such as a decreased[1,5,19−21], a hump-shaped[22,23], a concave[24], and no[25] latitudinal patterns of soil fungal alpha and beta diversity. However, a few studies have been conducted on the distribution pattern of phyllosphere fungal diversity[18,26−29]. For example, some studies reported a decreased latitudinal pattern of phyllosphere endophytic fungal alpha diversity in land plants[26,27] and in the savanna species Themeda triandra[18]. By contrast, a hump-shaped latitudinal pattern and an increased latitudinal pattern of phyllosphere fungal alpha diversity were found in Quercus robur (42.0–61.0° N)[29] and in Pinus sylvestris (55.0–66.5° N)[28], respectively. For beta diversity distribution, a previous study found a higher beta diversity of endophytic fungi in boreal forest (three plant species) than in temperate (three plant species) and tropical (six plant species) forests[26]. In addition, a previous study found that the alpha and beta diversity of endophytic and epiphytic fungi increased with plant species diversity in a subtropical forest[9]. These various distribution patterns may be ascribed to different energy availability caused by temperature and rainfall, distinct host specificity, or edge effect of host distribution. Generally, the high plant species diversity and favorable hydrothermal conditions in low-latitude regions may support high fungal diversity, compared with high-latitude regions. However, a comprehensive assessment of the latitudinal pattern of both alpha and beta diversity in phyllosphere epiphytic and endophytic fungal communities in forest ecosystems is still lacking.
A general framework of assembly rules reflects that species co-occurrence results from phylogeographic (speciation and migration) and ecological assembly processes[30]. Historical speciation, extinction, and migration form a regional species pool[31], which may drive local diversity patterns[4,32]. For example, previous studies have found that regional species pools affected the alpha and beta diversity patterns of plants[4,32−34] and animals[35]. By contrast, a few studies elucidated the effect of species pool on fungal diversity patterns[36,37]. For example, Chen et al.[36] found a positive correlation between regional species pool and fungal beta diversity in forest, grass, and wetland soils on a national scale, suggesting a relative contribution of species pool to fungal community assembly. However, the effect of species pool on community assembly of phyllosphere epiphytic and endophytic fungi in forest ecosystems has not been studied.
In addition to species pools, ecological processes, including deterministic and stochastic processes, play important roles in community assembly[38−40]. Most previous studies reported that deterministic processes mainly shaped community assembly of phyllosphere epiphytic or/and endophytic fungi[41−44], while some showed that stochastic processes were predominant[9,45,46]. Furthermore, the relative importance of ecological assembly processes for regulating species diversity patterns differed across various biogeographical regions and was mediated by local environmental factors, such as temperature and precipitation[47−52]. For plant communities, some studies found that environmental filtering played a more important role in temperate compared to tropical forests[47,48]. This latitudinal gradient is often attributed to increasing environmental harshness at higher latitudes strengthening deterministic filtering[53,54], whereas higher productivity at lower latitudes could increase the importance of stochastic processes, such as ecological drift and priority effect[55,56]. In contrast to the well-documented patterns in plant communities, the latitudinal patterns in fungal community assembly remain poorly understood[49,50]. For example, the relative importance of stochastic processes in soil fungal community assembly was higher in low compared to high latitudinal paddy soils, due to less environmental filtering in tropical regions[49,50]. These findings imply that deterministic processes may play a more important role in shaping phyllosphere fungal communities in high-latitude than in low-latitude regions. However, the latitudinal pattern in phyllosphere epiphytic and endophytic fungal community assembly in forest ecosystems has not been studied.
Unveiling plant-fungus interactions using ecological network analysis can enhance our understanding of the mechanisms underlying biodiversity maintenance and community stability[57,58]. In the main topological properties of a network, high modularity enhances overall network stability by confining perturbations to individual modules and preventing them from spreading to others, thereby protecting communities from secondary extinctions[59]. Nestedness and connectance, shaped by variations in climate and plant community composition[9,60], can reflect network complexity[9,61]. Many studies have been conducted on network analysis of phyllosphere epiphytic and endophytic fungi in forest[9,16,27], grassland[62], coastal[63], and mangrove[15,64] ecosystems, and some found that they were mainly characterized by high specialization and modularity, but less connectance and nestedness. Furthermore, a previous study revealed a higher specialization of plant-endophytic fungus networks in subboreal than in subtropical forests[27]. In addition, a positive relationship between the complexity of plant-epiphytic and plant-endophytic fungus networks and tree species diversity was reported in a subtropical forest[9], which may be due to more potential species interactions caused by a greater host range overlap in higher tree diversity forests. This finding suggests that the complexity of the phyllosphere fungus network is higher in low-latitude than in high-latitude regions, as plant species diversity is higher in low latitude compared with high latitude regions. However, the latitudinal pattern of the network structure of phyllosphere epiphytic and endophytic fungi in forest ecosystems has rarely been investigated.
In order to better understand the latitudinal pattern of diversity, community assembly and network structure of phyllosphere epiphytic and endophytic fungi, we examined phyllosphere fungal communities from 172 plant species spanning 21 Chinese forests (18° to 53° N) using Illumina Novaseq high-throughput sequencing techniques. We hypothesized that: (1) the alpha and beta diversity of epiphytic and endophytic fungi decrease with increasing latitude; (2) the community assembly of epiphytic and endophytic fungi is mainly shaped by deterministic processes, and the strength of deterministic processes increases with increasing latitude; and (3) the complexity of plant-epiphytic and plant-endophytic fungus networks decreases with increasing latitude in forest ecosystems.
-
This study was conducted at 21 forest sites along a latitudinal gradient in China (21.36°–53.33° N, 100.36°–130.01° E; Supplementary Fig. S1a). Leaf samples were collected from July to October 2020. At each site, we selected nine to 12 common woody plant species, and 30 healthy leaves (ca. 20 g) were collected from each of five individuals (replicates, 50 m away from each other) of each plant species. The collected leaf samples were immediately placed in sterile plastic bags, labeled, transported to the laboratory in an ice box, and stored at −80 °C until DNA extraction. In total, 1,197 leaf samples were collected from 172 plant species across 103 genera and 54 families (Supplementary Fig. S1b). Additionally, estimates of the mean annual temperature (MAT), mean annual precipitation (MAP), temperature seasonality (TS), and precipitation seasonality (PS) were obtained from the WorldClim global climate data (
www.worldclim.org ) set with a resolution of 2.5 min. Geographic coordinates (latitude and longitude) and altitude were recorded using an M-241 GPS instrument (Holux Technology Inc., Taiwan, China). Information on the plant species, geography, and climate of each site is provided in Supplementary Table S1.DNA extraction, amplicon sequencing, and bioinformatics
-
We extracted DNA of epiphytic and endophytic fungi following Yao et al.[15]. Briefly, epiphytic fungi from each leaf sample (5 g frozen leaves) were washed from leaf surfaces using sonication (45 s) and vortexing (30 s). For endophytic fungi, the surface sterilization of the above leaf samples was carried out in 75% ethanol (1 min), 3.25% sodium hypochlorite (3 min), and 75% ethanol (30 s), followed by three rinses in sterile distilled water. The DNA of the epiphytic and endophytic fungi was extracted using the modified CTAB method[15], and the DNA concentration was measured using a NanoDrop 1000 Spectrophotometer (Thermo Scientific, Wilmington, USA).
We amplified the fungal internal transcribed spacer 1 (ITS1) region of rDNA using the primer pairs ITS1F and ITS2[65] linked with 12-base barcode sequences to enable sample identification following Yao et al.[15]. The PCR products from three amplifications of each sample were pooled, purified with EZNA Gel Extraction Kit (Omega, Norcross, GA, USA), and quantified with Qubit™ dsDNA HS Assay Kit (Thermo Fisher Scientific, Waltham, MA, USA). We combined equal amounts (100 ng) of purified DNA from each sample and adjusted the mixture to 10 ng μL−1. Following the manufacturer's instructions of the VAHTS Universal DNA Library Prep Kit for Illumina V3 (Illumina, CA, USA), we added an Illumina sequencing adaptor (5′-GATCGGAAGAGCACACGTCTGAACTCCAGTCACATCACGATCTCGTATGCCGTCTTCTGCTTG-3′) to the products to construct the sequencing library. Finally, the library was sequenced on the Illlumina NovaSeq PE250 platform with NovaSeq 6000 SP Reagent Kit (500 cycles) at Shanghai Personal Biotechnology Co., Ltd (Shanghai, China).
The raw sequence data were processed using Quantitative Insights into Microbial Ecology 2 (QIIME 2)[66]. After quality filtering (requiring a quality score > 25, no ambiguous bases, with valid primer sequence or barcode sequence and length > 250 bp), the DADA2 pipeline was applied to perform denoising, dereplication, and chimeras removal[67]. The ITS1 sequences were extracted using the ITSx software package[68] and clustered into operational taxonomic units (OTUs) at a 97% sequence similarity level with VSEARCH v2.9.1[69]. For taxonomic assignment, the most abundant ITS1 sequence from each OTU (≥ 10 reads) was searched against the 'unified system for the DNA-based fungal species linked to the classification' (UNITE) database[70] using the sintax function[71] in USEARCH with a confidence cut-off (p) value of 0.65. Finally, the sequence number per sample was rarefied to the smallest sample size using the sub.sample command in MOTHUR[72]. In addition, the potential pathogenic fungi were predicted based on the FungalTraits database[73]. Information about fungi detected in the study is summarized in Supplementary Table S2.
Statistical analysis
-
All the statistical analyses were implemented in R v4.0.3, except for the network modularity analysis in the program MODULAR[74]. The alpha diversity of fungi was measured using two indices: OTU richness (the number of fungal OTUs in a sample) and Shannon's diversity index. The beta diversity of fungi, as the fungal community dissimilarities of paired samples, was measured using Bray–Curtis and Simpson dissimilarity metrics. Bray–Curtis metric, which incorporates species abundance data[75], can be confounded by variations in fungal richness[76]. To account for variation in plant species and fungal richness among sites, fungal beta diversity was calculated using the Simpson dissimilarity metric based on presence/absence data among the five replicates of the same plant species in each site using the beta.pair command in the Betapart package[77]. The gamma diversity is defined as the total number of fungal OTUs in a site, which represents the species pool. The relationships between the alpha and beta diversity of fungi and latitude were evaluated using first- and second-order polynomial regression models, with plant identity as a random factor, and model selection was performed using the Akaike Information Criterion (AIC).
We constructed plant phylogenetic trees based on the phylogeny[78] as the backbone using phylomatic-awk[79]. Pairwise patristic distances of plant phylogeny (pairwise sums of the branch lengths connecting terminal taxa) were calculated using the cophenetic.phylo command in the Ape package[80]. Principal coordinate analysis (PCoA) was used to convert the pairwise patristic distances to phylogenetic eigenvectors using the cmdscale command in the Vegan package[81]. We generated the spatial variables using Moran's eigenvector maps (MEM)[82] from the site coordinates (latitude and longitude) using the dbmem command in the Adespatial package[83]. All the environmental variables were standardized prior to subsequent statistical analyses. In order to avoid multicollinearity among the variables, we deleted the variables with the variance inflation factor (VIF) > 10.
The variation in alpha (OTU richness) and beta (Simpson dissimilarity) diversity of epiphytic and endophytic fungi was partitioned by plant identity, species pool, space, and climatic variables using the varpart command in the Vegan package. Additionally, the distance matrices of community composition (Hellinger transformation of the OTU read data) of epiphytic and endophytic fungi were constructed by calculating dissimilarities using the Bray–Curtis method. Subsequently, non-metric multidimensional scaling (NMDS) was used to visualize the community dissimilarities of epiphytic and endophytic fungi using the metaMDS command in the Vegan package. Furthermore, permutational multivariate analysis of variance (PerMANOVA) was applied to explore the effect of site on the epiphytic and endophytic fungal community compositions. The relative abundance of abundant epiphytic and endophytic fungal OTUs (> 0.2% of total fungal reads) among different sites was depicted using the pheatmap function in the Pheatmap package v1.0.8[84].
We built a structural equation model (SEM) to test for the direct and indirect effects of host plant species, climate, space, and species pool on fungal alpha and beta diversity using the PiecewiseSEM package[85]. Prior to modeling, bivariate correlations were performed among all variables to assess the suitability of a linear model, and all predictors and response variables were standardized before analyses using the z-score to interpret parameter estimates on a comparable scale. Additionally, we used Fisher's C-test (when 0.05 < p < 1.00) to confirm the goodness of the modelling results. We then modified our models according to the significance (p < 0.05) and the goodness of the model. We used plant phylogenetic eigenvectors and spatial eigenvectors to represent host plant species and space variables, respectively. For graphical simplicity, we constructed three composite variables for climate, plant phylogenetic eigenvectors, and spatial eigenvectors.
To assess the effect of species pool on beta diversity of epiphytic and endophytic fungi, we first simulated the expected relationship between beta diversity among communities that are randomly sampled from a species pool without any community assembly processes using a lognormal species abundance distribution and gamma diversity[4]. Then, we examined the correlation between the observed beta diversity and gamma diversity using Spearman's correlation. If the observed correlation is significant and consistent with the expected correlation, that indicates the species pool has an influence on beta diversity.
Furthermore, we used beta deviation based on the null model method to compare the relative importance of species pool and ecological assembly processes on fungal beta diversity. Briefly, we calculated observed beta diversity and expected beta diversity from the null model as the distance from a sample to the centroid of the group of all samples within a site (distance-to-centroid) using the betadisper function in the Vegan package. Then, beta deviation was calculated using the formula: Beta deviation = [Beta-diversityobserved − Mean (beta-diversityexpected)]/SD [beta-diversityexpected]. In addition, a one-sample t-test was used to compare mean beta deviation against zero in each site. If a mean beta deviation is statistically indistinguishable from zero, this indicates that the species pool dominates beta diversity within a site. By contrast, if a mean beta deviation is significantly different from zero, this indicates that ecological assembly processes dominate beta diversity within a site[86].
Additionally, we further assessed the relative importance of different ecological assembly processes on epiphytic and endophytic fungal community assembly using inferred community assembly mechanisms by phylogenetic bin-based null model analysis (iCAMP)[87]. We calculated the beta Net Relatedness Index (βNRI) of fungal OTUs in each bin based on a fungal phylogenetic tree (constructed from 18S + 28S rDNA sequences using the taxonomy_to_tree.pl script of Tedersoo et al.[88]) and the Raup–Crick index (RCbray) using the scripts of Chase et al.[89] and Ning et al.[87]. For each bin, heterogeneous selection was recognized as βNRI > 1.96, homogenizing selection as βNRI < −1.96, homogenizing dispersal as |βNRI| < 1.96 and RCbray < −0.95, dispersal limitation as |βNRI| < 1.96 and RCbray > 0.95, and drift or others (mostly consists of weak selection, weak dispersal, diversification, and/or drift) as |βNRI| < 1.96 and |RCbray| < 0.95. Subsequently, the relative importance of individual ecological assembly processes at the whole community level was assessed by weighting with the relative abundance of each bin. Then, the relationships between the relative importance of different ecological processes and latitude were evaluated using the lm function in the Stats package[90].
According to Toju et al.[91], we examined the architecture properties of plant-fungus networks, including the H2' metric of the network-level interaction specialization[92], the weighted connectance[93], the weighted nestedness metric based on overlap and decreasing fill (WNODF)[94], and Barber's metric of modularity[95]. Briefly, original species-level matrices were obtained from the OTU-level matrix. Randomized matrices were obtained using a shuffle-sample null model with 1,000 permutations for performing a randomization test. Based on the original and randomized species-level matrices, we calculated the weighted connectance, H2', and WNODF using the network-level command in the Bipartite package[96] and modularity using the MODULAR program[74]. The significance of the difference between observed and random network properties was examined using a two-tailed t-test at p < 0.05. To compare network properties in different forest sites and correct variances in network properties caused by species richness and number of interactions, we performed Z-score normalization for the network structure indices. The Z-score is defined as follows: Z = (Eobserved − Erandomized)/SDrandomized, where Eobserved is the observed value, Erandomized and SDrandomized are the mean value and the standard deviation of randomized matrices[97]. Then, the relationships between the structures of plant-fungus networks and latitude were evaluated using the lm function in the Stats package.
-
After quality control, 42,366,526 high-quality ITS1 sequences were obtained from 45,779,701 raw sequences and divided into 56,804 OTUs at a 97% sequence similarity level. Of these OTUs, 20,391 (36,053,961 sequences) were identified as fungi. As the fungal sequence numbers ranged from 1 to 128,780 across 2,394 samples, the sequence number was normalized to 510 (3 epiphytic samples and 103 endophytic samples with < 510 sequences excluded). The normalized dataset contained 13,187 epiphytic fungal OTUs, which mainly consisted of 9,368 Ascomycota (71.9% of total epiphytic fungal reads) and 2,920 Basidiomycota (13.0%) (Supplementary Fig. S2a). It also contained 6,146 endophytic fungal OTUs, which mostly consisted of 4,337 Ascomycota (77.9% of total endophytic fungal reads) and 1,054 Basidiomycota (13.1%) (Supplementary Fig. S2b).
Additionally, we identified 399 potential epiphytic pathogenic fungal OTUs (8.8% of total epiphytic fungal reads) and 344 potential endophytic pathogenic fungal OTUs (19.4% of total endophytic fungal reads). The potential plant pathogens were dominated by a few genera, such as Ramularia, Strelitziana, and Pseudocercospora in the epiphytic community and Colletotrichum, Ramularia, and Pseudocercospora in the endophytic community (Supplementary Fig. S3).
Latitudinal pattern of epiphytic and endophytic fungal diversity
-
The OTU richness and Shannon's diversity index of epiphytic fungi ranged from 78.5 ± 24.9 to 192.7 ± 33.6 and from 2.9 ± 0.5 to 4.5 ± 0.6 (means ± SD) in different sites, and exhibited strong quadratic relationships with latitude (Fig. 1a, b; Supplementary Table S3). Similarly, the OTU richness and Shannon's diversity index of endophytic fungi ranged from 23.2 ± 11.0 to 83.3 ± 48.9 and from 1.4 ± 0.9 to 3.2 ± 1.2 in different sites, and displayed a U-shaped pattern with latitude (Fig. 1c, d; Supplementary Table S3). The beta diversity (Bray–Curtis dissimilarity) of epiphytic and endophytic fungi showed a U-shaped latitudinal pattern (Fig. 1e, f). Similarly, the beta diversity (Simpson dissimilarity) of epiphytic and endophytic fungi fitted well with quadratic regression models after controlling for host plant species and fungal richness (Fig. 1g, h; Supplementary Table S3).
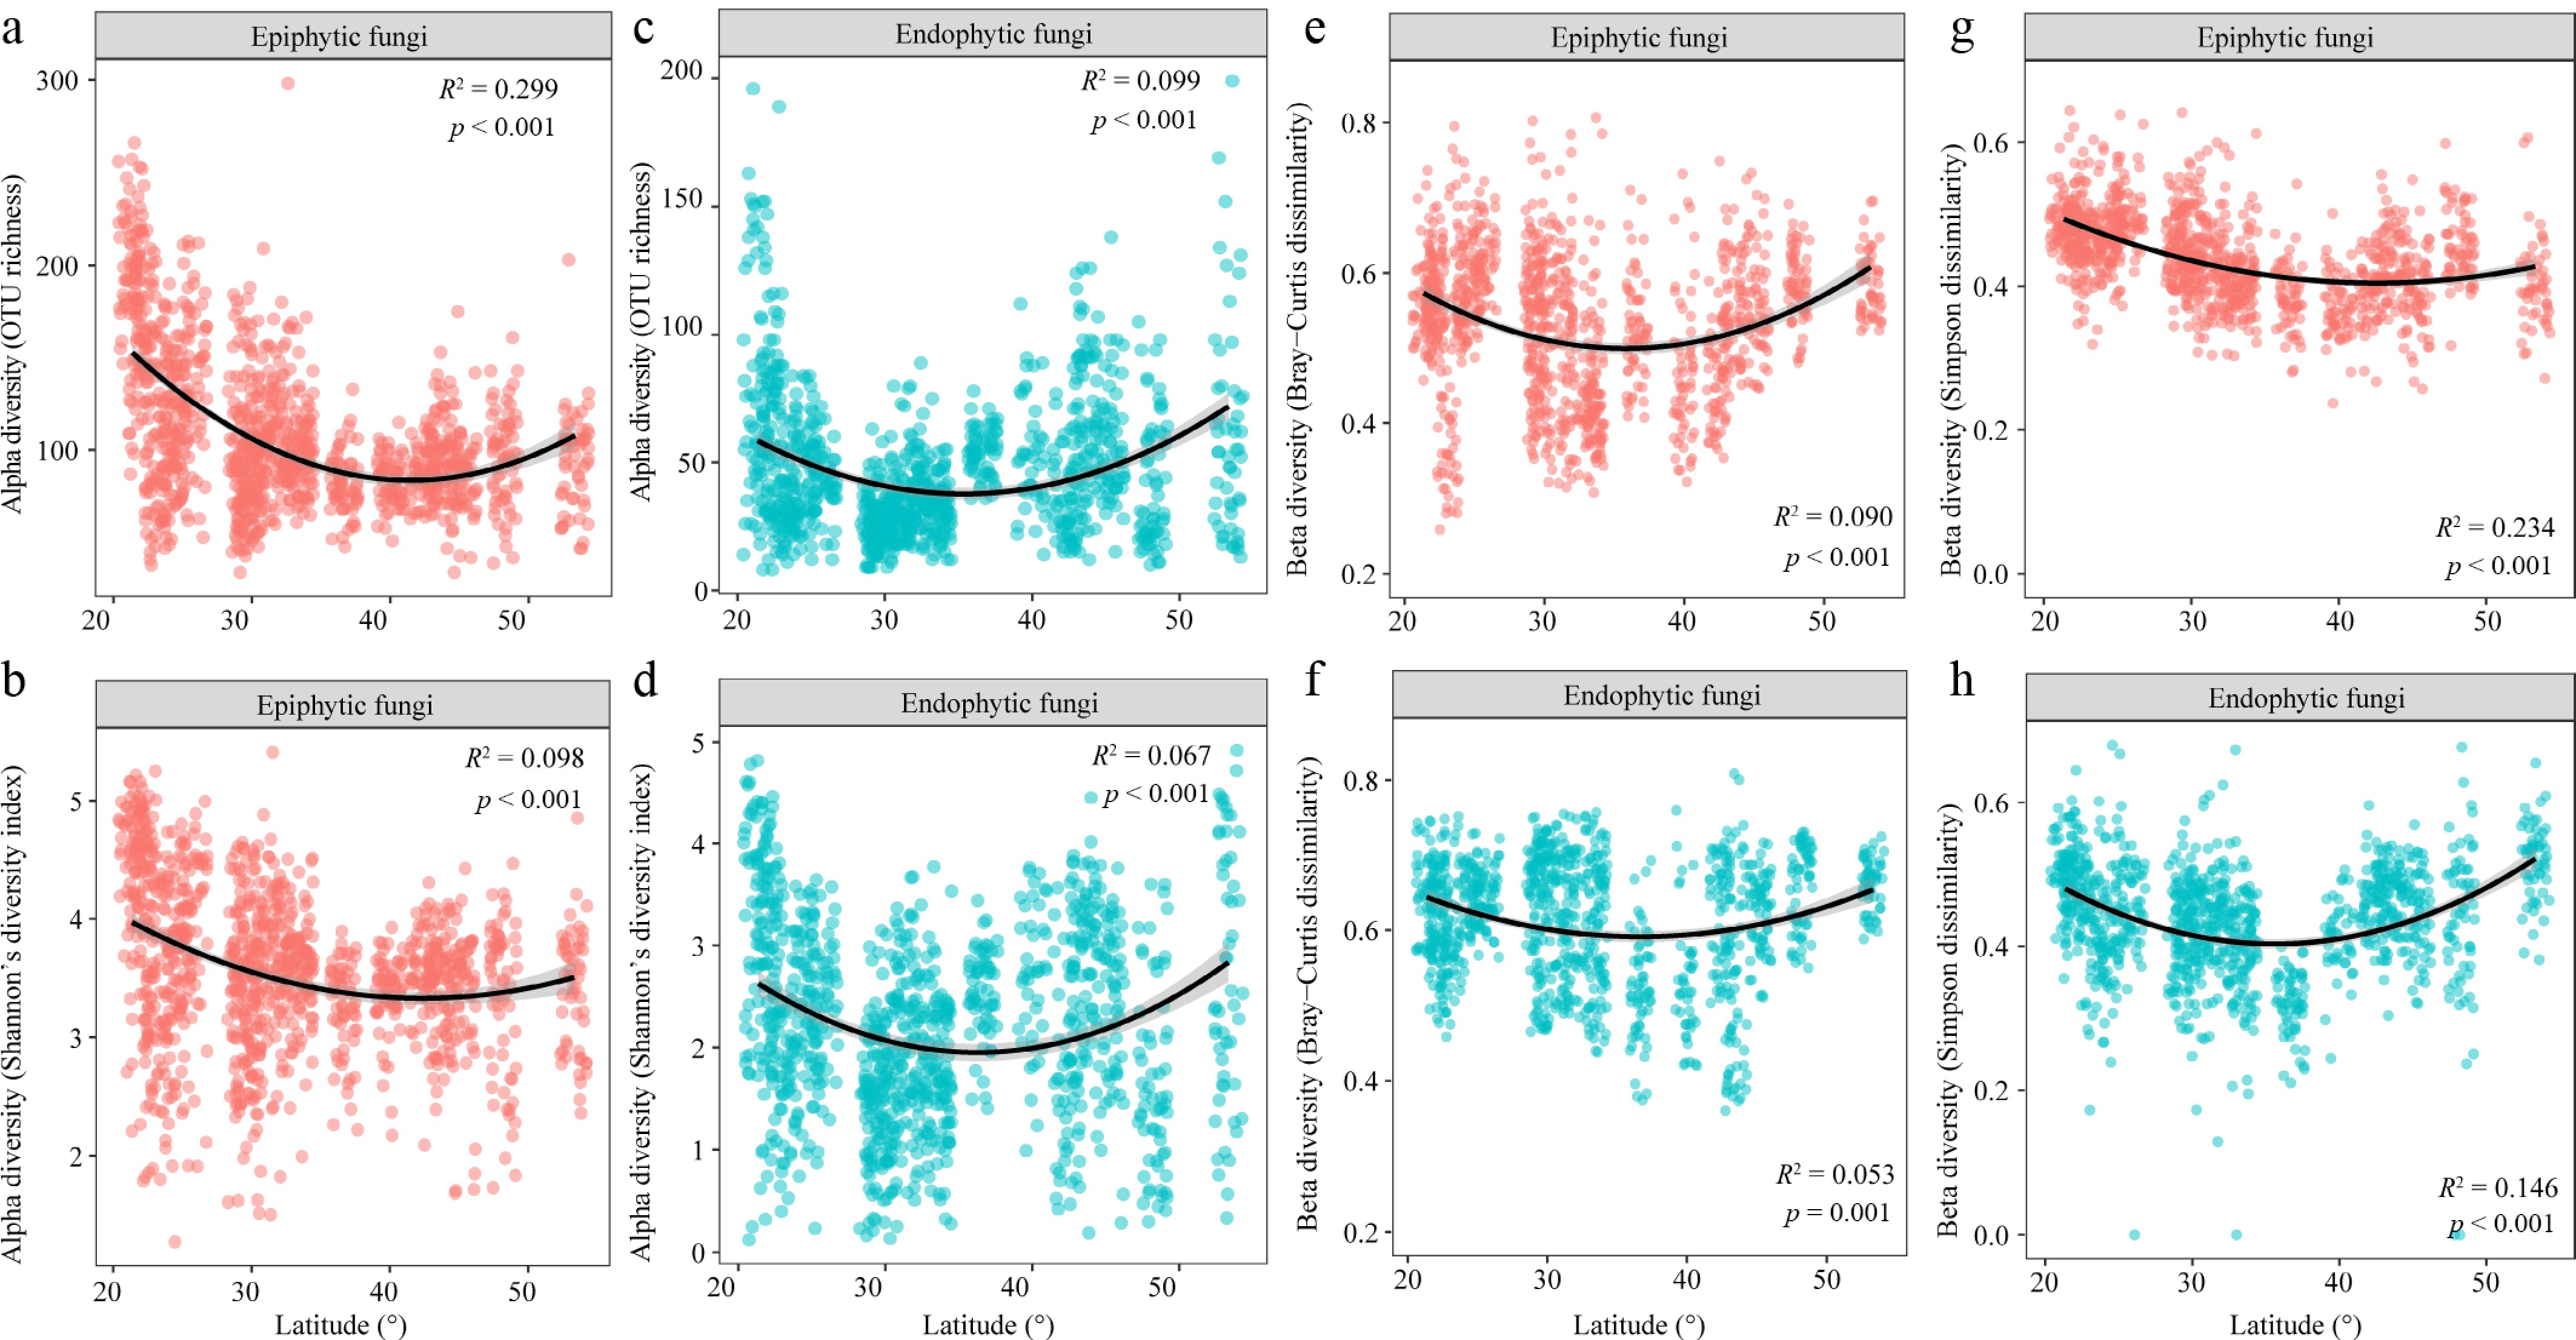
Figure 1.
Latitudinal patterns of the alpha and beta diversity of phyllosphere epiphytic and endophytic fungi.
Furthermore, the OTU richness of both epiphytic and endophytic pathogenic fungi showed a U-shaped latitudinal pattern (Supplementary Fig. S4a, b). Similarly, the beta diversity (Simpson dissimilarity) of epiphytic pathogenic fungi decreased with increasing latitude after controlling for host plant species and pathogenic fungal richness (Supplementary Fig. S4c), while that of endophytic pathogenic fungi fitted well with quadratic regression models (Supplementary Fig. S4d). Additionally, the relative abundance of potential epiphytic and endophytic pathogenic fungi decreased with increasing latitude (Supplementary Fig. S4e, f).
Variation partitioning analysis showed that 66.8% and 50.9% of the variation in epiphytic and endophytic fungal OTU richness was explained by plant identity (64.3% and 45.4%), species pool (44.0% and 27.1%), spatial distance (41.0% and 22.1%), and climatic factors (27.1% and 17.9%) (Fig. 2a, b).
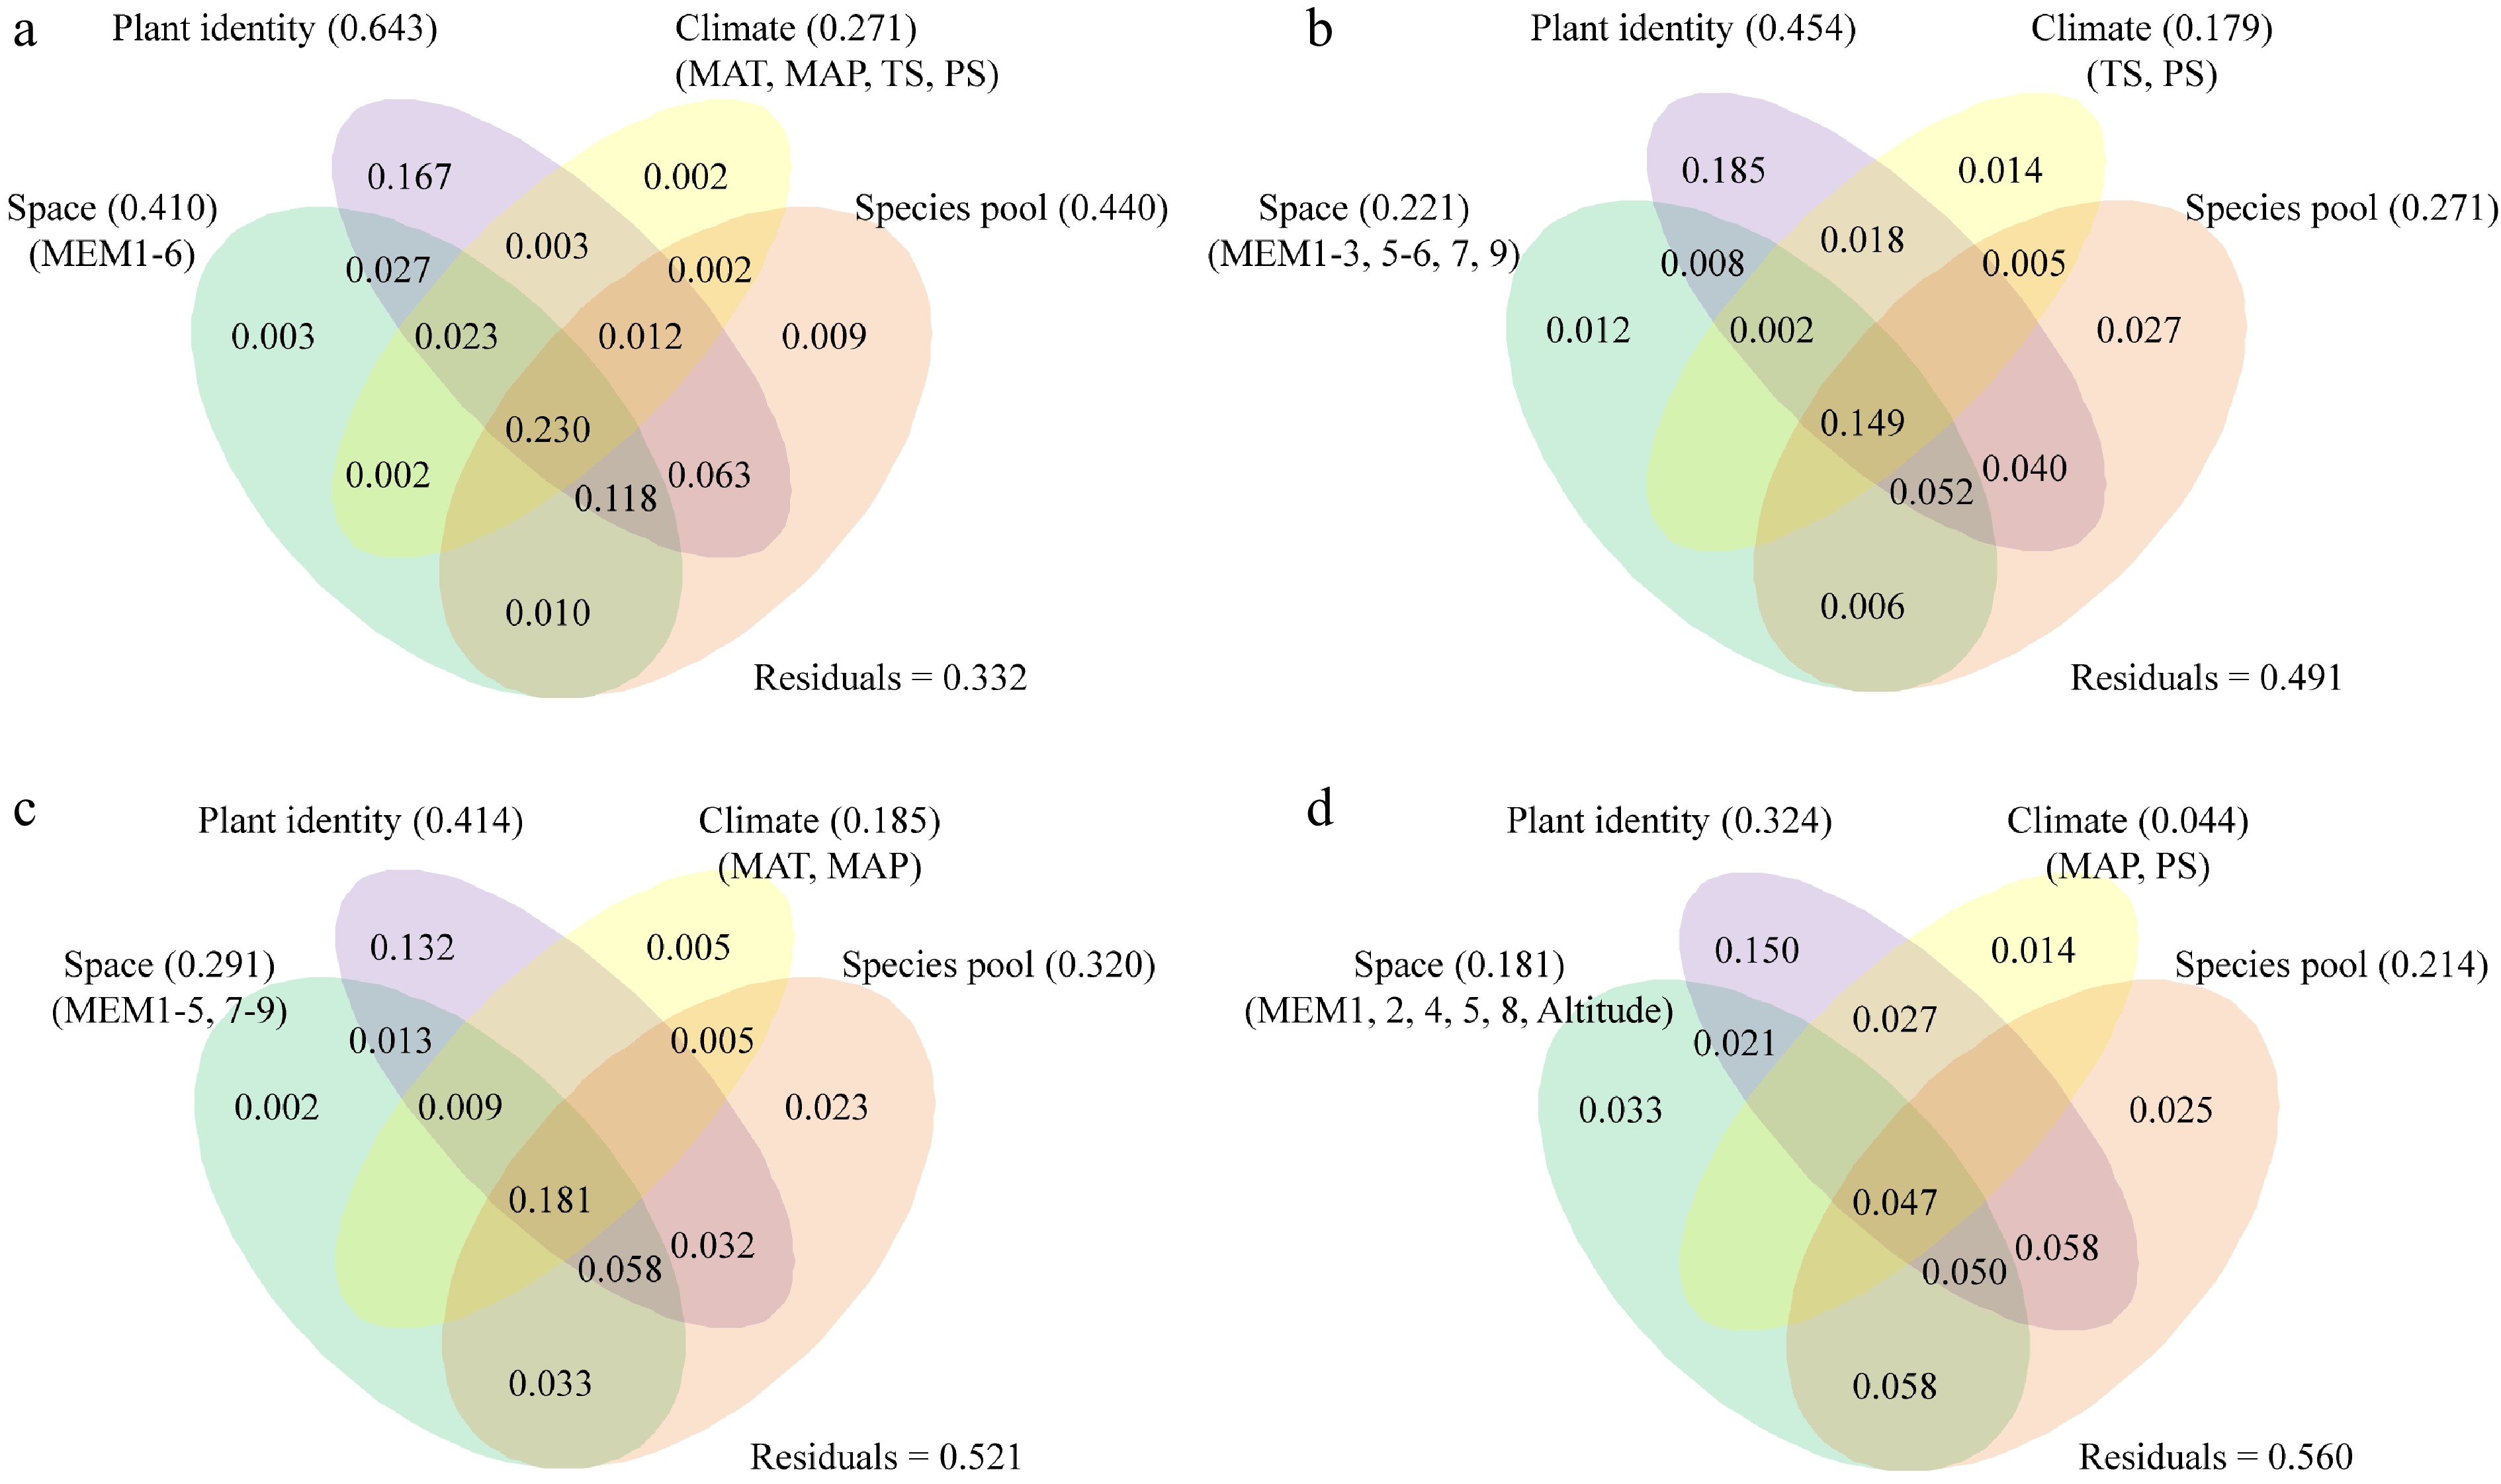
Figure 2.
Result of variation partitioning analysis showing the pure and shared effects of plant identity, species pool, space, and climatic variables on phyllosphere fungal diversity. (a) Richness of epiphytic fungal operational taxonomic units (OTUs). (b) Richness of endophytic fungal OTUs. (c) Beta diversity (Simpson dissimilarity) of epiphytic fungi. (d) Beta diversity (Simpson dissimilarity) of endophytic fungi. Numbers indicate proportions of explained variation (adjusted R2 values). MAT, mean annual temperature; MAP, mean annual precipitation; TS, Temperature seasonality; PS, precipitation seasonality; MEM, Moran's eigenvector maps.
The epiphytic fungal community was dominated by Dothideomycetes and Eurotiomycetes, and the endophytic fungal community was dominated by Dothideomycetes and Sordariomycetes at the class level, with various relative abundances among sites (Fig. 3a, b). For example, Dothideomycetes were relatively abundant in mid-latitudinal regions, but Sordariomycetes were relatively abundant in low-latitudinal regions (Fig. 3a, b). The heatmap revealed that the occurrence of some relatively abundant epiphytic and endophytic fungal OTUs was different among forest sites (Supplementary Fig. S5). For example, epiphytic fungal OTU8803 (Paraconiothyrium) occurred mainly in DLS and TYS, while OTU9678 (Ramichloridium) occurred mainly in DHS (Supplementary Fig. S5a). Endophytic fungal OTU 9698 (Pseudocercospora) occurred mainly in DHS, NG, BB, and NBH, while OTU 8803 (Paraconiothyrium) occurred mainly in DLS, TYS, and BTM (Supplementary Fig. S5b). The NMDS ordination and PERMANOVA showed that the community composition was significantly different between epiphytic and endophytic fungi (R2 = 0.042, p = 0.001; Fig. 3c). Furthermore, the site had a significant effect on the community composition of epiphytic and endophytic fungi (R2 = 0.457, p = 0.001; R2 = 0.200, p = 0.001; Fig. 3d, e). Variation partitioning analysis showed that 47.9% and 44.0% of the variation in epiphytic and endophytic fungal beta diversity was explained by plant identity (41.4% and 32.4%), species pool (32.0% and 21.4%), spatial distance (29.1% and 18.1%), and climatic factors (18.5% and 4.4%) (Fig. 2c, d).
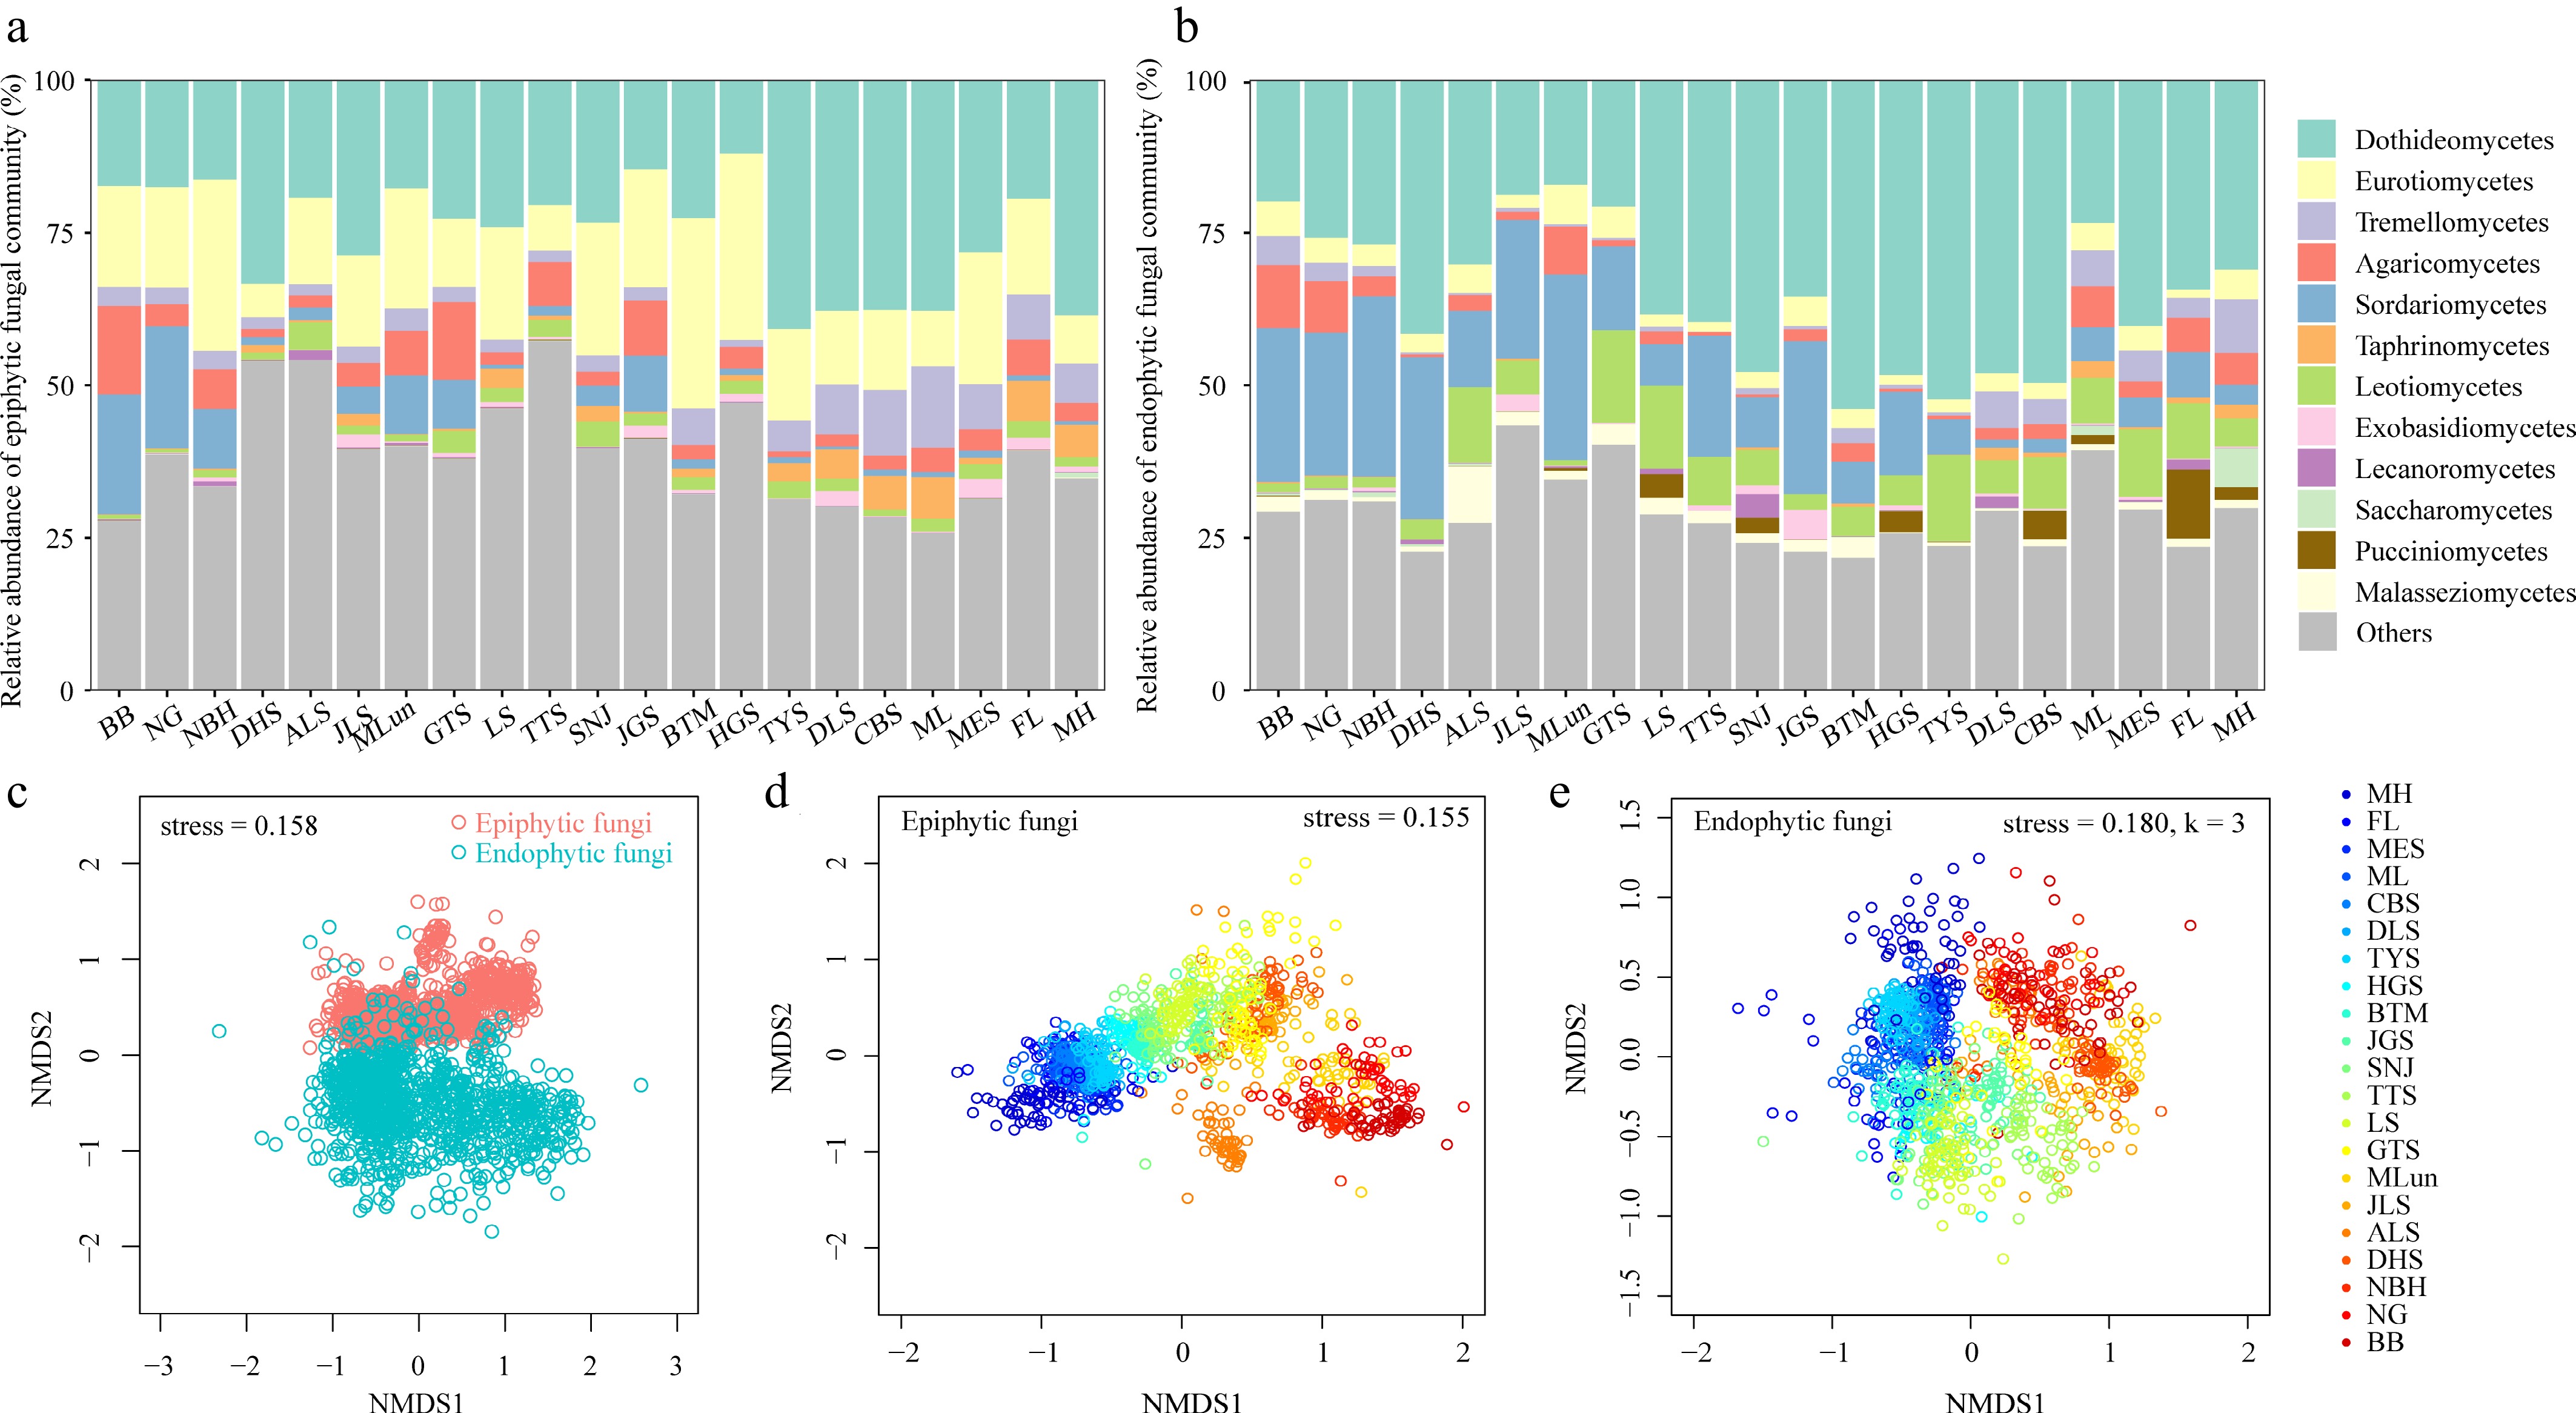
Figure 3.
Community composition of the phyllosphere epiphytic and endophytic fungi in different forest sites. Relative abundance of (a) epiphytic, and (b) endophytic fungi at the class level. (c)–(e) Non-metric multidimensional scaling (NMDS) ordination of the community composition (Bray–Curtis dissimilarity) of epiphytic and endophytic fungi in different sites. 'Others' includes the fungal classes with < 0.5% of the total epiphytic and endophytic fungal reads and operational taxonomic units unclassified to fungal class level. The sites are ranked from lowest to highest latitude. BB, Bubeng; NG, Nonggang; NBH, Nabanhe; DHS, Dinghushan; ALS, Ailaoshan; JLS, Jiulianshan; MLun, Mulun; GTS, Gutianshan; LS, Lushan; TTS, Tiantongshan; SNJ, Shennongjia; JGS, Jigongshan; BTM, Baotianman; HGS, Huangguanshan; TYS, Taiyueshan; DLS, Donglingshan; CBS, Changbaishan; ML, Muling; MES, Maoershan; FL, Fenglin; MH, Mohe.
The SEM analysis showed that the alpha diversity of epiphytic fungi was influenced by plant phylogeny, species pool, and climate directly and by plant phylogeny, space, and climate through species pool indirectly (Fig. 4a). The beta diversity of epiphytic fungi was influenced by plant phylogeny, species pool, space, and epiphytic fungal richness directly and by plant phylogeny, space, and climate through species pool and epiphytic fungal richness indirectly (Fig. 4a). The alpha diversity of endophytic fungi was influenced by plant phylogeny, species pool, and space directly and by plant phylogeny and space through species pool indirectly (Fig. 4b). The beta diversity of endophytic fungi was influenced by plant phylogeny, species pool, space, and climate directly and by plant phylogeny and space through species pool indirectly (Fig. 4b).
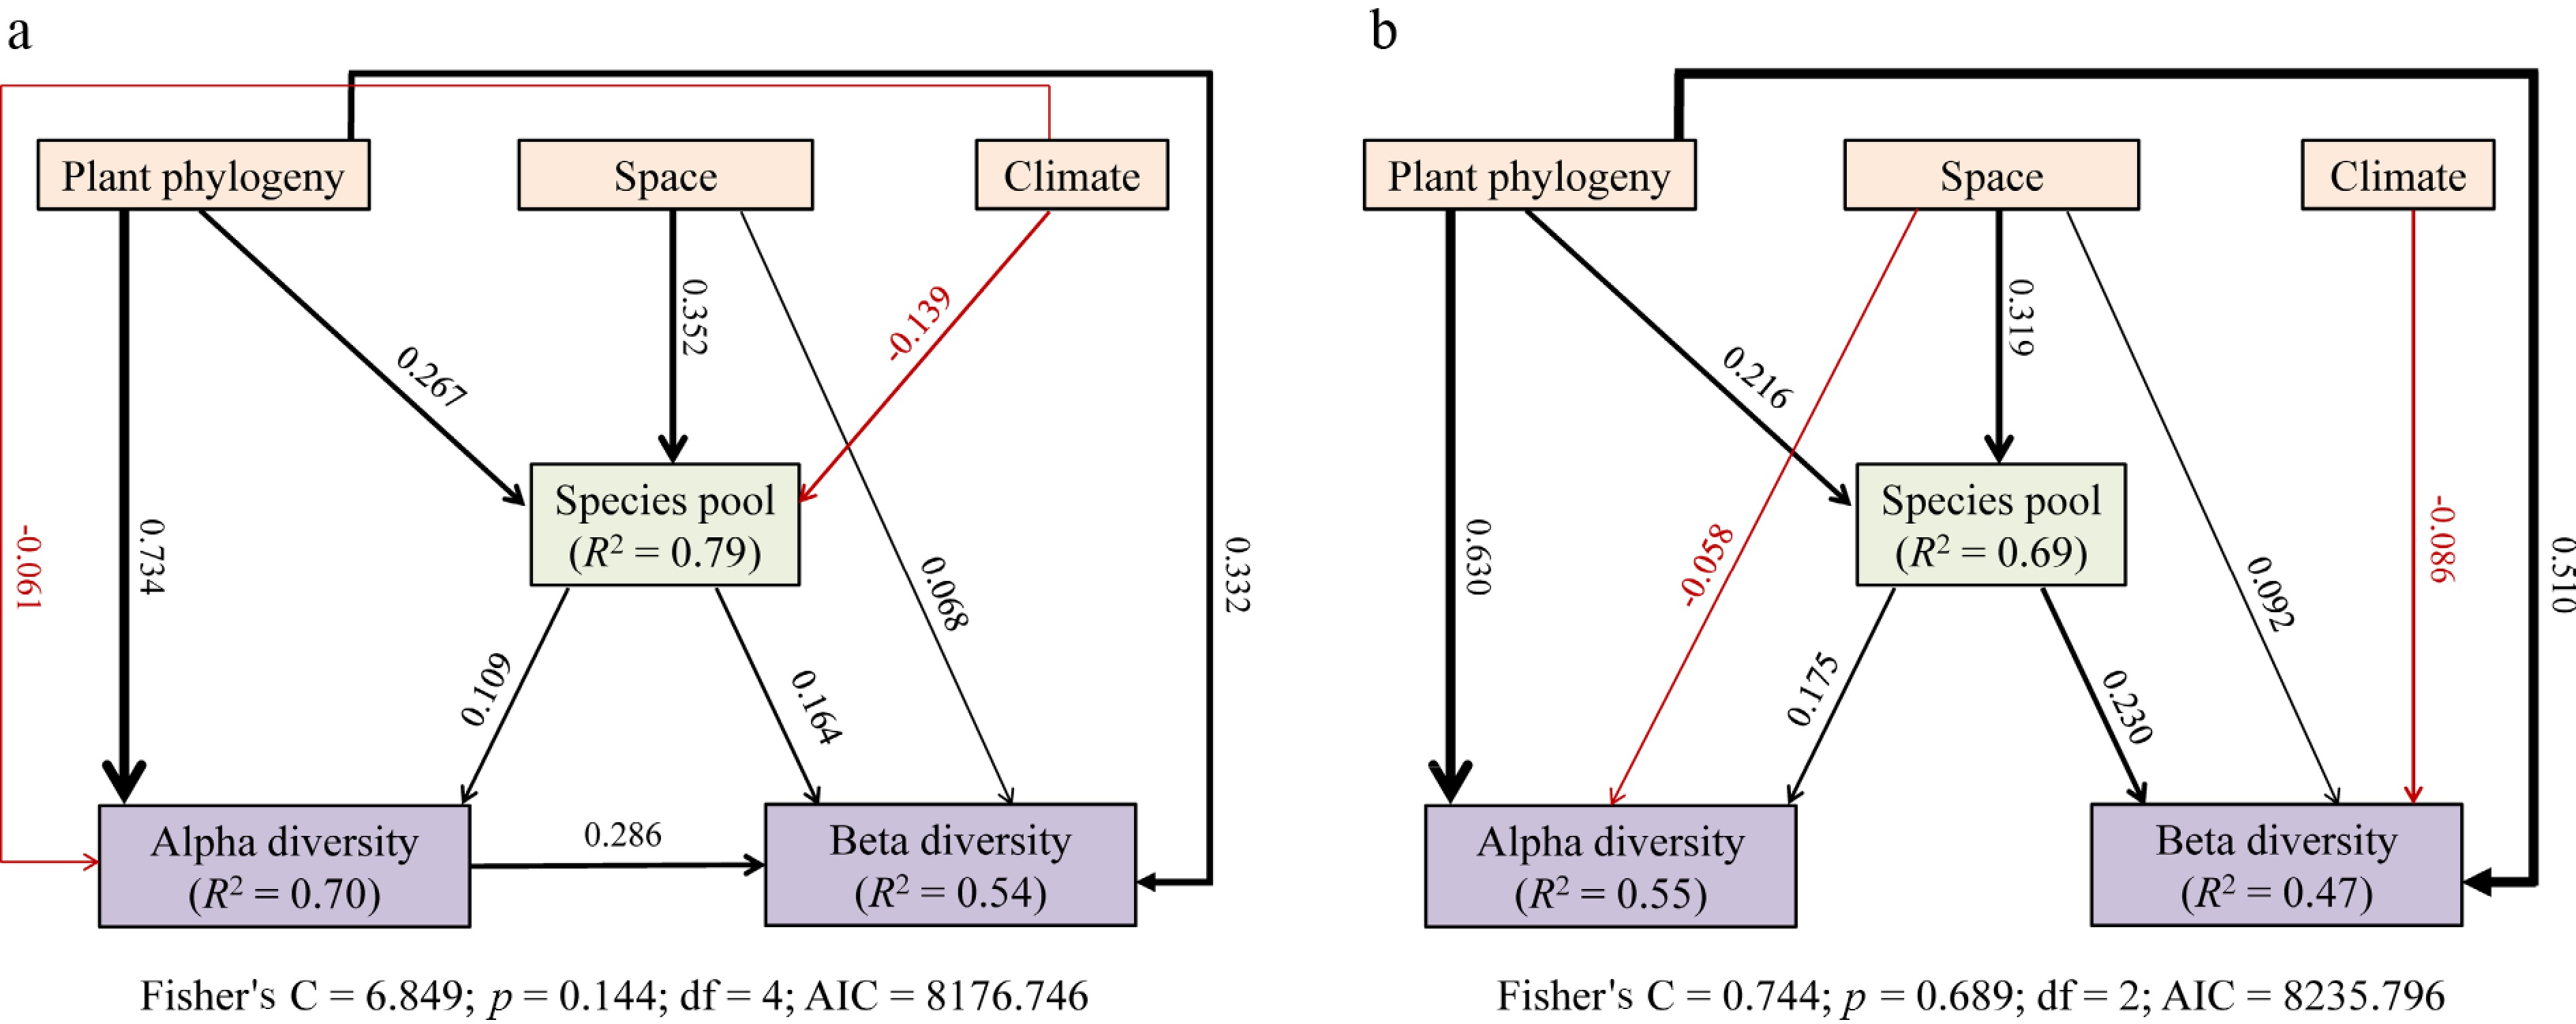
Figure 4.
Structural equation models (SEMs) showing the hypothesized relationships between plant phylogeny, species pool, space, climate, and fungal diversity. (a) Epiphytic fungi. (b) Endophytic fungi. The width of the lines represents the strength of the relationship (p < 0.05). Black and red solid lines indicate significant positive or negative correlations, respectively. Numbers above the lines indicate path coefficients. R2 is the proportion of variance explained by the model. df, degree of freedom; AIC, akaike information criterion. The detailed information of plant phylogeny, space, and climate is listed in Supplementary Table S5.
Latitudinal pattern of epiphytic and endophytic fungal community assembly
-
The results of sampling simulation using a lognormal species abundance distribution revealed that the expected beta diversity was increased with increasing gamma diversity, regardless of the number of individuals (Fig. 5a). A significant correlation between the observed beta and gamma diversity of epiphytic and endophytic fungi was found and was consistent with the expected pattern (Fig. 5b, c). These results indicated that the species pool had an effect on the beta diversity of epiphytic and endophytic fungi.
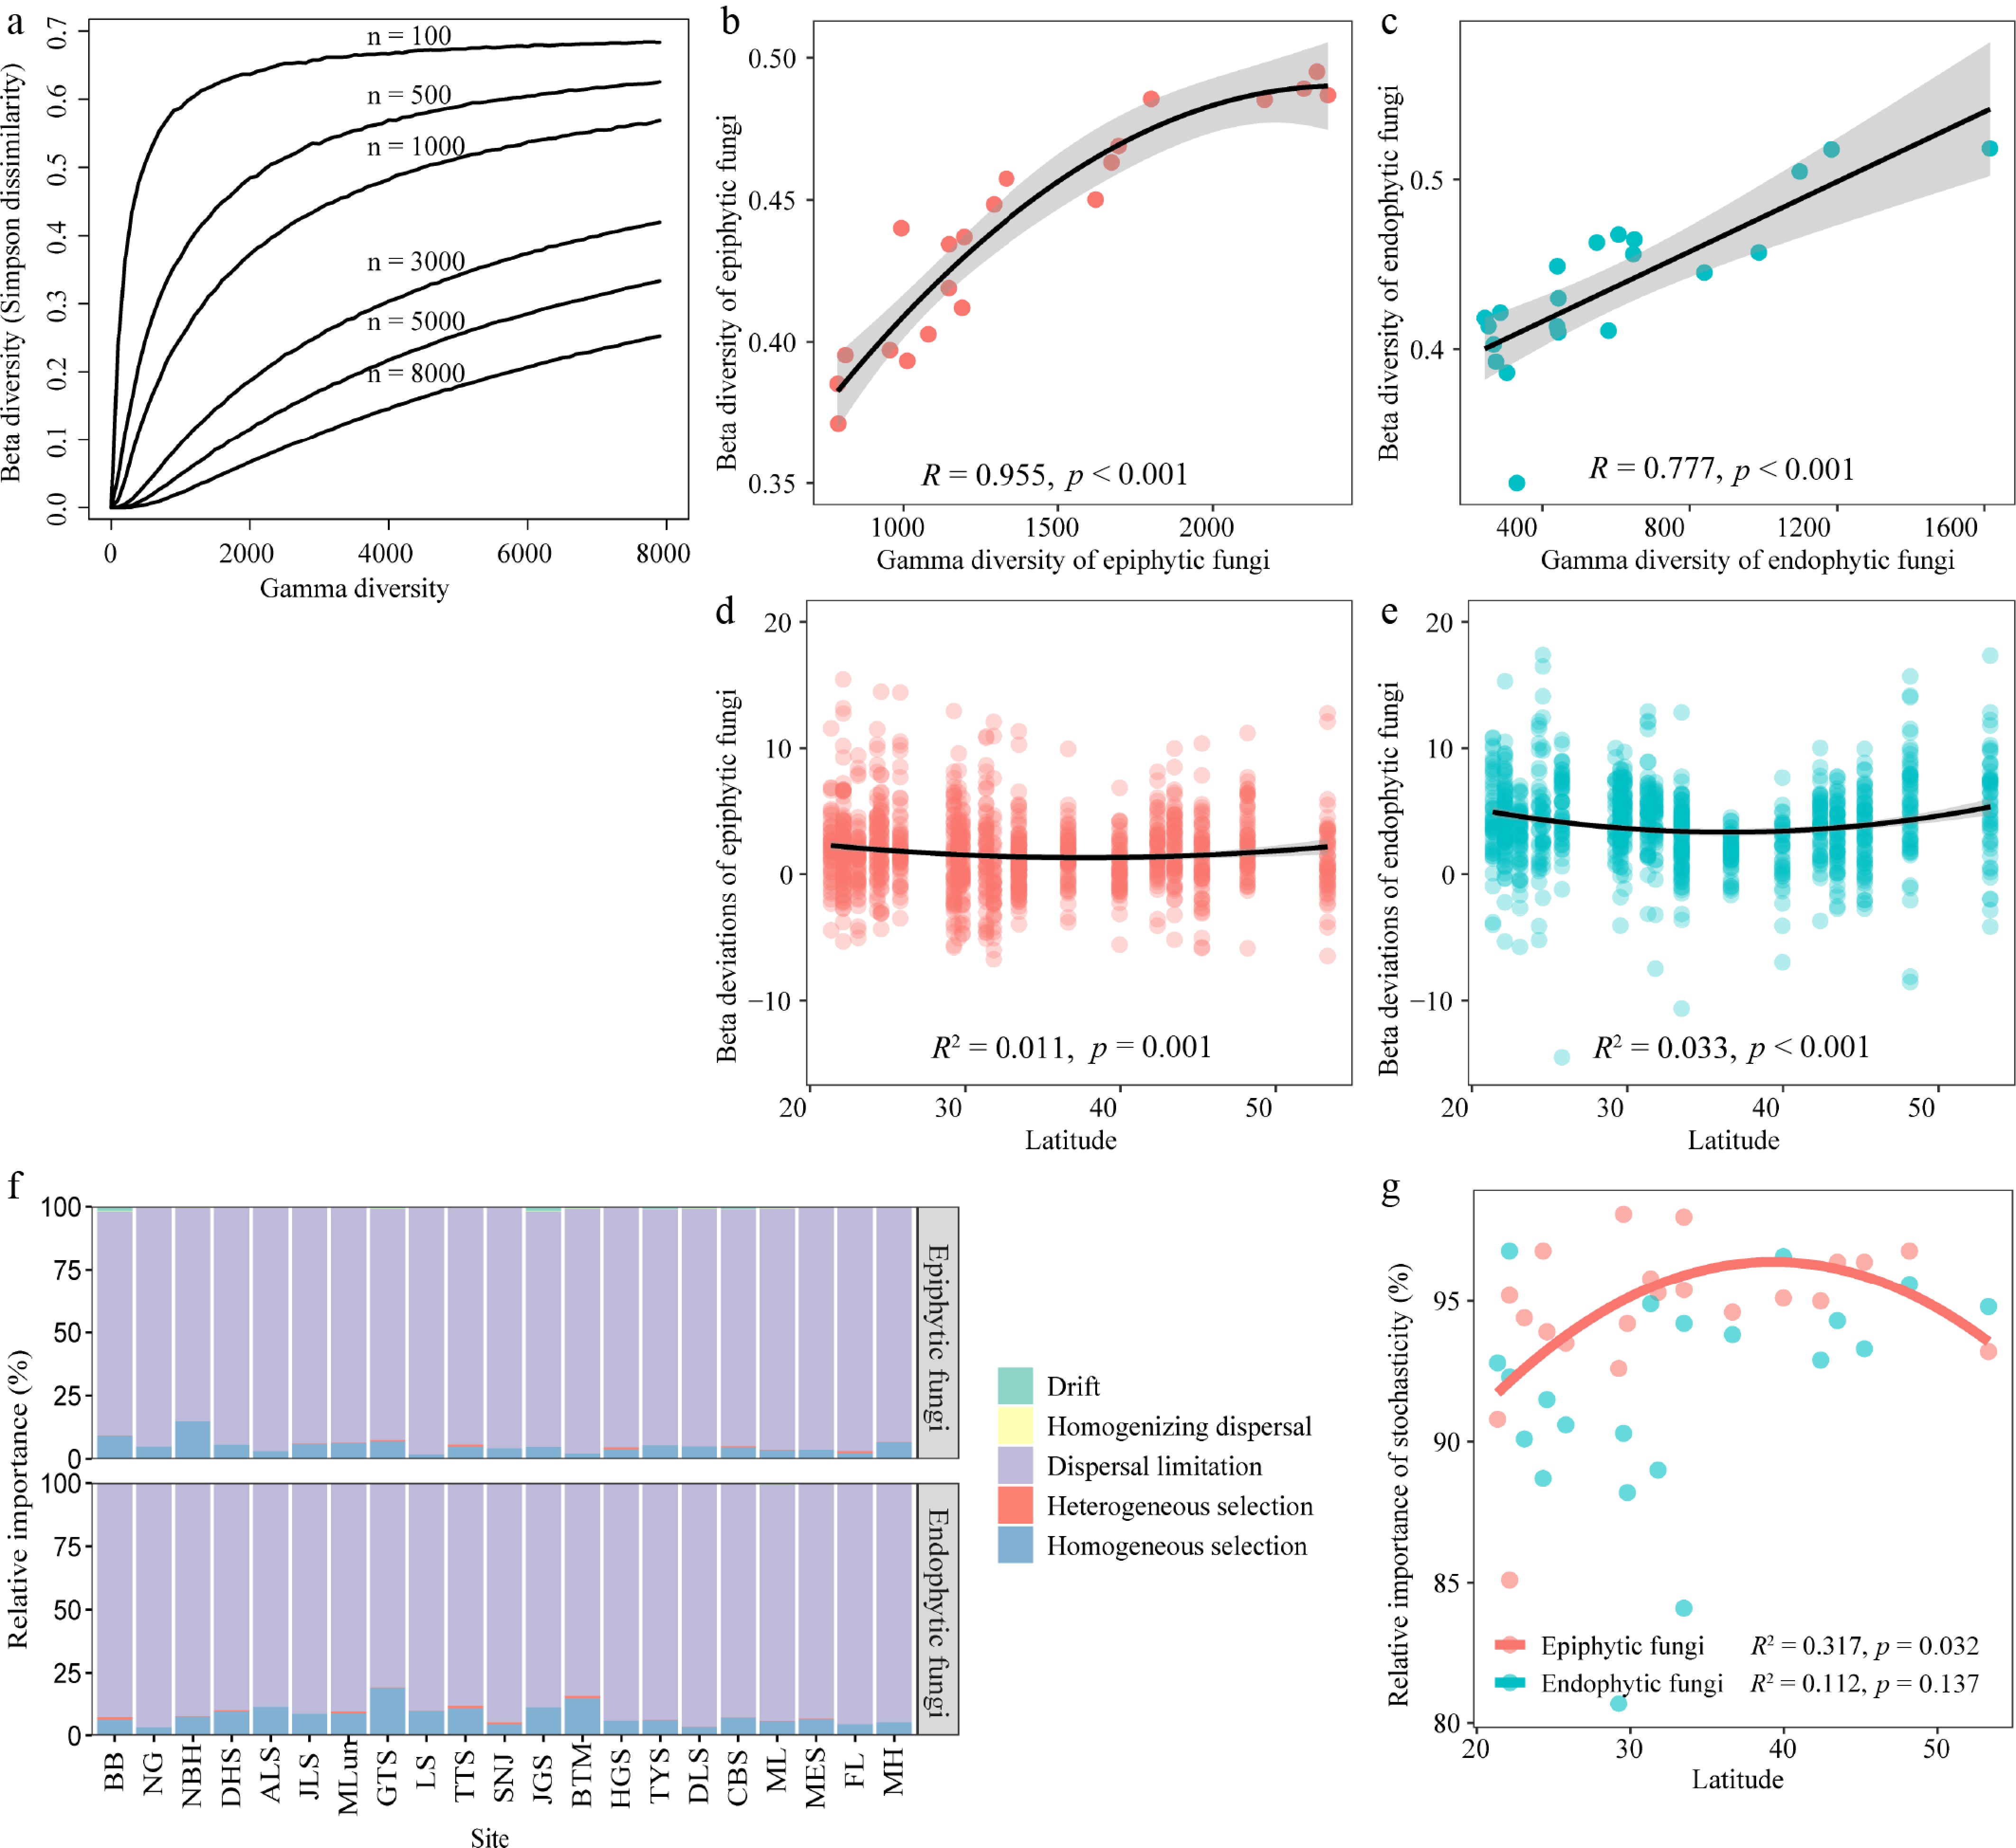
Figure 5.
Community assembly of phyllosphere epiphytic and endophytic fungi. (a) The expected beta diversity increased with increasing gamma diversity produced by a simple sampling simulation, using a lognormal species abundance distribution, and 'n' represented the number of individuals in each sample. Relationship between the observed beta diversity (Simpson dissimilarity) and gamma diversity in (b) epiphytic, and (c) endophytic fungi. Latitudinal pattern of beta deviation of (d) epiphytic, and (e) endophytic fungi. (f) Phylogenetic-bin-based null model analysis (iCAMP) showing the relative importance of each process on community assembly of epiphytic and endophytic fungi in each site, and the sites are ranked from lowest to highest latitude. (g) Latitudinal pattern of the relative importance of stochastic processes on epiphytic and endophytic fungal community assembly. BB, Bubeng; NG, Nonggang; NBH, Nabanhe; DHS, Dinghushan; ALS, Ailaoshan; JLS, Jiulianshan; MLun, Mulun; GTS, Gutianshan; LS, Lushan; TTS, Tiantongshan; SNJ, Shennongjia; JGS, Jigongshan; BTM, Baotianman; HGS, Huangguanshan; TYS, Taiyueshan; DLS, Donglingshan; CBS, Changbaishan; ML, Muling; MES, Maoershan; FL, Fenglin; MH, Mohe.
The null model analyses showed that the mean beta deviation of epiphytic and endophytic fungal communities in each site was significantly greater than zero after controlling for species pool (Fig. 5d, e; Supplementary Table S4). This indicated that the ecological assembly processes, but not the species pool, predominantly governed the beta diversity pattern of epiphytic and endophytic fungi. Furthermore, the iCAMP analysis showed that epiphytic and endophytic fungal communities were mainly shaped by stochastic processes, including dispersal limitation (80.7%–98.0%) and drift (0%–1.9%), followed by deterministic processes, including homogeneous selection (1.9%–19.0%) and heterogeneous selection (0%–1.4%) in each site (Fig. 5f). In addition, the relative importance of stochastic processes on epiphytic but not endophytic fungal community assembly showed a hump-shaped latitudinal pattern (Fig. 5g).
Latitudinal pattern of plant-epiphytic and plant-endophytic fungus network structures
-
The network structure of plant-epiphytic and plant-endophytic fungi was generally characterized by high specialization and modularity but low connectance and nestedness (Supplementary Fig. S6). Namely, compared with the null models, the observed value of weighted connectance was significantly lower (except for endophytic fungal networks in BB, ALS, JLS, GTS, CBS, and MH sites), whereas that of H2' and modularity was significantly higher (except for epiphytic and endophytic fungal networks at the JGS site) across the forest sites (Supplementary Fig. S6a–S6c, S6e–S6g). Additionally, compared with the null models, the observed value of WNODF in epiphytic and endophytic fungus networks was not significantly different at most sites (57.1%, 81.0%) (Supplementary Fig. S6d, S6h).
Furthermore, Z-score normalization analysis revealed that plant-epiphytic fungus networks were more highly specialized and modular, but less connected and nested than plant-endophytic fungus networks in all forest sites (except for modularity in BB, DHS, and BTM, and nestedness in NG, MLun, and HGS; Fig. 6a–d), suggesting that plant-epiphytic fungus networks were more stable but less complex than plant-endophytic fungus networks in most sites. Additionally, the connectance and nestedness of plant-epiphytic fungus networks decreased, while the specialization increased with increasing latitude (Fig. 6e–h). By contrast, the network structure of plant-endophytic fungi had no significant latitudinal pattern (Fig. 6e–h). These results suggest that the complexity of plant-epiphytic but not plant-endophytic fungus networks decreased with increasing latitude.
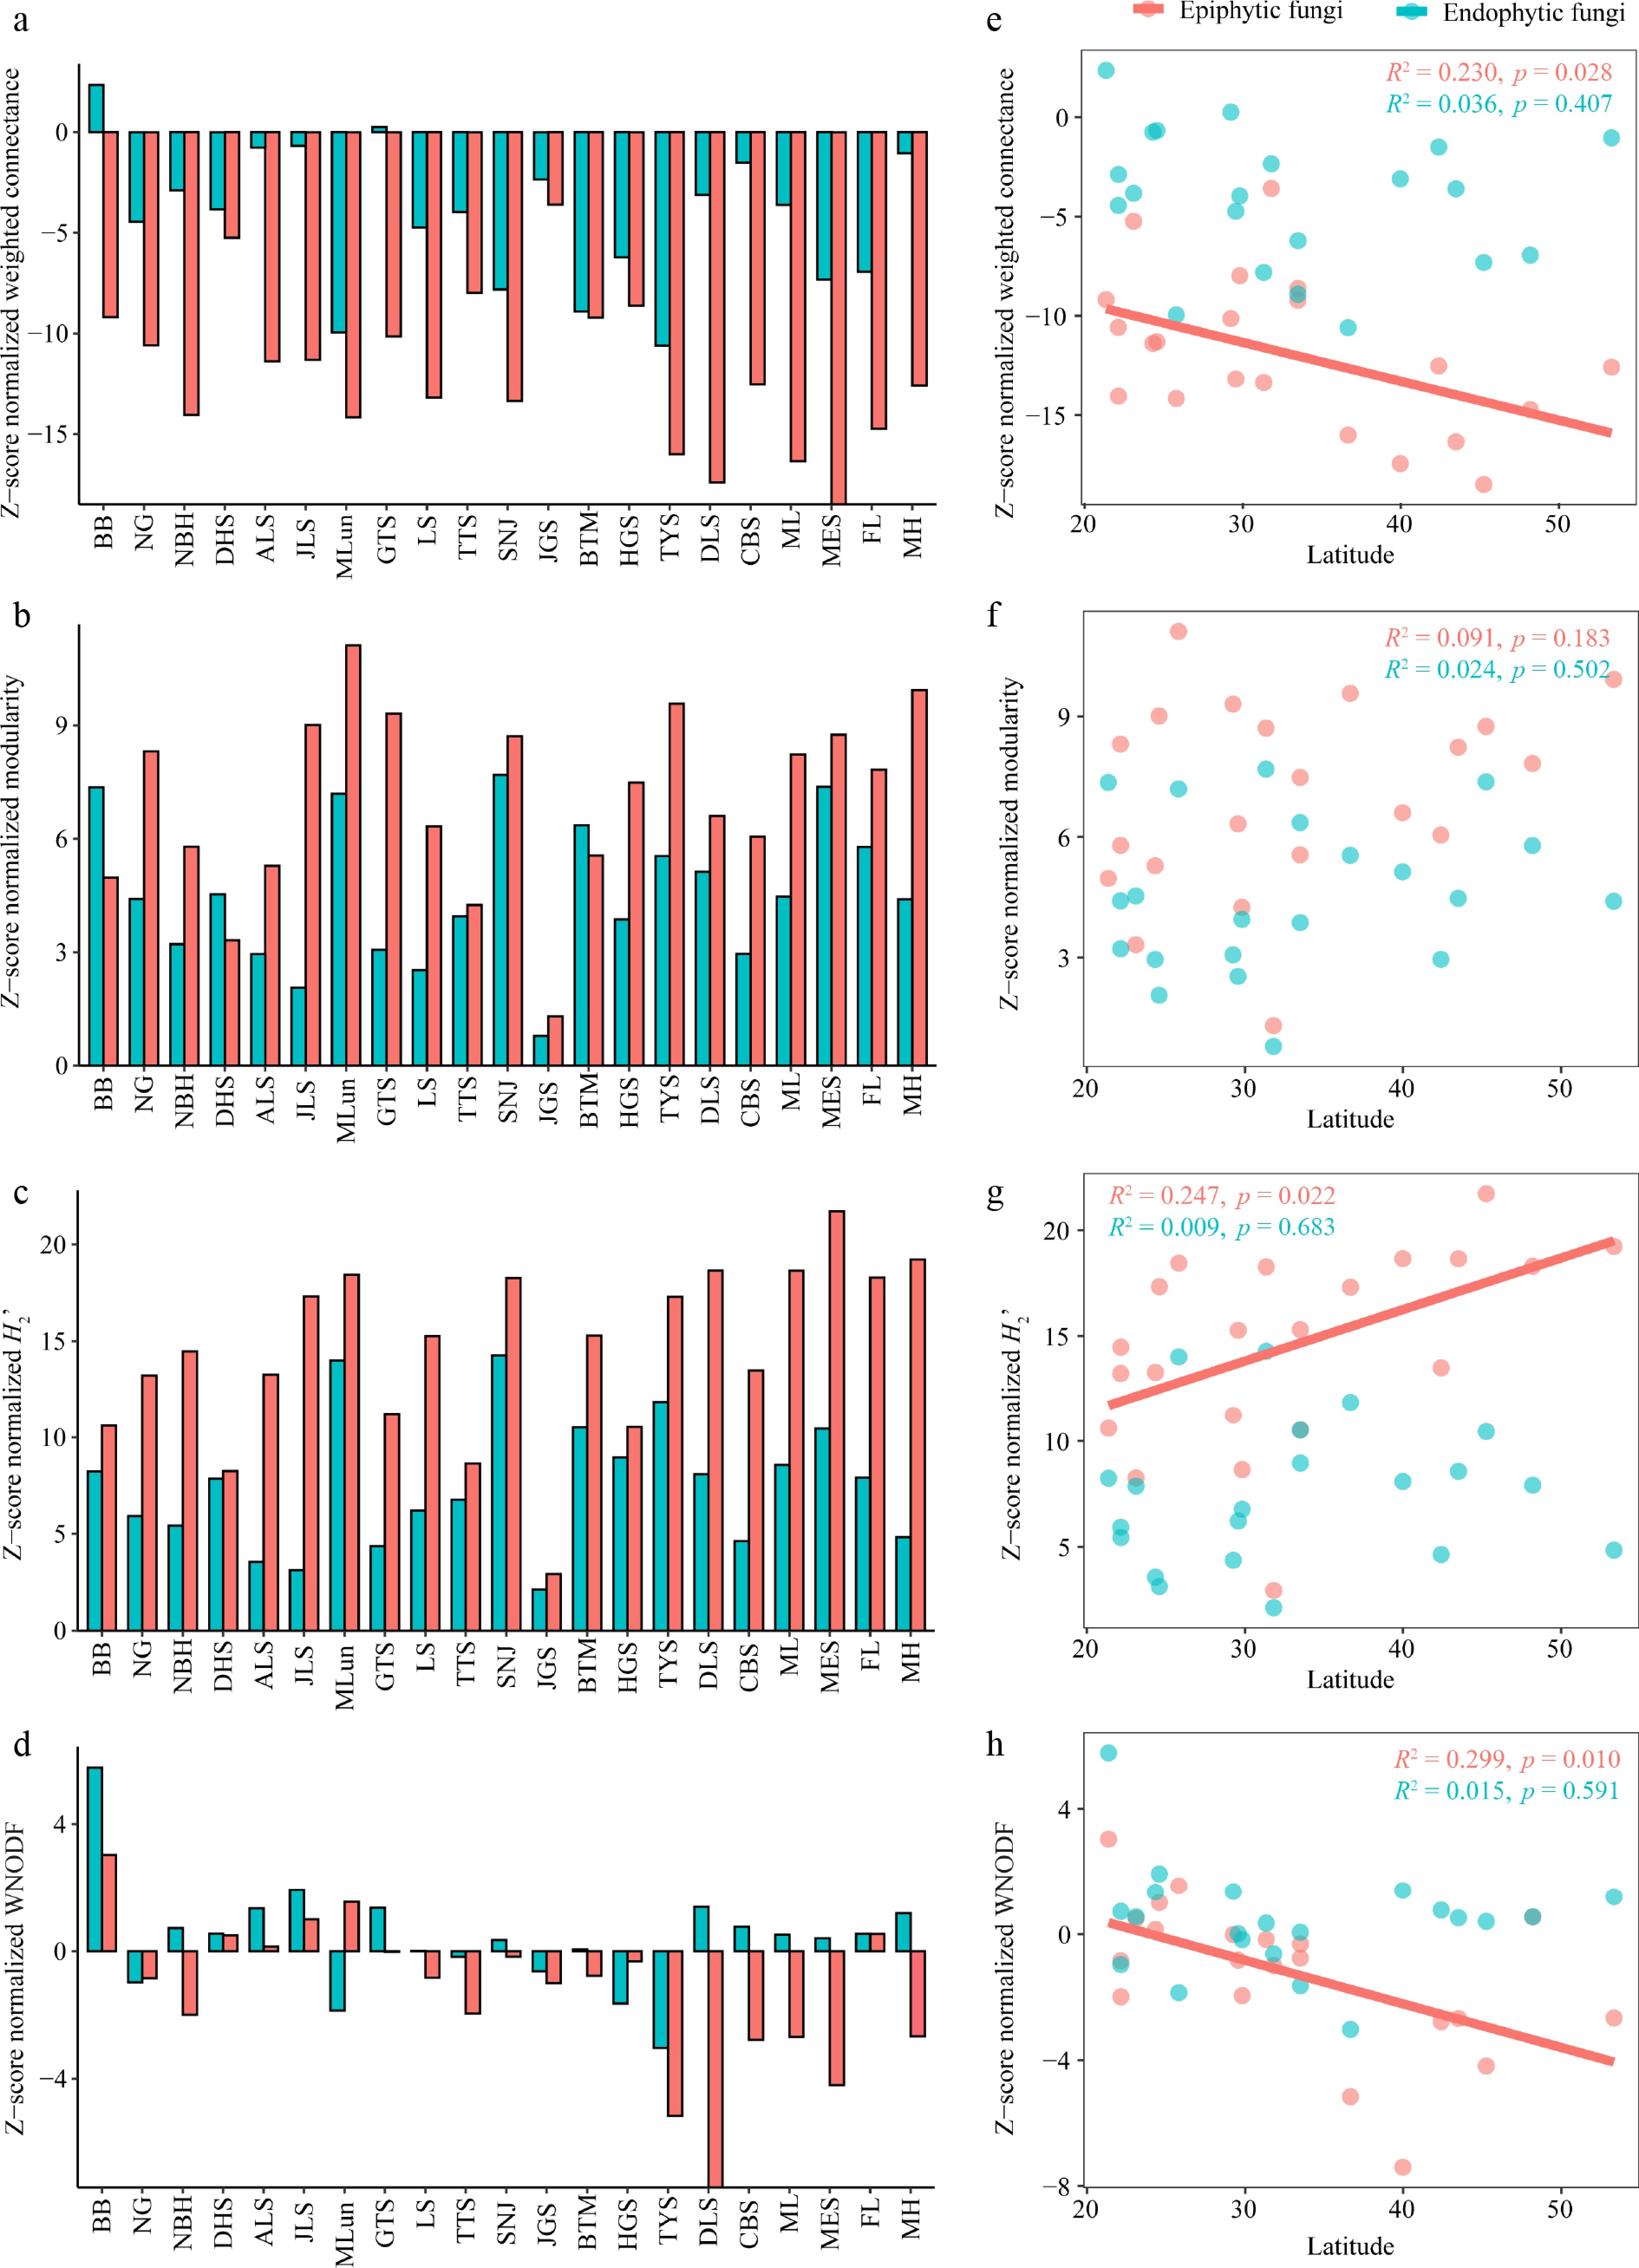
Figure 6.
Structure of plant-epiphytic and endophytic fungus networks. (a)–(d) Z-score-normalized properties of epiphytic and endophytic fungus networks. (e)–(h) Latitudinal pattern of plant-epiphytic and endophytic fungus networks. H2', H2' metric of the network-level interaction specialization; Modularity, Barber's metric of modularity; WNODF, weighted nestedness metric based on overlap and decreasing fill. BB, Bubeng; NG, Nonggang; NBH, Nabanhe; DHS, Dinghushan; ALS, Ailaoshan; JLS, Jiulianshan; MLun, Mulun; GTS, Gutianshan; LS, Lushan; TTS, Tiantongshan; SNJ, Shennongjia; JGS, Jigongshan; BTM, Baotianman; HGS, Huangguanshan; TYS, Taiyueshan; DLS, Donglingshan; CBS, Changbaishan; ML, Muling; MES, Maoershan; FL, Fenglin; MH, Mohe.
-
The first hypothesis was not supported by our findings that the alpha and beta diversity of epiphytic and endophytic fungi showed a U-shaped latitudinal pattern, as reported in soil fungi in Chinese forests[24]. This pattern may be partly attributed to the influence of the species pool, as both epiphytic and endophytic fungal species pools exhibited a significant U-shaped pattern in our study (Supplementary Fig. S7). Compared to mid-latitude forests, a larger species pool at low and high latitudes provided great and heterogeneous fungal sources, which contributed to higher alpha and beta diversity in these regions. Indeed, a significantly positive relationship between species pool and the alpha and beta diversity of fungi was observed in our study (Fig. 5b, c; Supplementary Fig. S8) and previous[36,37] studies. It is highly possible that larger species pools contain greater species with diverse adaptive traits that allow them to thrive in different environments[98], or due to greater random differences in community composition[4,99,100].
In addition to the species pool, the alpha and beta diversity of epiphytic and endophytic fungi was also affected by plant identity, as well as spatial and climatic variables, as reported in previous studies[9,15,18,101]. The effect of plant identity on fungal diversity is exerted through direct host preferences, which are mediated by leaf nutrients, volatile organic compounds, and surface topography. Indeed, we found that phyllosphere fungal diversity in most plant species was lower in mid-latitudinal than in low- and high-latitudinal forests (Supplementary Figs S9, S10). In addition, soil heterogeneity is lower in mid-latitudinal than in low- and high-latitudinal regions[24]. The homogeneous soil environment possibly contributes to a more homogeneous leaf environment[102], which may enhance homogeneous filtering and lead to low diversity. Another reason is that greater human disturbance (e.g., land use change, fragmentation, or deposition) in central China may have damaged diversity, as reported in soil fungi and other macro-organisms[103,104]. However, some previous studies found that endophytic fungal alpha diversity decreased toward boreal forests using culturable methods[26,27]. The differences may be attributed to the different detection methods, as culture-based approaches can detect more Ascomycota than Basidiomycota[105,106], which are dominant at high latitudes[20].
Inconsistent with the second hypothesis, we found that community assembly of epiphytic and endophytic fungi was mainly structured by stochastic processes (e.g., dispersal limitation). Similarly, some previous studies reported that fungal community assembly in leaves and soil was governed primarily by stochastic processes in shrub[45,46], agriculture[107], and forest[1,108] ecosystems. The reason could be that geographic isolation among sampling sites generates dispersal barriers and reduces migration rates of microbial propagules, especially at a large spatial scale[109,110], as we found an important influence of space on community of epiphytic and endophytic fungi by variation partitioning analysis (Fig. 2). Furthermore, our results showed that a considerable proportion of epiphytic and endophytic fungal community variance was not explained (52.1%–56.0%; Fig. 2c, d), which may be due to stochastic processes such as diversification or speciation, which was not directly detected in the natural environment[111]. Moreover, fungal species have different dispersal and colonization abilities[112], and the arrival order of fungal species may affect the fungal community via priority effects[113].
Furthermore, we found that the relative importance of stochastic processes on the community assembly of epiphytic fungi had a hump-shaped latitudinal pattern. Compared to low and high latitudes, the epiphytic fungal community was more homogeneous in mid-latitudinal forests in this study, which possibly led to stronger interspecific competition[24]. In this case, the priority effect may have a greater impact on community assembly because the species that arrives first gains a competitive advantage by preemptively occupying resources[114], leading to greater stochasticity in mid-latitudinal forests. Additionally, the complex topography and large elevational variation in mid-latitude regions may cause greater dispersal limitation for epiphytic fungi, further contributing to the high stochasticity. However, we found no latitudinal pattern in the relative importance of stochastic processes on community assembly of endophytic fungi. This result may be attributed to the strong selective effect of the host on endophytic fungi during their colonization[15,115].
Our third hypothesis was partially supported by our findings that the complexity of plant-epiphytic fungus networks, rather than plant-endophytic fungus networks, decreased with increasing latitude, as the connectance and nestedness of plant-epiphytic fungus networks but not plant-endophytic fungus networks decreased with increasing latitude. The higher connectance may be due to a great species pool and favorable hydrothermal conditions in low-latitudinal forests, promoting potential interactions between epiphytic fungi and plants, thereby enhancing network complexity. Additionally, the specialization of epiphytic fungus networks increased with increasing latitude, as found in root-associated fungi[60]. It reflects a stronger niche differentiation in temperate regions, leading to less competition for host plants among fungal species, which decreases the nestedness of plant-fungus networks, thus suggesting a lower network complexity at high latitudes. However, the network structure of plant-endophytic fungi had no significant latitudinal pattern. This result could be ascribed to stronger host selection and greater resistance and/or resilience to environmental perturbations compared to epiphytic fungi[15,116].
Additionally, we found that the plant-endophytic fungus network was more complex but less stable compared to the plant-epiphytic fungus network, as indicated by its higher connectance and nestedness but lower modularity compared to those of the epiphytic network. Similar results have also been found in a subtropical mangrove ecosystem[64]. The lower nestedness of plant-epiphytic fungus networks suggests that host plants may prefer to interact with specialists over generalists among epiphytic fungi rather than among endophytic fungi[117], thereby further promoting the specialization of these networks. This higher specialization indicates strong niche differentiation[118], which could reduce interspecific interactions and contribute to the low complexity of epiphytic fungal networks. Such strong niche differentiation may be driven by leaf surface microenvironments, including sunlight intensity, moisture, and nutrient content. Additionally, the high specialization was followed by high modularity, which enhances the stability of epiphytic fungal networks by limiting the impact of perturbations within a single module[59].
Finally, we should note that the leaf samples were stored at –80 °C, which may damage the tissue and cellular structure of broadleaves, introducing bias into the isolation of epiphytic and endophytic fungi that could potentially influence the latitudinal patterns of phyllosphere fungi.
-
This study provides the first example of research revealing the latitudinal pattern of diversity, community assembly, and network structure of phyllosphere epiphytic and endophytic fungi in Chinese forests. The alpha and beta diversity of epiphytic and endophytic fungi exhibited a U-shaped latitudinal pattern, which was mainly driven by plant identity, species pool, space, and climatic factors. The community assembly of phyllosphere epiphytic and endophytic fungi was predominantly governed by stochastic processes, and the relative importance of stochastic processes on epiphytic fungi rather than endophytic fungi showed a unimodal latitudinal pattern. The plant-epiphytic fungus networks were more stable but less complex than plant-endophytic fungus networks in most forests. The complexity of plant-epiphytic fungus networks, rather than plant-endophytic fungus networks, decreased with increasing latitude. These results enhance our understanding of species co-occurrence and community stability in forest ecosystems.
-
The authors confirm contribution to the paper as follows: study conception and design: Guo L, Gao C; data collection: Li X, Guo L, Gao C, Zheng Y, Wang C; analysis and interpretation of results: Li X, Li J, Guo L, Gao C; draft manuscript preparation: Li X, Li J, Guo L, Gao C, Willing CE, Frew A, Jiang L. All authors reviewed the results and approved the final version of the manuscript.
-
The raw reads have been deposited into the NCBI Sequence Read Archive (SRA) database (Accession Number: PRJNA1221103, PRJNA1221115, and PRJNA1221120), and the other relevant data can be found within the manuscript and its supporting materials.
-
This work was financially supported by the National Natural Science Foundation of China (32322053, 32170120, 32471693, 32170129, and 31700543). We thank support from the Chinese Forest Biodiversity Monitoring Network. We are grateful to Yong-Wong Wang, Xiang Sun, Liang Chen, Zi-Xuan Guo, Yue Zhang, Yu-Xuan Liu, Yong-Qing Lin, Qing-Yi Yu, Jing Cai, Hui Yao, Hui-Yun Gan, Min Cao, Ye Chen, Fu-Ping Zeng, Yang Wang, Song-Yan Tian, Ming-Xi Jiang, Han Xu, Xi-Hua Wang, Xiao-Yong Chen, Xiao-Bao Deng, Hong-Jin Dong, Xiao-Jun Du, Yong-Jun Fan, Sheng-Lei Fu, Nan-Nan Shi, Xiao-Wei Gao, Zhan-Qing Hao, Xiu-Hai Zhao, Lai Jiang, Ming-Xi Jiang, Guang-Ze Jin, Bu-Hang Li, Xian-Kun Li, Yu-Hong Liu, Ke-Ping Ma, Jin-Hua Qi, Wei-Guo Sang, Li-Yan Sun, Zong-Qiang Xie, Ji Ye, Wan-Hui Ye, Shui-Sheng You, Ming-Jian Yu, Shu-Sheng Zhang, Yong-Liang Zhang for help in field sampling. We are grateful to Yu-Xuan Liu, Yong-Qing Lin, and Yu-Jin Cui for help in performing experiments, and Yi-Fu Wang, Peng-Fa Li, Yong-Wong Wang, Zi-Xuan Guo, Yue Zhang, Yu-Xuan Liu, and Hui Yao for help in data analysis. We thank all members of the Gao and Guo Lab for their discussion and communication.
-
The authors declare that they have no conflict of interest.
-
accompanies this paper online at: https://doi.org/10.48130/mycosphere-0026-0011.
-
#Authors contributed equally: Xingchun Li, Jie Li
- Supplementary Table S1 Information on sampling sites and climatic variables in the study.
- Supplementary Table S2 Molecular identification of epiphytic and endophytic fungi at a 97% sequence identity leve.
- Supplementary Table S3 Polynomial fits showing the effect of latitude on epiphytic and endophytic fungal diversity with plant identity being treated as a random factor.
- Supplementary Table S4 One-sample two-sides t-test was used to compare mean beta deviation against zero in each site after controlling for species pool.
- Supplementary Table S5 The effect of explanatory variables on epiphytic and endophytic alpha and beta diversity based on the multiple linear regression model.
- Supplementary Fig. S1 Distribution of leaf samples collected from 172 plant species in 21 Chinese forest sites.
- Supplementary Fig. S2 The number of fungal operational taxonomic units (OTUs) at phylum level.
- Supplementary Fig. S3 Relative abundance of the top 10 leaf potential epiphytic and endophytic pathogenic fungal genera.
- Supplementary Fig. S4 Latitudinal pattern of the alpha and beta diversity and relative abundance of potential epiphytic and endophytic pathogenic fungi.
- Supplementary Fig. S5 Heatmap depicting the distribution of relatively abundant epiphytic and endophytic fungal operational taxonomic units (OTUs, > 0.2% of total fungal reads) in different forest sites.
- Supplementary Fig. S6 Structure of plant-fungus networks in different forest sites along a latitudinal gradient.
- Supplementary Fig. S7 Latitudinal pattern of phyllosphere epiphytic and endophytic fungal species pools.
- Supplementary Fig. S8 Relationship between fungal alpha diversity and species pool.
- Supplementary Fig. S9 Heatmap depicting the distribution of epiphytic fungal diversity in plant species within forest sites across different latitudes.
- Supplementary Fig. S10 Heatmap depicting the distribution of endophytic fungal diversity in plant species within forest sites across different latitudes.
- Copyright: © 2026 by the author(s). Published by Maximum Academic Press, Fayetteville, GA. This article is an open access article distributed under Creative Commons Attribution License (CC BY 4.0), visit https://creativecommons.org/licenses/by/4.0/.
-
About this article
Cite this article
Li X, Li J, Frew A, Zheng Y, Wang C, et al. 2026. Latitudinal pattern in diversity, community assembly, and network structure of phyllosphere fungi in Chinese forests. Mycosphere 17: e010 doi: 10.48130/mycosphere-0026-0011 

Latitudinal pattern in diversity, community assembly, and network structure of phyllosphere fungi in Chinese forests
- Received: 01 April 2026
- Revised: 21 May 2026
- Accepted: 06 June 2026
- Published online: 17 July 2026
Abstract: Deciphering latitudinal diversity patterns is critical for understanding biodiversity generation and its ecosystem consequences. However, the latitudinal distribution of community diversity, assembly, and network structure of phyllosphere fungi in forest ecosystems remains poorly understood. In this study, we examined phyllosphere epiphytic and endophytic fungal communities from 172 plant species spanning 21 Chinese forests (18° to 53° N) using amplicon sequencing techniques. The alpha and beta diversity of phyllosphere epiphytic and endophytic fungi displayed a U-shaped latitudinal pattern, which was mainly driven by plant identity, species pool, space, and climatic factors. The community assembly of phyllosphere epiphytic and endophytic fungi was predominantly governed by stochastic processes, and the relative importance of stochastic processes on community assembly of epiphytic fungi rather than endophytic fungi showed a unimodal latitudinal pattern. The plant-epiphytic fungus networks were more stable but less complex than plant-endophytic fungus networks in most forests. The complexity of plant-epiphytic fungus networks, rather than plant-endophytic fungus networks, decreased with increasing latitude. These findings enhance our understanding of species co-occurrence and community stability in forest ecosystems.
-
Key words:
- Alpha diversity /
- Beta diversity /
- Community assembly /
- Latitudinal pattern /
- Network structure /
- Phyllosphere fungi