


-
Road tunnels are essential elements of a transportation network, allowing to overcome certain barriers (e.g., urban areas, mountains, waterways, etc.) and meet the mobility demand of people and goods. However, the increasing construction of these structures around the world has raised many concerns among the competent authorities regarding user safety, especially after the occurrence of some tragic fires in certain European road tunnels (i.e., the Tauern tunnel fire in 1999 with 12 deaths, Mont Blanc tunnel fire in 1999 with 39 deaths, and Saint Gotthard tunnel fire in 2001 with 11 deaths). In this respect, with the aim of ensuring a minimum safety level of both new and old existing tunnels longer than 500 m belonging to the Trans-European Road Network (TERN), the European Parliament and Council, in 2004, issued Directive 2004/54/EC[1]. The primary intent of this Directive is to avoid critical events that might cause the loss of human lives, environmental disasters, and serious damage to tunnel structures and installations, while also protecting them in the case of incidents. Regarding road tunnels already open to traffic, Directive 2004/54/EC requires a preliminary assessment of the risk level for users by considering the existing safety measures in the tunnel, and, when the recommended minimum requirements are not met, it prescribes the implementation of refurbishment works to achieve the purpose. The Italian Ministry of Infrastructure and Transports adopted this Directive in 2006, establishing the date of 30 April 2019 as the deadline for completing the refurbishment works necessary to bring the existing Italian road tunnels falling within the scope of Directive 2004/54/EC into compliance with its provisions. In Italy, however, since there are a very high number of existing road tunnels that need to be adapted, most of them are still under refurbishment work.
In order to perform the refurbishment work of an existing tunnel, it is usually partially or completely closed to traffic for days or weeks, with consequences (e.g., a reduction in the travel speed of vehicles) that might also affect the vehicular flows traveling on the nearby road network. Therefore, the identification of strategies to contain the functionality loss of an existing tunnel affected by planned refurbishment works, while also considering the potential availability of alternative routes on open roads of the nearby infrastructure system, is a very important issue currently to be addressed.
A tunnel, or more generally a system, that reacts adaptively in the face of a perturbation (e.g., the execution of refurbishment work of an existing road tunnel) is typically described as resilient. The resilience of a system might be defined in different ways depending on the area of interest[2−5]. For example, with reference to a transportation network, resilience can be seen as the ability of the system to rapidly recover its functionality after a disturbing event.
Since the resilience of road infrastructures is strongly associated with their functionality level, the resilience assessment of these systems should be carried out through the use of traffic-based parameters. In this respect, given that the execution of refurbishment works of an existing road tunnel generally causes a reduction in the travel speed (i.e., an increase in the travel time) of vehicular flows moving along the infrastructure including the tunnel itself, the travel speed of vehicles appears to be appropriate for the purpose.
In order to evaluate the resilience of a transportation network, quantitative methods based on traffic simulation models are typically used. These allow the identification of the advantages and disadvantages related to different potential scenarios. Thereby, they constitute a support tool in the selection of the most suitable traffic management strategy to contain the functionality loss due to the partial or complete closure of one or more road links of a network caused by, for example, the execution of planned refurbishment works.
Several researchers have investigated the resilience of transportation networks in the case of random disruptive events (i.e., traffic accidents, fires, and natural disasters). However, with respect to the planned disruptive events (i.e., refurbishment and/or maintenance works), most of the studies in the current literature have focused on the assessment of their effects on traffic flows without any consideration about resilience. This appears to be a lacuna of knowledge that the present paper seeks to fill. In this respect, in fact, it is worth noting that the resilience of an existing road tunnel, or more generally of an infrastructure containing it, is expected to be different in the case of random or planned disruptive events for at least two main reasons. Firstly, in the case of planned disruptive events, the traffic flows along the disrupted transportation network are re-organized by the road management personnel before the disruptive event starts (e.g., if an alternative itinerary is available on the nearby road infrastructure, before reaching the partially or completely closure of a link of the network, drivers know the alternative route they should take to arrive at their destination). In contrast, the random disruptive events are unpredictable, so that when they occur, the emergency teams take a certain amount of time to reach the site and re-organize the traffic flow (e.g., the alternative route will be activated only after a certain period of time from the start of the disturbance, so longer queues are expected). Secondly, the duration of the perturbation due to the occurrence of a random disruptive event, if we exclude very catastrophic events, is expected to be a few hours (e.g., in the case of traffic accidents, the time needed for the emergency team to reach the site, the road police to identify the causes, the local emergency services to take away victims or help the injured, and the road management personnel to remove crashed vehicles and clean the road of any debris); while the execution of planned works generally takes longer (i.e., days or weeks).
In light of the above considerations, Table 1 shows a summary of the literature review.
Table 1. Summary of the literature review.
Year Author (s) Disruptive
eventIs resilience investigated? Scope 2011 Frangopol and Bocchini[6] Random YES To use the concept of resilience as an optimization criterion for the rehabilitation of a transportation network subject to an earthquake. 2012 Huerne et al.[7] Planned NO To set up a theoretical framework that can define the relationships between road maintenance characteristics and costs, traffic effects, and traffic hindrance for road works. 2017 Kaviani et al.[8] Random YES To develop a new approach to improve the resilience of regional road networks during the recovery period following a natural disaster. 2017 Sudarsana & Sanjaya[9] Planned NO To evaluate the increase in the travel time of vehicles during the execution of a road maintenance project. 2017 Yang et al.[10] Planned NO To present a road maintenance planning model that can be used to balance out maintenance cost and road user cost. 2018 Liao et al.[11] Random YES To propose a resilience optimization model for transportation networks under unpredictable disasters. 2018 Amini et al.[12] Random YES To evaluate the impacts of diverting traffic in real-time on the resilience of a road network affected by the closure of a link caused by an incidental event. 2019 Kilanitis & Sextos[13] Random YES To extend an existing framework to evaluate the seismic risk and resilience of road networks in earthquake-prone areas. 2020 Yang et al.[14] Planned NO To assess the additional delays along the network due to road maintenance by using the network-level traffic flow model. 2021 Sun et al.[5] Planned NO To propose a stochastic bi-objective integer programming model for minimizing the total cost and CO2 emissions of tunnel maintenance over the entire planning horizon. 2021 Shrestha et al.[15] Random or Planned NO To set up a new methodology for assessing the performance of rural road networks when a link in the network is disrupted due to random or planned disruptive events. 2021 Borghetti et al.[16] Random YES To study the impacts of emergency teams equipped with a micronized water system on the resilience of a road tunnel in the event of a fire. 2021 Zhao[17] Random YES To propose a genetic algorithm to identify the best strategy for recovering the resilience of a road network after a disaster. 2022 Torti et al.[18] Planned NO To introduce a methodology for assessing the socio-economic effects of closure for maintenance of one or more infrastructures of a large and complex road network. 2022 Caliendo et al.[19] Random YES To assess the resilience of a twin-tube road tunnel affected by a traffic accident in a tube and the efficiency of various recovery measures. 2022 Caliendo et al.[20] Random YES To perform a simultaneous analysis of the resilience and user safety of a road tunnel in the case of a fire. 2022 Tao et al.[21] Random YES To analyze the resilience degradation due to traffic accidents and develop relevant resilience optimization strategies. Given the limited body of studies focusing on the resilience of existing road tunnels under planned refurbishment works, the aims of this article are: (i) to implement a traffic macro-simulation model to address this issue in greater depth; (ii) to identify the most suitable traffic control measures to contain the reduction in the travel speed of vehicles, thus increasing the resilience of the tunnel system; (iii) to assess the effects resulting from the use of digital technologies such as Variable Message Signs (VMSs) to redirect vehicular flow on an alternative route in the surrounding road infrastructure. To achieve our goals, an existing Italian twin-tube motorway tunnel, assumed to be under refurbishment works for compliance with the safety prescription of Directive 2004/54/EC, was considered.
This study is organized as follows: the next paragraph describes the existing twin-tube road tunnel assumed to be under planned refurbishment works, as well as the study area and the scenarios analyzed. Afterward, the traffic macro-simulation model is explained and applied to estimate the travel speed of vehicular flows. Then, the model results are illustrated and discussed, as well as compared with the aim of identifying the most suitable traffic control measures to contain the functionality loss (i.e., to improve the resilience) of the tunnel system. Lastly, certain conclusions, recommendations, and future research are considered.
-
An existing twin-tube road tunnel located along an Italian motorway was analyzed. It was considered to be under planned refurbishment works for compliance with the minimum safety requirements of Directive 2004/54/EC. Specifically, these refurbishment works were assumed to involve one tube (i.e., the northbound tube reported in red in Fig. 1) that remains partially or completely closed to traffic.
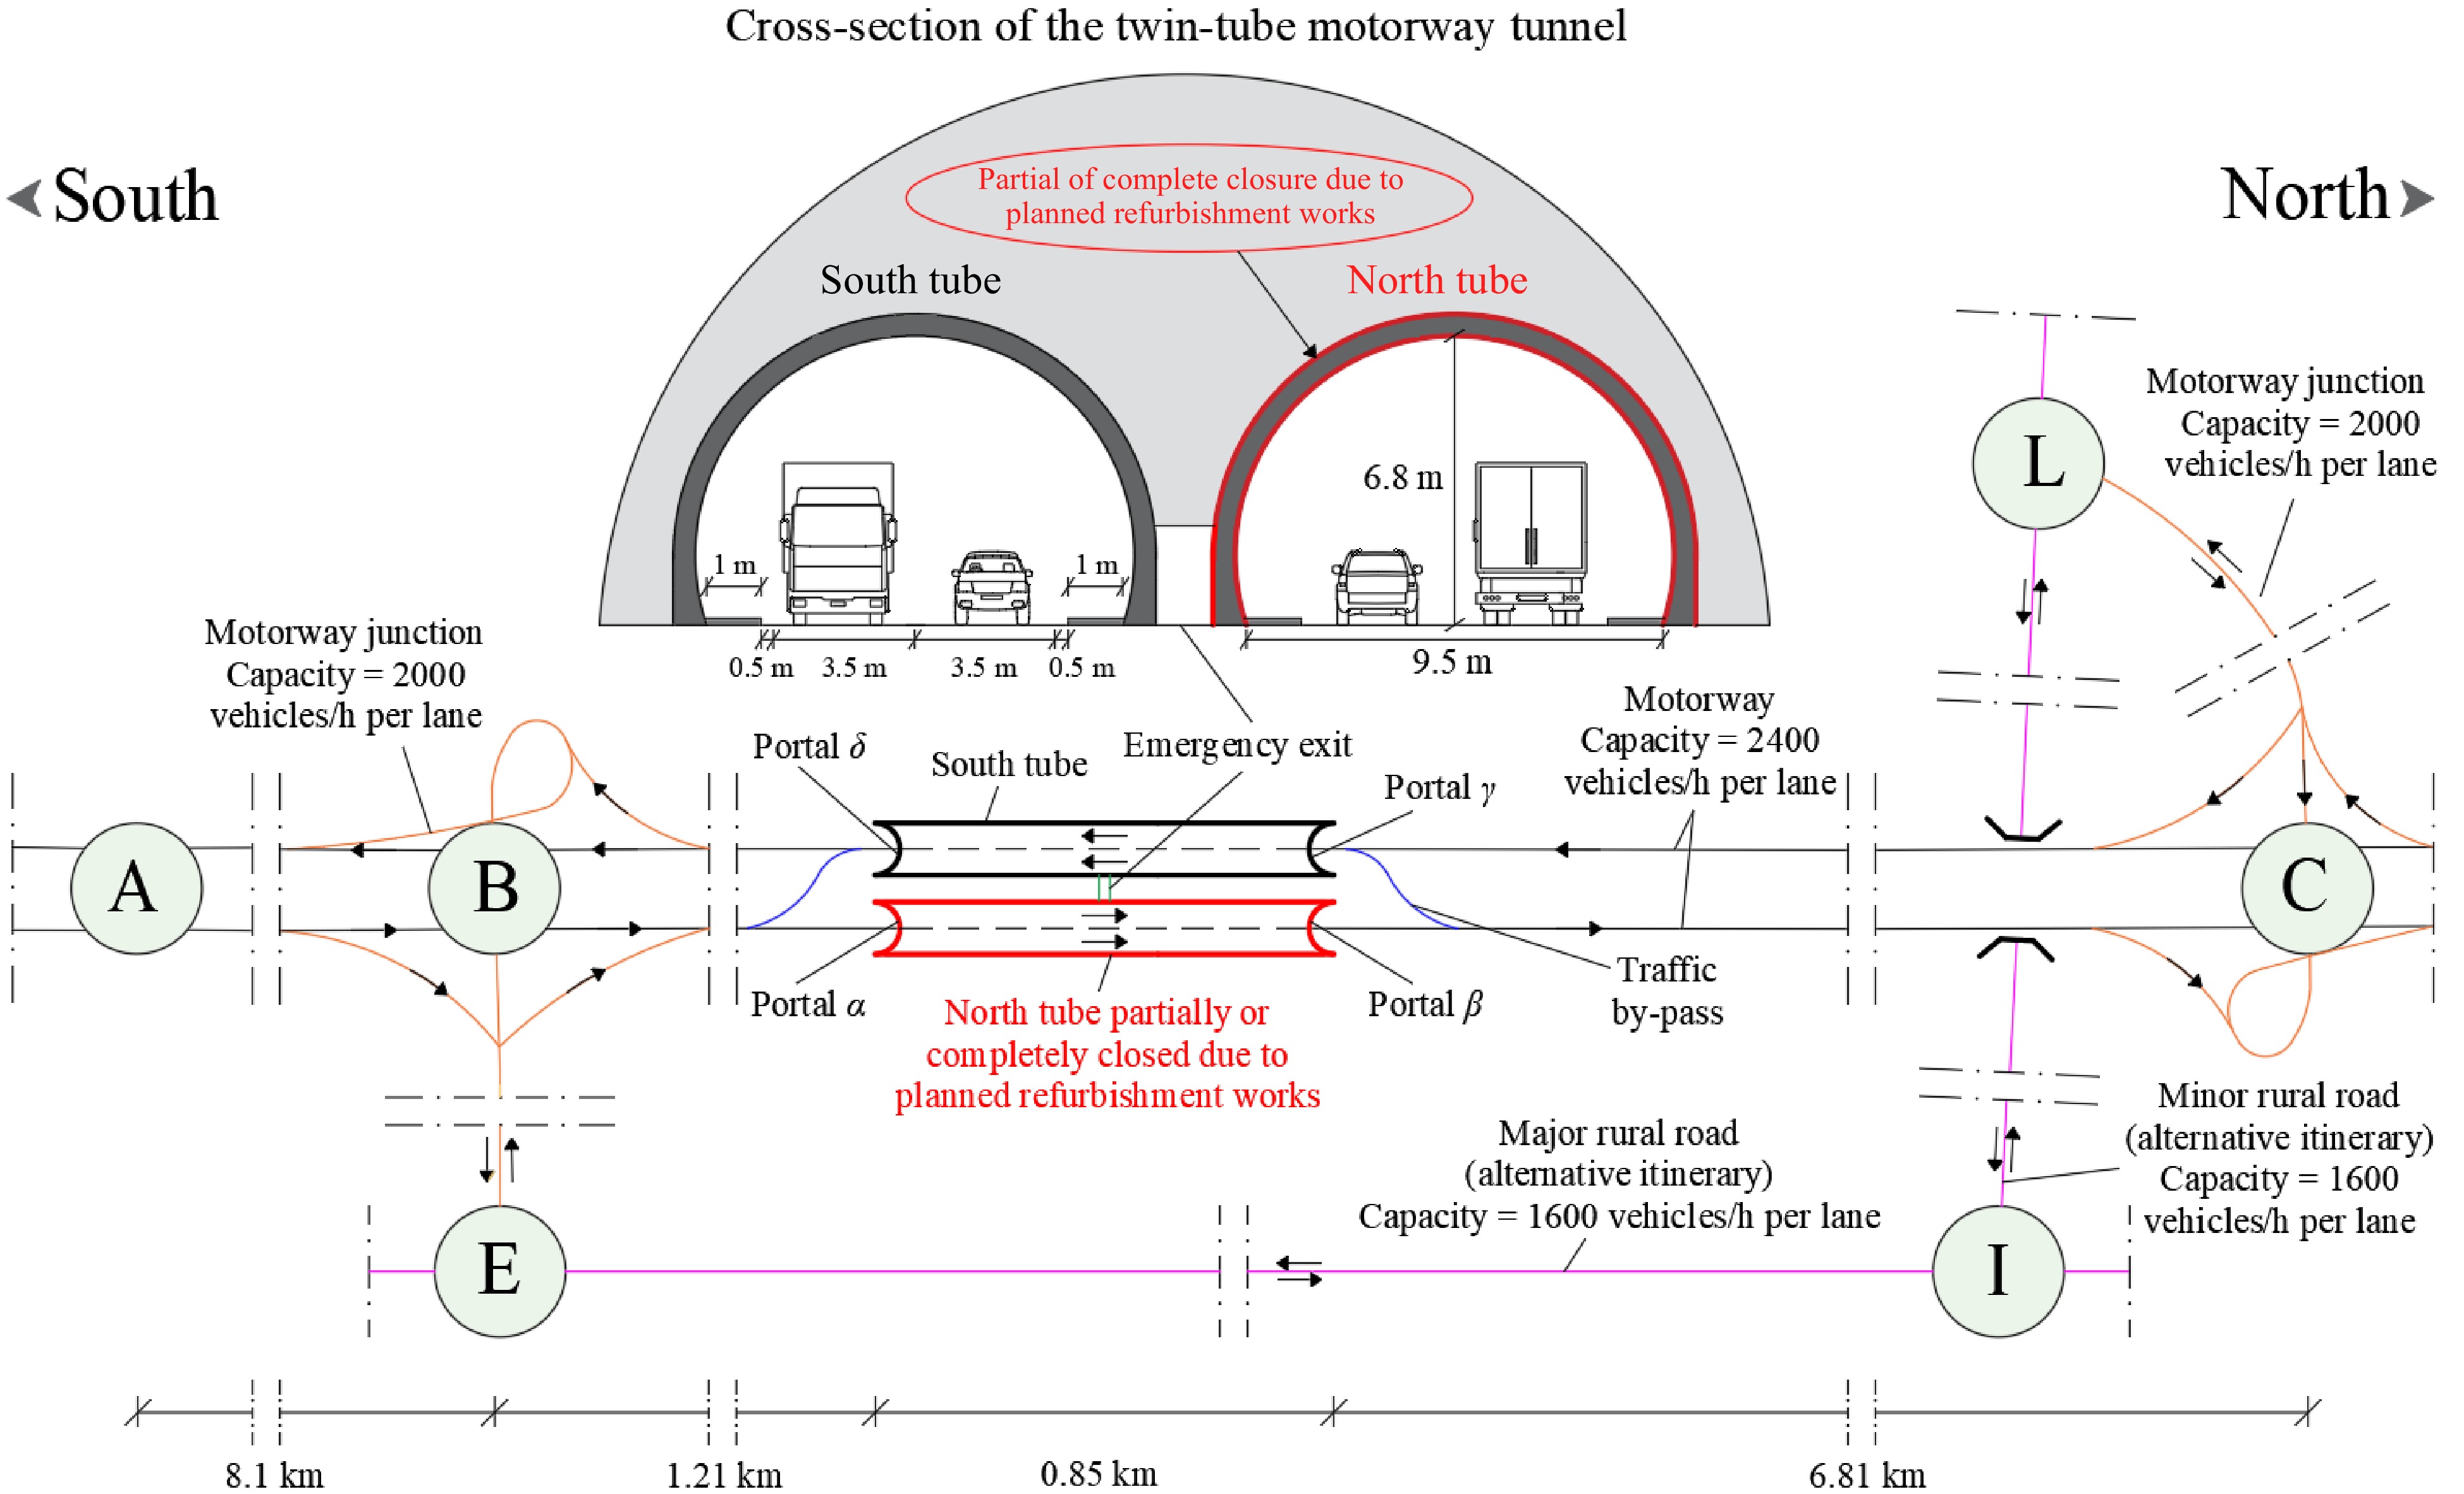
Figure 1.
Graphical depiction of the road network representing the study area and the cross-section of the twin-tube motorway tunnel investigated in this study.
The tunnel system consists of two straight and flat tubes 850 m long, transversally connected by an emergency exit located in the middle of the tunnel length. Each tube is ordinarily used for traffic in one driving direction and has two lanes 3.5 m wide.
Figure 1 also shows the portion of the road network (i.e., the study area) most affected by the consequences (e.g., reduction in the travel speed of vehicles) due to the partial or complete closure of the north tube, the extension of which was determined by preliminary traffic simulations (for more detail see Caliendo et al.[19]). In particular, the study area includes: (i) the motorway section (i.e., A–C road section) containing the north tube that is assumed to be partially or completely closed due to planned refurbishment works; (ii) the motorway section (i.e., C–A road section) containing the south tube that might be used for bi-directional traffic by means of the traffic by-passes situated at a certain distance from the entrance portal of the north tube in the case in which it remains completely closed; (iii) the motorway junctions (i.e., B–E and L–C road sections), the two-way major rural road (i.e., E–I road section), and the two-way minor rural road (i.e., I–L road section) that can be used as an alternative itinerary by the northbound traffic flow when the north tube is partially or completely closed due to planned refurbishment works.
Speed limits of each road section
-
The speed limits imposed on each road section constituting the study area were taken from the Italian Highway Code. The maximum speeds allowed are: (i) 130 and 100 km/h on the motorway sections for passenger cars and heavy vehicles (i.e., buses and Heavy Good Vehicles (HGVs)), respectively; (ii) 70 and 50 km/h on both the major and minor rural roads for passenger cars and heavy vehicles, respectively; (iii) 40 km/h on the motorway junctions for both passenger cars and heavy vehicles.
Scenarios investigated
-
It was considered that the refurbishment works involve one tube and that they are performed in the north tube that remains partially or completely closed to traffic for 6 h a day (i.e., equal to a daily work shift), namely from 7:00 a.m. to 1:00 p.m. Specifically, the work shift was assumed to start at the beginning of the peak traffic hour in the morning (i.e., 7:00 a.m.) to investigate the worst-case scenario in terms of negative effects on the vehicles' speed.
Figure 2 graphically shows the five scenarios investigated. In particular, Scenario 0 represents the reference scenario where the north tube is not yet under refurbishment works, this means that each tube is used for traffic in one driving direction. In Scenario 1, the north tube was considered to be partially closed (only one lane remains available) to perform certain planned refurbishment works within it, so all the vehicles (i.e., passenger cars and heavy vehicles) use its remaining undisrupted lane to keep traveling in the north direction; the speed limit imposed at the entrance portal (i.e., Portal α, see Fig. 1) of the north tube was set at 60 km/h. In Scenario 2, the execution of the planned refurbishment works was assumed to require the complete closure of the north tube (i.e., both lanes are closed); hence, both passenger cars and heavy vehicles continue to travel northbound using one lane of the south tube temporarily affected by bi-directional traffic by means of the use of the two traffic by-passes that are located in the proximity of the tunnel portals (the two traffic by-passes are considered to be opened simultaneously with the complete closure of the north tube at 7:00 a.m.); a speed limit of 60 km/h was imposed also at the entrance portal (i.e., Portal γ) of the south tube for vehicles traveling towards the south direction. Scenario 3 differs from the corresponding Scenario 1 for the activation of an alternative route for northbound HGVs only, which is suggested by the VMSs located upstream of the motorway junction preceding the north tube (i.e., Node B of Fig. 1). Scenario 4 differs from the corresponding Scenario 2 for the re-routing of only northbound HGVs along an alternative itinerary suggested by the activation of VMSs. Finally, in order to take into consideration the case in which the alternative itinerary is not available, in Scenario 5, the north tube was assumed to remain partially closed due to the execution of refurbishment works, with its remaining undisrupted lane used only by HGVs directed towards the north, while northbound passenger cars use the south tube temporarily affected by bi-directional traffic to reach their destination.
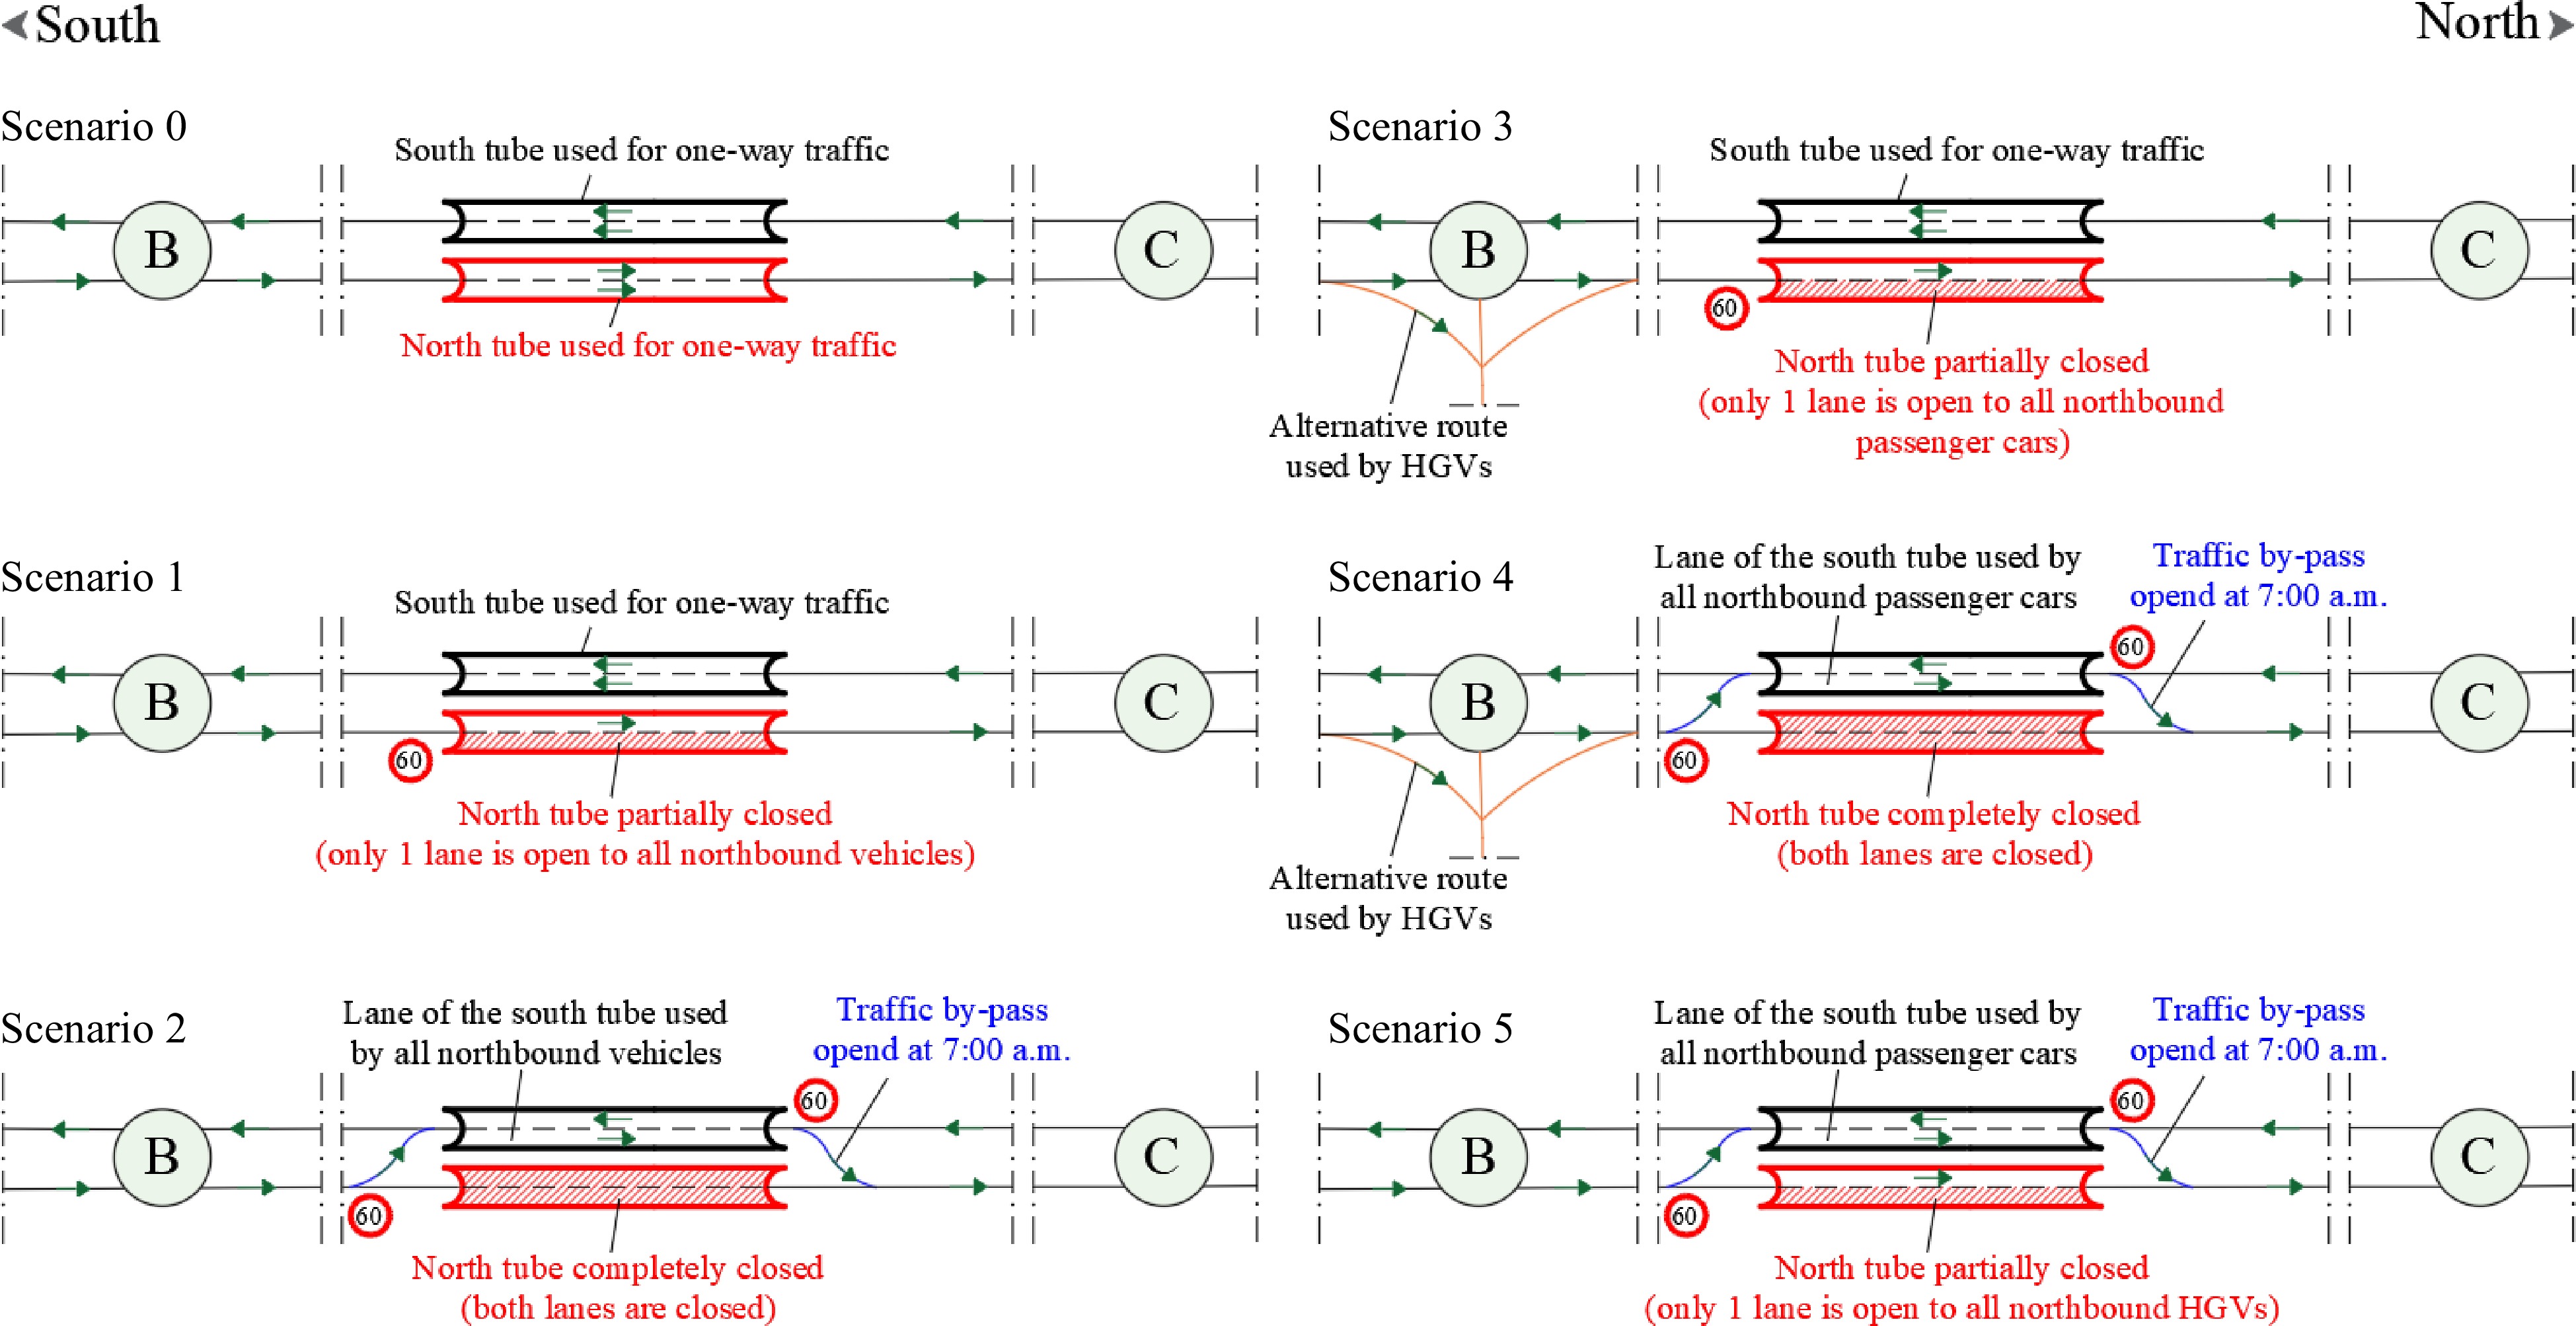
Figure 2.
Graphical description of the scenarios investigated. Scenario 0 in which the north tube is not yet under refurbishment works. Scenario 1 involves the partial closure of the north tube. Scenario 2 includes the complete closure of the north tube and the use of the south tube for two-way traffic. Scenario 3 differs from the corresponding Scenario 1 for the activation of an alternative route along which only HGVs directed towards the north are diverted. Scenario 4 differs from the corresponding Scenario 2 for the re-routing of only northbound HGVs along an alternative itinerary. Scenario 5 involves the partial closure of the north tube with its remaining undisrupted lane used only by HGVs directed towards the north, while northbound passenger cars use the south tube affected by bi-directional traffic.
Traffic
-
The traffic flows, expressed in terms of hourly traffic volumes, during the two peak hours (i.e., from 7:00 a.m. to 9:00 a.m.) and four off-peak hours (i.e., from 9:00 a.m. to 1:00 p.m.) included in the analysis period (i.e., from 7:00 a.m. to 1:00 p.m.) were provided by the management agencies of the various road segments within the study area and are shown in Table 2.
Table 2. Hourly traffic volumes during the two peak hours (i.e., from 7:00 a.m. to 9:00 a.m.) and four off-peak hours (i.e., from 9:00 a.m. to 1:00 p.m.) along the different road sections within the study area. In brackets is the number of heavy vehicles, which includes buses and HGVs, in the total traffic. The arrows indicate the direction of travel.
Direction of travel Hourly traffic volumes [vehicles/h per lane] Motorway Major rural road Motorway junctions A→B B→C A←B B←C E⇔I B→E L→C B←E L←C Two peak hours: 7:00 a.m. – 9:00 a.m. 1,099 (275) 1,100 (275) 1,039 (260) 1,038 (260) 776 (19) 499 (100) 571 (114) 504 (101) 550 (110) Four off-peak hours: 9:00 a.m. – 1:00 p.m. 275 (69) 275 (69) 260 (65) 260 (65) 194 (5) 125 (25) 143 (29) 126 (25) 259 (52) With reference to the case in which the tunnel system is not yet under refurbishment work (i.e., Scenario 0), by comparing the hourly traffic volumes shown in Table 2 with the capacity per lane of each type of road segment within the study area reported in Fig. 1, it is possible to note that the traffic is always less than the corresponding capacity. Regarding the other scenarios investigated, it is to be stressed that when the north tube is partially closed in order to perform the planned refurbishment work (i.e., Scenarios 1, 3, and 5), the capacity of its remaining undisrupted lane was considered to be 1,700 vehicles/h. Instead, when the south tube is affected by bi-directional traffic because the north tube is partially (i.e., Scenario 5) or completely (i.e., Scenarios 2 and 4) closed, its capacity per lane was assumed to be 1,600 vehicles/h. It is worth noting that the mentioned values of the capacity per lane were taken from the Highway Capacity Manual[22] by considering similar roads.
Resilience metrics
-
The travel speed of traffic flow averaged over the time of partial or complete closure of the north tube (i.e., 6 h) was used in the present paper as a traffic-based functionality parameter; while the resilience loss, recovery speed, and the resilience index were applied to quantitatively evaluate the resilience of the investigated twin-tube road tunnel affected by planned refurbishment works. Specifically, the residual level of functionality of the tunnel system following the partial or complete closure of the disrupted tube was computed as the ratio between the average travel speed of the traffic flow along the motorway section in the north direction (i.e., from the Nodes A to C) after and before the start of the planned refurbishment works.
First of all, the functionality level (F) of the investigated twin-tube road tunnel was assumed to be F0 = 100% without refurbishment work, namely until the time t0; then, when the refurbishment works start, the functionality level (F) decreases and, in this study, it was assumed to reach instantaneously (i.e., at the time ta coinciding with t0) the value Fa <F0. Subsequently, F remains equal to Fa until the time tr, namely for the entire simulation period of 6 h (i.e., tr – t0 represents the time during which Fa is constant). Finally, when the daily work shift for carrying out the refurbishment work is assumed to end (i.e., at 1:00 p.m.), the functionality level of the tunnel system begins to increase and achieve its initial value F0 = 100% after a certain time th (i.e., th – tr represents the time period needed to reach F = F0 = 100% again). More details about the graphical representation of the functionality curve over time can be found in Caliendo et al.[19].
Consequently, the analytical equations used as resilience metrics in the present paper are:
$ {R}_{LOSS}={\int }_{{t}_{0}}^{{t}_{h}}\left[100-F\left(t\right)\right]dt $ $ \mathit{tan}\beta =\frac{{F}_{0}-{F}_{a}}{{t}_{h}-{t}_{r}} $ $ {R(t}_{h})=\frac{{\int }_{{t}_{0}}^{{t}_{h}}F\left(t\right)dt}{{t}_{h}-{t}_{0}} $ Research framework
-
This study is set in the context of the resilience analysis of a twin-tube road tunnel in the case of the partial or complete closure of one of its tubes in order to perform planned activities (e.g., refurbishment works for complying it with the safety provisions imposed by Directive 2004/54/EC). However, it extends the state-of-the-art by implementing a traffic macro-simulation model to quantitatively assess the reduction in the average vehicles’ speed along the road network containing the structure under the mentioned planned activities, while also identifying the most suitable traffic management strategy to contain these reductions or, in other terms, to improve the resilience of the tunnel system. Moreover, this paper shows the effectiveness of certain digital technologies, such as VMSs, used to suggest to the traffic flow certain alternative itineraries in the surrounding road network.
In light of the above considerations, this research might represent a potential support tool for Tunnel Management Agencies (TMAs) in selecting the most suitable traffic management strategy in the case in which a tunnel is under planned refurbishment works that are carried out according to daily work shifts, while also providing additional insights on the performance of a road network when one or more of its links are partially or completely closed.
The flow chart of the methodology is shown in Fig. 3.
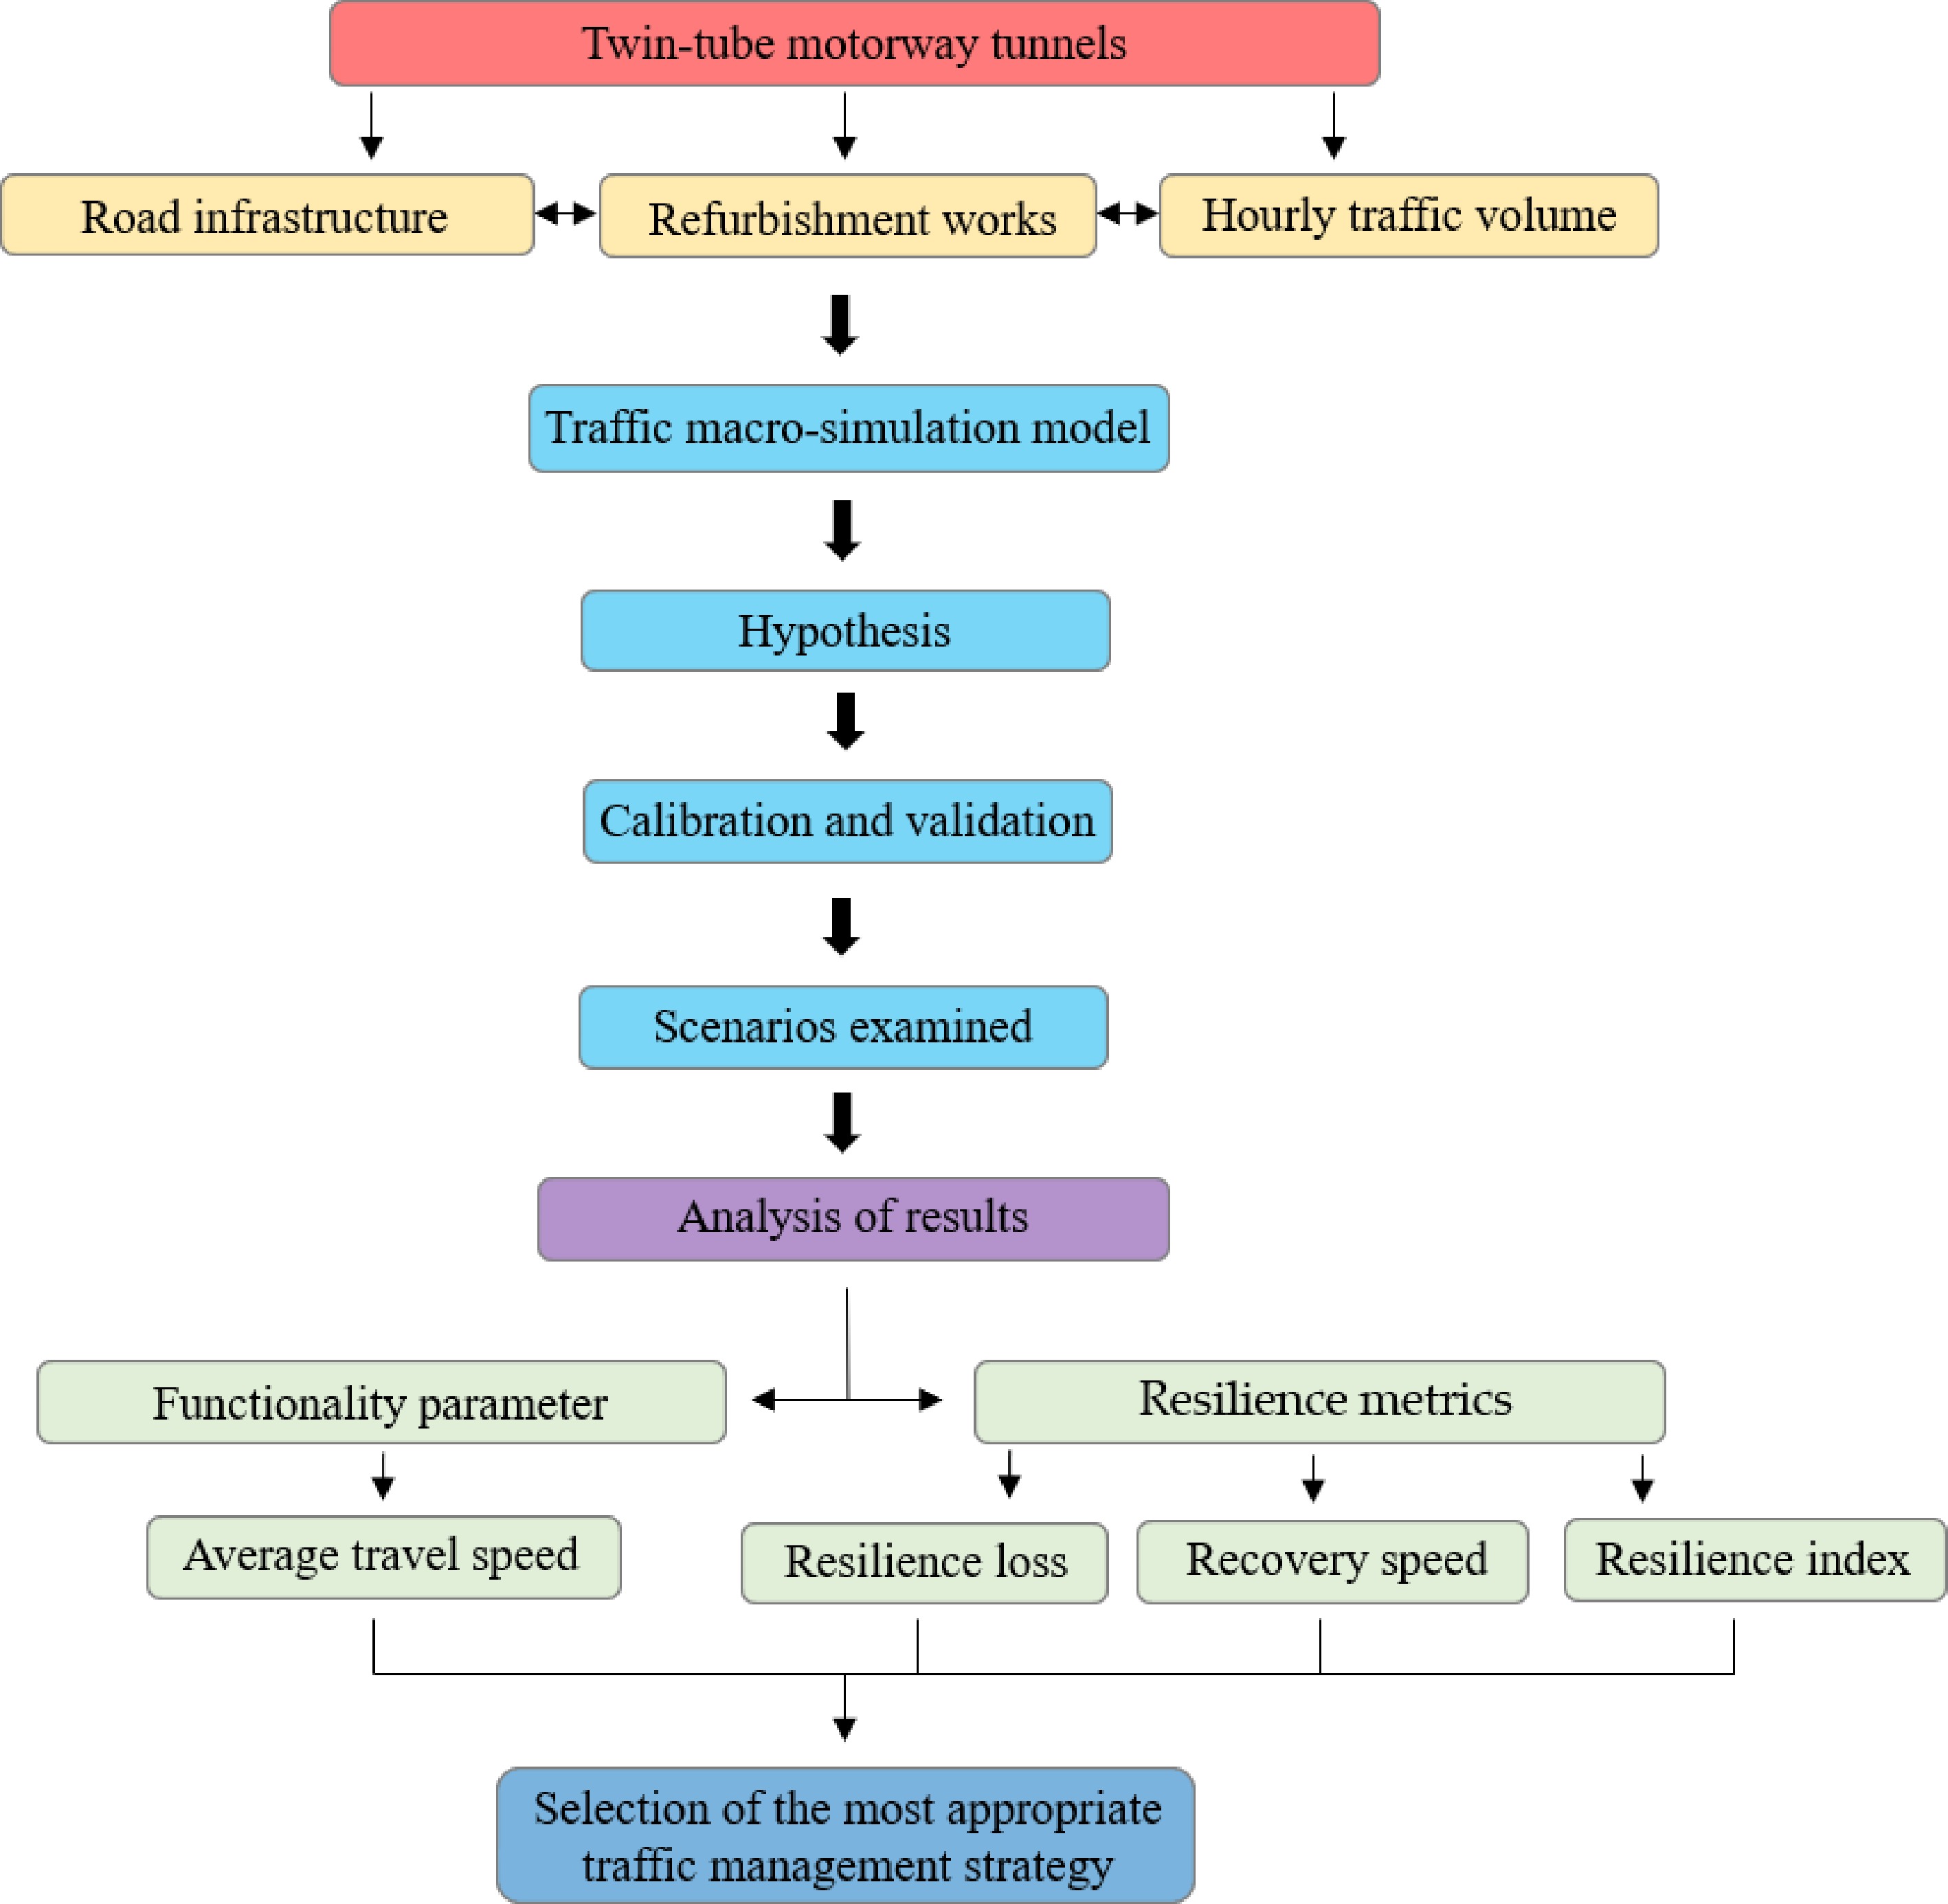
Figure 3.
Flow chart of the methodology.
-
With the aim of estimating the reduction in the travel speed of vehicles due to the execution of refurbishment works in the north tube, a traffic macro-simulation model was set up using the PTV Visum code 17 version[23]. The analysis period in the simulation modeling started one hour before the beginning of the daily work shift for carrying out the refurbishment work in the north tube (i.e., at 6:00 a.m.) in order to represent the road network already charged by traffic, it was stopped 3 h after the end of the daily work shift (i.e., at 4:00 p.m.) for continuing the investigation of the impacts on traffic flow during to the recovery process. Therefore, the total simulation time was equal to 10 h against the 6 h (i.e., from 7:00 a.m. to 1:00 p.m.) of the effective daily work shift in the north tube.
The main input data to be defined in order to set up the PTV Visum code concerned: (i) the geometry of the transportation network of interest; (ii) the capacity of each road segment, together with the maximum speed permitted for each type of vehicle; (iii) the Dynamic User Equilibrium (DUE) as a traffic assignment procedure to account for both the fluctuation in the traffic demand (i.e., peak hours and off-peak hours) and transport supply (i.e., closure of one or more lanes); (iv) the time interval with which the code provides the results (i.e., the travel speed of vehicular flow along each road section within the study area), which was assumed to be equal to 5 min as suggested by the PTV Visum User’s Guide[23].
Regarding the criterion for verifying the convergence of results, this was considered to be achieved when the difference in the output between two subsequent runs was less than 5%. Specifically, 10 simulations were required in this study.
The above-mentioned traffic macro-simulation model was calibrated by comparing the simulated hourly traffic volumes with the measured ones, ensuring that the GEH statistic was lower than the recommended value of 5 for each traffic stream within the study area. Moreover, it was validated by performing a comparison between the simulated and measured length of the vehicle queue caused by the occurrence of a real traffic accident in the north tube. More details on the calibration and validation process are reported in Caliendo et al.[19].
-
The travel speed averaged over the aforementioned period of 6 h, during which the north tube was partially or completely closed due to planned refurbishment works, was used as a functionality parameter.
Figure 4 shows the longitudinal spatial distributions of the average travel speed of traffic flow along the motorway in the north direction (i.e., from the Nodes A to C of Fig. 1). It is possible to note that when the north tube is not yet under refurbishment works (i.e., Scenario 0), the northbound vehicular flow, consisting of both passenger cars and HGVs, is characterized by an average travel speed of about 120 km/h, and it remains constant along the motorway segment from Nodes A to C.
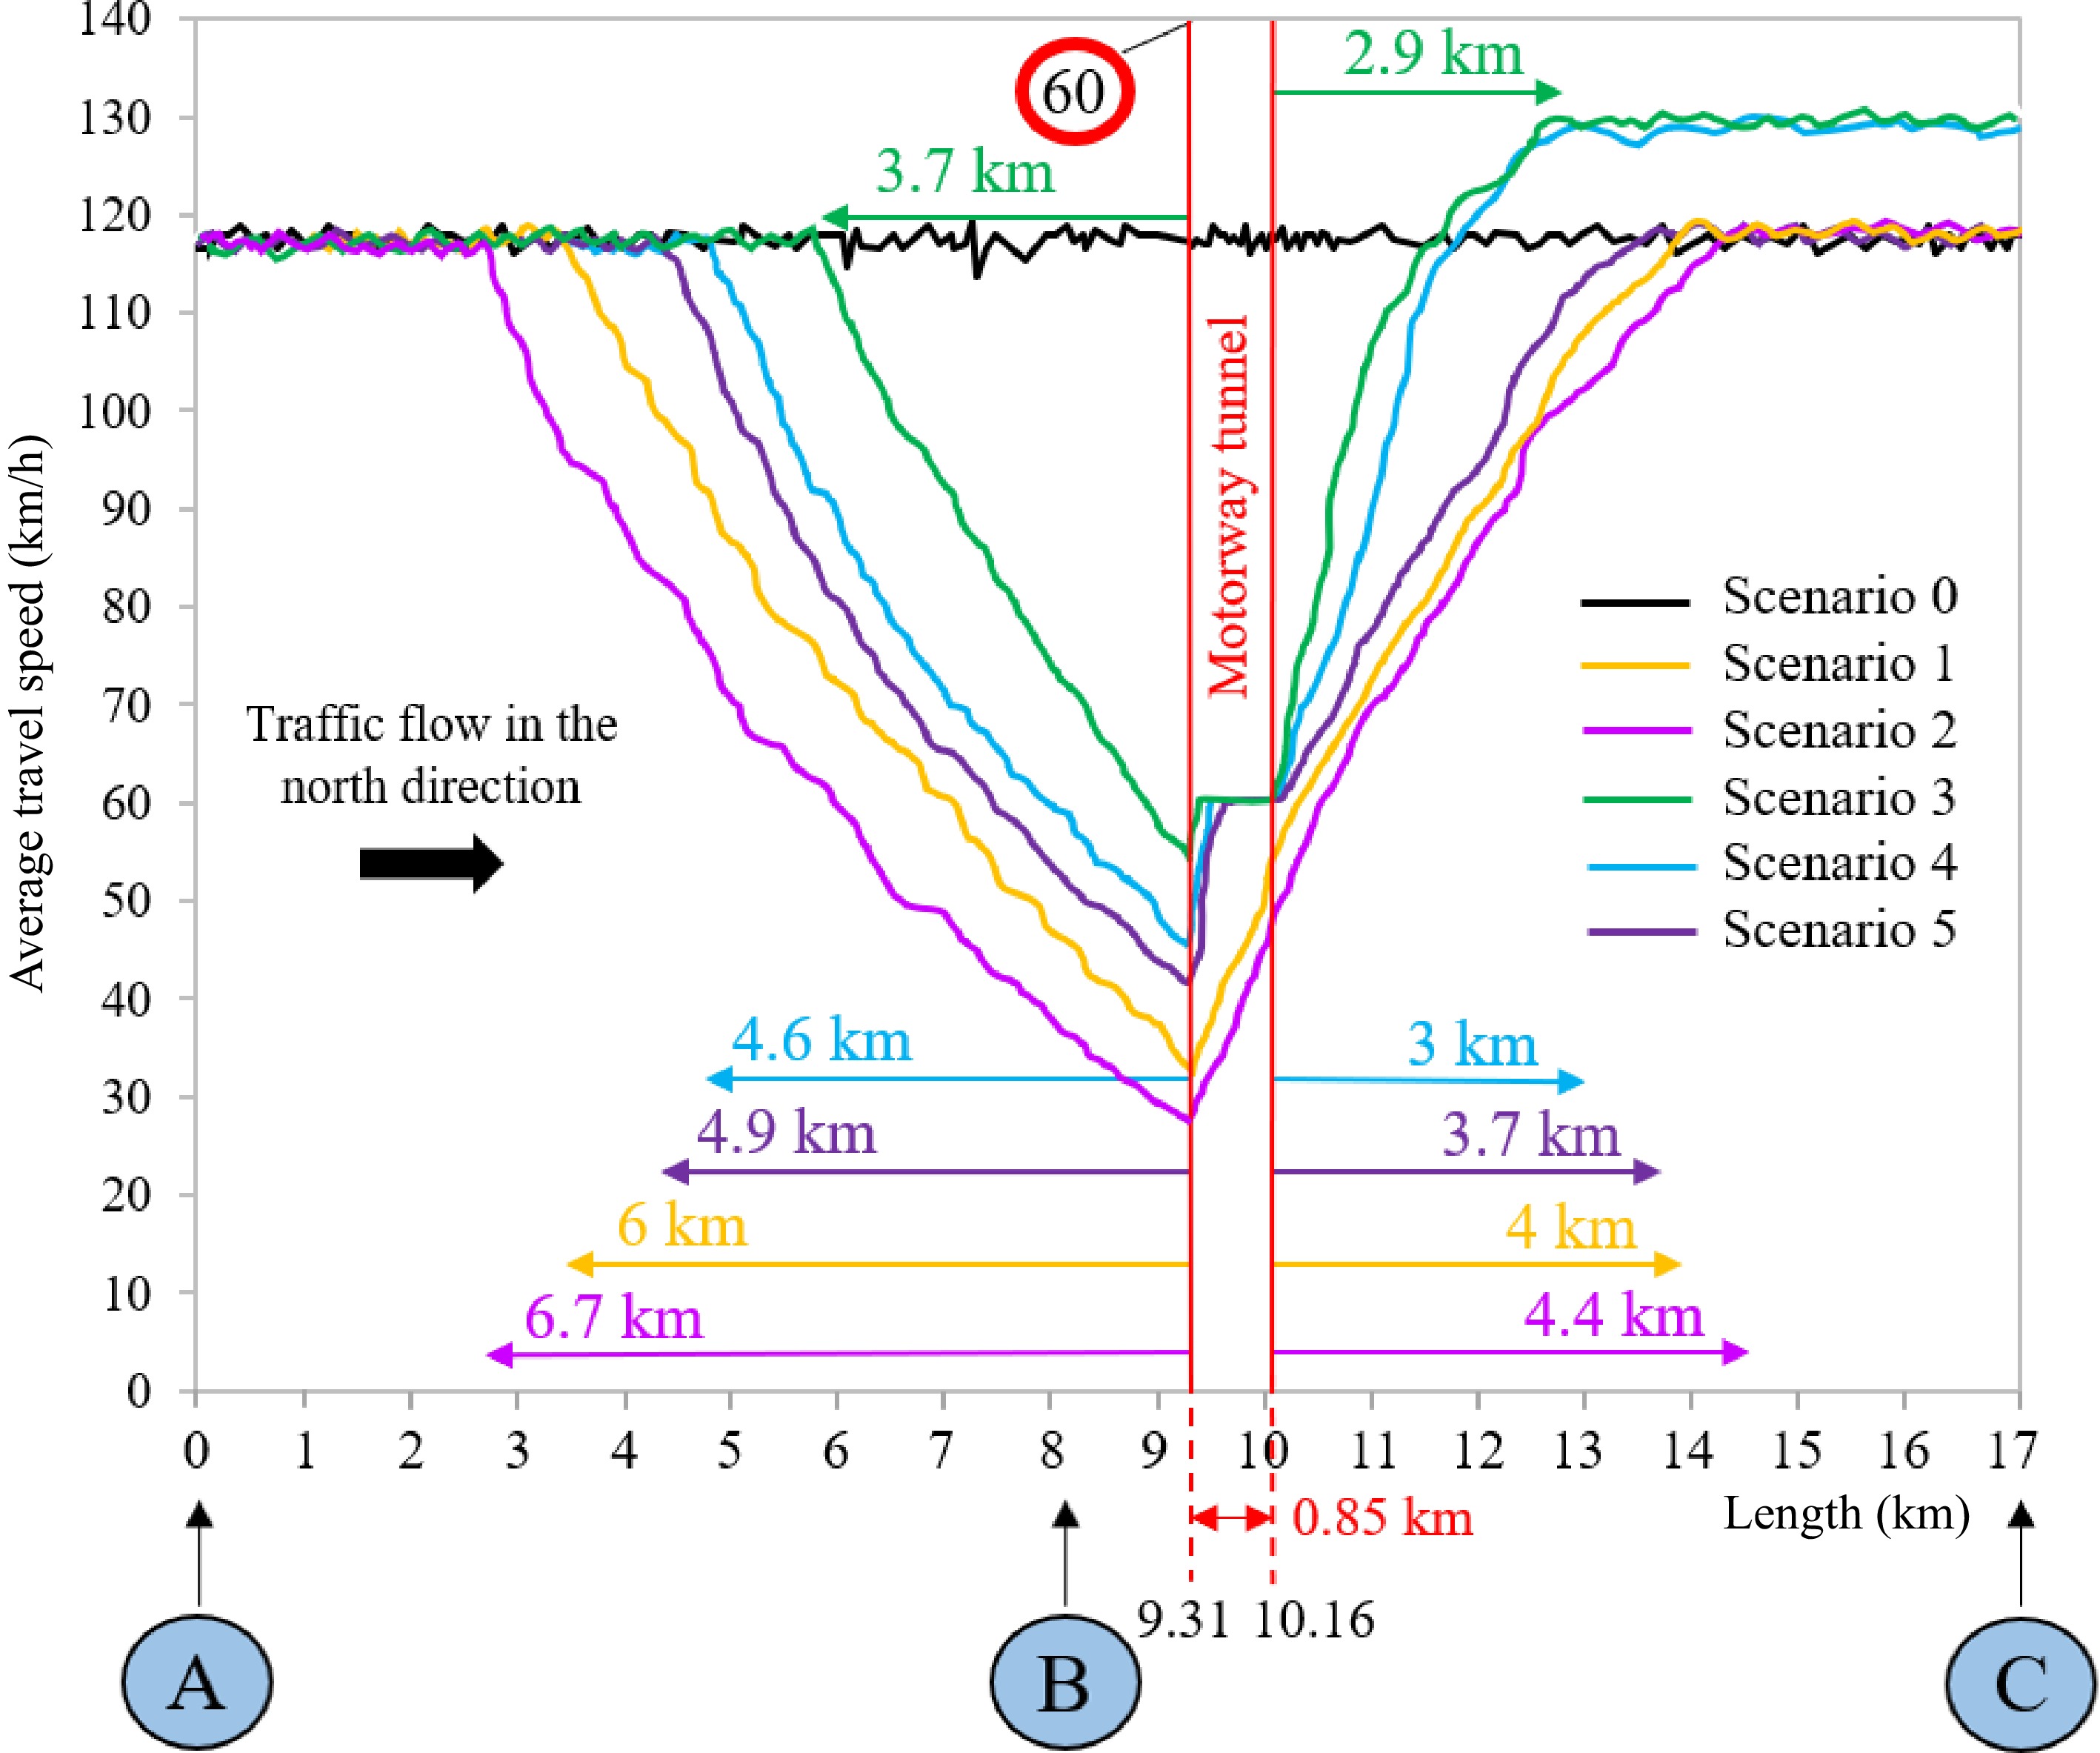
Figure 4.
Longitudinal spatial distributions of the average travel speed of traffic flow along the motorway in the north direction (i.e., from the Nodes A to C) for the analysis period of 6 h. Scenario 0 in which the north tube is not yet under refurbishment works. Scenario 1 involves the partial closure of the north tube. Scenario 2 includes the complete closure of the north tube and the use of the south tube for two-way traffic. Scenario 3 differs from the corresponding Scenario 1 for the activation of an alternative route along which only HGVs directed towards the north are diverted. Scenario 4 differs from the corresponding Scenario 2 for the re-routing of only northbound HGVs along an alternative itinerary. Scenario 5 involves the partial closure of the north tube with its remaining undisrupted lane used only by HGVs directed towards the north, while northbound passenger cars use the south tube affected by bi-directional traffic.
Figure 4 also shows that when the north tube is partially closed (i.e., only one lane remains usable by vehicular flow) and the alternative itinerary is not yet activated (i.e., Scenario 1), the average travel speed of 120 km/h of all northbound vehicles (i.e., both passenger cars and HGVs) progressively decreases as they approach the entrance portal (i.e., Portal α, see Fig. 1) of the tube interested by planned refurbishment works. Specifically, because of the partial closure of the north tube, the vehicular flow starts to decelerate at a distance of 6 km from Portal α, and the average travel speed decreases from about 120 km/h to 33 km/h in the proximity of the mentioned portal. Downstream of Portal α, the vehicles start to accelerate within the north tube by using its undisturbed lane, and the average travel speed reaches again the value of 120 km/h at a distance of about 4 km downstream of the exit portal (i.e., Portal β) of the north tube. In this scenario, it is worth noting that the average speed of vehicles within the north tube is lower than the imposed speed limit of 60 km/h. Moreover, it is also to be mentioned that the longitudinal spatial distribution of the average travel speed is not symmetrical upstream and downstream of the north tube, which underlines how the vehicles downstream of Portal β accelerate more than they decelerate upstream of Portal α due to a closed lane.
From Fig. 4, in which the north tube is completely closed and the alternative route is not yet activated so that all the vehicles (i.e., both passenger cars and HGVs) are forced to travel towards the north direction using a lane of the south tube that is re-organized for bi-directional traffic (i.e., Scenario 2), a reader can note both a greater reduction in the average travel speed if compared to Scenario 1, and that the travel speed starts to decrease at a longer distance from the entrance portal (i.e., Portal δ) of the south tube for northbound vehicles. This is caused by the interaction with the vehicles traveling in the opposite direction. As an additional consequence, the average speed of vehicles traveling towards the north direction will reach the value of 120 km/h at a greater distance from the exit portal (i.e., Portal γ) of the south tube.
The activation of VMSs, which alert only northbound HGVs to divert along an alternative route in the surrounding road infrastructure, was found to have a positive impact in containing the reduction in the average travel speed of vehicles due to the partial or complete closure of the north tube. In fact, when the north tube is partially (i.e., Scenario 3) and completely (i.e., Scenario 4) closed with the alternative itinerary used only by HGVs, Fig. 4 shows that the distance from the entrance portal (i.e., Portal α in Scenario 3 or Portal δ in Scenario 4) at which vehicles start to decrease their speed is reduced if compared to that of the corresponding cases without the activation of VMSs (i.e., Scenario 3 against Scenario 1, and Scenario 4 against Scenario 2). Moreover, the average speed of passenger cars in the proximity of the mentioned entrance portal is also found to be higher if compared to that of all the vehicles (i.e., both passenger cars and HGVs) when the alternative itinerary is not used. Within one of the two tubes (i.e., the north tube or the south tube in the case of the partial or complete closure of the north tube interested by refurbishment works, respectively), the average speed of passenger cars reaches the speed limit of 60 km/h. Finally, passenger cars downstream of Portal β reach a higher speed (i.e., 130 km/h) in a shorter distance compared to that of the corresponding cases without the activation of VMSs (i.e., Scenario 3 against Scenario 1, and Scenario 4 against Scenario 2). Therefore, the implementation of digital technologies, such as VMSs, can significantly mitigate the negative impact of the refurbishment works on the reduction of travel speeds.
From Fig. 4 it is also possible to note that, when an alternative itinerary is not available and the north tube is partially closed with its undisturbed lane used only by HGVs while passenger cars travel northbound by using a lane of the south tube re-organized for bi-directional traffic (i.e., Scenario 5): (i) the average speed (considering both the passenger cars and HGVs) of 120 km/h starts to decrease at a longer distance from Portal δ than in Scenario 4, this happens because in Scenario 5 the HGVs do not leave the motorway section; (ii) the average speed (calculated by considering only the passenger cars) at Portal δ is lower than that corresponding in Scenario 4 for the presence of HGVs; (iii) in the south tube used for bi-directional traffic, the average speed of northbound passenger cars is more or less the same as in Scenario 4; (iv) downstream of Portal γ, with the return of the passenger cars to the north carriageway, the average speed (considering both the passenger cars and HGVs) increases up to 120 km/h, but remains below the 130 km/h of Scenario 4.
These results show that a lower reduction in the average travel speed of traffic flow is found with the partial closure of the north tube due to planned refurbishment works rather than its complete closure, and that additional advantages are obtained with the activation of VMSs that forces the HGVs to leave the road section and use an alternative itinerary of the network.
Resilience loss and recovery speed
-
The residual level of functionality of the tunnel system during the partial or complete closure of the north tube due to planned refurbishment works was calculated as the ratio between the average travel speed of the traffic flow along the motorway section in the north direction (i.e., from the Nodes A to C) after and before the start of the planned refurbishment works. As an example, given that in absence of any refurbishment work within the north tube (i.e., Scenario 0) the average travel speed is about 120 km/h while it is 91.24 km/h in the case of the partial closure (i.e., Scenario 1), the percentage level of functionality of the tunnel system in Scenario 1 was found to be equal to: Fa,1 = (91.24/120) × 100 = 76.03%. Similarly, when the north tube is completely closed due to refurbishment works (i.e., Scenario 2), the percentage level of functionality of the tunnel system in Scenario 2 was computed to be equal to: Fa,2 = (85.12/120) × 100 = 70.93%, and so on for the other investigated scenarios. The functionality curve over time was then built for each examined scenario by reporting on the y-axis and x-axis the functionality level of the tunnel system and the simulation analysis period (i.e., 6:00 a.m. – 4:00 p.m.), respectively.
Figure 5 shows the functionality curve over time of the tunnel system analyzed for the different scenarios investigated, in which t0 represents the time instant when the refurbishment works start within the north tube (i.e., 7:00 a.m.); tr indicates the time instant when the tunnel system starts to recover its full functionality after the end of the daily work shift (i.e., 1:00 p.m.); and th,i identifies the time instant when the tunnel system is again fully functional with reference to the i-th scenario. In this respect, the trapezium area delimited by the functionality curve Fi over time of the i-th scenario and the constant line corresponding to the full functionality (i.e., F0 = 100%) represents the resilience loss in the i-th scenario investigated (i.e.,
$ {R}_{LOSS,i}={\int }_{{t}_{0}}^{{t}_{h,i}}\left[100-{F}_{i}\left(t\right)\right]dt $ 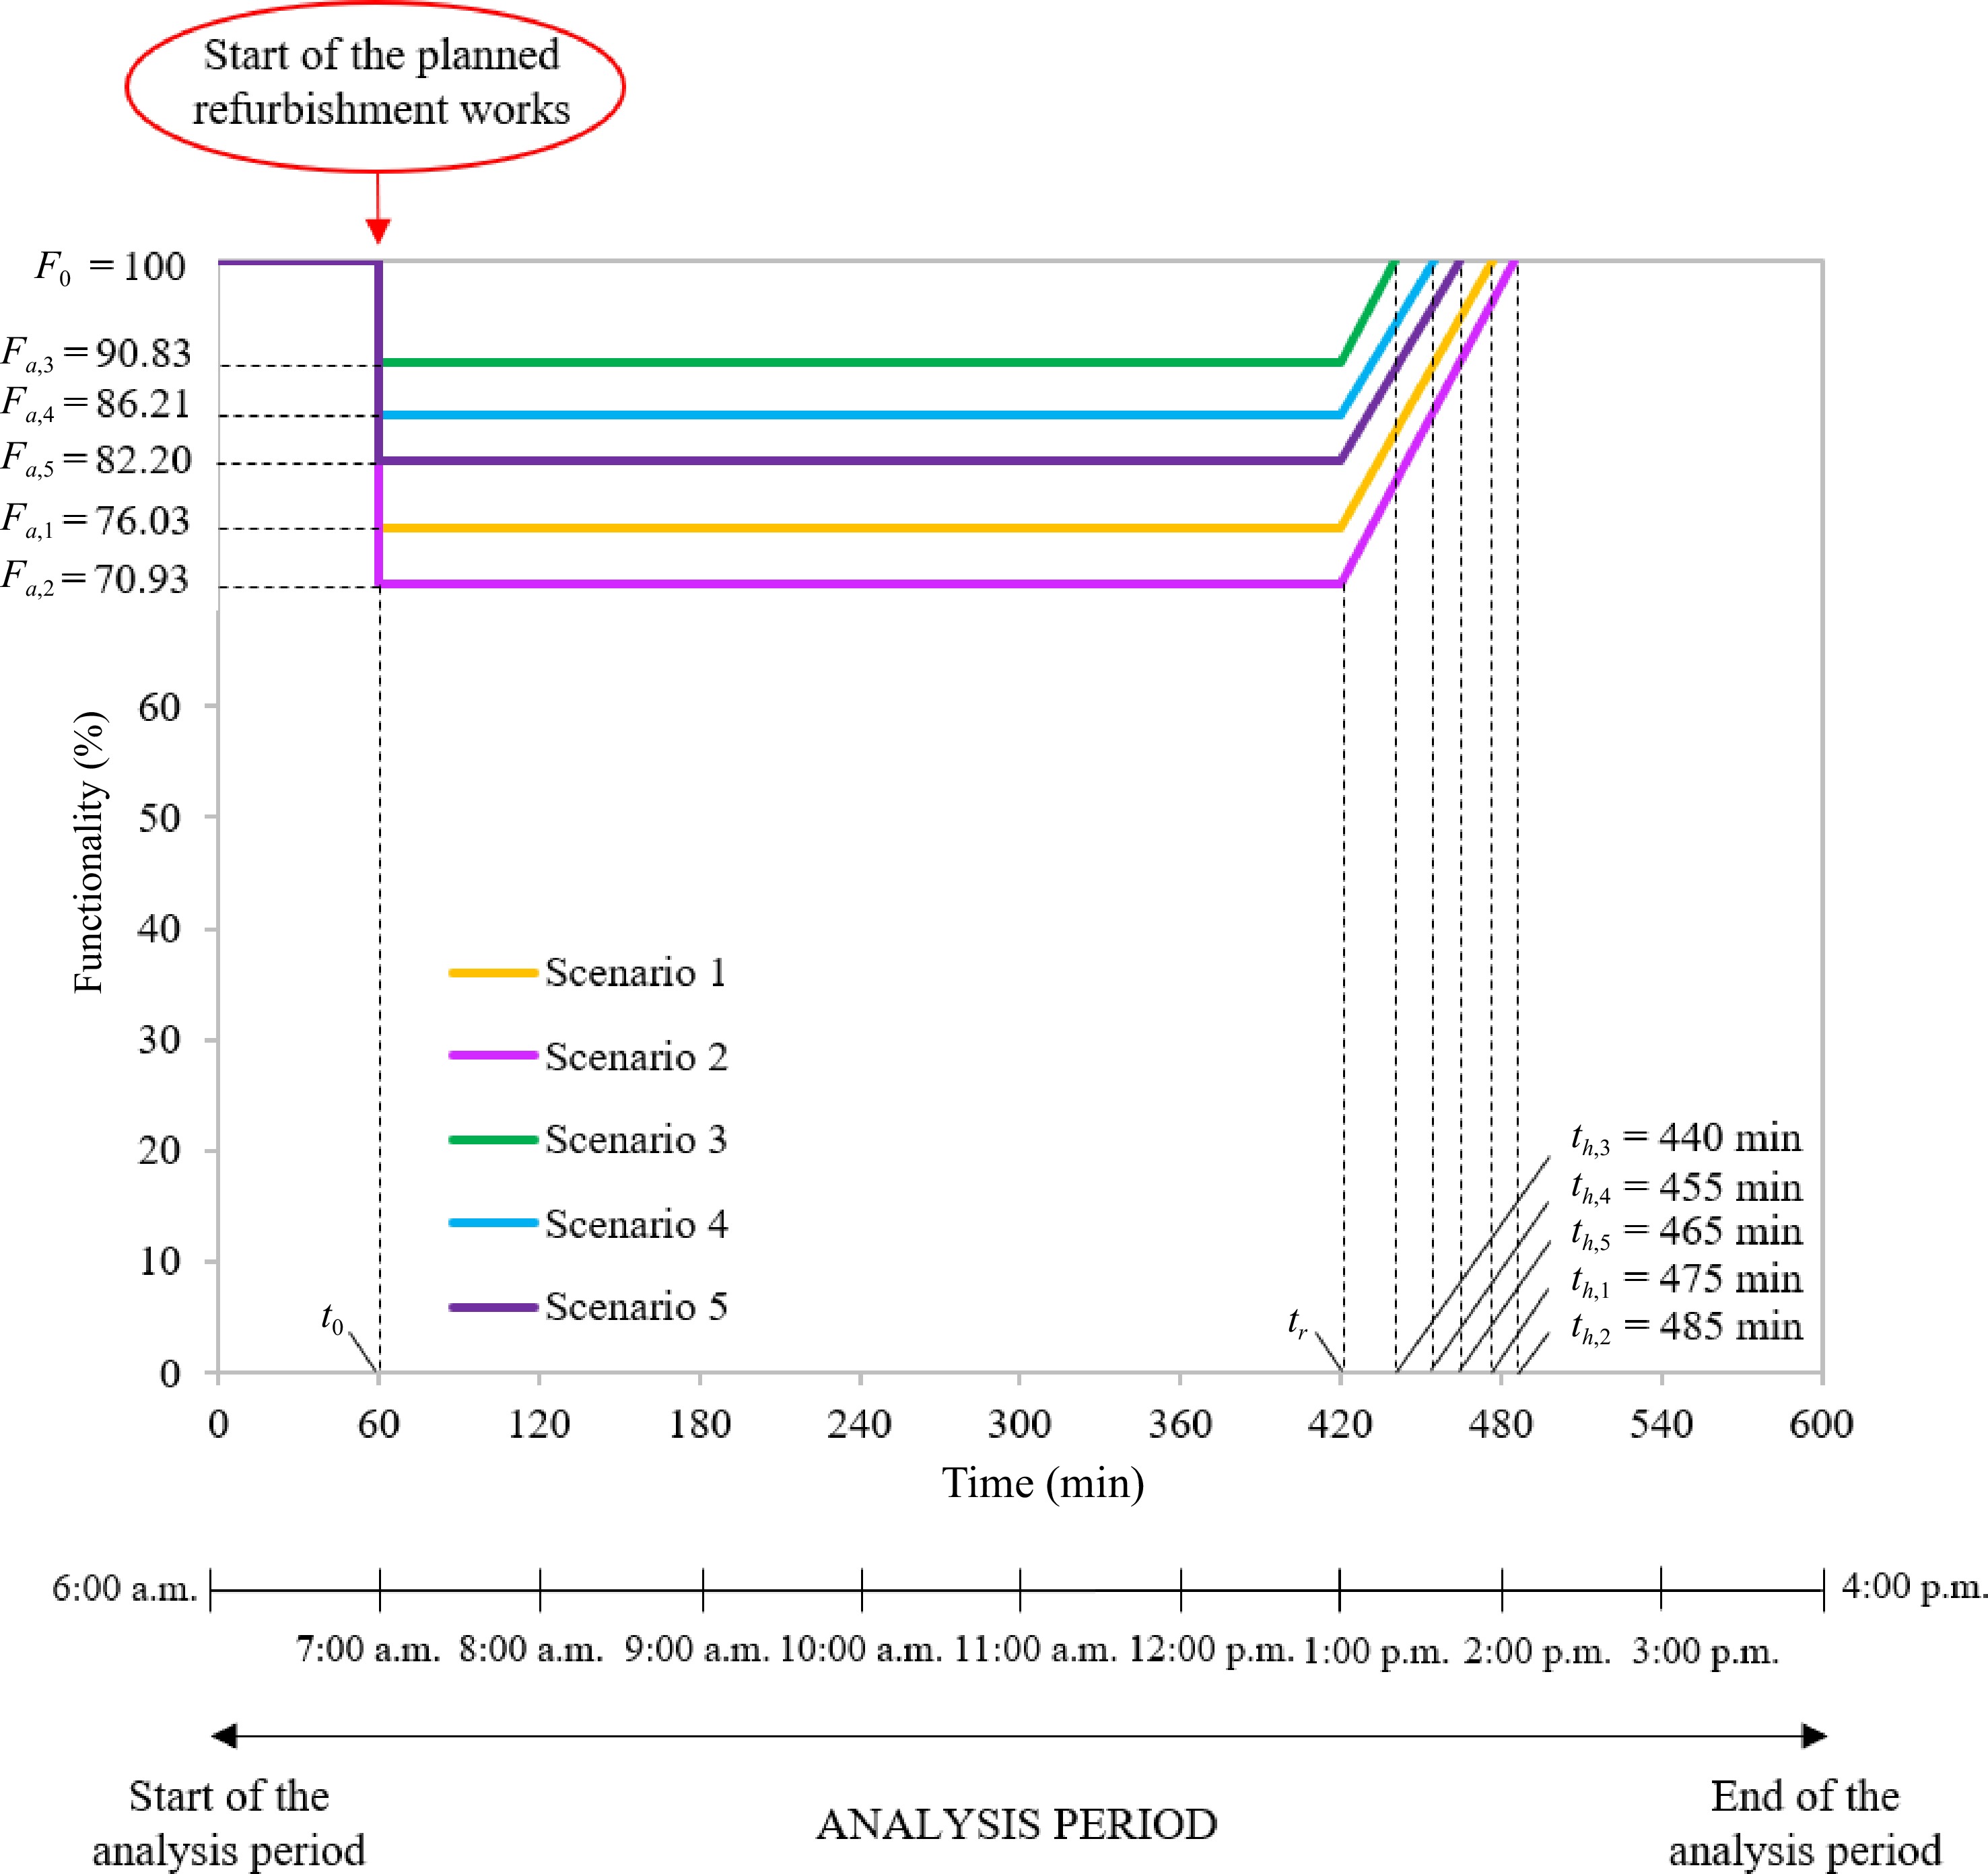
Figure 5.
Functionality curve over time of the tunnel system under each scenario investigated. Scenario 1 involves the partial closure of the north tube. Scenario 2 includes the complete closure of the north tube and the use of the south tube for two-way traffic. Scenario 3 differs from the corresponding Scenario 1 for the activation of an alternative route along which only HGVs directed towards the north are diverted. Scenario 4 differs from the corresponding Scenario 2 for the re-routing of only northbound HGVs along an alternative itinerary. Scenario 5 involves the partial closure of the north tube with its remaining undisrupted lane used only by HGVs directed towards the north, while northbound passenger cars use the south tube affected by bi-directional traffic.
In particular, from Fig. 5, it can be noted that the results in terms of resilience losses confirm the findings in terms of average travel speed of traffic flow, namely that: (i) a greater extension area (i.e., a higher resilience loss) was found for the complete closure rather than the partial closure of the north tube due to planned refurbishment works; (ii) the use of VMSs to divert only the HGVs along an alternative itinerary identified in the surrounding transportation network can reduce the resilience loss both when the north tube is partially and completely closed; (iii) in the event of the partial closure of the north tube and unavailability of an alternative itinerary, an intermediate loss of resilience can be found by diverting the northbound passenger cars along one lane of the south tube used for bi-directional traffic, while only the HGVs keep traveling in the north direction using the remaining available lane of the disrupted tube.
Finally, Fig. 5 also shows the recovery speeds (i.e., the slope of the side of the trapezoid between th,i and tr,
$ \mathit{tan}{\beta }_{i}=\frac{{F}_{0}-{F}_{i}}{{t}_{h,i}-{t}_{r}} $ Resilience index
-
To quantitatively represent the resilience of the tunnel system with a parameter that varies between 0 and 1, the resilience index was used in the present paper as a further resilience metric. With reference to the functionality curve over time depicted in Fig. 5, the resilience index of the i-th scenario investigated is given by:
$ {R(t}_{h,i})=\frac{{\int }_{{t}_{0}}^{{t}_{h,i}}F\left(t\right)dt}{{t}_{h,i}-{t}_{0}} $ Figure 6 shows the resilience index computed for each scenario investigated involving the partial or complete closure of the north tube due to planned refurbishment works. From Fig. 6 it can be noted that higher resilience indexes are associated with the partial closure of the north tube rather than the complete one (i.e., 0.78 in Scenario 1 against 0.73 in Scenario 2, as well as 0.91 in Scenario 3 against 0.87 in Scenario 4). Moreover, the use of digital technologies, such as VMSs, to suggest the HGVs to exit at the motorway junction preceding the partially or completely closed disrupted tube and use an alternative route was found to improve the resilience of the tunnel system (i.e., higher resilience indexes were found for Scenario 3 with respect to Scenario 1 and for Scenario 4 with respect to Scenario 2). Finally, when the north tube is partially closed due to refurbishment works and an alternative itinerary is not available for some reasons, the resilience index associated with the traffic management strategy consisting of diverting the northbound passenger cars along one lane of the south tube used for bi-directional traffic, while allowing the HGVs to keep traveling in the north direction using the remaining available lane of the disrupted tube, was found to be 0.83, which is an intermediate value among the scenarios investigated.
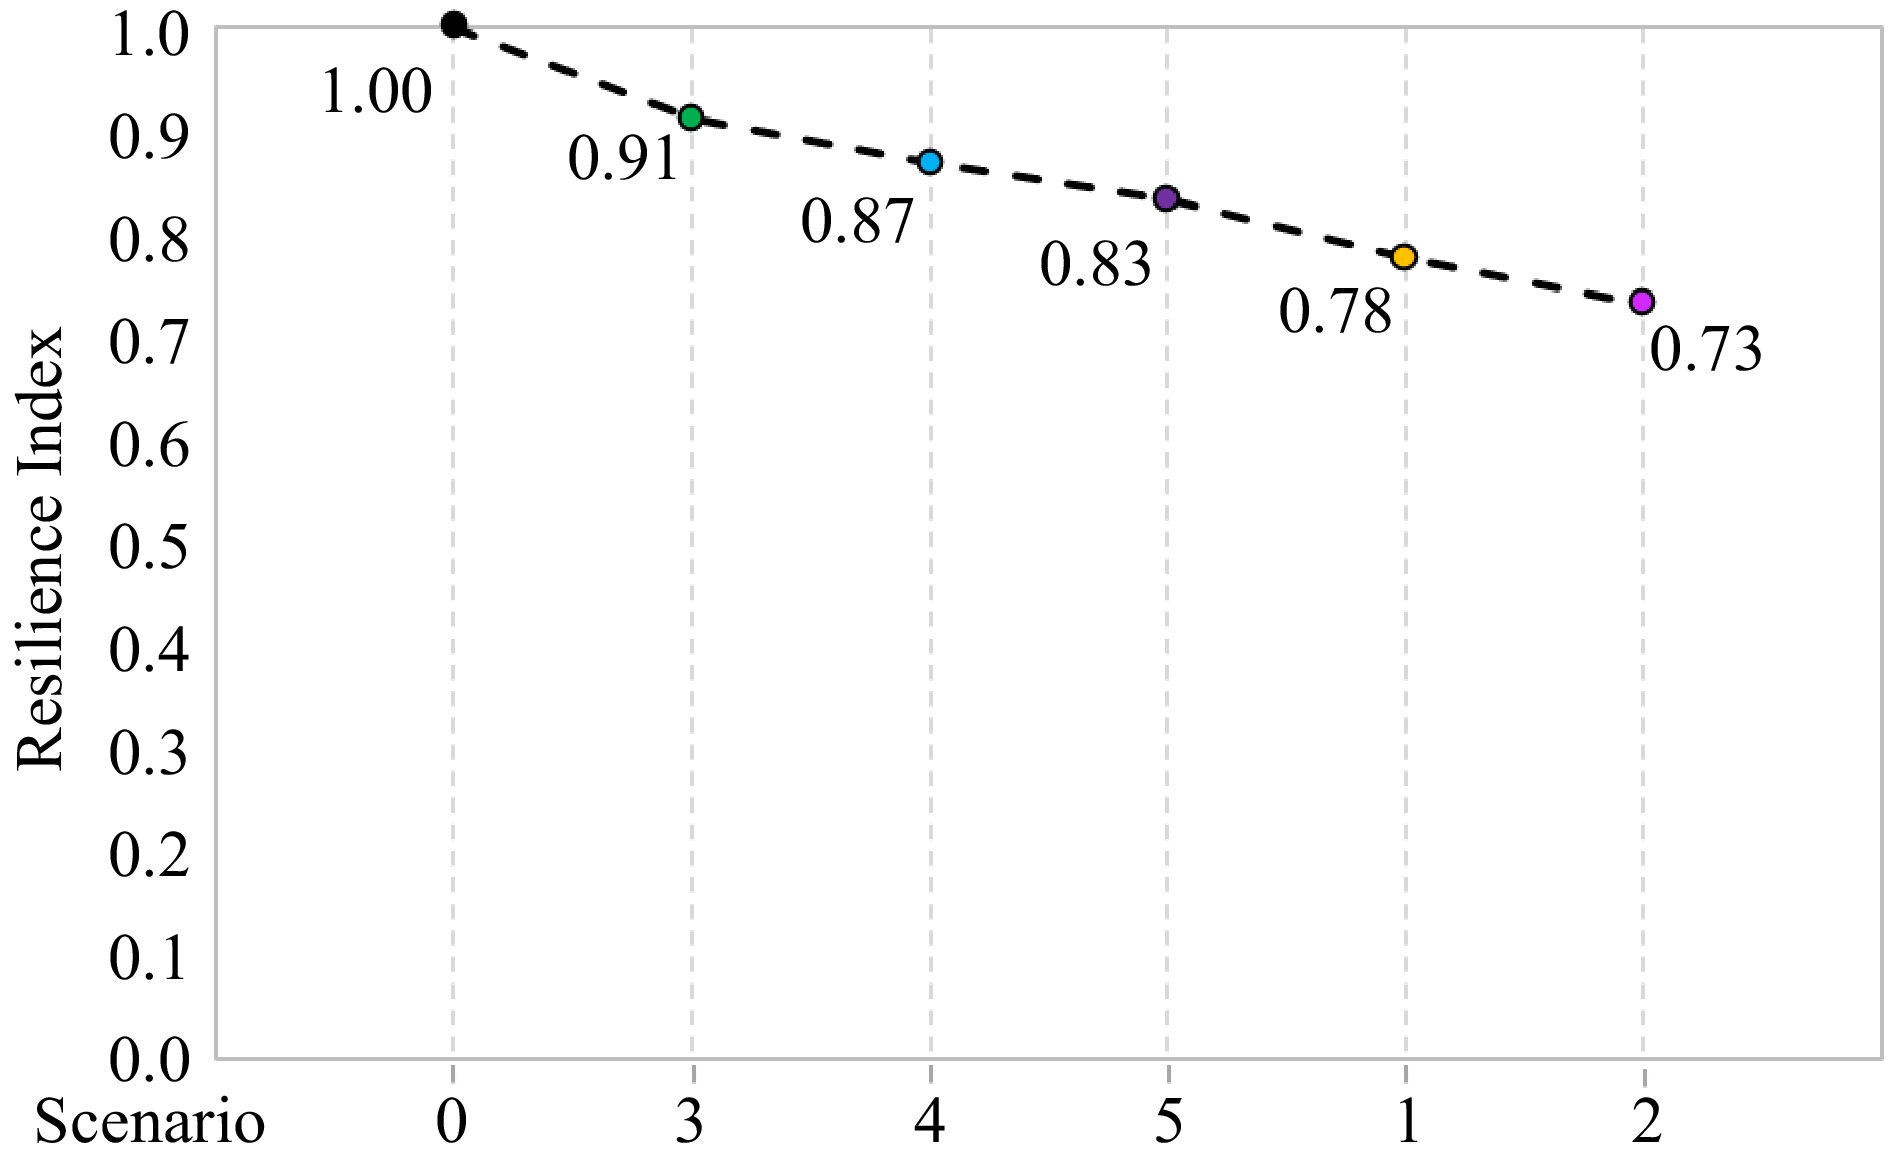
Figure 6.
Resilience index of the tunnel system under each scenario investigated. Scenario 0 in which the north tube is not yet under refurbishment work. Scenario 1 involves the partial closure of the north tube. Scenario 2 includes the complete closure of the north tube and the use of the south tube for two-way traffic. Scenario 3 differs from the corresponding Scenario 1 for the activation of an alternative route along which only HGVs directed towards the north are diverted. Scenario 4 differs from the corresponding Scenario 2 for the re-routing of only northbound HGVs along an alternative itinerary. Scenario 5 involves the partial closure of the north tube with its remaining undisrupted lane used only by HGVs directed towards the north, while northbound passenger cars use the south tube affected by bi-directional traffic.
Therefore, the results in terms of resilience index confirm our previous findings on both the average travel speed and resilience loss in all the scenarios analyzed, namely that, in the event of the partial or complete closure of one tube of a twin-tube motorway tunnel due to planned refurbishment works, certain benefits can be achieved by implementing specific management strategies of traffic control involving the use of digital technologies such as VMSs.
-
This paper aimed to assess the resilience of an existing twin-tube motorway tunnel located along the Italian road network when one of its tubes is assumed to be partially or completely closed due to planned refurbishment works for complying it with the minimum safety requirements imposed by Directive 2004/54/EC, as well as to identify the most suitable traffic management strategy, also involving the use of digital technologies, to mitigate the consequent negative impact on the vehicles’ speed reduction. To do so, a traffic macro-simulation model was developed using the PTV Visum code.
Several scenarios were investigated, which included the partial or complete closure of a tunnel tube for 6 h (i.e., corresponding to a daily work shift), considering the availability or not of an alternative itinerary in the surrounding transportation network.
The travel speed of traffic flow averaged over the time of partial or complete closure of the disrupted tube due to planned refurbishment works was used in the present paper as a traffic-based functionality parameter to quantitatively evaluate the resilience of the tunnel system. Specifically, the residual level of functionality was computed as the ratio between the average travel speed of the traffic flow along the motorway section containing the disrupted tube during the six-hour closure and that in ordinary condition of functionality (i.e., without any refurbishment work); while the resilience metrics were the resilience loss, the recovery speed, and the resilience index.
The findings obtained showed that: (i) a higher resilience loss, or, in other terms, a lower resilience index, was found for the complete closure rather than the partial closure of the tunnel tube affected by planned refurbishment works; (ii) the use of digital technologies, such as VMSs, to divert only the HGVs along an alternative itinerary identified in the nearby road network is able to significantly reduce the resilience loss of the tunnel system both in the case of the partial and complete closure; (iii) in the event of the partial closure of the tunnel tube and unavailability of an alternative itinerary for some reasons, diverting the passenger cars along one lane of the adjacent tube used for bi-directional traffic, while allowing only the HGVs to keep traveling using the remaining available lane of the disrupted tube, might also be an effective traffic management strategy since an intermediate loss of resilience is found.
Although this research might increase our knowledge in the field of resilience of road tunnels affected by planned maintenance and/or refurbishment works, there are still some points that are worth investigating. For example, given that the probability of occurrence of a traffic accident might increase with the duration of partial or complete closure of a tube, the resilience of tunnels affected by planned activities should also be coupled with safety. Moreover, certain random factors that might be responsible for uncertainties in the resilience analysis, as well as the interaction with other types of transport systems, should be taken into consideration. Therefore, further studies are necessary to address the aforementioned issues concerning tunnel resilience.
-
The authors declare that they have no conflict of interest. C. Caliendo and I. Russo are the Editorial Board members of Digital Transportation and Safety who were blinded from reviewing or making decisions on the manuscript. The article was subject to the journal's standard procedures, with peer-review handled independently of these Editorial Board members and their research groups.
- Copyright: © 2023 by the author(s). Published by Maximum Academic Press, Fayetteville, GA. This article is an open access article distributed under Creative Commons Attribution License (CC BY 4.0), visit https://creativecommons.org/licenses/by/4.0/.
-
About this article
Cite this article
Caliendo C, Russo I, Genovese G. 2023. Resilience analysis of road tunnels subject to refurbishment work. Digital Transportation and Safety 2(3):190−199 doi: 10.48130/DTS-2023-0015 

Resilience analysis of road tunnels subject to refurbishment work
- Received: 10 July 2023
- Accepted: 30 August 2023
- Published online: 28 September 2023
Abstract: After some tragic fire events, Directive 2004/54/EC was issued to ensure a minimum safety level for tunnels belonging to the Trans-European Road Network longer than 500 m. Nowadays, most of the Italian road tunnels are still not in compliance with the minimum safety requirements, thus refurbishment works are often planned. By developing a traffic macro-simulation model, this paper aims at assessing the resilience of an existing twin-tube motorway tunnel when one of its tubes is partially or completely closed due to planned activities. Several scenarios were investigated, also considering the availability or not of an alternative itinerary in the surrounding transportation network. The average vehicles’ speed was used as a functionality parameter, while the resilience metrics were the resilience loss, the recovery speed, and the resilience index. The findings showed higher resilience losses for complete closure rather than partial closure of the tube under planned refurbishment works. The implementation of digital technologies, such as variable message signs, might reduce the resilience loss of the tunnel system. This research might represent a reference for tunnel management agencies in the choice of the most appropriate traffic control strategy to improve tunnel resilience in the event of planned activities.
-
Key words:
- Road tunnels /
- Resilience /
- Refurbishment works /
- Traffic simulation /
- Digital technologies.