-
Plants undergo various environmental challenges, of which water scarcity is the most prominent abiotic stressor limiting development and productivity[1]. Global climate change has made these environmental challenges even more severe. Plants have developed sophisticated systems of tolerance that allow them to endure water deprivation. Water scarcity and soil water loss induced by environmental changes and excessive land use are obstacles to crop production[2]. Sustaining higher crop yields under environmental stress is the major constraint in modern agriculture[3]. According to studies, heat waves and water abnormalities (floods and droughts) are responsible for 50%–70% of agricultural production losses[4]. China has a wide range of apple planting areas. There are seven major provinces in the Bohai Bay, dominated by Shandong, Hebei, and Liaoning, and the Loess Plateau in Northwest China, dominated by Gansu, Shaanxi, Shanxi, and other provinces. It accounts for over 80% of the country's total output[5]. About half of the planting area is arid or semi-arid, and water resources are scarce. Water is a crucial element for plant growth, and a lack of it can lead to poor crop development and reduced yield.
Drought causes osmotic stress, which triggers turgor loss and oxidative stress via the generation of reactive oxygen species (ROS), resulting in membrane integrity loss, protein denaturation, and oxidative damage to other biomolecules. Such variations lead to the limitation of photosynthesis, metabolic dysfunction, and damage to cellular structures, which disrupt growth, lower fertility, and cause premature senescence[6]. In recent years, several advanced studies have been conducted to improve drought tolerance in apples[7−9]. Under prolonged drought stress, the MdGH3 RNA interference (RNAi) lines outperformed wild-type apple plants in terms of root system strength, higher root-to-shoot ratio, stronger hydraulic conductivity, better photosynthetic capacity, and higher water use efficiency[7]. Plants alter their morphology to respond effectively to drought stress[10]. The root system initially detects the stress information and gradually delivers it to the vegetative portion[11,12]. The level of drought stress adaptation can be estimated by measuring the leaf epidermis thickness, lower epidermis thickness, leaf thickness, palisade tissue thickness, sponge tissue thickness, and other anatomical structure parameters related to drought resistance. Furthermore, the membership function method is used to comprehensively evaluate drought-resistant rootstocks.
Apple rootstocks significantly impact scion development, fruit quality and production, and tolerance to biotic and abiotic challenges[13]. Dwarfing rootstocks are more common and frequently utilized among rootstocks as they can stimulate earlier flowering, control tree vigor, minimize labor, and enhance fruit quality and yield[14]. Unfortunately, a few studies on the comprehensive evaluation of drought resistance of apple rootstocks have been conducted. Due to the increasing demand for drought-tolerant apple rootstock cultivation in China and worldwide, this study designed and selected eight widely used apple rootstocks and observed the differences in leaf microstructure and physiological and biochemical characteristics under natural drought treatments. The changes in the indicators were comprehensively evaluated by the membership function method. To screen out better drought-resistant rootstocks and provide a theoretical basis for selecting rootstocks in arid and semi-arid regions. This study provides a reference for establishing a more systematic and scientific evaluation system for the drought resistance of fruit trees.
-
The relative soil moisture content of different rootstocks gradually decreased with the prolongation of the drought stress time (Fig. 1). On the 4th day of drought stress, the relative soil moisture content of different rootstocks was between 65%–75%. On the 6th day, the contents of all rootstocks ranged between 45%–55%, reaching a moderate drought level. However, on the 8th day, the relative soil moisture content was about 30%, approaching the severe drought level. The soil moisture content of the eight rootstocks during the same period was not significantly different. However, it decreases continuously with increasing time in all rootstocks (Fig. 1).
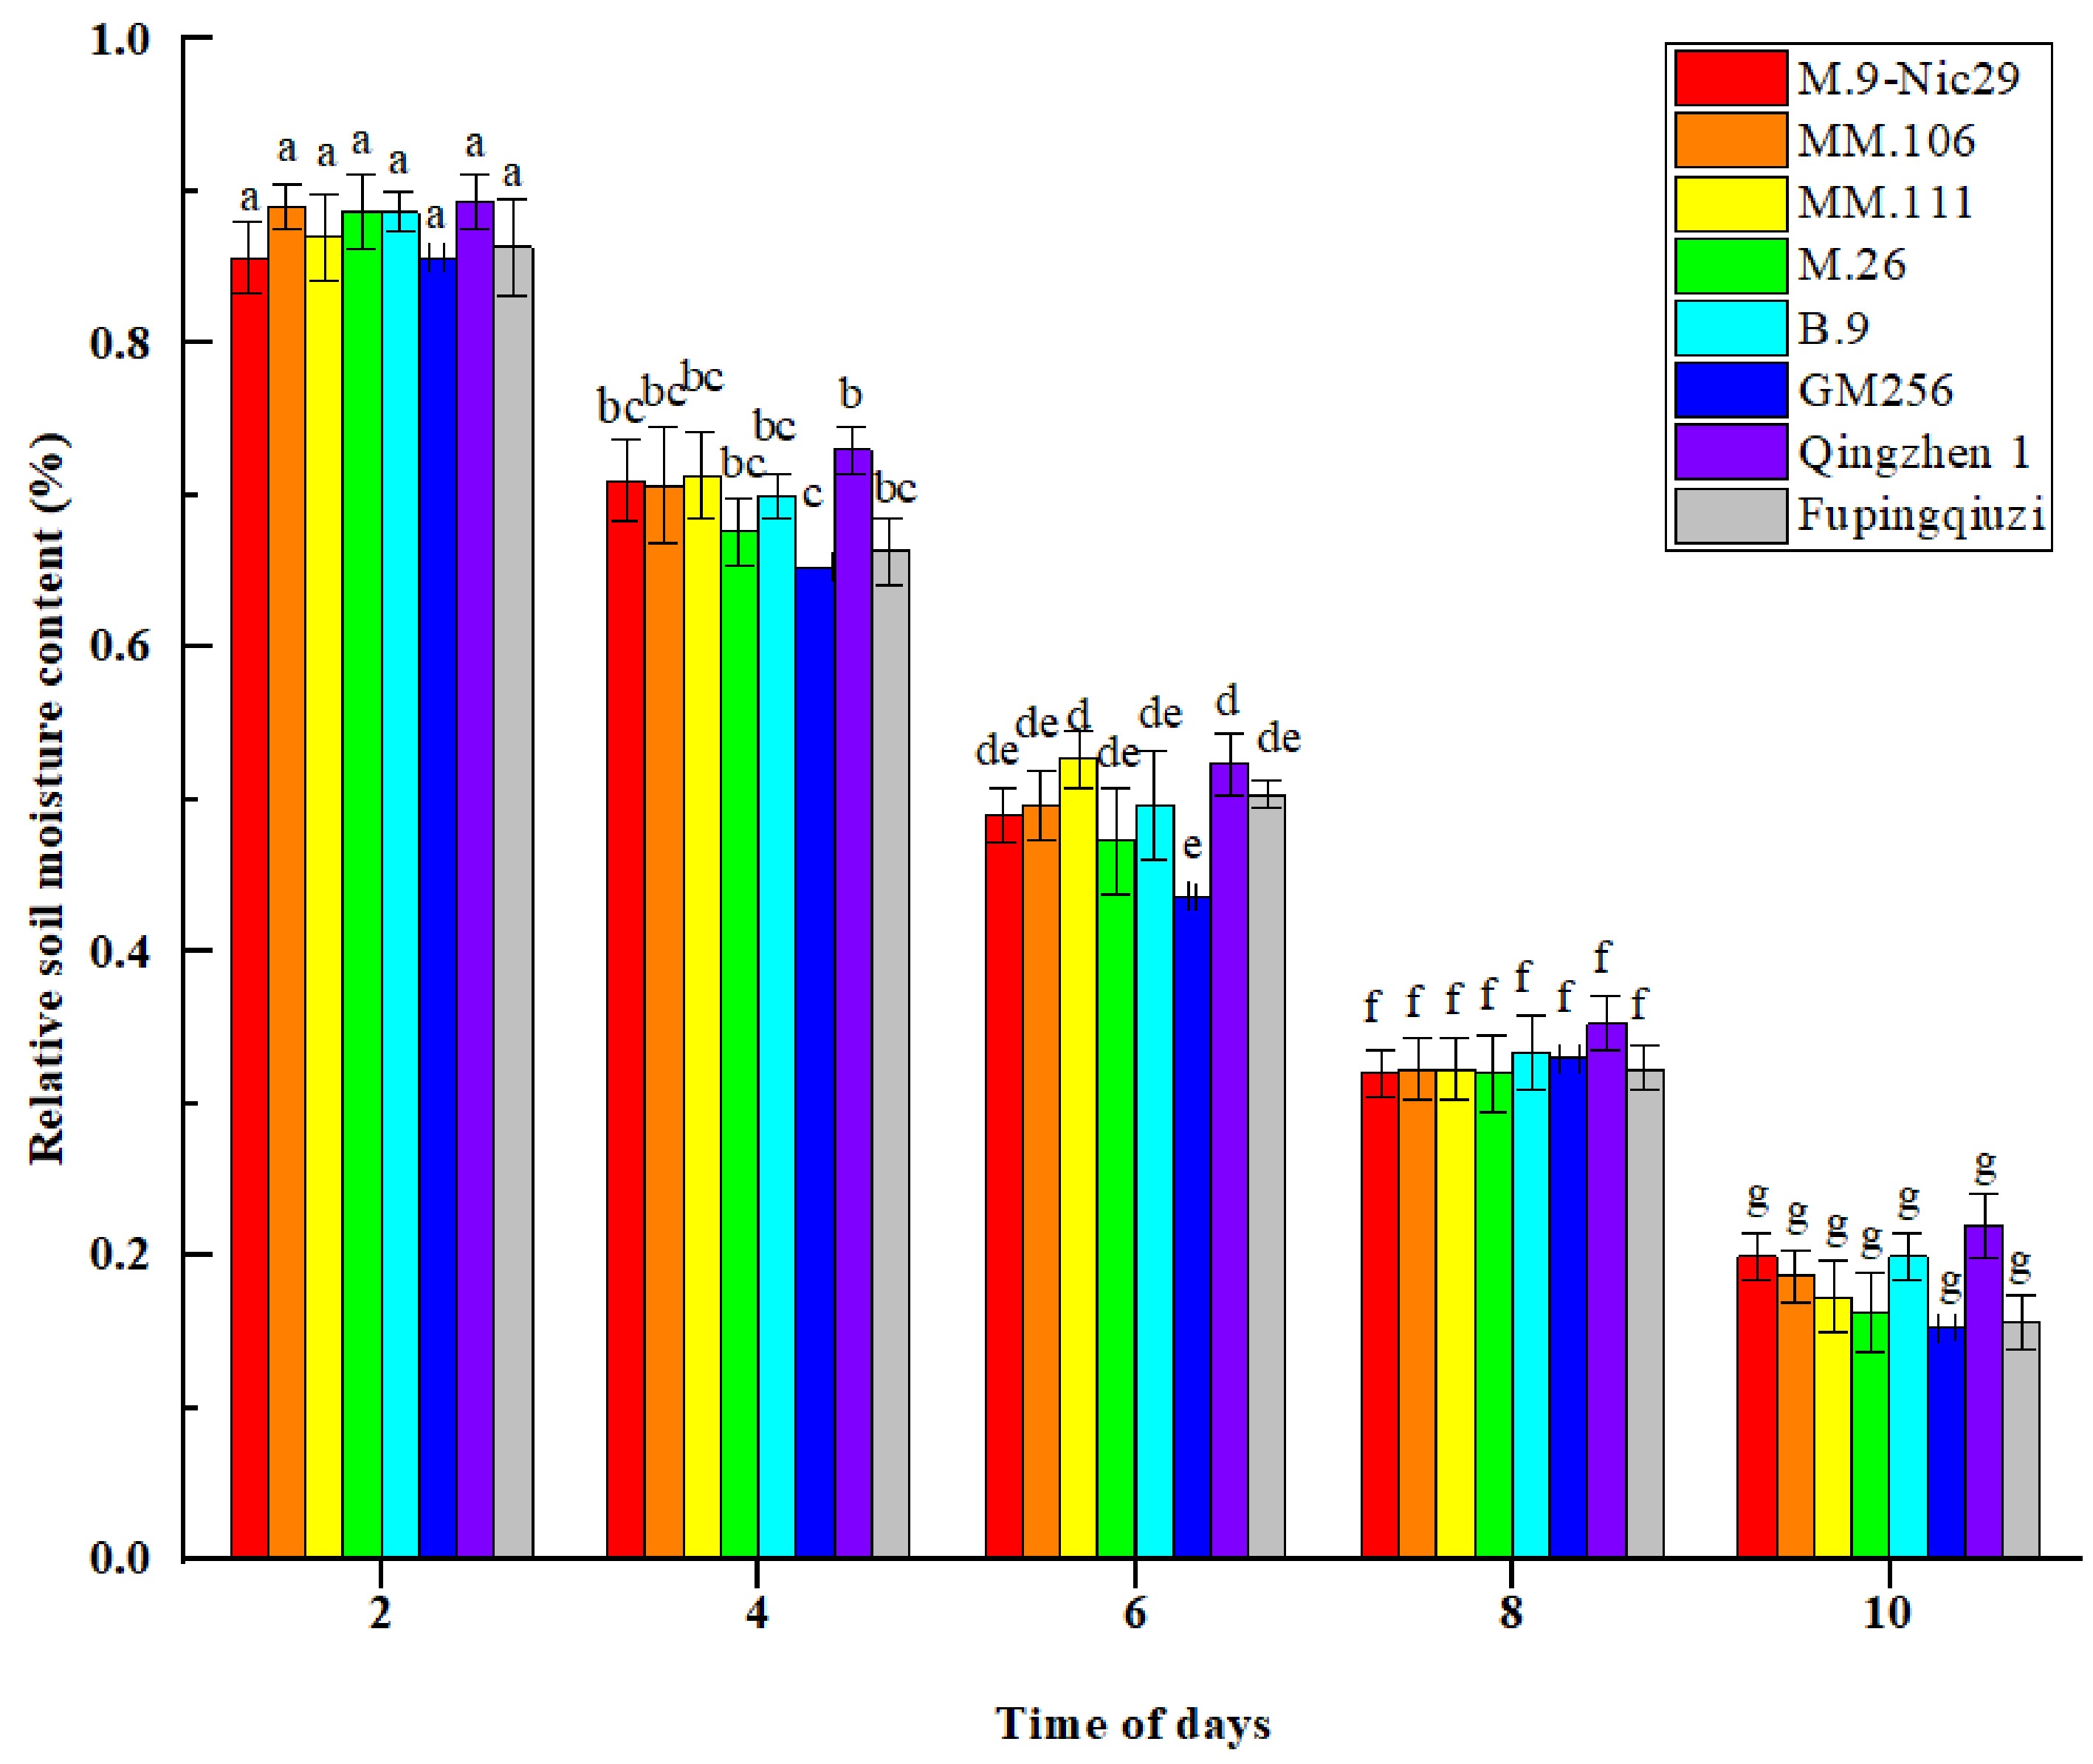
Figure 1.
The effect of natural drought stress on the relative soil moisture content of different apple rootstocks over the duration of 2, 4, 6, 8, and 10 d. Error bars refer to the average value ± SD from three biological replicates. Different letters indicate a significant difference at p < 0.05.
Morphological and anatomical observations of rootstocks under drought stress
-
The above-ground phenotypic changes of eight apple rootstocks under mild, moderate, and severe drought stress were captured and presented in Fig 2. Under mild drought stress, the leaves of all rootstocks did not show a wilting state, and the growing state was normal. Under moderate drought stress, the leaves of 'GM256', 'MM.106', 'M.26', and 'M.9-Nic29' showed a certain degree of wilting, but the other four rootstocks were in a good growth state. When the relative soil moisture was 25%–35% (under severe stress), 'GM256', 'MM.106', 'M.26', and 'M.9-Nic29' appeared wilted (Fig. 2). From the phenotypic analysis of different rootstocks, 'Fupingqiuzi', 'Qingzhen 1', 'B.9', and 'MM.111' showed stronger drought resistance.
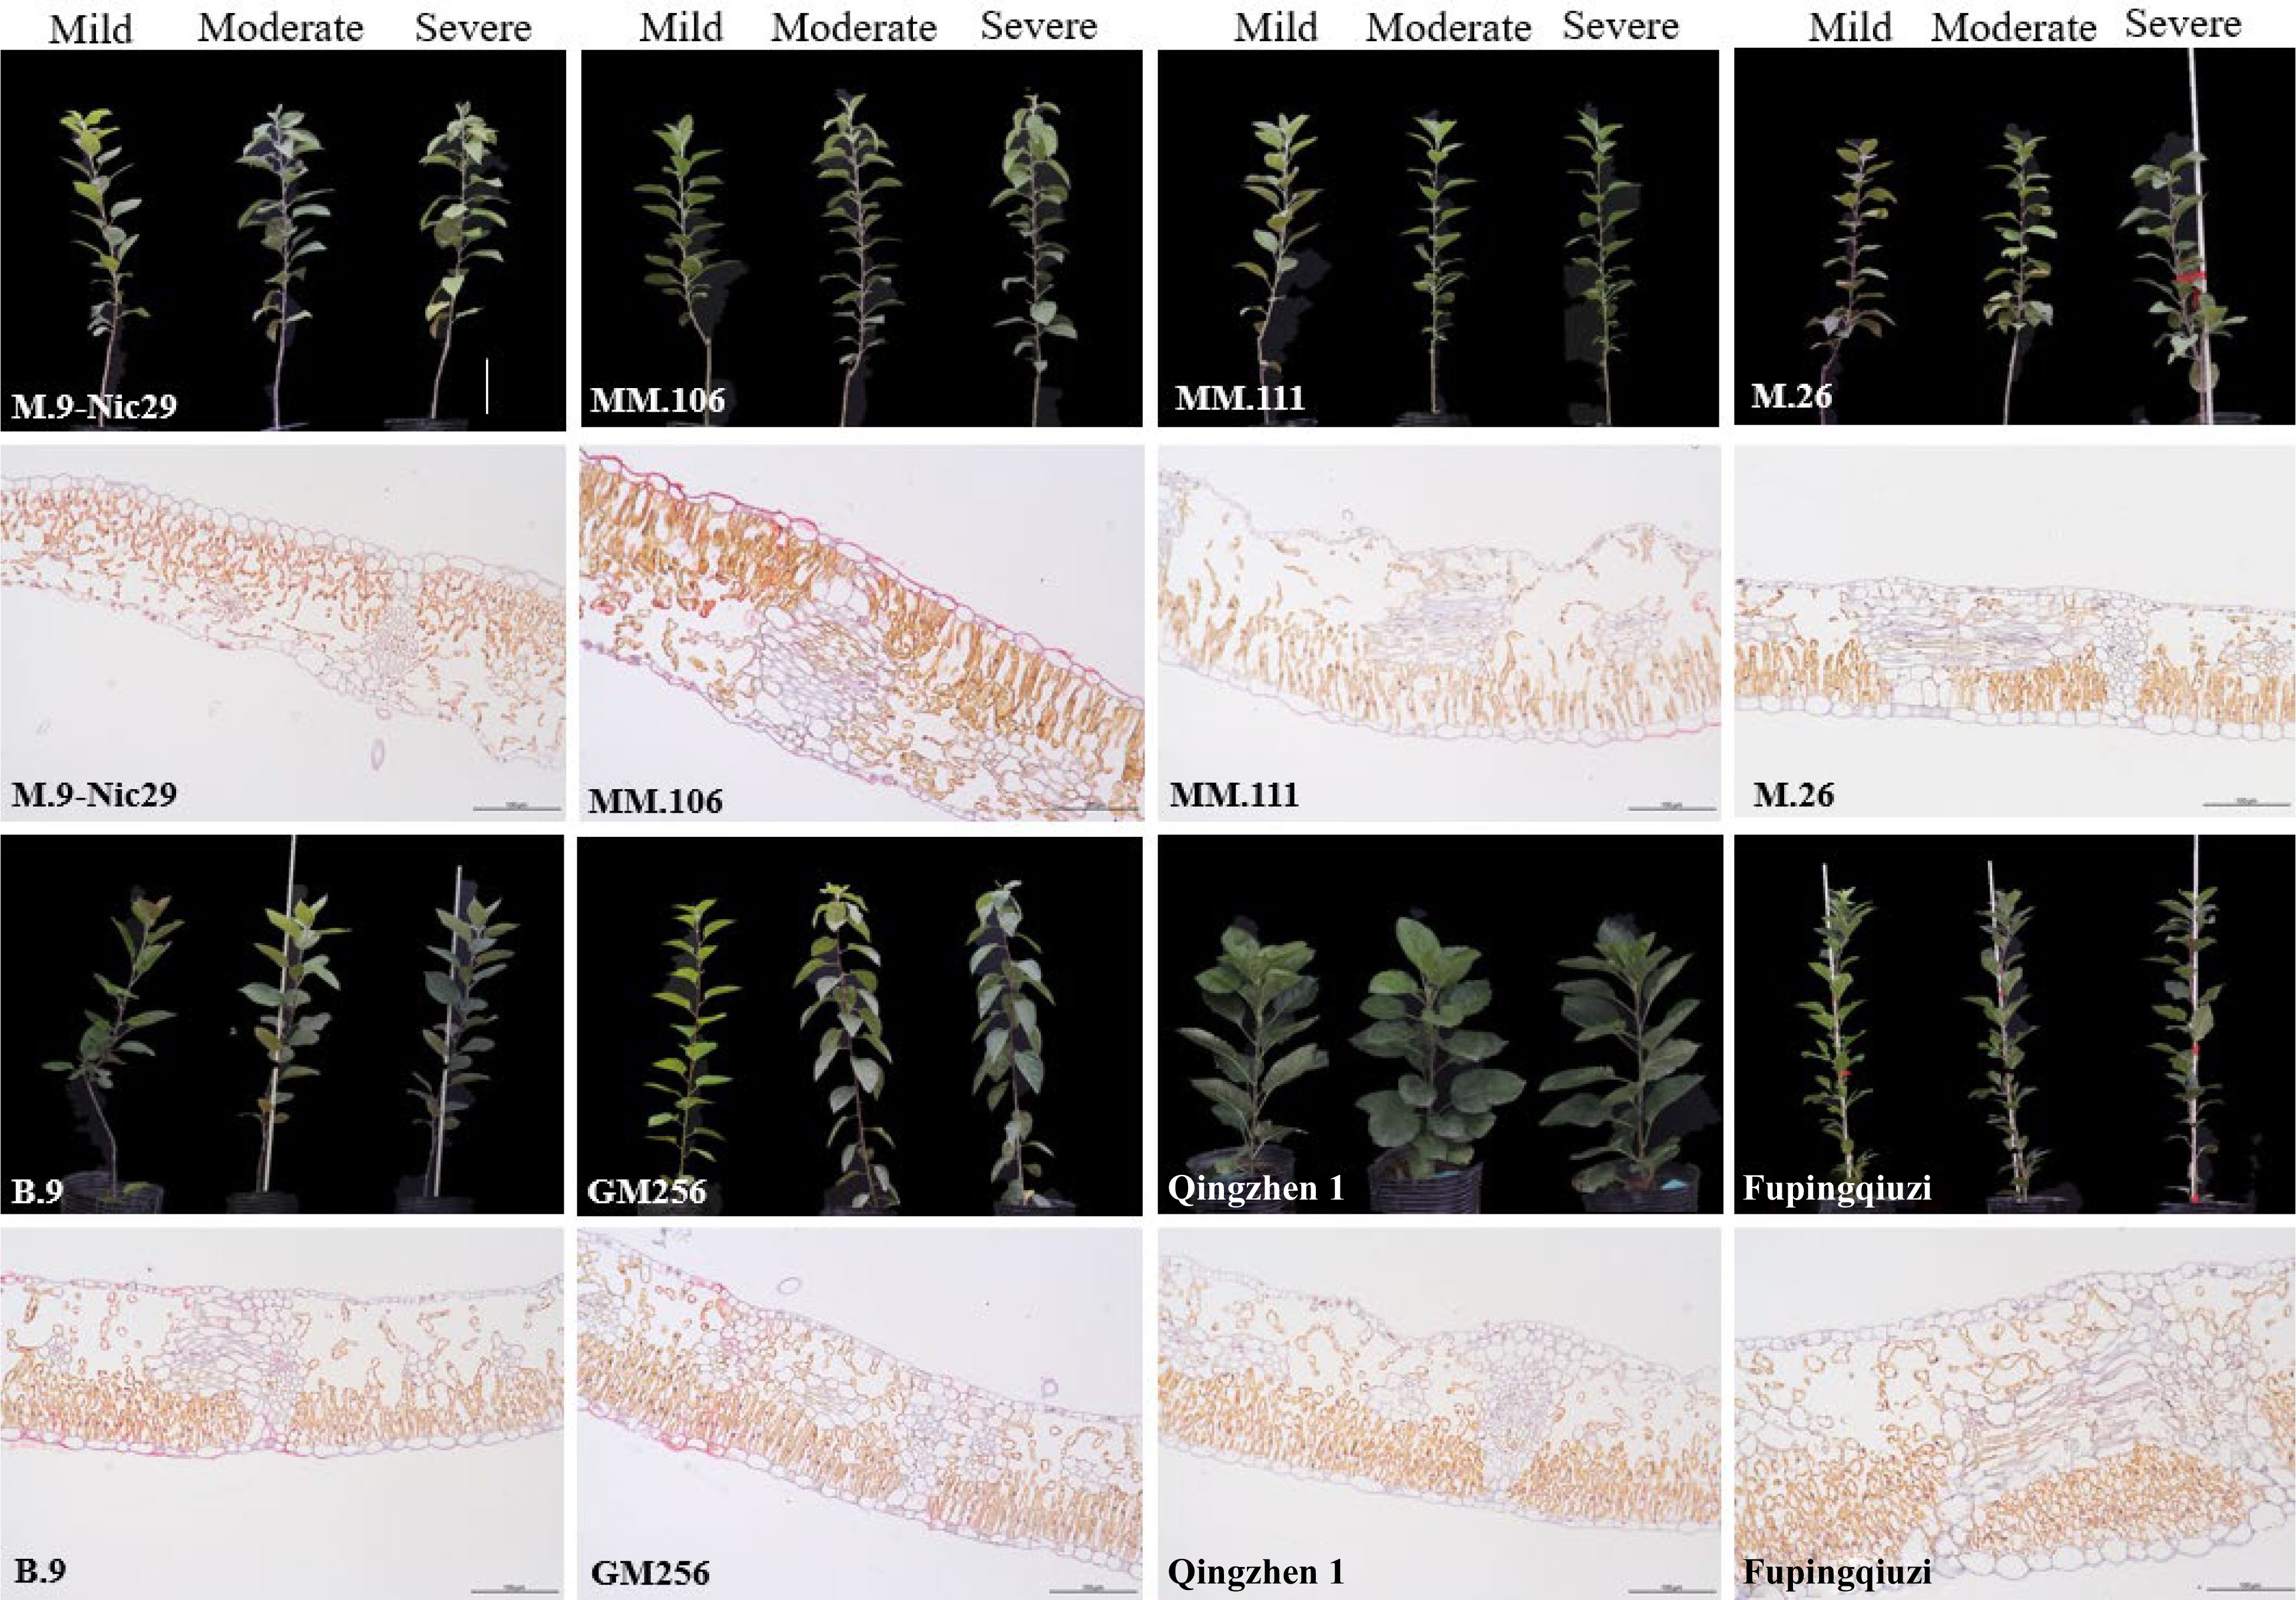
Figure 2.
Morphological changes of leaves among eight genotypes of apple rootstocks. Samples were taken when the relative soil water content reached 65%–75% (mild drought stress), 45%–55% (moderate drought stress), and 25%–35% (severe drought stress); the scale bar = 10 cm. From left to right, the same rootstock represents three states of stress. The anatomical structure of different rootstock leaves under severe drought stress (relative soil water content reached 25%–35%); the scale bar = 250 µm.
The results of the longitudinally cut paraffin sections of the leaves are shown in Fig. 2. Under severe drought stress, there were significant differences in the thickness of the leaves of each rootstock. The leaf thickness of the eight rootstocks ranged from 155.1 to 292.1 μm, among which 'Fupingqiuzi' was the thickest, reaching 292.1 μm, which was significantly higher than that of other rootstocks; the leaf thickness of 'M.26' was 155.1 μm, which was the lowest among all rootstocks (Fig. 2 and Table 1). The thickness of the leaves was arranged in descending order of 'Fupingqiuzi' > 'MM.106' > 'MM.111' > 'Qingzhen 1' > 'B.9' > 'GM256' > 'M.9-Nic29' > 'M.26'. The thickness of the upper epidermis of the eight rootstocks was 13.4–19 μm, and the thickness of the upper epidermis was the highest, which was 19 μm of 'MM.106' (Fig. 2 and Table 1). The palisade tissue thickness of the eight rootstocks ranged from 66.1 to 114 μm, and the palisade tissue thickness of 'Fupingqiuzi' was the highest at 114 μm, which was significantly higher than that of other rootstocks. The thickness of the sponge tissue of eight rootstocks ranged from 60.4 to 148.5 μm, and the thickness of the sponge tissue of 'Fupingqiuzi' was up to 148.5 μm (Fig. 2 and Table 1).
Table 1. The anatomical structure index values of leaves of different rootstocks.
Thickness (μm) 'M.9-Nic29' 'MM.106' 'MM.111' 'M.26' 'B.9' 'GM256' 'Qingzhen 1' 'Fupingqiuzi' Leaf thickness 155.2 ± 9 f 226.5 ± 5 b 218.7±7 bc 155.1 ± 3 e 191.8 ± 4 de 179.8 ± 4 f 202.6 ± 4 cd 292.1 ± 13 a Upper epidermis thickness 18.6 ± 1 ab 19.0 ± 1 a 17.1 ± 1 ab 16.1 ± 1 abcd 14.0 ± 1 cd 15.7 ± 1 bcd 13.4 ± 1 d 16.5 ± 1 abc Palisade tissue thickness 66.1 ± 5 d 94.6 ± 1 b 86.0 ± 4 bc 65.5 ± 5 d 71.6 ± 5 cd 70.4 ± 4 cd 83.1 ± 5 bc 114.0 ± 10 a Sponge tissue thickness 60.4 ± 7 e 103.8 ± 3 bc 108.8 ± 8 b 67.8 ± 6 de 100.7 ± 6 bc 84.4 ± 3 cd 96.7 ± 10 bc 148.5 ± 6 a Different letters indicate significant differences at the 0.05 level. Relative water content in the leaves of rootstocks under drought stress
-
The relative water content (RWC) of leaves is often used to evaluate drought resistance because plant leaves are susceptible to drought stress, and even weak drought stress can cause a decrease in leaf water content. It can be seen in Fig. 3 that the RWC of leaves from different rootstocks showed a decreasing trend as a whole with increasing drought stress. Under mild drought stress, 'Fupingqiuzi' had a stronger water-holding capacity, while 'B.9' had a weaker water-holding capacity. Under moderate water stress, the RWC of 'Qingzhen 1' was higher, and the RWC of 'B.9' was lower. When the relative soil water content was at its lowest, 30%–35% (under severe drought stress), the RWC was higher in 'MM.111' but at the same time lower in 'M.9-Nic29'. Compared with mild drought stress, the RWC of 'M.9-Nic29', 'MM.106', 'MM.111', 'M.26', 'B.9', 'GM256', 'Qingzhen 1', and 'Fupingqiuzi' decreased in order: 29.8%, 15.6%, 11.0%, 23.7%, 16.2%, 23.0%, 22.5%, and 29.8%, respectively (Fig. 3).
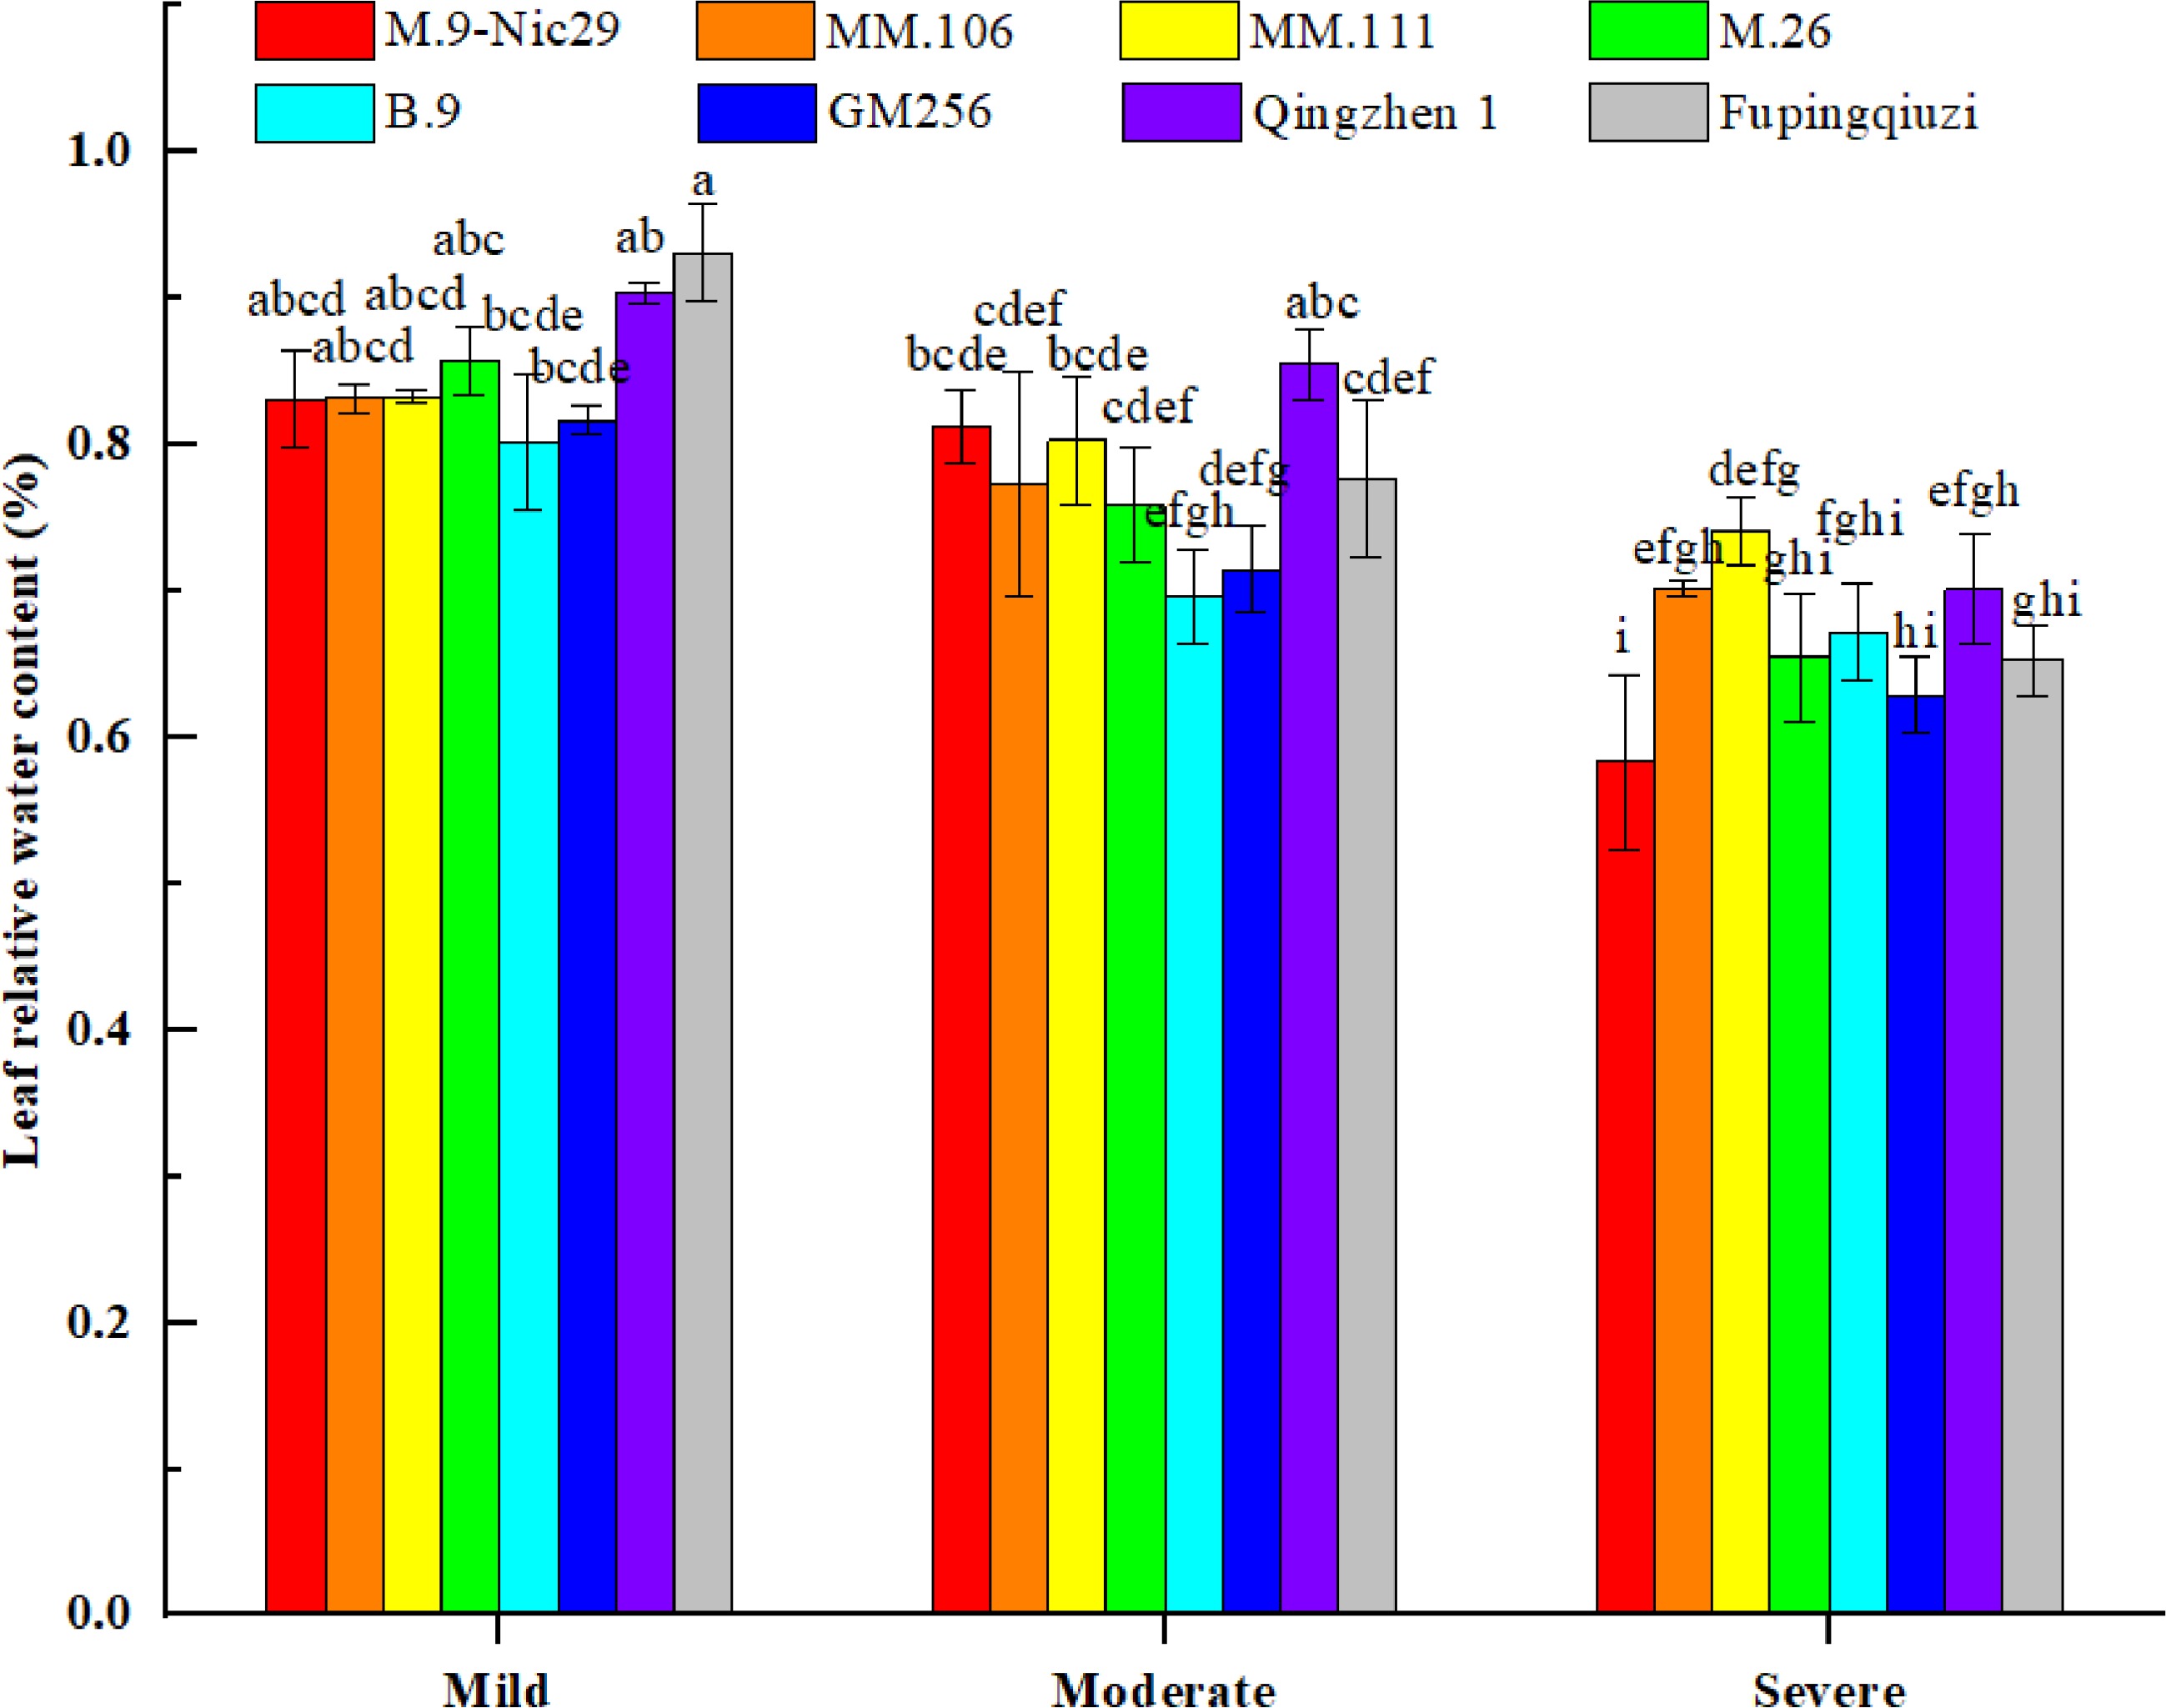
Figure 3.
The effect of different levels of drought on the relative water content (RWC) of leaves on different apple rootstocks. Samples were harvested when the relative soil water content reached 65%–75% (mild drought stress), 45%–55% (moderate drought stress), and 25%–35% (severe drought stress). Error bars refer to the average value ± SD from three biological replicates. Different letters indicate a significant difference at p < 0.05.
Photosynthetic gas exchange parameters in the leaves of rootstocks under drought stress
-
We also measured the photosynthetic gas exchange parameters, such as photosynthetic rate (Pn), transpiration rate (Tr), intercellular CO2 concentration (Ci), and stomatal conductance (Gs), of different rootstock leaves under mild, moderate, and severe drought stress (Fig. 4). There were differences in the responses of photosynthetic parameters of varying rootstock varieties to the drought environment, and the changes were also very different. As shown in Fig. 4, the net Pn of different apple rootstocks showed a downward trend with a decrease in the relative soil water content. During mild drought stress, the net Pn of 'Fupingqiuzi' was higher than that of other rootstocks. Under severe drought stress, the net Pn of 'M.26' was the highest and the net Pn of 'Qingzhen 1' was the lowest; the net Pn of the eight rootstocks decreased by 73.4%, 93.5%, 91.0%, 72.9%, 63.9%, 71.7%, 94.1%, and 64.5%, respectively (Fig. 4).
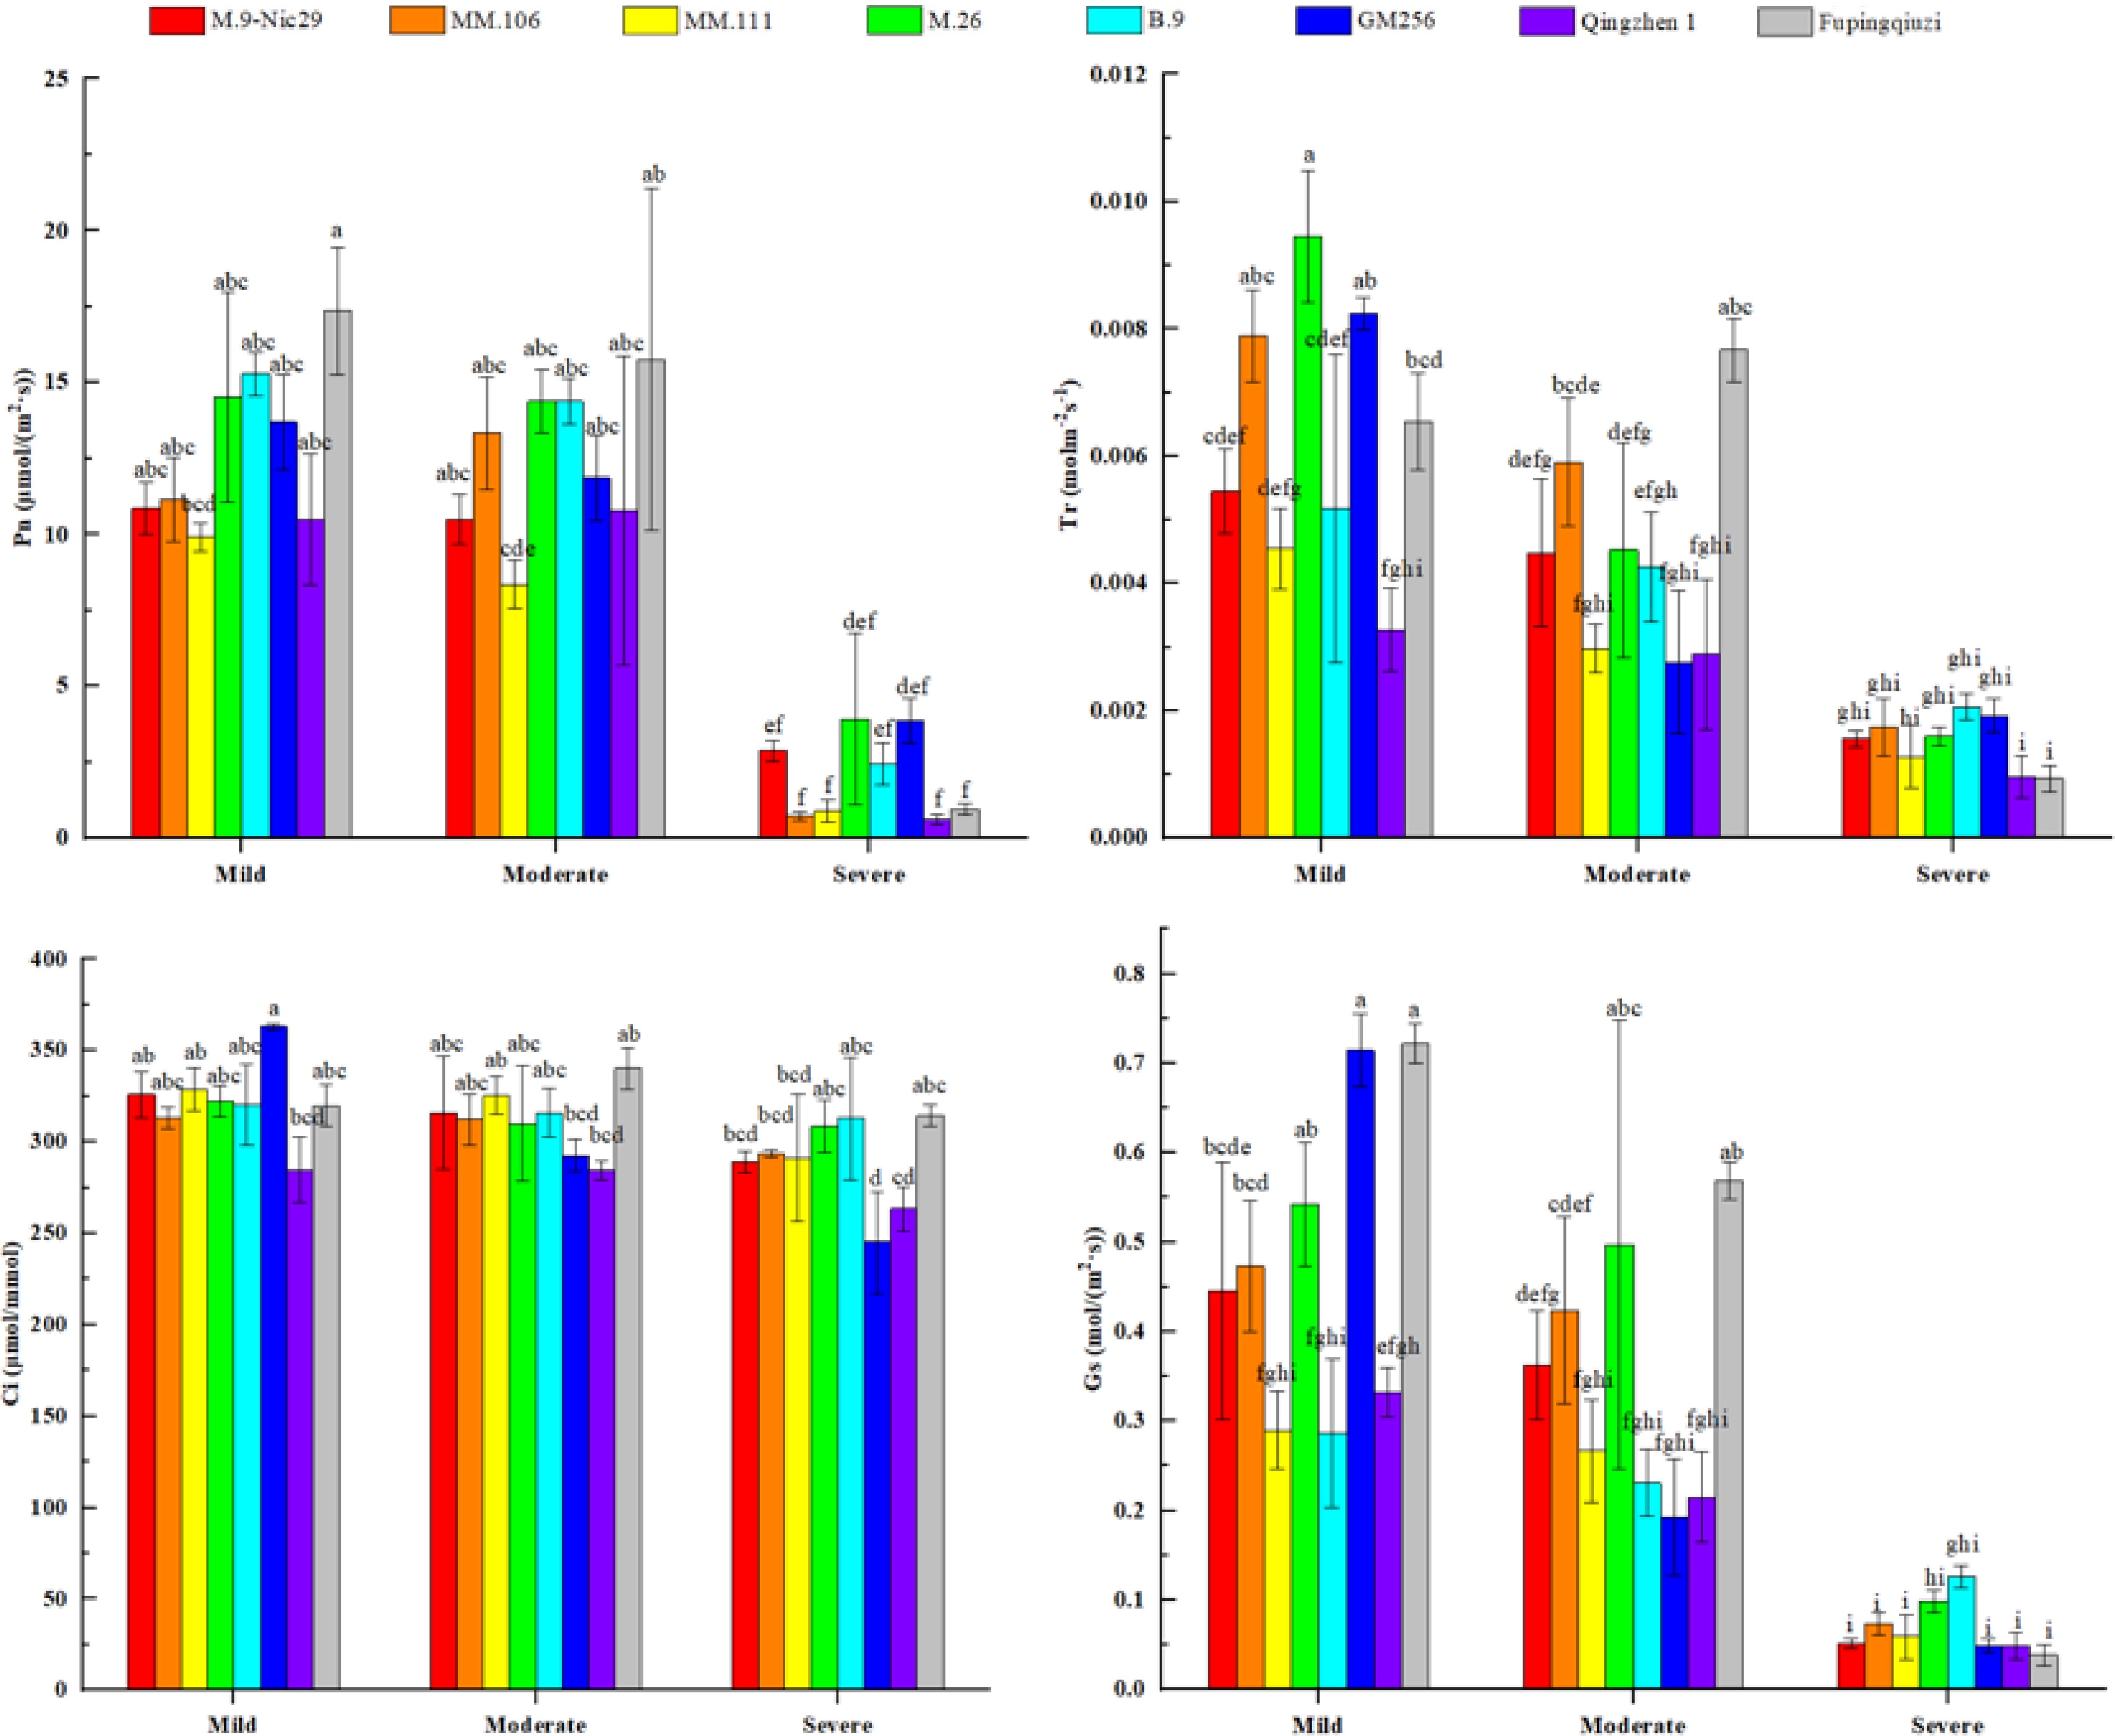
Figure 4.
The effect of different levels of drought on the photosynthetic parameters, such as photosynthetic rate (Pn), transpiration rate (Tr), intercellular CO2 concentration (Ci), and stomatal conductance (Gs), in different apple rootstocks. Samples were harvested when the relative soil water content reached 65%–75% (mild drought stress), 45%–55% (moderate drought stress), and 25%–35% (severe drought stress). Error bars refer to the average value ± SD from three biological replicates. Different letters indicate a significant difference at p < 0.05.
Furthermore, the Tr of 'Fupingqiuzi' first increased (at a moderate stress level) and then decreased rapidly (at a severe stress level). The Tr of the remaining seven rootstocks showed a downward trend as the relative soil water content decreased. At the mild drought stress level, the Tr of 'M.26' was significantly higher than that of other rootstocks, and the Tr of 'Qingzhen 1' was the lowest at the same stage. However, during the severe drought stress condition, the Tr of 'B.9' was higher and the Tr of 'Fupingqiuzi' and 'Qingzhen 1' was lower. The Tr of the eight rootstocks decreased by 70.4%, 78.5%, 71.1%, 83.0%, 59.6%, 76.8%, 69.7%, and 66.2%, respectively (Fig. 4).
Moreover, the Ci of 'Fupingqiuzi' increased at moderate stress levels and then slowly decreased at severe stress conditions. Meanwhile, the rest of the rootstocks were in a state of slow decline. The decreasing range of Ci for eight rootstocks was 11.2%, 6.2%, 11.5%, 4.3%, 2.3%, 32.5%, 7.5%, and 1.7%, respectively (Fig. 4).
As shown in Fig. 4, with the decrease of soil relative water content, the Gs and net Pn of different apple rootstocks showed a parallel trend of change, and both showed a decreasing trend with the deepening of drought stress. When the relative soil water content was 65%–75%, the Gs of 'Fupingqiuzi' was higher, and when the relative soil water content was 30%, 'B.9' was at a higher level compared with other rootstocks. The Gs of the eight rootstocks decreased by 88.3%, 84.4%, 79.6%, 81.8%, 56.0%, 93.1%, 85.3%, and 74.6%, respectively (Fig. 4).
Photosynthetic pigments in the leaves of rootstocks under drought stress
-
Drought stress causes the degradation of chlorophyll and carotenoids in leaves, which reduces their chlorophyll content. Therefore, the content of photosynthetic pigments is an important index to evaluate the drought resistance of plants. As shown in Fig. 5, in general, the chlorophyll and carotenoid content of each rootstock cultivar continued to decrease with the aggravation of drought stress. The chlorophyll and carotenoid contents of 'Fupingqiuzi' and 'M.9-Nic29' were relatively higher under various drought stress conditions. When the relative soil water content was the lowest (25%–35%, severe drought stress), the chlorophyll content of 'MM.111' was the lowest compared to other rootstocks. Compared with mild drought stress, the chlorophyll content in each rootstock decreased by 33.2%, 41.2%, 38.6%, 33.6%, 22.1%, 38.7%, 29.2%, and 11.5%, respectively (Fig. 5). Under severe drought stress, the content of carotenoids in 'M.9-Nic29' was higher and lower in 'MM.111'. The decreasing range of carotenoid content in different rootstocks was 13.0%, 17.6%, 28.9%, 17.4%, 7.8%, 30.2%, 22.1%, and 38.0%, respectively (Fig 5).
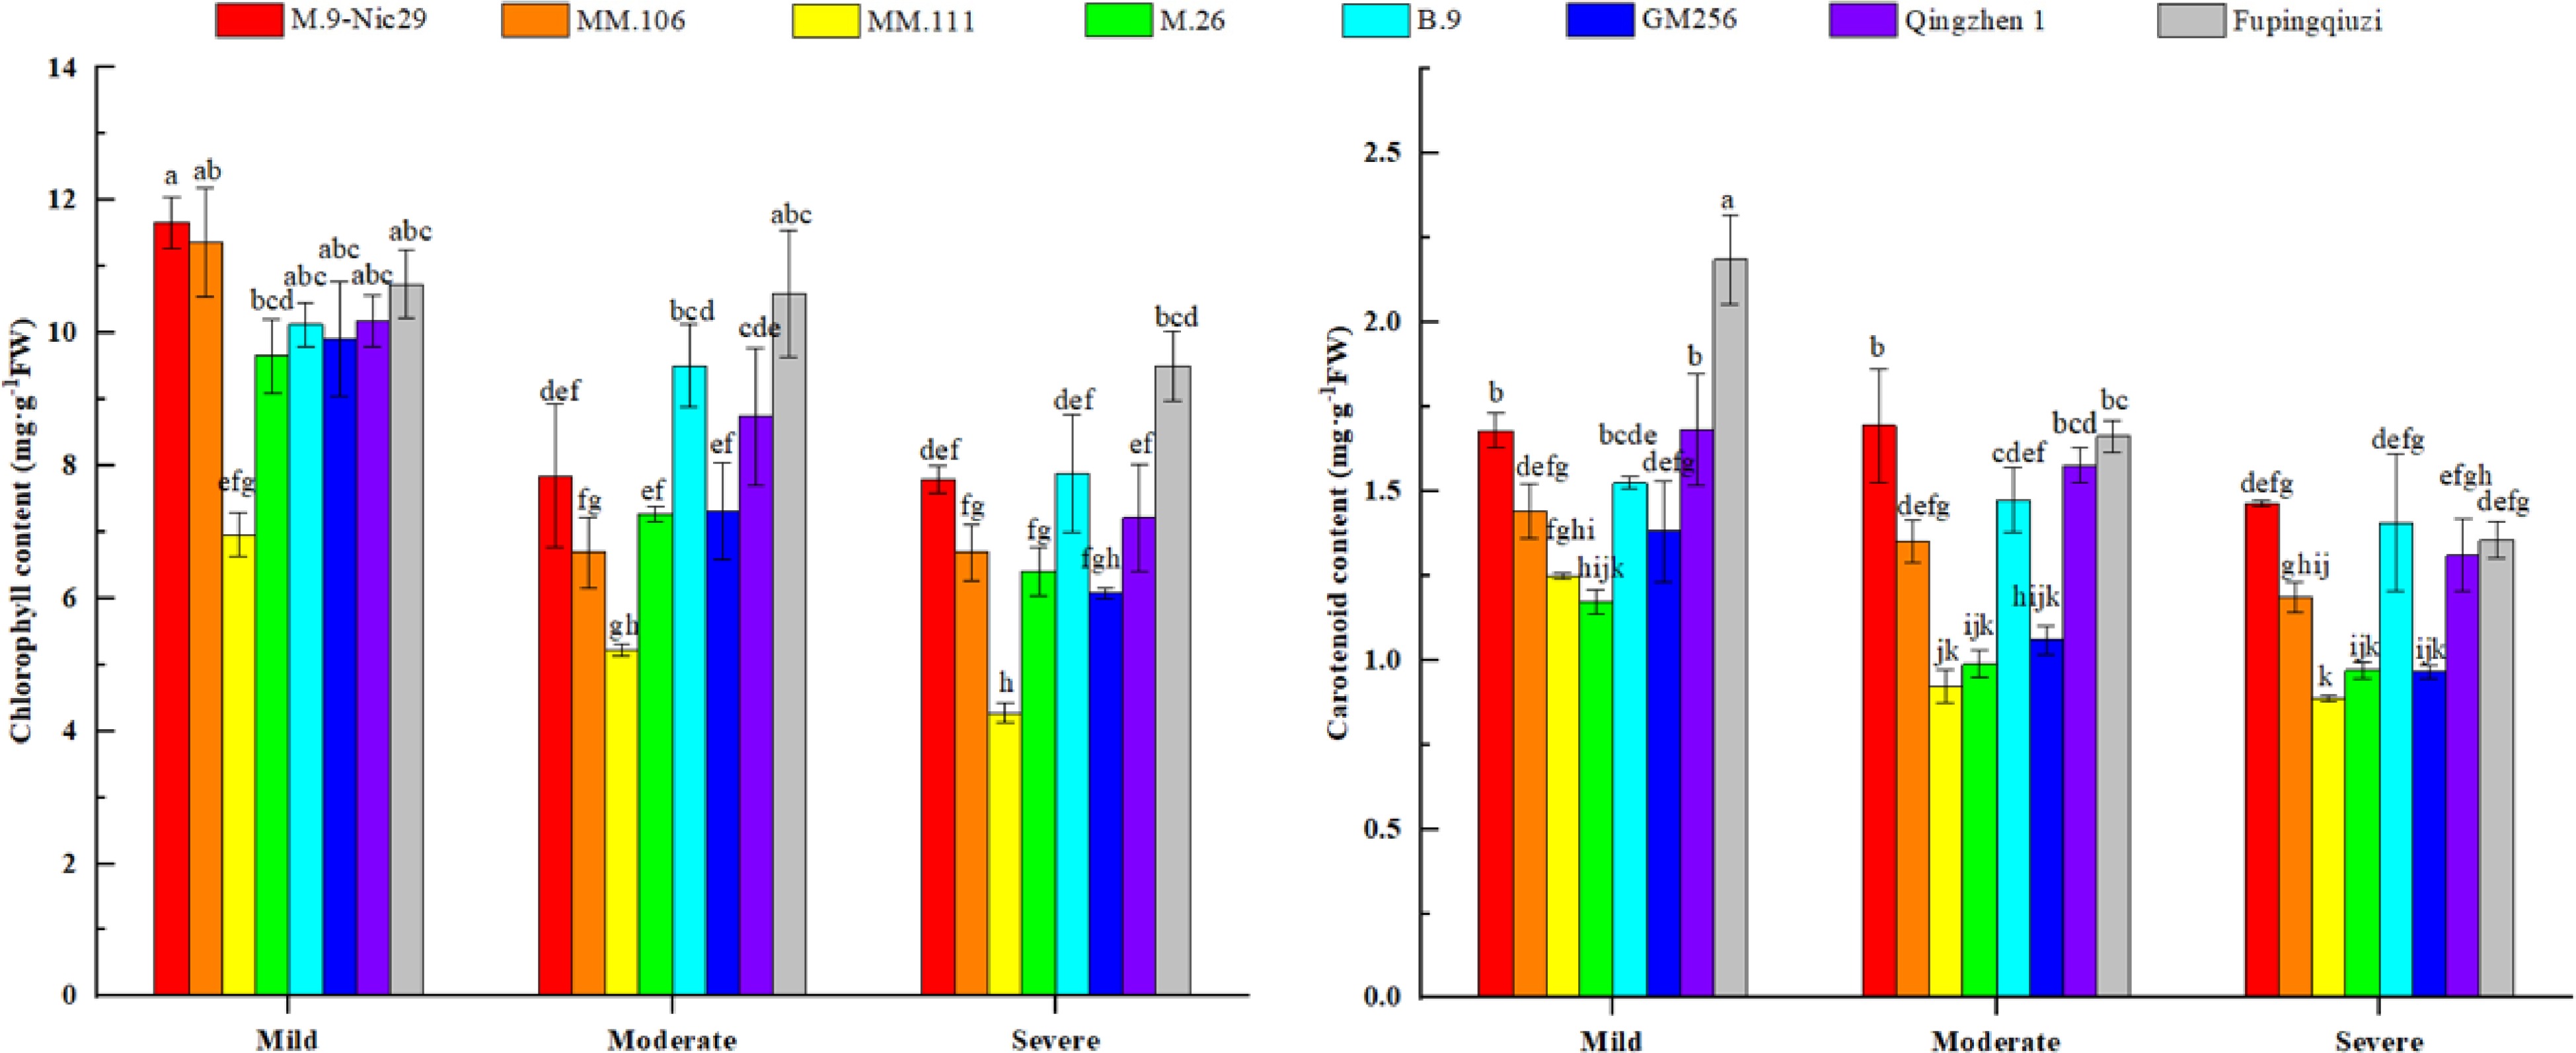
Figure 5.
The effect of different levels of drought on the contents of photosynthetic pigments (chlorophyll and carotenoid) in different apple rootstocks. Samples were harvested when the relative soil water content reached 65%–75% (mild drought stress), 45%–55% (moderate drought stress), and 25%–35% (severe drought stress). Error bars refer to the average value ± SD from three biological replicates. Different letters indicate a significant difference at p < 0.05.
Chlorophyll fluorescence parameters in the leaves of rootstocks under drought stress
-
The photochemical efficiency of the PSII reaction centre (
${\text Φ} $ ${\text Φ} $ ${\text Φ} $ ${\text Φ} $ ${\text Φ} $ ${\text Φ} $ 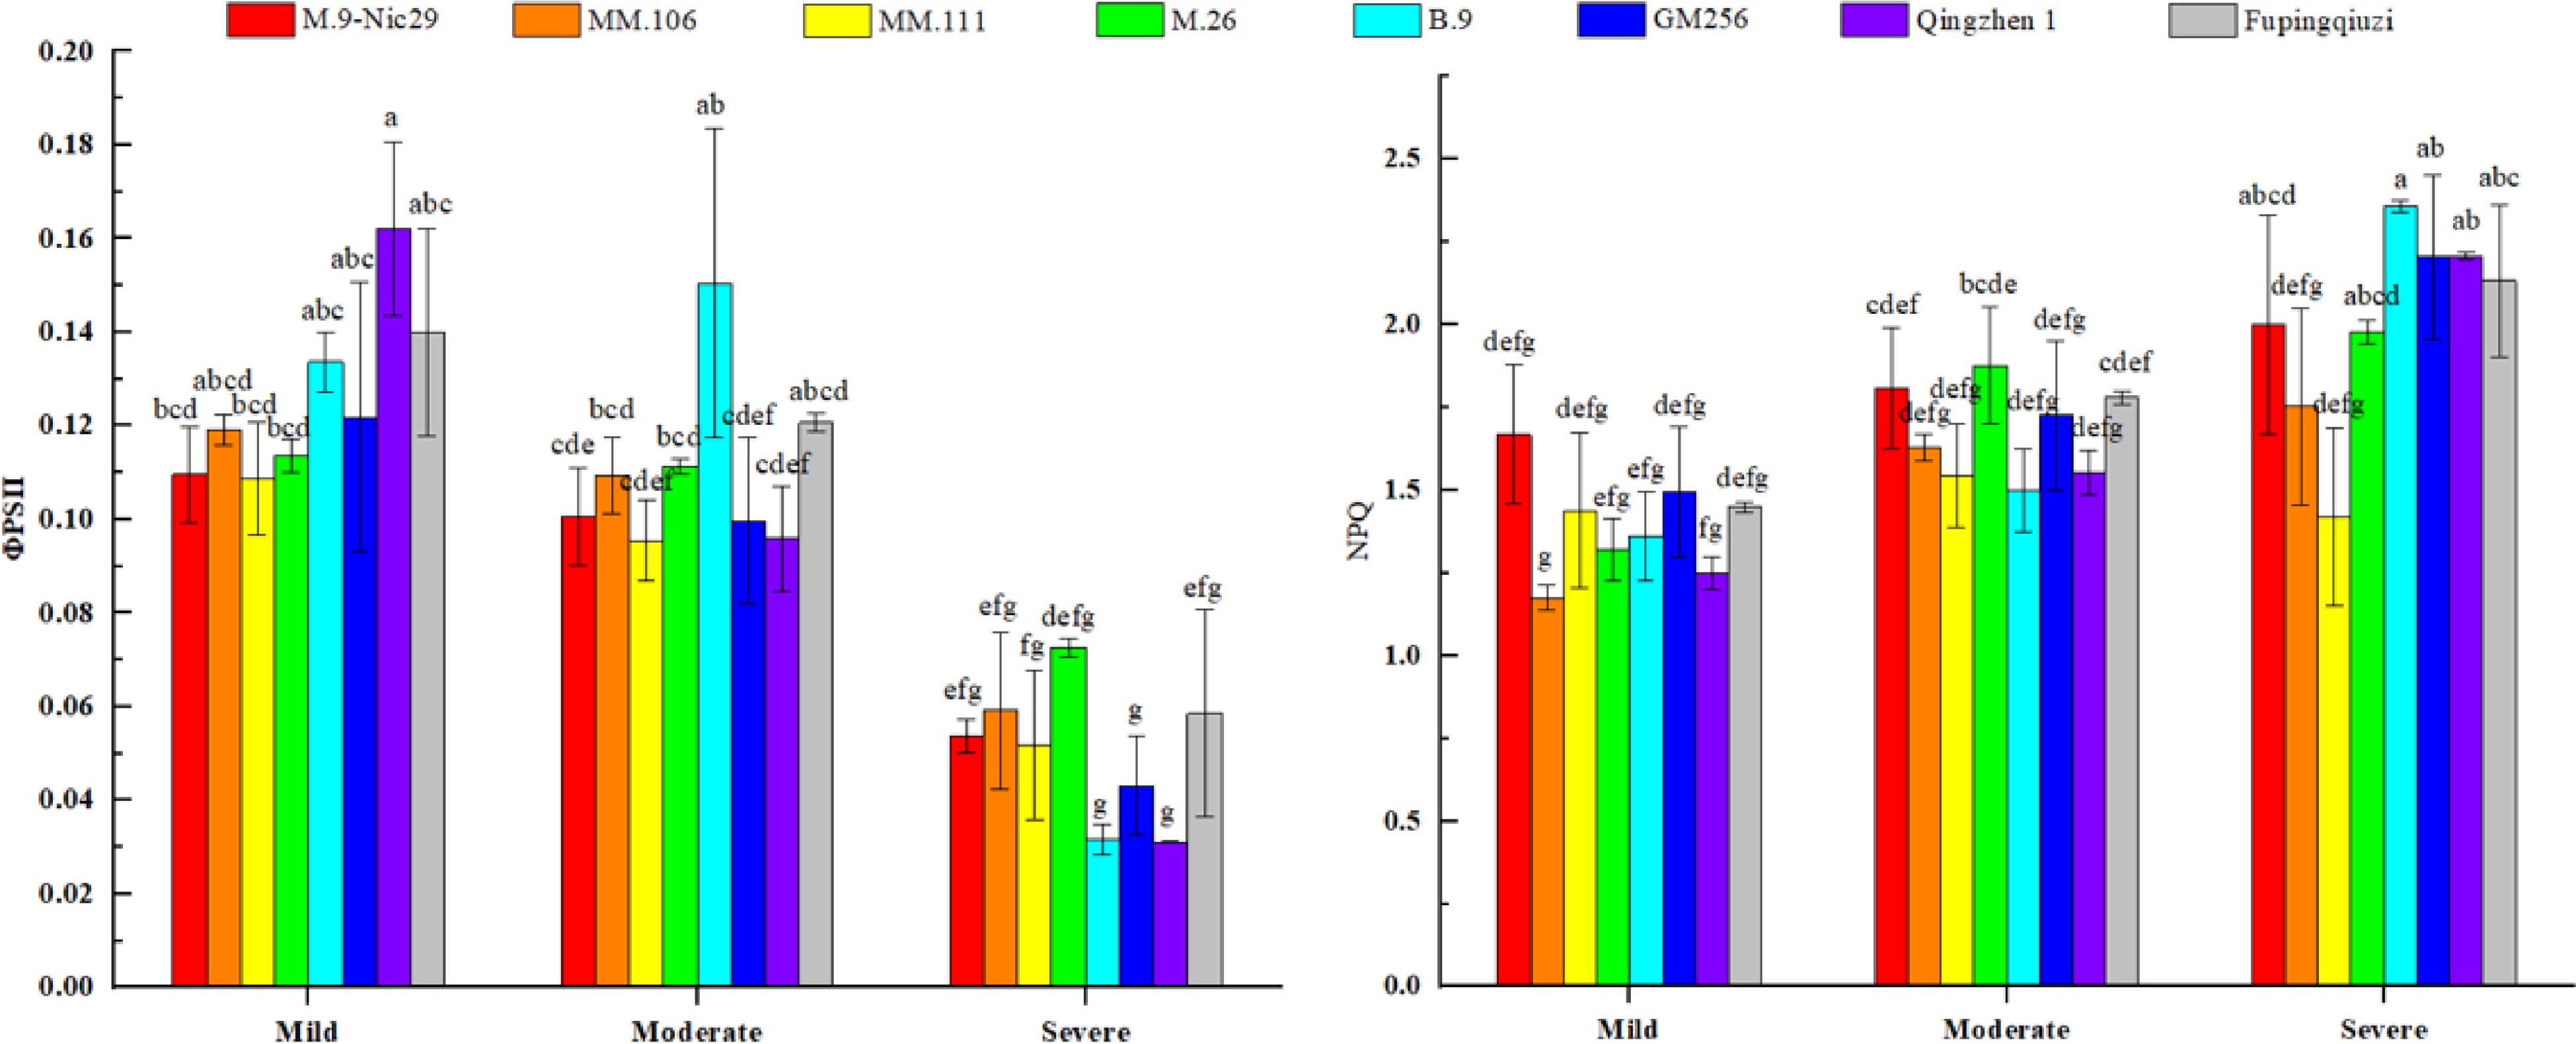
Figure 6.
The effect of different levels of drought on the chlorophyll fluorescence (photochemical efficiency of PSII reaction centre,
${\text Φ} $ PSII and non-photochemical quenching coefficient, NPQ) in leaves of different apple rootstocks. Samples were harvested when the relative soil water content reached 65%–75% (mild drought stress), 45%–55% (moderate drought stress), and 25%–35% (severe drought stress). Error bars refer to the average value ± SD from three biological replicates. Different letters indicate a significant difference at p < 0.05.The non-photochemical quenching coefficient (NPQ) represents the heat dissipation capacity of plants. The NPQ values of different rootstocks also increased, indicating that the eight rootstocks have a certain heat dissipation capacity. At the initial stage of drought stress, the initial NPQ value of 'M.9-Nic29' was higher, and that of 'MM.106' was lower; at the stage of severe drought stress, the NPQ value of 'B.9' was higher, and that of 'MM.111' was lower. The NPQ increase rates of the eight rootstock leaves were 19.9%, 49.3%, –1.3%, 49.9%, 73.2%, 47.4%, 76.8%, and 47.2%, respectively (Fig. 6).
Water use efficiency in the leaves of rootstocks under drought stress
-
During drought stress, the water use efficiency (WUE) of each rootstock showed the same trend of change, reaching a maximum at 45%–55% relative soil water content (a moderate stress condition) and then sharply decreasing towards severe drought stress (Fig. 7). Under mild drought stress, the WUE of 'Qingzhen 1' was higher, and 'GM256' was lower; during severe drought stress, the WUE of 'M.9-Nic29' was higher than that of other rootstocks, and the WUE of 'MM.106' was the lowest. The decreasing range of WUE of the eight rootstocks was 19.4%, 81.5%, 71.6%, 73.7%, 51.1%, 16.8%, 72.5%, and 60.2%, respectively.
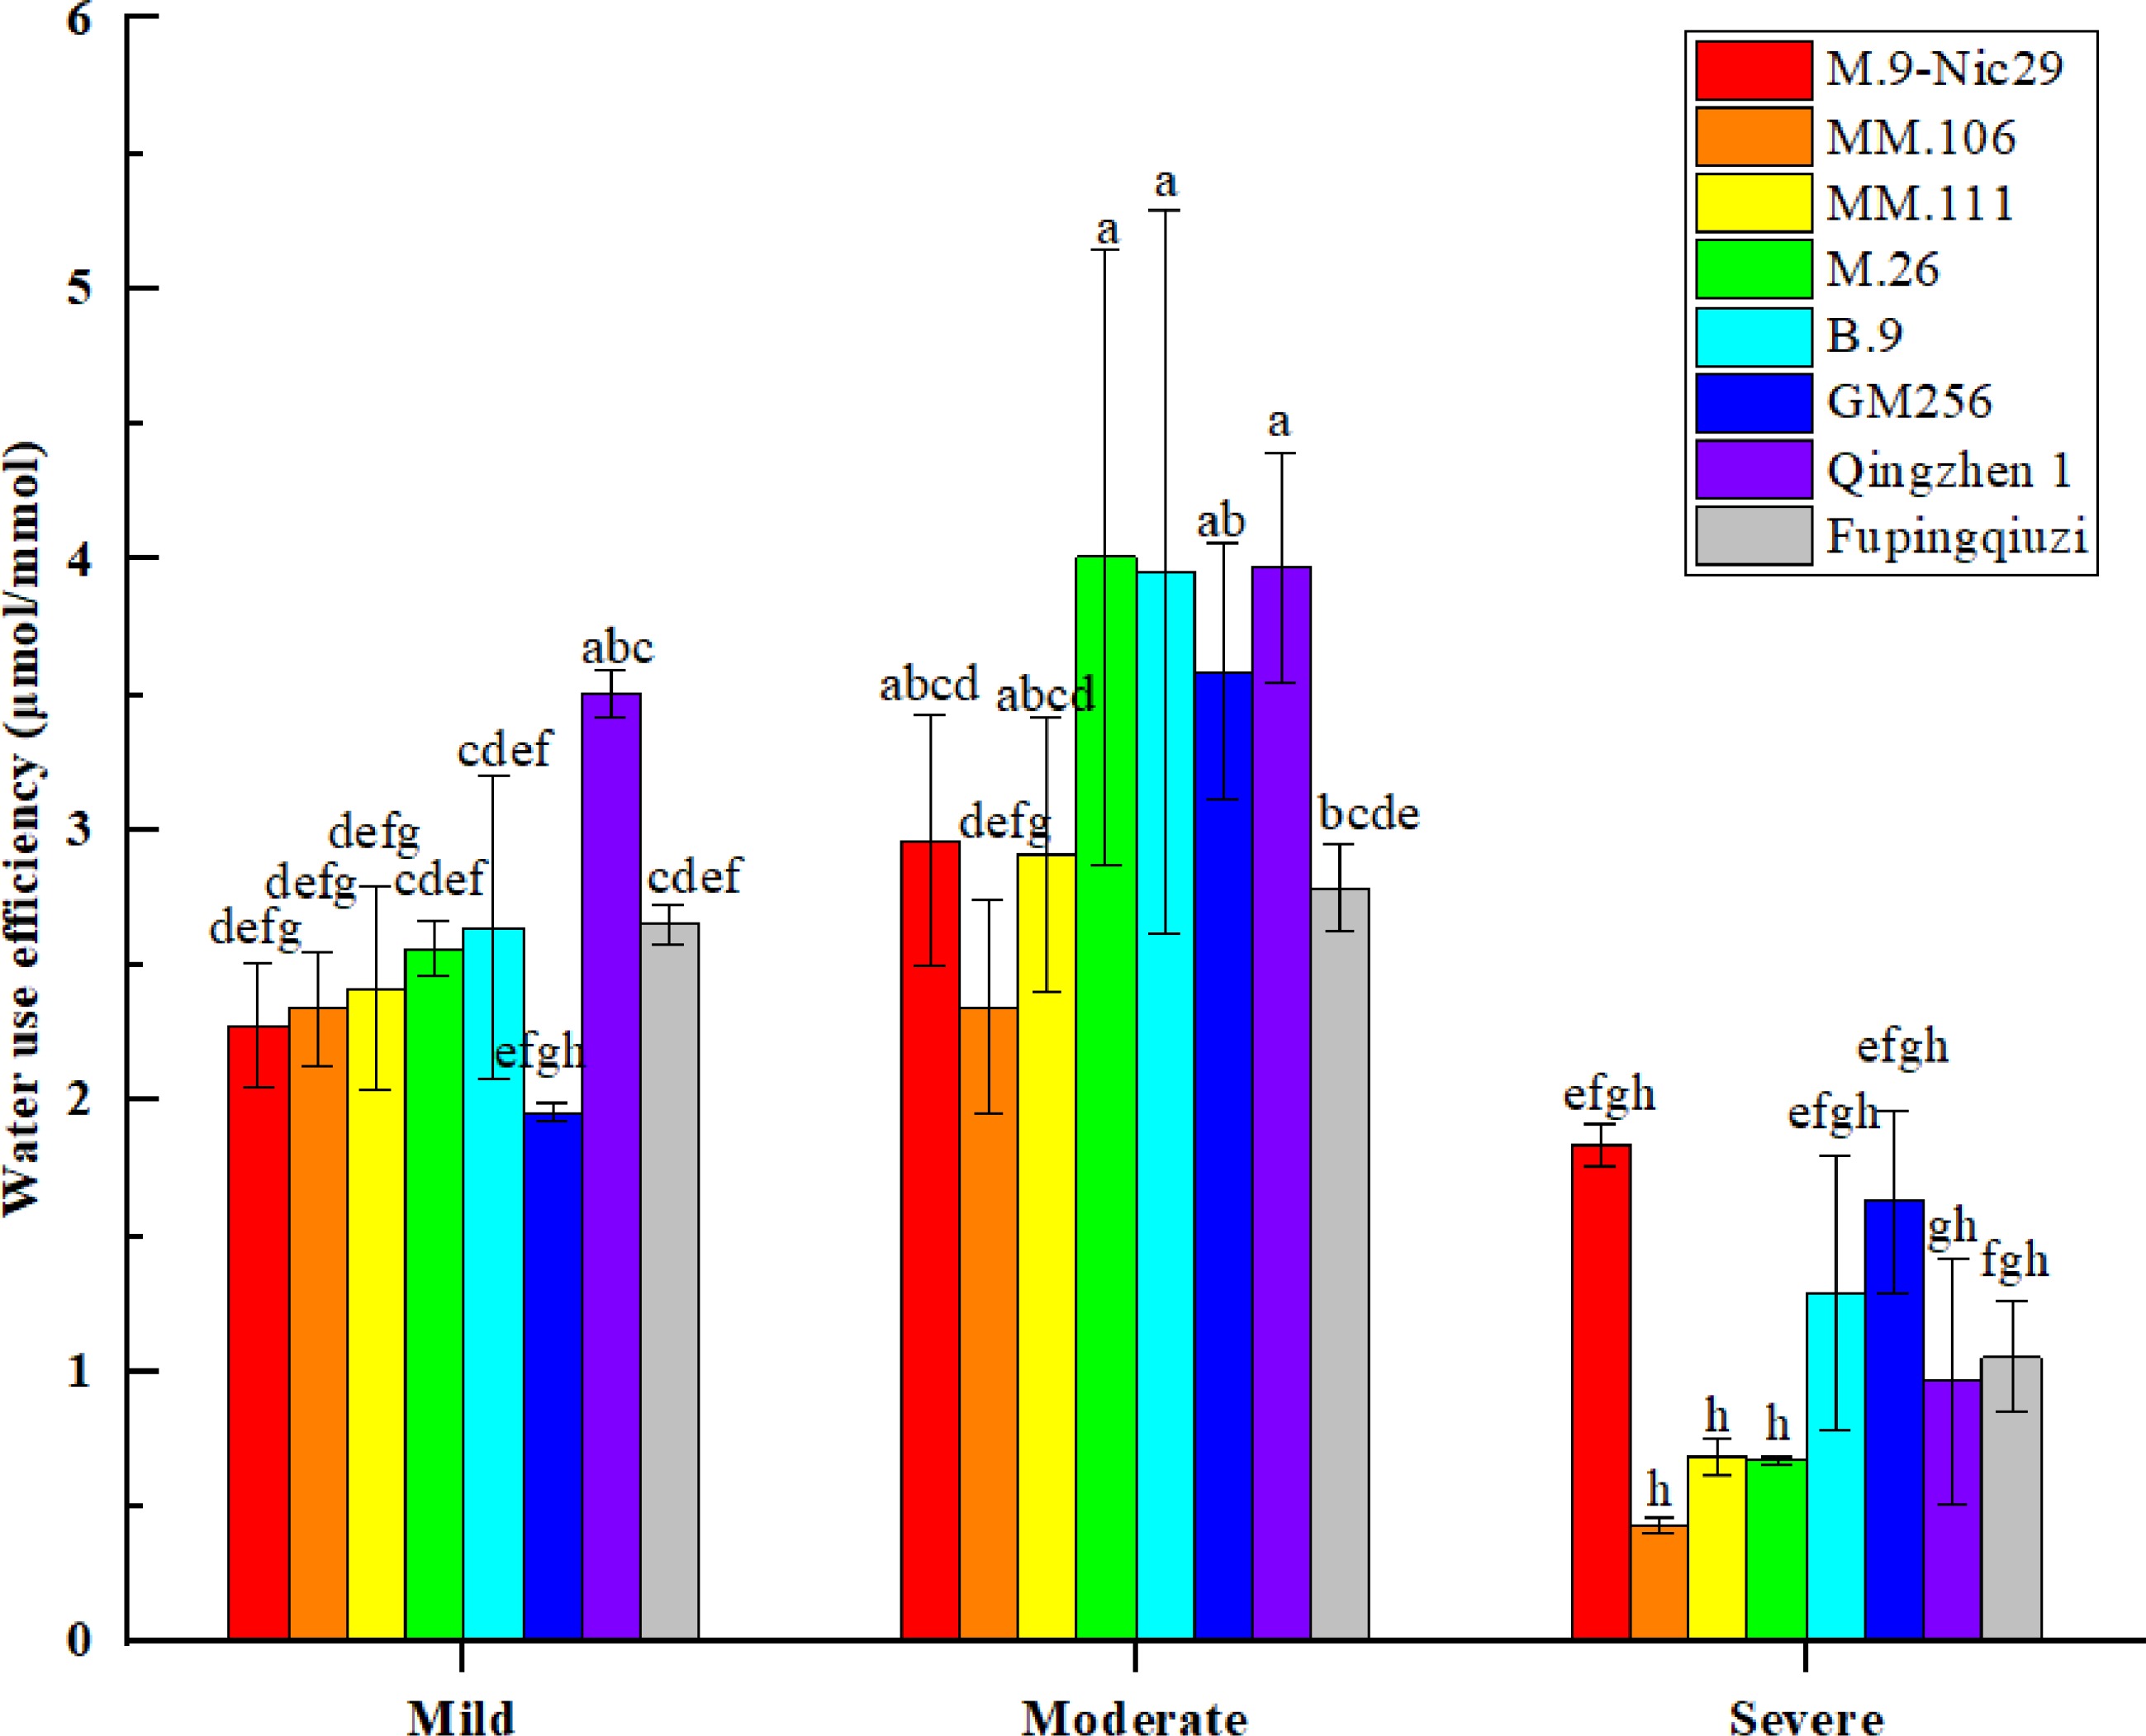
Figure 7.
The effect of different levels of drought on the water use efficiency (WUE) of different apple rootstocks. Samples were harvested when the relative soil water content reached 65%–75% (mild drought stress), 45%–55% (moderate drought stress), and 25%–35% (severe drought stress). Error bars refer to the average value ± SD from three biological replicates. Different letters indicate a significant difference at p < 0.05.
Non-structural carbohydrate and reducing sugar content in the leaves of rootstocks under drought stress
-
The variations in the non-carbohydrate content (NSC) of eight rootstocks under mild, moderate, and severe drought stress were also investigated. The varying trends of soluble sugar, starch, and NSC content in different apple rootstocks were different (Fig. 8). Except for the soluble sugar content of 'MM.106', which first decreased and then increased with the aggravation of drought, the soluble sugar content of the other seven rootstocks increased continuously with the alleviation of stress. The soluble sugar content in the leaves of eight rootstocks increased by 202.9%, 146.1%, 637.6%, 122.9%, 306.1%, 505.4%, 178.6%, and 116.8%, respectively (Fig. 8).
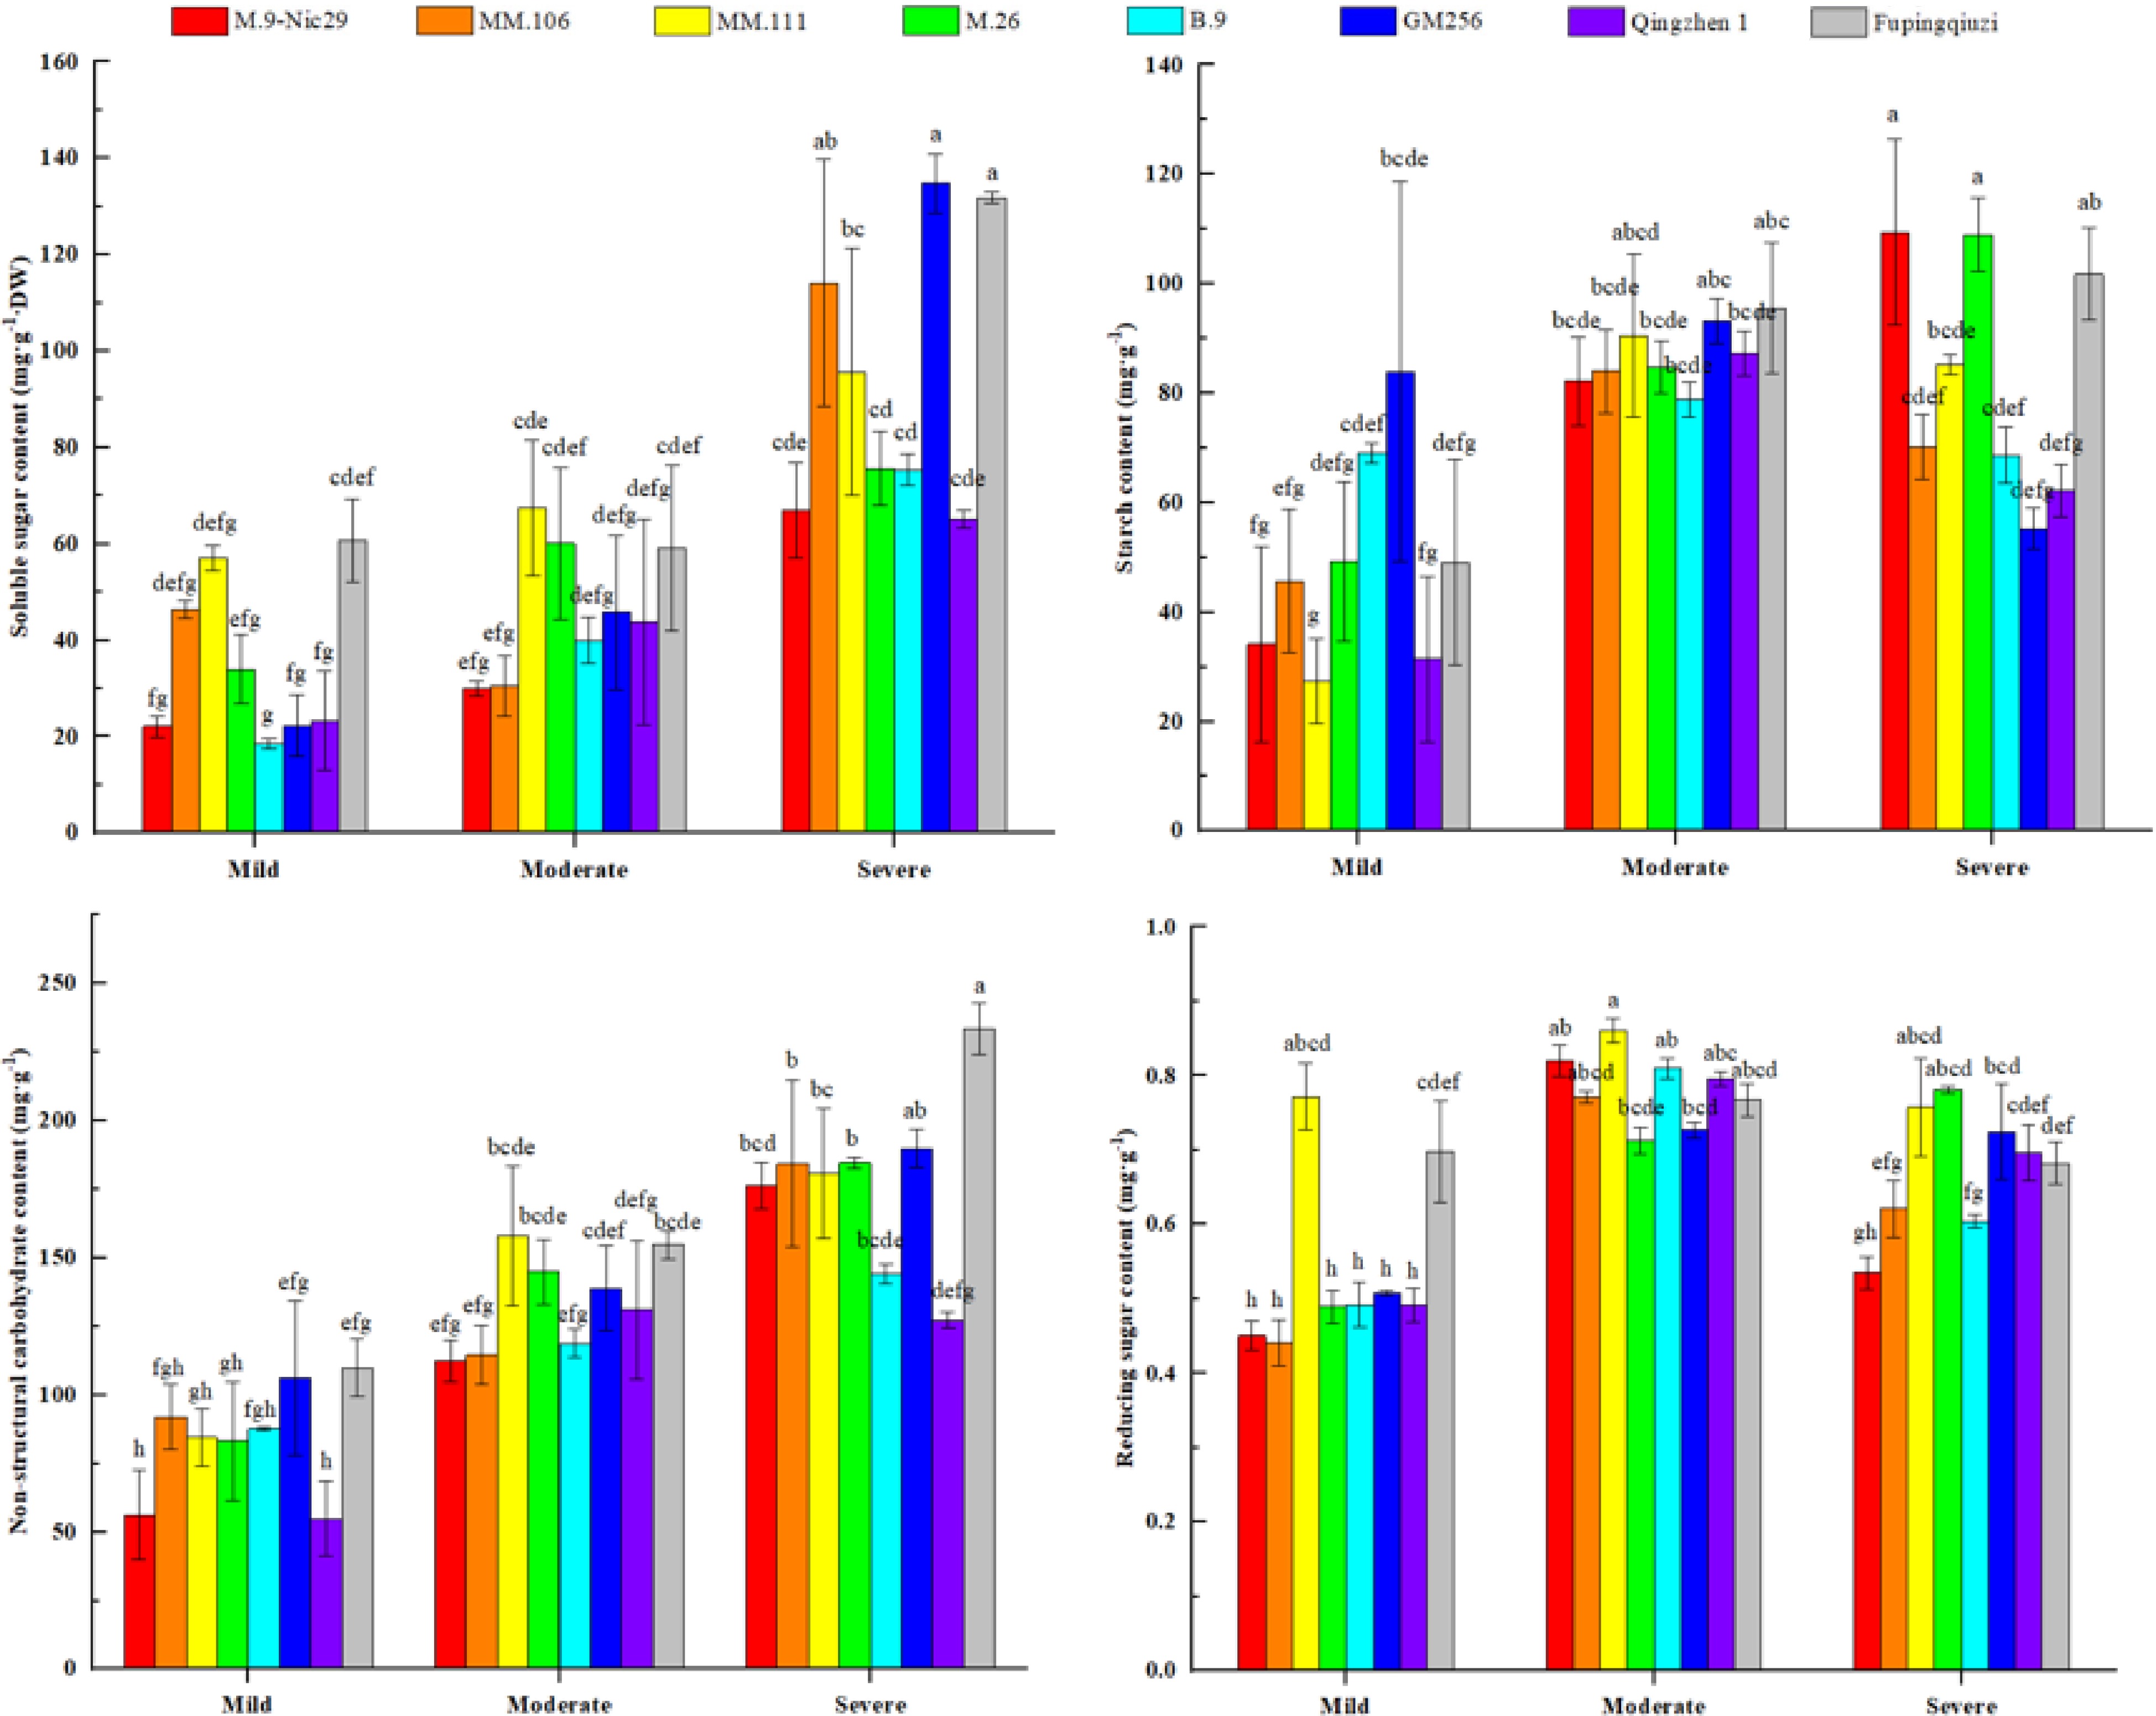
Figure 8.
The effect of different levels of drought on non-structural carbohydrates (NSC) and reducing sugar content in leaves of different apple rootstocks. Samples were harvested when the relative soil water content reached 65%–75% (mild drought stress), 45%–55% (moderate drought stress), and 25%–35% (severe drought stress). Error bars refer to the average value ± SD from three biological replicates. Different letters indicate a significant difference at p < 0.05.
Furthermore, the variations in starch content of different rootstock varieties were also different. Overall, 'B.9', 'Qingzhen 1', 'MM.106', 'GM256', and 'MM.111' showed different starch contents under drought stress. The starch content of the other four rootstocks increased gradually with the severity of drought stress. The growth rates of starch content in the leaves of the eight rootstocks were 220.4%, 53.9%, 211.7%, 121.3%, –0.6%, –37.9%, 97.9%, and 157.3%, respectively (Fig. 8). As can be seen in Fig. 8, with the deepening of drought stress, the NSC content of the eight apple rootstocks showed a gradually increasing trend as a whole. At the end of drought stress, the NSC content of 'Fupingqiuzi' was significantly higher than that of other rootstocks. The growth rates of NSC content in the leaves of the eight rootstocks were 213.5%, 100.4%, 114.2%, 122.0%, 64.4%, 79.0%, 132.3%, and 112.6%, respectively (Fig. 8).
Reducing sugar is an important osmotic regulator and an indicator for measuring plants' drought resistance. It can be seen from Fig. 8 that with the deepening of drought stress, the reducing sugar content of all rootstocks showed a trend of first increasing and then decreasing, except for 'M.26', where reducing sugar content increased from mild to severe stress. Under mild and moderate drought stress, the reducing sugar content of 'MM.111' was consistently higher than that of other rootstocks, while the reducing sugar content of 'M.26' was the highest under severe drought stress. The growth rates of reducing sugar content in the leaves of the eight rootstocks were 18.7%, 40.6%, –1.8%, 59.7%, 22.7%, 42.7%, 41.5%, and –2.3%, respectively.
Root relative electrical conductivity and root vigor of different rootstocks under drought stress
-
The premise of the normal physiological function of plant cells is that they have a stable cytoplasmic membrane system. Drought stress causes damage to the plasma membrane system. It increases the plasma membrane's permeability, leading to the leakage of ions and small molecules into the cell and increasing conductivity. The relative conductivity of the roots of each rootstock showed an upward trend with increasing stress. Under mild drought stress conditions, the relative conductivities of the roots of 'M.26' and 'M.9-Nic29' were lower, and the relative conductivities of other rootstocks were not significantly different. Moreover, under moderate and severe drought stress conditions, the relative conductivities of the roots of 'B.9' and 'MM.111' were lower than those of other rootstocks (Fig. 9). The growth rates of the root plasma membrane permeability of the eight rootstocks were 120.7%, 98.0%, 55.8%, 130.6%, 47.2%, 89.5%, 53.7%, and 79.3%, respectively.
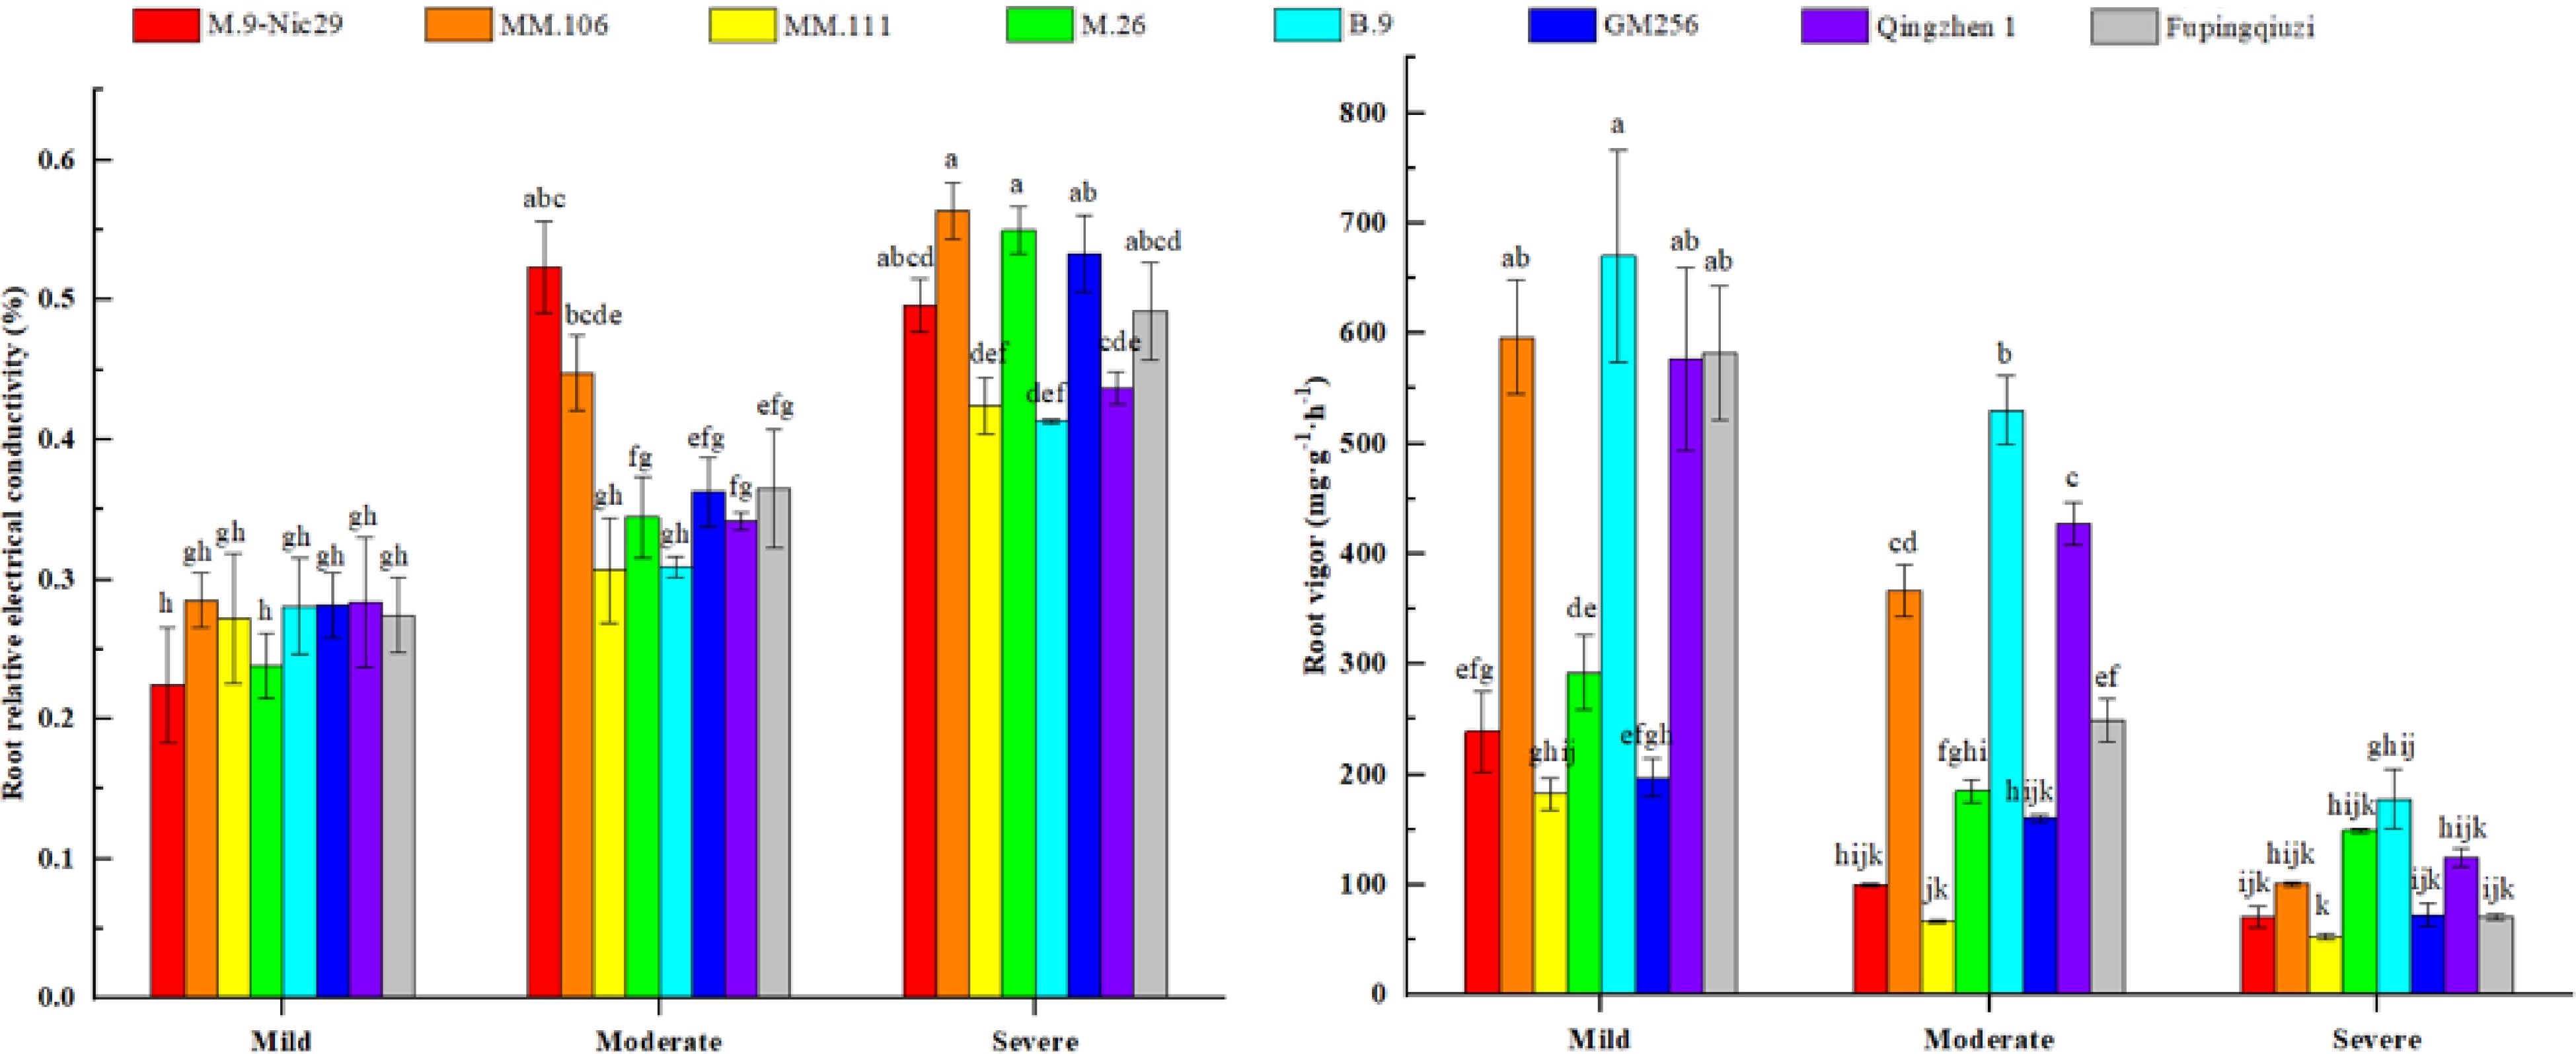
Figure 9.
The effect of different levels of drought on the relative electrical conductivity and root vigor of different apple rootstocks. Samples were harvested when the relative soil water content reached 65%–75% (mild drought stress), 45%–55% (moderate drought stress), and 25%–35% (severe drought stress). Error bars refer to the average value ± SD from three biological replicates. Different letters indicate a significant difference at p < 0.05.
Root vigor of different rootstocks under drought stress showed a downward trend with increasing stress. Among them, 'B.9' had the highest root activity in the mild stress condition, followed by 'MM.106', 'Qingzhen 1', and 'Fupingqiuzi'. Furthermore, under moderate and severe drought stress conditions, the root activity of 'B.9' was also higher than that of other rootstocks (Fig. 9). The root vigor of the eight rootstocks decreased by 70.5%, 83.1%, 71.0%, 49.0%, 73.5%, 63.3%, 78.3%, and 87.8%, respectively.
Comprehensive evaluation of drought resistance
-
Drought resistance is a complex trait composed of multiple attributes. The drought resistance evaluated by a single water control condition and a single index is one-sided and cannot fully and genuinely reflect the drought resistance of plants. To evaluate plant drought resistance comprehensively, multiple indicators must be used in the identification and evaluation of drought resistance results. A comprehensive evaluation based on the average score of membership function of 20 indexes, such as leaf morphology, anatomy, photosynthesis, and physiological regulation of eight apple rootstocks under drought stress, was used as the basis for the comprehensive evaluation. The higher the score, the stronger the drought resistance. The results show that 'Fupingqiuzi' obtained the highest comprehensive score with a score of 0.715; 'Qingzhen 1' and 'B.9' obtained the second and third highest scores of 0.537 and 0.520, respectively (Table 2). These results indicate that 'Fupingqiuzi' has the most robust drought resistance, followed by 'Qingzhen 1' and 'B.9'.
Table 2. Membership function value of drought resistance of different apple rootstock.
Indexes Membership function value 'M.9-Nic29' 'MM.106' 'MM.111' 'M.26' 'B.9' 'GM256' 'Qingzhen 1' 'Fupingqiuzi' Pn 0.340 0.405 0.000 0.918 0.869 0.688 0.183 1.000 Gs 0.638 0.489 0.973 0.259 0.934 0.508 1.000 0.000 Ci 0.307 0.390 0.205 0.237 0.180 0.522 1.000 0.000 Tr 0.500 0.000 0.821 0.000 0.500 0.321 1.000 0.071 WUE 0.589 0.000 0.268 0.640 0.832 0.617 1.000 0.404 Chlorophyll 0.755 0.577 0.000 0.478 0.770 0.476 0.674 1.000 Carotenoid 0.829 0.429 0.000 0.035 0.628 0.163 0.704 1.000 Soluble sugar 0.000 0.542 0.764 0.382 0.112 0.631 0.100 1.000 Starch 0.684 0.288 0.337 0.947 0.545 0.784 0.000 1.000 NSC 0.171 0.420 0.596 0.538 0.202 0.659 0.000 1.000 Reducing sugar 0.000 0.049 1.000 0.305 0.172 0.264 0.305 0.586 Relative water content of leaves 0.221 0.485 0.721 0.367 0.037 0.000 1.000 0.668 Root relative Conductivity 0.178 0.000 1.000 0.555 0.999 0.406 0.797 0.561 Root vitality 0.100 0.708 0.000 0.301 1.000 0.119 0.768 0.558 Leaf thickness 0.004 0.521 0.464 0.000 0.268 0.180 0.346 1.000 Upper epidermis thickness 0.927 1.000 0.659 0.493 0.051 0.419 0.000 0.554 Palisade tissue thickness 0.012 0.601 0.424 0.000 0.126 0.100 0.363 1.000 Sponge tissue thickness 0.000 0.493 0.550 0.084 0.457 0.273 0.412 1.000 ${\text Φ} $PSII 0.119 0.500 0.000 0.657 0.948 0.138 0.519 1.000 NPQ 1.000 0.145 0.000 0.718 0.761 0.952 0.564 0.892 Average score 0.369 0.402 0.439 0.396 0.520 0.411 0.537 0.715 Rank 8 6 4 7 3 5 2 1 Photosynthetic rate (Pn), transpiration rate (Tr), intercellular CO2 concentration (Ci), stomatal conductance (Gs), water use efficiency (WUE), non-structural carbohydrate (NSC), photochemical efficiency of PSII reaction centre (ΦPSII), and non-photochemical quenching coefficient (NPQ). -
Leaf traits are related to the ability of plants to adapt to their environment and self-regulate. Plant adaptation research focuses on how leaf traits respond to and adapt to climate change. Leaf transpiration is the leading way for plants to lose water. Under water-deficient conditions, leaves are the most sensitive organs, and their morphology and anatomical structure can better reflect the adaptability of plants to drought stress[15]. The present study showed that under drought stress, there were differences in leaf thickness, upper epidermis thickness, palisade tissue thickness, and spongy tissue thickness among eight apple rootstocks (Fig. 2 and Table 1), indicating that plant leaf thickness and structure were related to genetics. The thicker leaves have a stronger water retention capacity[16]. The thicker leaves of 'Fupingqiuzi' can prevent water from evaporating, and the thicker upper epidermis can effectively reduce transpiration, resulting in 'Fupingqiuzi's' better adaptation to the arid environment. These are consistent with the results of the membership function analysis (Table 2). Studies have shown that the thicker the palisade tissue, the smaller the cells, the tighter the arrangement, and the stronger the drought resistance[17]. This study also found that the palisade tissue of the more drought-resistant 'Fupingqiuzi' was thicker (Fig. 2 and Table 1). Collectively, results indicate that 'Fupingqiuzi' has strong adaptability and drought resistance in the arid environment.
Studies have shown that water is important for plant growth and metabolism. Under drought conditions, the higher the relative water content, the stronger the water retention and drought resistance[18]. In this experiment, with the aggravation of drought stress, 'Fupingqiuzi' and 'Qingzhen 1' had higher RWC (Fig. 3), indicating that these two rootstocks had stronger drought resistance, which was consistent with the results of the membership function evaluation (Table 2). Moreover, the palisade tissue of 'Fupingqiuzi' was thicker (Fig. 2 and Table 1), indicating that under drought conditions, the developed palisade tissue can prevent the evaporation of cell water.
Under drought conditions, the water potential of the leaves drops due to the loss of water, and the leaves wilt. Therefore, the degree of leaf wilting is often used as a morphological index for identifying drought resistance in the field under drought conditions and is used to evaluate the drought resistance of plants. In this experiment, different degrees of leaf wilting were found in 'Fupingqiuzi' and 'Qingzhen 1', with strong drought resistance under severe drought stress, while 'GM256' and 'MM.111', with weak drought resistance, were less wilted under the same stress (Fig. 2). These may be related to the difference in material genotype or physiological state, which will affect the evaluation of plant drought resistance to a certain extent.
The effects of water stress on the growth and metabolism of plants are multi-faceted, among which the effect on plant photosynthesis is particularly prominent[19,20]. Changes in photosynthetic indicators can reflect the impact of plant growth under stress. The net photosynthetic rate is one of the essential indicators reflecting plant photosynthesis. In the current study, the decrease range of each photosynthetic index of 'B.9' and 'Fupingqiuzi' was smaller than that of other rootstocks under the same drought stress conditions (Fig. 4). It indicated that drought stress had little effect on 'B.9' and 'Fupingqiuzi', which could maintain higher photosynthetic energy and thus have stronger drought resistance. It could also be because the palisade tissue was thicker and had more chloroplasts, which is conducive to the progress of photosynthesis and increases the photosynthetic rate of plants, thereby improving drought resistance.
Chlorophyll is the main pigment for photosynthesis and plays a key role in light absorption during photosynthesis. Its relative content is also an important indicator of plant photosynthesis capacity, nutrient stress, and growth and development stages[21]. Carotenoids have the functions of light energy capture and light damage defense, thereby protecting leaves from absorbing light energy reasonably and coordinating photosynthesis[22]. In our study, under moderate drought stress, the carotenoid content of 'Fupingqiuzi' was significantly higher than that of other rootstocks. Under severe drought stress, chlorophyll and carotenoid contents in 'Fupingqiuzi' and 'M.9-Nic29' were higher than those of other rootstocks, indicating that 'Fupingqiuzi' has strong drought resistance (Fig. 5).
From the perspective of
${\text Φ} $ ${\text Φ} $ Osmotic adjustment plays an essential role in plants' coping with drought stress[24]. According to studies[25,26], under drought stress, the decomposition of starch was enhanced, which would increase the soluble sugar content and improve the drought resistance of plants. Plant NSC content is one of the crucial substances in plant osmotic regulation. They have a particular effect on osmotic regulation, and their accumulation level is proportional to the ability of plants to resist drought stress. Plants can resist drought stress by accumulating NSC content to increase osmotic potential. Under severe drought stress, the NSC content of 'Fupingqiuzi' was significantly higher than that of other rootstocks (Fig. 8), indicating its strong regulation ability. This could be due to 'Fupingqiuzi's' relatively developed root system, which still maintains strong water absorption under drought-stress conditions, causing the leaves to retain a high water potential.
Moreover, the membrane system of the leaves was damaged to a small extent, the chlorophyll synthesis rate was more significant than the degradation rate, and the increase in chlorophyll content was conducive to the photosynthetic efficiency of the leaves. With the increase in light energy utilization, the plant's photosynthetic efficiency improved, and the synthesis of organic matter was greater than the consumption, promoting plant growth and development. The results of previous studies[27,28] showed that under different drought stress conditions, the membrane structure of roots was damaged to varying degrees; the heavier the drought stress, the more severe the damage to the membrane structure, and the greater the relative conductivity. In this study, the relative conductivity of the eight rootstocks increased after drought stress, indicating that the cell membranes of different rootstocks were damaged to a certain extent during drought stress. The relative conductivity of 'B.9', 'Qingzhen 1', and 'MM.111' has a slight increase (Fig. 9), which effectively protects the plasma membrane function, delays the damage caused by adversity, and ensures the stability of cells, which may be related to osmotic regulation in plant substance synthesis and decomposition processes.
Root vigor directly affects the growth and development of different plants and is significant in obtaining high yields in the later stages[29−31]. Under different drought stress conditions, the root vigor of 'B.9' has been significantly higher than that of other rootstocks (Fig. 9), indicating that under drought stress, the plant can resist drought stress by increasing its root vigor, showing strong drought resistance. The results are consistent with the results of the membership function analysis (Table 2).
-
In this study, the drought resistance of eight widely used apple rootstocks was investigated under natural drought conditions by analyzing their ultrastructural differences and the physiological and biochemical characteristics of the leaves. Among them, 'Fupingqiuzi' had the strongest drought resistance, and 'Qingzhen 1' and 'B.9' had better drought resistance. These three drought-resistant apple rootstocks can be selected for propagation in arid and semi-arid regions.
-
The experiment was conducted in a rain shelter at the Yangling Subsidiary Center of the National Apple Improvement Center in Shaanxi, China (Yangling, Shaanxi; 34°31′ N, 108°05′ E) in July 2021. The test material of 1-year-old apple rootstocks, such as 'M.9-Nic29', 'MM.106', 'MM.111', 'M.26', 'B.9', 'GM256', 'Qingzhen 1', and 'Fupingqiuzi', was used (Table 3). Rootstocks were planted in plastic pots measuring 16 cm × 10 cm × 30 cm in mid-March 2021. The soil, with a ratio of raw soil to substrate of 3:1, was used as the test soil, and each pot weighed the same.
Table 3. Background information about rootstocks used in this study.
Genotype Species Dwarfing class Origin Parents 'M.9-Nic29' Malus domestica Borkh. Dwarfing Belgian Nursery Rene Nicolai N.V. M9 'MM.106' Malus domestica Borkh. Semi-vigorous East Malling Research, UK Junxiu × M1 'MM.111' Malus domestica Borkh. Vigorous East Malling Research, UK Junxiu × M1 'M.26' Malus domestica Borkh. Semi-Dwarfing East Malling Research, UK M.16 × M.9 'B.9' Malus domestica Borkh Dwarfing Michurin University of former the Soviet Union M.8 × Red Standard 'GM256' Malus domestica Borkh. Semi-dwarfing Fruit Tree Institute of Jilin Academy of Agricultural Sciences Malus Prunifolia (Willd.) Borkh. × M.9 'Qingzhen 1' No species name Semi-dwarfing Qingdao Agricultural Academy, China Malus domestica Borkh. × Malus hupehensis Rehd. 'Fupingqiuzi' Malus prunifolia (Willd.) Borkh. Vigorous China Natural seedlings of Malus prunifolia Borkh. In July 2021, when the plants grew to 10–15 functional leaves, plants with the same growth vigor for each material were selected for natural drought treatment. Three biological replications were tested; each replication contained three rootstocks. The relative soil moisture content of each treatment pot was measured daily by dry weighing. Sampling was carried out when the relative soil water content reached 65%–75% (mild drought stress), 45%–55% (moderate drought stress), and 25%–35% (severe drought stress), and each treatment was repeated three times.
Determination of relative soil moisture content
-
The soil was collected using the ring knife method. After the soil was irrigated, sampling began. The samples were taken daily. The soil sampling depth was 10 cm, and the drying method was the same as in a previous study[32]. The formula used is as follows:
Soil absolute water content (%) = (original soil quality – drying soil quality) / drying soil quality × 100%;
Soil relative water content (%) = soil absolute water content/maximum field water holding capacity × 100%.
Preparation of paraffin sections
-
The upper middle leaves of eight different apple rootstocks were selected at a field capacity of 25%–35% (severe drought stress) to make longitudinal paraffin sections[33], which were observed and photographed under a fully automatic upright fluorescence microscope, and the thickness of the leaves, upper epidermis, palisade tissue, and sponge tissue was measured by Photoshop 2020 software.
Determination of relative water content
-
During the periods of 65%–75% (mild drought stress), 45%–55% (moderate drought stress), and 25%–35% (severe drought stress) of field water capacity, select the 9th to 11th mature leaves from the top of each rootstock. The relative water content of leaves was measured by the weighing method[34]. A single plant was taken as a replicate, and three leaves were mixed as a replicate from each plant, so each treatment had three replicates. The formula used is as follows:
RWC (%) = (leaf fresh weight – leaf dry weight) ⁄ (leaf saturated fresh weight – leaf dry weight)] × 100%.
Determination of photosynthetic gas exchange parameters
-
During the periods of 65%–75% (mild drought stress), 45%–55% (moderate drought stress), and 25%–35% (severe drought stress) of field water capacity. Five different apple rootstocks from each stress with uniform growth were selected, and the Licor-6800 portable photosynthetic system (LI-6800; LI-COR, Lincoln, Nebr.) was used to measure Pn, Tr, Gs, and Ci. The measurements were taken between 08:30 to 11:30, using a red and blue light source with a light intensity of 1,500 μmol/(m2·s). The temperature was controlled at 28 °C, and the relative air humidity was about 55%. All measurements were taken on sunny days[35].
Determination of leaf pigments
-
During the periods of 65%–75% (mild drought stress), 45%–55% (moderate drought stress), and 25%–35% (severe drought stress) of field water capacity. After each photosynthesis measurement, bring back the leaves of each treatment in an ice box using a paper towel. Wipe the surface of the leaves, weigh 0.2 g of the sample, cut it into pieces, and put it into a 10 ml test tube. Add 80% acetone to the extract, seal it with plastic wrap, and place it in the dark for 24 h. Finally, use a spectrophotometer with wavelengths of 663 nm and 645 nm. 470 nm colorimetric, using a formula to calculate total chlorophyll content (chlorophyll a content and chlorophyll b content) and carotenoid content[36].
Determination of chlorophyll fluorescence parameters
-
The five different rootstocks with uniform growth were selected from each treatment during the periods of 65%–75% (mild drought stress), 45%–55% (moderate drought stress), and 25%–35% (severe drought stress) of field water capacity. The Licor-6800 portable photosynthetic system (LI-6800; LI-COR, Lincoln, Nebr.) was used to measure leaf chlorophyll fluorescence parameters. The 9th to 10th mature leaves were counted from the top of the trunk of each rootstock and were used as the test material. ФPSII and NPQ parameters can be read directly[37].
Determination of water use efficiency
-
The WUE was expressed by the amount of CO2 (μmol) assimilated by a certain amount of water (mol) consumed by leaves through transpiration, WUE = Pn/Tr[38].
Determination of non-structural carbohydrates and reducing sugar content
-
Leaf sampling was conducted during the periods of 65%–75% (mild drought stress), 45%–55% (moderate drought stress), and 25%–35% (severe drought stress). The harvested leaves were quickly put into an oven to dry at 70 °C to a constant weight, then pulverized and sieved for determination of soluble sugar and starch content. Soluble sugar and starch were determined by the modified phenol-sulfuric acid method, and the NSC is the cumulative sum of soluble sugar content and starch content in woody plants[39].
For the determination of reducing sugar content in leaves, samples were taken during periods of 65%–75% (mild drought stress), 45%–55% (moderate drought stress), and 25%–35% (severe drought stress) of field capacity, and Fehling's reagent method was used[39].
Determination of the relative electrical conductivity of root and root vigor
-
Harvesting the roots from 65%–75% (mild drought stress) of the field water capacity served as the control. Drain the moisture from the roots; each treatment was repeated three times. One gram of fresh roots at the end of the root system were harvested from each repetition and cut into small sections. The treated materials were put into test tubes, and 20 mL of distilled water was added, they were then immersed in a constant temperature water bath at 20 °C for 24 h, shaking at irregular intervals. The conductivity (C1) of the leaching solution was measured by a DDS-1A conductivity meter. Then each sample was immersed in a boiling water bath for 10 min, cooled to room temperature, and the conductivity (C2) of the leaching solution was measured after all cells were destroyed[40]. To represent the total content of electrolytes in rootstock root cells. The calculation formula was:
Relative conductivity (%) = C1/C2 × 100%.
For the determination of root vigor, samples were taken during periods of 65%–75% (mild drought stress), 45%–55% (moderate drought stress), and 25%–35% (severe drought stress) of field capacity, and the triphenyltetrazolium chloride reduction method (TTC method) was used[41]. The amount of TTC restored by the root system per unit mass per unit time was used to express the strength of the root system.
Calculation of membership functions
-
Calculate the average membership function value of each drought resistance-related index. The larger the membership function value, the stronger the drought resistance. Considering the difference between the initial level and the dynamic change process of each evaluation index during drought stress, the membership function value was calculated by the average of each index. If the indicator was a positive indicator of drought resistance, the membership function value of the indicator was Ux = (X – Xmin)/(Xmax – Xmin); if the indicator was a negative indicator of drought resistance, the membership function value of the indicator was Ux = 1 – (X – Xmin)/(Xmax – Xmin). In the formula, X refers to the average value of a certain index, Xmax refers to the maximum value of the corresponding index; and Xmin refers to the minimum value of the corresponding index. Among the measurement indicators, stomatal conductance, intercellular CO2 concentration, transpiration rate, and root relative conductivity were negative indicators, and the rest were positive indicators[42].
Data analysis and processing
-
SPSS software was used for statistical analysis, and Origin 2021 was used to make graphs. Significant differences among treatments were distinguished by different letters using Duncan's multiple mean comparison test at p < 0.05.
This work was financially supported by Shaanxi Apple Industry Science and Technology Project, Grant/Award Number: 2020zdzx03-0-04; Science and Technology Activity Fund for Returnees Studying Abroad of Shaanxi Province, Grant/Award Number: 2020-07; Cyrus Tang Foundation and the earmarked fund CARS, Grant/Award Number: CARS-27.
-
The authors declare that they have no conflict of interest.
-
# These authors contributed equally: Pengpeng Sun, Muhammad Mobeen Tahir
- Copyright: © 2022 by the author(s). Published by Maximum Academic Press, Fayetteville, GA. This article is an open access article distributed under Creative Commons Attribution License (CC BY 4.0), visit https://creativecommons.org/licenses/by/4.0/.
-
About this article
Cite this article
Sun P, Tahir MM, Lu X, Liu Z, Zhang X, et al. 2022. Comparison of leaf morphological, anatomical, and photosynthetic responses to drought stress among eight apple rootstocks. Fruit Research 2:20 doi: 10.48130/FruRes-2022-0020
Comparison of leaf morphological, anatomical, and photosynthetic responses to drought stress among eight apple rootstocks
- Received: 21 September 2022
- Accepted: 23 November 2022
- Published online: 28 December 2022
Abstract: The drought resistance of eight commonly used apple rootstocks under natural drought conditions was examined to provide clues for the selection, promotion, and utilization of drought-resistant apple rootstocks. The ultrastructural differences and physiological and biochemical characteristics of the leaves of eight apple rootstocks under drought stress were observed. The index changes were used to rank drought resistance by the membership function method comprehensively. The results showed that the leaf thickness, palisade tissue thickness, sponge tissue thickness, net photosynthetic rate, and chlorophyll content were significantly higher in 'Fupingqiuzi' than those of other rootstocks at various stress conditions. The leaf water content and water use efficiency of 'Qingzhen 1' were significantly higher than those of other rootstocks under different stress conditions. The root vigor of 'B.9' was significantly higher than that of other rootstocks. The results of membership function analysis showed that the drought resistance of different rootstocks was in the order: 'Fupingqiuzi' > 'Qingzhen 1' > 'B.9' > 'MM.111' > 'GM256' > 'MM.106' > 'M.26' > 'M.9-Nic29'. 'Fupingqiuzi' had the strongest drought resistance, and 'Qingzhen 1' and 'B.9' were also relatively drought-resistant. These rootstocks can be used as raw materials for drought-resistant apple rootstock breeding and are propagated and utilized in arid areas.
-
Key words:
- Apple rootstock /
- Drought resistance /
- Membership function


