-
Fertilizer application is an indispensable management measure for high crop yields. Proper fertilizer application provides plants with the nutrients needed for growth and development and suppresses weeds and pests, thereby promoting high yields and increased quality of crop seeds[1−3]. The impact of fertilization on grassland productivity is mainly focused on the impact on forage yield, and the impact on seed yield and quality is rarely reported. Nitrogen (N), phosphorus (P), and potassium (K) are essential elements for healthy crop growth, and extremely high or low application amounts are detrimental to crop seed production. Fertilizer application can improve seed yield, and a combination of N, P, and K fertilizers is more effective than application of a single element[4−6]. Appropriate fertilization can promote forage grass growth and improve seed yield and quality[7]. The interactive effects of fertilizers significantly impact seed yield[8]. However, the optimal rates and ratio of N, P, and K fertilizers for high-yield production of seeds may vary with plant species and plant growth stage when fertilizers are applied.
The Three River Source region is the primary origin of China's water system and plays a crucial role in maintaining ecological balance. The grasslands in the Three Rivers source region have been degraded on a large scale because of exploitation since the 1990s. Years of experimental research have shown that planting artificial grasslands is one of the most effective methods to restore and re-establish degraded grassland vegetation in the Three Rivers source region[9]. Poa pratensis L. cv. Qinghai is a new species of wild cultivated forage grass. However, outdated seed production techniques have limited its widespread application; thus, optimization of seed production methods are urgent for the widespread applicability of Poa pratensis.
Perennial grasses, such as Poa pratensis, form vegetative tillers in the first year of plants and form fertile reproductive tillers in the following year. The reproductive tiller formation plays a key role in the seed yield[10]. The application of N, P, and K fertilizers can promote the formation of tillers in plants[11,12]. Therefore, applying base fertilizer during the planting process may directly affect the formation of Poa pratensis tillers, which subsequently affects the number of fertile reproductive branches formed in the following year, thereby regulating seed yield. In this study, we aimed to identify the optimal fertilizer application ratio to improve seed yield and seed quality of Poa pratensis L. cv. Qinghai. The '3414' fertilizer scheme as base fertilizer application was used to analyze and evaluate the effects of different fertilizer ratios on seed yield and seed quality of Poa pratensis L. cv. Qinghai in this experiment. The results provide a theoretical basis for seed production and cultivation management techniques of Poa pratensis L. cv. Qinghai on the Qinghai-Tibet Plateau.
-
The seed yield of all fertilization treatments was significantly higher than that of the N0P0K0 treatment (P < 0.05). The N2P2K2 treatment resulted in the highest seed yield, reaching 1017.69 kg·hm−2, which was 25.64%, 4.75%, 8.90%, and 47.00% higher than that in the N0P2K2 (no N application), N2P0K2 (no P application), N2P2K0 (no K application), and N0P0K0 (no fertilizer application) treatments, respectively (Fig. 1).
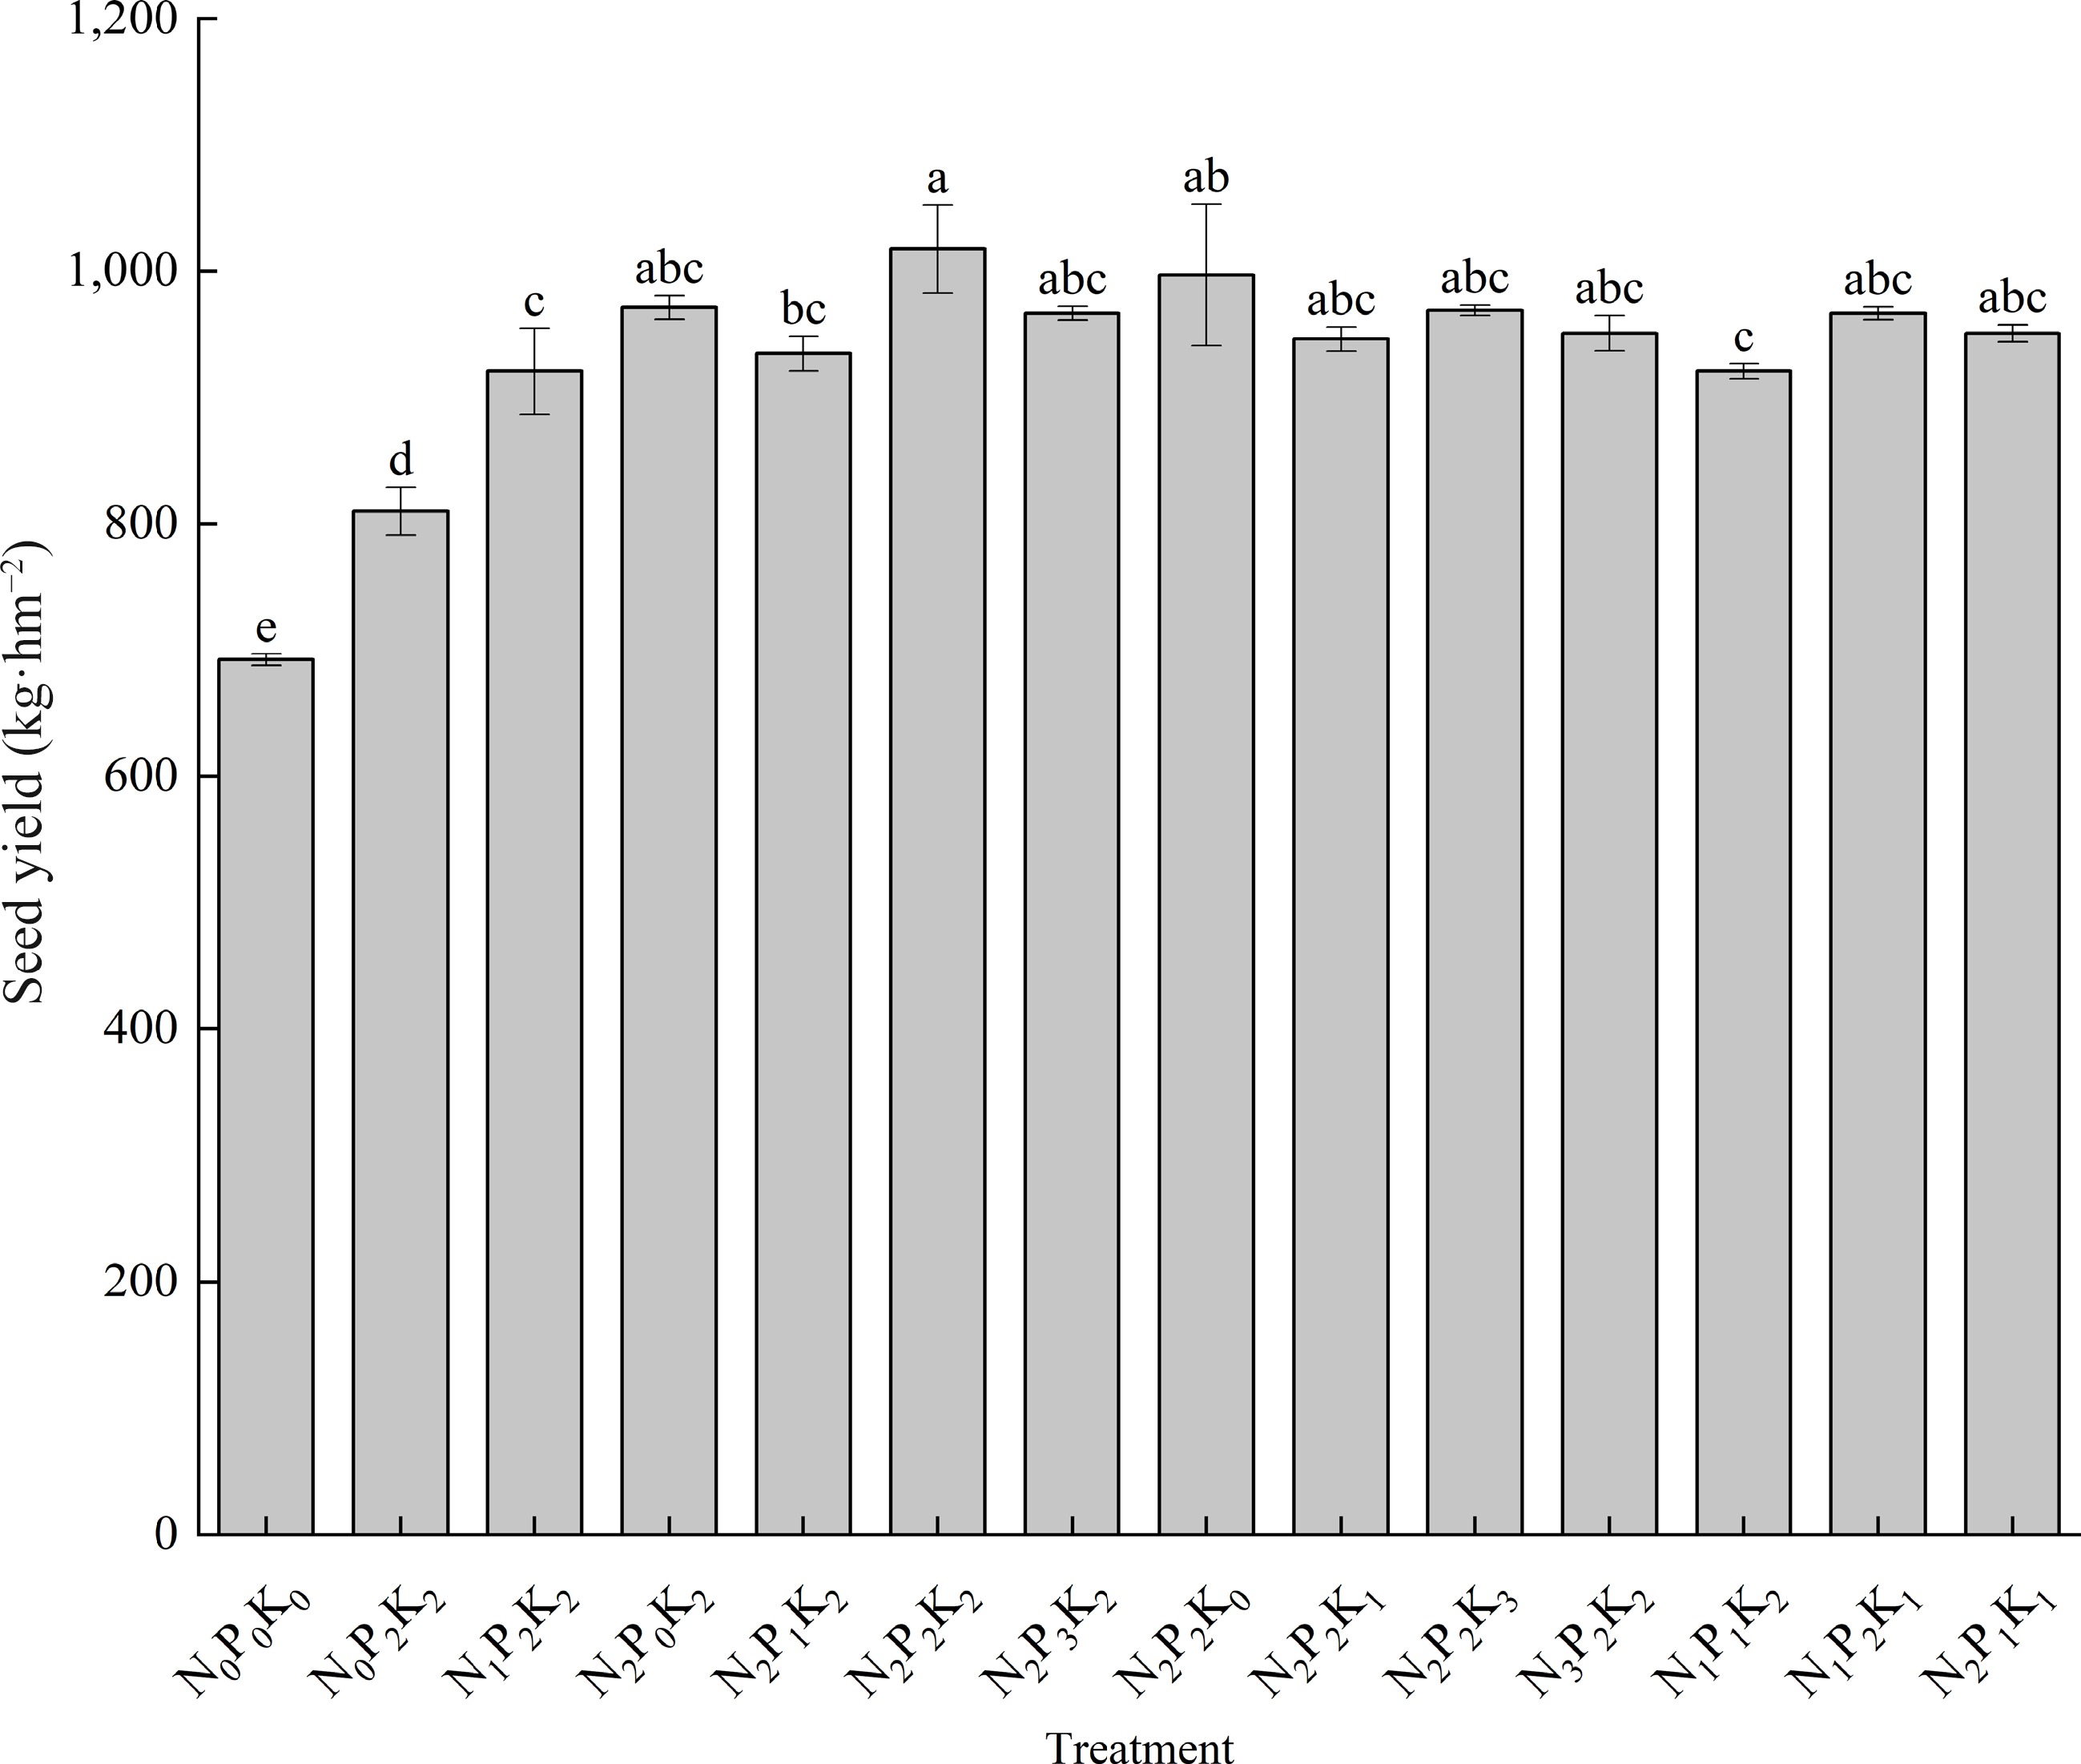
Figure 1.
Effects of fertilization Poa pratensis L. cv. Qinghai seed Yield. Different lowercase letters represent significant differences at the 0.05 level.
Differential effects of fertilizer compositions on Poa pratensis seed yield components
-
From Table 1, no distinct variation patterns were observed for panicle length, seeds number per panicle, floret site utilization, and thousand-seed-weight under different treatments. However, the N1P1K2 treatment demonstrated the longest panicle length, exceeding the control treatment (N0P0K0) by 2.28 cm. No significant differences were observed in the seeds number per panicle among treatments (P > 0.05). The highest floret site utilization was observed in the N2P0K2 and N2P2K0 treatments, reaching 0.91, which was 0.2 higher than that in the control treatment (N0P0K0). The N2P1K1 treatment exhibited the highest thousand-seed-weight, at 0.32 g, representing an increase of 52.38% compared with that of the control treatment (N0P0K0). The N2P2K2 treatment showed the highest number of seeds number per panicle and reproductive branches per square meter, with 134 seeds number per panicle, representing an increase of 47.25% than that of the control treatment (N0P0K0), and 3528.68 reproductive branches per square meter, representing an increase of 48.47% compared with that in the control treatment (N0P0K0).
Table 1. Effects of fertilization on seed yield components of Poa pratensis L. cv. Qinghai.
Treatment Panicle length /cm Spikelets number Seeds number
/per panicleFloret site utilization Thousand-seed-weight /g Reproductive branch
number per square meterN0P0K0 11.55 ± 0.6abc 16.67 ± 1.76a 91.33 ± 1.33d 0.89 ± 0.03a 0.21 ± 0.01e 2376.73 ± 18.01d N0P2K2 13.64 ± 0.81ab 20.67 ± 2.19a 106.67 ± 0.33c 0.78 ± 0.03c 0.29 ± 0.01abc 2794.13 ± 57.27c N1P2K2 12.27 ± 0.13abc 16.00 ± 0.58a 121.33 ± 6.84b 0.85 ± 0.11b 0.23 ± 0.01de 3189.67 ± 122.00b N2P0K2 11.58 ± 1.58abc 17.67 ± 1.20a 128.00 ± 1.53ab 0.91 ± 0.01a 0.28 ± 0.01bc 3353.89 ± 35.22ab N2P1K2 11.78 ± 0.26abc 20.67 ± 4.81a 131.33 ± 5.04ab 0.90 ± 0.03a 0.26 ± 0.02cd 3444.86 ± 198.35ab N2P2K2 13.29 ± 0.61ab 18.67 ± 0.88a 134.00 ± 4.73a 0.90 ± 0.05a 0.23 ± 0.01e 3528.68 ± 125.73a N2P3K2 11.05 ± 1.17abc 18.67 ± 2.40a 127.33 ± 1.86ab 0.85 ± 0.03b 0.31 ± 0.01ab 3327.71 ± 34.95ab N2P2K0 11.2 ± 0.97abc 19.67 ± 3.71a 123.00 ± 2.52ab 0.91 ± 0.03a 0.22 ± 0.02e 3201.11 ± 53.94b N2P2K1 11.58 ± 0.16abc 18.67 ± 2.19a 124.33 ± 3.38ab 0.86 ± 0.09ab 0.27 ± 0.01cd 3249.9 ± 25.04b N2P2K3 13.01 ± 1.12ab 18.00 ± 1.15a 127.67 ± 3.18ab 0.88 ± 0.03ab 0.23 ± 0.02de 3345.80 ± 28.44ab N3P2K2 12.73 ± 1.24abc 18.00 ± 2.08a 125.33 ± 0.88ab 0.87 ± 0.03ab 0.31 ± 0.01ab 3271.64 ± 57.50ab N1P1K2 13.83 ± 0.74a 18.33 ± 2.40a 121.67 ± 3.28b 0.78 ± 0.03c 0.26 ± 0.01cd 3181.97 ± 24.36b N1P2K1 10.82 ± 0.36bc 15.33 ± 1.76a 127.00 ± 2.08ab 0.80 ± 0.09bc 0.21 ± 0.01e 3339.12 ± 33.80ab N2P1K1 9.95 ± 0.92c 16.00 ± 1.00a 125.00 ± 2.89ab 0.88 ± 0.03ab 0.32 ± 0.01a 3278.06 ± 36.58ab The relationship between actual seed yield and different components was analyzed using stepwise regression. The results showed that the seed yield was only positively correlated with the reproductive branches per square meter (R2 = 0.996, P = 0.000), with a path coefficient of 0.998. The regression equation was Yield = 18.533 + 0.284 × Reproductive branch number per square meter (R2 = 0.996, P = 0.000). This equation indicates that, when other factors are kept constant, each unit increase in reproductive branches per square meter leads to an increase of 18.817 kg·hm−2 in seed yield, suggesting that N, P, and K fertilization primarily impacted the reproductive branch number per square meter of Poa pratensis L. cv. Qinghai, thereby achieving the goal of increased seed yield.
Differential effects of fertilizer compositions on Poa pratensis seed quality
-
Figure 2 shows that the germination rate, germination potential, germination indices, and vigor index of Poa pratensis L. cv. Qinghai treated with N2P2K2 were significantly higher than those treated with N0P0K0 (P < 0.05), with increases of 59.57%, 73.91%, 54.17%, and 223.00% respectively. Additionally, analysis of seed quality under the single factor fertilization treatments (Fig. 3) revealed that the germination rate, germination potential, germination indices, and vigor index of seeds treated with N2, P2, and K2 at the P2K2, N2K2, and N2P2 levels were significantly higher than those treated with N0, P0, and K0 (P < 0.05), respectively. Furthermore, these indicators were also significantly higher than those at the other two levels (P < 0.05).
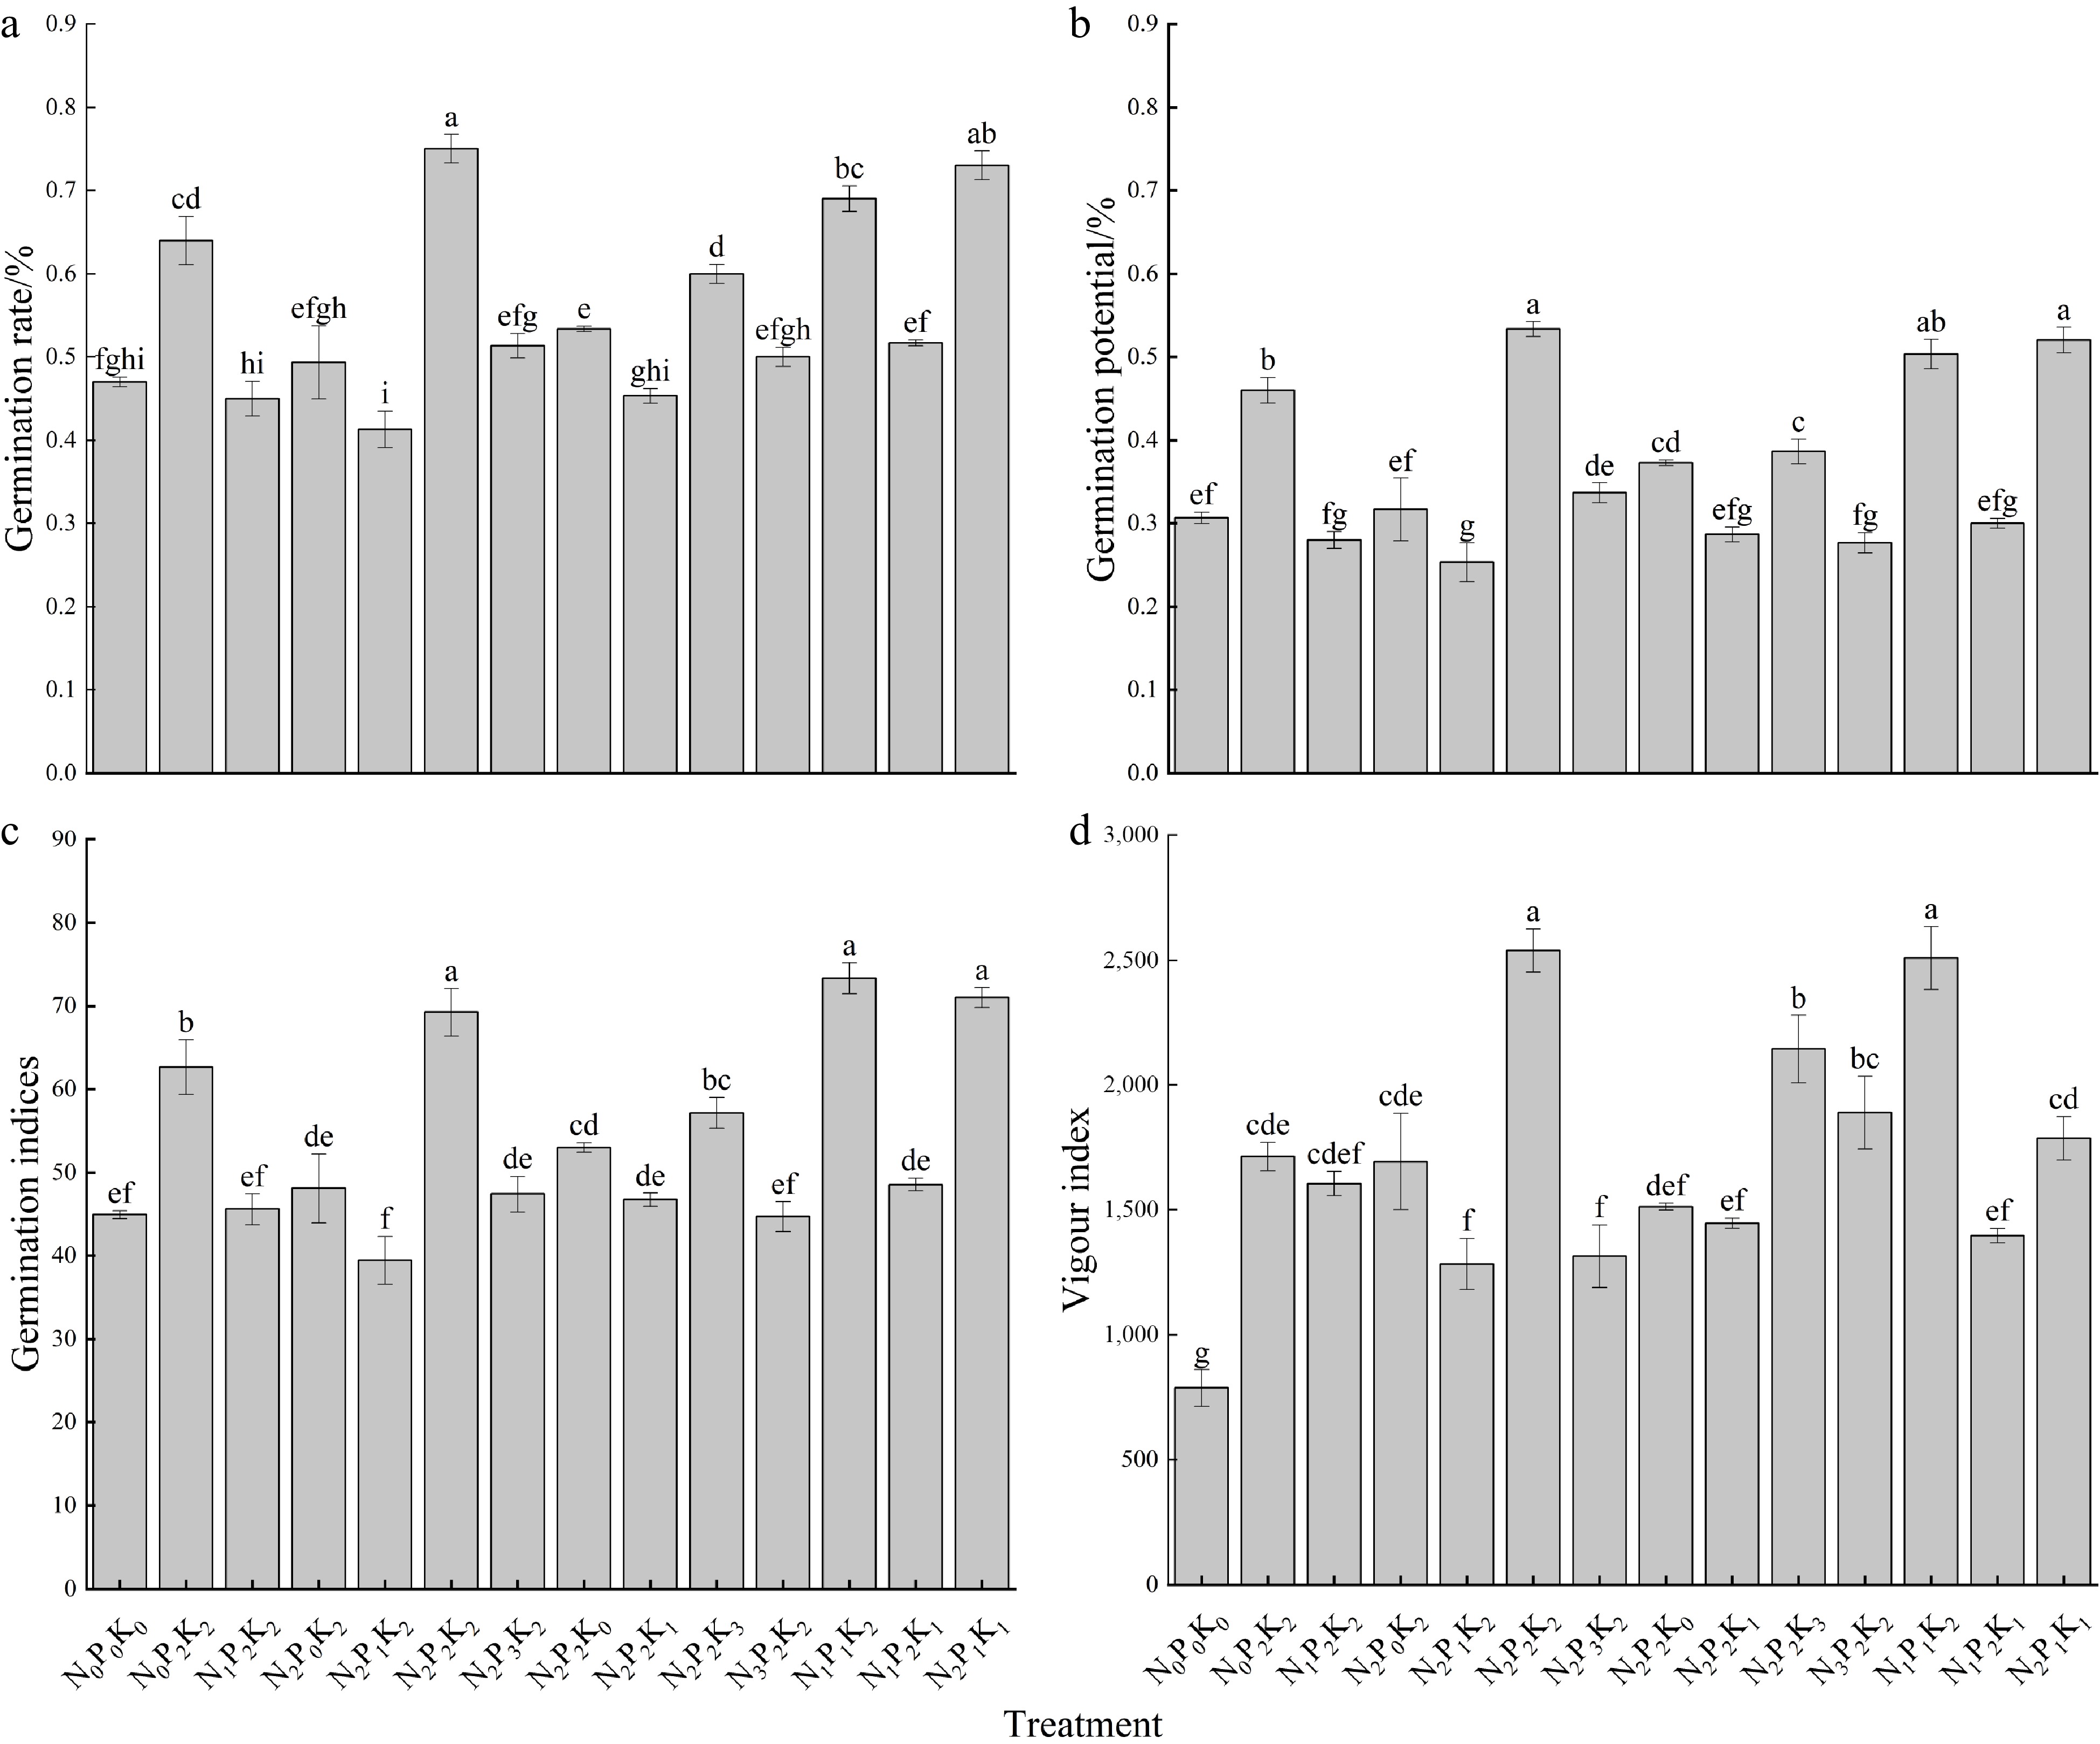
Figure 2.
Effects of different fertilization treatments on Poa pratensis L. cv. Qinghai seed quality.
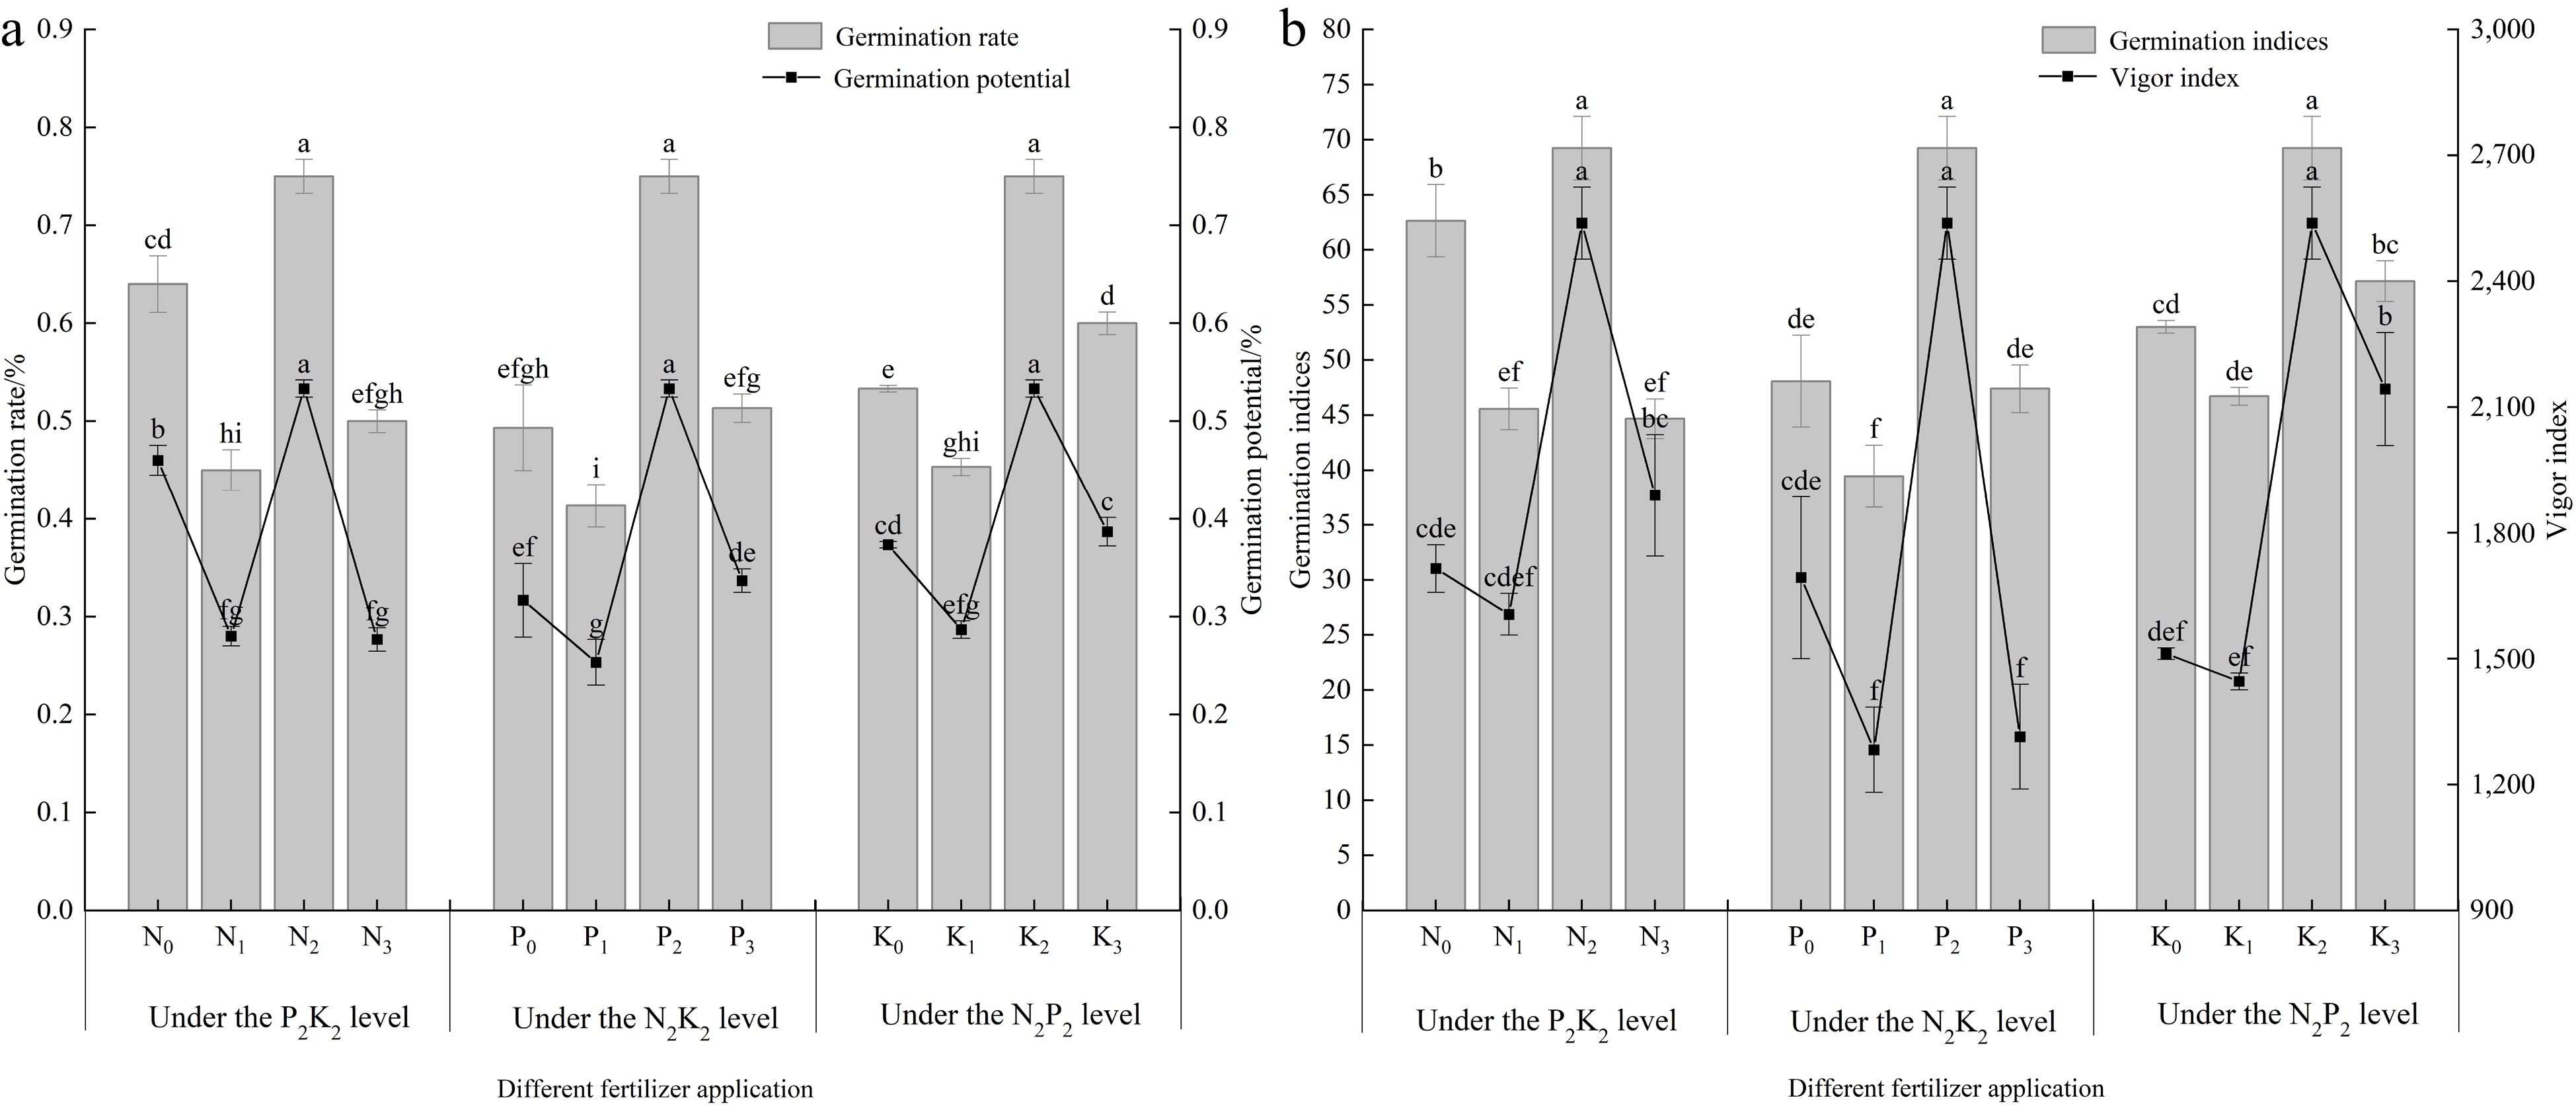
Figure 3.
Effects of different fertilization levels on seed quality of Poa pratensis L. cv. Qinghai.
Finally, the Bartlett sphericity test (Table 2) confirmed that a factor analysis could be conducted on the four indicators of seed quality. Principal component analysis was performed to assess the four indicators of each treatment comprehensively, and then the treatments were ranked to determine the best seed quality treatment. The results indicated that the seed quality of Poa pratensis L. cv. Qinghai was optimal under the N2P2K2 treatment.
Table 2. Factor analysis test of seed quality.
KMO test and Bartlett test KMO value 0.746 Bartlett sphericity test Approximate χ2 82.566 df 6 P 0.000*** Relationship between fertilizer compositions and Poa pratensis seed yield
-
This study conducted a dimensionless analysis of the fertilizer effects of rice variety '3414' in a field experiment using R language. The average unit price of local market fertilizers was 4.85-yuan·kg−1 for N, 4.68-yuan·kg−1 for P2O5, and 7.21-yuan·kg−1 for K2O. The average market purchase price of the Poa pratensis L. cv. Qinghai seeds is 45-yuan·kg−1.
After the fitting of 14 fertilizer treatments and seed yield, the regression equations for the interaction effects of N, P, and K fertilizers and the seed yield of Poa pratensis L. cv. Qinghai was obtained as follows:
Yield = 692.961 + 2.131 × N + 2.623 × P + 0.988 × K − 0.010 × N2 − 0.004 × P2 − 0.016 × K2 − 0.007 × N × P + 0.022 × N × K − 0.018 × P × K
The regression equation has a correlation coefficient of R2 = 0.98, P = 0.006 < 0.05, and F = 19.14, indicating a significant level for the F-test. The regression equation also conforms to the law of diminishing returns, where the coefficient of the first-order term is positive, and the coefficient of the second-order term is negative[13]. This law indicates a successful fitting of a typical three-variable quadratic fertilizer response function. To solve for the maximum and optimal yield based on the principle of zero marginal yields and zero marginal profit, the partial derivatives of the obtained quadratic equation are equated to zero, resulting in two sets of three-variable linear equations.
2.131 − 0.007 × P + 0.022 × K − 0.010 × (2 × N) = 0
2.623 − 0.007 × N − 0.018 × K − 0.004 × (2 × P) = 0
0.988 + 0.022 × N − 0.018 × P − 0.016 × (2 × K) = 0
The theoretical maximum yield of Poa pratensis L. cv. Qinghai can be obtained by solving the linear equations for the given values of N = 119 kg·hm−2, P = 115 kg·hm−2, and K = 48 kg·hm−2. This maximum yield was calculated as 994.75 kg·hm−2.
Using the price variable, the optimal fertilization scheme was obtained as follows:
2.131 − 0.007 × P + 0.022 × K − 0.010 × (2 × N) = 4.85/45
2.623 − 0.007 × N − 0.018 × K − 0.004 × (2 × P) = 68/45
0.988 + 0.022 × N − 0.018 × P − 0.016 × (2 × K) = 21/45
When the values of N = 117 kg·hm−2, P = 104 kg·hm−2, and K = 47 kg·hm−2 were used, the theoretical optimal yield of Poa pratensis L. cv. Qinghai was obtained and calculated as 993.84 kg·hm−2.
The effects of N and P fertilizer, N and K fertilizer, and P and K fertilizer on the Poa pratensis L. cv. Qinghai seed yield was again fitted separately. The interaction effects of N and P fertilizer were analyzed by treatments 2, 3, 4, 5, 6, 7, 11, and 12 with K fertilizer as the second level. Thus, the regression model of seed yield with the interaction effects of N and P fertilizer was obtained as follows:
Yield = 704.644 + 3.328 × N + 1.447 × P − 0.010 × N2 − 0.004 × P2 − 0.006 × N × P
The regression equation had a significant correlation coefficient R2 = 0.89, with P = 0.048 < 0.05 and F = 19.14, indicating a significant regression relationship between the amount of N and P fertilizer applied and the seed yield of Poa pratensis L. cv. Qinghai.
Examining Fig. 4a, we observed an upward convex parabolic surface as the three-dimensional surface plot of the interaction effect equation between the N and P fertilizer when the N fertilizer application was 130 kg·hm−2. The highest point of this surface was located within the range of N fertilizer application between 0 and 260 kg·hm−2 and the P fertilizer application between 0 and 200 kg·hm−2, as shown in Fig. 4b. This distribution allows for determination of the maximum yield, optimal yield, and corresponding fertilizer application amounts. Finally, two pairs of simultaneous linear equations were derived by taking partial derivatives of the obtained quadratic equation concerning N and P fertilizer and equating them to 0.
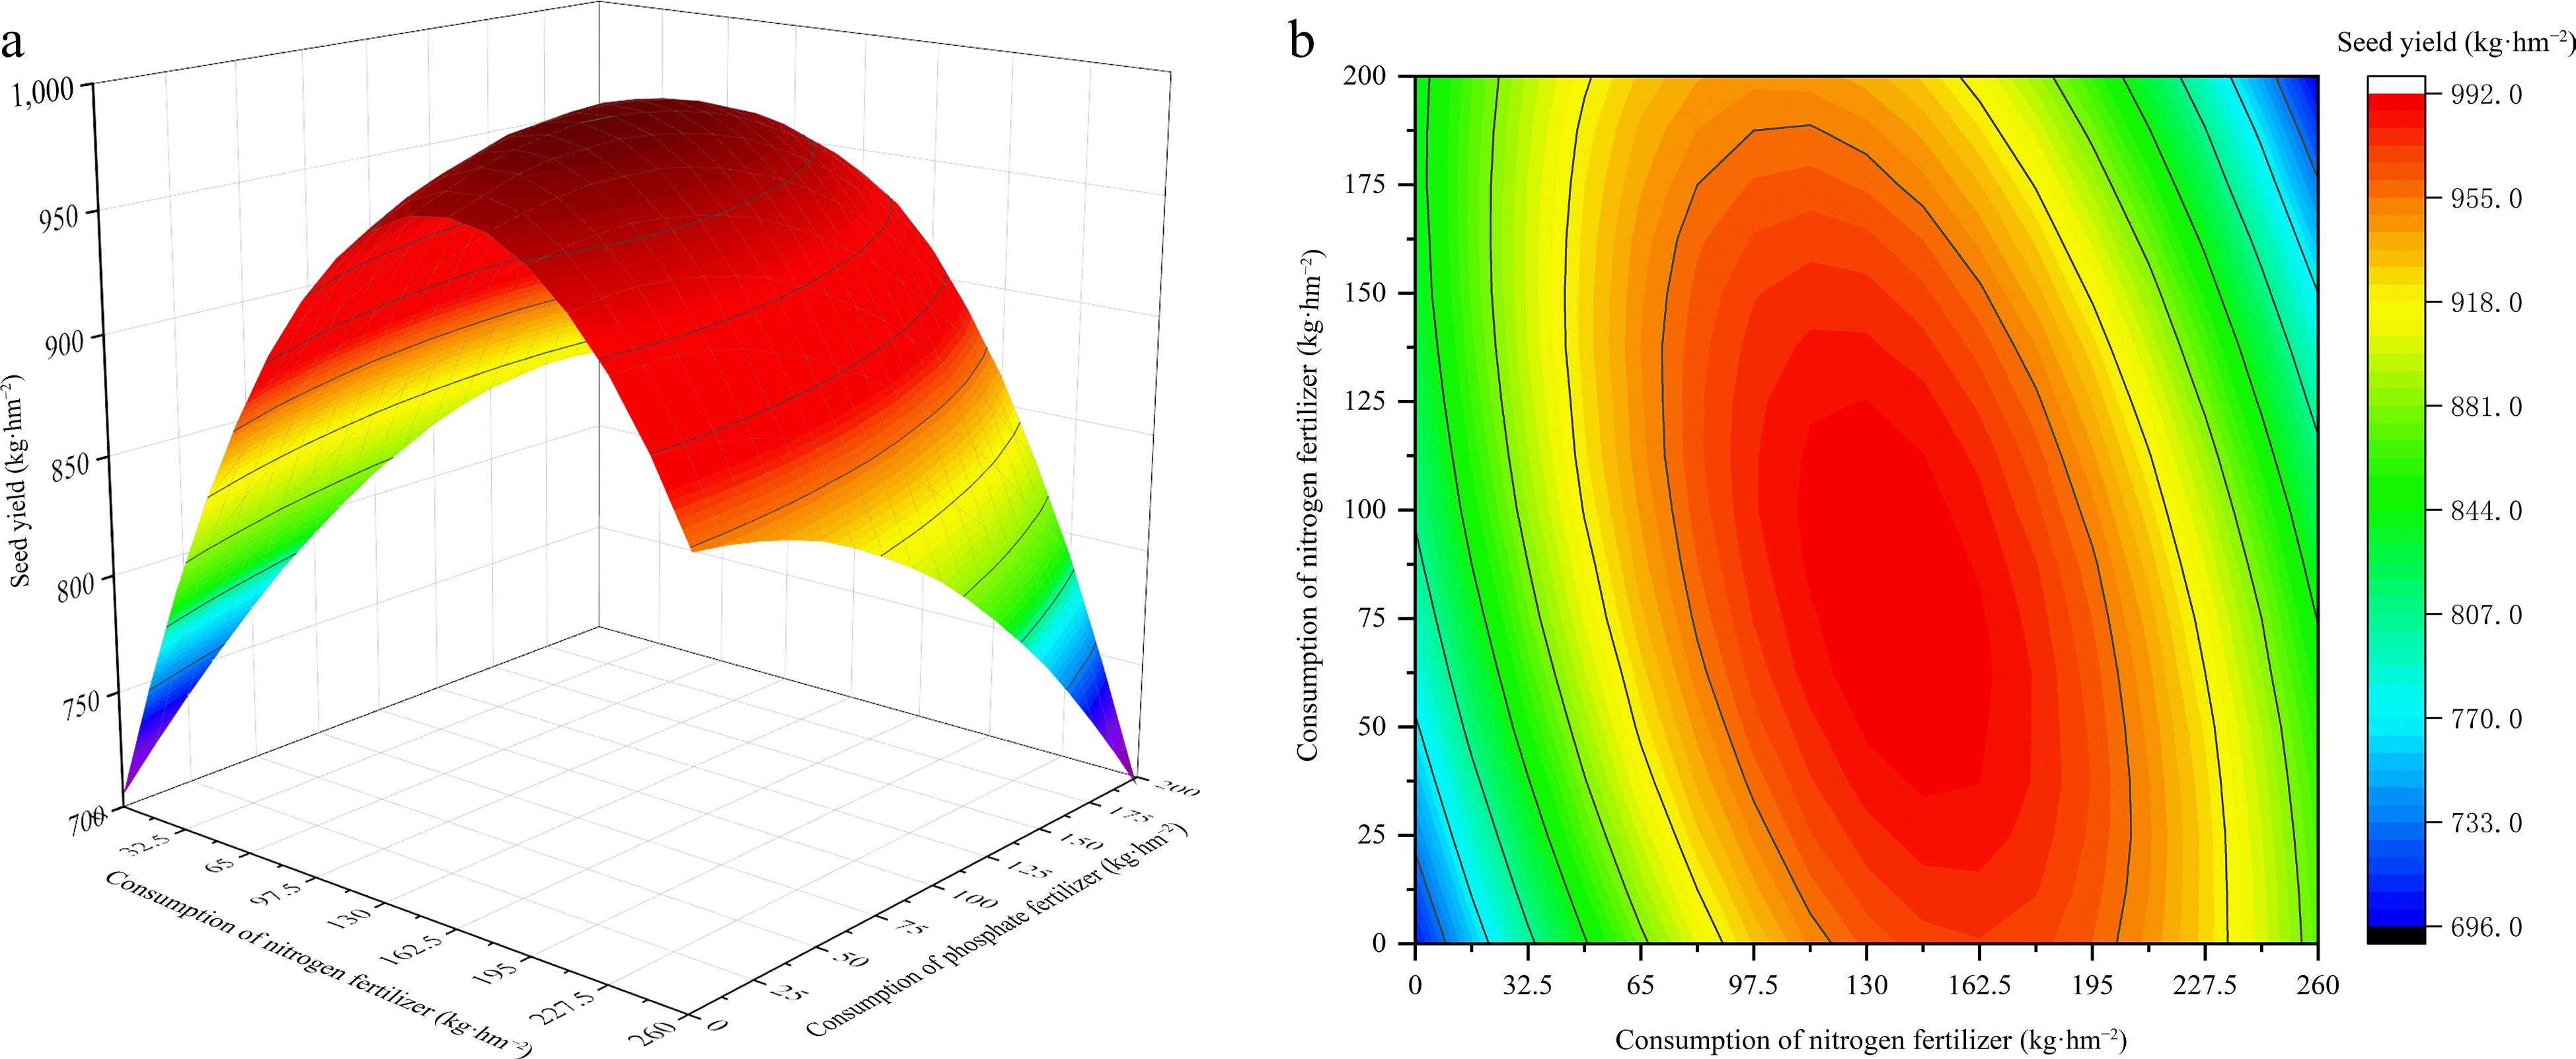
Figure 4.
(a) Three-dimensional curved surface diagram of the change in Poa pratensis L. cv. Qinghai seed yield under the interaction of N and P fertilizers. (b) Isogram of Poa pratensis L. cv. Qinghai seed yield under the interaction of N and P fertilizers.
3.328 − 0.006 × P − 0.010 × (2 × N) = 0
1.447 − 0.006 × N − 0.004 × (2 × P) = 0
The theoretical maximum yield of Poa pratensis L. cv. Qinghai can be obtained by solving the linear equations for the given values of N = 145 kg·hm−2, P = 72 kg·hm−2. This maximum yield was calculated as 997.762 kg·hm−2.
Using the price variable, the optimal fertilization scheme was obtained:
3.328 − 0.006 × P − 0.010 × (2 × N) = 4.85/45
1.447 − 0.006 × N − 0.004 × (2 × P) = 4.68/45
When the values of N = 133 kg·hm−2, P = 94 kg·hm−2 were used, the theoretical optimal yield of Poa pratensis L. cv. Qinghai could be obtained and was calculated as 996.040 kg·hm−2.
The obtained fertilizer application scheme based on the interactive effects of N and P showed similarities with the N2P2K2 treatment, with the actual seed yield from the N2P2K2 treatment being greater than that of the proposed scheme. Therefore, we concluded that the N2P2K2 treatment was the optimal fertilizer application scheme for seed production.
The linear regression models between seed yield and fertilizer application amount for N and P fertilizer applied together and separately, as well as that for P and K fertilizer applied together and separately, were fitted using treatments 2, 3, 6, 8, 9, 10, 11, 13, and treatments 4, 5, 6, 7, 8, 9, 10, 14, respectively. However, none of the model equations were significant (P > 0.05). Additionally, using treatments 2, 3, 6, 11, and treatments 4, 5, 6, 7, as well as treatments 6, 8, 9, and 10, the linear regression models between seed yield and the amount of N, P, and K fertilizer applied individually were fitted. Consequently, none of the linear fits for seed yield and the application of N, P, and K fertilizer individually were significant (P > 0.05).
-
In this study, we found that the seed yield was highest under the N2P2K2 treatment, and the interaction between N and P fertilizers significantly affected seed yield when the amount of K fertilizer remained constant. However, changes in K fertilizer did not significantly affect seed yield, and no significant difference in seed yield was observed between the N2P2K0 and N2P2K2 treatments. This finding differed from results of other crops, possibly due to differences in crop types and planting areas. As the amount of fertilization increased, the seed yield of Poa pratensis showed an initial increase followed by a decline, indicating a linear relationship between fertilization and seed yield, which was similar to the results of Medicago sativa L.[14] and consistent with the law of diminishing marginal returns.
N application had a significant effect on the floret site utilization, number of seeds per panic, and thousand-seed-weight of Leymus chinensis (Trin. ex Bunge) Tzvelev[7] and could also increase the number of reproductive branches per unit area of Agropyron cristatum L. Gaertn. In contrast, P application could also increase the number of reproductive branches per unit area in addition to the aforementioned characteristics[15]. Researchers determined that the number of reproductive branches per unit area was a critical factor in determining seed production for Bromus inermis Leyss[16]. The pathway analysis results of this study showed that applying fertilizers containing N, P, and K as basal fertilizers significantly increased the number of reproductive branches of Poa pratensis L. cv. Qinghai in the second year, thereby affecting seed yield. This finding indicates that supplementing the necessary nutrients required for growth during the early growth stages of Poa pratensis L. cv. Qinghai through basal fertilization measures can increase its yield.
Fertilizer application is a crucial factor affecting seed quality[17−18], and seed quality is determined by various comprehensive indicators, such as germination rate, germination velocity, germination index, and vigor index. Seed quality determines the number of seeds used for further production. In this study, when N, P, and K fertilizers were applied at the intermediate level, seed quality indicators were the highest, and as the concentration of individual fertilizers increased, they showed an initial decreasing trend, followed by an increase, and finally a slight decrease. This trend is different from that present in other crops, requiring further mechanistic research. Furthermore, second level K fertilizer application can significantly improve the quality of forage grass seeds[14,19]. Our study found that although changes in K fertilizer did not significantly affect seed yield, reasonable concentrations of fertilizer can play a certain role in improving seed quality. This quality can be attributed to the fact that after plants absorb K fertilizer, K can act as an activator of enzymes and increase the metabolic activity of various enzymes in the plant body[20]. Furthermore, K can induce biosynthesis and activity regulation of indoleacetic acid in plants, thereby improving seed quality.
-
K fertilizer had no significant effect on the Poa pratensis seed yield, but the application of 50 kg·hm−2 K fertilizer as base fertilizer improved seed quality. N, P, and K as base fertilizers effectively promoted the increase in reproductive branches of Poa pratensis in the second year, thus achieving a higher seed yield. The optimal fertilization formula for seed production of Poa pratensis was intermediate levels of fertilizers with N (130 kg·hm−2), P (100 kg·hm−2), and K (50 kg·hm−2) as the base fertilizer. These proportions are optimal owing to the increased seeds number per panicle and reproductive tillers. The mechanisms for stimulating reproductive tillers and seed production with the intermediate level of N-P-K base fertilizers could be related to regulating hormone metabolism; however, this hypothesis deserves further investigation.
-
The experiment was conducted from 2021 to 2022 in a test field located at Guinan County, Hainan Tibetan Autonomous Prefecture, Qinghai Province, in the village of Luojia, Guinan Grass Development Co., Ltd. of Sanjiang Group, China. The test field is located at 101.21°E, 35.76°N, and the elevation is 3,317 m The experimental site was located in a high-altitude continental climate, with an average annual temperature of 2.3 °C and an average annual precipitation of 391 mm, with majority of the rainfall occurring between July and August. The annual evaporation rate in the area is over 1,300 mm, with a relative humidity of 51%. Figure 5 shows the changes in local monthly temperature, humidity, solar radiation, and precipitation from the start of sowing in July 2021 to the end of the experiment in August 2022. It can be seen that the local temperature in July and August, and September is around 10−20 °C, which is the highest throughout the year (Fig. 5a). The air humidity is also the highest throughout the year (Fig. 5b). The difference in solar radiation throughout the year is not significant (Fig. 5c). The precipitation in July, August, and September is the highest throughout the year (Fig. 5d). Therefore, it is suitable to sow in July, with the best water and temperature conditions in August of the following year, and there are more days with high solar radiation in July. Data are based on historical reanalysis datasets from the European Centre for Medium-Range Weather Forecasts (ECMWF)/National Aeronautics and Space Administration NASA)[21].
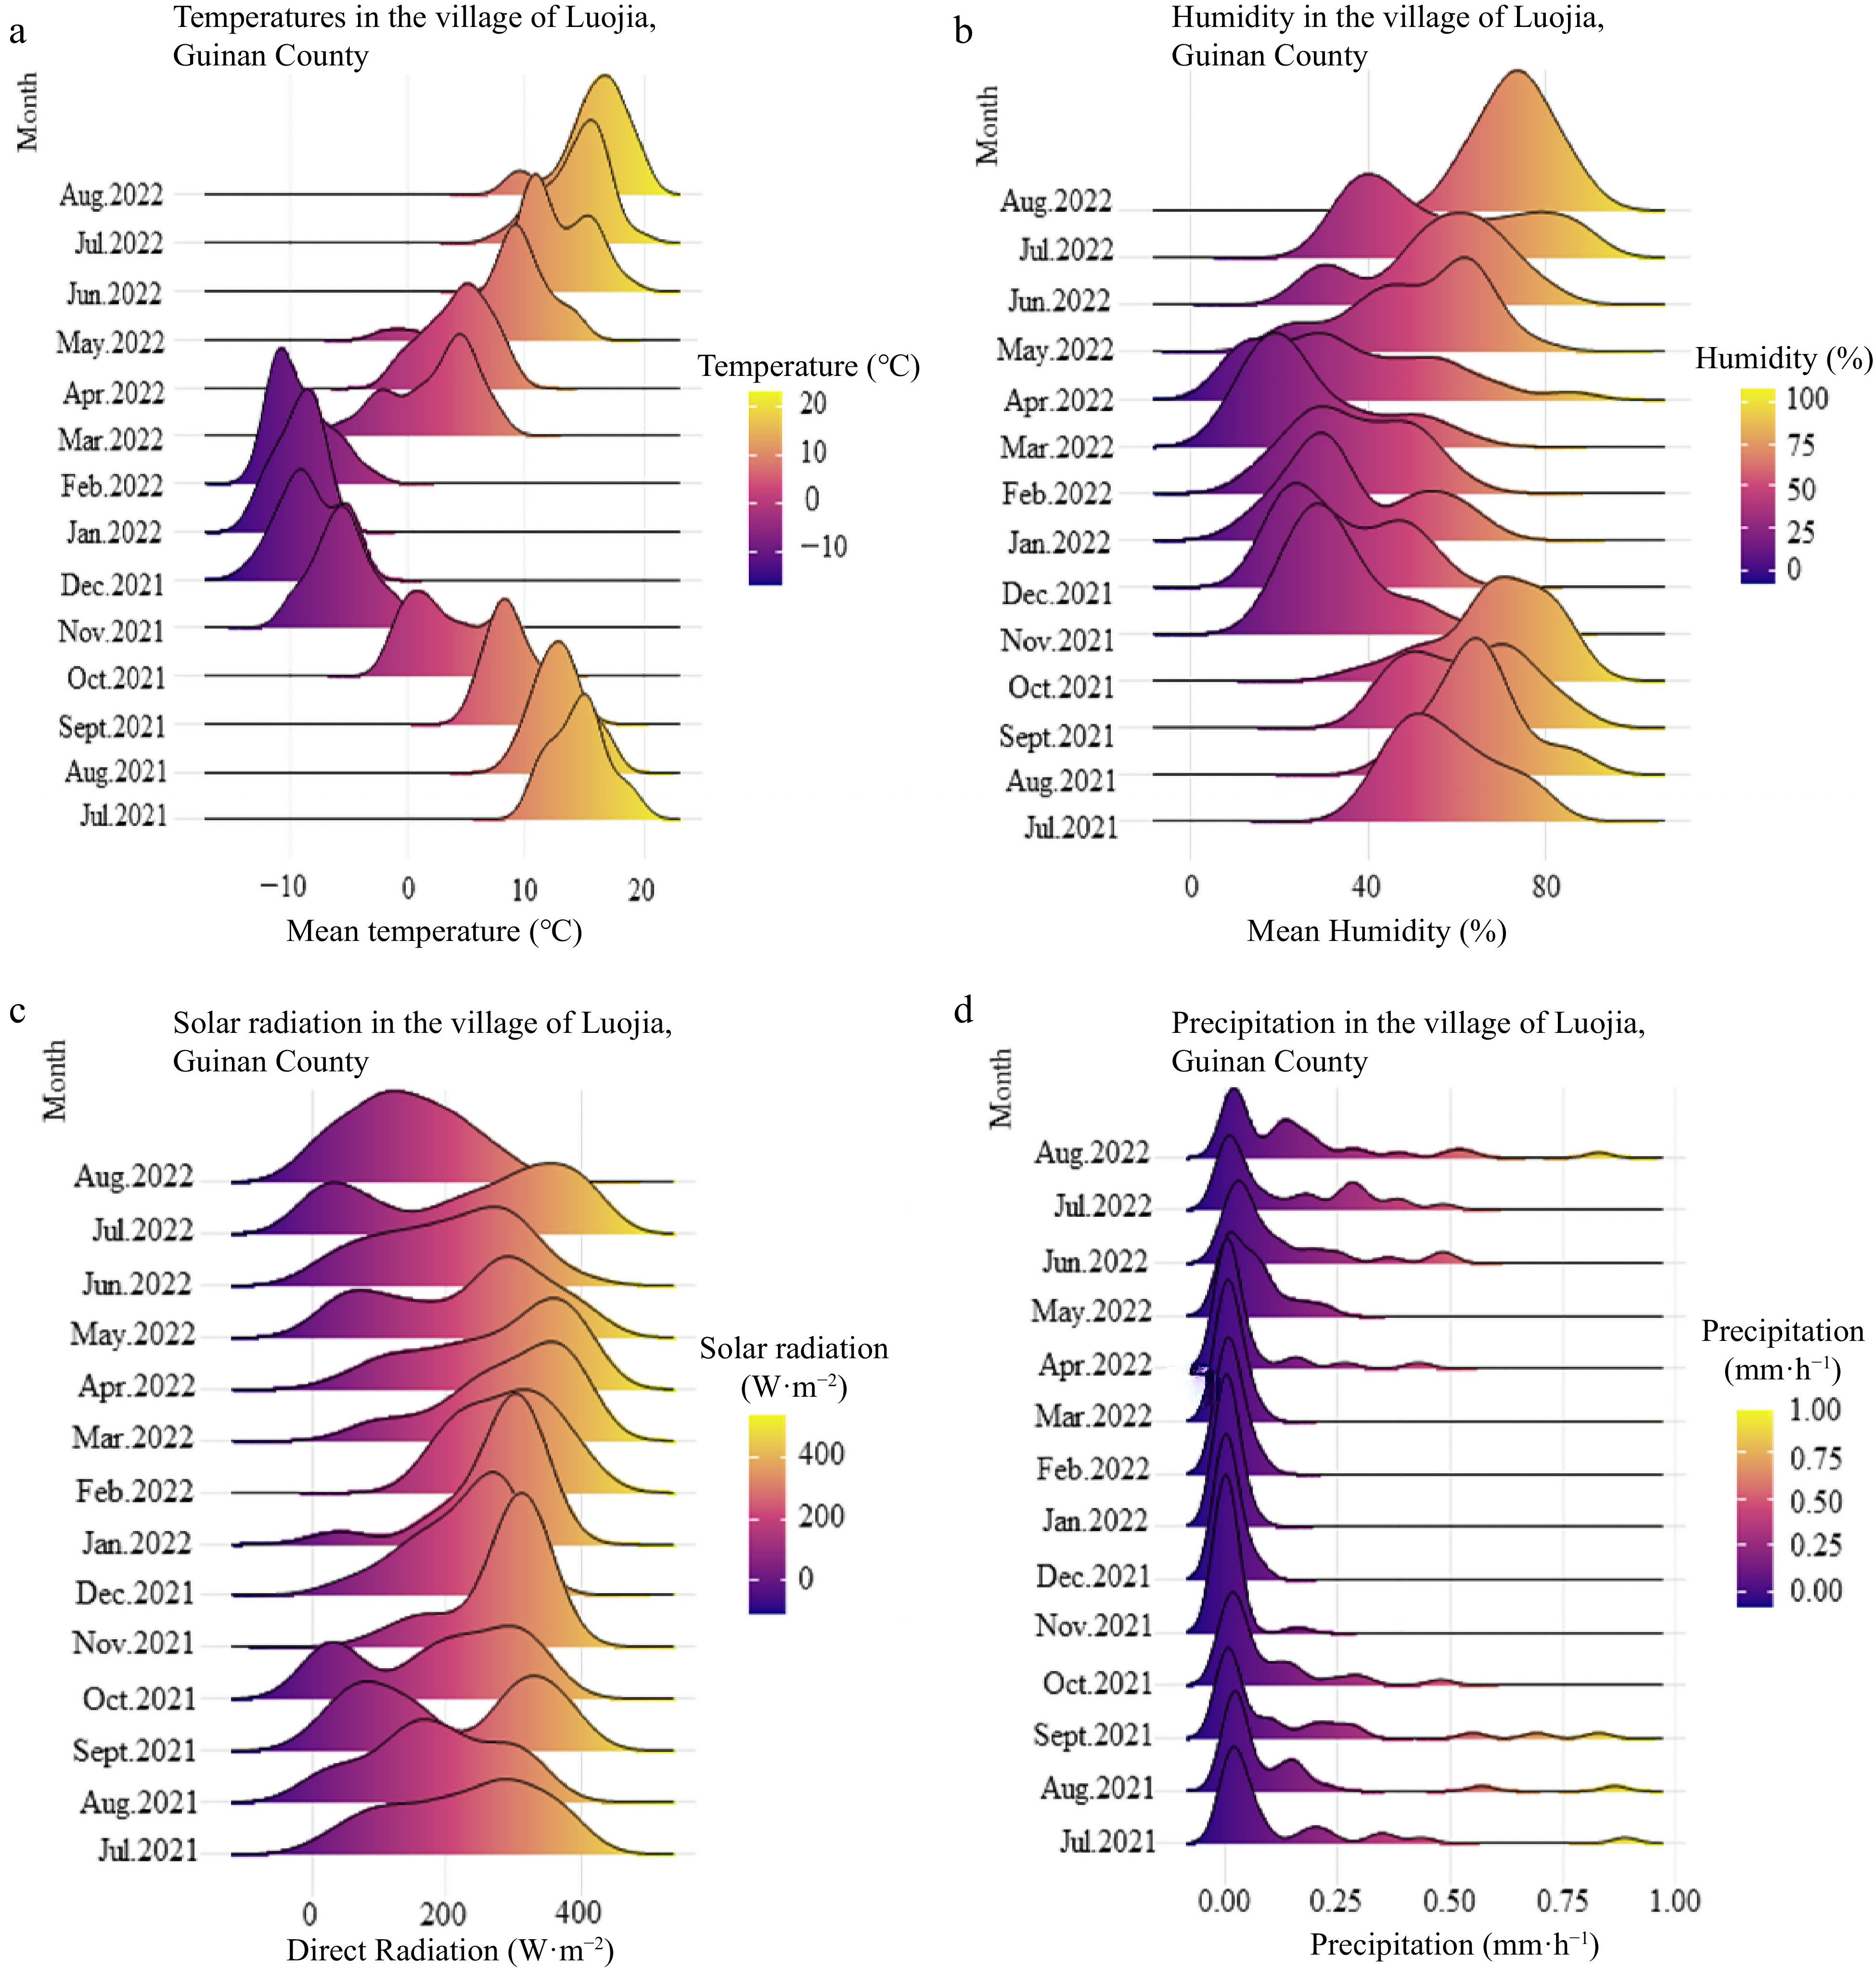
Figure 5.
Intermonthly changes in (a) temperature, (b) humidity, (c) solar radiation, and (d) precipitation in the Maying area from July 2021 to August 2022.
The soil type of the experimental site comprised chestnut calcareous soil, and the previous crop was barley, with one year of fallow prior to the experiment. Before Poa pratensis L. cv Qinghai was sowed, the basic soil nutrient levels in the 0–30 cm layer were as follows: soil pH value was 8.5, organic matter content was 4.8%, total N content was 0.17%, total P content was 0.062%, total K content was 1.83%, available N content was 129.47 mg·kg−1, available P content was 6.9 mg·kg−1, and available K content is 201 mg·kg−1.
Poa pratensis L. cv Qinghai seeds were provided by Qinghai Animal Husbandry and Veterinary Science Academy. The seeds were subjected to impurity screening and then sowed in July 2021. The '3414' fertilizer scheme was adopted, and a completely randomized block design was used, with three N, P, and K factors, each with four levels (0, 1, 2, 3). The '0' level refers to no fertilizer applied, whereas the '2' level refers to the average optimal fertilization amount for other crops in the local area. The '1' level is equivalent to 0.5 times the 2 level, whereas the '3' level is equivalent to 1.5 times the 2 level (this level refers to excess fertilization). A total of 14 treatments were applied, as shown in Table 3. The source of nitrogen fertilizer is urea (N 46%), the source of phosphorus fertilizer is superphosphate (P2O5 12%), and the source of potassium fertilizer is potassium sulfate (K2O 50%). Before sowing, it is evenly mixed and sprinkled into the corresponding plot according to different treatments, with a plot area of 12 square meters (3 m × 4 m). After plowing, use it as a base fertilizer and repeat each treatment three times. The sowing amount is 7.5 kg·hm−2, and the sowing depth is 1 cm. As the first year of Poa pratensis L. cv Qinghai is for nutritional growth, data collection is conducted from the second year of planting (late August 2022, when the seeds mature).
Table 3. N, P, K ratio treatment and fertilizer application amount.
Numbering Treatment N/kg·hm−2 P2O5/kg·hm−2 K2O/kg·hm−2 1 N0P0K0 0 0 0 2 N0P2K2 0 100 60 3 N1P2K2 65 100 60 4 N2P0K2 130 0 60 5 N2P1K2 130 50 60 6 N2P2K2 130 100 60 7 N2P3K2 130 150 60 8 N2P2K0 130 100 0 9 N2P2K1 130 100 30 10 N2P2K3 130 100 90 11 N3P2K2 195 100 60 12 N1P1K2 65 50 60 13 N1P2K1 65 100 30 14 N2P1K1 130 50 30 Note: The number of subscripts in the second column is the code of each factor. Primary indicators and measurement methods
Reproductive branch number per square meter
-
During the ripening period, three 1 m2 sample areas were randomly selected in each plot to obtain and quantify the number of reproductive branches, and the number of reproductive branches per unit area was calculated.
Seed yield
-
At seed maturity (80% of seeds mature), three 1 m2 sample areas were randomly selected in each plot, and all the panicles were harvested. The seeds were manually separated and cleaned using a winnower and a sieve and weighed after air-drying for 5 d to obtain the seed yield, which was then converted to yield per hectare in kg·m−2.
Botanical characters
-
Ten panicles with consistent growth were selected from each plot for botanical measurements, including panic length, spikelet number per panicle, and seed number per panicle. The floret site utilization was calculated as the ratio of the number of full seeds to the number of spikelets on each panicle.
Thousand-seed-weight
-
After harvesting, 1,000 randomly selected seeds were weighed for each treatment, and this process was repeated five times to obtain the average value.
Seed quality
-
After harvesting, 100 random seeds were selected for each treatment and subjected to a 14-d germination test repeated three times in a culture box under the following conditions: a 14-h light period with a light intensity of 2,000 lx, temperature of 25 ± 2 °C, and relative humidity of 70%, followed by a 10-h dark period with a temperature of 20 ± 2 °C and relative humidity of 80%. The following indicators were measured:
Germinability = (number of normal germinated seeds within 7 d/total number of seeds tested) × 100%
Germination percentage = (number of normal germinated seeds within 14 d/total number of seeds tested) × 100%.
Germination index =
$ \sum \dfrac{Gt}{Dt} $ Vitality index = germination index × sprout length.
Statistical analysis
-
All data were recorded using Excel 2019 and subjected to normality tests (Kolmogorov–Simirnov test) and homogeneity of variance tests (Levene test) before statistical analysis. One-Way ANOVA was used in SPSS 19.0 software (IBM SPSS Inc., Chicago, USA) to conduct a single factor variance analysis for each indicator, the level of significant difference was P < 0.05. Duncan tests were used to compare the levels of each indicator, and factor analysis was used for the seed quality indicators. Equations for N, P, and K fertilizer application and seed yield were fitted using R language. Graphs were produced using Origin 2022 (OriginLab Corp Inc., USA), and all data are presented as mean ± standard error.
-
The authors confirm contribution to the paper as follows: study conception and design: Hua XZ, Liu Y, Ma YS; data collection: Wang YL, Hou WH, Zhang BC, Li J; analysis and interpretation of results: Hua XZ, Liu Y; draft manuscript preparation: Hua XZ. All authors reviewed the results and approved the final version of the manuscript.
-
The datasets generated during and/or analyzed during the current study are not publicly available due the fact that the results of this study are the basic data for subsequent studies but are available from the corresponding author on reasonable request.
The authors sincerely acknowledge the support of the scientific research project of ‘Qinghai Scholars’ in Qinghai Province (A demonstration study on domestication and application of native ecological grass species in alpine region) and the National Key R&D Project of Ministry of Science and Technology (2021YFC3201603) funds and the contributions of Guinan Grass Industry Development Co., Ltd. in Qinghai Province.
-
The authors declare that they have no conflict of interest.
- Copyright: © 2023 by the author(s). Published by Maximum Academic Press, Fayetteville, GA. This article is an open access article distributed under Creative Commons Attribution License (CC BY 4.0), visit https://creativecommons.org/licenses/by/4.0/.
-
About this article
Cite this article
Hua XZ, Liu Y, Ma YS, Wang YL, Hou WH, et al. 2023. Optimization of nutrient ratio and quantity in base fertilizer for seed production in Poa pratensis. Grass Research 3:27 doi: 10.48130/GR-2023-0027
Optimization of nutrient ratio and quantity in base fertilizer for seed production in Poa pratensis
- Received: 17 July 2023
- Accepted: 06 December 2023
- Published online: 22 December 2023
Abstract: Poa pratensis L. cv. Qinghai is a major grass species utilized for the restoration of the 'black beach' in the Three River Source region. However, its seed production has been relatively underdeveloped. To enhance the seed yield, this experiment aimed to determine the optimal application ratio and amount of base fertilizer to achieve high-yield production of seeds in Poa pratensis. Using the '3414' fertilization scheme, the plants (cv. Qinghai) were fertilized with a base fertilizer varying in ratios and quantities of nitrogen, phosphorus, and potassium. Regression analysis was employed to identify the most appropriate base fertilizer application scheme, in order to increase the seed yield of its. K fertilizer had no significant effect on the seed yield of Poa pratensis, but applying K fertilizer (50 kg·hm−2) as base fertilizer improved the seed quality. Seed yield reached the highest level due to the increased number of seeds per panicle and reproductive tillers by applying fertilizer comprising 130 kg·ha−1 N, 100 kg·ha−1 P, and 50 kg·ha−1 K. This study demonstrated that the highest number of seeds per panicle and reproductive tillers per square meter were key field components enhanced by the optimal formulation of base fertilizer for seed production of Poa pratensis.
-
Key words:
- Poa pratensis L. cv. Qinghai /
- Seed yield /
- '3414' fertilization scheme


