


-
Greenhouse cultivation is a widespread method of cultivating high-quality plants to improve survival and adaptability. However, with the impacts of global climate change, abiotic stresses, such as higher temperature or stronger light intensity due to higher solar radiation, are becoming a great threat to plants especially in tropical, subtropical and temperate regions, consequently retarding plant growth or causing plant death under greenhouse cultivation[1−4]. To date, shade practice has been a common and effective method that alleviates or prevents the damage on plant cultivation under greenhouse conditions[2, 5−7]. Aied et al.[2] reported that eggplant grown under greenhouse conditions with 30%–70% shading, performed better than that grown in the open field.
Light is an important factor that affects plant growth[7, 8]. Shade practice reduces light intensity under greenhouse cultivation, and excessive or slight shading causes unfavorable light intensity and further affects plant growth, hence, it is necessary to determine the optimal shading levels for plant growth. In practice, shading levels in greenhouse cultivation depend on plant species and genotypes. Slight shade (25%–50% of full sunlight) was suitable for Azolla growth[9]. Two dwarf Lisianthus species showed the best growth under 20% shade condition in a study performed by Rezai et al.[10].
Plants respond to shading conditions through morphological changes and physiological behaviors. With regard to morphology, suitable shading conditions benefited the morphological development of Anthurium andreanum[7] and increased the plant height, internode length, leaf number, and leaf area[11]. Meanwhile, a well-developed root system is formed to increase nutrient absorption capacity[12,13]. In contrast, many plants under light-limiting or excessive light conditions showed undesirable morphological traits and reduced plant quality[11]. Regarding physiological behaviors, the biosynthesis and degradation of chlorophyll is actively regulated by light[14,15], and suitable shading levels upregulate chlorophyll content[8, 11]. In addition, relative water content (RWC) and soluble sugar content are also related to shading levels[11,16]. Moreover, the massive production of reactive oxygen species (ROS) owing to abiotic stress leads to accelerated activity of antioxidant enzymes, such as superoxide dismutase (SOD), catalase (CAT), and peroxidase (POD) in plant cells to minimize the negative impacts[11]. In all, various physiological activities of plants are in order when plants are cultivated under greenhouse cultivation with suitable shading conditions.
Cyclocarya paliurus (Batal) Iljinskaja (C. paliurus), belonging to the family Juglandaceae, is a native, medicinal and ornamental tree distributed in the highlands of southern China[17]. In recent years, the demand for its leaf production has increased with the exploration and exploitation of its medical value because the leaf contains many bioactive compounds, such as triterpenoids, polysaccharides, and phenolic compounds etc., which benefit human health[18−20]. The harvesting of its leaf was mainly from natural forests of Cyclocarya species, resulting in serious damage to the natural forests. Moreover, the shape of Cyclocarya species can be used as ornamental trees in urban parks due to its graceful shape and copper-like fruits. Thus, it is necessary to develop artificial cultivation of Cyclocarya species.
Seedlings are the only way to artificially cultivate Cyclocarya species, and seedling cultivation has an important effect on the quality of artificial cultivation. Previous reports on seedling cultivation of C. paliurus only focused on improving leaf bioactive content using light and fertilization treatments under laboratory conditions[21−24]. For example, Deng et al.[21] reported that leaf production per seedling increased under intermediate shade and fertilization treatments, and Yang et al.[23] investigated the effect of differential light quality and intensity on the growth and water-soluble polysaccharides of C. paliurus. However, in the actual process of forestry breeding, seedling is often cultivated in the open field. Considering the difference in experimental controllability under laboratory conditions, changeable environmental factors in the open field directly or indirectly lead to the uneven growth and low quality of seedling. This reduced the survival and adaptability of seedlings after transplantation. Therefore, it is necessary and urgent to cultivate high-quality seedlings of Cyclocarya species.
Plastic greenhouse cultivation has been used to cultivate seedling growth of Cyclocarya species[25]. Feng et al.[25] reported that 50%–60% soil water capacity in plastic greenhouses significantly improved seedling quality. However, during the process of seedling cultivation, seedling growth was inhibited or seedlings died which was found to be caused by higher temperatures, especially in summer. To avoid or alleviate this problem, we hypothesized that shade could improve the seedling quality of C. paliurus under plastic greenhouse conditions. Therefore, the objective of this study was to determine the optimal shading level for C. paliurus seedlings from June to September and obtain high-quality seedlings based on their growth performances and physiological behaviors under different shading levels.
-
Seeds were collected from the natural forest of Jinggangshan (Jiangxi province, China, named JX), and the collected seeds were treated using the method of Fang et al.[17]. After stratification treatment for five months, the germinated seedlings were first transplanted into cultivation bags (10.8 cm in diameter and 14.5 cm in height) filled with a medium (a mixture of nutritional soil: perlite (10:1, g/g)) and then cultured in an incubation room at 15 ± 2 °C (day) and 10 ± 2 °C (night), with natural light environment (about 15 ± 1 h photoperiod). Each bag contained one plant.
Seedlings with even growth (height, marked H1) were selected and exposed to different shading levels in a plastic greenhouse under natural condition. Shade nets were set at 1.8 m height from the ground with different layers of shade net: no layer of shade net (marked SH0, as control, 60%–70% of full sunlight), one layer of shade net (marked SH1, 30%–40% of full sunlight) and two layers of shade net (marked SH2, 10%–20% of full sunlight); and plastic sheeting were not fitted around the plastic greenhouse. Soil water capacity was maintained at 50%–60%, and the lost water was supplemented at approximately 6:00 AM every day, and the position of the seedling was adjusted every 5 d. The experiment was established in a randomized complete block design, and each shading treatment contained three replicates and 15 seedlings per replicate.
After 100 d of shading treatment (from June to September), the surviving seedlings were observed and investigated for growth analysis. Three seedlings were randomly selected and separated into leaves, shoots, and roots to determine and analyze their water content (WC) and mineral content, and the fourth compound leaf from the top to bottom with the same orientation were obtained from other seedlings and then immediately frozen in liquid nitrogen to determine and analyze their total soluble sugar (TSS) content, antioxidant enzyme activity, chlorophyll content and malondialdehyde (MDA) content.
Assessment of growth performances
-
Seedling height (the final height, marked H2), ground diameter (DH), and leaf area (LA) of the seedlings under each shading treatment were measured. After washing, three parts of seedling were weighed (marked FW), and then heated at 105 °C for 15 min and dried to a constant weight (marked DW) at 85 °C. Finally, the growth and biomass of seedlings were assessed and the growth index was calculated according to the method described by Feng et al.[25].
Measurement of physiological characteristics
Determination of water content
-
Based on the measurement of FW and DW, WC was calculated with the formula 1[26]:
$ \mathrm{W}\mathrm{C}\;\left({\text{%}}\right)\;=\frac{\mathrm{F}\mathrm{W}-\mathrm{D}\mathrm{W}}{\mathrm{F}\mathrm{W}}\times 100$ (1) Extraction and determination of mineral content
-
According to the method described by Feng et al.[25], dried samples were digested and extraction was obtained using the electric-heating digestion method by the Block Digestion System (AIM600, Clontarf Qld 4019 Australia), then the mineral content was measured using Inductively Coupled Plasma - Optical Emission Spectrometer (ICP-OES, optima 7000DV, PerkinElmer Co., USA), and finally the mineral content (potassium (K), calcium (Ca), magnesium (Mg), sodium (Na)) and translocation factor (TF) were calculated according to Eqns 2 & 3:
$ \mathrm{C}\;\left(\mathrm{m}\mathrm{g}/\mathrm{g}\right)\;=\frac{\mathrm{C}\mathrm{m}\times \mathrm{V}}{\mathrm{D}\mathrm{W}} $ (2) $ \mathrm{T}\mathrm{F}=\frac{\mathrm{C}_{\mathrm{s}\mathrm{h}\mathrm{o}\mathrm{o}\mathrm{t}}+\mathrm{C}_{\mathrm{l}\mathrm{e}\mathrm{a}\mathrm{f}}}{\mathrm{C}_{\mathrm{r}\mathrm{o}\mathrm{o}\mathrm{t}}}$ (3) Cm is the mineral content measured by ICP-OES, mg/L; V is the total volume of extraction, L; DW is the dried weight of the sample, g; Cshoot, Cleaf, and Croot are the mineral content in the shoots, leaves and roots, respectively.
Extraction and determination of total soluble sugar content
-
Total soluble sugar (TSS) was extracted and measured according to the method described by Li[27]. First, fresh leaves were ground and added to 10 mL distilled water, and then heated at 100 °C for 30 min, finally filtered to a volume of 25 mL. Next, 0.5 mL extraction was added to a mixture of 1.5 mL of distilled water, 0.5 mL of Anthrone and ethyl acetate mixture (Anthrone:ethyl acetate = 1:50 g/mL) and 5 mL of H2SO4, and then kept at 100 °C for 1 min. Finally, the absorbance was measured at 630 nm using a UV-visible spectrophotometer (TU-1900, Beijing Purkinje General Instrument Co., Ltd, China). TSS content was calculated using Eqn 4:
$ \mathrm{C}\;\left({\text{%}}\right)\;=\frac{\mathrm{C}\mathrm{s}\times \mathrm{V}}{\mathrm{W}\times 0.5\times 1000000}\times 100 $ (4) Cs was obtained from the standard curve in which sugar was used as the standard curve, mg/L; V is the total volume of extraction, mL; W indicates the fresh weight of the sample, g.
Extraction and determination of chlorophyll content
-
Chlorophyll content was determined using the method explained by Li[27]. Briefly, fresh leaves were ground and added to 10 mL 80% acetone, and then filtered to a volume of 25 mL. Then, the absorbance was measured using a UV-visible spectrophotometer (TU-1900, Beijing Purkinje General Instrument Co., Ltd, China) at 470 nm (A470), 663 nm (A663) and 645 nm (A645). Finally, chlorophyll content and carotenoid content were calculated using Eqns 5, 6, 7 & 8 respectively.
$ \mathrm{C}\mathrm{a}=13.95\mathrm{A}_{665}-6.88\mathrm{A}_{649} $ (5) $ \mathrm{C}\mathrm{b}=24.96\mathrm{A}_{649}-7.32\mathrm{A}_{665} $ (6) $ \mathrm{C}\mathrm{x}.\mathrm{c}=\frac{1000\mathrm{A}_{470}-2.05\mathrm{C}\mathrm{a}-114.8\mathrm{C}\mathrm{b}}{245} $ (7) $ \mathrm{C}\mathrm{h}\mathrm{l}\mathrm{o}\mathrm{r}\mathrm{o}\mathrm{p}\mathrm{h}\mathrm{y}\mathrm{l}\mathrm{l}\;\mathrm{c}\mathrm{o}\mathrm{n}\mathrm{t}\mathrm{e}\mathrm{n}\mathrm{t} (mg/g)=\frac{\left(\mathrm{C}\mathrm{a}+\mathrm{C}\mathrm{b}\right)\times \mathrm{V}}{\mathrm{W}} $ (8) V is the total volume of extraction, mL; W indicates the fresh weight of the sample, g.
Extraction and determination of MDA content
-
MDA content was extracted from fresh leaves using an improved thiobarbituric acid-malondialdehyde (TBA-MDA) assay method[27], and then measured at 450 nm, 532 nm and 600 nm by a UV-visible spectrophotometer (TU-1900, Beijing Purkinje General Instrument Co., Ltd, China), respectively. Finally, MDA content was calculated using Eqns 9 & 10, respectively:
$ \mathrm{C}\;\left(\frac{\mathrm{u}\mathrm{m}\mathrm{o}\mathrm{L}}{\mathrm{L}}\right)\;=6.45\left(\mathrm{A}_{532}-\mathrm{A}_{600}\right)-0.56\mathrm{A}_{450}$ (9) $ \mathrm{M}\mathrm{D}\mathrm{A}\;\mathrm{c}\mathrm{o}\mathrm{n}\mathrm{t}\mathrm{e}\mathrm{n}\mathrm{t}\;(\mathrm{u}\mathrm{m}\mathrm{o}\mathrm{L}/\mathrm{g})\;=\frac{\mathrm{C}\times \mathrm{V}}{\mathrm{W}} $ (10) V is the total volume of extraction, L; W indicates the weight of the fresh sample, g.
Extraction and determination of antioxidant enzyme activity
-
Fresh leaves were ground and added to 15 mL 0.05 mol/L phosphate buffer (PBS, pH 7.8), then kept at 4 °C for 15 min, finally centrifuged at 4 °C, 11,000 ×g for 10 min (TGL-16M, Hunan Xiangyi Laboratory Instrument Development Co., Ltd, China). Enzyme extraction (labeled E) was obtained and antioxidant enzyme activity was immediately determined.
SOD activity was determined using the method explained by Li[27] with slight modifications. Reaction mixture including 0.1 mL enzyme extraction (labeled E1), 3.0 mL 0.05 mol/L PBS (pH 7.8), 0.6 mL 130 mol/L methionine, 0.6 mL 0.1 mmol/L ethylene diamine tetraacetic acid disodium, 0.4 mL distilled water, 0.6 mL 0.02 mmol/L riboflavin and 0.6 mL 0.75 mmol/L nitro-blue tetrazolium was reacted at 4,000 lx for 20 min, but the control was kept in the dark. After that, the absorbance was measured at 560 nm by a UV-visible spectrophotometer (TU-1900, Beijing Purkinje General Instrument Co., Ltd, China).
POD activity was measured according to the method described by Li[27] with slight modification. Reaction mixture containing 2.9 mL 0.05 mol/L PBS (pH 7.8), 1 mL 2% H2O2 (v/v), 1 mL 50 mmol/L guaiacol and 0.1 mL enzyme extraction (labeled E2) was heated at 34 °C for 3 min. Then, the absorbance was immediately measured at 470 nm, 6 times with an interval of 1 min by a UV-visible spectrophotometer (TU-1900, Beijing Purkinje General Instrument Co., Ltd, China).
Polyphenol oxidase (PPO) activity was determined using the method described by Li[27] with slight modification. Reaction mixture containing 3.5 mL 0.05 mol/L PBS (pH 7.8), 1 mL 0.1 mol/L catechol and 0.5 mL enzyme extraction (labeled E3) was heated at 37 °C for 10 min. Then, 2 mL 20% trichloroacetic acid (w/v) was quickly added to the reaction mixture and centrifuged at 4 °C, 11,000 ×g for 10 min (TGL-16M, Hunan Xiangyi Laboratory Instrument Development Co., Ltd, China). Finally, the absorbance was measured immediately at 420 nm, 6 times with an interval of 1 min by a UV-visible spectrophotometer (TU-1900, Beijing Purkinje General Instrument Co., Ltd, China).
CAT activity was measured using the method described by Li[27] with slight modification. Reaction mixture was prepared using 2 mL 0.05 mol/L PBS (pH 7.8), 0.5 mL 0.18% H2O2 (v/v), 1 mL distilled water and 0.5 mL enzyme extraction (labeled E4). The absorbance was immediately measured at 240 nm, 6 times with an interval of 1 min by a UV-visible spectrophotometer (TU-1900, Beijing Purkinje General Instrument Co., Ltd, China).
Antioxidant enzyme activity was calculated with the following equations:
$ \mathrm{S}\mathrm{O}\mathrm{D}\;\mathrm{a}\mathrm{c}\mathrm{t}\mathrm{i}\mathrm{v}\mathrm{i}\mathrm{t}\mathrm{y}\;\left(\mathrm{U}/\mathrm{g}\cdot\mathrm{F}\mathrm{W}\right)\;=\frac{\left(\rm{A}ck-\mathrm{A}e\right)\times \rm{V}e}{0.5\times \rm{A}ck\times \rm{W}\mathrm{ }\times \rm{V}\mathrm{e}1} $ (11) $ \mathrm{P}\mathrm{O}\mathrm{D}\;\mathrm{a}\mathrm{c}\mathrm{t}\mathrm{i}\mathrm{v}\mathrm{i}\mathrm{t}\mathrm{y}\;\left(\mathrm{U}/\mathrm{g}\cdot\mathrm{m}\mathrm{i}\mathrm{n}\right)\;=\frac{{\text△}\rm{D}470\times \rm{V}e}{0.01\times \rm{W}\times \rm{V}e2\times \mathrm{T}} $ (12) $ \mathrm{P}\mathrm{P}\mathrm{O}\;\mathrm{a}\mathrm{c}\mathrm{t}\mathrm{i}\mathrm{v}\mathrm{i}\mathrm{t}\mathrm{y}\;\left(\mathrm{U}/\mathrm{g}\cdot\mathrm{m}\mathrm{i}\mathrm{n}\right)\;=\frac{{\text{△}}\rm{D}420\times \mathrm{V}\mathrm{e}}{\left(0.01\times \rm{W}\times \rm{V}e3\times \mathrm{T}\right)} $ (13) $ \mathrm{C}\mathrm{A}\mathrm{T}\;\mathrm{a}\mathrm{c}\mathrm{t}\mathrm{i}\mathrm{v}\mathrm{i}\mathrm{t}\mathrm{y}\;\left(\mathrm{U}/\mathrm{g}\cdot\mathrm{m}\mathrm{i}\mathrm{n}\right)\;=\frac{{\text{△}}\mathrm{D}240\times \rm{V}e}{0.1\times \mathrm{ }\rm{W}\times \rm{V}e4\times \mathrm{T}} $ (14) Ack and Ae are the absorbance of the control and samples at 560 nm, respectively;
${\text{△}}{\rm D470} $ ${\text{△}}{\rm D420} $ ${\text{△}}{\rm D240} $ Data and statistical analysis
-
One-way analysis of variance was conducted to evaluate the effect of shading treatment on growth and physiological characteristics, followed by Tukey's Highly Significant Differences (HSD), and the standard error of differences between means was calculated with p set to 0.05. All statistical analyses were performed using SPSS Statistics 18 version 16.0 for Windows (SPSS Inc., Chicago, IL, USA). Correlation analysis was performed to identify the relationship between the growth index of seedlings and physiological index using the software package Origin 9.1 (Northampton, MA01060, USA). Network analysis was performed using Gephi (version 0.9.2, WebAtlas, France) to analyze the correlation between various physiological index.
-
In the treatment without shade net (SH0, as a control), the survival rate of seedlings was 84.44%, and seedling growth was significantly inhibited. Specifically, seedlings had the lowest height and growth biomass. Leaves were seriously burnt, but RSR was the highest (Fig. 1, Table 1). Under shading conditions, the survival rate of seedlings increased significantly, but there was no difference under SH1 and under SH2. Seedling growth and biomass significantly increased with increasing layers of shade net. In particular, seedlings under SH2 showed favorable growth with the largest leaf area, highest plant height, and highest plant weight, but RSR decreased with increasing layers of shade net (Table 1, Fig. 1).
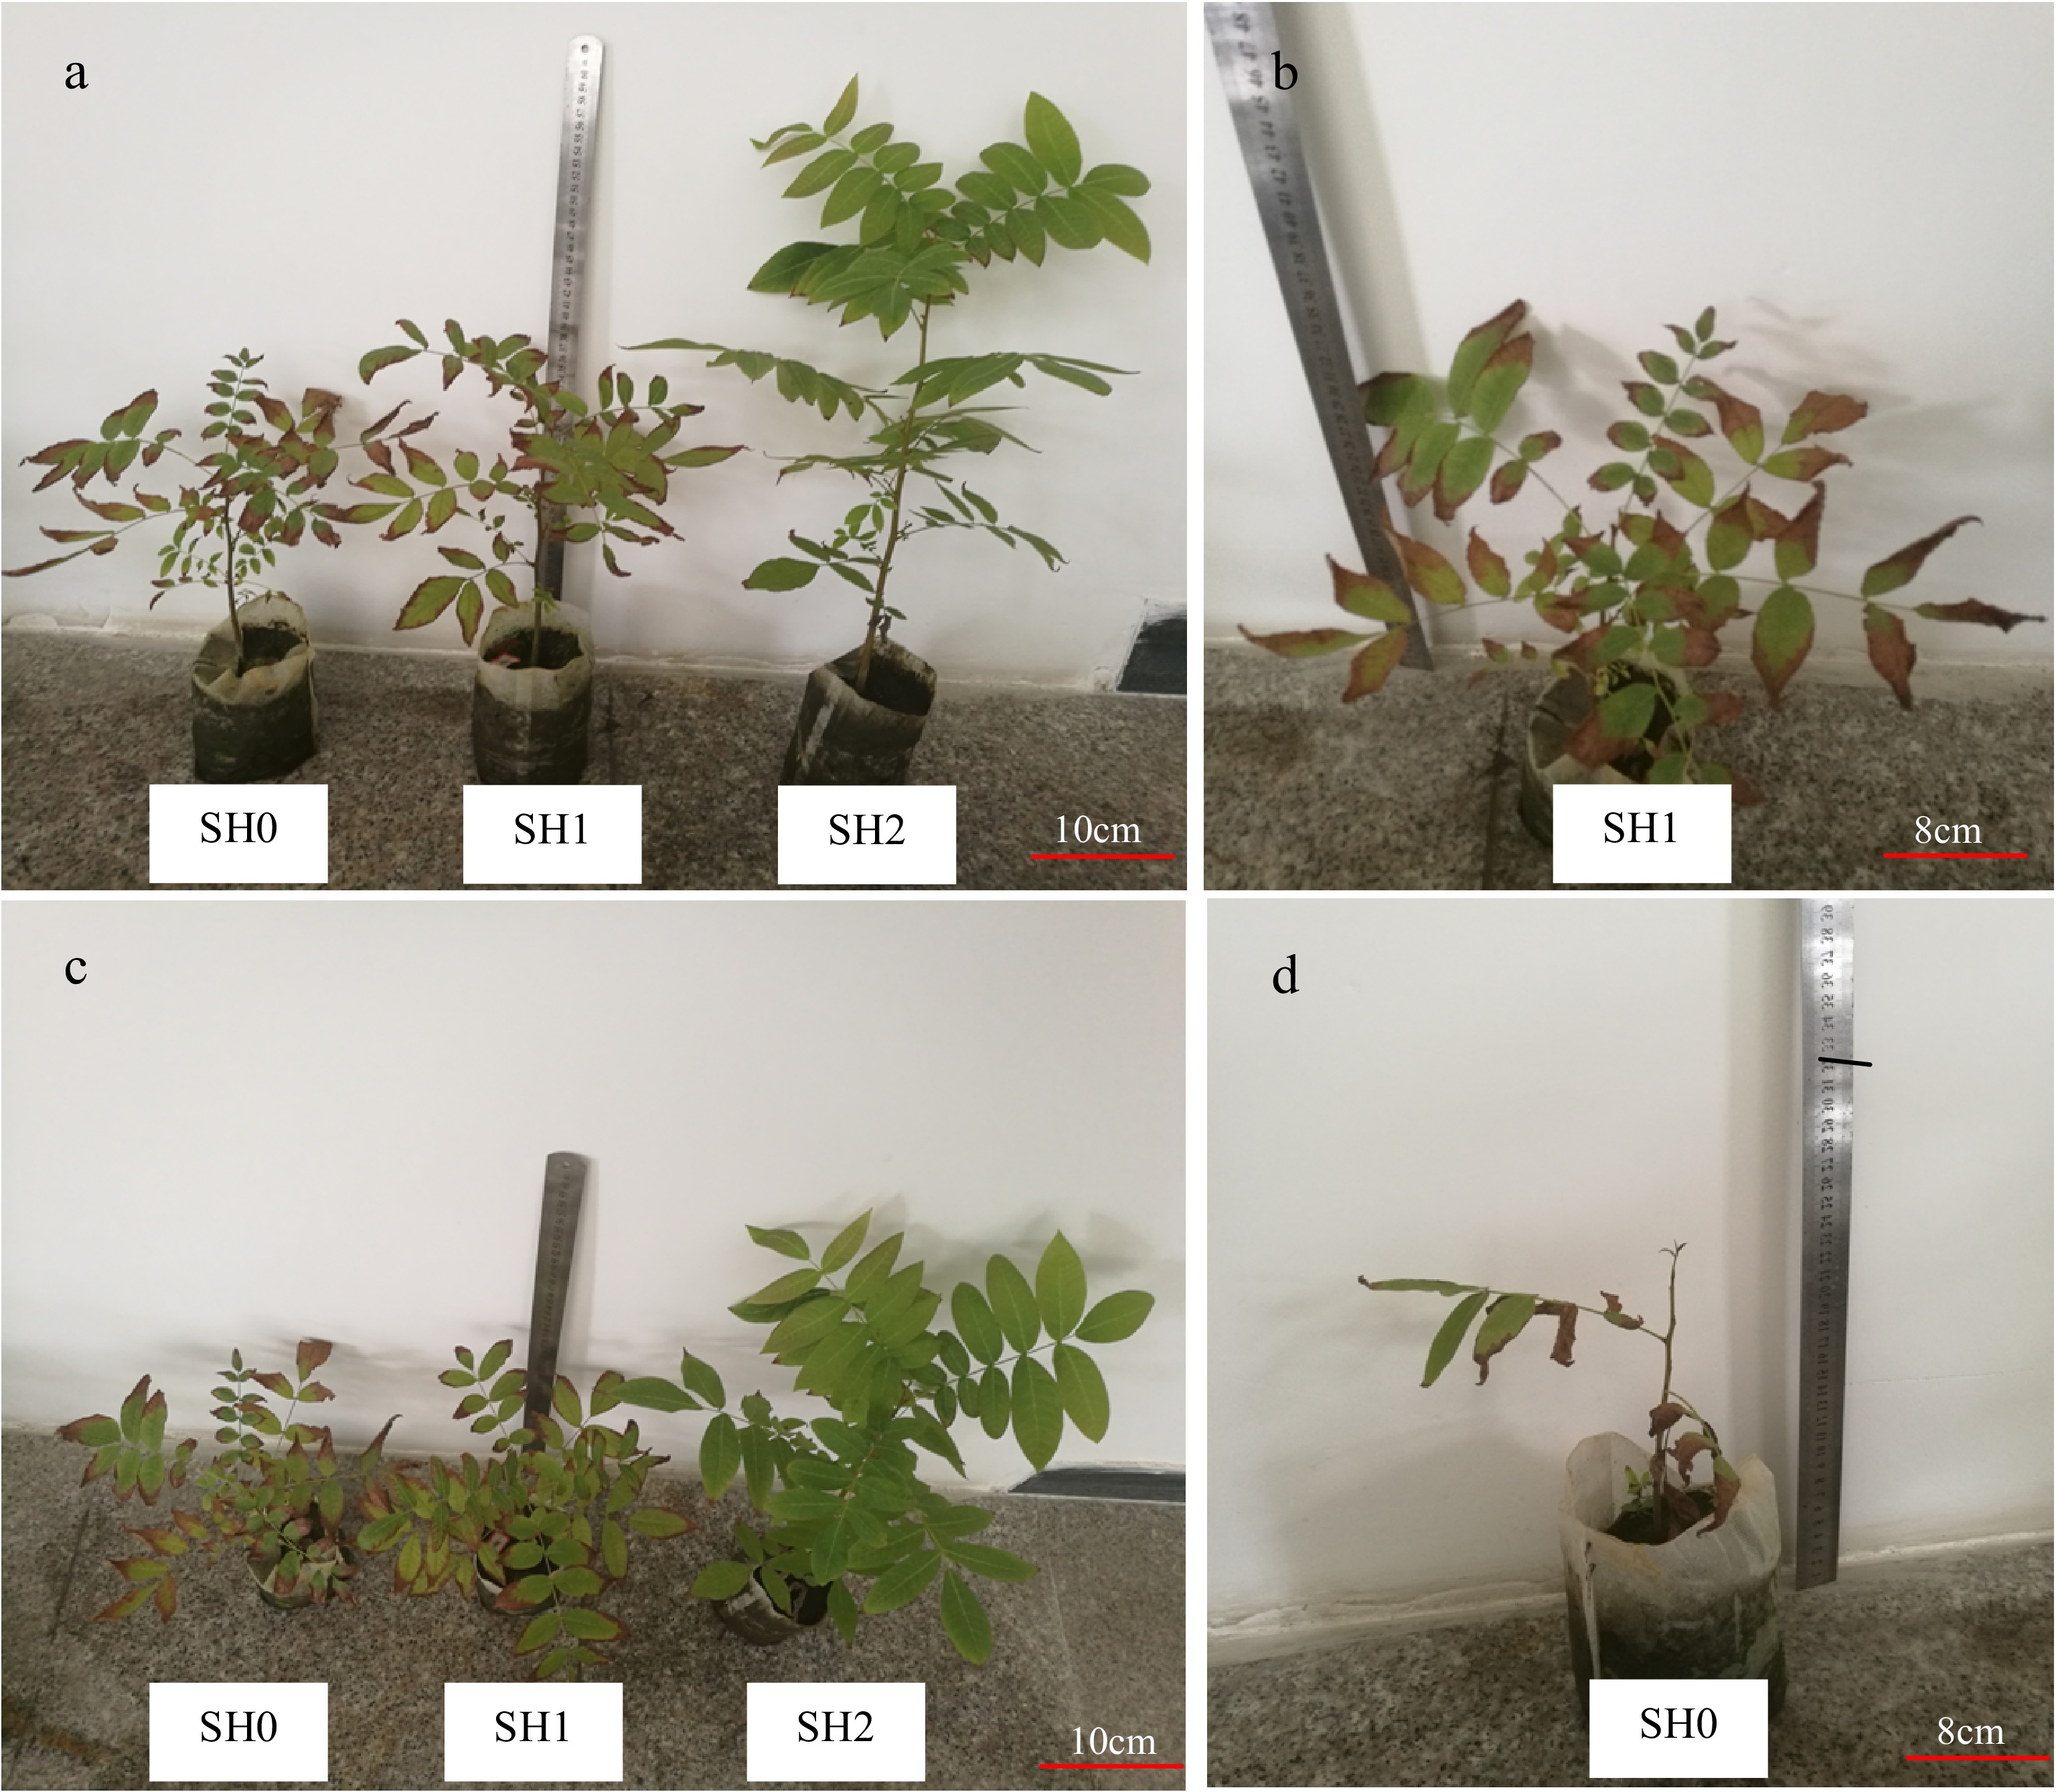
Figure 1.
Growth of Cyclocarya paliurus seedlings under different shading levels. (a), (c) Seedling growth in plastic greenhouse under three shading levels; (b), (d) seedling growth in plastic greenhouse under SH1 and SH0, respectively; SH0 indicates seedling growth with no shade net (about 60%−70% of full sunlight); SH1 indicates seedling growth with one layer of shade net (about 30%−40% of full sunlight); SH2 indicates seedling growth with two layers of shade net (about 10%−20% of full sunlight). Seedlings were treated in plastic greenhouses with different shading levels for 100 d (from June to September), and plastic sheeting was not fitted around the plastic greenhouse and the shade net was set at 1.8 m height from the ground.
Table 1. Variations in seedling growth of Cyclocarya paliurus with different shading treatments
Treatment Survival rate
(%)The fourth leaf area
(cm2)DH
(mm)The growth rate of stem
(cm/d)DM:FM
(g/plant)RSR SH0 84.44 ± 3.85b 3.46 ± 0.42c 1.48 ± 0.24c 0.02 ± 0c 4.04 ± 0.72b 0.70 ± 0.19a SH1 95.56 ± 3.85a 9.19 ± 1.045b 2.76 ± 0.42b 0.08 ± 0.02b 6.34 ± 2.79b 0.58 ± 0.13ab SH2 100 ± 0a 33.19 ± 3.09a 5.29 ± 0.76a 0.31 ± 0.03a 18.84 ± 3.72a 0.41 ± 0.08b SH0 means seedling growth with no shade net; SH1 means seedling grwoth with one layer of shade net; SH2 means seedling growth with two layers of shade net. Different letters (a,b,--) indicate significant differences between shading treatments by Tukey's Highly Significant Differences at p set to 0.05. DH represents ground diameter; DM:FM represents dry mass: fresh mass; RSR represents the ratio of underground weight to aboveground weight. Variation in water content (WC)
-
WC of seedlings under SH1 and SH2 was slightly higher than that under SH0, but no differences exist between SH0, SH1, and SH2 (Fig. 2a). However, WC varied in the three parts (root, shoot, and leaf) under different shading levels. Specifically, WC in the root increased, but WC in the shoot decreased with increasing layers of shade net, and no difference was observed between SH0, SH1, and SH2. WC in the leaf under SH1 and SH2 significantly increased by 12.54% and 12.78%, respectively, in comparison with that under SH0 (Fig. 2a).
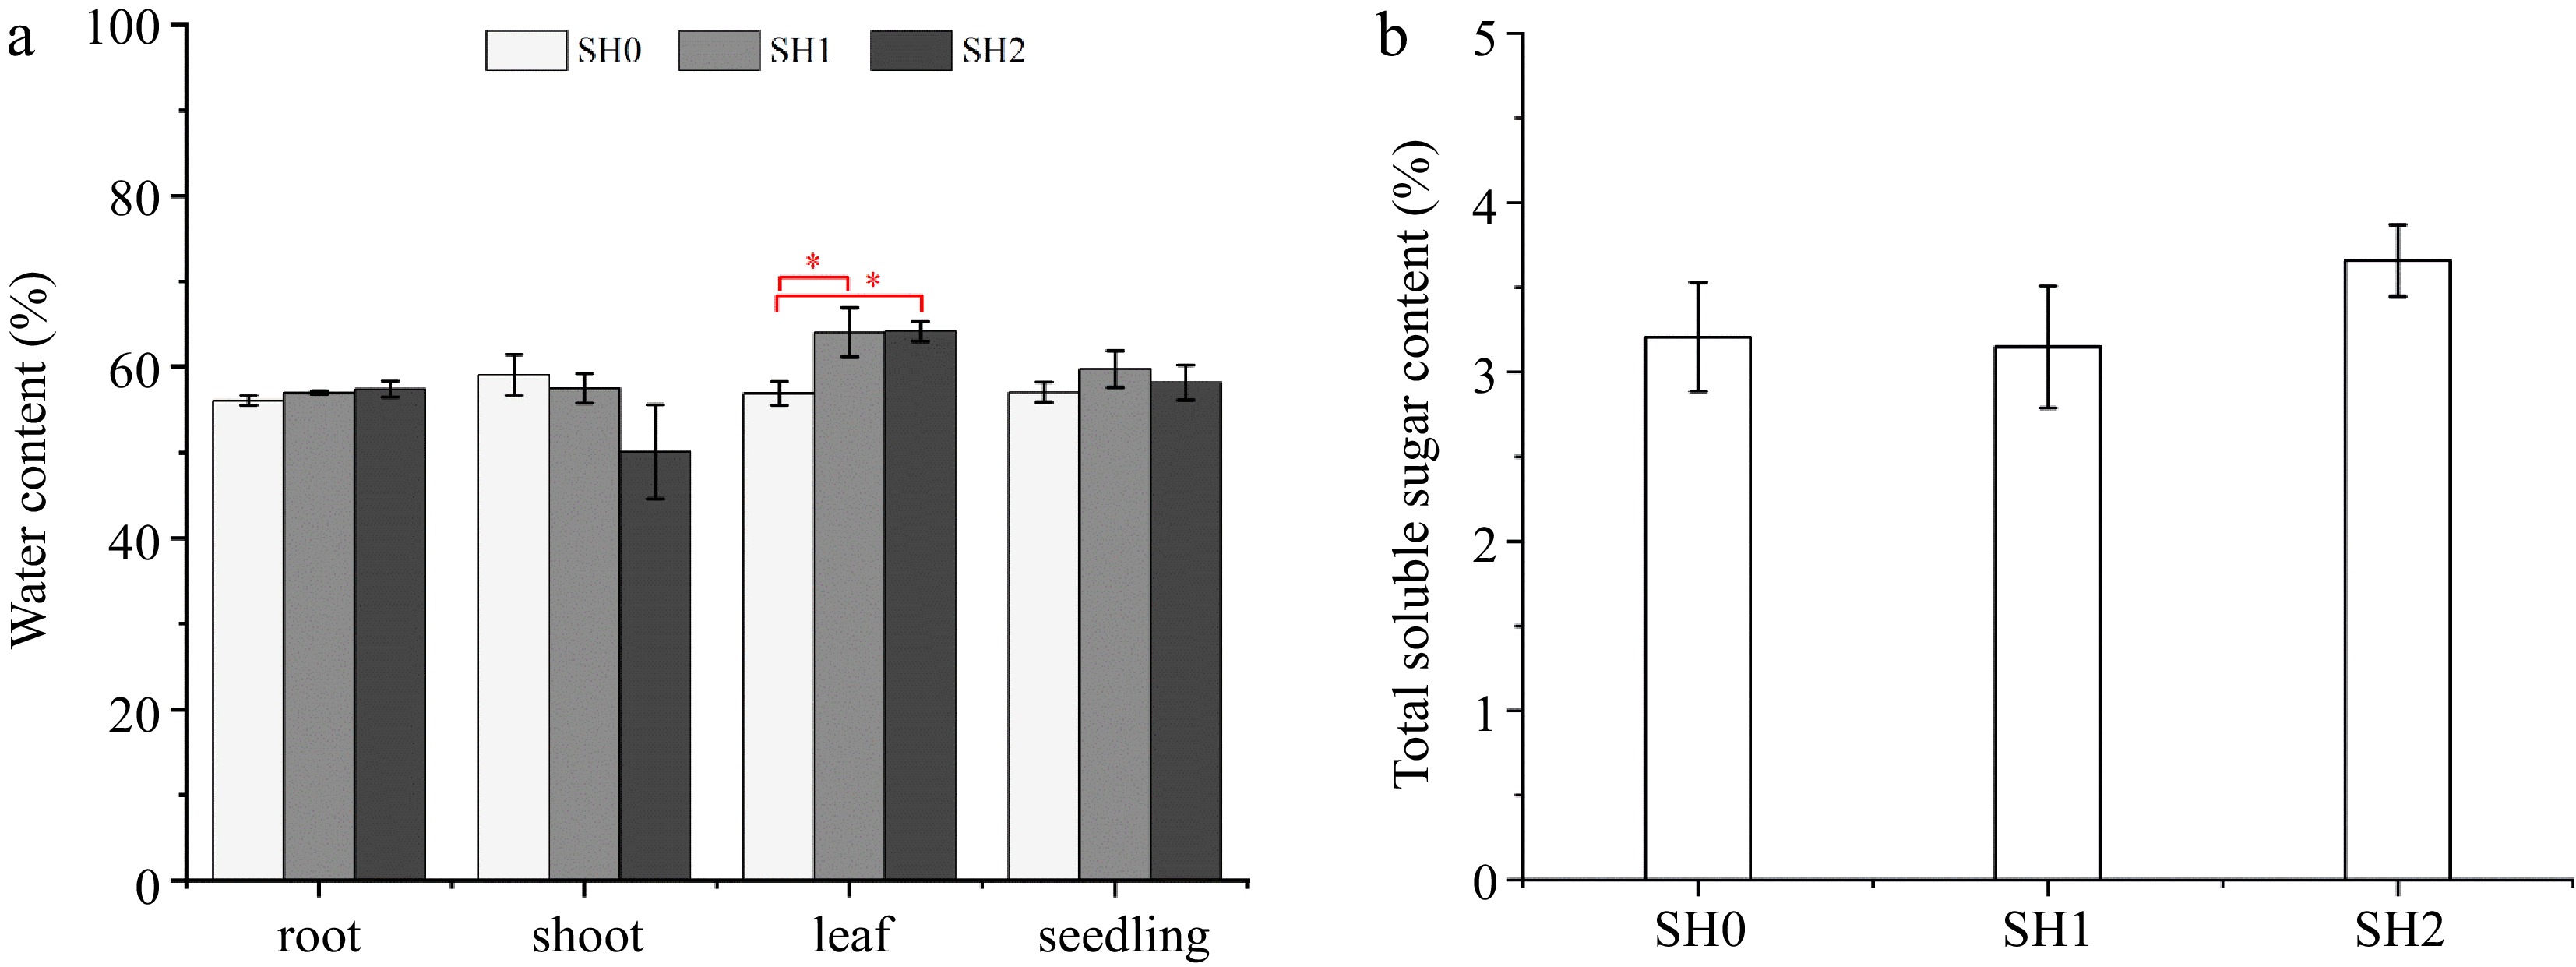
Figure 2.
(a) Water content and (b) total soluble sugar content in Cyclocarya paliurus seedlings under different shading levels. SH0 indicates seedling growth with no shade net; SH1 indicates seedling growth with one layer of shade net; SH2 indicates seedling growth with two layers of shade net. * means significant differences (p < 0.05 according to Tukey's HSD) between SH0, SH1 and SH2.
Variation in total soluble sugar content
-
Leaves under SH2 showed the highest TSS content, TSS content under SH0 and SH1 decreased by 13.93% and 14.67%, respectively, but there was no difference between three shading levels (Fig. 2b).
Variation in chlorophyll content
-
Chlorophyll (Chl) content of leaves under SH2 was 2.52 times and 1.67 times higher than that under SH0 and SH1, respectively (Fig. 3a). Chl a content was much higher than Chl b content and carotenoid content, but both of them showed a similar trend (Fig. 3b, c, d).
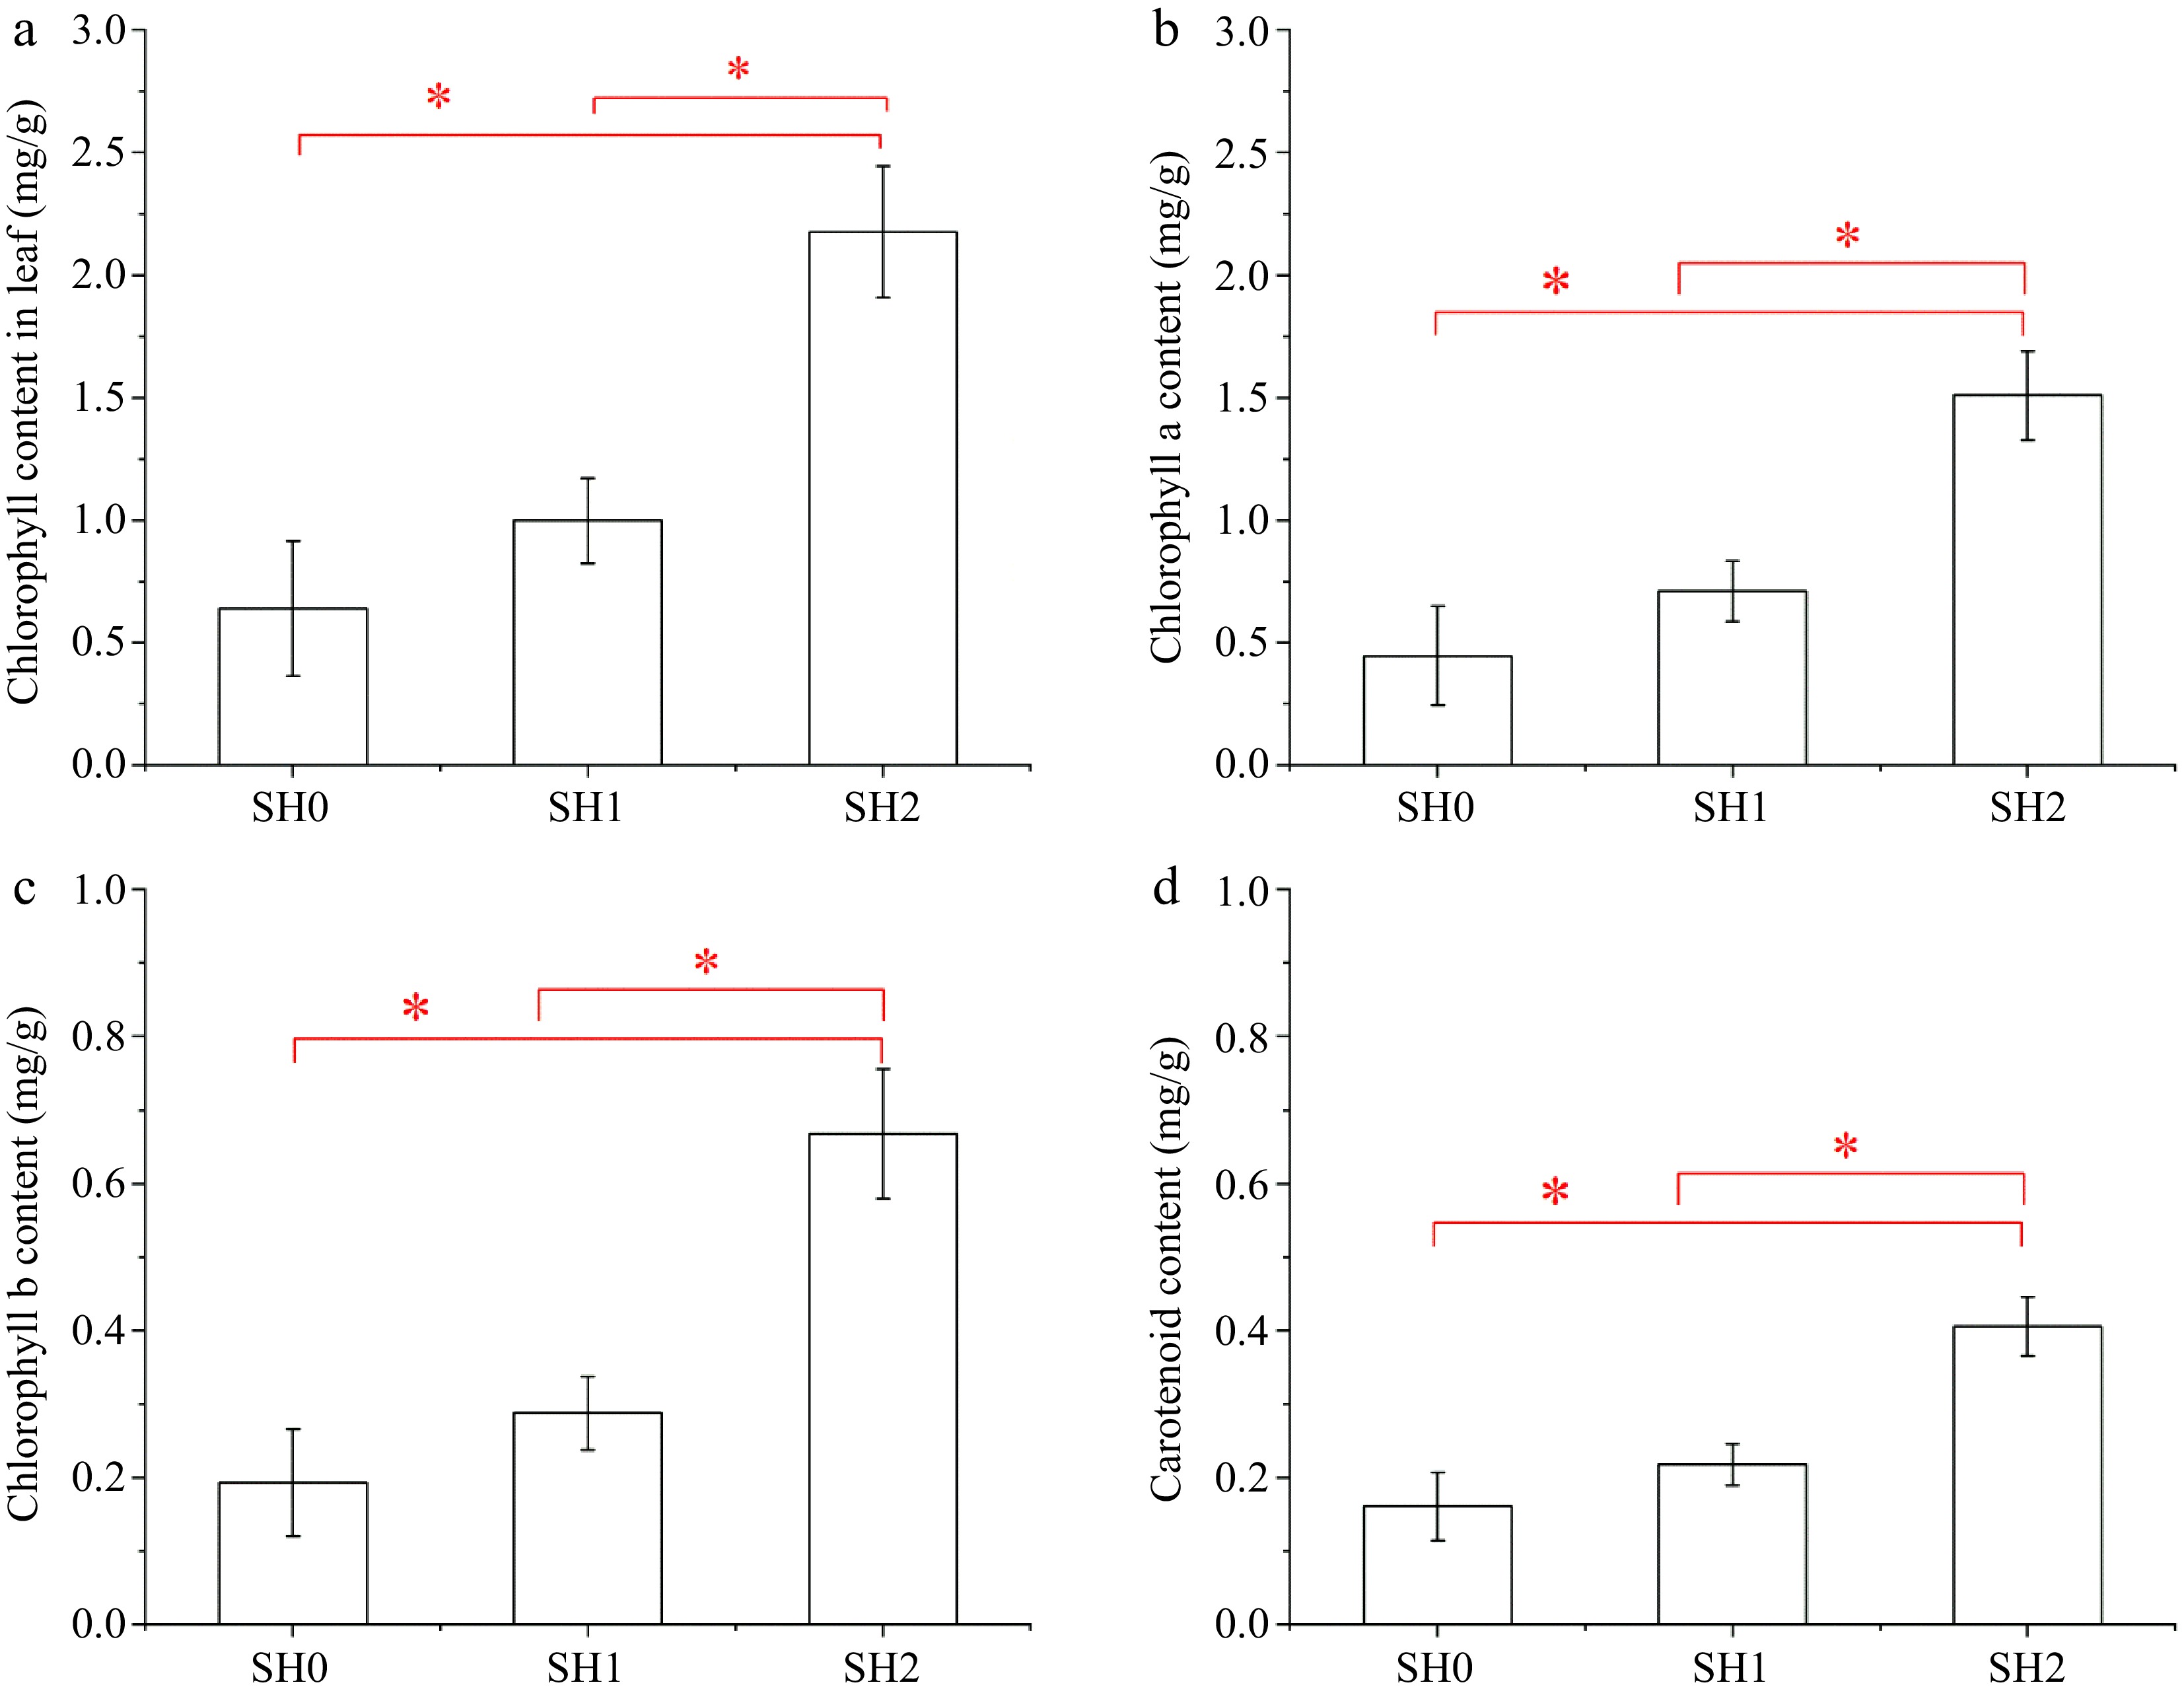
Figure 3.
Chlorophyll content and carotenoid content in Cyclocarya paliurus leaves under different shading levels. (a) Chlorophyll content; (b) chlorophyll a content; (c) chlorophyll b content; and (d) carotenoid content. SH0 indicates seedling growth with no shade net; SH1 indicates seedling growth with one layer of shade net; SH2 indicates seedling growth with two layers of shade net. * means significant differences (p < 0.05 according to Tukey's HSD) between SH0, SH1 and SH2.
Variation in lipid peroxidation content
-
Under the three shading levels, MDA content in leaf under SH2 was the lowest, and its content under SH0 and SH1 significantly increased by 59.15% and 60.25%, respectively (Fig. 4). But there was no difference between under SH0 and SH1.
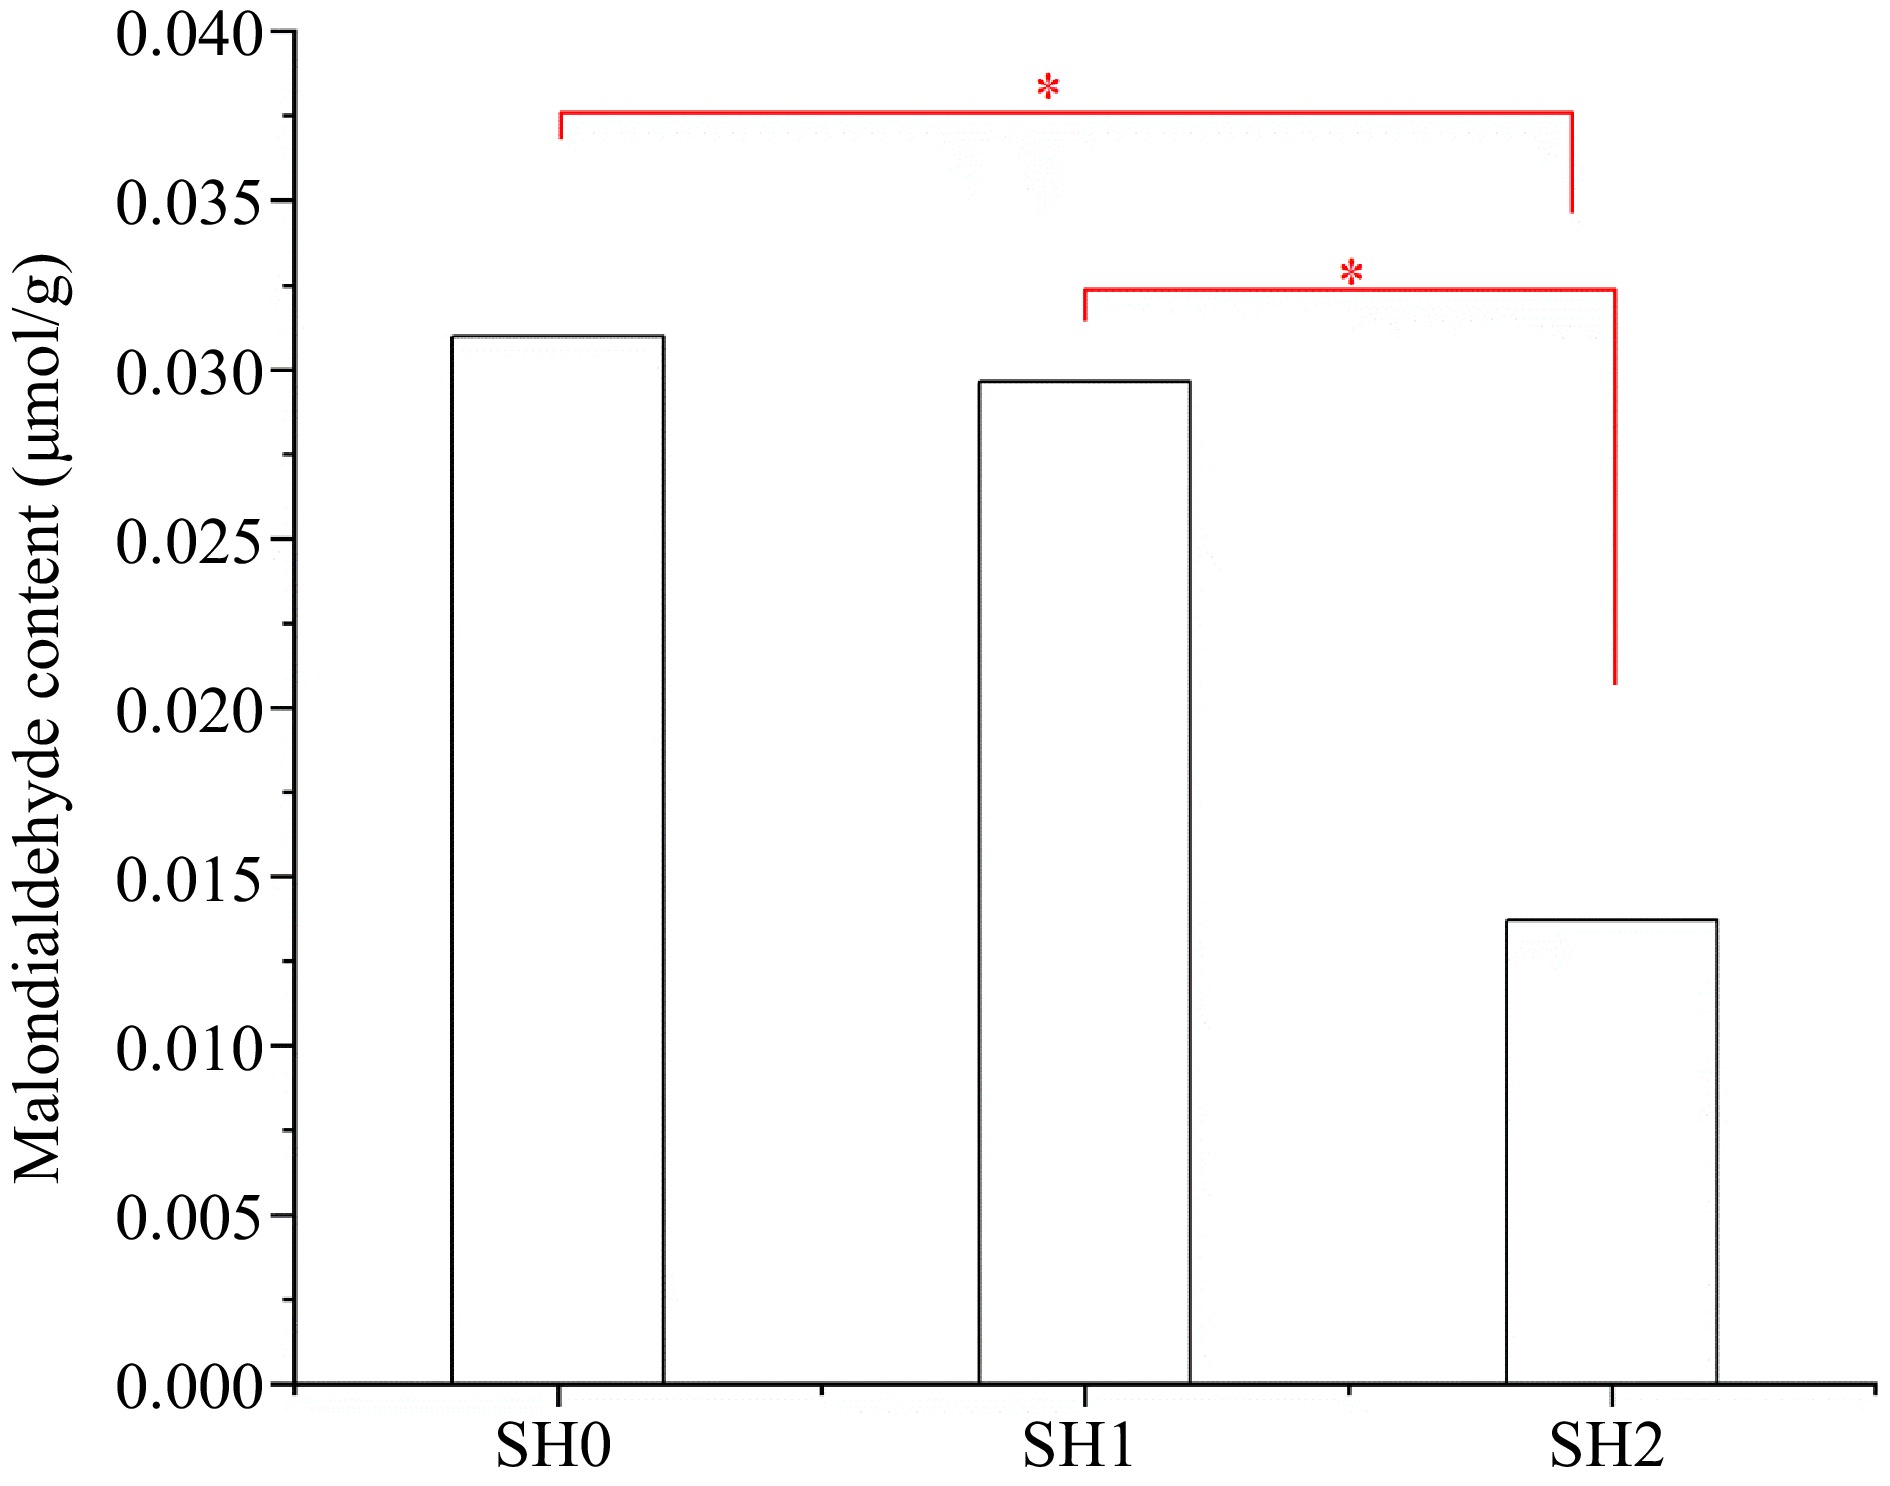
Figure 4.
MDA content in Cyclocarya paliurus leaves under different shading levels. SH0 indicates seedling growth with no shade net; SH1 indicates seedling growth with one layer of shade net; SH2 indicates seedling growth with two layers of shade net. * means significant differences (p < 0.05 according to Tukey's HSD) between SH0, SH1 and SH2.
Variation in mineral content
-
Four kinds of mineral (K, Ca, Mg, and Na) were detected in seedlings, and their contents were in the order of Ca>K>Mg>Na (Fig. 5a). The translation factor of the four minerals decreased with the increasing layers of shade net, and there was a significant difference between under SH0, SH1, and SH2 (Fig. 5b).
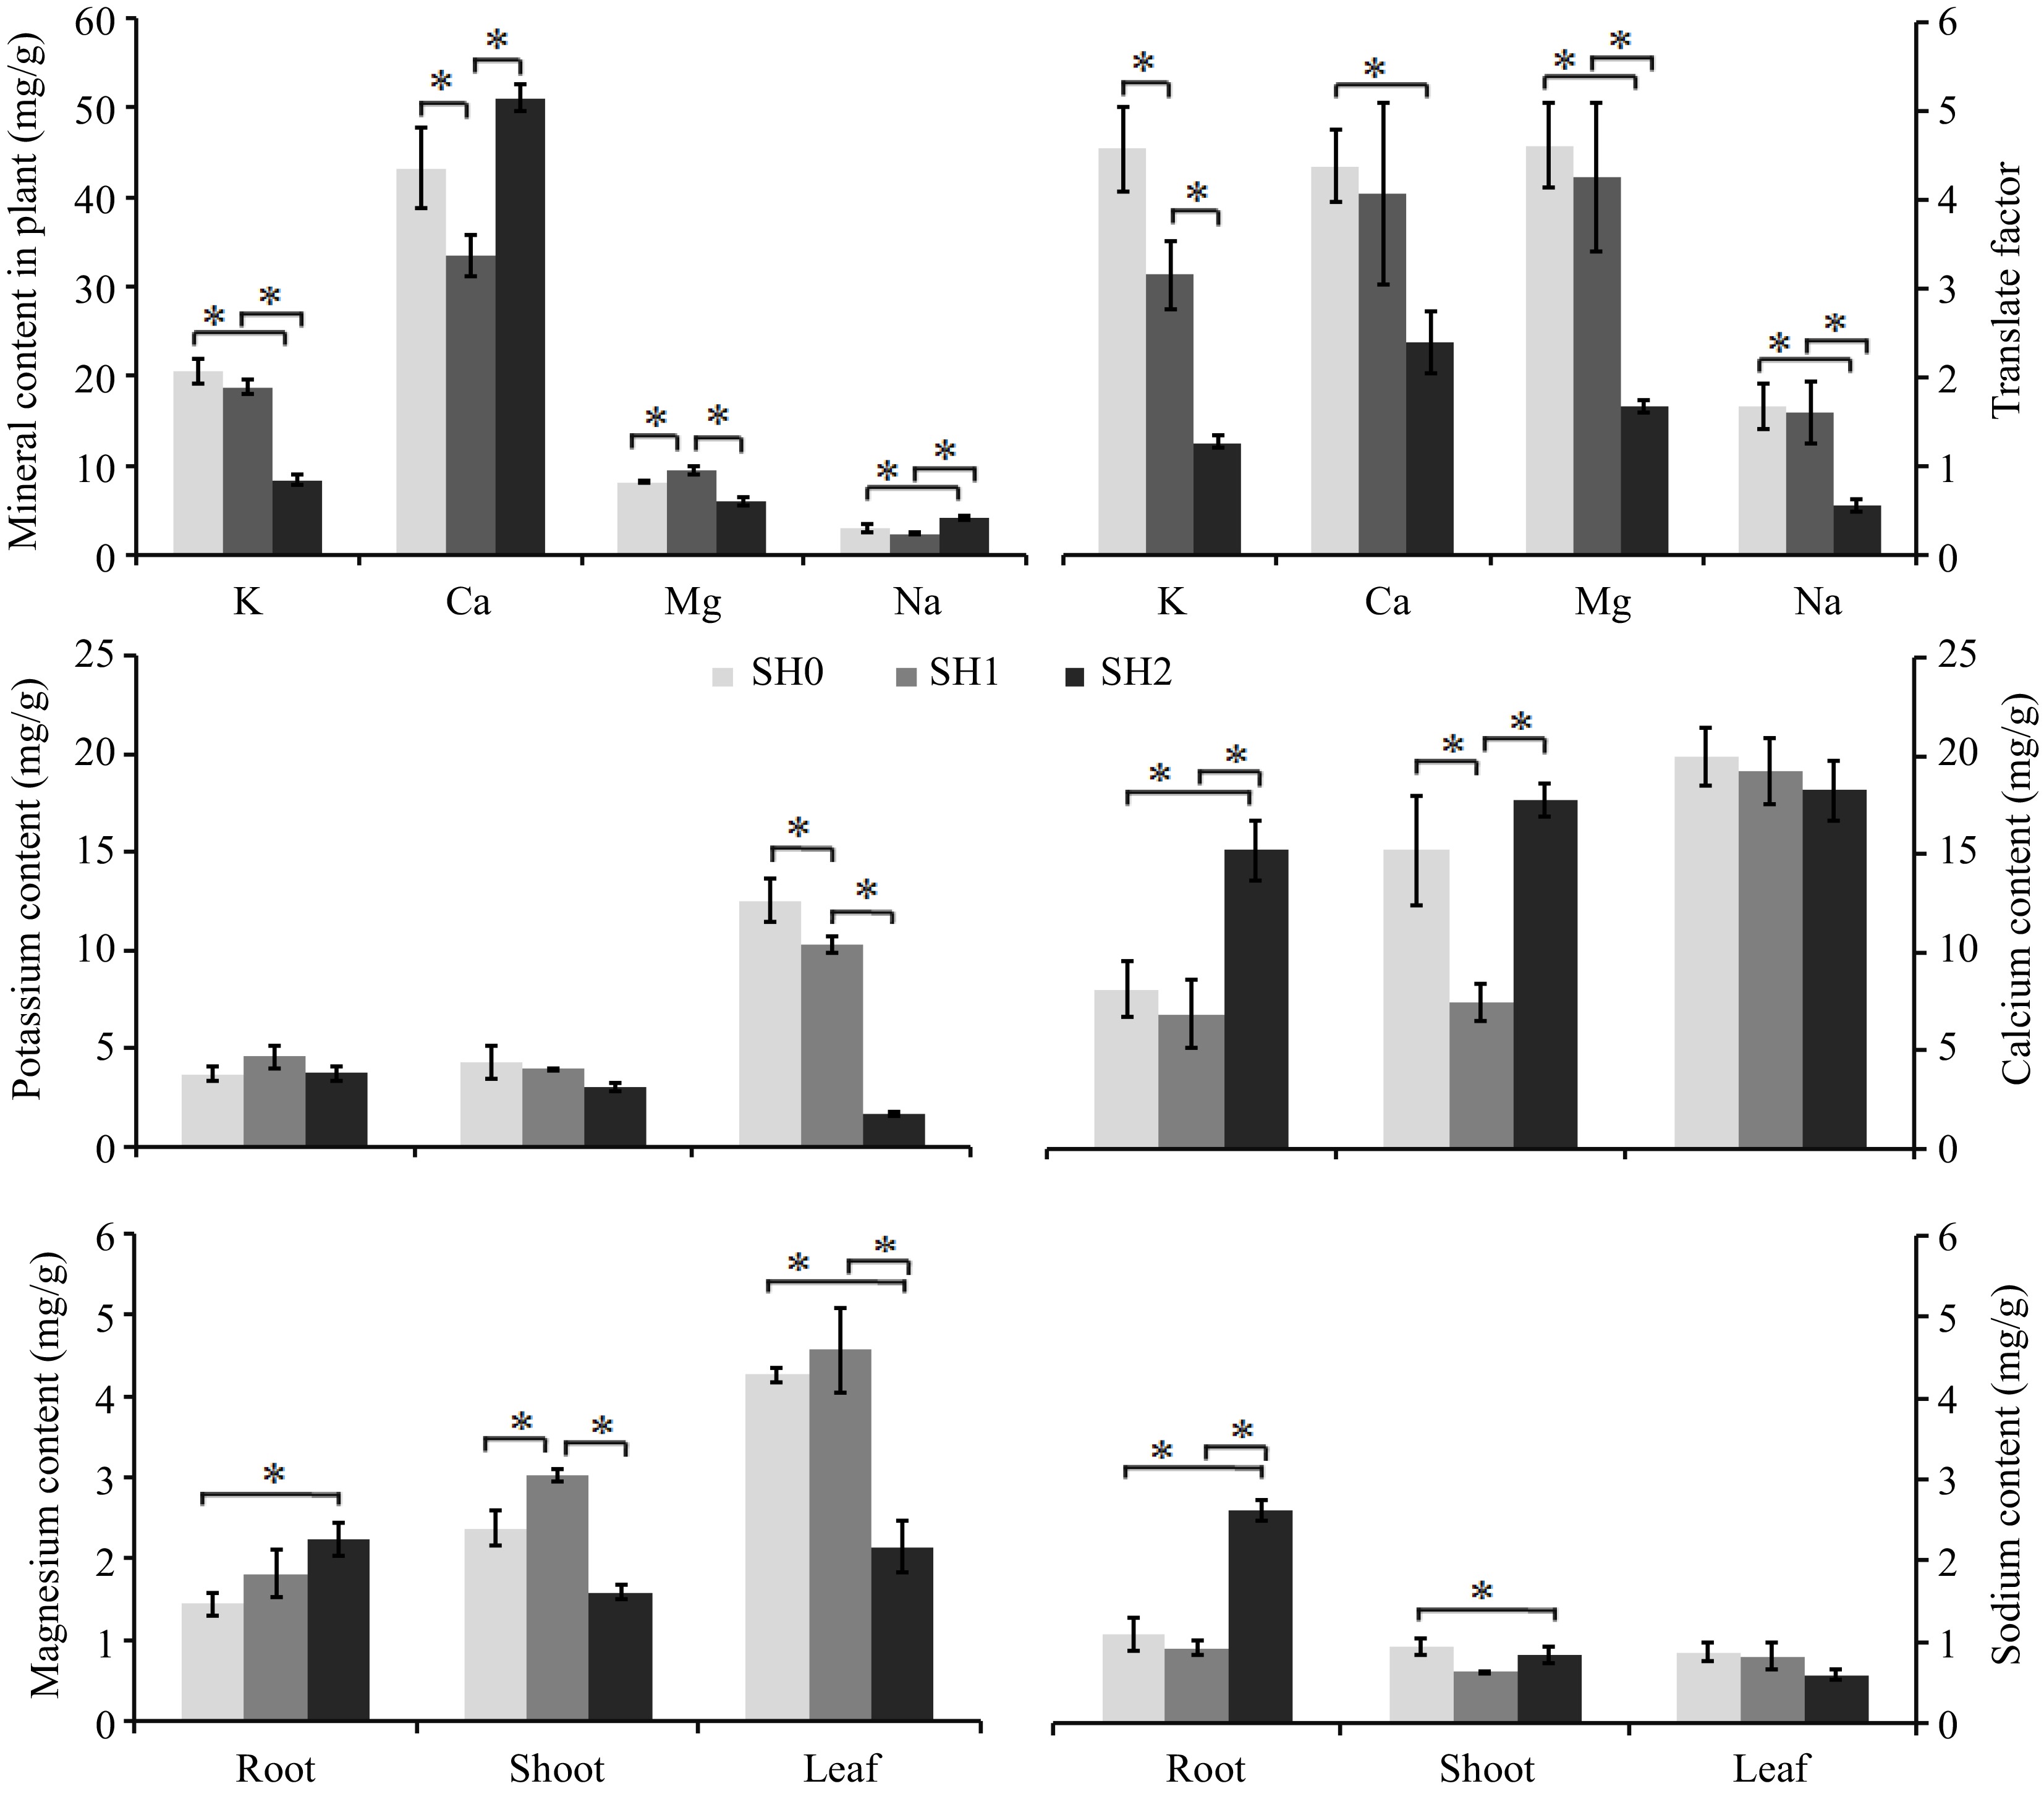
Figure 5.
Mineral contents in Cyclocarya paliurus seedling under different shading levels. (a) mineral contents in seedlings; (b) translocation factor; (c) K content; (d) Ca content; (e) Mg content; (f) Na content. SH0 indicates seedling growth with no shade net; SH1 indicates seedling growth with one layer of shade net; SH2 indicates seedling growth with two layers of shade net. * means significant differences (p < 0.05 according to Tukey's HSD) between SH0, SH1 and SH2.
K content of seedlings was significantly decreased with the increasing layers of shade net (Fig. 5a), K content under SH0 and SH1 was rich in the leaf (Fig. 5c). K content in the root under SH1 was higher than that under SH0 and SH2, but no change was observed between under SH0, SH1 and SH2. K content in the shoot and leaf decreased with increasing layers of shade net (Fig. 5c).
Ca content of seedlings under SH1 significantly decreased, but increased significantly under SH2 in comparison with that under SH0 (Fig. 5a). Ca content in the leaf was higher than that in the root and shoot (Fig. 5d). Ca content in the root and shoot had a similar trend with that in seedlings. Leaves showed a decreasing Ca content with increasing layers of shade net.
Seedling under SH1 had the highest Mg content (Fig. 5a), Mg content was also rich in leaf. Mg content in the root slightly increased, but Mg content in the shoot and leaf significantly decreased with increasing layers of shade net (Fig. 5e).
Na content of seedlings reached significant difference under SH2 (Fig. 5a), Na content in the root was higher than that in the leaf and in shoot. Na content in the root and shoot significantly increased, but decreased in the leaf with increasing layers of shade net (Fig. 5f).
Variation in antioxidant enzyme activity
-
Four kinds of antioxidant enzymes (SOD, PPO, POD, and CAT) were detected in the leaf and their activities were in the following order: SOD>PPO>POD>CAT (Fig. 6). However, their activities varied with different shading levels. Leaf under SH0 had the highest SOD activity, and SOD activity decreased significantly with increasing layers of shade net. The change of POD and CAT activities were similar to that of SOD activity. However, PPO activity increased significantly with increasing layers of shade net, and its activity under SH2 was 25.67 and 23.03 times higher than that under SH0 and SH1, respectively.
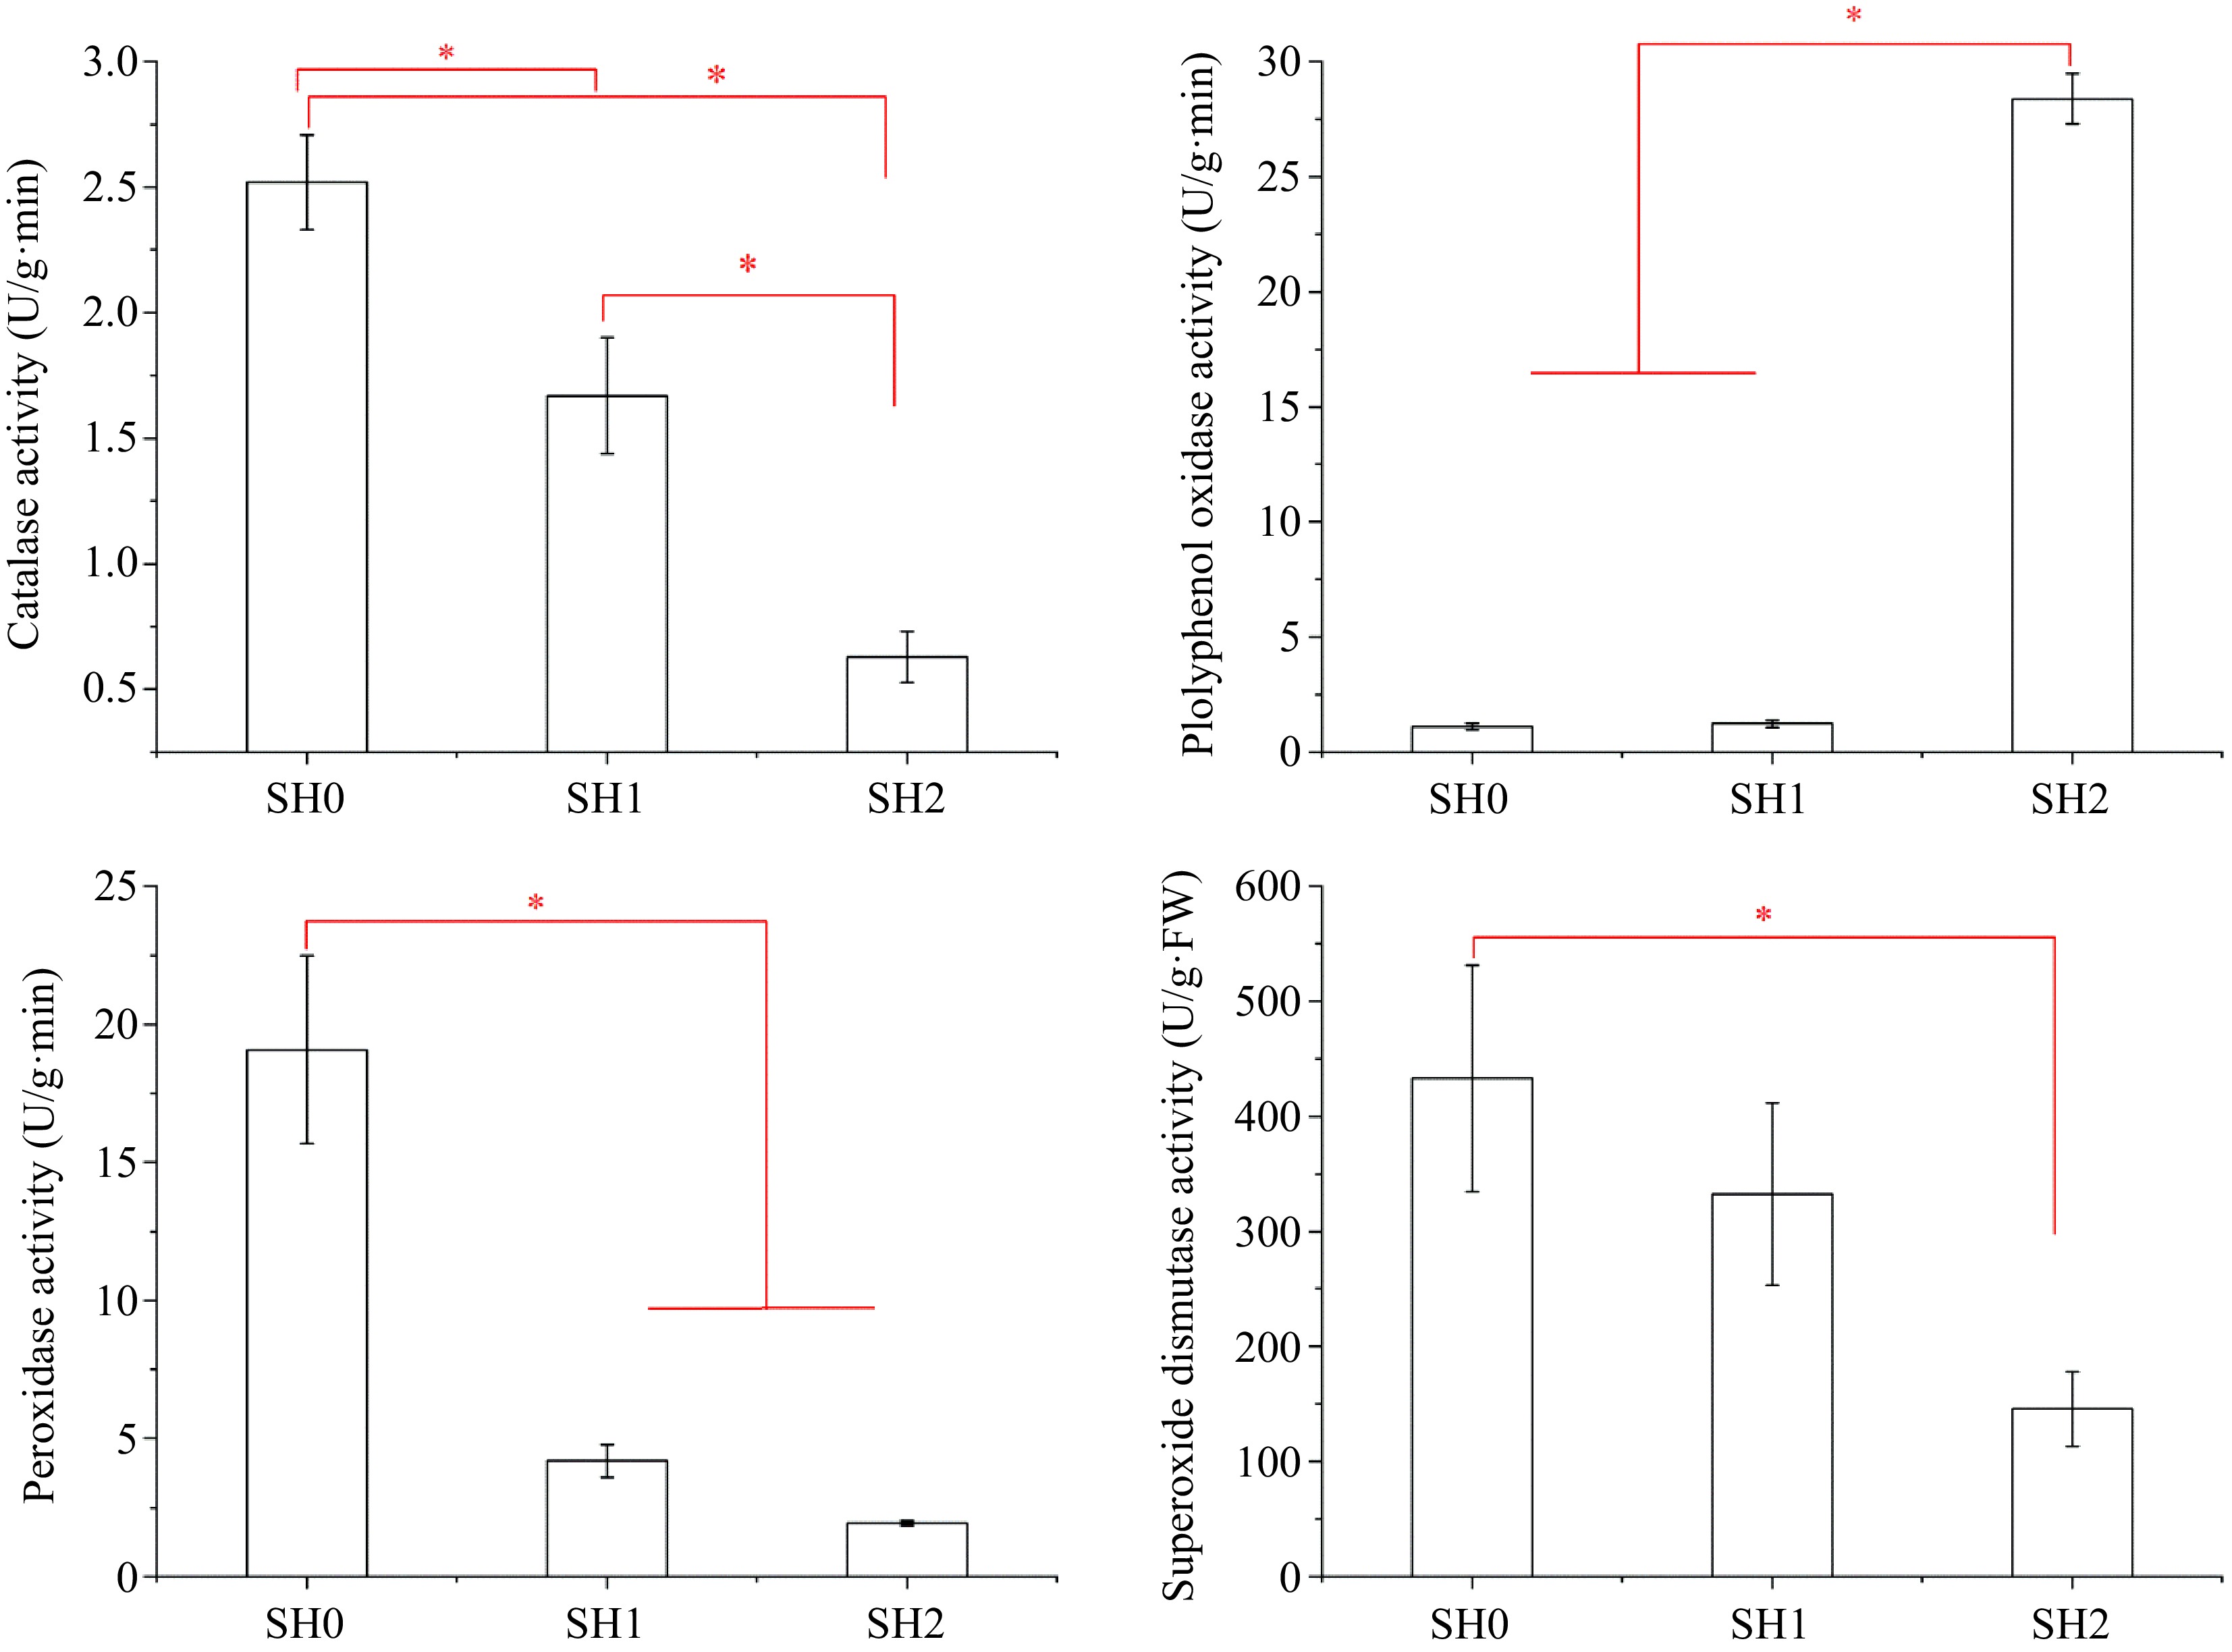
Figure 6.
Variations in antioxidant enzyme activities in Cyclocarya paliurus leaves under different shading levels. (a) CAT activity; (b) PPO activity; (c) POD activity; and (d) SOD activity. SH0 indicates seedling growth with no shade net; SH1 indicates seedling growth with one layer of shade net; SH2 indicates seedling growth with two layers of shade net. * means significant differences (p < 0.05 according to Tukey's HSD) between SH0, SH1 and SH2.
Correlation among parameters
-
The growth index of seedlings had positive or negative relationships with various physiological indices under three shading levels (Fig. 7a). And various relationships exist between them. For example, seedling height and leaf area had a negative relation with growth biomass (DM:FM, RSR); PPO activity had a significant positive relation with TSS and Chl content. Antioxidant enzyme activity (SOD, POD, CAT) had a positive relation with mineral content (K, Ca, Mg, Na); but physiological index had a negative relation with antioxidant enzyme activity and mineral content (Fig. 7b).
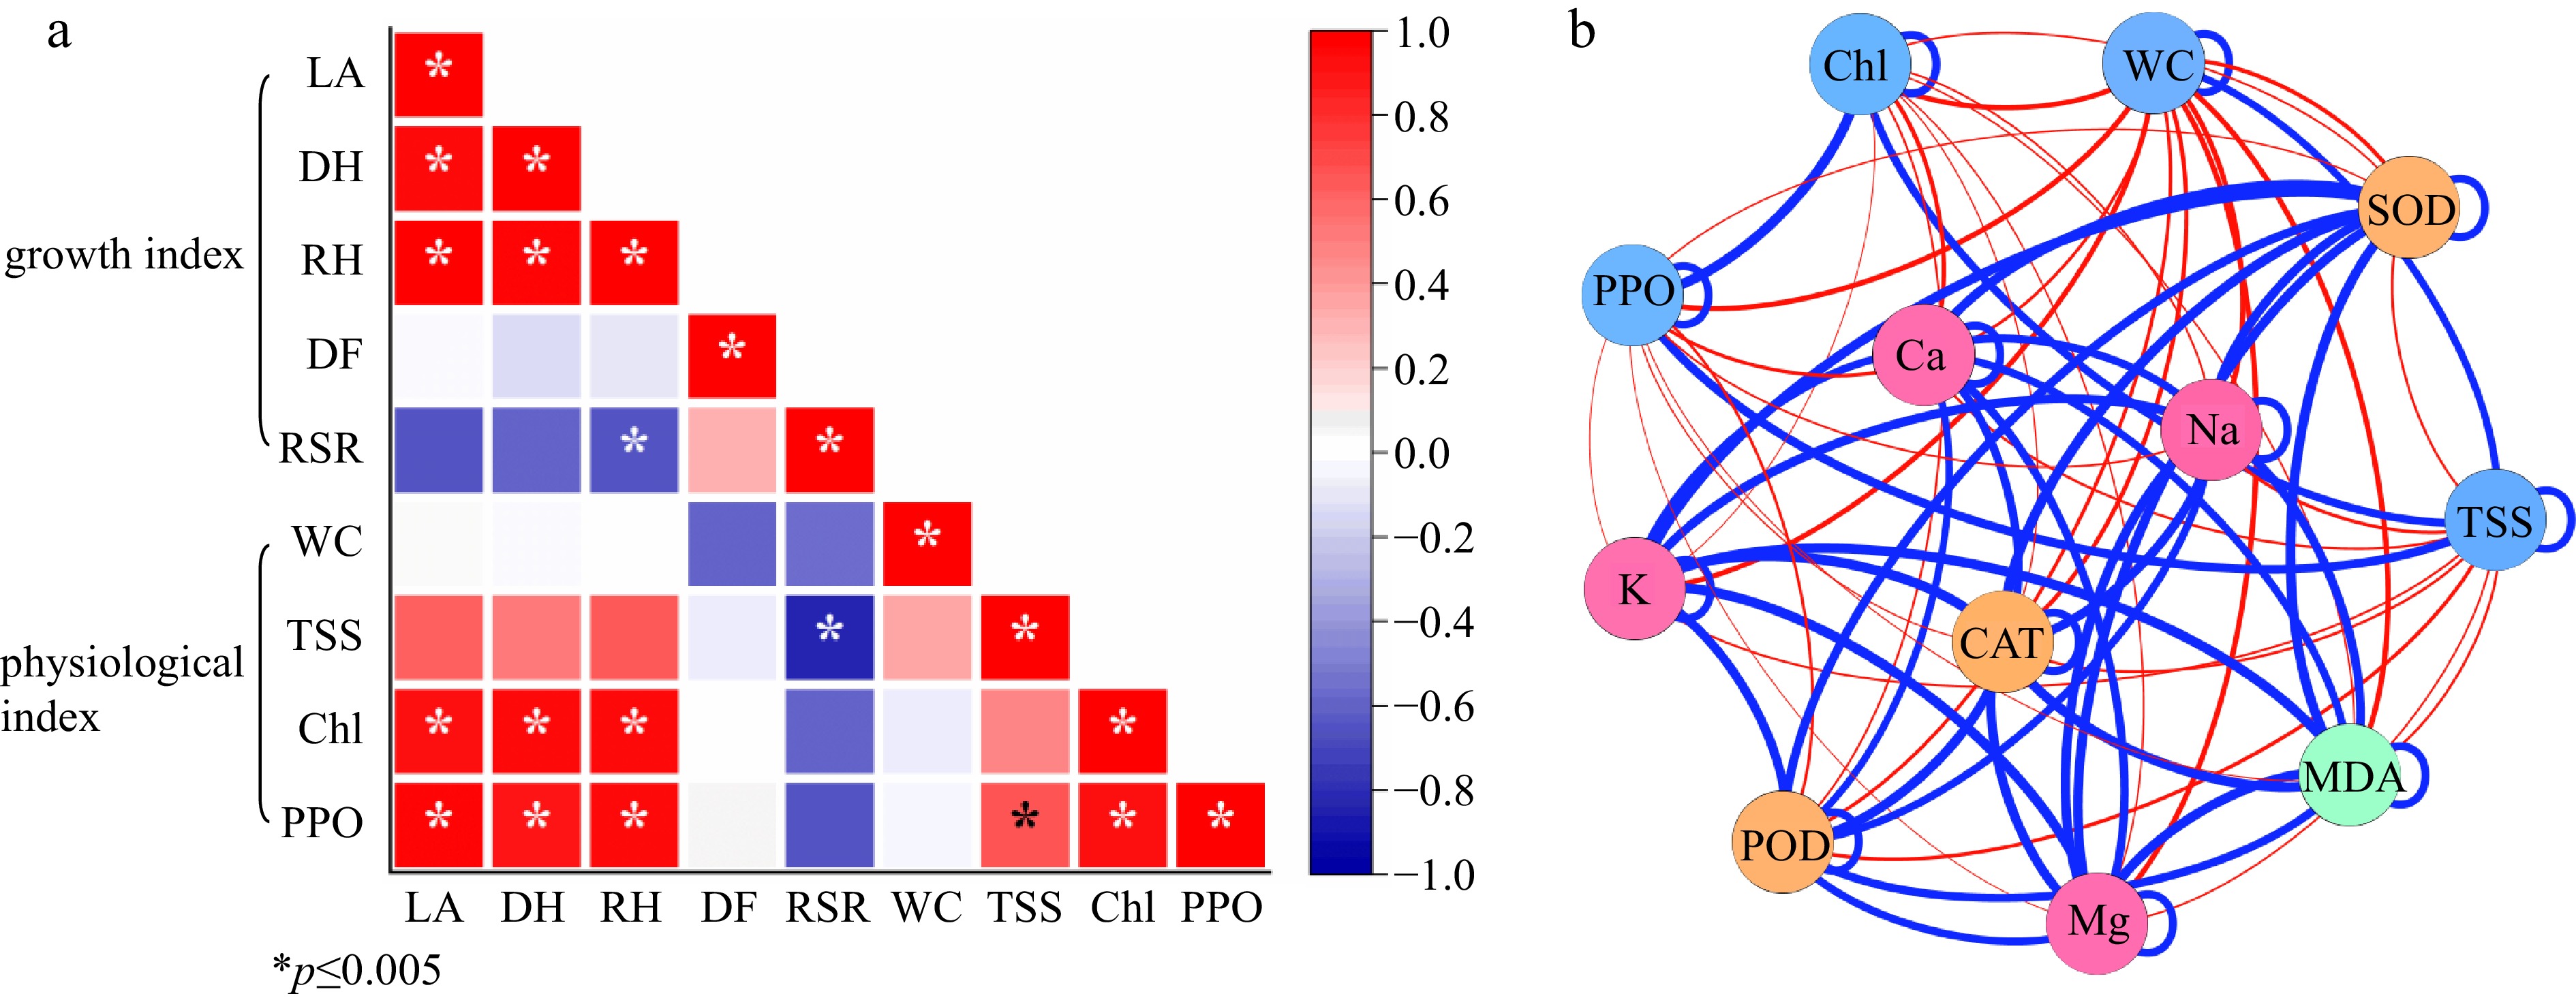
Figure 7.
(a) Correlation analysis and (b) network analysis between different studied factors. LA, DH, RH, DF, RSR indicates leaf area, ground diameter, the growth rate of shoot, the ratio of dry mass to fresh mass, the ratio of underground weight to aboveground weight, respectively; WC, TSS, Chl, PPO indicate water content, total soluble sugar content, Chlorophyll content, polyphenol oxidase activity;* represents significant differences (p < 0.05 according to Tukey's HSD) between SH0, SH1, and SH2.


-
Greenhouse cultivation is an effective method of cultivating high-quality seedlings. However, higher temperatures or stronger light intensity impairs the successful growth of many plants under greenhouse cultivation, especially plastic greenhouse cultivation. The morphological characteristics of many seedlings were the increase of leaf thickness, the reduction of leaf area and plant height, and the serious sunburn of leaves[2,3,14]. In accordance with previous morphological changes, our findings also showed that plastic greenhouse cultivation with no shade net (SH0) inhibited plant height and leaf area and caused serious leaf sunburn (Table 1, Fig. 1). Our finding of MDA content under SH0 further inferred that seedling growth and metabolism were seriously inhibited or damaged even at the cellular level (Figs 2−6), resulting in higher activity of antioxidant enzymes and higher content of minerals to alleviate this damage according to network analysis (Fig. 7). This result suggested that plastic greenhouse cultivation without shading condition was unsuitable to cultivate seedlings of C. paliurus.
Shading practices effectively alleviate or prevent damages in plants under greenhouse cultivation[2,5−8,14]. Our findings further confirmed that suitable shading conditions favor the growth of seedlings. For one reason, growth index and biomass serve as a direct indicator of plant response to environmental conditions[28−30]. Our findings showed that both shading levels (SH1 and SH2) benefited seedling growth, especially two layers of shade net (SH2), where growth index and biomass of seedlings were much better than that under SH0 (Fig. 1, Table 1). Similar findings were reported by Lee et al.[31], who showed that 30% shade promoted plant growth. However, Liu et al.[22] reported that full light intensity conditions resulted in the highest growth and total biomass production of one-year-old C. paliurus plants in an open field, probably because cultivation conditions were different from our study. For another reason, chlorophyll takes part in light utilization and promotes plant growth by improving light interceptions and absorptions and accelerating photosynthetic metabolism[32−34]. In corroboration with previous findings[2,35], our finding further revealed that the chlorophyll content in leaves had a significant positive relationship with plant height and TSS content or PPO activity (Fig. 7). However, the significant decrease of chlorophyll content under SH0 and SH1 may be caused by the serious damage to the cellular membrane, leading to the inhibition of chlorophyll synthesis, the promotion of chlorophyll degradation, or the prevention of the conversion of Chl a to Chl b to a large extent. This was further illustrated by the negative relation between Chl content and MDA content (Fig. 7b). This was in corroboration with the results for rose[8], Azolla microphylla[11] and lettuce[34, 36]. Finally, the change of MDA content under different shading levels further inferred that shading condition was suitable for seedling cultivation by alleviating the damage of adverse conditions. This was shown from the network analysis between MDA and other physiological index (Fig. 7b).
Sugar is a substrate that participates in many biosynthetic processes and energy production in plants, including the regulation of lateral root emergence and development and biosynthesis and degradation of auxin via an interaction with phytochrome[37]. In addition, sugar is also a substrate for sensing and signaling plant systems under biotic or abiotic stress[38]. Sugar can protect olive trees during drought conditions[39,40] and improve C. paliurus seedlings during drought conditions[25]. In the present study, total sugar content in the leaves under three shading levels had no difference (Fig. 2), but TSS content positively correlated with morphological traits (plant height, leaf area) and other physiological components (Chl content, PPO activity), and negatively correlated with RSR (Fig. 7), suggesting that sugar acts as a major integrator for osmotic response to abiotic stress and influences root development by promoting auxin degradation[25,33,37,38,41].
Minerals are indispensable nutrients for the growth and development of plants, and as non-enzymatic antioxidant defense systems, minerals respond to adverse conditions by regulating many physiological activities[42,43]. In our study, the content of four minerals varied in the three parts and had different relationships with physiological index (Figs 5 & 7b). K is essentially for stomatal function, cell expansion, osmoregulation, and cellular or whole-plant homeostasis[44−46]. Mg is the central atom of chlorophyll and enzyme activator for photosynthesis. High K and Mg contents were observed in the leaf under SH0 and SH1, and they had a positive relationship with antioxidant enzymes, but had a negative relationship with Chl content, TSS content or WC (Figs 5 & 7b). This result can be attributed to the transfer of high content of K and Mg from roots to leaves to protect seedlings from high solar radiation. Ca is important for preserving membrane integrity, signaling osmoregulation, and influencing K/Na selectivity[47,48]. This was further inferred from the change of Ca content under different shading levels (Fig. 5). Na improves plant water balance and water use efficiency by modifying stomatal control and contributes to the maintenance of cell turgor and expansion[49]. A decreasing tendency of Na transfer ability from root to stem or leaf was observed with increasing shading levels in our study (Fig. 5).
Enzymatic defense mechanisms (superoxide dismutase (SOD), catalase (CAT), and peroxidase (POD)) have been developed to reduce the negative effects of reactive oxygen species (ROS), which affect plants at the cellular level under stress[50]. In accordance with Feng et al.[25], who reported that C. paliurus seedlings had increased antioxidant enzyme activities under different soil water capacities, higher activities of SOD, CAT and POD were observed in leaf under SH0 in comparison with that under SH2, highlighting the effectiveness of antioxidant enzyme systems in protecting cellular apparatuses under unsuitable conditions. Similar result was also reported in rose[8]. Moreover, SOD activity was much higher than CAT activity and POD activity, and they had positive correlation with MDA and mineral content (Figs 6 & 7b). This indicates that SOD is the main antioxidant enzyme in the enzymatic defense mechanism, and three antioxidant enzymes (SOD, CAT, and POD) participated in alleviating excessive ROS at the cellular level via a cascade mechanism[50] and coordinated non-enzymatic mechanisms (K, Ca, Mg, and Na) to maintain the healthy growth of plants. However, our findings showed that PPO activity under SH0 and SH1 had a lower level compared to that under SH2 and positively correlated with growth index except for RSR (Figs 4 & 7b), inferring that PPO may have another role in seedling growth; however, further experimental investigation is needed to confirm this inference.
-
Cyclocarya paliurus seedlings were cultivated in a plastic greenhouse under three shading levels. The results showed that (1) shading conditions with two layers of shade net (SH2) improved the survival rate and growth of Cyclocarya paliurus seedlings, and seedlings significantly increased plant height, leaf area, and biomass accumulation; (2) in comparison with that under SH0 and SH1, chlorophyll content increased and MDA content reduced significantly under SH2, indicating that suitable shading conditions was beneficial to seedling growth and normal metabolism; and (3) the physiological responses of seedlings varied with shading levels and showed various correlation with seedling growth, indicating that mineral and antioxidant enzymes could coordinate to alleviate or protect seedling from damage under SH0 and SH1, and SOD was the main enzymatic mechanism.
This work was supported by Natural Science Foundation of Fujian province of China (No. 2022J011107), Talent project of Quanzhou city of China (2021C043R) and The college students innovations special project of Fujian province (S202110399065; S202210399049).
-
The authors declare that they have no conflict of interest.
- Copyright: © 2023 by the author(s). Published by Maximum Academic Press, Fayetteville, GA. This article is an open access article distributed under Creative Commons Attribution License (CC BY 4.0), visit https://creativecommons.org/licenses/by/4.0/.
-
About this article
Cite this article
Feng Y, Zhi L, Pan H, Chen Y, Xu J. 2023. Shade improves seedling quality of ornamental Cyclocarya species under plastic greenhouse cultivation. Ornamental Plant Research 3:13 doi: 10.48130/OPR-2023-0013 

Shade improves seedling quality of ornamental Cyclocarya species under plastic greenhouse cultivation
- Received: 21 December 2022
- Accepted: 31 May 2023
- Published online: 29 June 2023
Abstract: Plastic greenhouse cultivation is a widespread and convenient way of cultivating high-quality seedlings, which are often damaged by higher temperatures during summer. Cyclocarya paliurus, a medical and ornamental species with low-quality seedlings, was investigated using three shading levels (treatment with no shade net (SH0), treatment with one layer of shade net (SH1), and treatment with two layers of shade net (SH2)). The growth and physiological responses of seedlings under plastic greenhouse cultivation were investigated from June to September. The results showed that the survival rate of seedlings reached 100%, and seedling growth and biomass were the best under SH2, with higher plant height and leaf area than that under other treatments. Water content of seedlings exhibit not difference between three shading levels, and leaves had the highest water content and total soluble sugar content. The chlorophyll content in the leaf increased, but malondialdehyde content decreased with increasing shading layers. Mineral content were in the following order: calcium > potassium > magnesium > sodium, and the translocation factor decreased with increasing shading layers. Antioxidant enzyme activities were in the following order: SOD > PPO > POD > CAT; their activities decreased with increasing shading layers, except for that of PPO. Various correlation existed between physiological response and seedling growth. Shade improved seedling quality through a series of physiological responses under plastic greenhouse conditions. This study provides a solid foundation for greenhouse cultivation of Cyclocarya species.
-
Key words:
- Cyclocarya paliurus /
- Shade level /
- Growth biomass /
- Physiological characteristics