-
Strawberries (Fragaria × ananassa) are a very popular crop in Japan. Over the past few decades, many June-bearing and ever-bearing varieties have been bred and their cultivation methods actively improved and developed for better fruit quality and higher yield[1]. These techniques have extended the harvest season of strawberries from mid-November to May, with more than 90% of total production grown under forcing/protected or semi-forcing/protected cultivation[2]. In the forcing/protected cultivation, the temperature is controlled to keep plants in a semi-dormant or non-dormant state without exposing them to the low temperature that induces dormancy, to prompt flower bud formation in the simulated winter season. However, it is difficult to control the air temperature in the summer, and the high temperature during the vegetative growth stage induces the inhibition of flower bud formation. Therefore, stable year-round production of strawberries is not possible with the conventional forcing cultivation method.
The plant factory with artificial lighting (PFAL) is a system that cultivates plants efficiently in a completely closed environment using only artificial light such as LEDs while controlling the environmental conditions[3]. So far, a wide variety of plants are studied for their viability in PFAL, such as lettuces[4, 5], herbs[6, 7], medicinal plants[8] and edible flowers[9]. Although leafy vegetables are the major crops in PFALs, fruit vegetables such as tomatoes are also added to the production list[10]. Also, strawberries have been considered as one of the candidate crops in PFAL as they neither require high light intensity nor grow too tall[11]. In fact, studies on strawberry cultivation in a closed environment such as PFAL are actively conducted around the world[11−13]. Year-round constant temperature, a necessary environmental condition that conventional forcing cultivation cannot attain, makes it possible to induce continuous flower bud formation and, therefore, to harvest strawberries throughout the year.
Pollination is essential to plant production and consequently to agriculture[14]. In Japan, strawberry is the fifth most pollinated crop by pollinators and about 80% of the value of pollination services is brought about by reared pollinators[15]. Commercial honeybees are the most commonly used reared pollinators to pollinate strawberries cultivated in greenhouses. In recent years, however, the shortage of pollinators such as honeybees has become a serious problem throughout the world[16]. As a substitute for honeybees, the use of blowflies has drawn attention recently[17, 18]. Even if blowfly is a potential pollinator to replace bees, there remains room for discussion on whether or not it is ethical to use creatures as pollinators only for agricultural production.
In PFALs, if bee pollination were to be used in a completely closed environment, it would bring several risks to the stable production of the PFAL cultivation system. These risks include the development of diseases caused by dead bees, the invasion of bugs that may be present in beehives, and the risk of operators being stung by bees. Moreover, bee pollination is not the most realistic method for 'stable production' in a fully closed environment, as it is extremely difficult to control the bees and manage pollination as the growers want. It is reported that the number of bees per unit area has a great influence on the rate of deformed fruit. For example, more than 20 honeybees/100 m2 damaged the pistils and increased the number of malformed fruits, and less than 3 honeybees/100 m2 also increased unpollinated flowers and caused malformed fruits[19]. On the other hand, when honeybees were used to pollinate 10 different cultivars of strawberries, the incidence of malformed fruit ranged from 23.1% to 76.8%, which means that the rate of normal fruit was 86.9% to 23.2%, varying vastly by cultivar[18]. Therefore, an alternative pollination method that can achieve a 'stable and high pollination rate' (marketable fruit rate higher than 80%) is urgently needed.
Several alternative pollination methods, such as pollination machines or robots, have been researched and developed[20−22]. A strawberry pollination system that uses ultrasonic radiation pressure as a substitute for bee pollination for strawberry cultivation in a plant factory has been developed[23]. However, the long-term influence of ultrasonic on the physiology of strawberry plants has not been researched yet thus far. If robots are used for pollination, risks associated with using bees can be avoided. Some robots are being developed to conduct the pollination movement on a strawberry flower detected by an integrated detection system[24]. This kind of detection system is not only a process of the pollination system but also a tool to collect and accumulate information on scanned plants. Such information could be of great help to monitor and diagnose plants, because it would require much more effort and time if the same work were carried out manually by operators.
The accuracy, quality, and efficiency of pollination directly affect the yield and fruit quality of strawberries and thus the profitability of strawberries produced in PFALs. There are studies that compare the effects of self-pollination, insect or wind pollination, and hand pollination on fruit development and the quality of strawberries, and hand pollination is found to perform the best[25, 26]. If robotic pollination could perform as well as hand pollination, robots can replace bees and other insects in plant factories to pollinate strawberries. However, there has been no study that addresses this issue.
This study aims to evaluate the performance and feasibility of robot pollination and compare its performance with hand pollination. Evaluation is made by examining whether the two pollination methods lead to differences in strawberry fruit quality and yield.
-
The PFAL
The experiment was conducted in a 20 m2 PFAL placed in a laboratory building of HarvestX Inc. in Tokyo, Japan. The PFAL, though small in size, is fully equipped with facilities for air-conditioning, CO2 control, and hydroponic cultivation systems for year-round plant cultivation under perfect environmental control, and four 3-layer cultivation racks (the dimension of one layer; length 1,315 mm, width 362 mm, height 1,315 mm) are placed.
Strawberry plants used
In the PFAL, 120 strawberry plants (10 plants per layer, 30 plants per cultivation rack) (cultivar; 'Yotsuboshi') were planted in August 2020. The plants have kept bearing fruits continuously since then. Of 120 plants, we used 90 strawberry plants (three cultivation racks) in this experiment. It should be noted that it is a usual practice for strawberry cultivation in PFALs to use plants, once planted, for as long as four to five years[27]. As far as the vigor of plants and the state of flowers are concerned, there were no appreciable differences between the first year of cultivation and the start of this experiment.
Environmental conditions
Throughout the experiment, the following environmental conditions were kept. The light intensity in the PPFD was set to 300 µmol·m−2·s−1 provided by white LED lamps (GW45, Kyowa Co., LTD, Osaka, Japan). Air temperature, relative humidity, and CO2 concentration were set to 21 °C (light/dark periods), 60%–80%, and 800 µmol·mol–1, respectively. The plants were irrigated hydroponically with a nutrient solution (Otsuka hydroponic composition, Otsuka Chemical Co. Ltd., Osaka, Japan; Otsuka formula, nutrient contents of which were: N 21%, P2O5 8%, K2O 27%, MgO 4%, CaO 23%, Fe 0.18%, Cu 0.002%, Zn 0.006%, Mo 0.002%, MnO 0.1%, and B2O3 0.1%)[28].
Experiment period
Our experiment took 46 d, from the first pollination on July 12, 2022, to the final harvest on September 2, 2022. The pollination lasted until August 10 and the first harvest commenced on August 2.
Treatments
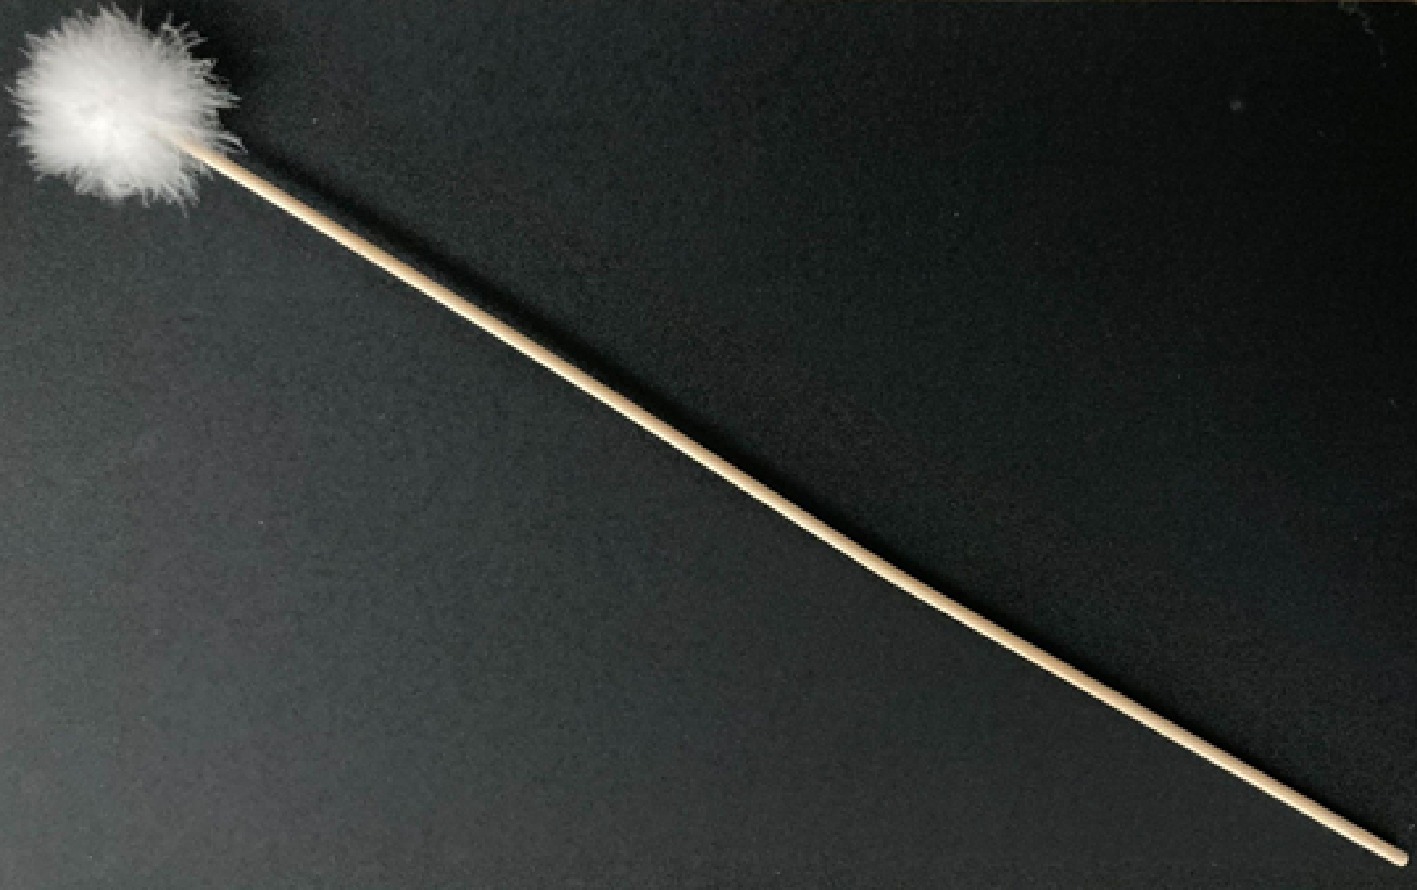
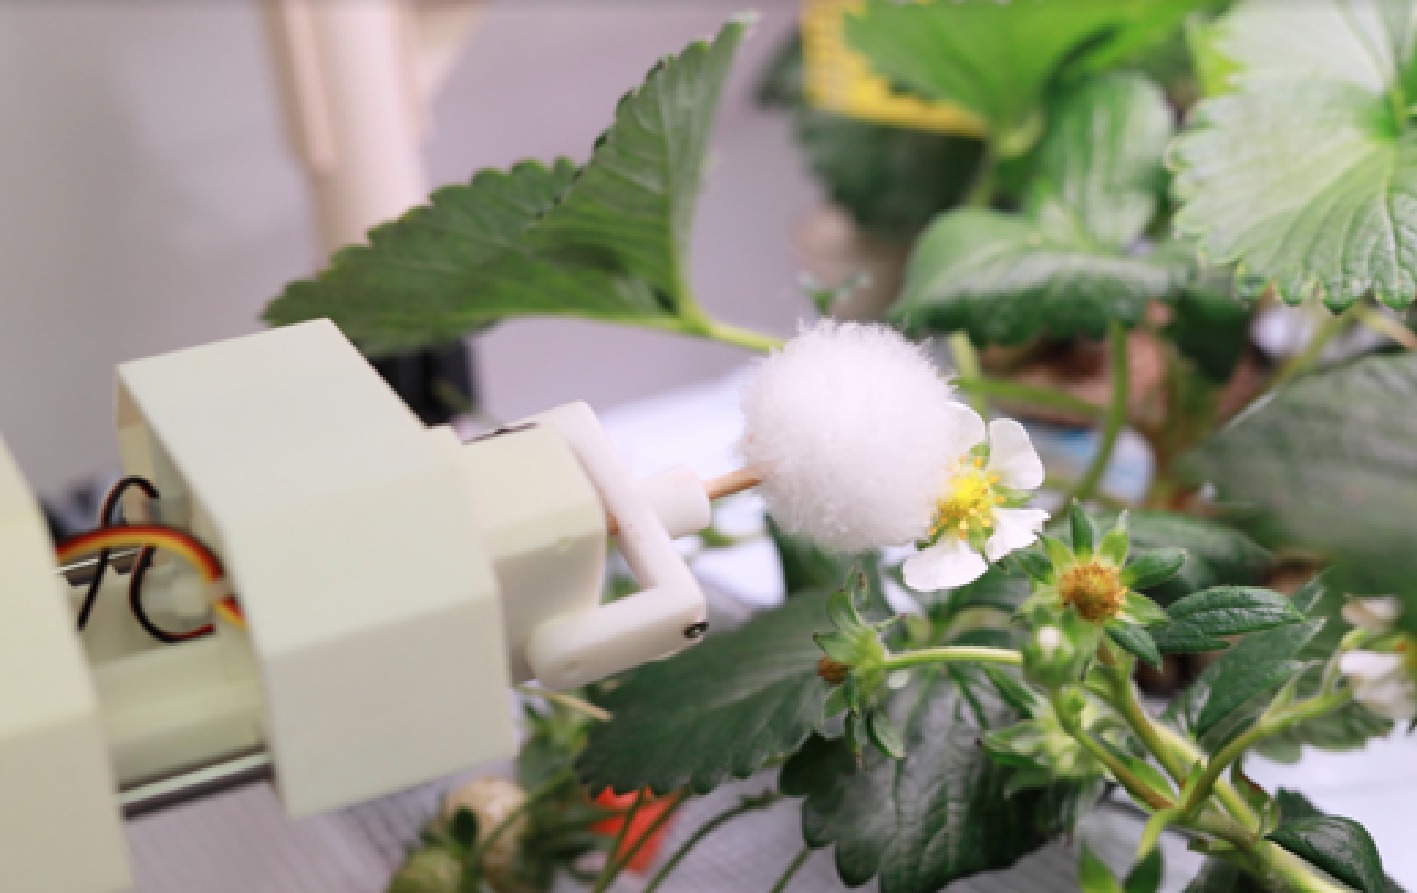
Flowers to be pollinated were selected randomly from their growing sections of the 90 plants as they reached the stage of appropriate pollination, until the number of samples reached 50 for each pollination method. The flowers selected were on the first and second day of anthesis and 20 mm or more in diameter. Each pollinated flower was labeled with an ID tag to avoid repetitive pollination. For both pollination methods, Bonten (Fig. 1: Brahma in English, originally part of an earpick), designed specifically for pollination, was used to pollinate the flowers. For hand pollination, the bundle of feathers of a Bonten was gently placed onto the receptacle of the flower and moved in a circular motion for five seconds. Robot pollination was conducted by a robot (XV3-Unit, HarvestX Inc., Tokyo, Japan), which, moved manually to a randomly selected flower, executed pollination by placing the bundle of feathers of a Bonten onto the receptacle of the flower, and conducted the pollination in a circular motion for five seconds (Fig. 2). The radius of the circular movement of the Bonten is 1.53 mm and the speed is 240 RPM (revolutions per minute).
Measurements
Ripened strawberry fruits were harvested for measurement when completely turned red to the borderline between the flesh and calyx. Right after harvest, we measured the diameter (mm), length (mm), weight (g), and sugar content (Brix%) of each fruit.
The diameter and length of the receptacle, and of the fertilized receptacle (fruit), were measured using a digital caliper at pollination and every week after pollination until harvest, and the volume of receptacle/fruit was estimated as follows: V = R2 × π × L × (1/3), where V = the volume of fruit (cm3), R = the radius of receptacle/fruit (cm), and L = the length of fruit (cm). Brix (%) was measured for each fruit by dripping a few drops of juice squeezed from the strawberry into a digital refractometer (Atago PAL-BX/ACID4, Tokyo, Japan). We also counted the number of unfertilized and fertilized achenes for each fruit (Fig. 3).
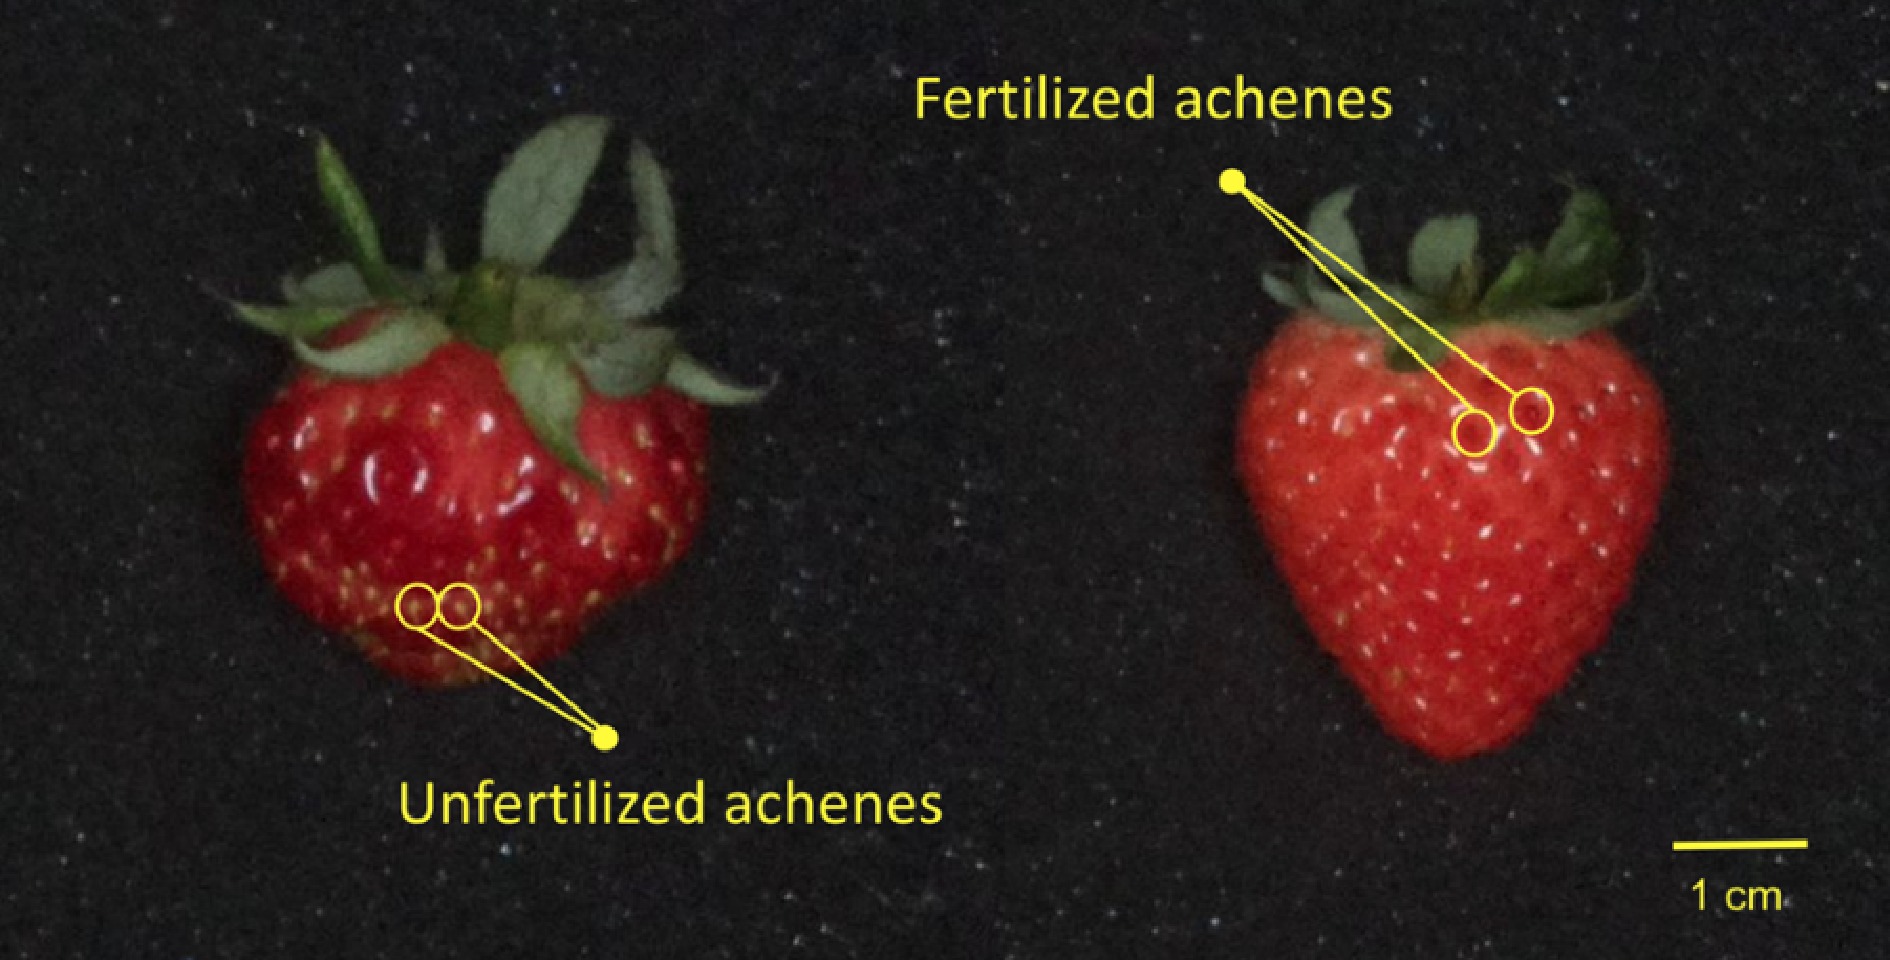
Figure 3.
Fertilized and unfertilized achenes of a sample strawberry. Fertilized achenes are turning red and the fleshy surrounding skin can be observed. Unfertilized achenes are green and the surrounding skin is not enlarged.
Grading
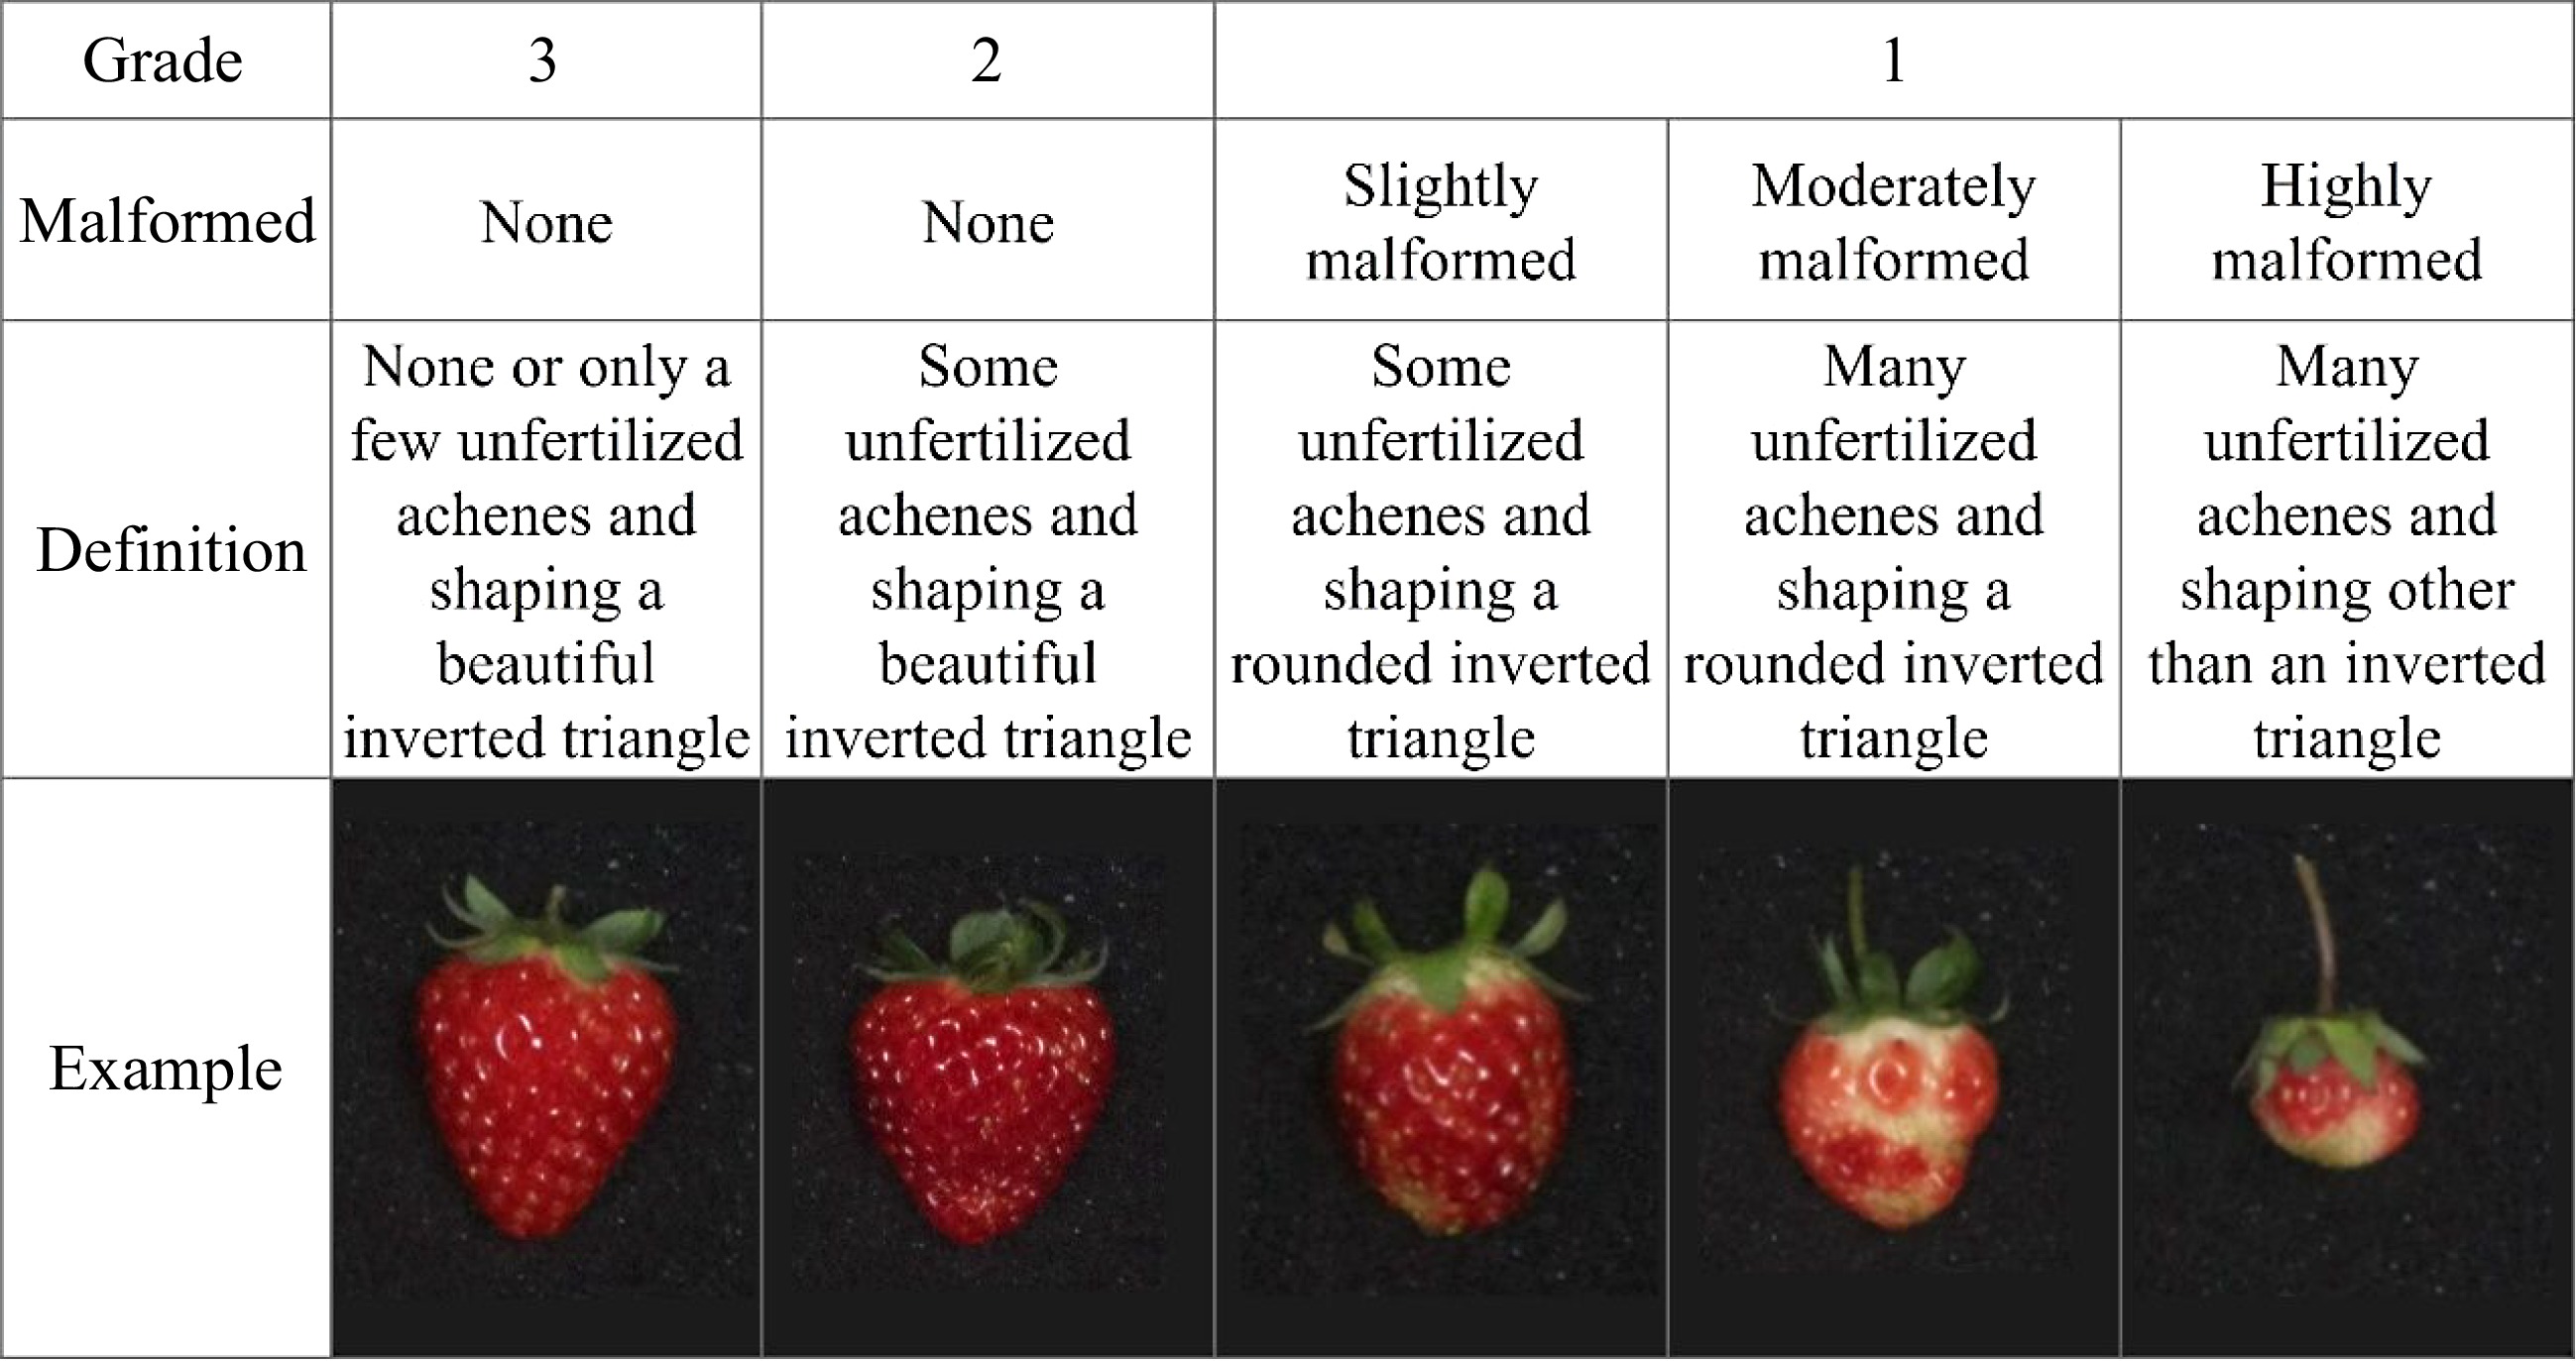
We categorized all the harvested fruits into three grades according to the evaluation criteria explained in Fig. 4. Strawberries of the top two grades are marketable fruits, whereas those of Grade 1 are deformed and unmarketable. It should be noted that the criteria for grading adopted here are shape-appearance-based ones. There are other important criteria for strawberry fruits, such as volume, weight, and sugar content. In the commercial markets for strawberries, the first screening/grading is made based on the shape and appearance (malformity), followed by the second screening/grading based on other criteria. Adopted here are the evaluation criteria of the first screening/grading.
Statistical analysis
-
Statistical methods applied in this study are the analysis of variance (ANOVA), the t-test for simple two-mean comparisons, and multiple-mean comparisons by the Tukey method. As an ancillary statistical test, the χ2 test for testing the independence of two distributions is applied.
-
The direct results of pollination are summarized in Table 1.
Table 1. The results of pollination: distributions of sampled flowers by pollination method.*
Number of flowers/fruits*** Total weight of fruits (g) Hand Robot Hand Robot Fruited flowers** Grade 3 33 (66) (72) 27 (54) (59) 333 (75) 271 (62) Grade 2 6 (12) (13) 11 (22) (24) 60 (14) 128 (29) Grade 1 7 (14) (15) 8 (16) (17) 52 (12) 37 (8) Sub-total 46 (92) (100) 46 (92) (100) 446 (100) 436 (100) Sterile flowers 4 (8) 4 (8) Total 50 (100) 50 (100) * Numbers in parenthesis are percentages. ** For the definition of the grade, see Fig. 4. *** The chi-square test of the distribution of fruited flowers indicates that the null hypothesis that differences in pollination methods are independent of the distribution over the grades is not rejected at p = 0.05 (χ2 = 2.14, D.F. = 2, p = 0.34). For both pollination methods, four flowers out of 50 sampled flowers pollinated ended up sterile. A sterile rate of 8% is considered typical for the strawberry variety used[29]. Although the same number of sterile flowers appeared by hand pollination and robot pollination, respectively, the sterility should be caused by the quality of pollen and pistils[30−32] and therefore not considered to be related to the pollination methods.
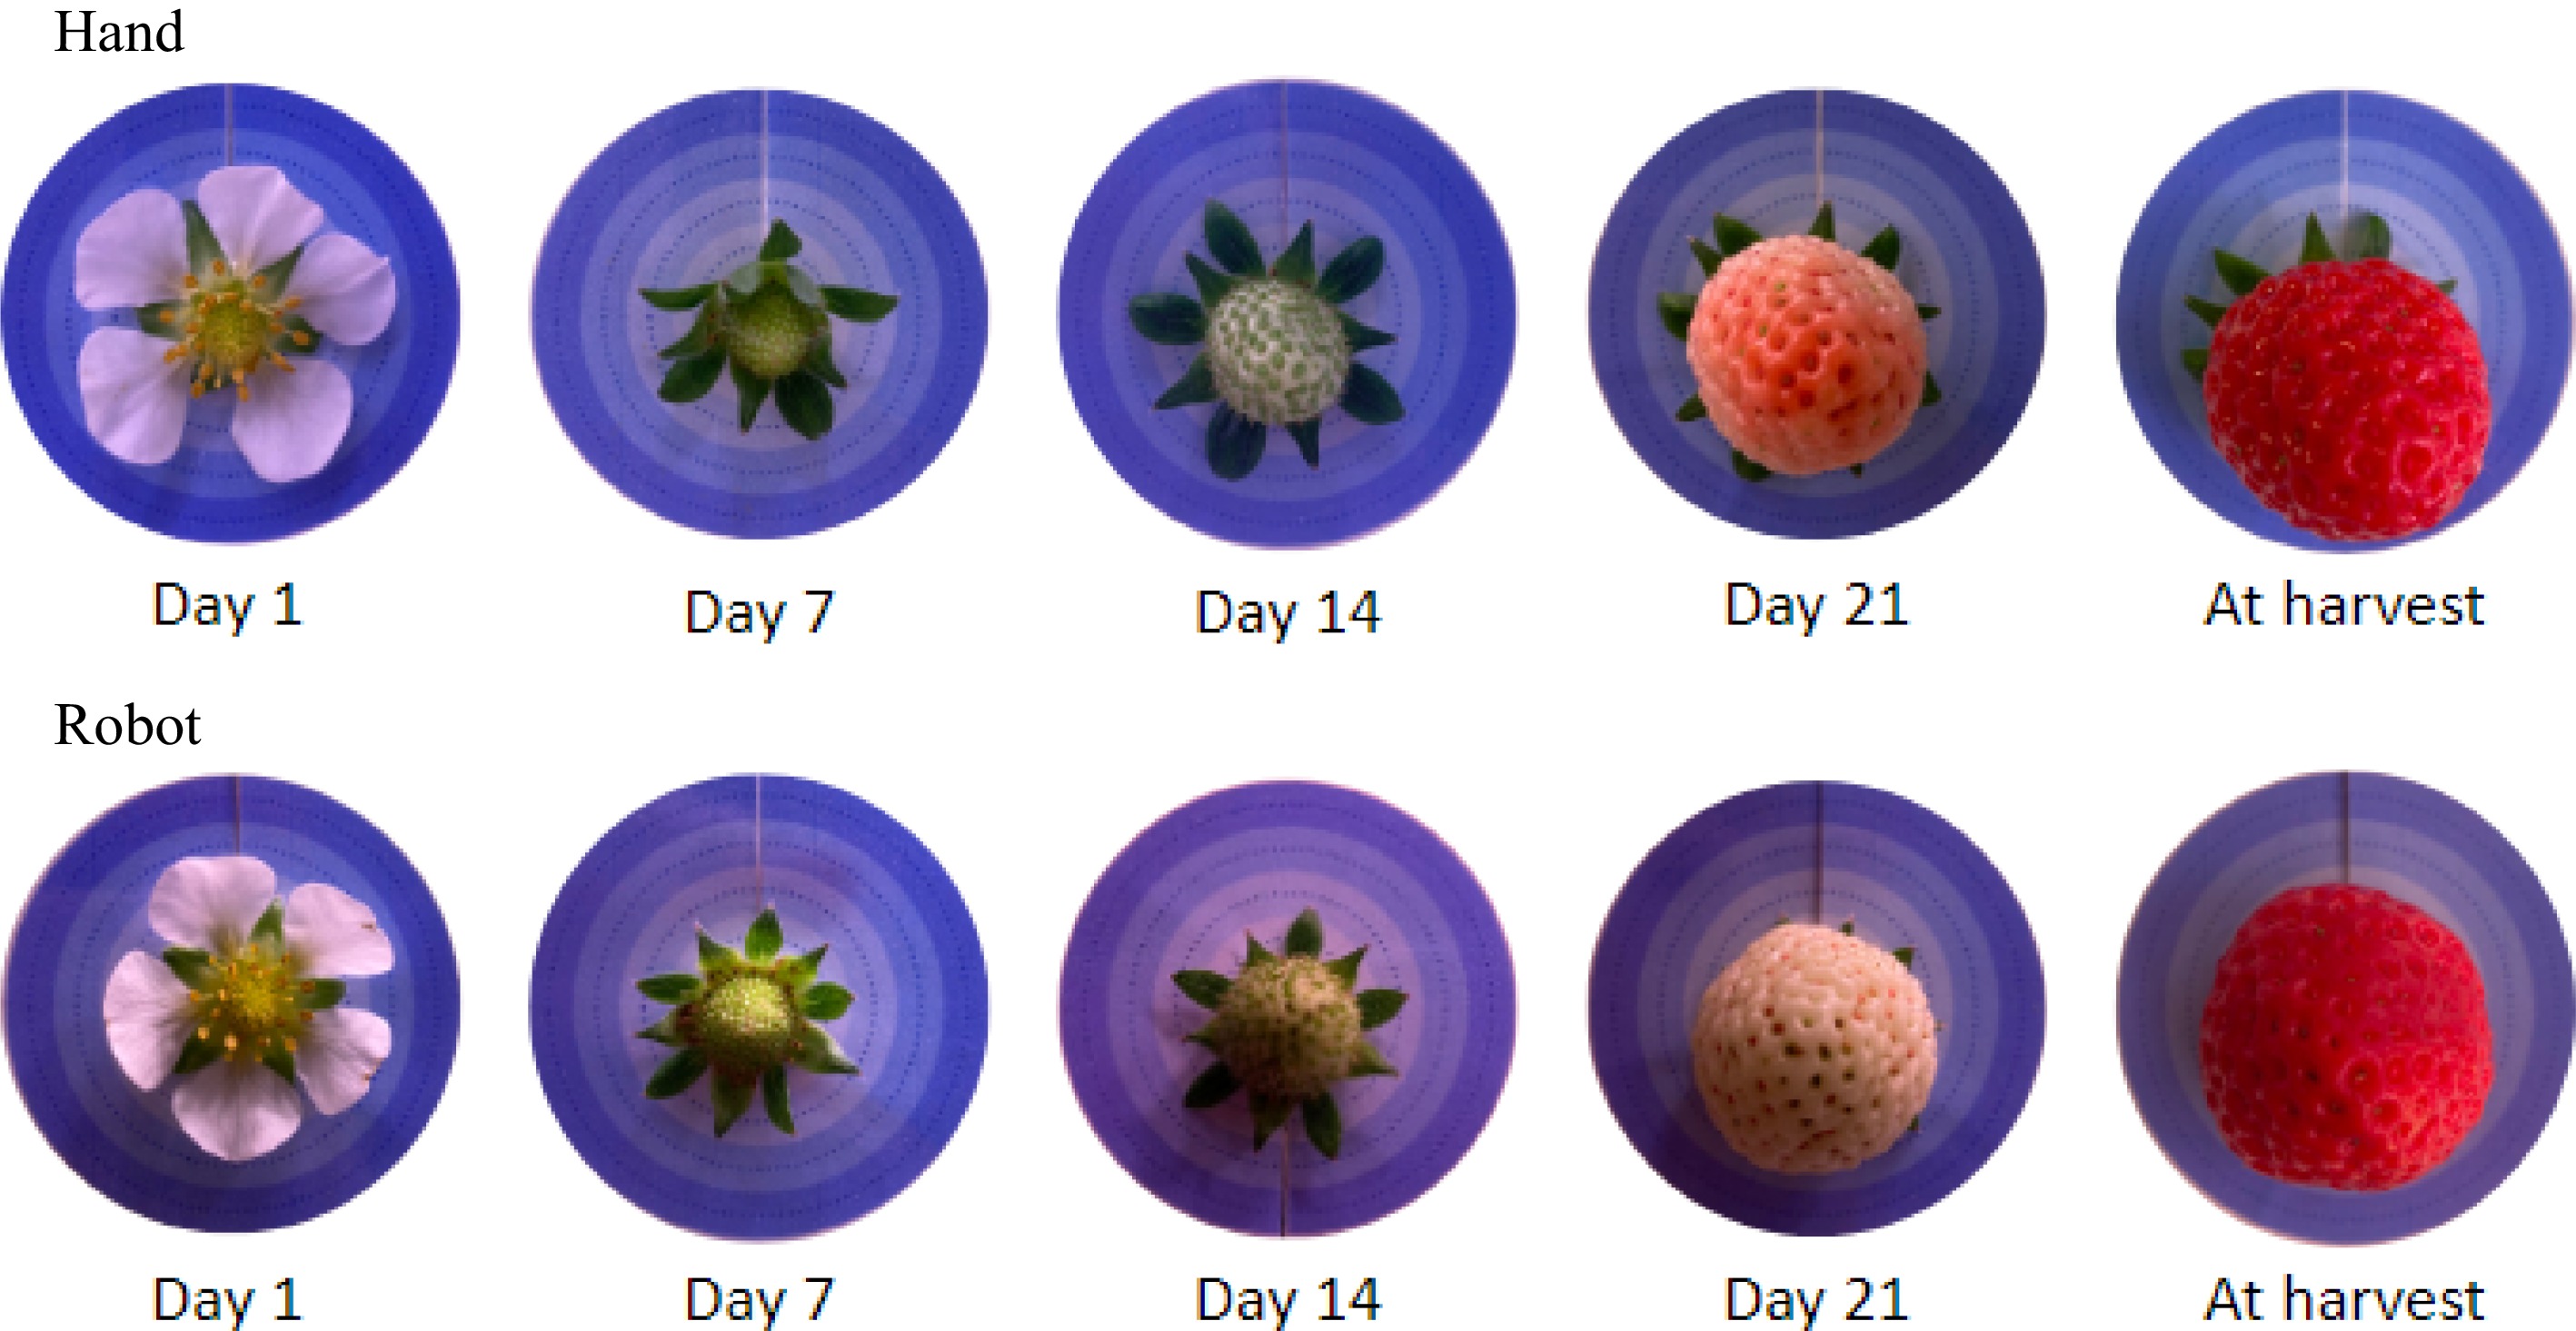
Fruited flowers became fully ripened and harvested, on average, 26 d after pollination. As shown in Fig. 5, it is difficult for eye inspection to distinguish the fully ripened robot-pollinated strawberry from the hand-pollinated one.
Table 1 shows the distribution of fruited flowers by the grade of the ripened fruits graded according to the criteria specified in Fig. 4. The number and weight of fruits that belong to Grade 3 (the highest grade) are both better for hand-pollinated fruits than robot-pollinated ones. The opposite is the case for Grade 2. For the fruits that belong to Grade 1 consisting of malformed fruits, hand pollination records one fruit less than robot pollination, but in terms of weight, robot pollination gives less weight than hand pollination. As a result, the percentage of marketable fruits (Grade 3 + Grade 2) in terms of weight is higher for robot pollination (92%) than for hand pollination (88%). The percentage of nonmarketable fruits in terms of weight is as low as 8% for robot-pollinated fruits.
The χ2-test applied to the hand and robot distributions of the number of fruits in Table 1 indicates that the null hypothesis that differences in pollination methods are independent of the distribution over the quality grades cannot be rejected. If the average grade is computed, treating the grade number as a rank variable, it is 2.57 for hand-pollinated fruits and 2.41 for robot-pollinated fruits, the difference of which is not statistically significant even if with the one-tail t-test.
The percentage of non-marketable fruits of 8% is the lowest record as far as we have searched in the literature on strawberry production in greenhouses and PFALs, only followed by 13%[33]. These results suggest that hand pollination may have an advantage over robot pollination in producing better quality fruits, though the advantage would not be so large, and that, with the low rate of non-marketable fruits, this robot pollination is at a level practically applicable.
Fruit characteristics
ANOVA
-
Table 2 summarizes the results of the two-way ANOVA, with the pollination methods ('Hand' and 'Robot') and the Grade (3, 2, and 1) as factors, applied separately to five fruit characteristics as dependent variables. Five points deserve special mention.
Table 2. The results of ANOVA: the significance probability of fruit grade, pollination method, and their interaction effect, and the ratio of the residual variation to the total variation, for the five fruit characteristics.*
Factor Variation ratio Grade of fruits Pollination method Interaction effect Residual/Total*** Significance provability** Fruit weight (g/fruit)) 8.2E-04 0.646 0.260 0.811 Fruit volume (cm3/fruit) 0.001 0.596 0.316 0.945 Brix (%) 0.081 0.483 0.763 0.934 Number of achenes (no./fruit) 0.491 0.996 0.702 0.971 Percentage of fertilized achenes (%) 1.3E-13 0.027 0.431 0.469 * The degree of freedom is 2 for the grade, 1 for the pollination method, 2 for the interaction effect, 86 for the residual, and 91 for the total variation.
** For p < 0.001, probabilities are expressed in an index form, such as 8.2E-04, which stands for 8.2 × 10⁻⁴. The probability of less than the critical level of p = 0.05 is expressed in bold letters.
*** The variation ratio, residual/total, means the share in the total variation of the variation that is not explained by the factors.First, the difference (variation) in the pollination method does not give any statistically significant effect on any of the first four fruits characteristics in the table, neither independently nor in interaction with the Grade. Second, an exception for these results is the percentage of fertilized achenes in the total number of achenes, on which difference in the pollination method gives an effect statistically significant at p < 0.05. This is an important result because the significant effect that robot pollination gives on the percentage of fertilized achenes is negative. The simple correlation coefficient (r) between the percentage of fertilized achenes and a robot dummy variable (robot-pollination = 1 and hand-pollination = 0) is r = −0.22.
Third, the differences in Grade give statistically significant effects on the weight and volume of fruits and the percentage of fertilized achenes in the total number of achenes. Fourth, Brix and the number of achenes are characteristics affected neither by the difference in the Grade nor the pollination method.
Fifth, the ratio of the total variation of the dependent variable accounted for by the variations of the factor to the total variation, which is (1 - Residual/Total), is less than 10% for the volume, the Brix, and the number of achenes, 19% for the weight, and 53% for the percentage of fertilized achenes. The high percentage of the last characteristic is due to the high positive correlation between the percentage of fertilized achenes and the Grade levels (r = 0.7), which is brought about because the percentage of fertilized achenes is an important criterion in the grading of fruits (Fig. 4).
Mean comparison
-
The means of the five fruit characteristics are compared in Table 3 by the pollination method and Grade.
Table 3. The means and coefficient of variations (CV) of the weight, volume, and brix of strawberry fruits, the total number of achenes per fruit, and percentage share of fertilized achenes in the total achenes, by pollination method and grade.*
Hand Robot 1/2 Mean 1 CV (%) Mean 2 CV (%) Fruit weight (g/fruit) Grade 3 10.1a 38.9 10.0a 31.7 1.01 Grade 2 10.0ab 37.0 11.6a 42.5 0.86 Grade 1 7.50ab 61.9 4.60b 62.8 1.63 Fruit volume (cm3/fruit) Grade 3 6.84a 46.8 6.58a 33.9 1.04 Grade 2 6.84ab 39.9 7.98a 48.9 0.86 Grade 1 4.84ac 64.2 2.77bc 68.6 1.75 Brix (%) Grade 3 9.36a 12.7 9.35a 13.2 1.00 Grade 2 9.38a 10.6 9.55a 8.7 0.98 Grade 1 9.87a 8.9 10.3a 11.5 0.95 Number of achenes (no./fruit) Grade 3 144a 32.3 133a 25.3 1.08 Grade 2 131a 38.8 140a 40.2 0.94 Grade 1 122a 55.9 125a 28.3 0.98 Percentage of fertilized achenes (%) Grade 3 81.5a 17.6 78.2a 19.6 1.04 Grade 2 60.3ab 45.7 47.0bc 36.1 1.28 Grade 1 43.9bc 55.4 30.5c 67.9 1.44 * Of the six means for each characteristic, the means followed by the same alphabet letter are not statistically different at p < 0.05 (tested by the Tukey method). The weight and volume of fruits are both important characteristics that positively affect the marketability of strawberries. For the means of these two characteristics of the fruits that belong to the two marketable-fruit grades, Grades 3 and 2, there are no statistically significant differences among the four means, not only between the two pollination methods but also between Grade 3 and Grade 2. For the unmarketable malformed fruits of Grade 1, the mean weight of robot-pollinated fruits (4.6 g) is different statistically significantly from those of Grade 2 (11.6 g) and Grade 3 (10.0 g). For the hand-pollinated fruits, the mean weight of malformed fruits of Grade 1 is lighter than those of Grade 2 and Grade 3, but the differences are not statistically significant. The means of fruit volume are subject to the same difference pattern. These results indicate that the significant mean difference between marketable and non-marketable robot-pollinated fruits makes the grade a significant factor in the ANOVA of weight and volume in Table 2. For these two characteristics, the variations among the fruits within the six categories, measured by the coefficient of variation, are large, particularly for the fruits of Grade 1. However, for each grade, there are no appreciable systematic differences in the degree of variation between the two pollination methods.
The average weight of marketable fruits in this study (Grades 3 + 2 for Hand + Robot) is 10.3 g/fruit. The strawberry cultivar used, 'Yotsuboshi,' was developed in the mid-2010s. The developers of this variety introduced it as having fruits of medium to small size, good triangular pyramid shape, and high redness[34], which are the characteristics of the marketable fruits (Grade 3 and Grade 2) in our experiment (Fig. 3 & 4). A difference from our study was the fruit weight, which is reported 20 g/fruit on average. The weight of our fruits is lighter because plants constantly, as explained earlier, keep bearing fruits for more than one year. The fruit size becomes smaller as harvest proceeds to lower inflorescences[33, 35]. It should be emphasized that strawberries of smaller sizes are not necessarily handicapped in the consumer market. Strawberries of around 10 g/fruit are categorized as small to medium sizes according to the shipping standard in Japan and are widely distributed in the market. It is reported that 'Yotsuboshi' strawberries of this size command good prices[36].
The sugar content (Brix%) of fruits, on average 9.5%, is a stable characteristic that does not vary, not only between the pollination methods but also across grades. The variation among the fruits in each category is also relatively small. It is even stable across cultivars. Among the popular strawberry cultivars in the Japanese consumer market, those with a sugar content of 9-10% far exceed the majority[37].
The total number of achenes per fruit is another characteristic that is affected neither by the pollination methods nor by the grades, although the variation among fruits is larger than in the case of Brix. It has been reported that pistil differentiation occurs during the flower bud differentiation stage, indicating that the number of total achenes is determined before pollination[38]. Therefore, the total number of achenes would not be affected by the pollination methods.
Since the percentage of fertilized achenes in the total achenes per fruit is a criterion in the shape-based grading adopted in this study, the means decline as the grade becomes lower for both hand and robot pollination. The mean difference between Grade 3 and Grade 1 is statistically significant for both pollination methods. For hand-pollinated fruits, the mean of Grade 2 is not statistically distinguishable from those of Grade 3 and Grade 1, while for robot-pollinated fruits, the mean of Grade 2 is statistically different from that of Grade 3 but not distinguishable from that of Grade 1. For this characteristic, the ANOVA reveals that robot pollination gives a statistically significant negative effect on this variable (Table 2). The mean difference between the two pollination methods by Grade is not statistically significant for all three grades (Table 3). Unlike other characteristics, however, the mean of hand-pollinated fruits is consistently higher than that of robot-pollinated fruits for all three grades. These systematic differences make the pollination method a significant factor in the ANOVA. Whether pollination satisfactory goes well for robot pollination matters here.
Webb et al., studying English strawberry cultivars, found that there were commonly eight achenes per cm2 of the surface of strawberry fruits produced in good commercial cultivation[35]. The mean surface areas of robot-pollinated Grade 3 and Grade 2 fruits in this study are 15.5 cm2 (radius = 1.54 cm, length = 2.80 cm) and 17.5 cm2 (radius = 1.65 cm, length = 2.93 cm), respectively, and their standard achene number reproduces the total number of achenes almost exactly; 124 and 139 per fruit, respectively, for the actual numbers of 133 and 140 per fruit (Table 3). Applying the percentage of fertilized achenes (Table 3), the mean numbers of fertilized achenes per robot-pollinated fruits are 104 for Grade 3 and 66 for Grade 2. Webb et al. also established well that the number of achenes on a strawberry fruit is highly correlated with the weight of the fruit[35]. SPRIAF (2005) reports that the number of fertilized achenes for two medium- to small-sized commercially popular strawberry cultivars is 108 and 85 per fruit of 12.6 and 10.9 g, respectively[33]. As far as Grade 3 fruits are concerned, the performance in producing fertilized achenes of the robot-pollinated strawberries in our experiment in the PFAL is comparable to the performance of similar-sized strawberry cultivars in greenhouses with bee-pollination.
Prospects for improving robot pollination
-
Though not statistically significant, robot pollination tended to have a lower percentage of the highest grade (Grade 3) fruits than hand pollination (Table 1). Though not statistically significant also, the number of fertilized achenes is consistently less for robot pollination than for hand pollination for all three grades (Table 3). This might have indeed been caused by the dimensional difference of the movement of the pollination methods. The movement of the robot toward flowers is uniform and 2-dimensional. In contrast, the movement of hand pollination can be back and forth, i.e., 3-dimensional, adjusting flexibly depending on each flower. In other words, depth is added to the 2-dimensional movements in hand pollination. The results of our experiment indicate that such a difference, if any, does not result in any significant difference in the grade of strawberries between the two pollination methods. Improving the pollination accuracy by applying such depth into the robot pollination movement and allowing the movement flexibility depending on flowers, the percentages of higher grades could be increased.
The strawberry plants used in this experiment were regularly pruned to adjust the number of leaves so that the flower clusters would be brought to the front side. This prevented the flowers and fruits from being hidden by the leaves. While bees can move freely around plants and spatially recognize flowers, the robot uses a fixed RGB camera to detect flowers. If leaves are not pruned regularly, the robot may not be able to detect flowers well, and thus may not perform successful pollination. Should this pollination robot be adopted in other strawberry-growing environments, it would be necessary to be combined with regular pruning.
-
In this study, we assessed, in comparison with hand pollination, the feasibility of robot pollination in producing quality fruits in strawberry production in PFALs. There were no differences in the percentages of marketable and non-marketable fruits between the two pollination methods. For robot-pollinated fruits, the percentage of unmarketable, malformed fruits to be scrapped is less than 10%, a level rarely attained by any method of pollination. Of the five fruit-quality-related characteristics examined, no statistically significant differences were found between the two pollination methods in weight, volume, sugar content, and the number of achenes. The percentage of fertilized achenes in the total number of achenes was the only characteristic for which robot pollination showed some systematically inferior results relative to hand pollination, though not statistically significant if the comparison was made for the fruits in the same grade. Although robot pollination, as it is, is not perfectly comparable to or exceeded manual pollination yet, it has already reached a level of practical use to solve the problem of pollination by bees. Slight improvements to add the robot pollination 3-dimensional flexible movements would make it possible to replace hand or bee pollination with equal or even better performance as far as the quality of strawberry fruits are concerned.
-
The authors declare that they have no conflict of interest. Na Lu is the Editorial Board member of Technology in Horticulture. She is blinded from reviewing or making decisions on the manuscript. The article was subject to the journal's standard procedures, with peer-review handled independently of this Editorial Board member and her research groups.
- Copyright: © 2023 by the author(s). Published by Maximum Academic Press, Fayetteville, GA. This article is an open access article distributed under Creative Commons Attribution License (CC BY 4.0), visit https://creativecommons.org/licenses/by/4.0/.
-
About this article
Cite this article
Nishimoto Y, Lu N, Ichikawa Y, Watanabe A, Kikuchi M, et al. 2023. An evaluation of pollination methods for strawberries cultivated in plant factories: robot vs hand. Technology in Horticulture 3:19 doi: 10.48130/TIH-2023-0019
An evaluation of pollination methods for strawberries cultivated in plant factories: robot vs hand
- Received: 03 June 2023
- Accepted: 21 July 2023
- Published online: 08 September 2023
Abstract: The cultivation of strawberries in plant factories with artificial lighting (PFAL) has recently been recognized as it makes pesticide-free and stable year-round production possible. Conventional strawberry cultivation uses bees for pollination. Considering the global decline in bee populations and the difficulty of managing these living creatures in a closed environment, it is essential to establish an efficient and sustainable alternative for pollination in PFAL. This study investigated the feasibility of robotic pollination in PFAL by comparing the effects of hand and robot pollination on strawberry fruit quality and yield. No differences between the two pollination methods were found in the percentages of marketable and non-marketable fruits. Also, there were no differences in weight, volume, sugar content, and the number of achenes among the fruits of the same grade. Although robot pollination, as it is, is not perfectly comparable to or exceeds manual pollination yet, it has already reached a level of practical use to solve the problem of pollination by bees.
-
Key words:
- Bee pollination /
- Fertilization rate of achenes /
- Fruit quality /
- Marketable fruit /
- Sustainability


