ARTICLE   Open Access    

Challenges in breeding and selecting Passiflora edulis f. flavicarpa × P. incarnata hybrids

More Information
  • Passiflora is comprised of many species, with P. edulis being the prominent commercial species. Another species that grows in more temperate regions is P. incarnata. Breeding to create interspecific hybrids with these two species has been done before but without longstanding success. Controlled crosses of P. edulis f. flavicarpa × P. incarnata were made to generate baseline data on interspecific passionfruit hybrids that can survive subtropical and temperate winters. The number of fruits collected per individual hybrid selection ranged from 4 to 52. Some fruits produced no seeds whereas others averaged more than 25 seeds per fruit. Pulp weight ranged from 0 to 10 g, with two individuals above 10 g. Many vines had poor pulp percentage (< 25%). A few were over 30% and two individuals were over 40%. The average width of fruit ranged between 32 and 46 mm. The overall shapes were similar among fruits. Vines with P. incarnata from Illinois (USA) as a parent produced fewer seeds, lower total fruit weight, shorter height, smaller width, lower fruit density, lighter pulp weight and pulp percentage. The vines with P. incarnata from Oklahoma (USA) as a parent made more seeds, longer height, and a more elongated shape than the other two pollen parents. Mississippi-based P. incarnata vines had the greatest average total fruit weight, hull weight, fruit width, and fruit density. Based on the results of this study, there is reason to be cautiously optimistic about interspecific hybrid Passiflora involving P. incarnata. Creating more generations with backcrossing to P. edulis is the next logical step in the process.
  • Agricultural management practices impact soil physicochemical properties to a remarkable extent. Degradation of soil health has led to a contraction in agricultural production and soil biodiversity particularly due to conventional farming practices, indiscriminate use of inorganic fertilizers (INF) and inadequate input of residues[1]. Organic or inorganic fertilizers have been regarded as a critical component of agriculture to accomplish global food security goals[2]. The exogenous supply of fertilizers could easily alter soil properties by restoring the nutrients that have been absorbed by the plants[2]. Thus, implementing adequate nutrient management strategies could boost plant yield and sustain plant health. Tillage affects the soil, especially for crop production and consequently affects the agro-ecosystem functions. This involves the mechanical manipulation of the soil to modify soil attributes like soil water retention, evapotranspiration, and infiltration processes for better crop production. Thus, tillage practices coupled with fertilizer inputs may prove a viable strategy to improve soil health components such as nutrient status, biodiversity, and organic carbon.

    Soil serves as a major reservoir of nutrients for sustainable crop production. Intensive cultivation due to growing population burden has led to the decline of soil nutrient status that has adversely affected agricultural production. Various researchers have assessed the soil nutrient budget and the reasons behind decline of nutrient content in soil[3]. Soil management strategies have assisted in overcoming this problem to a greater extent. Tillage practices redistribute soil fertility and improve plant available nutrient content due to soil perturbations[4]. Different tillage and fertilization practices alter soil nutrient cycling over time[5]. Fertilization is an important agricultural practice which is known to increase nutrient availability in soil as well as plants[6]. A report has been compiled by Srivastava et al.[7], which assessed the effectiveness of different fertilizers on soil nutrient status in Indian soils.

    Soil biota has a vital role in the self-regulating functions of the soil to maintain soil quality which might reduce the reliance on anthropogenic activities. Soil microbial activities are sensitive to slight modifications in soil properties and could be used as an index of soil health[8]. Maintenance of microbial activity is essential for soil resilience as they influence a diverse range of parameters and activities including soil structure formation, soil SOM degradation, bio-geochemical cycling of nutrients etc.[9]. Various researchers have identified microbial parameters like microbial biomass carbon (MBC), potentially mineralizable nitrogen (PMN), soil respiration, microbial biomass nitrogen (MBN), and earthworm population as potential predictors of soil quality. Geisseler & Scow[10] have compiled a review on the affirmative influence of long-term mineral fertilization on the soil microbial community.

    Being the largest terrestrial carbon (C) reservoir, soil organic carbon (SOC) plays a significant role in agricultural productivity, soil quality, and climate change mitigation[11]. Manure addition, either solely or along with INF augments SOC content which helps in the maintenance and restoration of SOM more effectively as compared to the addition of INF alone[12]. Enhancement of recalcitrant and labile pools of SOC could be obtained through long-term manure application accentuating the necessity of continuous organic amendments for building up C and maintaining its stability[13]. Generally, compared with manure addition, INF application is relatively less capable of raising SOC and its labile fractions[14]. Alteration in SOC content because of management strategies and/or degradation or restoring processes is more prominent in the labile fraction of soil C[15]. Several fractions of soil C play vital roles in food web and nutrient cycles in soils besides influencing many biological properties of soil[16]. Thus, monitoring the response of SOC and its fractions to various management practices is of utmost importance.

    A positive impact on SOC under manure application coupled with INF in rice-wheat systems has been reported, as compared to sole applications of INFs[17]. Although ploughing and other mechanical disturbances in intensive farming cause rapid OM breakdown and SOC loss[18], additional carbon input into the soil through manure addition and rational fertilization increases carbon content[13]. Wei et al.[19] in light sandy loam soil of China found that the inclusion of crop straw together with inorganic N, P and K fertilizers showed better results for improving soil fertility over sole use of inorganic fertilizers. Zhu et al.[20] studied the influence of soil C through wheat straw, farmyard manure (FYM), green manure, and rice straw on plant growth, yield, and various soil properties and found that the recycling of SOM under intensive cultivation is completely reliant on net OM input and biomass inclusion. However, most of the studies on residue management and organically managed systems could not provide clear views regarding the relations between the quality of OM inputs and biological responses towards it. The disintegration of soil aggregates due to ploughing, use of heavy machinery, and residue removal has been reported widely under conventional tillage (CT) practices[21]. On the contrary, improvement in SOC stabilization has also been observed by some scientists[22]. Under CT, the disintegration of macro-aggregates into micro-aggregates is a prominent phenomenon, while conservation tillage has been identified as a useful practice for increasing macro-aggregates as well as carbon sequestration in agricultural soils[23]. By and large, the ploughing depth (0–20 cm) is taken into consideration for evaluating the impact of tillage and straw retention on soil aggregation[24], while degradation in deeper layers of soil is becoming a major constraint towards soil quality together with crop yield[25].

    Hence, the present review would be useful in determining how tillage practices and inorganic and organic fertilization impact nutrient availability in the soil, microbial composition and SOC fractions besides stocks under different land uses.

    Agricultural production is greatly influenced by nutrient availability and thus nutrient management is required for sustaining higher yields of crop. The term 'nutrient availability' refers to the quantity of nutrients in chemical forms accessible to plant roots or compounds likely to be converted to such forms throughout the growing season in lieu of the total amount of nutrients in the soil. For optimum growth, different crops require specifically designed nutrient ratios. Plants need macronutrients [nitrogen (N), phosphorus (P), potassium (K) in higher concentrations], secondary nutrients [calcium (Ca), magnesium (Mg), sulphur (S) in moderate amounts as compared to macronutrients] and Micronutrients [Zn (zinc), Fe (iron), Cu (copper), B (boron), Mn (manganese), Mo (molybdenum) in smaller amounts] for sustainable growth and production[26]. Fertilizers assist the monitoring of soil nutrient levels by direct addition of required nutrients into the soil through different sources and tillage practices may alter the concentration of available plant nutrients through soil perturbations. Various studies on the influence of fertilization and tillage practices on available plant nutrients have been discussed below.

    Yue et al.[27] reported that long-term fertilization through manure/INF improved the macronutrient content of Ultisol soil in China. Two doses of NPK (2NPK) considerably improved soil properties over a single dose (NPK). Combined application (NPK + OM) resulted in higher hydrolysable N and available P over the sole OM application. The total K content was higher under the treatments NPK, 2NPK and NPK + OM than sole OM treatment, whereas available K was higher in treatments NPK + OM and 2NPK over the sole OM and NPK. Likewise, OM, INF, and OM + INF were evaluated for their potential to regulate the soil macronutrient dynamics. Organic manure significantly improved the soil N content, whereas INF showed comparable results to that of the control treatment. Besides, all the treatments improved available P and exchangeable K concentration[28].

    Hasnain et al.[29] performed comparative studies of different ratios of INF + compost and different application times for the chemical N fertilizer on silty loamy soils of China. The available nitrogen and phosphorous content were greater in conjoint OM + INF application over the bare INF and control application irrespective of N application time. Soil quality substantially improved with increasing ratio of compost and 70:30 (INF to compost ratio) was found to be most suitable to maintain soil fertility and nutrient status. Another study by Liu et al.[30] reported the superior effects of NPK + pig manure and NPK + straw to improve soil available P and K over the control and sole NPK treatments. However, total N concentration did not exhibit any significant variation under any treatment.

    Shang et al.[31] accounted the positive impact of vermicompost and mushroom residue application on grassland soil fertility in China. The addition of organic manures improved available P and K content to a considerable extent. Under moisture-deficit winter wheat-fallow rotation, another study quantified the influence of residue management approaches and fertilizer rate on nutrient accrual. Residue burning resulted in no decline in soil macronutrient content, whereas the perpetual addition of FYM for 84 years significantly improved total N and extractable K and P concentration. Thus, residue incorporation along with FYM application may prove beneficial in reducing the temporal macronutrient decline[32].

    Ge et al.[33] examined the effects of NPK and NPK along with manure (NPKM) addition on the macronutrient status of Hapli-Udic Cambisol soil. The NPKM application resulted in the highest increase in total N, available-P and K concentration as compared to NPK and control. Likewise, mineral fertilization reduction and partial substitution with organic amendments have posed a significant influence on soil macronutrient status. Soil available P and K decreased after INF reduction[34]. Chen et al.[35] evinced that integrated application of manure and mineral fertilizers to red clay soil (typical Ultisols) improved hydrolyzed nitrogen and available P due to an increase in the decomposition of organic matter (OM) and N bio-fixation than sole mineral fertilizers and control.

    A long-term experiment was carried out out by Shiwakoti et al.[36] to ascertain the influence of N fertilization and tillage on macronutrient dynamics in soil. Nitrogen fertilization produced higher crop biomass which might have improved total N and P concentration in soil. Moreover, the reduced interaction between soil colloids and residue or greater cation exchange sites due to tillage practices could have augmented K concentration in 0−10 cm soil depth. Likewise, among tillage systems combined organic (poultry manure) and inorganic (lime and fertilizers) fertilization, no-tillage, and reduced tillage with organic fertilization resulted in higher availability of P owing to minimal disturbance of soil which decreases contact surface between phosphate ions and adsorption sites. Greater losses of K in runoff water under NT resulted in lower K availability under NT than CT[37].

    The influence of tillage systems on soil nutrient dynamics showed that minimal soil disturbances under zero tillage prohibited redistribution of soil nutrients and resulted in the highest available N, P, and K in the surface soil[38]. The influence of tillage timing on soil macronutrient status has also been assessed under tillage treatments that are fall tillage (FT), spring tillage (ST), no tillage (NT), and disk/chisel tillage (DT/CT) on mixed mesic Typic Haploxerolls soil. All the tillage systems differed in the quantity of residues generated. Thus, variation in the decomposition of crop residue and mineralization of SOM resulted in variable rates of nutrient release. The FT and ST had the highest N content over DT/CT and NT systems at corresponding depth. The N content also decreased with soil depth irrespective of tillage treatment. The available P and extractable K were highest under NT at the top 10 cm soil depth and increased over time[39]. Residue management in combination with tillage treatments (ST and CT) has been reported to affect the soil macronutrient status in Bangladesh. Tillage treatments enhanced the total N content to a considerable extent. Moreover, 3 years of residue retention led to a higher concentration of total N, available P and K in the soil.

    The combinations of N, P, and K in different ratios together with two rates of organic fertilizer (OF) applied on the aquic Inceptisol having sandy loam texture influenced the micronutrient status of the soil[40]. Soil Zn content decreased with time when no fertilizer was applied as compared to organic fertilizer (OF) application. The mineral fertilizer treatments led to a substantial increase in DTPA-extractable micronutrients in the soil. The higher micronutrient concentration due to higher OM highlights the importance of maintaining OM for soil fertility and higher crop production. Further studies revealed that long-term application of sole N fertilizers led to a significant decline in total Zn and Cu, whereas Mn and Fe status improved through atmospheric deposition. Phosphorus and OF addition along with straw incorporation markedly increased total Zn, Cu, Fe, and Mn. The DTPA-extractable Mn, Zn, Fe, and Cu were also higher in OF treatment, thus demonstrating the beneficial effects of constant OM application for maintaining the nutrient status of soil[41].

    López-Fando & Pardo[42] quantified the impact of various tillage practices including NT, CT, minimum tillage (MT), and zone-tillage (ZT) on soil micronutrient stocks. Tillage systems did exhibit a significant influence on plant available Fe stocks in the topsoil; however, diminished with depth under ZT, NT and MT. Manganese was higher in NT and ZT at all depths and increased with soil depth. Zinc was highest under NT and other results did not vary significantly as in the case of Cu. The SOC levels were also found to be responsible to affect micronutrients due to tillage practices. Likewise, in Calciortidic Haploxeralf soil the distribution of soil micronutrients (Zn, Mn, Fe, Cu) was ascertained under different tillage practices (CT, MT, and NT). The micronutrient status was highest under NT in the upper layers due to the higher SOC level[43].

    Sharma & Dhaliwal[44] determined that the combined application of nitrogen and rice residues facilitated the transformation of micronutrients (Zn, Mn, Fe, Cu). Among different fractions, the predominant fractions were crystalline Fe bound in Zn, Mn, and Cu and amorphous Fe oxide in Fe with 120 kg N ha˗1 and 7.5-ton rice residue incorporation. The higher content of occluded fractions adduced the increment in cationic micronutrient availability in soil with residue incorporation together with N fertilization due to increased biomass. Rice straw compost along with sewage sludge (SS) and INF also affected the micronutrient availability under the RW cropping system. Nitrogen fertilization through inorganic fertilizers and rice straw compost and sewage sludge (50% + 50%) improved soil micronutrient status due to an increase in SOM over sole NPK fertilizers[45]. Earlier, Dhaliwal et al.[46] in a long-term experiment determined that different combinations of NPK along with biogas slurry as an organic source modified the extractable micronutrient status of the soil.

    A comparative study was carried out by Dhaliwal et al.[47] to ascertain the long-term impact of agro-forestry and rice–wheat systems on the distribution of soil micronutrients. The DTPA-extractable and total Cu, Zn, Fe, and Mn were greater in the RW system due to the reduced conditions because of rice cultivation. Under the RW system Zn removal was higher which was balanced by continuous Zn application. The higher availability of Fe under the RW system was due to reduced conditions. Contrarily, Mn was greater under the agro-forestry system owing to nutrient recycling from leaf litter.

    The long-term impact of integrated application of FYM, GM, WCS (wheat-cut straw) and INF on the soil micronutrients (Zn, Mn, Cu, and Fe) have been studied by Dhaliwal et al.[48]. The FYM application substantially improved DTPA-extractable Zn status followed by GM and WCS, whereas Cu content was maximum in the plots with OM application. The highest Fe concentration was recorded in treatment in which 50% recommended N supplied through FYM. This could be ascribed to the release of micronutrients from OM at low soil pH.

    Shiwakoti et al.[49] studied the dual effects of tillage methods (MP, DP, SW) and variable rates of N (0, 45, 90, 135 and 180 kg ha−1) on the distribution of micronutrients under a moisture-deficit winter wheat-fallow system. The soil Mn content was highest under the DP regime. Inorganic N application reduced Cu content in the soil. Comparative studies with adjacent undisturbed grass pasture indicated the loss of Zn and Cu to a significant extent. Thus, DP along with nitrogen added through inorganic fertilizers could improve micronutrient concentration in the soil. Moreover, the results implied that long-term cultivation with nitrogen fertilization and tillage results in the decline of essential plant nutrients in the soil. Thus, organic amendments along with INF may prove an effective approach to increase soil micronutrient content. In another study conducted by Lozano-García & Parras-Alcántara[50] tillage practices such as NT under apple orchard, CT with the wheat-soybean system and puddling (PD) in the rice-rice cropping system were found to affect nutrient status. Under CT, Cu content was lowest and Zn content was highest. On the contrary, puddling caused an increase in Fe and Mn concentration owing to the dispersion of soil aggregates which reduced the percolation of water and created an anaerobic environment thereby enhancing the availability of Fe and Mn.

    Tillage practices along with gypsum fertilization have been known to affect secondary nutrient concentrations in soil. In a long-term experiment, FYM application showed maximum response to increased S concentration due to the maximum addition of OM through FYM over other treatments as S is an essential component of OM and FYM[32]. Higher Mg content was recorded in FYM and pea vine treatments because the application of organic matter through organic manure or pea vines outright led to Mg accrual. The lower Mg concentration in topsoil than the lower layers was due to the competition between Mg and K for adsorbing sites and thus displacement of Mg by K. Han et al.[28] while ascertaining the impact of organic manures and mineral fertilizers (NPK) on soil chemical attributes determined that INF application reduced exchangeable calcium, whereas no significant changes were exhibited in the magnesium concentrations. The OM application significantly increased both the calcium and magnesium concentrations in the soil.

    While ascertaining the effect of different tillage treatments such as CT, NT, and MT on exchangeable and water-soluble cations, Lozano-García & Parras-Alcántara[50] recorded that NT had greater content of exchangeable Ca2+ and Mg2+ than MT and CT. The exchangeable Ca2+ decreased with depth, however, opposite results were observed for Mg2+ which might be due to the higher uptake of Mg2+ by the crop. On another note, there might be the existence of Mg2+-deficient minerals on the surface horizon. Alam et al.[51] studied the temporal effect of tillage systems on S distribution in the soil and observed that available S was 19%, 31%, and 34% higher in zero tillage than in minimum tillage, conventional tillage, and deep tillage, respectively.

    Kumar et al.[38] appraised the impact of tillage systems on surface soil nutrient dynamics under the following conditions: conventional tillage, zero till seeding with bullock drawn, conventional tillage with bullock drawn seeding, utera cropping and conservation tillage seeding with country plough and observed that tillage had a significant impact on the available S content. Compared with conventional tillage, zero and minimum tillage had higher S content as there was none or limited tillage operations which led to the accumulation of root stubble in the soil that decomposed over time and increased S concentration.

    Soil is considered a hotspot for microbial biodiversity which plays an important role in building a complex link between plants and soil. The microbial components exhibit dynamic nature and, therefore, are characterized as good indicators of soil quality[52]. These components include MBC, MBN, PMN and microbial respiration which not only assist in biological transformations like OM conversion, and biological nitrogen fixation but also increase nutrient availability for crop uptake. Management strategies such as fertilizer inputs and tillage practices may exert beneficial effects on soil biota as discussed below.

    Soil is an abode to a considerable portion of global biodiversity. This biodiversity not only plays a pivotal role in regulating soil functions but also provides a fertile ground for advancing global sustainability, especially agricultural ventures. Thus, the maintenance of soil biodiversity is of paramount importance for sustaining ecosystem services. Soil biodiversity is the diverse community of living creatures in the soil that interact not only with one another but also with plants and small animals to regulate various biological activities[53]. Additionally, it increases the fertility of soil by converting organic litter to SOM thereby enhancing SOC content. Thus, the SOM measures the number and activity of soil biota. Furthermore, the quality and amount of SOC, as well as plant diversity have a considerable impact on the soil microbial community structure[54].

    Dangi et al.[55] ascertained the impact of integrated nutrient management and biochar on soil microbial characteristics and observed that soil amended with biochar or the addition of organic manures influenced microbial community composition and biomass and crop yield. After two years, the higher rates of biochar significantly enhanced the levels of gram-positive and gram-negative bacterial phospholipid fatty acid (PLFA), total arbuscular mycorrhizal fungal (AMF) than lower rates, unfertilized and non-amended soil. Luan et al.[56] conducted a comparison study in a greenhouse to assess the effects of various rates of N fertilizer and kinds (inorganic and organic) on enzyme activities and soil microbial characteristics. Microbial growth (greater total PLFAs and microbial biomass carbon) and activity were promoted by manure substitution of mineral fertilizer, particularly at a higher replacement rate. On account of lower response in bacterial over fungal growth, manure addition led to a greater fungi/bacteria ratio. Furthermore, manure application significantly enhanced microbial communities, bacterial stress indicators and functional diversity. Lazcano et al.[57] determined the influence of different fertilization strategies on microbial community structure and function, soil biochemical properties and crop yield three months after addition of fertilizer. The integrated fertilizer regimes augmented microbial growth with improved enzyme activity as compared to sole inorganic amendments. Bacterial growth showed variable response with variation in fertilizer regime used whereas fungal growth varied with the amount of fertilizer added. Compared to mineral fertilizers, manure application led to a rapid increase in PLFA biomarkers for gram-negative bacteria. The organic amendments exhibited significant effects even at small concentration of the total quantity of nutrients applied through them; thus, confirming the viability of integrated fertilizer strategies in the short term.

    Kamaa et al.[58] assessed the long-term effect of crop manure and INF on the composition of microbial communities. The organic treatments comprised of maize (Zea mays) stover (MS) at 10 t ha−1 and FYM @ 10 t ha−1, INF treatments (120 kg N, 52.8 kg P-N2P2), integrated treatments (N2P2 + MS, N2P2 + FYM), fallow plot and control. The treatment N2P2 exhibited unfavourable effects on bacterial community structure and diversity that were more closely connected to the bacterial structure in control soils than integrated treatments or sole INF. In N2P2, fungal diversity varied differently than bacterial diversity but fungal diversity was similar in the N2P2 + FYM and N2P2 + MS-treated plots. Thus, the total diversity of fungal and bacterial communities was linked to agroecosystem management approaches which could explain some of the yield variations observed between the treatments. Furthermore, a long-term experiment was performed by Liu et al.[59] to study the efficiency of pig manure and compost as a source for N fertilization and found unique prokaryotic communities with variable abundance of Proteobacteria under compost and pig manure treatments.

    Recently, Li et al.[60] assessed the influence of different tillage practices (no-tillage, shallow tillage, deep tillage, no-tillage with straw retention, shallow tillage with straw retention and deep tillage with straw retention) on microbial communities and observed that tillage practices improved the bacterial Shannon index to a greater extent over the no-tillage plots in which the least value was recorded. Another research study by He et al.[61] reported the effect of tillage practices on enzyme activities at various growth stages. Across all the growth stages, enzyme activities of cellobiohydrolase (CBH), β-xylosidase (BXYL), alkaline phosphatase (AP), β-glucosidase (BG), β-N-acetylglucosamines (NAG) were 17%−169%, 7%−97%, 0.12%−29%, 3%−66%, 23%−137% greater after NT/ST, NT, ST, ST/PT, and PT/NT treatments as compared to plow tillage. The NT/ST treatment resulted in highest soil enzyme activities and yield, and thus was an effective and sustainable method to enhance soil quality and crop production.

    Microbes play a crucial role in controlling different soil functions and soil ecology and microbial community show significant variation across as well as within the landscape. On average, the total biomass of microbes exceeds 500 mg C kg soil−1[62]. Microbial biomass carbon is an active constituent of SOM which constitutes a fundamental soil quality parameter because SOM serves as a source of energy for microbial processes and is a measure of potential microbial activity[48,63]. Soil systems that have higher amounts of OM indicate higher levels of MBC. Microbial biomass carbon is influenced by many parameters like OM content in the soil, land use, and management strategies[64]. The MBC and soil aggregate stability are strongly related because MBC integrates soil physical and chemical properties responds to anthropogenic activities.

    Microbial biomass is regarded as a determinative criterion to assess the functional state of soil. Soils having high functional diversity of microbes which, by and large, occurs under organic agricultural practices, acquire disease and insect-suppressive characteristics that could assist in inducing resistance in plants[65]. Dou et al.[66] determined that soil microbial biomass C (SMBC) was 5% to 8% under wheat-based cropping systems and zero tillage significantly enhanced SMBC in the 0−30 cm depth, particularly in the upper 0 to 5 cm. According to Liang et al.[67], SMBC and soil microbial biomass N (SMBN) in the 0−10 cm surface layer were greater in the fertilized plots in comparison to the unfertilized plots on all sampling dates whereas microbial biomass C and N were highest at the grain filling stage. Mandal et al.[68] demonstrated that MBC also varied significantly with soil depth. Surface soil possessed a maximum MBC value than lower soil layers due to addition of crop residues and root biomass on the surface soil. The MBC content was highest with combined application of INF along with farmyard manure and GM, whereas untreated plots showed minimum MBC values. The incorporation of CR slows down the rate of mineralization processes; therefore, microbes require more time to decompose the residues and utilize the nutrients released[69]. On the other hand, incorporation of GR having a narrow C:N ratio enhances microbial activity and consequently accelerates mineralization in the soil. Malviya[70] also recorded that the SMBC contents were significantly greater under RT than CT, regardless of soil depth which was also assigned to residue incorporation which increases microbial biomass on account of higher carbon substrate in RT.

    Naresh et al.[71] studied the vertical distribution of MBC under no-tillage (NT), shallow (reduced) tillage and normal cultivated fields. A shallow tillage system significantly altered the tillage induced distribution of MBC. In a field experiment, Nakhro & Dkhar[72] examined the microbial populations and MBC in paddy fields under organic and inorganic farming approaches. The organic source used was a combination of rock phosphate, FYM and neem cake, whereas a mixture of urea, muriate of potash and single super phosphate was used as an inorganic source. The organically treated plots exhibited the highest MBC compared to inorganically treated plots and control. Organic carbon exhibited a direct and significant correlation with bacterial and fungal populations. The addition of organic fertilizers enhanced the content of SOC and consequently resulted in higher microbial count and MBC. Ramdas et al.[73] investigated the influence of inorganic and organic sources of nutrients (as minerals or INF) applied over a five-year period on SOC, MBC and other variables. It was observed that the addition of FYM and conjoint application of paddy straw (dry) and water hyacinth (PsWh) (fresh) significantly increased the SOC content than vermicompost, Chromolaena adenophorum (fresh) and Glyricidia aculeate (fresh), and Sesbania rostrata (fresh).

    Xu et al.[74] evaluated the influence of long-term fertilization strategies on the SOC content, soil MBN, soil MBC, and soil microbial quotient (SMQ) in a continuous rice system and observed that MBC at the main growth stages of early and late rice under 30% organic matter and 70% mineral fertilizer and 60% organic matter and 40% mineral fertilizer treatments was greater as compared to mineral fertilizer alone (MF), rice straw residues and mineral fertilizer (RF), and no fertilizer (CK) treatments. However, SMBC levels at late growth stages were greater in comparison to early growth stages. A recent study by Xiao et al.[75] demonstrated that increasing tillage frequency (no-tillage, semi-annual tillage, and tillage after every four months, two months, and one month) decreased soil MBC. Microbial biomass carbon content was significantly greater in no-till treatment (597 g kg−1) than in tillage every four months (421 g kg−1), two months (342 g kg−1) and one month (222 g kg−1). The decrease in the content of MBC in association with tillage practices is due to soil perturbations which enhanced soil temperature, diminished soil moisture content, and resulted in the destruction of microbial habitat and fungal hyphae. Therefore, the MBC content eventually affected the N cycle.

    Li et al.[76] reported that in comparison to CT, NT and RT resulted in increased MBC content and NT significantly increased MBC by 33.1% over CT. Furthermore, MBC concentration was 34.1% greater in NT than RT. The increase in MBC concentration was correlated with the results of increase in SOC concentration. Site-specific factors including soil depth and mean annual temperature significantly affected the response ratio of MBC under NT as compared to the duration of NT.

    Microbial biomass nitrogen (MBN) is a prominent indicator of soil fertility as it quantifies the biological status of soil. Soil MBN is strongly associated with organic matter of the soil. The nitrogen in MBN has a rapid turnover rate thereby reflecting the changes in management strategies way before the transformations in total N are discernable[77].

    In an experiment on continuous silage maize cultivation with crop rotation, Cerny et al.[78] observed that organic fertilizers exerted an affirmative influence on the soil MBN. During the application of organic manure MBN decreased, but there was higher MBN content as compared to control. However, addition of mineral nitrogenous fertilizers exerted an adverse effect on MBN content in experiments with maize. El-Sharkawi[79] recorded that organic matter-treated pots resulted in maximum MBN content than urea-treated pots. The sludge application enhanced total MBN and, therefore, could implicitly benefit crop production particularly in poor soils[18]. Sugihara et al.[80] observed that during the grain-filling stage in maize, residue and/or fertilizer addition exerted a pronounced influence on soil microbial dynamics; however, a clear effect of residue and ⁄or fertilizer addition was not observed. Microbial biomass nitrogen reduced dramatically from 63–71 to 18–33 kg N ha˗1 and C:N ratio at the same time increased more than ten-fold in all plots.

    Malik et al.[81] apprised that the organic amendments significantly enhanced MBN concentrations up to 50% more than the unamended soil. Wang et al.[82] evaluated the influence of organic materials on MBN content in an incubation and pot experiment with acidic and calcareous soils. The results revealed that MBN content which was affected by the different forms of organic amendments, increased by 23.37%−150.08% and 35.02%−160.02% in acidic and calcareous soils, respectively. The MBN content of both soils decreased with the increase in the C/N ratio of the organic materials, though a higher C/N ratio was effective for sustaining a greater MBN content for a very long time.

    Dhaliwal & Bijay-Singh[52] observed higher MBN levels in NT soils (116 kg ha−1) than in cultivated soils (80 kg ha−1). Kumar et al.[83] ascertained that in surface layer, MBN content was 11.8 mg kg−1 in CT which increased to 14.1 and 14.4 mg kg−1 in ZT and RT without residue retention and 20.2, 19.1 and 18.2 mg kg−1 in ZT, RT and CT with residue incorporation, respectively (Table 1). In the subsurface layer, the increased tendency on account of tillage and crop residue retention was identical to those of 0−15 cm layer but the magnitude was comparatively meagre (Table 1). In comparison to control, the persistent retention of crop residues led to significant accrual of MBN in the surface layer.

    Table 1.  Effect of different treatments on contents of various fractions of soil organic carbon[38].
    TreatmentsPMN (mg kg−1)MBC (mg kg−1)MBN (mg kg−1)DOC (mg kg−1)
    Depths (cm)
    0−1515−300−1515−300−1515−300−1515−30
    Tillage practices
    ZTR12.411.2562.5471.120.218.9198.6183.6
    ZTWR8.57.6350.4302.114.112.6167.1159.2
    RTR10.69.9490.2399.319.117.2186.4171.6
    RTWR7.66.6318.1299.814.413.7159.5148.7
    CTR9.38.5402.9354.418.216.6175.9168.9
    CT6.75.6307.9289.511.89.7142.5134.6
    Nitrogen management
    Control3.62.8218.3202.910.810.4103.792.3
    80 kg N ha−15.34.4241.1199.414.912.2128.3116.9
    120 kg N ha−18.97.6282.7220.916.516.1136.8123.6
    160 kg N ha−19.88.4343.9262.919.418.1164.8148.9
    200 kg N ha−110.49.7346.3269.622.721.7155.7136.4
    ZTR = Zero tillage with residue retention, ZTWR = Zero tillage without residue retention; RTR = Reduced tillage with residue retention, RTWR = Reduced tillage without residue retention, CTR = Conventional tillage with residue incorporation; CT = Conventional tillage without residue incorporation.
     | Show Table
    DownLoad: CSV

    Xiao et al.[75] determined that the MBN content decreased with tillage treatment having highest value in no tillage treatment, however, the difference among the treatments was negligible. Soil perturbations decreased the aggregate size and thus lower the soil aeration and exposure of fresh organic matter which restricted the growth of microorganisms. The results also concluded that MBN content is highly sensitive to tillage. Ginakes et al.[84] assessed the impact of zone tillage intensity on MBN in a corn-kura clover cropping sequence. Microbial biomass nitrogen was influenced by time and type of tillage treatment. Temporal studies revealed that MBN was higher after tillage treatment than the values possessed before tillage. Under different tillage treatments, higher values were recorded in ST (shank-till) and DT (double-till) over NT and RZT (zone-till) treatments.

    Another biological parameter, PMN, is a crucial parameter of soil fertility due to its association with soil N supply for crop growth. Also, PMN indicates the status of soil microbial community associated with PMN, whether it is improving or degrading. Forest soils are characterized by greater levels of PMN than CT receiving conventional chemical fertilizers which could be assignable to improved microbial activity in the former soils than the latter[48,77]. Aulakh et al.[85] assessed the effect of various combinations of fertilizer N, P, FYM and wheat residue (WR) applied to soybean and soybean residues added to wheat under CT and CA. The added fertilizers of N and P, FYM, and crop residue enhanced the mean weight diameter and water-stable aggregates thus favoured the development of macro-aggregates. The treatment INF + FYM + crop residue performed better among all the treatments. The net flux of mineral nitrogen from the mineralizable fraction is used to measure potentially mineralizable N which indicates the balance between mineralization and immobilization by soil microbes[77]. Nitrogen mineralization is widely used to assess the ability of SOM to supply inorganic nitrogen in the form of nitrate which is the most common form of plant-available nitrogen. Kumar et al.[83] observed an increase in PMN which was higher in surface soil than sub-surface soil thereby implying that high OC accumulation on account of crop residue retention was the most probable cause.

    Verma & Goyal[86] assessed the effect of INM and organic manuring on PMN and observed that PMN was substantially affected by different organic amendments. Potentially mineralizable nitrogen varied between 19.6−41.5 mg kg−1 soil with greater quantity (2.5%) in vermicompost applied plots than FYM treated plots. The INF treatments resulted in lower PMN content which could be due to nutrient immobilization by microbes. Mahal et al.[87] reported that no-till resulted in higher PMN content than conventional tillage treatments. This trend was due to the maintenance of SOM due to the residue cover and reduction of soil erosion under no-tillage system[88]. On the contrary, tillage practices led to the loss of SOC owing to loosened surface soil and higher mineralization of SOM.

    Soil respiration is referred as the sum of CO2 evolution from intact soils because of the respiration by soil organisms, mycorrhizae and roots[89]. Various researchers have proposed soil respiration as a potential indicator of soil microbial activity[52,77]. Gilani & Bahmanyar[90] observed that addition of organic amendments enhanced soil respiration more than the control and synthetic fertilizer treatments. Moreover, among organic amendment treatments, highest soil respiration was observed in sewage-sludge treated soils. Under controlled conditions in saline-sodic soil, Celis et al.[91] reported that sewage sludge resulted in a higher soil respiration rate than mined gypsum and synthetic gypsum. The application of gypsum because of minimal organic matter intake had little effect on soil respiration. The addition of organic matter especially during early spring led to higher microbial biomass and soil respiration albeit diminished levels of nitrate-N. Moreover, SOM hinders the leaching of nitrate ions thereby resulting in a better soil chemical environment[71].

    Faust et al.[92] observed that microbial respiration was associated with volumetric water content. The respiration declined with less availability of water, thus the lesser the tillage intensity, the more the volumetric water content which consequently resulted in higher microbial respiration. Another study by Bongiorno et al.[93] reflected the influence of soil management intensity on soil respiration. Reduced tillage practices resulted in 51% higher basal respiration than CT. Furthermore, this investigation suggested that microbial catabolic profile could be used as a useful biological soil quality indicator. Recently, Kalkhajeh et al.[94] ascertained the impact of simultaneous addition of N fertilizer and straw-decomposing microbial inoculant (SDMI) on soil respiration. The SDMI application boosted the soil microbial respiration which accelerated the decomposition of straw due to N fertilization. The C/N ratio did not affect the microbial respiration at elongation and heading stages, whereas N fertilization enhanced the microbial respiration to a greater extent than the unfertilized control. Additionally, the interaction between sampling time and basal N application significantly affected microbial respiration.

    Gong et al.[95] apprised the effect of conventional rotary tillage and deep ploughing on soil respiration in winter wheat and observed that deep ploughing resulted in a higher soil respiration rate than conventional rotary tillage. Soil moisture content and temperature are the dominating agents influencing soil respiration which is restricted by the soil porosity.

    Soil organic carbon plays a vital role in regulating various soil functions and ecosystem services. It is influenced by numerous factors like tillage practices and fertilization. Moreover, modified management practices may prove beneficial to avoid SOC loss by increasing its content. An exogenous supply of fertilizers may alter the chemical conditions of soil and thus result in transformation of SOC. Tillage practices lead to frequent soil disturbances which reduce the size of soil aggregates and accelerate the oxidation of SOC thereby reducing its content. The literature on the influence of fertilization and tillage practices on the transformation of SOC is discussed below.

    Soil organic carbon is a major part of the global carbon cycle which is associated not only with the soil but also takes part in the C cycling through vegetation, oceans and the atmosphere (Figs 1 & 2). Soil acts as a sink of approximately 1,500 Pg of C up to 1 m depth, which is greater than its storage in the atmosphere (approximately 800 Pg C) and terrestrial vegetation (500 Pg C) combined[96]. This dynamic carbon reservoir is continuously cycling in diverse molecular forms between the different carbon pools[97]. Fertilization (both organic and mineral) is one of the crucial factors that impart a notable influence on OC accretion in the soil. Many researchers have studied the soil C dynamics under different fertilizer treatments. Though inorganic fertilizers possess the advantage of easy handling, application and storage, they do not contribute to soil organic carbon. On the contrary, regardless of management method, plant residues are known to increase organic carbon content.

    Figure 1.  Impact of different fertilization regimes on abundance of the microbial biomarker groups . Error bars represent the standard error of the means and different letters indicate significant differences at p < 0.05 among treatments. Source: Li et al.[60].
    Figure 2.  Soil organic carbon (SOC) dynamics in the global carbon cycle.

    Katkar et al.[98] reported a higher soil quality index under conjunctive nutrient management strategies comprising addition of compost and green leaves along with mineral nutrients. Mazumdar et al.[99] investigated the impact of crop residue (CR), FYM, and leguminous green manure (GM) on SOC in continuous rice-wheat cropping sequence over a 25-year period. At the surface layer, the maximum SOC content was recorded under NPK + FYM than NPK + CR and NPK + GM treatments. SOC was significantly lower under sole application of INFs (NPK) than the mixed application of organic and inorganic treatments. A higher range of SOC content was recorded at a depth of 0.6 m in the rice-wheat system (1.8–6.2 g kg−1) in farmyard manure (FYM)-treated plots than 1.7–5.3 g kg−1 under NPK, and 0.9–3.0 g kg−1 in case of unfertilized plots[100]. In a research study Dutta et al.[101] reported that rice residue had a higher decomposition rate (k¼ 0.121 and 0.076 day−1) followed by wheat (0.073 and 0.042 day−1) and maize residues (0.041 day−1) when their respective residues placed on soil surface than incorporated in the soils. Naresh et al.[102] found FYM and dhaincha as GM/ sulphitation press mud (SPM) treatments are potent enough to enhance the SOC. Maximum SOC content was noted in 0–5 cm depth that reduced gradually along the profile. In surface soil, the total organic content (TOC) under different treatments varied with source used to supply a recommended dose of nitrogen (RDN) along with conventional fertilizer (CF).

    Cai et al.[103] ascertained that long-term manure application significantly improved SOC content in different size fractions which followed the sequence: 2,000–250 μm > 250–53 μm > 53 μm fraction. Naresh et al.[22] determined that mean SOC content increased from 0.54% in control to 0.65% in RDF and 0.82% in RDF + FYM treatment and improved enzyme activity; thus, ultimately influenced nutrient dynamics under field conditions. The treatments RDF + FYM and NPK resulted in 0.28 Mg C ha−1 yr−1 and 0.13 Mg C ha−1 yr−1, respectively and thus higher sequestration than control. Zhao et al.[104] determined that in the surface layer, significant increase in SOC content in each soil aggregate was noticed under straw incorporation treatments over no straw incorporated treatments (Fig. 3). Moreover, the aggregate associated OC was significantly higher in the surface layer than the sub-surface layer. The highest increment in aggregate-associated OC was noted in both maize and wheat straw (MR-WR) added plots followed by MR and least in WR. Besides, all of the three straw-incorporated treatments exhibited notable increase in SOC stock in each aggregate fraction in the surface layer of the soil. In the subsurface (20−40 cm) layer under MR-WR, significant rise in SOC stock of small macro-aggregates was observed, whereas there was a reduction in SOC stock in the silt + clay fraction than other treatments. The straw-incorporated treatments increased the quantity of mineral-associated organic matter (mSOM) and intra-aggregate particulate organic matter, (iPOM) within small macro-aggregates and micro-aggregates especially in the topmost layer of the soil.

    Figure 3.  Distribution of OC in coarse iPOM (intra-aggregate particulate organic matter) fine iPOM, mSOM (mineral-associated matter), and free LF (free light fraction) of small macro-aggregates and micro-aggregates in the 0–20 cm and 20–40 cm soil layers under MR-WR (return of both maize and wheat straw), MR (maize straw return), WR (wheat straw return). Different lowercase and uppercase letters indicate significant differences at p < 0.05 among treatments and depths respectively[104].

    Srinivasarao et al.[105] reported that SOC content was reduced with the addition of INFs (100% RDN) alone as compared to the conjunctive application of inorganic and organic or sole FYM treatments. Earlier, Srinivasarao et al.[106] reported that FYM treated plots exhibited greater per cent increase in SOC stock than mineral fertilized plots and control. Tong et al.[107] ascertained that the application of NP and NPK significantly improved SOC stocks. On the contrary, fertilized soils could also exhibit decrease in carbon content than control. Naresh et al.[108] determined that higher biomass C input significantly resulted in greater particulate organic carbon (POC) content. Zhang et al.[109] ascertained that long-term addition of NPK and animal manures significantly improved SOC stocks by a magnitude of 32%−87% whereas NPK and wheat/ and or maize straw incorporation enhanced the C stocks by 26%−38% than control. Kamp et al.[110] determined that continuous cultivation without fertilization decreased SOC content by 14% than uncultivated soil. However, super optimum dose of NPK, balanced NPK fertilization and integration of NPK with FYM not only improved SOC content but also SOC stocks over the first year. In conventionally tilled cotton-growing soils of southern USA, Franzluebbers et al.[111] estimated that carbon sequestration averaged 0.31 ± 0.19 Mg C ha−1 yr−1. Mandal et al.[112] reported maximum SOC stock in the surface layer of the soil (0–15 cm) which progressively diminished with depth in each land use system. A significant decrease in SOC stock along the profile depth was also observed by Dhaliwal et al.[47] in both croplands and agroforestry. In the topmost soil layer, highest SOC stock was recorded in rice–fallow system while the lowest was in the guava orchard[112].

    Nath et al.[113] determined that there was accrual of higher TOC in surface layers as compared to lower layers of soil under paddy cultivation. This accrual could be adduced to left-over crop residues and remnant root biomass which exhibited a decreasing trend with soil depth. Das et al.[114] determined that integrated use of fertilizers and organic sources resulted in greater TOC as compared to control or sole fertilizer application. Fang et al.[115] observed that the cumulative carbon mineralization differed with aggregate size in top soils of broad-leaved forests (BF) and coniferous forests (CF). However, in deep soil it was greater in macro-aggregates as compared to micro-aggregates in BF but not in CF (Fig. 4). By and large, the percent SOC mineralized was greater in macro-aggregates as compared to micro-aggregates. Dhaliwal et al.[100] ascertained that SOC accrual was considerably influenced by residue levels and tillage in surface soil (0−20 cm); albeit no variation was observed at lower depth (20−40 cm). The SOC content was greater in zero-tilled and permanently raised beds incorporated with residues as compared to puddled transplanted rice and conventionally planted wheat. Pandey et al.[116] reported that no-tillage prior to sowing of rice and wheat increased soil organic carbon by 0.6 Mg C ha–1 yr–1. The carbon sequestration rate on account of no-tillage or reduced tillage ranged between 0−2,114 kg ha–1 yr–1 in the predominant cropping system of South Asia, Xue et al.[117] observed that the long-term conventional tillage, by and large, exhibited a significant decline in SOC owing to degradation of soil structure, exposing protected soil organic matter (intra-soil aggregates) to microbes. Therefore, the adoption of no-tillage could hamper the loss of SOC thereby resulting in a greater or equivalent quantity of carbon in comparison to CT (Fig. 5).

    Figure 4.  (a) Soil aggregate fractions of two depths in two restored plantations of subtropical China, (b) organic carbon and (c) its mineralization from various soil aggregates within 71 d at various soil depths in two restored plantations of subtropical China. Error bars show the standard error of the mean. The different letters represent significant differences among the different soil aggregate fractions within a depth at p < 0.05[115].
    Figure 5.  The concentrations of (a) SOC, (b) total nitrogen (TN), and (c) soil C:N ratio for 0–50 cm profile under different tillage treatments in 2012 and 2013. NT = no-till with residue retention; RT = rotary tillage with residue incorporation; PT = plow tillage with residue incorporation; and PT0 = plow tillage with residue removed. The lowercase letters indicate statistical difference among treatments at p < 0.05[117].

    Singh et al.[118] determined that carbon stock in the 0-40 cm layer increased by 39, 35 and 19% in zero-tilled clay loam, loam, and sandy loam soils, respectively as compared to conventional tilled soils over a period of 15 years. Kuhn et al.[119] also apprised about the advantages of NT over CT vis-a-vis SOC stocks across soil depths. In the surface layer (0−20 cm) NT, by and large, resulted in higher SOC stocks as compared to CT; however, SOC stocks exhibited a declining trend with soil depth, in fact, became negative at depths lower than 20 cm. Sapkota et al.[120] observed that over a period of seven years, direct dry-seeded rice proceeded by wheat cultivation with residue retention enhanced SOC at 0-60 cm depth by a magnitude of 4.7 and 3.0 t C ha−1 in zero-tillage (ZTDSR-ZTW + R) and without tillage (PBDSR-PBW + R), respectively. On the contrary, the conventional tillage rice-wheat cropping system (CTR-CTW) decreased the SOC up to 0.9 t C ha−1 (Table 2).

    Table 2.  Influence of tillage and crop establishment methods on SOC stock and its temporal variation under rice–wheat system[120].
    Tillage and crop establishment methodsDepths (m)
    0–0.050.05–0.150.15–0.30.3–0.60–0.6
    Total SOC (t/ha)
    CTR-CTW3.5e7.1c8.77.026.2c
    CTR-ZTW3.9d7.6bc8.86.526.7c
    ZTDSR-CTW4.2d7.5bc9.26.327.3c
    ZTDSR-ZTW4.9c8.9ab8.26.228.2bc
    ZTDSR-ZTW+R6.1a9.0ab9.86.831.8a
    PBDSR-PBW+R5.5b9.3a9.36.030.1ab
    MSD0.41.72.01.42.49
    Treatment effect
    (p value)
    < 0.0010.040.1580.267< 0.001
    Initial SOC content3.6 ±
    0.15
    8.1 ±
    1.39
    8.78 ±
    1.07
    6.7 ±
    0.73
    27.1 ±
    1.21
    Change in SOC over seven years (t/ha)
    CTR-CTW−0.16−0.99−0.040.28−0.90
    CTR-ZTW0.28−0.500.01−0.20−0.41
    ZTDSR-CTW0.62−0.570.45−0.340.16
    ZTDSR-ZTW1.340.84−0.62−0.461.09
    ZTDSR-ZTW+R2.490.961.040.164.66
    PBDSR-PBW+R1.891.220.51−0.642.98
    CTR-CTW = Conventionally tilled puddled transplanted rice followed by conventionally tilled wheat, CTR-ZTW = Conventionally tilled puddled transplanted rice followed by zero-tilled wheat, ZTDSR-CTW = Zero-tilled direct dry-seeded rice followed by conventionally tilled wheat, ZTDSR-ZTW = Zero-tilled direct dry-seeded rice followed by zero-tilled wheat, ZTDSR-ZTW+R = Zero-tilled direct dry-seeded rice followed by zero-tilled wheat with residue retention, PBDSR-PBW+R = Direct dry-seeded rice followed by direct drilling of wheat both on permanent beds with residue retention, MSD, minimum significant difference. Significant different letters indicate significant differences at p < 0.05.
     | Show Table
    DownLoad: CSV

    Labile organic carbon (LC) is that fraction of SOC that is rapidly degraded by soil microbes, therefore, having the highest turnover rate. This fraction can turn over quickly on account of the change in land use and management strategies. From the crop production perspective, this fraction is crucial as it sustains the soil food cycle and, hence, considerably impacts nutrient cycling thereby altering soil quality and productivity. Short-term management could influence the labile fraction of carbon[121]. However, some site-specific problems and regional factors may influence their distribution in soil layers[102].

    Banger et al.[122] observed significant alteration in labile pools of C, for instance, particulate organic matter (POM), water-soluble C (WSC) and light fraction of C (LFC) because of the addition of fertilizers and/or FYM over a 16-year period. Particulate organic matter, LFC and WSC contributed 24%–35%, 12%–14% and 0.6%–0.8%, respectively, towards SOC. The increase in concentration of SOC including its pools like POC and the sequestration rate due to integrated nutrient management was also reported by Nayak et al.[123]. Gu et al.[124] observed that mulch-treated soils (straw and grass mulch) had significantly greater levels of LOC, POC, DOC and EOC as compared to no mulch-treated soils which could be adduced to the addition of straw, root and its sections into the soil. The content of labile C fractions across all treatments exhibited a decreasing trend with soil depth[23, 102, 125].

    In a long-term experiment, Anantha et al.[126] observed that the total organic carbon apportioned into labile carbon, non-labile, less labile, and very labile carbon constituted around 18.7%, 19.3%, 20.6% and 41.4% of the TOC, respectively (Table 3). Zhu et al.[20] determined that straw incorporation had a substantial impact on TOC and labile C fractions of the soil which were greater in straw incorporated treatments as compared to non-straw treatments across all the depths. Wang et al.[127] reported that the light fraction organic carbon (LFOC) and DOC were significantly greater in the straw-applied treatments than the control by a magnitude of 7%–129% for both the early and late season rice. The treatments NPK + FYM or NPK + GR + FYM resulted in greater content of very labile and labile C fractions whereas non-labile and less labile fractions were greater in control and NPK + CR treatment. There was 40.5% and 16.2% higher C build-up in sole FYM treated plots and 100% NPK + FYM, respectively over control. On the other hand, a net depletion of 1.2 and 1.8 Mg ha−1 in carbon stock was recorded under 50% NPK and control treatments, respectively. Out of the total C added through FYM, only 28.9% was stabilized as SOC, though an external supply of OM is a significant source of soil organic carbon[69]. Hence, to sustain the optimum SOC level at least an input of 2.3 Mg C ha−1 y−1 is required. A comparatively greater quantity of soil C in passive pools was observed in 100% NPK + FYM treatment. The increase in allocation of C into the passive pool was about 33%, 35%, 41% and 39% of TOC in control, suboptimal dose, optimal dose and super optimal dose of NPK which indicates that the concentration of passive pools increased with an increase in fertilization doses. Water-soluble carbon (WSC) was 5.48% greater in the upper soil layer as compared to lower layer of soil. In surface soil (0−15 cm), the values of light fraction carbon (LFC) were 81.3, 107.8, 155.2, 95.7, 128.8, 177.8 and 52.7 mg kg−1 in ZT without residue retention, ZT with 4 t ha−1 residue retention, ZT with 6 t ha−1 residue retention, FIRB without residue addition and FIRB with 4 and 6 t ha−1 residue addition and CT, respectively (Table 4). Tiwari et al.[128] determined that the decrease in POC was due to reduction in fine particulate organic matter in topsoil whereas decrement in dissolved organic carbon was observed largely in subsoil. Therefore, in surface soils fine POC and LFOC might be regarded as preliminary evidence of organic C alteration more precisely, while DOC could be considered as a useful indicator for subsoil. Reduction in allocations of fine POC, LFOC and DOC to SOC caused by tillage and straw management strategies indicated the decline in quality of SOC. A higher SOC concentration was recorded in the conjoint application of INF + FYM (0.82%) and sole application of INF (0.65%) than control (0.54%). Kumar et al.[83] reported that the CT without residue retention had significantly lower labile carbon fractions (27%–48%) than zero-tillage with 6-ton residue retention. Moreover, residue-retained fertilized treatments had significantly greater labile fractions of C than sole fertilized treatments[125]. Kumar et al.[83] reported highest change in DOC in zero-till with residue retention (28.2%) in comparison to conventional tillage practices. In ZT, absence of soil perturbations resulted in sustained supply of organic substrata for soil microbes which increases their activity. On the contrary, CT practices resulted in higher losses of C as CO2 due to frequent disturbances.

    Table 3.  Oxidisable organic carbon fractions in soils (g kg−1) at different layers[126].
    TreatmentDepths (cm)
    0−1515−3030−45Total
    Very Labile C
    Control3.6 ± 0.5c1.4 ± 0.3b1.3 ± 0.2a6.3 ± 0.4b
    50% NPK4.6 ± 0.3bc2.1 ± 0.7ab1.5 ± 0.1a8.1 ± 0.9a
    100% NPK4.4 ± 0.3bc2.3 ± 0.2a1.4 ± 0.5a8.0 ± 0.7a
    150% NPK5.0 ± 0.2ab2.6 ± 0.2a1.5 ± 0.1a9.0 ± 0.3a
    100% NPK + FYM4.8 ± 0.2ab2.0 ± 0.2ab1.3 ± 0.3a8.1 ± 0.2a
    FYM5.9 ± 1.3a2.2 ± 0.2a1.4 ± 0.3a9.5 ± 1.6a
    Fallow4.2 ± 0.7bc1.5 ± 0.5b0.7 ± 0.3b6.3 ± 0.8b
    Lbile C
    Control2.4 ± 0.3a1.0 ± 0.2a0.8 ± 0.4a4.2 ± 0.6a
    50% NPK1.7 ± 0.4ab0.9 ± 0.5a0.7 ± 0.2a3.3 ± 0.7a
    100% NPK1.8 ± 0.4ab0.8 ± 0.5a0.6 ± 0.3a3.2 ± 0.8a
    150% NPK1.2 ± 0.3b0.7 ± 0.2a0.9 ± 0.2a2.8 ± 0.4a
    100% NPK + FYM1.9 ± 0.3ab0.7 ± 0.2a0.7 ± 0.3a3.4 ± 0.2a
    FYM2.5 ± 0.9a0.7 ± 0.3a0.7 ± 0.2a3.9 ± 0.9a
    Fallow2.2 ± 1.0ab1.0 ± 0.3a1.0 ± 0.4a4.1 ± 1.1a
    Less labile C
    Control1.5 ± 0.3c0.6 ± 0.4c0.4 ± 0.0c2.6 ± 0.7d
    50% NPK1.8 ± 0.1c0.4 ± 0.1c0.5 ± 0.2c2.7 ± 0.1cd
    100% NPK2.5 ± 0.3ab0.8 ± 0.1bc1.1 ± 0.2ab4.4 ± 0.1b
    150% NPK2.6 ± 0.2a0.9 ± 0.1bc0.4 ± 0.2c3.9 ± 0.1b
    100% NPK + FYM2.7 ± 0.6a1.5 ± 0.2a1.4 ± 0.1a5.6 ± 0.7a
    FYM1.9 ± 0.7bc1.7 ± 0.2a1.0 ± 0.2b4.5 ± 0.7ab
    Fallow1.5 ± 0.3c1.3 ± 0.7ab0.9 ± 0.4b3.8 ± 1.2bc
    Non labile C
    Control1.2 ± 0.5b1.2 ± 0.3a0.2 ± 0.2b2.6 ± 0.5b
    50% NPK1.2 ± 0.9b1.7 ± 0.8a0.7 ± 0.4ab3.5 ± 1.8ab
    100% NPK1.3 ± 0.6b1.5 ± 0.6a0.5 ± 0.2ab3.3 ± 1.0ab
    150% NPK1.4 ± 0.3b1.5 ± 0.2a0.8 ± 0.1a3.7 ± 0.3ab
    100% NPK + FYM2.0 ± 0.8b1.3 ± 0.1a0.3 ± 0.3ab3.5 ± 0.7ab
    FYM3.7 ± 1.3a1.0 ± 0.2a0.5 ± 0.5ab5.1 ± 1.9a
    Fallow2.1 ± 0.2b1.4 ± 0.7a0.4 ± 0.2ab3.9 ± 0.9ab
    Values in the same column followed by different letters are significantly different at p < 0.001, ± indicates the standard deviation values of the means.
     | Show Table
    DownLoad: CSV
    Table 4.  Influence of tillage and nitrogen management on distribution of carbon fractions in soil[83].
    TreatmentsWSOC
    (g kg−1)
    SOC
    (g kg−1)
    OC
    (g kg−1)
    BC
    (g kg−1)
    POC
    (mg kg)
    PON
    (mg kg−1)
    LFOC
    (mg kg−1)
    LFON
    (mg kg−1)
    Depths (cm)
    0−1515−300−1515−300−1515−300−1515−300−1515−300−1515−300−1515−300−1515−30
    Tillage practices
    ZTR28.826.223.119.39.619.134.694.281342.8967.9119.5108.1194.7154.814.812.3
    ZTWR25.324.618.414.87.877.213.763.19981.1667.494.686.5120.5104.711.810.3
    RTR27.025.922.418.28.688.174.133.871230.2836.9109.797.8170.9144.913.711.6
    RTWR23.721.818.114.27.667.073.122.96869.4604.482.676.6107.197.39.78.6
    CTR26.124.421.817.48.497.963.823.481099.1779.498.489.3143.8115.912.810.9
    CT21.820.916.113.16.215.642.892.63617.5481.869.257.690.873.69.67.9
    Nitrogen management
    Control21.114.916.113.16.135.481.581.07709.7658.631.726.3123.9104.36.45.8
    80 kg N ha−128.321.217.814.76.466.162.461.75860.7785.668.456.2132.8116.17.66.9
    120 kg N ha−129.522.119.116.17.256.713.262.18952.2808.989.578.5150.6127.69.78.6
    160 kg N ha−130.223.120.818.27.757.283.822.661099.5823.896.883.4168.5145.710.29.8
    200 kg N ha−131.125.421.318.77.937.484.153.421153.1898.4103.997.3176.2152.911.710.6
    WSOC = Water soluble organic carbon, SOC = Total soil organic carbon, OC = Oxidizable organic carbon, BC =Black carbon, POC = particulate organic carbon, PON = particulate organic nitrogen, LFOC = labile fraction organic carbon, and LFON = labile fraction organic nitrogen. ZTR = Zero tillage with residue retention, ZTWR = Zero tillage without residue retention; RTR = Reduced tillage with residue retention, RTWR = Reduced tillage without residue retention, CTR = Conventional tillage with residue incorporation; CT = Conventional tillage without residue incorporation.
     | Show Table
    DownLoad: CSV

    The soil characteristics such as plant available nutrients, microbial diversity and soil organic carbon transformation are dwindling on account of intensive cultivation under conventional tillage practices, therefore, demand relevant management approaches for soil and crop sustainability. Long-term application of organic amendments significantly increases soil properties by increasing plant available macro, micro, secondary nutrients and soil organic C, whereas the increase in organic C by INF application is, by and large, due to increment in organic C content within macro-aggregates and in the silt + clay compartments. The soil organic carbon and other plant available nutrients were significantly greater in conservation tillage systems as compared to conventional tillage (CT) that conservation approaches could be an exemplary promoter of soil productivity by modifying soil structure thereby protecting SOM and maintaining higher nutrient content. The mean concentration of different fractions of carbon MBN, PMN and soil respiration under integrated nutrient management treatments was higher as compared with to control. Therefore, the conjoint use of organic manures or retention of crop residues with inorganic fertilizers is imperative to reduce the depletion of SOC while sustaining crop production as a realistic alternative. Future research should focus mainly on the usage of organic and mineral fertilizers in conjunction with conservation tillage approaches to sustain the soil environment.

    The authors confirm contribution to the paper as follows: study conception and design: Dhaliwal SS, Shukla AK, Randhawa MK, Behera SK; data collection: Sanddep S, Dhaliwal SS, Behera SK; analysis and interpretation of results: Dhaliwal SS, Gagandeep Kaur, Behera SK; draft manuscript preparation: Dhaliwal SS, walia, Shukla AK, Toor AS, Behera SK, Randhawa MK. All authors reviewed the results and approved the final version of the manuscript.

    Data sharing not applicable to this article as no datasets were generated or analyzed during the current study.

    The support rendered by the Departemnt of Soil Science, PAU, Ludhiana, RVSKVV, Gwailor, CSSRI, Karnal, IISS, Bhopal, School of Organic Farming, PAU Ludhiana and Washington State University, USA is fully acknowledged .

  • The authors declare that they have no conflict of interest.

  • [1]

    Ulmer T, MacDougal JM, Ulmer B. 2004. Passiflora Passionflowers of the World. Timber Press, Portland, OR, USA; Cambridge, UK.

    [2]

    Vanderplank J. 2000. Passion Flowers. 3rd Edition. Cambridge, MA, USA: MIT press

    [3]

    Gremillion KJ. 1989. The development of a mutualistic relationship between humans and maypops (Passiflora incarnata L.) in the southeastern United States. Journal of Ethnobiology 9:135−55

    Google Scholar

    [4]

    Hermsen EJ. 2021. Review of the fossil record of Passiflora, with a description of new seeds from the Pliocene gray fossil site, Tennessee, USA. International Journal of Plant Sciences 182:533−50

    doi: 10.1086/714282

    CrossRef   Google Scholar

    [5]

    Killip EP. 1938. The American species of Passifloraceae. Field Museum of Natural History. Botanical Series. vol 19. Chicago: Field Museum of Natural History. 613 pp. https://doi.org/10.5962/bhl.title.2269

    [6]

    McGuire CM. 1999. Passiflora incarnata (Passifloraceae): A new fruit crop. Economic Botany 53:161−76

    doi: 10.1007/BF02866495

    CrossRef   Google Scholar

    [7]

    Dhawan K, Kumar R, Kumar S, Sharma A. 2001. Correct identification of Passiflora incarnata Linn., a promising herbal anxiolytic and sedative. Journal of Medicinal Food 4:137−44

    doi: 10.1089/109662001753165710

    CrossRef   Google Scholar

    [8]

    Dhawan K, Dhawan S, Sharma A. 2004. Passiflora: a review update. Journal of Ethnopharmacology 94:1−23

    doi: 10.1016/j.jep.2004.02.023

    CrossRef   Google Scholar

    [9]

    Wehtje G, Reed RB, Dute RR. 1985. Reproductive biology and herbicidal sensitivity of maypop passionflower (Passiflora incarnata). Weed Science 33:484−90

    doi: 10.1017/S0043174500082709

    CrossRef   Google Scholar

    [10]

    Stafne ET. 2022. Controlled pollination to assess intraspecific compatibility among Passiflora incarnata genotypes from different provenances. HortScience 57:919−24

    doi: 10.21273/HORTSCI16658-22

    CrossRef   Google Scholar

    [11]

    Knight RJ Jr. 1991. Development of tetraploid hybrid passion fruit clones with potential for the north temperate zone. HortScience 26:1541−43

    doi: 10.21273/HORTSCI.26.12.1541

    CrossRef   Google Scholar

    [12]

    Knight RJ Jr. 1992. Characters needed for commercially successful passion fruit. Proceedings of the Florida State Horticultural Society, Tampa, Florida, USA, 1992. Fort Lauderdale, Florida USA: Florida State Horticultural Society, Inc. pp. 280−82. https://journals.flvc.org/fshs/article/download/92925/89114/0

    [13]

    Knight RJ Jr. 1994. Problems and opportunities in passion fruit culture and development. Fruit Varieties Journal 48:159−62

    Google Scholar

    [14]

    Knight RJ Jr, Payne JA, Schnell RJ, Amis AA. 1995. 'Byron Beauty', An ornamental passion vine for the temperate zone. HortScience 30:1112

    doi: 10.21273/HORTSCI.30.5.1112

    CrossRef   Google Scholar

    [15]

    Produce news. 2022. Passion fruit popularity soars to a summer swelter. https://theproducenews.com/berries/passion-fruit-popularity-soars-summer-swelter.

    [16]

    Md Nor S, Ding P, Sea C. 2019. Role of assisted pollination in fruit shape of purple passion fruit (Passiflora edulis Sims.). International Journal of Agriculture, Forestry and Plantation 8:128−33

    Google Scholar

    [17]

    Amela Garcia MT, Hoc PS. 2011. Pollination mechanisms in Passiflora species: the common and the rare flowers – ecological aspects and implications for horticulture. In Pollination: Mechanisms, Ecology and Agricultural Advances, eds. Raskin ND, Vuturro PT. NY, USA: Nova Science Publishers Hauppauge. pp. 23.

    [18]

    Rigden P, Newett S. 2011. The passionfruit growing guide. Queensland Dept. of Employment, Economic Development and Innovation, Queensland, Australia.

    [19]

    Maier R. 2023. Breeding hardy passion fruit. https://gaertnerbuch.luberaedibles.com/en/breeding-hardy-passion-fruit-p172

    [20]

    Arjona HE, Matta FB, Garner JO Jr. 1991. Growth and composition of passion fruit (Passiflora edulis) and maypop (P. incarnata). HortScience 26:921−23

    doi: 10.21273/HORTSCI.26.7.921

    CrossRef   Google Scholar

    [21]

    Codex Alimentarius. 2014. Standard for passion fruit codex stan 316-2014. www.fao.org/fao-who-codexalimentarius/sh-proxy/en/?lnk=1&url=https%253A%252F%252Fworkspace.fao.org%252Fsites%252Fcodex%252FStandards%252FCXS%2B316-2014%252FCXS_316e_2014.pdf

    [22]

    Stafne ET (ed). 2022. Proceedings of the 2022 Passion fruit Conference: Growing the U.S. Passion Fruit Industry. A Strategic Conference for: Growers, Marketers, Researchers, and Stakeholders. Mississippi State University, Coastal Research and Extension Center Publications - 4. https://scholarsjunction.msstate.edu/crec-publications/4.

    [23]

    Knight RJ Jr. 1971. Breeding for cold hardiness in subtropical fruits. HortScience 6:157−60

    doi: 10.21273/HORTSCI.6.2.157

    CrossRef   Google Scholar

    [24]

    Quesada, P, Matta FB. 1992. Cold hardiness of Passiflora species. HortScience 27:1167

    doi: 10.21273/HORTSCI.27.11.1167e

    CrossRef   Google Scholar

  • Cite this article

    Stafne ET. 2023. Challenges in breeding and selecting Passiflora edulis f. flavicarpa × P. incarnata hybrids. Technology in Horticulture 3:16 doi: 10.48130/TIH-2023-0016
    Stafne ET. 2023. Challenges in breeding and selecting Passiflora edulis f. flavicarpa × P. incarnata hybrids. Technology in Horticulture 3:16 doi: 10.48130/TIH-2023-0016

Figures(2)  /  Tables(4)

Article Metrics

Article views(4074) PDF downloads(620)

Other Articles By Authors

ARTICLE   Open Access    

Challenges in breeding and selecting Passiflora edulis f. flavicarpa × P. incarnata hybrids

Technology in Horticulture  3 Article number: 16  (2023)  |  Cite this article

Abstract: Passiflora is comprised of many species, with P. edulis being the prominent commercial species. Another species that grows in more temperate regions is P. incarnata. Breeding to create interspecific hybrids with these two species has been done before but without longstanding success. Controlled crosses of P. edulis f. flavicarpa × P. incarnata were made to generate baseline data on interspecific passionfruit hybrids that can survive subtropical and temperate winters. The number of fruits collected per individual hybrid selection ranged from 4 to 52. Some fruits produced no seeds whereas others averaged more than 25 seeds per fruit. Pulp weight ranged from 0 to 10 g, with two individuals above 10 g. Many vines had poor pulp percentage (< 25%). A few were over 30% and two individuals were over 40%. The average width of fruit ranged between 32 and 46 mm. The overall shapes were similar among fruits. Vines with P. incarnata from Illinois (USA) as a parent produced fewer seeds, lower total fruit weight, shorter height, smaller width, lower fruit density, lighter pulp weight and pulp percentage. The vines with P. incarnata from Oklahoma (USA) as a parent made more seeds, longer height, and a more elongated shape than the other two pollen parents. Mississippi-based P. incarnata vines had the greatest average total fruit weight, hull weight, fruit width, and fruit density. Based on the results of this study, there is reason to be cautiously optimistic about interspecific hybrid Passiflora involving P. incarnata. Creating more generations with backcrossing to P. edulis is the next logical step in the process.

    • Passionfruit (Passiflora sp.) is primarily a tropical fruit, originating in South America with Passiflora edulis being the most important commercial species[1,2]. However, other species within Passiflora exist in subtropical and temperate areas. Some of these species produce fruit that may potentially be used in breeding for more cold hardy passionfruit vines. One of the most interesting of these species is P. incarnata, also called maypop. It is native to North America, especially the southeastern US[36]. It is most well-known for its pharmaceutical properties and is widely used as an anti-spasmodic and sedative[7, 8]. This diploid, herbaceous, perennial vine also can produce a sizable, edible fruit. In areas of the US where the vine is native, it is often considered a weed, as it will colonize disturbed areas within crop land or along fence rows[9]. Wild fruit of P. incarnata is highly variable in size and fruit quality and little effort has been made in selecting superior individuals for breeding. The distribution of the vine is broad, encompassing many different climates, from cold and wet (PA, NY, USA) to hot and dry (TX, USA)[6]. Evaluation of vines from across the spectrum of locations would enhance breeding efforts, but only limited work in this area has been performed.

      P. incarnata is also self-incompatible which further inhibits breeding progress[10]. Interspecific hybridization could potentially help with compatibility issues, although previous attempts have not proved successful. Knight[1113] tried for many years to cross P. edulis and P. incarnata for improved fruit quality, but a successful fruit-bearing cultivar was never released, only a colchicine-induced tetraploid ornamental ('Byron Beauty')[14].

      Passionfruit is gaining in popularity around the globe[15], but P. edulis cannot be grown everywhere successfully as it is tropical in nature and will not survive cold winter temperatures. Therefore, the purpose of this work is to develop baseline data on interspecific passionfruit hybrids involving P. incarnata that can survive subtropical and temperate winters while prospering in areas that have relatively long, hot summers.

    • The study began in 2021 and fruit was collected in 2022 at the Mississippi State University South Mississippi Branch Experiment Station in Poplarville, Mississippi, USA (lat. 30°85'36" N, long. 89°49'94" W, elevation 97 m, USDA hardiness zone 8b). Passiflora incarnata parental vines were from Villa Park, Illinois (IL), Richton, Mississippi (MS), and Guthrie, Oklahoma (OK). P. incarnata were obtained from wild plants, either via seed or root cutting. Controlled crosses (P. edulis f. flavicarpa × P. incarnata, Fig. 1) that resulted in the seedlings tested in this study were performed under a high tunnel structure where P. edulis f. flavicarpa was planted in the ground. Controlled hand pollinations were done once a flower had opened, generally between 11:00 am and 1:00 pm. An anther was removed, and pollen was rubbed on the stigma. The pollinated flower was covered by a mesh bag. Evidence of positive fertilization was observed usually within 48 h, but final determination of success was not made until fruit fully developed. Successfully developed fruit were collected when ripe and seeds were extracted. Due to limitations imposed by the COVID-19 pandemic, seeds were stored in a cool, dry environment for up to 1 year before sowing. Collected seeds were submerged in hot water and allowed to sit for 24 h prior to sowing under intermittent mist in a greenhouse. Upon emergence, all seedlings remained in the greenhouse and/or fully enclosed screened high tunnel but were removed from intermittent mist once vining habit and tendril growth started. At that stage they were then re-potted into 11.4-L pots (3-gal) pots and hand watered as needed. The vines were eventually put onto a gravel-covered nursery pad in rows with pots spaced 1.83 m (6 ft) apart within the row and 2.44 m (8 ft) between rows after chance of frost had passed and were drip irrigated. All vines were fertilized with 16 g 13-13-13 (N-P-K, Magic Carpet, Agri-AFC LLC, Decatur, AL, USA) after installation on gravel pad. Vines were allowed to attach to wire fencing material up to 1.52 m (5 ft) tall. In total there were 35 vines. Once on the gravel pad, pollinations were allowed to be made naturally via insect visitation. Eastern Carpenter Bees (Xylocopa virginica) are common in Mississippi and around these vines. Therefore, no hand pollination was done. Fruits were collected regularly once they naturally abscised from the vine from 5 July to 7 Sept. 2022. All fruit were processed immediately where they were measured for length and width with a Mitutoyo Absolute Digimatic (Mitutoyo Corp., Kawasaki, Japan). Fruit were weighed both as entire fruit and once pulp was removed. Fruit density was determined by the formula: Fd = W/(H×D), where W = fruit weight (g), H = fruit height (mm), and D = fruit width (mm). Fruit shape was calculated as H/D as described in Md Nor et al.[16]. Fruits were rated based on feel on a scale of 1 to 5, with 1 = light, empty fruit to 5 = heavy, full fruit. A visual rating of pulp content was also done after the fruits were cut in half, also on the same 1 to 5 scale.

      Figure 1. 

      Representative flower types used in interspecific crosses to develop more cold hardy fruiting passionfruit vines. Passiflora incarnata flower (left), P. edulis f. flavicarpa flower (middle), and resulting hybrid flower (right).

      Data of fruit measurements were analyzed by JMP (version 12; SAS Institute, Cary, NC, USA) using a one-way analysis of variance and means were compared with standard error of the mean or Tukey's honestly significant difference (HSD) at the 0.05 level where appropriate. Pearson product-moment correlations were performed in the multivariate procedure.

    • In total there were 35 seedling vines. Some of these had already been through one round of selection in the previous year (2021). Out of these 35, 11 were kept in 2022 as advanced selections (Table 1). The number of fruits collected per individual ranged from 4 (22R504) to 52 (20R104 and 21R308). The former had P. incarnata IL as a parent and the latter two had P. incarnata OK. Fruits were rated based on feel to gauge, non-destructively, the mass of the fruit. Most average ratings were between 3 and 4 but ranged from 1.59 (22R507) to 4.58 (20R314). After the feel rating, another the visual rating of the pulp was performed, also on a 1-5 scale. The purpose was to see how closely the ratings were aligned. The lowest ranked individuals were 22R502 and 22R504 (1.00) and the highest was 20R314 (4.50). These two ranking were significantly correlated (p < 0.0001) at 0.6586 (Table 2). In 25 out of 35 cases the feel rating was higher than the visual.

      Table 1.  Fruit related characteristics of interspecific hybrid Passiflora selections among both selections were kept for further evaluation and those that were eliminated from further analysis (not kept).

      SelectionParentageFruit #KeepFeel1Visual2Seed #Tot wt (g)Hull wt (g)HT (mm)Width (mm)Density (g/cm2)3Shape4Pulp wt (g)Pulp %5
      20R104P. edulis f. flavicarpa × P. incarnata OK52No2.381.985.6716.3712.4755.4041.430.691.342.2011.59
      20R114P. edulis f. flavicarpa × P. incarnata OK37Yes3.784.2721.9122.6112.6056.9739.100.991.469.5740.15
      20R305P. edulis f. flavicarpa × P. incarnata OK22Yes4.454.3625.5832.1719.1159.1644.591.181.3310.3633.21
      20R309P. edulis f. flavicarpa × P. incarnata OK14No3.933.149.7124.8915.1756.3842.300.981.333.1712.19
      20R314P. edulis f. flavicarpa × P. incarnata OK26Yes4.584.5022.7429.5417.0354.4942.391.211.299.5233.25
      20R426P. edulis f. flavicarpa × P. incarnata OK21No3.293.5511.2718.5614.2247.5735.711.011.355.0120.81
      21R203P. edulis f. flavicarpa × P. incarnata OK24Yes3.293.3314.5618.9411.9855.5240.650.821.375.2627.74
      21R206P. edulis f. flavicarpa × P. incarnata OK51Yes3.243.2210.3817.3811.1849.0233.080.991.495.3225.90
      21R207P. edulis f. flavicarpa × P. incarnata OK27No2.302.006.9612.039.1150.8334.390.661.492.6820.13
      21R215P. edulis f. flavicarpa × P. incarnata OK20No3.953.8513.4721.4714.4057.1438.950.941.475.4725.75
      21R217P. edulis f. flavicarpa × P. incarnata OK33No2.822.826.2015.7811.7453.0138.080.771.402.5014.36
      21R218P. edulis f. flavicarpa × P. incarnata OK33Yes3.063.3918.3318.149.6752.9137.650.871.416.4732.59
      21R221P. edulis f. flavicarpa × P. incarnata OK31No2.683.0015.5618.9713.1556.7340.180.821.415.5028.06
      21R301P. edulis f. flavicarpa × P. incarnata OK41No3.053.1715.5017.9312.1952.2837.830.871.397.3934.79
      21R303P. edulis f. flavicarpa × P. incarnata OK41Yes3.953.6617.1323.1214.6254.9040.660.991.356.8628.74
      21R304P. edulis f. flavicarpa × P. incarnata OK43Yes3.093.3014.6718.2111.7254.1037.500.861.456.0628.37
      21R308P. edulis f. flavicarpa × P. incarnata OK52No2.272.447.5915.0310.0653.5838.940.691.383.1419.50
      21R317P. edulis f. flavicarpa × P. incarnata OK6No2.331.332.0020.4820.0054.1744.910.831.200.852.35
      21R319P. edulis f. flavicarpa × P. incarnata OK41Yes3.414.0726.7122.2810.2756.5738.960.981.4510.9946.97
      22R306Frederick × P. incarnata IL30No2.432.379.0714.4010.2848.4339.870.741.223.9026.25
      22R307Frederick × P. incarnata IL25Yes3.363.8819.5718.6211.7852.8039.130.891.356.8736.87
      22R401P. edulis f. flavicarpa × P. incarnata IL16No3.132.196.9225.0315.3552.8046.630.941.143.3817.33
      22R402P. edulis f. flavicarpa × P. incarnata MS35No3.262.317.4220.6613.9053.1541.970.901.273.7219.77
      22R403P. edulis f. flavicarpa × P. incarnata MS5No3.001.400.0018.5113.0047.1936.521.041.310.000.00
      22R404P. edulis f. flavicarpa × P. incarnata MS12No3.753.5012.0021.3913.0950.3337.401.101.356.1426.96
      22R405P. edulis f. flavicarpa × P. incarnata MS20Yes3.853.3514.6425.7717.3155.3643.771.041.277.5529.30
      22R406P. edulis f. flavicarpa × P. incarnata MS20No3.452.4010.7521.5715.1249.3541.221.051.205.9324.84
      22R407P. edulis f. flavicarpa × P. incarnata MS16No3.753.2511.2023.0015.2248.5740.471.141.205.5827.77
      22R501P. edulis f. flavicarpa × P. incarnata IL23No1.611.131.0511.7311.1039.0434.340.861.130.492.39
      22R502P. edulis f. flavicarpa × P. incarnata IL9No2.111.002.0013.718.8045.4836.300.811.270.858.71
      22R503P. edulis f. flavicarpa × P. incarnata IL25No1.801.080.4111.8611.4339.2733.050.921.190.040.38
      22R504P. edulis f. flavicarpa × P. incarnata IL4No1.751.000.0013.117.7244.1032.530.811.360.000.00
      22R505P. edulis f. flavicarpa × P. incarnata IL12No2.921.675.2019.6014.3150.3241.750.961.212.4512.94
      22R506P. edulis f. flavicarpa × P. incarnata IL25No1.921.040.2115.3913.7448.2539.220.781.240.080.97
      22R507P. edulis f. flavicarpa × P. incarnata IL37No1.591.190.6310.7710.1241.9834.120.741.230.222.11
      1 Feel: (feel scale of 1−5, with 1 = light, empty fruit and 5 = heavy, full fruit). 2 Visual: (visual rating of pulp of 1−5, with 1 = light, empty fruit and 5 = heavy, full fruit). 3 Density: Fd = W/(H×D), where W = fruit weight (g), H = fruit height (cm), and D = fruit width (cm). 4 Shape: H/D, where H = fruit height (mm), and D = fruit width (mm). 5 Pulp percentage [(pulp weight/total weight) × 100].

      Table 2.  Correlations of fruit characteristics among all interspecific Passiflora hybrids selections in 2022.

      Fruit feelVisualSeed #Hull wt (g)Pulp wt (g)Pulp %Density (g/cm2)Total wt (g)
      Fruit Feel11.000.65860.65240.51290.65920.65840.76770.7084
      Visual20.65861.000.68070.04420.72150.65860.51450.3972
      Seed #0.65240.68071.000.34410.96520.90690.56810.8095
      Hull wt (g)0.51290.04420.34411.000.30730.22600.61140.8024
      Pulp wt (g)0.65920.72150.96520.30731.000.89160.66040.7853
      Pulp %30.65840.65860.90690.22600.89161.000.63060.7314
      Density40.76770.51450.65810.61140.66040.63061.000.7818
      Total wt (g)0.70840.39720.80950.80240.78530.73140.78181.00
      1 Feel: (feel scale of 1−5, with 1 = light, empty fruit and 5 = heavy, full fruit). 2 Visual: (visual rating of pulp of 1−5, with 1 = light, empty fruit and 5 = heavy, full fruit). 3 Pulp percentage [(pulp weight/total weight) × 100]. 4 Density: Fd = W/(H×D), where W = fruit weight (g), H = fruit height (cm), and D = fruit width (cm).

      Seed number was counted for each fruit and then averaged over all collected fruits for each individual vine. Some fruits produced no seeds (22R403 and 22R504) whereas others had more than 25 seeds per fruit (20R305 and 21R319) (Table 1). The presence of many seeds was an indicator of significant pulp presence. As would be expected with any segregating population only one generation from wild material, average total weight of the fruit varied greatly among the individual vines. Some were small, close to 10 g (22R507) and some were much larger, over 30 g (20R305). Of course, there are different components encompassing the total weight, namely hull weight and pulp weight (including seeds). Hulls of P. incarnata are thinner than those of P. edulis and that difference in thickness can affect postharvest shelf life. In general, hull weights ranged between 10 to 20 g, with a few less than 10 g and only one at 20 g (Table 1). Pulp weight ranged from 0 to 10 g, with two individuals above 10 g (20R305 and 21R319), both of which have P. incarnata OK as a parent. Pulp % [(pulp weight/total weight) × 100] was a strong indicator for advancing a selection. Many vines had poor pulp percentage (< 25%). A few were over 30% and two individuals were over 40% (20R114 and 21R319). Fruit density is a non-destructive measure of how full a fruit is of pulp while accounting for fruit size (g/cm2). Fruit densities were mostly < 1.00 but some were higher.

      In terms of harvested fruit, shapes were almost exclusively longer than wide. Most were greater than 40 mm and many over 50 mm and only two were less than 40 mm (22R501 and 22R503). The average width of fruit ranged between 32 and 46 mm. The overall shape (height/width) were similar among all fruits with all being over 1.00 (round) and they were categorized as oblong spheroid[16].

      All correlations of measured traits were significant at p < 0.05 except for hull weight and visual assessment (Table 2). Fruit density was positively correlated with feel and total fruit weight (r = 0.7677 and 0.7818, respectively). This would indicate that any of these three non-destructive measures could potentially be used equally. Total weight was highly correlated with seed number (r = 0.8095), pulp weight (r = 0.7853), and pulp percentage (r = 0.7314). Feel was also correlated with those same variables but lower (r = 0.6524, r = 0.6592, and r = 0.6584). Fruit density was similar to feel (r = 0.6581, r = 0.6604, and r = 0.6306). Therefore, total fruit weight, as a non-destructive measure, was the best indicator of seed number, pulp weight, and pulp percentage in this study (Table 2).

      When it came to influence of male parent on traits, IL was clearly behind both MS and OK (Table 3). Vines with IL as a parent produced fewer seeds, lower total fruit weight, shorter height, smaller width, lower fruit density, lighter pulp weight and pulp percentage. Those vines with OK as a parent made more seeds, longer height, and a more elongated shape than the other two pollen parents. MS-based vines had the greatest average total fruit weight, hull weight, fruit width, and fruit density. MS and OK were not different in pulp weight and pulp percentage.

      Table 3.  Fruit measurements by Passiflora incarnata male parent among all interspecific hybrid selections in 2022.

      MaleTotal wt (g)Hull wt (g)Height (mm)Width (mm)Density (g/cm2)2Shape3Pulp Wt (g)Pulp %4Seed #
      IL14.8 c11.5 b45.9 c37.6 c0.83 c1.23 c2.00 b11.9 b5.0 c
      MS22.1 a14.8 a51.6 b41.2 a1.02 a1.26 b5.24 a23.8 a10.3 b
      OK19.5 b12.3 b54.1 a38.8 b0.89 b1.40 a5.90 a27.2 a14.3 a
      P value1< 0.0001< 0..0001< 0.0001< 0.0001< 0.0001< 0.0001< 0.0001< 0.0001< 0.0001
      1 Means within a column followed by the same letter are similar according to Tukey's honest significant difference (HSD) at p ≤ 0.05. Means followed with different letters within a column are significantly different. 2 Density: Fd = W/(H×D), where W = fruit weight (g), H = fruit height (cm), and D = fruit width (cm). 3 Shape: H/D, where H = fruit height (mm), and D = fruit width (mm). 4 Pulp percentage: [(pulp weight/total weight) × 100].

      After selections were made, the individual selections kept were significantly higher/better in all traits categories except for fruit width (p = 0.3698) and hull weight (p = 0.2415) (Table 4). Eleven out of 35 vines were chosen as advanced selections. Those chosen to advance had much higher seed numbers and pulp weights, which are highly correlated (r = 0.9652). Fruit that was full of pulp had the highest priority in the selection process and that was borne out in the results (Table 4).

      Table 4.  Resulting traits of interspecific Passiflora vine selections that were kept and those discarded during the 2022 season.

      Seed #Total wt (g)Height (mm)Width (mm)Density (g/cm2)2Shape3Pulp wt (g)Hull wt (g)
      Kept18.221.754.339.00.971.407.512.6
      Discarded7.016.950.438.70.841.313.012.2
      P value1< 0.0001< 0.0001< 0.00010.3698< 0.0001< 0.0001< 0.00010.2415
      1 Means within a column are different according to Tukey’s honest significant difference (HSD) at p ≤ 0.05. 2 Density: Fd = W/(H×D), where W = fruit weight (g), H = fruit height (cm), and D = fruit width (cm). 3 Shape: H/D, where H = fruit height (mm), and D = fruit width (mm).
    • Making selections in a new breeding program is challenging, especially when the crop is new or underutilized. The priority was to identify the most important traits to move a vine from general population to improved selection. In the case of interspecific hybrid passionfruit (i.e., Passiflora edulis x P. incarnata), there is insufficient literature to rely upon to establish fruit quality parameters. While cold hardiness is the primary goal, other traits are also important and easier to assess without being destructive and a level of increased cold tolerance is assumed at this stage. Based on prior observation of earlier populations of interspecific seedlings and knowledge regarding self-incompatibility in both Passiflora species, the most important trait to select for was fully filled fruit. Poor pollination can lead to fruit that has normal size but has few or no pulp or seeds[17]. Since the flowers were not hand-pollinated and pollination relied solely on insect pollinator activity, vines that produced well-filled fruit would be viewed as desirable in contrast to fruit that were only partially filled. The second consideration was fruit size. Average fruit size for P. incarnata can vary but may range between 30 and 40 g but may get to nearly 60 g[10]. Passiflora edulis also has a wide range depending on type. Purple fruit is usually far smaller than yellow or red fruit (Fig. 2), ranging from ~80g for purple to ~150 or more for yellow and red[1819]. Since these species were crossed, one would expect to see intermediate traits, including fruit weight; however, this was not the case. Fruit weights were smaller than either parent (Table 1), although fruit from some selections approached that P. incarnata. Arjona et al.[20] reported decreased fruit weight in container-grown P. incarnata vines in a greenhouse. Knight[11] found a wide range of fruit weights among Passiflora hybrids, some results similar to what was observed in the present study. However, in the study by Knight[11] the vines were tetraploid and thus were able to achieve larger size and heavier fruit weights. Conditions reported in other studies likely differed substantially from this one, yet the small fruit weight is a concern. It is important to have fruit that is not too small, such that consumers find it potentially a poor value. Because fruit fill and fruit size were the most important overriding factors in advancing selections in this study, other traits such as sugar and acid levels were not considered but will be in the next round of selection.
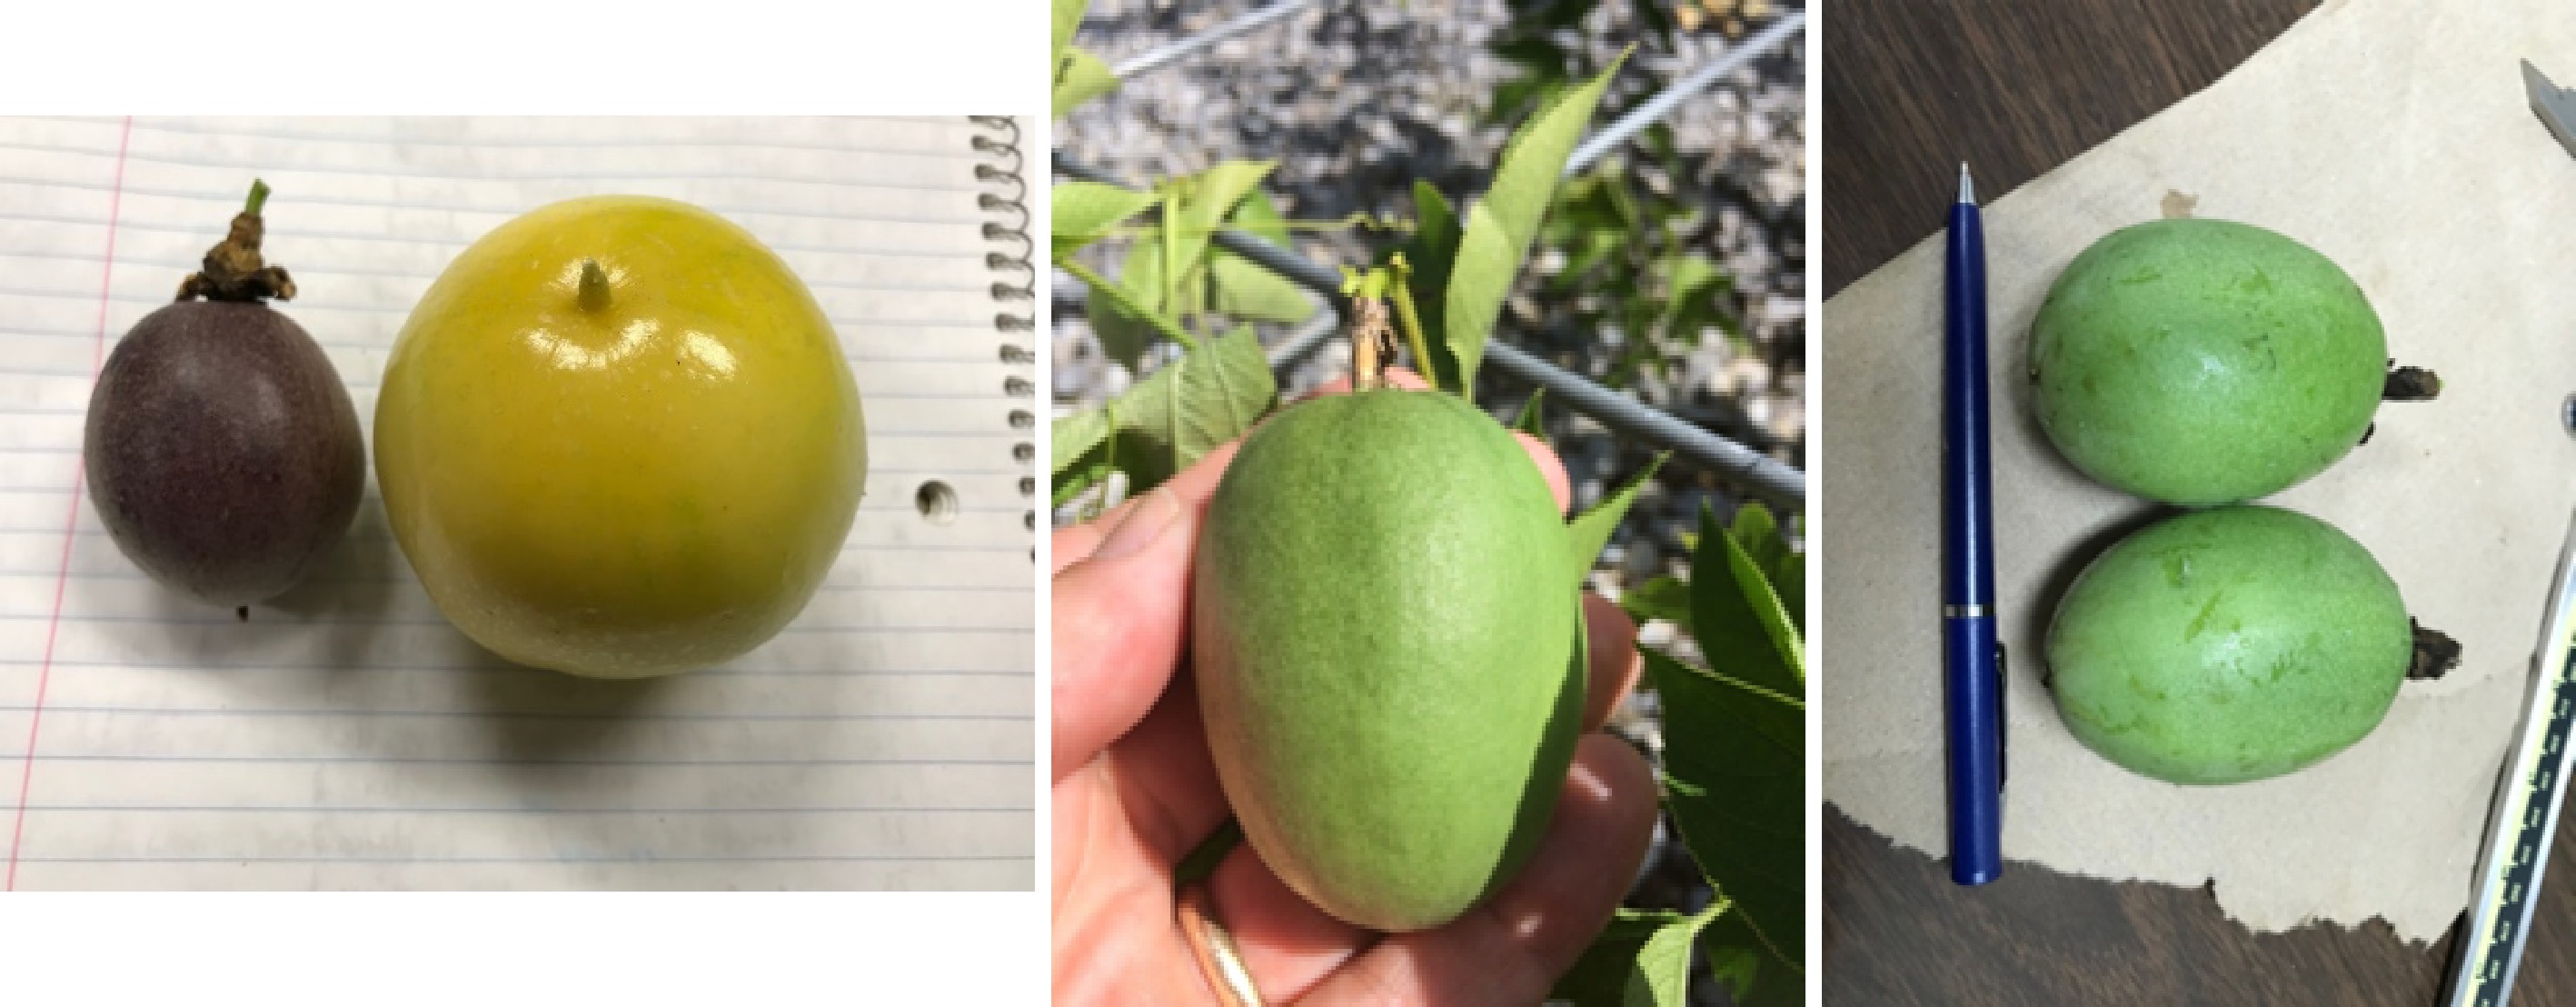
      Figure 2. 

      Fruit from P. edulis (purple and yellow) (left), P. incarnata (middle) and hybrid fruit (right). Hybrid fruit remained green similar to the P. incarnata parent.

      Fruit fill cannot be determined solely based on visual assessment of the whole fruit, nor by total fruit weight. Percent pulp can be measured via destructive measurement, but this is time consuming. A physical assessment of fruit fill can be done without measuring the amount of pulp, but it is subject to unmeasurable variables such as hull weight and thickness that make feel-based ratings a potentially inaccurate metric. Therefore, a non-destructive method to aid in the selection making process would be extremely useful. Fruit density proved to be similar to other methods (Table 2) for estimating fruit fill and could have potential as more data are collected to determine its appropriateness.

      Fruit shape was a less important consideration in the selection process as well. Most of the fruit was oblong, although not extremely so. Most P. edulis fruit are round or near-round and therefore that shape is the accepted standard for passionfruit[21]. With backcrossing, future selections may come closer to the round shape that is expected of passionfruit, but as the American consumer by-and-large has little knowledge of passionfruit it may be possible to introduce other fruit shapes into the marketplace.

      High seed number is desirable because an aril must have a seed to form (there are currently no seedless passionfruit although the possibility is being explored[22]), but seeds of P. incarnata are larger and harder than P. edulis. Hybrids produced intermediate sized seeds, but they were still considerably more noticeable than P. edulis seeds. Passiflora edulis seeds can be readily consumed, as they are small enough to not be noticed. Separating the seeds from the pulp is labor intensive as well. The future of passionfruit production in the US is in fresh fruit consumption and not the processing market due to the relatively inexpensive volume of juice and pulp that is imported from South America[22].

      Breeding with wild or native plant material can be a long-term endeavor. Numerous challenges exist within Passiflora that make progress difficult, especially in interspecific breeding efforts with P. incarnata. These obstacles include large seed size, poor fruit fill (poor pollination, self-incompatibility), low fruit quality, smaller fruit size, and short postharvest shelf life.

      One big advantage for using P. incarnata is the improvement in cold hardiness[11,13,19,23]. While there are problems with incompatibility and hybrid sterility[10,23] when using this species, successful crosses can be made. Since P. incarnata is an herbaceous vine, it will die to the ground starting in fall. Yet, early in the following spring it will emerge from the roots and within weeks it will produce flower buds. Conversely, the P. edulis vine is woody and can be severely damaged by cold temperatures. In south Mississippi, vines of P. edulis f. flavicarpa were completely killed by temperatures of 22 °F (−5.6 °C) even when grown under a high tunnel structure. Interspecific hybrid vines show intermediate growth habit, partially dying back in fall and winter. This could potentially leave them susceptible to damage at low temperatures aboveground. Observations of interspecific hybrids vines in south Mississippi have shown them to vary in their ability to handle cold temperatures, with some dying and some returning strongly from the roots. Appropriate selection for cold hardiness will be needed to progress breeding efforts.

    • There is reason to be cautiously optimistic about interspecific hybrid Passiflora involving P. incarnata. However, as seen in previous studies, the challenges are significant toward the production of a commercially viable fruit. In the case of this study, the fruit obtained was smaller than desired with lesser fruit quality than that of P. edulis. Therefore, creating more generations with backcrossing to P. edulis is the next logical step in the process with the expectation of incremental losses of cold hardiness. Additional proxy experiments of cold hardiness, such as differential thermal analysis and electrolyte leakage[24] will be performed as it becomes necessary to determine more precise estimates of tolerances to cold temperatures.

      • The author thanks Jeremy Edwards, Robert Gabella, and Jennifer Sherrill, for providing Passiflora incarnata plant material and Jenny Ryals and Haley Williams for early reviews of the paper. The project was founded through a Specific Cooperative Agreement between Mississippi State University and USDA-ARS, supported by the Mississippi Agricultural, Forestry and Experiment Station and Mississippi State University Extension Service. This material is based upon work that is supported by the National Institute of Food and Agriculture, US Department of Agriculture, Hatch project under accession number MIS-211150.

      • The author declares that there is no conflict of interest.

      • Copyright: © 2023 by the author(s). Published by Maximum Academic Press, Fayetteville, GA. This article is an open access article distributed under Creative Commons Attribution License (CC BY 4.0), visit https://creativecommons.org/licenses/by/4.0/.
    Figure (2)  Table (4) References (24)
  • About this article
    Cite this article
    Stafne ET. 2023. Challenges in breeding and selecting Passiflora edulis f. flavicarpa × P. incarnata hybrids. Technology in Horticulture 3:16 doi: 10.48130/TIH-2023-0016
    Stafne ET. 2023. Challenges in breeding and selecting Passiflora edulis f. flavicarpa × P. incarnata hybrids. Technology in Horticulture 3:16 doi: 10.48130/TIH-2023-0016

Catalog

  • About this article

/

DownLoad:  Full-Size Img  PowerPoint
Return
Return