ARTICLE   Open Access    

Toxicity of fusaric acid and beauvericin in tissue-cultured banana 'Grand Nain' and 'Lakatan'

More Information
  • Fusarium oxysporum forma specialis cubense (Foc) produces toxins known to contribute to virulence and infection in the host. Fusaric acid (FA) and beauvericin (BEA) are major toxins contributing to Foc virulence in the host plant. Recent advancements allow the production of disease-resistant crops via cell selection, a process that involves resistance screening of somaclones using phytotoxin exposure. Determination of the appropriate concentration is an important step for the toxin-based selection of disease-resistant plants. In this study, the toxicity of FA (0, 5, 10, 20, 30, 50, and 100 μm) and BEA (0, 5, 10, and 20 μm) in different tissues of banana cv. ‘Grand Nain’ and 'Lakatan' were investigated. Overall results indicated a positive relationship between the toxin concentration and plant sensitivity, as indicated by the degree of vascular browning rate. Results demonstrated that lower concentrations of BEA are required for phytotoxicity than in FA. Furthermore, a higher degree of vascular browning was recorded in the test tissues of ‘Lakatan’ treated with FA and BEA than in the ‘Grand Nain’ genotype suggesting genotype-dependent sensitivity of banana to phytotoxins. To our knowledge, this study is the first to investigate the phytotoxicity of FA and BEA in callus cultures of banana ‘Lakatan.’
  • Carnation (Dianthus spp.) is popular ornamental flower; D. caryouphyllus and D. chinensis are widely planted and enjoyed by people worldwide. Flowers, as important ornamental plants, are widely studied. Varied flower shapes or florescence affect the economic value of ornamental plants. Thus, understanding the molecular mechanism of floral organ development and functional differentiation of these regulatory genes in carnation will aid in accelerating breeding improvement.

    As early as 1991, the 'ABC model' of flower development was proposed in Arabidopsis thaliana and Antirrhinum majus[1]. In this model, class A, class B and class C genes were thought to regulate floral organ formation. Subsequently, the class E genes involved in the formation of floral organs were later discovered[2]. In Arabidopsis, four SEP genes were identified[35]: AtSEP1, AtSEP2, AtSEP3 and AtSEP4, all of which were expressed in the primordia of four whorl floral organs[6]. None of these four genes had any phenotype if they were individually mutated. However, in sep1/sep2/sep3 mutants, the petals, stamens and carpels of plants all changed into calyx sheet structures[2]. In the sep1/sep2/sep3/sep4 mutants, the normal floral primordium was absent, and all four floral organs became leaf like structures, suggesting that SEP genes were indispensable in controlling floral primordium formation[79].

    Subsequently, the classical 'ABC model' of flower development was further improved with the discovery of the function of class E genes. The 'Floral quartets model'[10] was proposed, which showed that class A-, B-, C- and E- proteins interacted to regulate plant flowering and were continuously developing: AP1–AP1–SEP–SEP protein interactions were involved in sepal development, AP1–AP3–PI–SEP interactions determined petal development, AG–AP3–PI–SEP interactions determined stamen development, AG–AG–SEP–SEP interactions determined carpel development and AG–SHP–STK–SEP interactions determined ovule development[11]. In this model, every whorl of floral organ formation was regulated by at least one SEP protein, so class E genes were referred to as the 'glue' in the 'quartet model'[11,12].

    In recent years, the function of class E genes has been reported in an increasing number of species. Previous studies have shown that the number of class E genes identified varies among different species; for example, two class E genes were identified in watermelon[13], four in Prunus mume[14], five in Oryza sativa[15] and ten in Brassica rapa[16]. These genes belonged to different subclades of class E genes, such as the SEP1/2, FBP9/23 and SEP4 subclades, which were derived from LOFSEP, which produced two consecutive gene copies in dicotyledons[6].

    Previous studies have also found that the functions of SEP genes in many plants[1723] are diverse, which may be involved in determining floral organ identity and plant architecture, fruit maturation and the transition from vegetative growth to reproductive growth processes. For example, in Phalaenopsis orchid, silenced PeSEP3 made the tepal a leaf-like organ. Downregulation of TM29 caused tomato parthenocarpic fruit development and floral reversion. However, in strawberry, FveSEP3 inhibited fruit growth in the absence of pollination and promoted fruit ripening[24]. These reports suggested that class E genes experienced functional redundancy and new functionalization in the process of evolution. However, to date, the roles of class E genes in flower development or whether they experience sub-functionalization and neo-functionalization in carnation remain unclear.

    In this study, through transcriptome comparative analysis, we found that the expression of class E genes increased gradually in the first three stages (Sepal (S2), petal (S3), and stamen (S4) primordium development) after flowering initiation (S1). To explore the roles of class E genes in the development of flowers in carnation, six SEP-like genes were identified in D. chinensis. Then the expression patterns of these class E genes were analyzed by quantitative real-time PCR (qRT‒PCR). The interactions of class E proteins of D. chinensis were also investigated by yeast two-hybrid (Y2H) and bimolecular fluorescence complementation (BiFC) assays. In addition, the functions of SEP3 genes with different expression and interaction patterns were analyzed. This study demonstrated the role of class E genes in flower development, which lays a theoretical foundation for understanding the mechanism by which ABCE proteins in carnations regulate flower development and is of guiding significance for the directional improvement of carnation flower patterns.

    D. chinensis 'L', a high-generation inbred line, were grown in an experimental field under natural conditions at Huazhong Agricultural University, in Wuhan, Hubei Province, China (30°28'36.5" N, 114°21'59.4" E). Six samples of different organs (stems and leaves during vegetative growth; sepals, petals, stamens, and pistils of flowers) were collected from D. chinensis 'L'. For each biological replicate, the samples were extracted and then immediately frozen in liquid nitrogen and stored at −80 °C until RNA extraction. Arabidopsis plants were grown under long-day conditions (16-h light/8-h dark cycle) at 22/21 °C day/night in an illumination incubator.

    Samples from different floral primordium development stages were identified under the microscope. Shoots were fixed and sectioned following previously described methods[25]. Transcriptome samples from six different flower developmental stages were sequenced and obtained (PRJNA574036). The RNA-seq reads were mapped to the new carnation genome[26] using HISAT2[27]. Principal component analysis (PCA) of the samples was performed using the prcomp function in R software. The expression levels of each gene in each RNA-seq library were calculated as the fragments per kilobase of exon model per million mapped fragments (FPKM). The average FPKM value across three biological replicates was calculated and represented in a heatmap.

    Based on transcriptome data (PRJNA533533 and PRJNA574036)[28] and the two published genomes of the carnation[26,29], primers of the D. chinensis class E genes were designed specifically by Primer Premier 5.0 (Supplemental Table S1). Total RNA was isolated from flower buds of D. chinensis 'L' using EASYspin Pant RNA kit reagent according to the manufacturer's instructions. To remove potentially contaminating genomic DNA, RNA was treated with RNase−free DNase (Promega, USA). First strand complementary DNA (cDNA) was synthesized from 1 μg total RNA with the Prime Script TM RT Reagent Kit with gDNA Eraser (Takara, Otsu, Japan) following the manufacturer's instructions. All target fragments were cloned into the pMDTM18−T vector (TaKaRa, China) to transform DH5α Escherichia coli (Shanghai Weidi Biotechnology, China) and sequenced. The plasmids were extracted by Plasmid Miniprep Kit I (Biomiga, USA) and stored at −80 °C. The full-length coding sequences (CDS) of six DcSEP genes are shown in Supplemental Table S2.

    A total of 52 class E genes from different species, including the AtAP1 gene as an outgroup, were used for phylogenetic analysis (Supplemental Table S3). Protein sequences were obtained from NCBI (www.ncbi.nlm.nih.gov) and previous reports[30]. The amino acid sequences were aligned with the DNAMAN v6.0.x program. A phylogenetic tree was constructed using MEGA v6.0[31] by the neighbor joining (NJ) method with 1,000 iterations for the bootstrap values.

    Total RNA of each sample was extracted using an EASYspin Plant RNA kit reagent (Aidlab Biotechnologies, Beijing, China) according to the manufacturer's instructions. The specific primers of six DcSEPs for qRT−PCR were designed within the nonconservative C-terminal region using Primer Premier 5.0 software and are listed in Supplemental Table S4. The qRT−PCR was conducted using SYBR Premix Ex Taq (Takara, Beijing, China) and the ABI Prism 7500 Sequence Detection System (Applied Biosystems, Beijing, China). Each PCR was performed with three biological and three technical replicates. The housekeeping gene DcGAPDH was selected as an internal quantitative control (Supplemental Table S4). The relative expression values were calculated using the comparative CT(2−ΔΔCᴛ) method[32].

    Floral buds were divided into six developmental stages: Stage 1 (S1): the stage of floral initiation, S2: sepal primordium development stage, S3: petal primordium development stage, S4: stamen primordium development stage, S5: carpel primordium development stage, S6: late stage of differentiation of floral organ primordium. Samples of different flower bud differentiation stages were fixed overnight in fresh FAA (3.7% formaldehyde, 5% acetic acid, and 50% ethanol). Samples were finally embedded in paraffin for subsequent use of tolonium chloride as a dye. After the sections were sliced, they were observed and photographed under a Jiangnan NLCD500 microscope (Jiangnan, Nanjing, China).

    The GAL4-based Matchmaker Two-Hybrid System (Clontech) was used. Every full-length ORF of class E genes from D. chinensis was fused into pGADT7 or pGBKT7 to form the prey or bait constructs, respectively. The bait and prey plasmids were cotransformed into yeast strain AH109 and spotted on medium lacking leucine and tryptophane (SD/–Leu–Trp, Coolaber, Beijing, China). Protein interactions were tested on SD/–Leu–Trp–His–Ade plates (Coolaber, Beijing, China). X-α-Gal (5-Bromo-4-chloro-3-indolyl-α-Dgalactopyranoside) was used as a substrate to quantify the interaction affinity. Each combination was gradient diluted separately. To confirm the reliability of the results, at least three individual clones were used for each combination. The primers used were listed in Supplemental Table S5.

    To verify the reliability of the yeast two-hybrid assay results, the CDSs of DcSEP1 and DcSEP3-1, DcSEP3-2, DcSEP4-1 and DcSEP4-2 (without stop codon) were amplified with the primers (Supplemental Table S6) and cloned into the pGBKT7-gene and pGADT7-gene separately to create DcSEP4-2-YFPN, DcSEP1-YFPC, DcSEP3-1-YFPC, DcSEP3-2-YFPC and DcSEP4-1-YFPC constructs. The constructs carried by Agrobacterium tumefaciens GV3101 were used for the transfection of 5-week-old Nicotiana benthamiana leaves, according to the protocol described by Walter et al.[33]. After 2-day culture, the samples were observed with a fluorescence microscope (LEICA, DM2500).

    The pMD18-T vectors containing CDS of DcSEP3s genes were digested by restriction enzymes, and the target fragments were ligated into the corresponding sites of vector, modified from the binary vector pCAMBIA2300 containing the CaMV35S promoter, resulting in 35S:DcSEP3-1 and 35S:DcSEP3-2 constructions, respectively. All the constructed plasmids were confirmed by PCR and sequenced. The resulting plasmids were then transformed into the A. tumefaciens strain GV3101. The floral dip method in Arabidopsis was carried out as previously described[34]. The transformed seeds were screened on Murashige and Skoog (MS) agar with 50 μg·ml−1 kanamycin and 50 μg·ml−1 cefotaxime. T2 plants were used in this study.

    Statistical significance was checked using GraphPad Prism version 9.0 for one-way ANOVA. And significant difference was shown at p < 0.01 (**).

    The floral organ primordium of developing D. chinensis 'L' was divided into six typical stages: Stage 1 (S1): the stage of floral initiation, S2: sepal primordium development stage, S3: petal primordium development stage, S4: stamen primordium development stage, S5: carpel primordium development stage and S6: late stage of differentiation of floral organ primordium (Fig. 1a). The total RNA was isolated from the flowers of the six stages and sequenced using the Illumina platform, generating more than 21 million high-quality reads representing more than 6 Gbp in every sample. (Supplemental Table S7). Q30 values (sequencing error rate < 1%) ranged from 89.95% to 95.47%. The PCA plot showing clustering of three biological replicates of different stages of flower development was high, indicating that the dataset was reliable (Fig. 1b). Based on the recently published carnation genome[26], we aligned the sequencing reads to the reference genome and calculated the expression levels (FPKM) (Fig. 1c). The results showed that there were more than 2,000 genes with FPKM values > 60, more than 6,000 genes with FPKM values between 15 and 60, and more than 20,000 genes with FPKM values < 1 in each sample (Supplemental Table S8).

    Figure 1.  Transcriptome sequencing of flowers at different floral organ primordium developmental stages in D. chinensis. (a) Floral organ primordium at different developmental stages. (b) Principal component analysis (PCA) analysis of different samples. (c) The expression in floral organ primordium at different stages. S1: the stage of floral initiation. S2: Sepal primordium development stage. S3: Petal primordium development stage. S4: Stamen primordium development stage. S5: Carpel primordium development stage. S6: Late stage of differentiation of floral organ primordium. br. bract; se. sepal; pe. petal; st. stamen; ca. carpel.

    We conducted a comparative analysis of the DEGs using five combinations of stages that represented major changes in floral organ primordium development (S2_vs_S1, S3_vs_S2, S4_vs_S3, S5_vs_S4 and S6_vs_S5). There were 976 (S2_vs_S1), 1,398 (S3_vs_S2), 1,335 (S4_vs_S3), 1,521 (S5_vs_S4), and 410 (S6_vs_S5) upregulated DEGs identified, and 411, 1,539, 966, 1,792, and 845 down-regulated DEGs identified, respectively (Fig. 2a). Among them, MADS-box genes were only present in upregulated DEGs with floral organ primordium development. Especially during the first three developmental stages (S2–S4) after flower initiation (S1), there were a greater number of MADS-box DEGs (Fig. 2b). In contrast to other MADS-box genes, we found that class E genes were only differentially expressed in the first two comparison groups (S2_vs_S1, S3_vs_S2) (Fig. 2c), which suggested that class E genes may play important roles in the development of the sepal primordium and petal primordium.

    Figure 2.  Analysis of differential expression genes in different floral organs primordium development stages. (a) Bar graph showing differential expression genes (DEG) number of up-regulated and down-regulated in different pair comparisons (S2_vs_S1, S3_vs_S2, S4_vs_S3, S5_vs_S4 and S6_vs_S5). (b) The number of ABCE class MADS-box genes with differentially expressed in different comparison. (c) The DEGs of class E genes in each different comparison are displayed. Red represents up-regulated genes and blue represents down-regulated genes.

    Based on the MADS-box genes identified from two carnation genomes, genome_v0 and genome_v1[26,29], we identified the known class ABCE genes and found that the number of class ABC genes was the same in the two carnation genomes. The number of class E genes was six in genome_v0[29] published in 2014 and five in genome_v1 published in 2022[26]. To further confirm the members of class E genes in D. chinensis, the E genes were amplified using cDNA from D. chinensis as a template. Then, six DcSEP genes were identified and amplified in D. chinensis. Finally, a total of 15 full-length ABCE genes were obtained. Then, a phylogenetic tree was constructed by using the MADS-box proteins from D. chinensis and other species (Fig. 3). Referring to the naming of D. caryophyllus proteins[30], the corresponding D. chinensis genes were designated AP1 (DcAP1), FUL (DcFUL), AP3 (DcAP3-1 and DcAP3-2), PI (DcPI and DcPI2), TM6 (DcTM6), AG (DcAG1 and DcAG2), and SEP (DcSEP1, DcSEP3-1, DcSEP3-2, DcSEP4-1, DcSEP4-2, and DcSEP4-3).

    Figure 3.  The phylogenetic tree of the class A-, B-, C- and E- proteins. The subgroups are indicated by different colors.

    To further identify the subclade of class E genes, these class E amino acid sequences were aligned which showed that they all had the conserved MADS domain and K domain as well as the typical SEPI and SEPII terminal motifs (Supplemental Fig. S1). The similarity of these class E amino acid sequences in D. chinensis and D. caryophyllus was between 95.86 and 100% (Supplemental Table S9). In addition, we found that the number of class E genes in different published species was different (Table 1, Supplemental Fig. S2). Among them, the number of both SEP1/2/4 and SEP3 subgroup members varied, such as in the SEP3 subgroup, three members in B. rapa, two members in Triticum aestivum and only one member in Citrullus lanatus and P. mume. This result indicated the difference in class E genes among different species.

    Table 1.  The number and references of class E homologous genes in different species.
    SpeciesE genesSEP1/2/4
    subclass
    SEP3 subclassReference
    C. lanatus211[13]
    P. mume431[14]
    O. sativa532[15]
    B. rapa1073[16]
    A. thaliana431[46]
    T. aestivum862[35]
    D. caryophyllus642[30]
    D. chinensis642This study
     | Show Table
    DownLoad: CSV

    To investigate the molecular mechanism underlying floral organ identity, the expression patterns of these genes were assayed using transcriptome data and qRT–PCR (Fig. 4). We applied the FPKM value obtained via transcriptome profiling to generate a heatmap for the DcMADS-box gene expression patterns during floral development (Fig. 4a). The results revealed that DcAP1 and DcFUL1 were expressed at the early stage of floral development (S1), in which the shoot apical meristem (SAM) transformed into flower meristem and the bract primordium differentiated, and their expression level increased gradually with the development of floral organs. Regarding class B, DcPI and DcPI2 (PI homologs), DcAP3-1 and DcAP3-2 (AP3 homologs), and DcTM6 were all expressed from the petal primordium at stages 3–6, but the expressions of DcAP3-1 and DcPI2 were low and their expression level increased from S4. DcAG1 began to be expressed after flowering initiation (S1), but DcAG2 began to be expressed after the emergence of the stamen primordium (S4). DcSEP3-1 was expressed in sepal and petal primordia at stages 3 and 4, while DcSEP3-2 had lower expression than DcSEP3-1, and its expression activation stage was later than that of DcSEP3-1. The expression pattern of DcSEP4-2 was similar to that of class A genes and DcSEP1 and they are grouped together. The expression pattern of DcSEP4-1 was similar to that of DcSEP3-2 and expressed from petal primordium development. Overall, ABCE genes exhibited dynamic expression patterns in different flower development stages. In addition, the qRT–PCR results also showed that the gene expression patterns of class E genes were different in the tissues and organs of D. chinensis (Fig. 4bc).

    Figure 4.  Analysis of expression in D. chinensis E class genes at different tissues and stages. (a) The spatial expression patterns of class E genes in developing flowers of D. chinensis as revealed by RNA-seq. (b) The expression of six class E genes of D. chinensis in different organs were detected by qRT–PCR. Error bars indicate the collective standard deviations of three biological replicates and three technical replicates. se, sepal. pe, petal. st, stamen. ca, carpel. ste, stem. le, leaf. (c) The different organs of D. chinensis.

    To clarify how homologous or heterologous dimers can be formed among six class E proteins and other MADS-box proteins in D. chinensis, the yeast two-hybrid method was used in this study to analyze the interaction patterns of these proteins (Fig. 5 and Supplemental Fig. S3). None of the selected proteins were self-activated (Supplemental Fig. S4).

    Figure 5.  The interaction statistics of class E proteins with other class A−, B−, C genes in D. chinensis. '+' in light orange represents weak interaction; '++' in orange represents moderate interaction; '+++' in deep orange represents relatively strong interaction; '++++' in brown represents strong interaction; '−' in bule represents that there is no detectable interaction of proteins, '\' in grey represents did not cover in this study.

    The results showed that the class E proteins DcSEP3-1, DcSEP3-2, DcSEP4-2 and DcSEP4-3 interacted with more proteins than DcSEP1 and DcSEP4-1 (Fig. 5 and Supplemental Fig. S3). The DcSEP3-1 protein interacted with one class A protein (DcAP1), while DcSEP3-2 and DcSEP4-3 interacted with the other class A protein (DcFUL1). DcSEP4-2 interacted with two class A proteins. DcSEP4-2 lightly interacted with DcAP1 and had a relatively strong interaction with DcFUL1. Four class E proteins (DcSEP3-1, DcSEP3-2, DcSEP4-2 and DcSEP4-3) all interacted with DcPI and DcPI2 of class B. Among them, DcSEP3-2 still interacted with DcTM6 of class B, and DcSEP4-2 interacted with DcAP3-1. For the interaction with class C genes, DcSEP3-1, DcSEP3-2, DcSEP4-2 and DcSEP4-3 all interacted with DcAG1 and DcAG2. Moreover, the proteins of class E not only interacted with class A-, B- and C- proteins but also, they interacted with their own proteins to form homologous dimers, such as DcSEP3-1, DcSEP3-2, DcSEP4-2 and DcSEP4-3 (Fig. 5 and Supplemental Fig. S3). To verify the reliability of the results, four combinations of DcSEP4-2 interactions with other proteins (DcSEP1, DcSEP3-1, DcSEP3-2 and DcSEP4-1) were selected for BiFC experiments (Supplemental Fig. S5) and showed similar results to those of Y2H, suggesting that the two methods being mutually supportive. Overall, compared other subclade, the interactions of the SEP3 subclade were the richest in all the protein interactions of class E genes. It is speculated that SEP3 subclade functions are more important. Moreover, the two genes (DcSEP3-1 and DcSEP3-2) belong to the same subclade have different interaction patterns, which suggesting that they play different roles in flower development.

    To further investigate the roles of the two DcSEP3s in flower development, the constructed vectors containing DcSEP3-1 and DcSEP3-2 were transformed into Arabidopsis. Transgenic plants were obtained by screening. The relative gene expression levels of these transgenic plants and wild-type Arabidopsis were analyzed (Fig. 6). Ectopic expression of DcSEP3-1 and DcSEP3-2 strongly influenced flowering time and plant architecture. Phenotypic analysis of transgenic lines showed that overexpression of DcSEP3-2 genes in Arabidopsis resulted in early flowering, smaller rosettes, dwarfism, abnormal floral organs and the number of rosette leaves decreased significantly compared with the wild type (Fig. 6 and Supplemental Figs S6 & S7). The transgenic line overexpressing DcSEP3-1 only showed an early-flowering phenotype (Fig. 6 and Supplemental Fig. S7). All these results further suggested that two DcSEP3 genes of D. chinensis were sub-functionalized.

    Figure 6.  Phenotype and expression analysis of D. chinensis class E genes overexpression in A. thaliana. (a) Transgenic plant of 35S:DcSEP3-1 (left), Columbia (Col) Arabidopsis (right). (b) Transgenic plant of 35S:DcSEP3-2. (c) Expression of DcSEP3-1 in transgenic lines. (d) Expression of DcSEP3-2 in transgenic lines. Data represent the mean ± SE from three biological replicates, and AtEF1a was used as internal control. Significant difference was shown at p < 0.01 (**).

    Class E genes play significant roles in floral organ development, and every whorl of floral organ formation is regulated by at least one SEP protein[7,36]. In our results, the expression patterns of the six class E genes were different not only at different floral organ primordium developmental stages, but also in different tissues based on the transcriptome data and qRT–PCR analysis. For example, DcSEP1 and DcSEP4-2 were expressed from the S2, and DcSEP3-1 was expressed from the S3. DcSEP1 was highly expressed in petals and carpels which was similar to that of GRCD3 in Gerbera hybrida[37] and SlaSEP1 in Silene latifolia[38], while, DcSEP3-1 was highly expressed in sepals, petals, and carpels. In addition, through evolutionary analysis, the expression patterns of genes in the same subclade may be the same or different, which indicates that the evolution of class E genes in D. chinensis is complex. Especially, the expression pattern of the DcSEP3-2 gene was different from that of DcSEP3-1, and it was mainly detected in sepals and petals, although they were all SEP3 homologs. This was different from what has been reported in Arabidopsis; AtSEP3 was mainly expressed in the inner three whorls, and the expression level was highest in petals[9]. Besides, we found that the transgenic lines of same subclade genes also showed different phenotype, such as the transgenic lines overexpressing DcSEP3-1 and DcSEP3-2. The results suggested that the two DcSEP3 genes of D. chinensis were subfunctionalized. A similar phenomenon has been found in other species. For example, in the woody plant Platanus acerifolia, overexpression of PlacSEP3-1 in Arabidopsis showed slightly early flowering or slightly more cauline leaves, unlike PlacSEP3-2, which showed severe phenotypic changes[39]. In marigold, overexpression of TeSEP3-2 and TeSEP3-3 led to early flowering in Arabidopsis, which was different from that of TeSEP3-1[40]. These reports have shown that genes in the same subclade may undergo subfunctionalization. In addition, different subclades may have undergone multiple evolutionary events. For example, in G. hybrida, GhGRCD5 plays a unique role in regulating petal development, while, GhGRCD1 regulates stamen development[41]. In addition, in orchids, overexpression of the PeSEP3 gene leads to transgenic Arabidopsis plants showing severe phenotypes, such as early flowering and much smaller plant size, while overexpression of PeSEP1 shows no obvious change in phenotype[20].

    In addition to the comparison of gene expression patterns and transgene experiments to predict whether the gene form the same subclade has been subfunctionalized, the pattern of protein interaction belonging to the same subclade is also good evidence. Previous studies have found that functionally redundant proteins have the same interaction pattern and may have shared interaction partners when performing their function[42,43]. For example, in Arabidopsis, there is functional redundancy between AtSEP1 and AtSEP3 proteins, and the interaction patterns of these two proteins are extremely similar[44]. In our study, the interaction patterns of different subclades showed a variety of results: DcSEP3-1 and DcSEP3-2 had different interaction patterns. The protein interaction patterns of DcSEP4-1 were different from that of DcSEP4-2 and DcSEP4-3, while DcSEP4-2 had a similar interaction pattern with DcSEP4-3. In our results, we found that DcSEP3-1 and DcSEP3-2 were different not only in their interaction patterns but also in their expression patterns and gene functions. Therefore, we speculate that the two genes belonging to the SEP3 subclade in Dianthus may experience sub-functionalization. However, the genes belonging to other subclades showed more complex patterns of interaction, such as the DcSEP4 subclade, and there is much work to be done to elucidate which evolutionary events these genes have undergone.

    This work was supported by the National Natural Science Foundation of China (No.32072607).

  • Xiaopeng Fu is the Editorial Board member of journal Ornamental Plant Research. She was blinded from reviewing or making decisions on the manuscript. The article was subject to the journal's standard procedures, with peer-review handled independently of this Editorial Board member and her research group.

  • [1]

    Beckman CH, Mace ME, Halmos S, McGahan MW. 1961. Physical barriers associated with resistance in Fusarium wilt of bananas. Phytopathology 51:507−15

    Google Scholar

    [2]

    Li C, Zuo C, Deng G, Kuang R, Yang Q, et al. 2013. Contamination of bananas with beauvericin and fusaric acid produced by Fusarium oxysporum f. sp. cubense. PLoS ONE 8:e70226

    doi: 10.1371/journal.pone.0070226

    CrossRef   Google Scholar

    [3]

    Fakhouri W, Walker F, Armbruster W, Buchenauer H. 2003. Detoxification of fusaric acid by a nonpathogenic Colletotrichum sp. Physiological and Molecular Plant Pathology 63:263−69

    doi: 10.1016/j.pmpp.2004.03.004

    CrossRef   Google Scholar

    [4]

    Ding Z, Yang L, Wang G, Guo L, Liu L, et al. 2018. Fusaric acid is a virulence factor of Fusarium oxysporum f. sp. cubense on banana plantlets. Tropical Plant Pathology 43:297−305

    doi: 10.1007/s40858-018-0230-4

    CrossRef   Google Scholar

    [5]

    Liu S, Li J, Zhang Y, Liu N, Viljoen A, et al. 2019. Fusaric acid instigates the invasion of banana by Fusarium oxysporum f. sp. cubense TR4. New Phytologist 225:913−929

    doi: 10.1111/nph.16193

    CrossRef   Google Scholar

    [6]

    Drysdale RB. 1984. The production and significance in phytopathology of toxins produced by species of Fusarium. In The Applied mycology of Fusarium, eds. Moss MO, Smith JE. x, 264 pp. Cambridge: Cambridge University Press. pp. 95–105

    [7]

    Marrè MT, Vergani P, Albergoni FG. 1993. Relationship between fusaric acid uptake and its binding to cell structures by leaves of Egeria densa and its toxic effects on membrane permeability and respiration. Physiological and Molecular Plant Pathology 42:141−57

    doi: 10.1006/pmpp.1993.1012

    CrossRef   Google Scholar

    [8]

    Chakrabarti DK, Ghosal S. 1989. The disease cycle of mango malformation induced by Fusarium moniliforme var. subglutinans and the curative effects of mangiferin-metal chelates. Journal of Phytopathology 125:238−46

    doi: 10.1111/j.1439-0434.1989.tb01065.x

    CrossRef   Google Scholar

    [9]

    Gapillout I, Milat ML, Blein JP. 1995. Effect of fusaric acid on cells from tomato cultivars resistant or susceptible to Fusarium oxysporum f. sp.Lycopersici. European Journal of Plant Pathology 102:127−32

    doi: 10.1007/BF01877099

    CrossRef   Google Scholar

    [10]

    D'Alton A, Etherton B. 1984. Effects of fusaric acid on tomato root hair membrane potentials and ATP Levels 1. Plant Physiology 74:39−42

    doi: 10.1104/pp.74.1.39

    CrossRef   Google Scholar

    [11]

    Kuźniak E. 2001. Effect of fusaric acid on reactive oxygen species and antioxidants in tomato cell cultures. Journal of Phytopathology 149:575−82

    doi: 10.1046/j.1439-0434.2001.00682.x

    CrossRef   Google Scholar

    [12]

    Brown DW, Lee SH, Kim LH, Ryu JG, Lee S, et al. 2015. Identification of a 12-gene fusaric acid biosynthetic gene cluster in Fusarium species through comparative and functional genomics. Molecular Plant-Microbe Interactions 28:319−32

    doi: 10.1094/MPMI-09-14-0264-R

    CrossRef   Google Scholar

    [13]

    López-Díaz C, Rahjoo V, Sulyok M, Ghionna V, Martín-Vicente A, et al. 2018. Fusaric acid contributes to virulence of Fusarium oxysporum on plant and mammalian hosts. Molecular Plant Pathology 19:440−53

    doi: 10.1111/mpp.12536

    CrossRef   Google Scholar

    [14]

    Moretti A, Logrieco A, Bottalico A, Ritieni A, Randazzo G, et al. 1995. Beauvericin production by Fusarium subglutinans from different geographical areas. Mycological Research 99:282−86

    doi: 10.1016/S0953-7562(09)80899-X

    CrossRef   Google Scholar

    [15]

    Hamill RL, Higgens CE, Boaz HE, Gorman M. 1969. The structure of beauvericin, a new depsipeptide antibiotic toxic to Artemia salina. Tetrahedron Letters 49:4255−58

    doi: 10.1016/s0040-4039(01)88668-8

    CrossRef   Google Scholar

    [16]

    Hidaka H, Nagatsu T, Takeya K, Takeuchi T, Suda H. 1969. Fusaric acid, a hypertensive agent produced by fungi. The Journal of Antibiotics 22:228−30

    doi: 10.7164/antibiotics.22.228

    CrossRef   Google Scholar

    [17]

    Lemmens-Gruber R, Rachoy B, Steininger E, Kouri K, Saleh P, et al. 2000. The effect of the Fusarium metabolite beauvericin on electromechanical and physiological properties in isolated smooth and heart muscle preparations of guinea pigs. Mycopathologia 149:5−12

    doi: 10.1023/A:1007293812007

    CrossRef   Google Scholar

    [18]

    Logrieco A, Moretti A, Ritieni A, Caiaffa MF, Macchia L. 2001. Beauvericin: chemistry, biology and significance. In Advances in Microbial Toxin Research and Its Biotechnological Exploitation, ed. Upadhyay RK. Amsterdam, Netherlands: Elsevier Science Publishers. pp 23–30. https://doi.org/10.1007/978-1-4757-4439-2_2

    [19]

    Tomoda H, Huang XH, Cao J, Nishida H, Nagao R, et al. 1992. Inhibition of acylCoA: cholesterol acyltransferase activity by cyclodepsipeptide antibiotics. The Journal of Antibiotics 45:1626−32

    doi: 10.7164/antibiotics.45.1626

    CrossRef   Google Scholar

    [20]

    Gavazzi G, Tonelli C, Todesco G, Arreghini E, Raffaldi F, et al. 1987. Somaclonal variation versus chemically induced mutagenesis in tomato (Lycopersicon esculentum L.). Theoretical and Applied Genetics 74:733−38

    doi: 10.1007/BF00247550

    CrossRef   Google Scholar

    [21]

    Péreau-Leroy P. 1958. Le palmier dattier au Maroc. Paris: Institut français de recherches fruitières outremer, Mission au Maroc. 142 pp.

    [22]

    El Hadarami A, El Idrissi-Tourane A, El Hassni M, Daayf F, El Hadrami I. 2005. Toxin-based in-vitro selection and its potential application to date palm for resistance to the bayoud Fusarium wilt. Comptes Rendus Biologies 328:732−44

    doi: 10.1016/j.crvi.2005.05.007

    CrossRef   Google Scholar

    [23]

    Smith RH, Duncan RR, Bhaskaran S. 1993. In vitro selection and somaclonal variation for crop improvement. In International Crop Science I, eds. Buxton DR, Shibles R, Forsberg RA, Blad BL, Asay KH, et al. United States of America: Crop Science Society of America. pp. 269−632. https://doi.org/10.2135/1993.internationalcropscience.c99

    [24]

    Wilson CR, Tegg RS, Wilson AJ, Luckman GA, Eyles A, et al. 2010. Stable and extreme resistance to common scab of potato obtained through somatic cell selection. Phytopathology 100:460−67

    doi: 10.1094/PHYTO-100-5-0460

    CrossRef   Google Scholar

    [25]

    Esmaiel NM, Al-Doss AA, Barakat MN. 2012. In vitro selection for resistance to Fusarium oxysporum f. sp. dianthi and detection of genetic polymorphism via RAPD analysis in carnation. Journal of Medicinal Plants Research 6:3997−4004

    doi: 10.5897/jmpr12.150

    CrossRef   Google Scholar

    [26]

    Purwati RD, Budi US, Sudarsono S. 2007. Penggunaan asam fusarat dalam seleksi in vitro untuk resistensi abaka terhadap Fusarium oxysporum f.sp. cubense. Industrial Crops Research Journal 13:64−72

    Google Scholar

    [27]

    Matsumoto K, Barbosa ML, Souza LAC, Teixeira JB. 1999. In vitro selection for Fusarium wilt resistance in banana. II. Resistance to culture filtrate of race 1 Fusarium oxysporum f. sp. cubense. Fruits 54:151−57

    Google Scholar

    [28]

    Murashige T, Skoog F. 1962. A revised medium for rapid growth and bio assays with tobacco tissue cultures. Physiologia Plantarum 15:473−97

    doi: 10.1111/j.1399-3054.1962.tb08052.x

    CrossRef   Google Scholar

    [29]

    Molina AB, Sinohin VO, Fabregar EG, Ramillete EB, Loayan MM, et al. 2016. Field resistance of Cavendish somaclonal variants and local banana cultivars to tropical race 4 of Fusarium wilt in the Philippines. Acta Horticulturae 1114:227−30

    doi: 10.17660/actahortic.2016.1114.31

    CrossRef   Google Scholar

  • Cite this article

    Cruz MA, Alcasid C, Millado CS, Balendres MA. 2023. Toxicity of fusaric acid and beauvericin in tissue-cultured banana 'Grand Nain' and 'Lakatan'. Technology in Horticulture 3:15 doi: 10.48130/TIH-2023-0015
    Cruz MA, Alcasid C, Millado CS, Balendres MA. 2023. Toxicity of fusaric acid and beauvericin in tissue-cultured banana 'Grand Nain' and 'Lakatan'. Technology in Horticulture 3:15 doi: 10.48130/TIH-2023-0015

Figures(4)  /  Tables(2)

Article Metrics

Article views(3571) PDF downloads(539)

ARTICLE   Open Access    

Toxicity of fusaric acid and beauvericin in tissue-cultured banana 'Grand Nain' and 'Lakatan'

Technology in Horticulture  3 Article number: 15  (2023)  |  Cite this article

Abstract: Fusarium oxysporum forma specialis cubense (Foc) produces toxins known to contribute to virulence and infection in the host. Fusaric acid (FA) and beauvericin (BEA) are major toxins contributing to Foc virulence in the host plant. Recent advancements allow the production of disease-resistant crops via cell selection, a process that involves resistance screening of somaclones using phytotoxin exposure. Determination of the appropriate concentration is an important step for the toxin-based selection of disease-resistant plants. In this study, the toxicity of FA (0, 5, 10, 20, 30, 50, and 100 μm) and BEA (0, 5, 10, and 20 μm) in different tissues of banana cv. ‘Grand Nain’ and 'Lakatan' were investigated. Overall results indicated a positive relationship between the toxin concentration and plant sensitivity, as indicated by the degree of vascular browning rate. Results demonstrated that lower concentrations of BEA are required for phytotoxicity than in FA. Furthermore, a higher degree of vascular browning was recorded in the test tissues of ‘Lakatan’ treated with FA and BEA than in the ‘Grand Nain’ genotype suggesting genotype-dependent sensitivity of banana to phytotoxins. To our knowledge, this study is the first to investigate the phytotoxicity of FA and BEA in callus cultures of banana ‘Lakatan.’

    • Fusarium wilt, caused by Fusarium oxysporum f. sp. cubense (Foc), is an economically important disease affecting banana. Wilting results from the restrictive movement of water in the vascular bundles[1]. However, part of the pathogenesis and invasion of plants by Foc can be attributed to toxic metabolites produced by the fungus[2]. Major toxins of Foc include fusaric acid and beauvericin, which act as virulence factors for infection by causing significant browning of vascular tissues and plant necrosis[35].

      Fusaric acid (FA) is a non-specific toxin many fungal pathogens produce[6]. Based on previous studies, FA supports disease development through the induction of cell membrane early super polarization[3], H+ pumping, K+ leaking suppression[7], mineral chelation[8] and inhibition of plant defensive enzymes activity, leading to reduced cell viability[9], changes in membrane permeability and potential[7,10], and production of reactive oxygen species[11]. Previously, Brown et al. recorded that lack of FA production did not affect the virulence of F. oxysporum in cacti or F. verticillioides in maize seedlings[12]. In contrast, several studies reported the importance of FA production in the virulence of Foc in banana[2,5,13].

      Meanwhile, beauvericin (BEA) is a secondary metabolite produced by several species from the Fusarium fujikuroi species complex[14] and the entomopathogenic fungus Beauveria bassiana[15]. Although FA and BEA are major toxins of Foc, the two are not considered mycotoxins with significant human, animal, food, and feed safety risks[2]. Still, some studies have documented physiologic disorders in experimental animals and human cell lines treated with FA[16] and BEA[1719].

      Phytotoxin insensitivity of plant cell lines can be used as a potential marker in breeding programs for early screening of resistance against plant pathogens[20,21]. The approach requires a significant correlation between toxin sensitivity and host susceptibility to the pathogens producing them[22]. Several studies have taken advantage of this via somaclonal cell selection - a technique that utilizes phytotoxins as selective agents for developing resistant clones against economically important diseases such as common scab of potato[23,24]. Production of Fusarium wilt-resistant date palm[22], carnation[25], abaca[26], and banana cv. 'Maca'[27] has also been reported by cell selection. Yet, little attention has been given to the phytotoxicity of Foc metabolites in banana.

      This study determined the phytotoxicity of FA and BEA in leaf tissues, multiple bud clumps, tissue-cultured plantlets, and calli in-vitro. These results would aid in determining the appropriate concentration of the metabolites for somaclonal cell selection.

    • The test substances: fusaric acid (≥ 99% purity, CAS No. 536-69-6) and beauvericin (≥ 97% purity, CAS No. 28048-05-5), were obtained from Sigma-Aldrich. The toxins were dissolved in 0.05% methanol to obtain a 10 mM stock solution. The stock solution was then filter-sterilized by passing through Whatmann no.1 filter paper (125 mm size) (CAT no. 1001-125, GE Healthcare Life Sciences) and stored in a 4 °C refrigerator until use.

    • Different concentrations of fusaric acid (FA) and beauvericin (BEA) in tissue-cultured Cavendish plantlets, multiple bud clumps (MBC), callus, and attached leaf tissues were determined. FA stock solution was further diluted to 0, 1, 5, 10, 20, 30, 50, 70, 100 μm concentrations by adding desired concentrations in culture medium. Meanwhile, 0, 1, 5, 10, and 20 μm BEA were tested. These concentrations were selected based on the previous findings of Li et al.[2] on the phytotoxicity of FA and BEA in tissue-cultured plantlets of banana.

      For tissue-cultured plantlets tests, tissue-cultured 'Grand Nain' and 'Lakatan' were obtained from the National Plant Genetic Resources Laboratory (NPGRL), IPB, UPLB. We used 'Grand Nain' because it is commercially propagated in Mindanao, where the Foc TR4 is present. 'Lakatan' was also used since it is a local variety commonly grown in the Philippines, especially by small-scale growers. The tissue-cultured materials were cultured and maintained in the laboratory for micropropagation. The plantlets were propagated by cutting a 2-cm segment of tissue containing the pseudostem and apical meristems. The tissues were then cut in half and cultured in a multiplication-inducing medium which consisted of Murashige and Skoog medium[28] + 3 mg·L−1 BAP. Four segments were placed in each glass jar. Cultures were maintained in 14 h light with temperature ranging from 20 ± 5 °C. Cultures were routinely transferred in the same medium every two weeks to prevent browning. One-month-old tissue-cultured plantlets with roots were transferred in test tubes containing 10 ml liquid medium and treated with FA and BEA by pipetting desired concentration in the medium. Plantlets treated with sterile distilled water served as control. Cultures were maintained in 8 h light at ambient temperature (20 ± 5 °C).

      For multiple bud clumps studies, the protocol of Matsumoto et al.[27] was used to produce multiple bud clumps. Rhizome tissues were cut from 'Grand Nain' and 'Lakatan' shoot cultures and were grown in MS medium containing BAP (5 mg·L−1) to initiate multiple bud clump (MBC) formations. Cultures were maintained under the same conditions as previously mentioned. One-month-old bud clumps were harvested from a multiple bud clump and transferred into test tubes containing 10 ml liquid medium. Five individual buds were placed in each tube and treated with FA and BEA as previously described.

      Corm segments (approximately 2 cm in size) were cut from one-month-old shoot cultures of banana cv for callus studies. 'Grand Nain' and 'Lakatan' and inoculated on MS basal medium supplemented with 2,4-dichloro phenoxy acetic acid (1.0 mg·L−1) and myo-inositol (50 mg·L−1). Cultures were stored in dark conditions under a chamber covered with black cloth and incubated at ambient temperature (20 ± 5 °C). Individual calli were harvested eight weeks post-inoculation and transferred into test tubes containing 10 ml liquid medium. Five individual calli were placed in each tube and treated with FA and BEA as previously described.

      For the attached leaf assay, tissue-cultured 'Grand Nain' and 'Lakatan' with multiple shoots were grown in basal MS medium for rooting. After one month, the rooted plantlets were acclimatized and transferred to plastic bags containing sterile soil in the nursery. The plantlets were grown for two months and watered daily. FA and BEA were diluted to the desired concentration by adding sterile distilled water in 1.5 ml Eppendorf tubes. The attached leaves were inoculated by pipetting 20 μl of solution in wounded (pricked using a syringe needle) tissues. The experiment was repeated twice.

    • The phytotoxicity of fusaric acid (FA) and beauvericin (BEA) in different banana tissues was assessed ten days post-inoculation. Wilting rates were measured ocularly based on the 10-point arbitrary scale produced. A one-way ANOVA was performed to identify significant differences between treatments using Statistical Tool for Agricultural Research (STAR Nebula) with a 95% confidence level.

    • Wilting of different tissues treated with fusaric acid (FA) and beauvericin (BEA) was observed ten days post-inoculation. Ten-point visual hedonic browning scales were developed based on varying degrees of wilting (Fig. 1ac). The rating scales were used to measure the degree of phytotoxicity in tissue-cultured plantlets (TC plantlets), multiple bud clumps (MBC), and callus cultures.
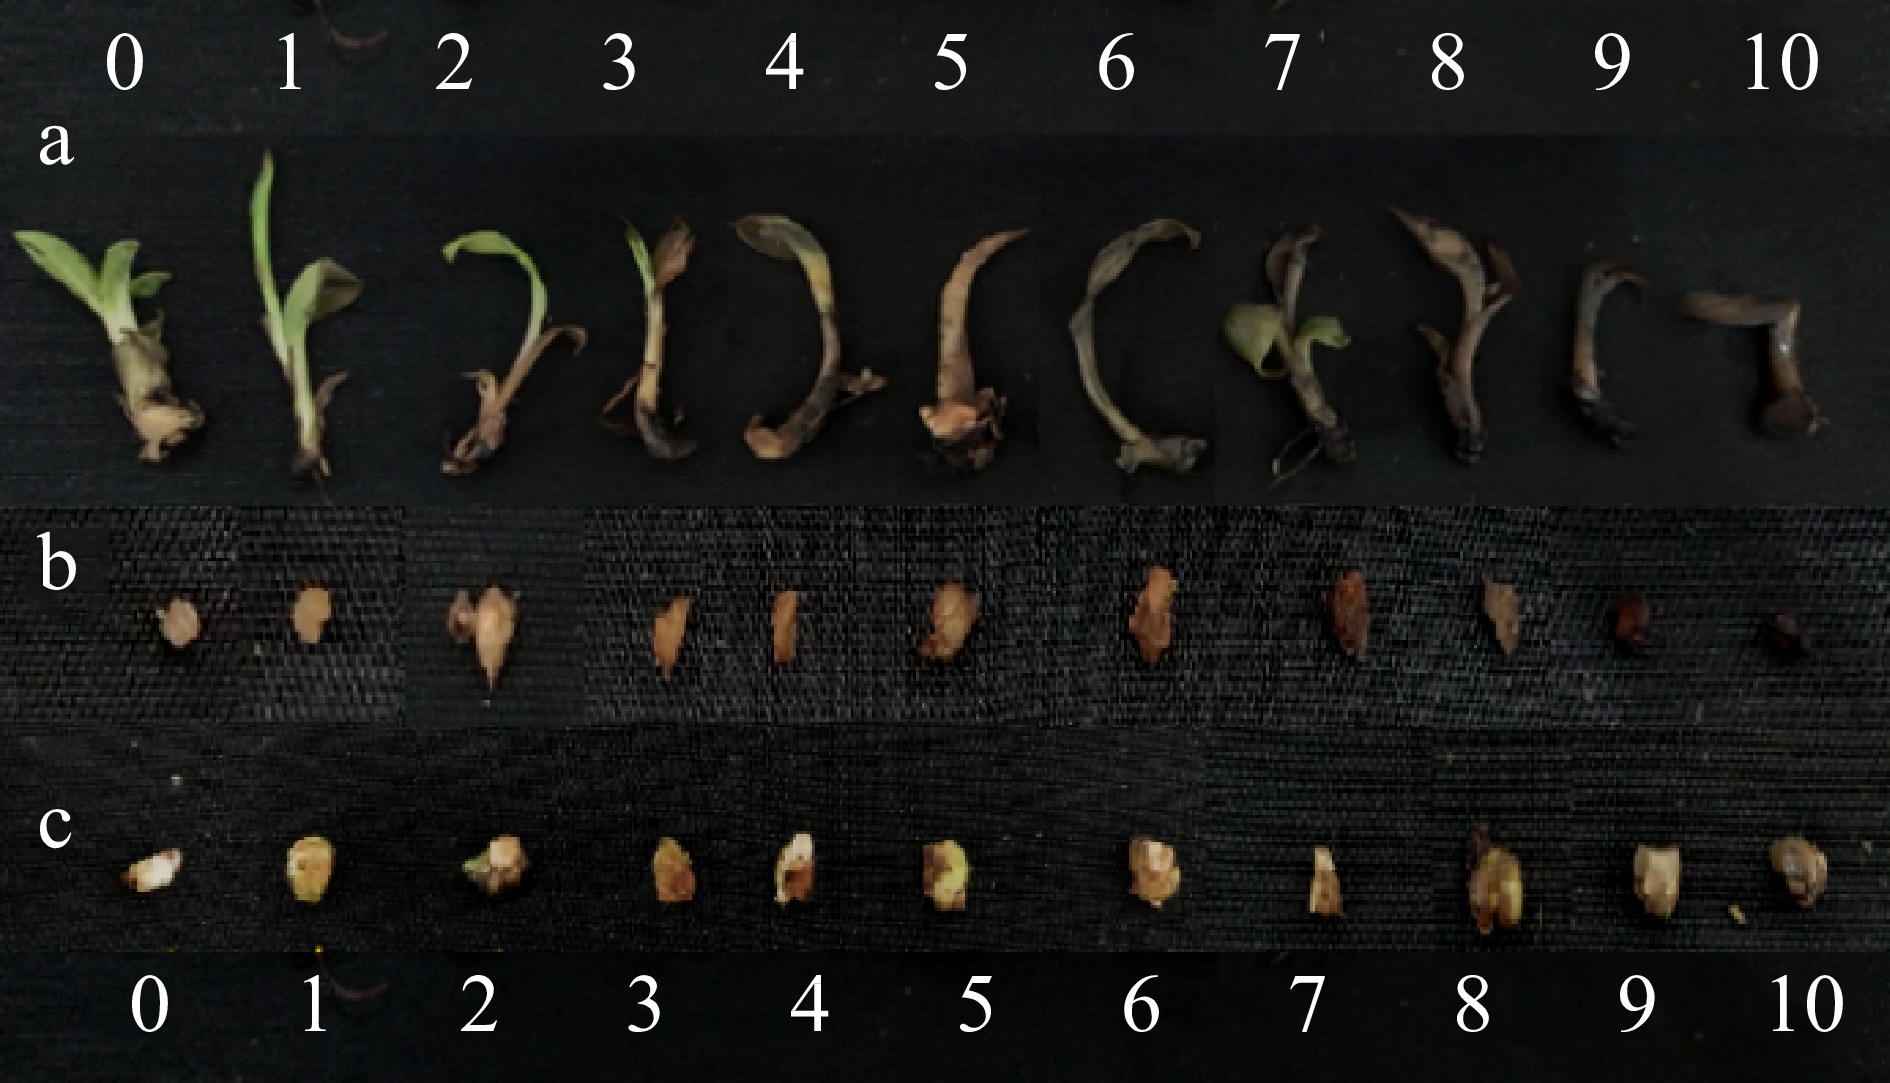
      Figure 1. 

      Ten point rating scales produced in this study for measuring degree of wilting in (a) tissue cultured plantlets, (b) calli, and (c) multiple bud clumps, as caused by Fusarium toxins.

      Overall, there is an increasing trend between the toxin concentration and the degree of browning observed (Figs 24). For both 'Grand Nain' and 'Lakatan,' the highest browning rates were observed in tissues treated with 100 μm FA and 20 μm BEA (Tables 1 & 2). A higher degree of browning was recorded in 'Lakatan' TC plantlets, MBC, and callus than in 'Grand Nain,' except in TC plantlets treated with 20 μm BEA, where a higher average browning rate score was observed in 'Grand Nain' (9) than in 'Lakatan' (Tables 1 & 2).
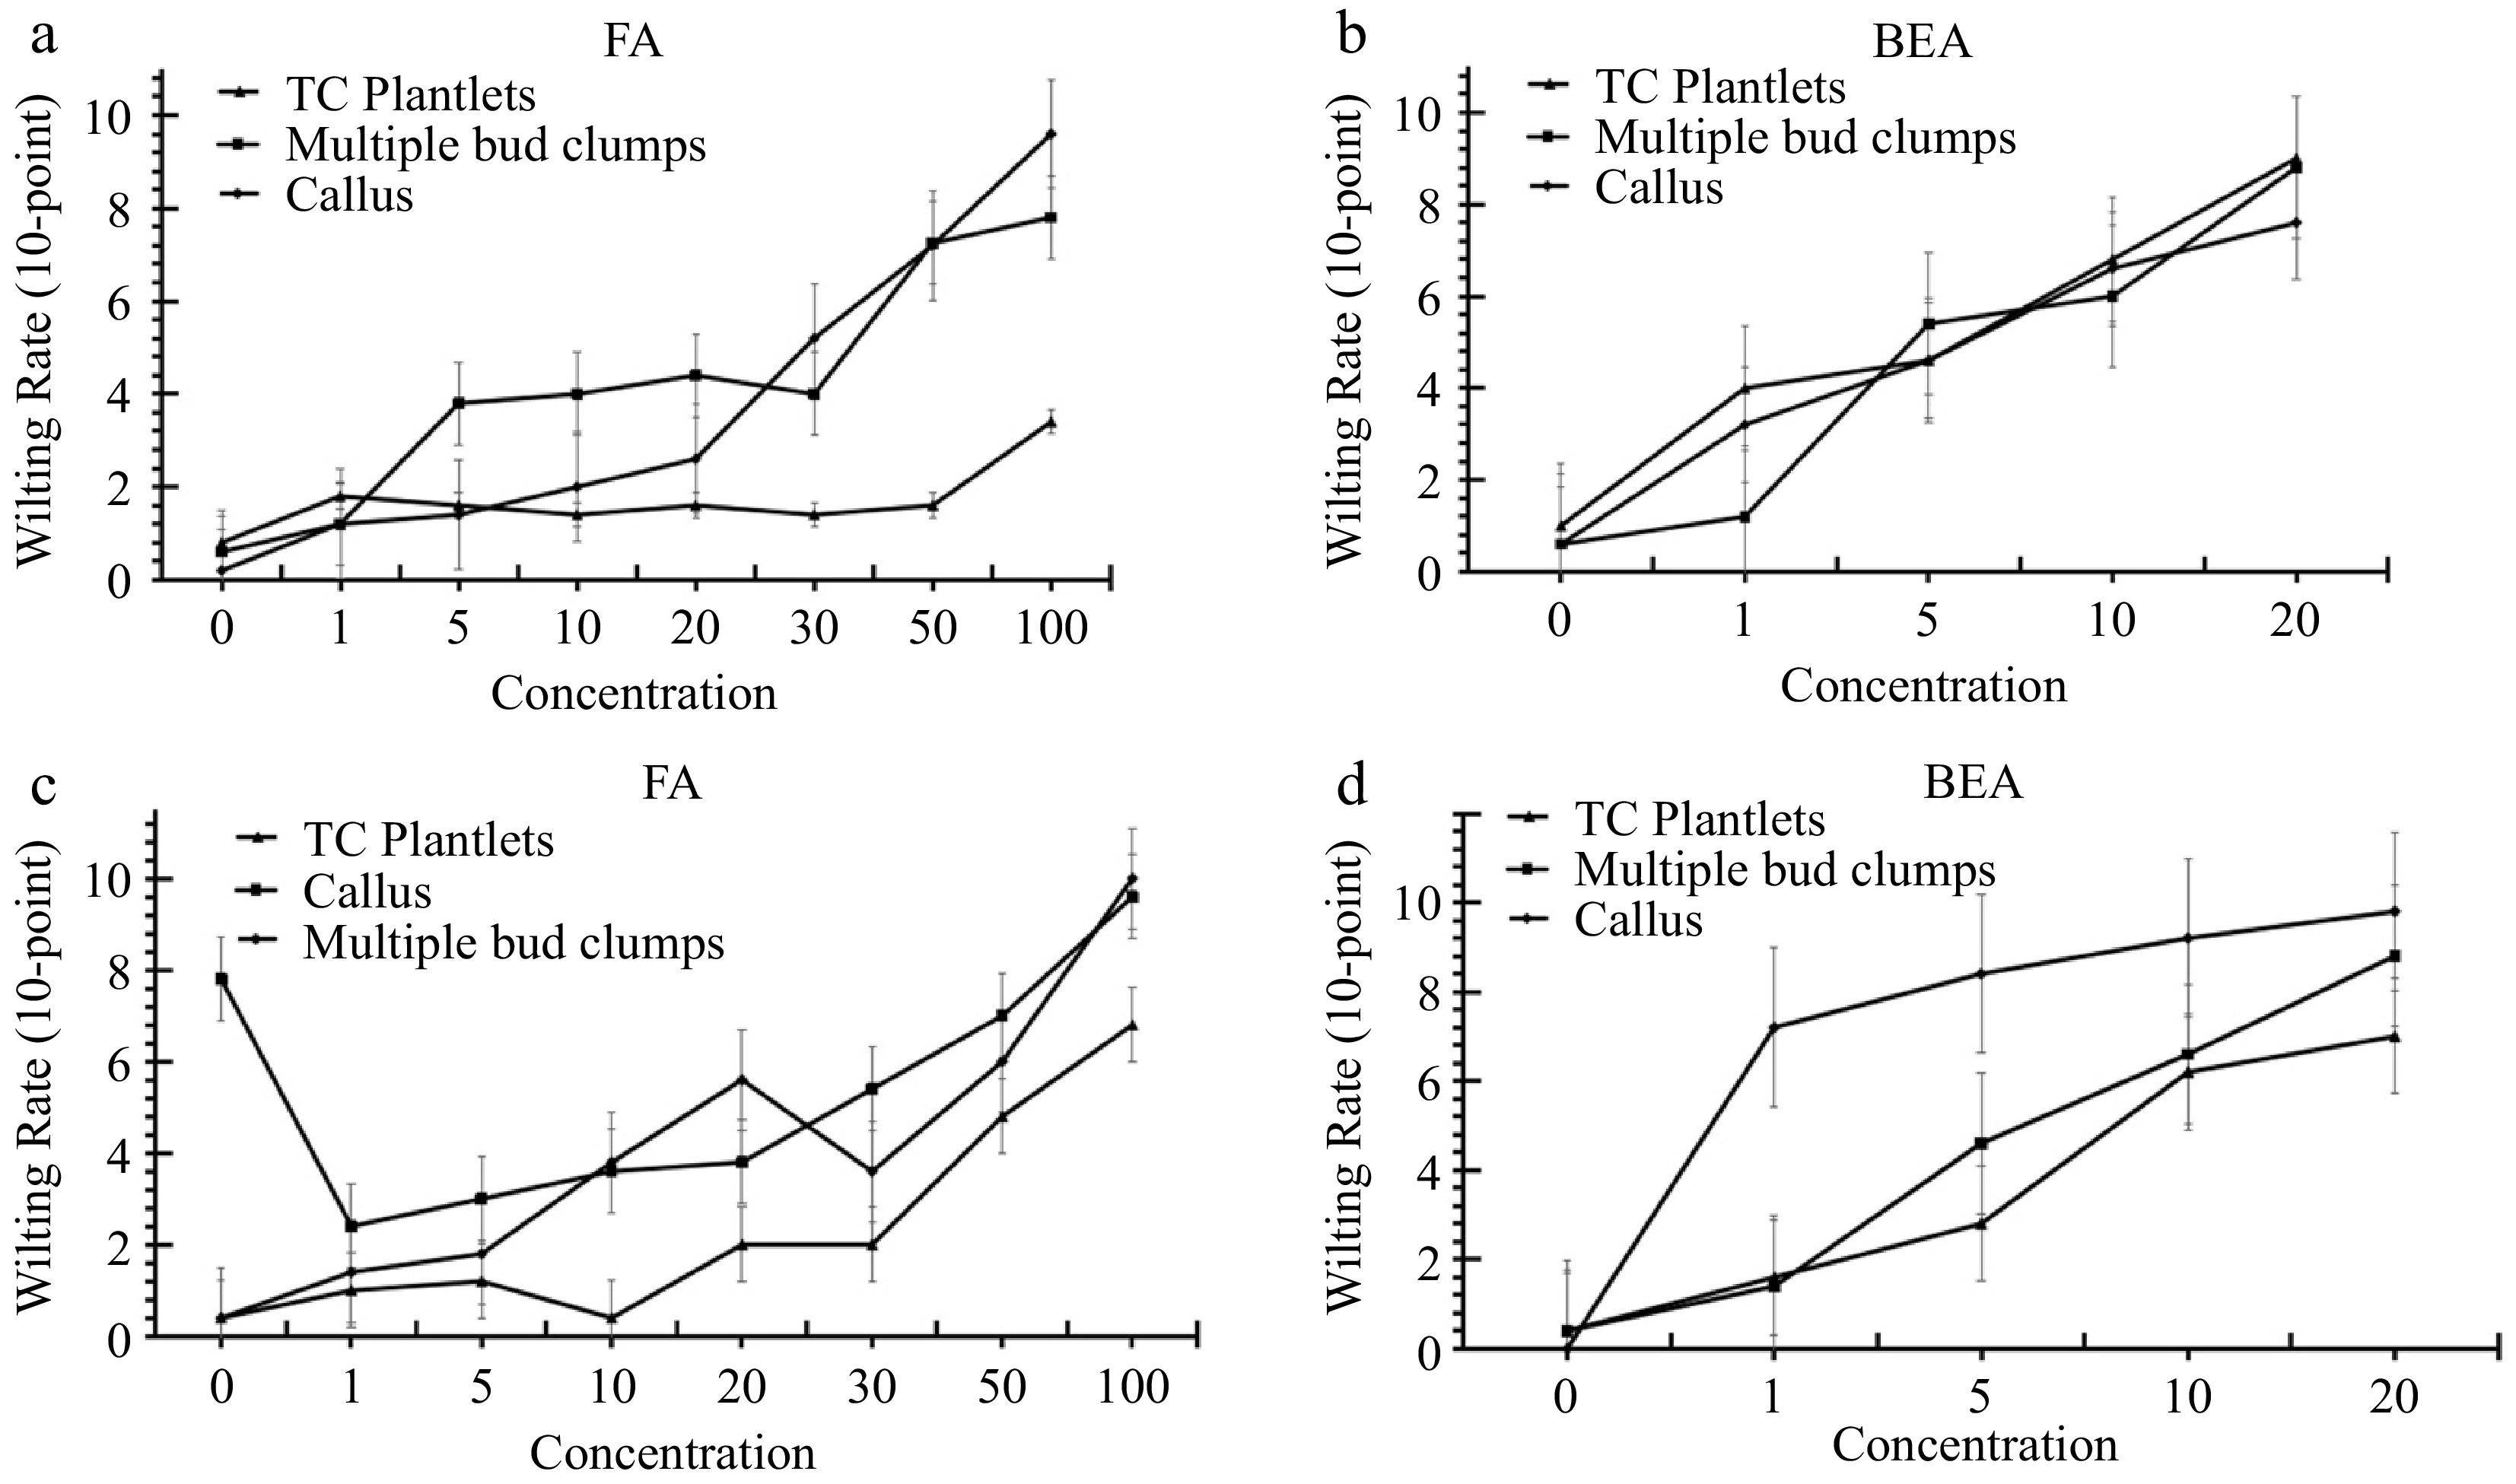
      Figure 2. 

      Browning rates of tissue-cultured plantlets, calli, and multiple bud clumps of banana cvs. (a), (b) ‘Grand Nain’ and (c), (d) ‘Lakatan' treated with varying concentrations of FA and BEA at 10 d post-incubation.

      Average browning rates of 'Grand Nain' TC plantlets, MBC, and callus treated with 100 μm FA were 3.4, 7.8, and 9.6, respectively, using the 10-point system (Table 1). Meanwhile, on average, the browning rates of tissue-cultured 'Lakatan' TC plantlets, multiple bud clumps, and calli treated with the same concentration were 6.8, 9.6, and 10 (Table 1). For phytotoxicity tests using BEA, 'Grand Nain' TC plantlets, MBC, and callus scored 9, 8.8, and 7.6, while the same tissues of 'Lakatan' scored 7.0, 9.8, and 8.8, respectively (Table 2).

      Table 1.  Wilting rates of different tissues of banana 10 d after fusaric acid treatment.

      FA (µm)'Grand Nain''Lakatan'
      TC plantletMBCCallusTC plantletMBCCallus
      Control0.8 ± 0.37b0.6 ± 0.24c0.2 ± 0.20d0.4 ± 0.24c0.4 ± 0.24e7.8 ± 0.37ab
      11.8 ± 0.49ab1.2 ± 0.20c1.2 ± 0.20cd1.0 ± 0.55c1.4 ± 0.24e2.4 ± 0.68e
      51.6 ± 0.60ab3.8 ± 0.86bc1.4 ± 0.24cd1.2 ± 0.20c1.8 ± 0.37de3.0 ± 0.45e
      101.4 ± 0.24b4.0 ± 1.48bc2.0 ± 0.00cd0.4 ± 0.24c3.8 ± 0.58cd3.6 ± 0.51de
      201.6 ± 0.40ab4.4 ± 1.50abc2.6 ± 0.24c2.0 ± 0.32c5.6 ± 0.24bc3.8 ± 0.58de
      301.4 ± 0.40b4.0 ± 0.00bc5.2 ± 1.24b2.0 ± 0.00c3.6 ± 0.75cd5.4 ± 0.68cd
      501.6 ± 0.24ab7.3 ± 0.56ab7.2 ± 0.49b4.8 ± 0.49b6.0 ± 0.63b7.0 ± 0.00bc
      1003.4 ± 0.24a7.8 ± 0.92a9.6 ± 0.24a6.8 ± 0.80a10.0 ± 0.00a9.6 ± 0.24a
      Values represent the mean ± SE of five replicates Means in a column with the same letter are not significantly different (p > 0.05).

      Table 2.  Wilting rates of different tissues of banana 10 d after beauvericin treatment.

      BEA
      (µm)
      'Grand Nain''Lakatan'
      TC plantletMBCCallusTC plantletMBCCallus
      Control1.0 ± 0.32d0.6 ± 0.40c0.6 ± 0.24d0.4 ± 0.24d0.0 ± 0.55e0.4 ± 0.00d
      14.0 ± 0.63c1.2 ± 0.20c3.2 ± 0.37c1.6 ± 0.24c7.2 ± 0.55d1.4 ± 0.84c
      54.6 ± 0.75c5.4 ± 0.40b4.6 ± 0.51b2.8 ± 0.20b8.4 ± 0.55c4.6 ± 0.55b
      106.8 ± 0.37b6.0 ± 0.32b6.6 ± 0.24a6.2 ± 0.37a9.2 ± 0.55b6.6 ± 0.45a
      209.0 ± 0.45a8.8 ± 0.37a7.6 ± 0.24a7.0 ± 0.45a9.8 ± 0.84a8.8 ± 0.45a
      Values represent the mean ± SE of five replicates Means in a column with the same letter are not significantly different (p > 0.05).

      Treatment with FA and BEA significantly affected the browning rate compared to the control treatment (Tables 1 & 2). For 'Grand Nain,' the browning rate of TC plantlets and MBC significantly increased at 100 μm and 50 μm concentrations, respectively. At the same time, a significant increase in browning can be observed in callus cultures in as low as 20 μm FA (Fig. 3). FA also caused a significant browning of 'Lakatan' TC plantlets and MBC at 50 and 10 μm concentrations, respectively (Fig. 4). Additionally, 1 μm FA sufficiently caused significant browning in 'Lakatan' callus (Table 2, Fig. 4). BEA, at 1 μm concentration, already caused significant browning for both 'Grand Nain' and 'Lakatan' genotypes (Figs 3 & 4), except in 'Grand Nain' MBC where 5 μm BEA significantly affected the browning rate (Fig. 3). For both 'Grand Nain' and 'Lakatan' attached leaf tissues assay, browning around the inoculated sites were observed with 10 μm and 20 μm FA and BEA (Figs 3 & 4). But more severe symptoms were observed in the 'Lakatan' genotype than in 'Grand Nain' (Figs 3 & 4).
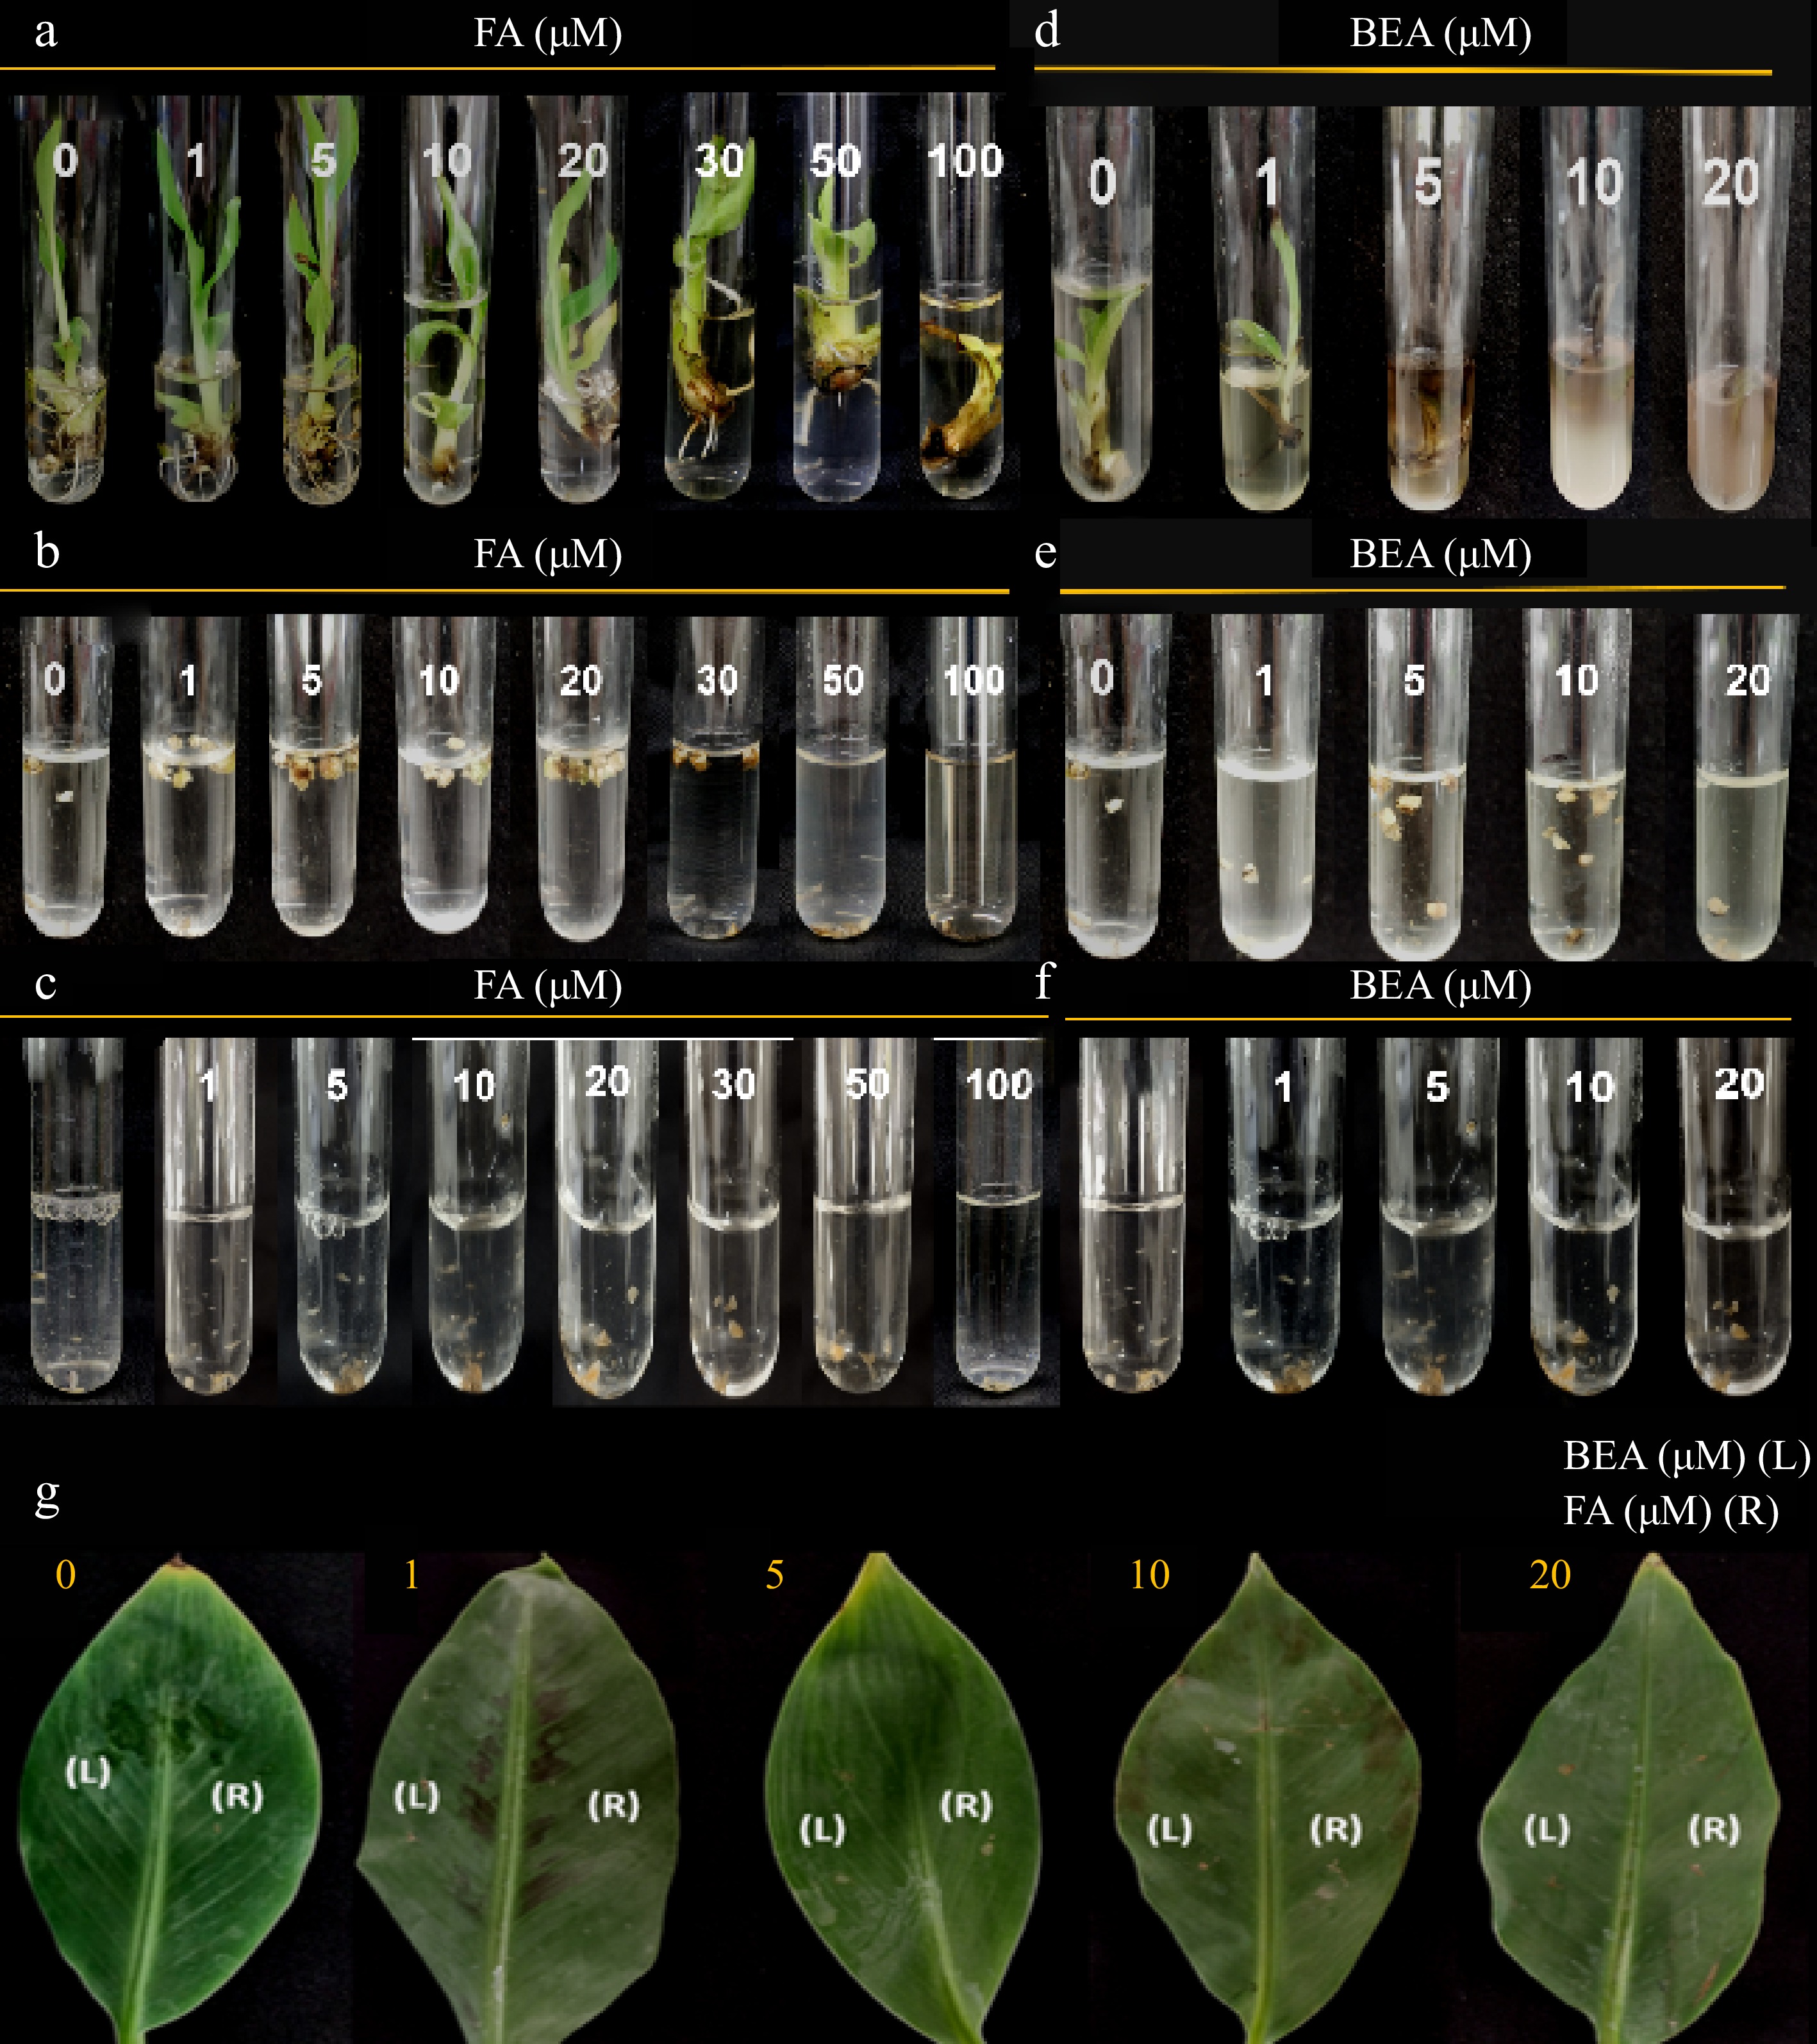
      Figure 3. 

      Toxic effect of FA and BEA in different tissues of banana cv. 'Grand Nain'. Varying concentrations were tested in (a), (d) one-month old tissue-cultured plantlets, (b), (e) multiple buds clumps, (c), (f) callus and (g) attached leaf tissues of two-month old greenhouse plantlets were used. Symptoms were assessed at 10 d post-inoculation.
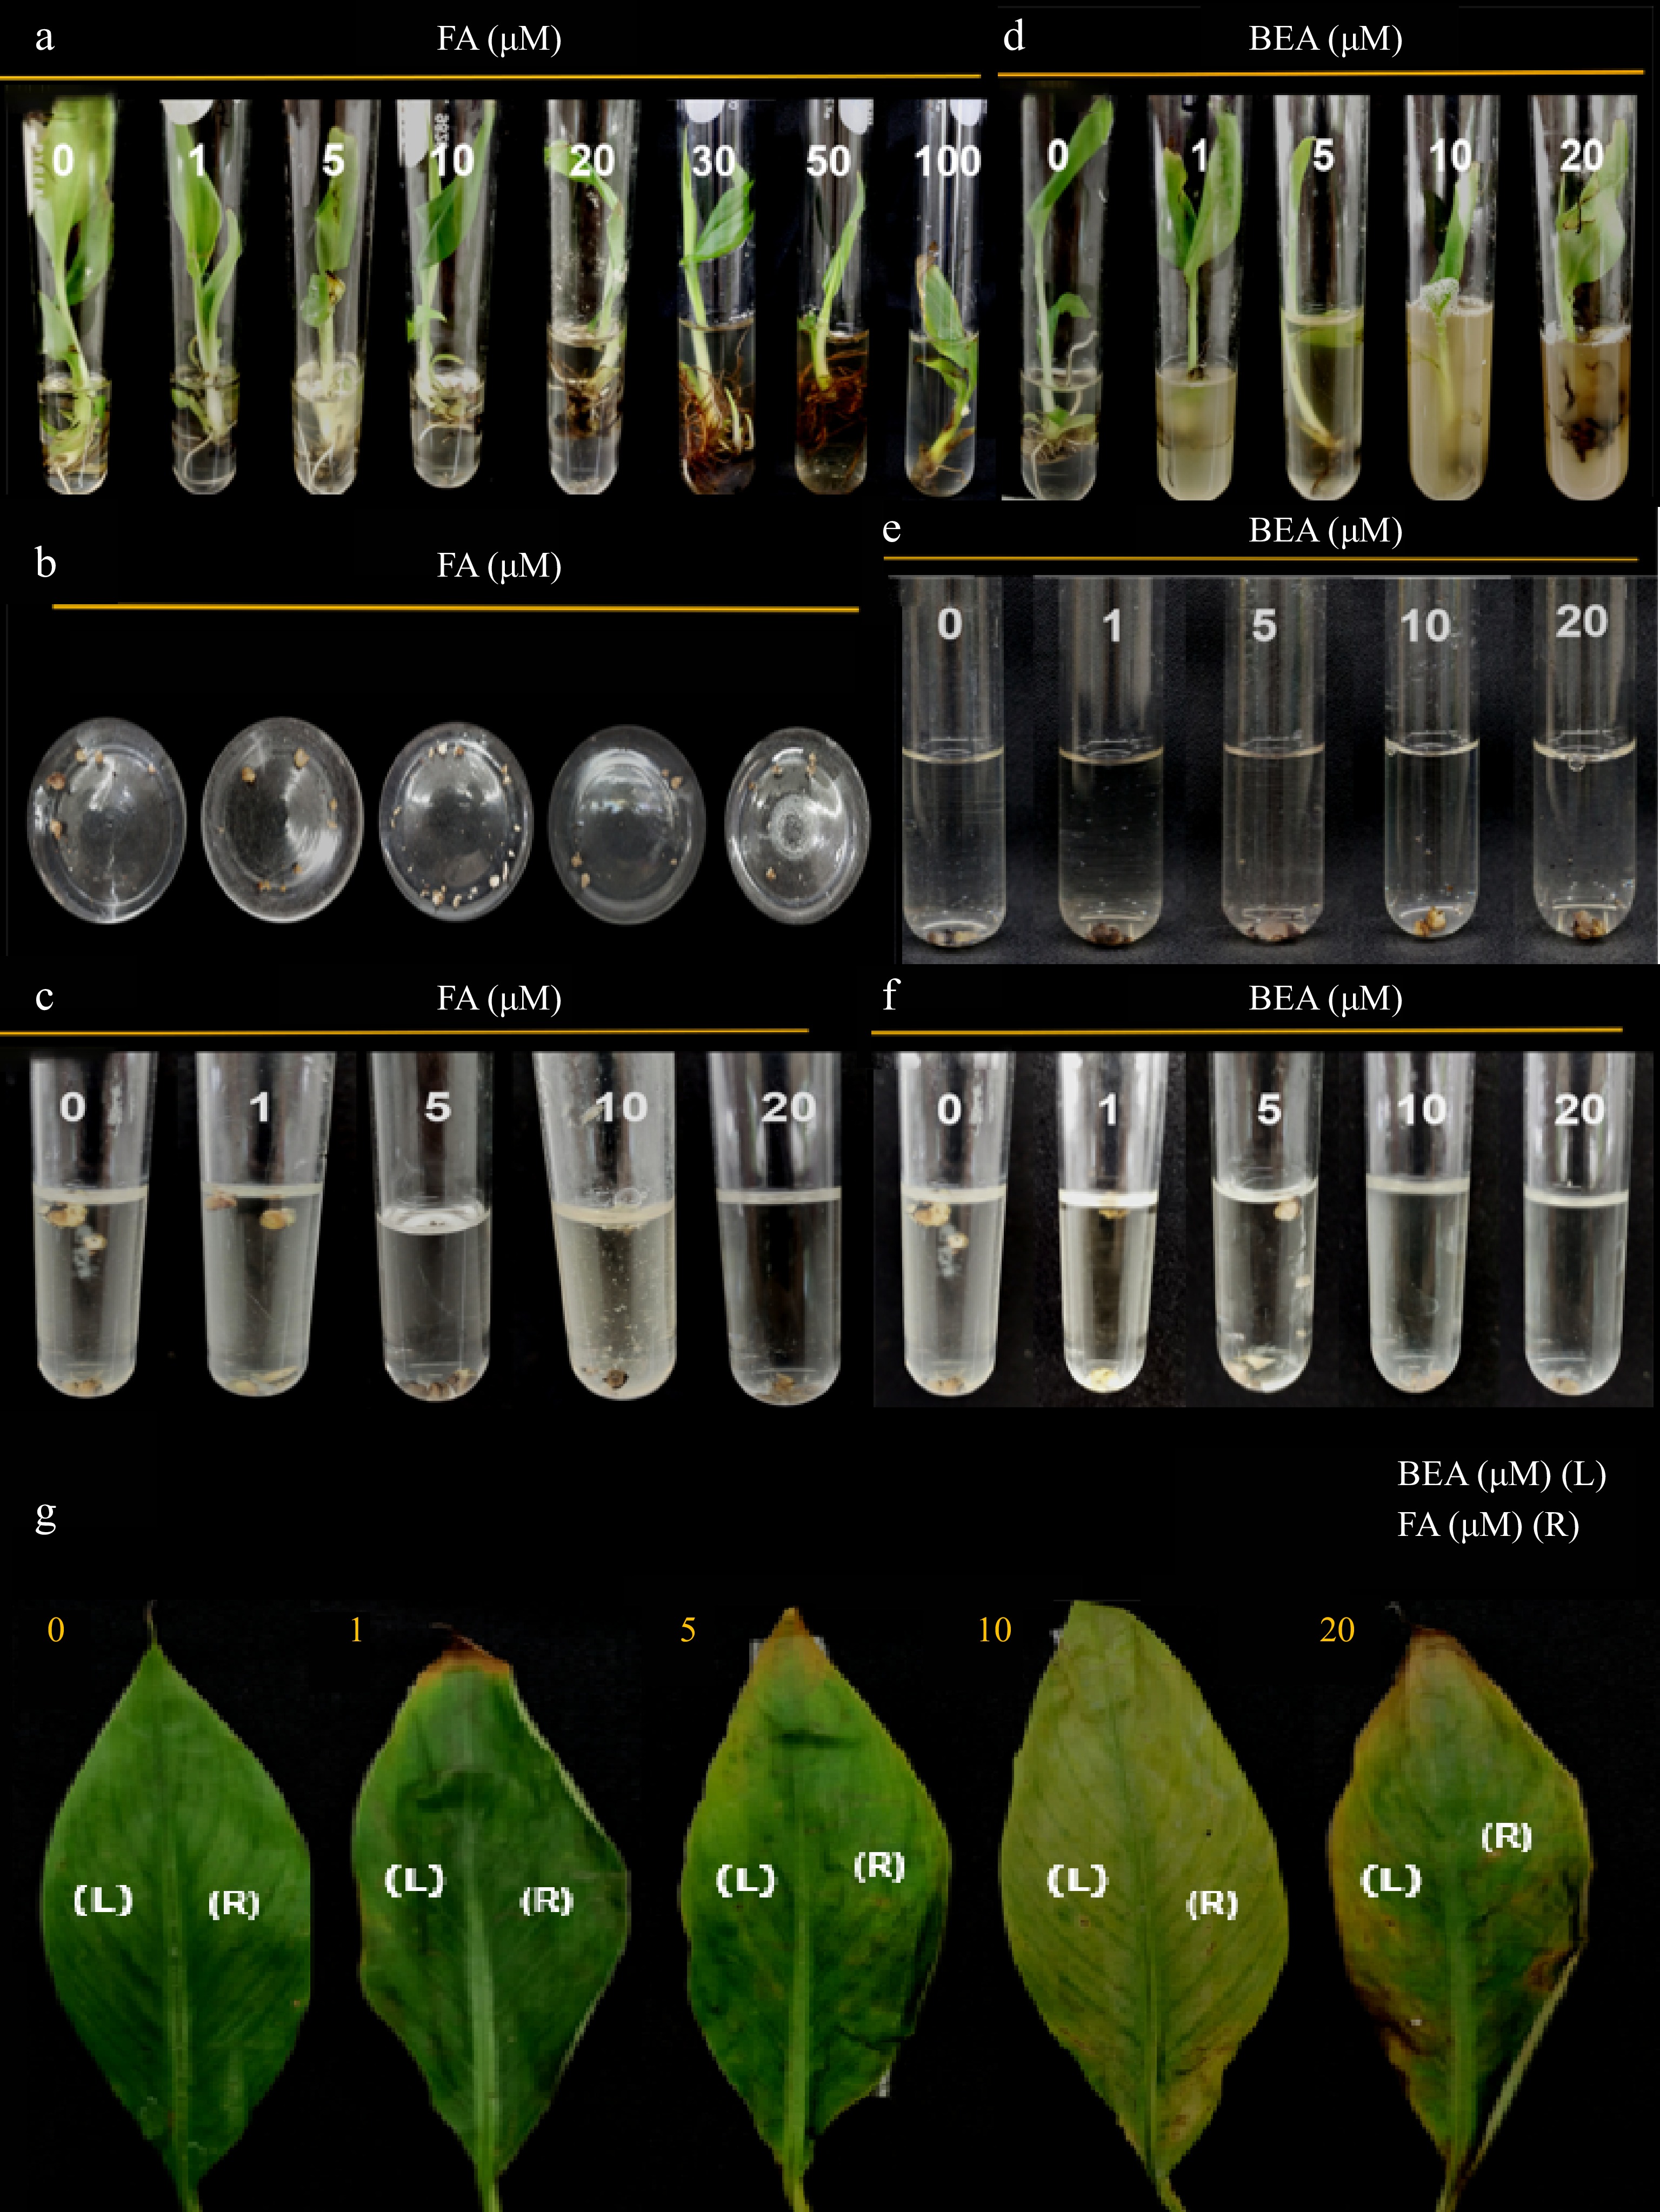
      Figure 4. 

      Toxic effect of FA and BEA in different tissues of banana cv. 'Lakatan'. (a), (d) Varying concentrations were tested in one-month old tissue-cultured plantlets, (b), (e) multiple bud clumps, (c), (f) callus and (g) attached leaf tissues of two-month old greenhouse plantlets were used. Symptoms were assessed at 10 d post-inoculation.

    • This study demonstrated the phytotoxic effect of varying fusaric acid (FA) and beauvericin (BEA) concentrations in banana 'Grand Nain' and 'Lakatan'. The results were consistent with the previous findings of Li et al.[2], where 100 µm FA and 20 µm BEA sufficiently caused toxicity in tissue-cultured bananas. However, a lower concentration of BEA (1 µm) was found to cause wilting in this study. The arbitrary 10-point visual hedonic scales used in this study could be used to measure the phytotoxicity of Fusarium toxins in the test tissues of banana. A higher degree of vascular browning was recorded in the test tissues of 'Lakatan' treated with FA and BEA than in the 'Grand Nain' genotype. This suggests that banana sensitivity to phytotoxins differs from one genotype to another. In a study conducted by Molina et al., they recorded relatively higher susceptibility and disease incidence of 'Lakatan' in the field than in the 'Grand Nain' genotype[29]. Thus, the sensitivity rate of banana tissues to phytotoxins (FA and BEA) in-vitro may be correlated with its susceptibility to Fusarium wilt disease in the field.

      The degree of browning rates of test plants: tissue-cultured plantlets (TC plantlets), multiple bud clumps (MBC), callus, and attached leaf tissues to FA and BEA varied from one another. Higher susceptibility of callus and MBC than TC plantlets and attached leaf tissues were observed, which indicated higher sensitivity of the tissues to the phytotoxins. This confirms callus and MBC as suitable materials for screening resistant cell lines via somatic cell selection due to heightened toxin sensitivity, although the reason behind this is still unclear. A lower browning rate of attached leaf tissues than in in-vitro test plants demonstrated that toxin sensitivity was more pronounced in vitro than in planta. This may be attributed to several factors, including the environment and the type of tissues[2].

    • Fusaric acid (FA) and beauvericin (BEA) are toxic to banana 'Grand Nain' and 'Lakatan' through significant vascular browning. The arbitrary 10-point visual hedonic scales developed in this study for tissue-cultured plantlets (TC plantlets), multiple bud clumps (MBC), and callus tissues could be used to measure the phytotoxicity of Fusarium toxins. The higher degree of vascular browning observed in 'Lakatan' banana treated with FA and BEA toxins than in 'Grand Nain' suggested genotype-dependent toxin sensitivity and subsequent susceptibility of banana to Fusarium wilt disease, although further data are needed to support this. Data obtained here would aid in determining the effective concentration for toxin-based cell selection using callus and MBC cultures.

      • This study was supported by the Department of Agriculture- Bureau of Agricultural Research (DA-BAR), Philippines. We thank Fe dela Cueva, Edzel Evallo, Diana Rose Biglete, Monica Fronda, Yron Retuta, Rodel Pia, Pamela Quintos, May Eljera, Loida Pascual, Flora R. Cuevas, Rochelle Delgado, and Eugene Parañaque for the technical assistance and support. Special thanks to the Fruit Crops Section and the National Plant Genetic Resources Laboratory of the Institute of Plant Breeding, College of Agriculture and Food Science for providing the banana cultures and plantlets.

      • The authors declare that they have no conflict of interest.

      • Copyright: © 2023 by the author(s). Published by Maximum Academic Press, Fayetteville, GA. This article is an open access article distributed under Creative Commons Attribution License (CC BY 4.0), visit https://creativecommons.org/licenses/by/4.0/.
    Figure (4)  Table (2) References (29)
  • About this article
    Cite this article
    Cruz MA, Alcasid C, Millado CS, Balendres MA. 2023. Toxicity of fusaric acid and beauvericin in tissue-cultured banana 'Grand Nain' and 'Lakatan'. Technology in Horticulture 3:15 doi: 10.48130/TIH-2023-0015
    Cruz MA, Alcasid C, Millado CS, Balendres MA. 2023. Toxicity of fusaric acid and beauvericin in tissue-cultured banana 'Grand Nain' and 'Lakatan'. Technology in Horticulture 3:15 doi: 10.48130/TIH-2023-0015

Catalog

  • About this article

/

DownLoad:  Full-Size Img  PowerPoint
Return
Return