


-
Bruise damage to fresh produce is the most common defect in the horticultural industry. It reduces fruit quality for the consumer and decreases the revenue of the growers[1−5]. Bruise damage can cause substantial economic losses and result in serious food safety concerns. Bruises on fruit surfaces can potentially result in tissue degradation, facilitating the development of a favourable environment for the growth of mold and/or bacteria[2]. Bruise damage is caused largely by excessive impact and/or compression forces on the produce[1,3,4]. These forces cause the fruit's outer layer to break without getting ripped[1,3,6]. Bruising causes cells to break down and become exposed to oxygen that causes browning. The reaction does change the color as well as make the tissue feel softer or even mushy[3,6]. Several factors regulate the susceptibility of fruit to bruise damage, some of these include genetic (species/genotype), seasonality, climate change and environmental conditions, farming/orchard practices; and the effect of fruit properties[7], the major contributing factor has been linked to the amount of mechanical energy applied and absorbed by produce during its preharvest and postharvest handling chain[4,7,8].
Pomegranate (Punica granatum L.) is an ancient deciduous fruit of Middle Eastern origin with over 500 different cultivars grown in many parts of the world, including South Africa[9−11]. Pomegranate fruit is usually eaten fresh, but it can also be eaten in juice, dried arils, jams, etc. The pomegranate fruit industry has received a boost in revenue and production owing to the many health benefits of the product[12−15]. The pomegranate fruit possesses a significant concentration of anti-inflammatory and antioxidant chemicals, which have the potential to contribute to the prevention of inflammatory illnesses. Additionally, these compounds may also have anti-proliferative and antimetastatic effects in humans[12].
Studies show that pomegranate fruit is vulnerable to bruise damage[1]. Bruising occurs during harvesting and postharvest handling operations[4,8]. Bruising makes fruit rind soft and susceptible to insect attack. Opara et el.[8] reported a significant correlation between bruised fruits and decay/insect damage. Several research studies have revealed that bruising degrades pomegranate fruit's physical and biological qualities[16−18]. Some of the changes induced by bruising include increased peel electrolyte leakage (PEL), higher browning score and increased polyphenol oxidase (PPO) enzyme activity. Hussein et al.[17] has reported a high respiration rate and several physicochemical changes, including colour browning, peel electrolyte leakage and polyphenol oxidase (PPO) enzyme activity after bruise damage. Bruising also results in weight loss and hence a decrease in saleable value.
Pomegranate fruit possess a hard and thick rind/peel making bruise damage detection difficult compared to apple and pear fruits[1,19, 20]. Bruises in pomegranate fruit only become visible after several days[21] (Fig. 1) and early detection of bruised pomegranates visually is difficult in the sorting line. At present, the practice of employing manual fruit sorting in packhouses for the purpose of detecting and removing bruised samples from the sorting line is deemed inefficient[1]. To this end, there is strong interest in improving bruise detection and sorting capability.
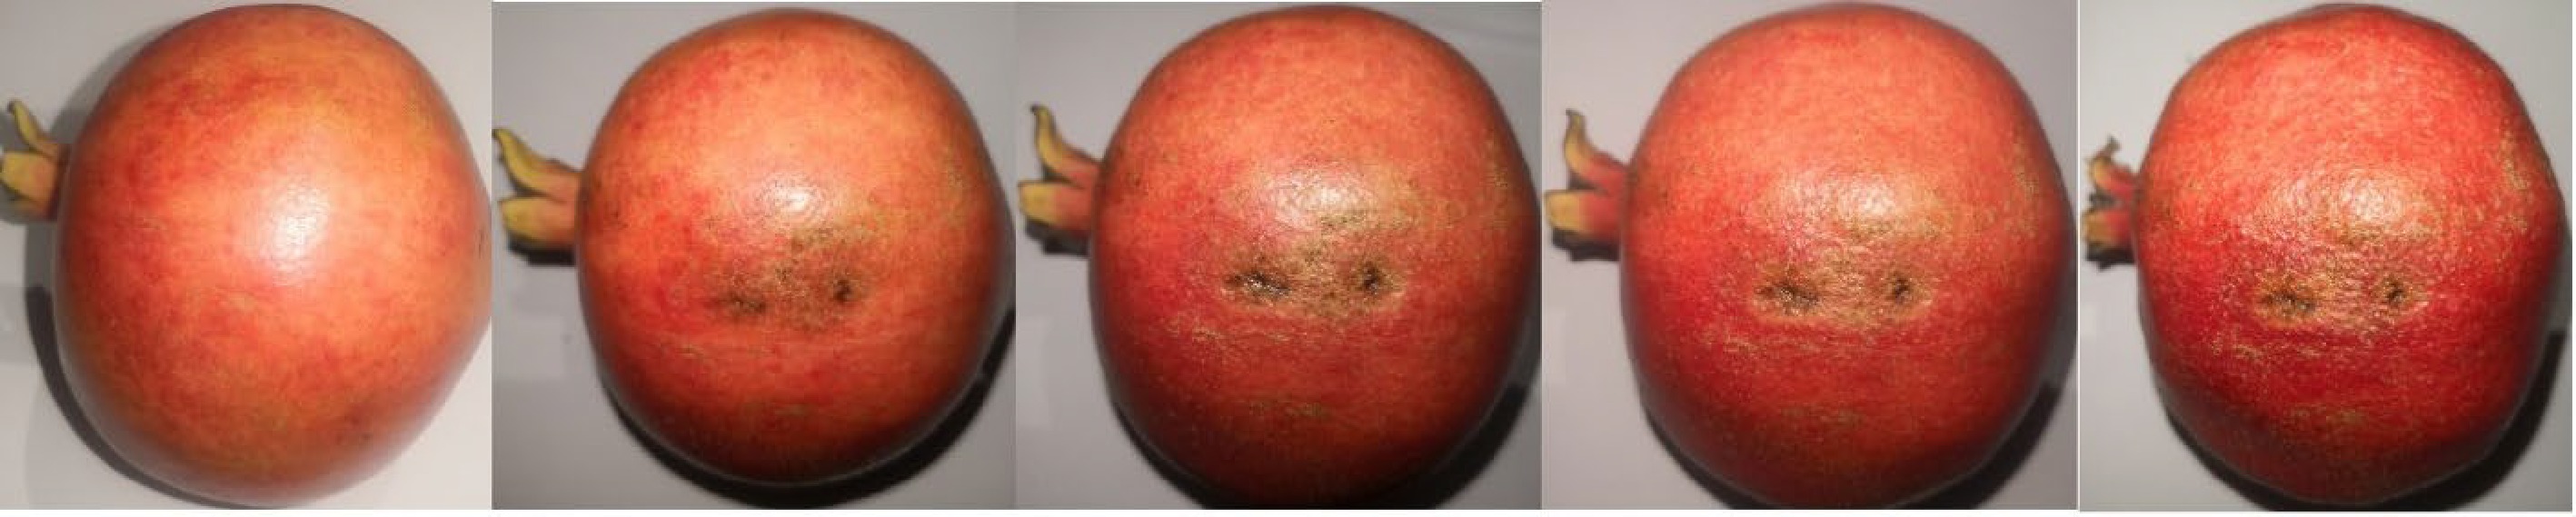
Figure 1.
Evolution of bruising damage over 8 d in pomegranate fruit (cv. Wonderful) that was dropped from 60 cm vertically (impact energy of about 1.8 J).
The machine vision system (MVS) has long been used to classify and evaluate food and horticulture goods[22]. The MVS functions using only spatial parameters like colour and fruit size. The MVS evaluation of internal quality features is hindered by the lack of full spectrum information[19, 22]. Multi and hyperspectral imaging offer precise physical and chemical measurements, advancing fruit quality monitoring. This improvement allows objective fruit quality distribution assessment[23, 24]. The hyperspectral imaging's high spectral resolution and large number of bands—often hundreds or thousands—allow it to detect previously undetected occurrences[25]. The HSI combines spectroscopy and imaging in a non-invasive, nondestructive device[24−27]. The HSI acquires a three-dimensional data set called hypercube with two spatial and one spectral dimension[25,28]. The HSI provides more reliable diagnostic data than traditional machine vision or spectroscopy techniques in analyzing the characteristics of objects[29,30]. However, hyperspectral data collection, manipulation, and interpretation are difficult[25, 28−31].
Artificial intelligence (AI) has made good progress in the analysis and recognition of images, which has also triggered some researchers to explore the area of combining machine learning with hyperspectral images of biological materials and achieve some progress. Particularly in the postharvest industry, several machine learning methods have been explored for fruit quality analysis[31−33]. For most applications, the convolutional neural networks (CNN) are preferred in computer vision tasks over traditional artificial neural network (ANN) algorithms such as Multilayer Perceptron (MLP), Linear Regression (LR), Random Forest, Support Vector Machine, etc.[30, 33−35]. However, CNN requires huge amounts of data and computational power and a long time for training which introduce lots of research limitations[36−39]. Deep learning (DL), a branch of machine learning (ML) and AI is nowadays considered as a core technology to handle more data, connectivity and analytics for digitalizing and automating produce sorting, grading, and packing. However, deep learning models require huge amounts of data and an expert team to train the models. It is advisable not to use deep learning if you don't have enough labeled data and a dedicated team[36]. The MLP on the other hand, has been shown to provide excellent results in non-destructive identification and detection of bruises and diseases in the fresh produce industry[44−52]. Examples includes apples (Malus domestica)[44], strawberries (Fragaria × ananassa Duch.)[45], blueberries (Vaccinium)[46], peaches (Amygdalus persica L.)[47], kiwifruit (Actinidia deliciosa)[48], pears (Pyrus)[49], jujube (Zizyphus Jujuba Mill.)[50] and cucumbers (Cucumis sativus)[51].
Analysis of bruise detectability during the first few days after injury provides vital information for the sorting and grading process. It could also be crucial in monitoring the development of bruise induced infections in fruits[44, 45, 47−51]. Prior research has explored the utilisation of hyperspectral imaging techniques for the purpose of identifying and categorising bruises present on delicate fruits such as apples and pears[44−52]. The diagnosis of bruising on pomegranate fruit during its early stage, however, is difficult due to the tough thick structure of its outer peel. It would be worthwhile to investigate the feasibility of using hyperspectral imaging technique. A successful algorithm will aid in the development of bruise sorting system, which will have a significant economic impact in the sector. The hyperspectral imaging approach can be used to identify and quantify mechanical damage to a fruit (owing to fruit juice collection in areas of damage). The purpose of this paper is to evaluate the potential of hyperspectral imaging to capture and identify this phenomenon.
This study examined the capability of hyperspectral imaging utilising two HSI cameras, HySpex VNIR-1800 (400 to 1,000 nm) and HySpex SWIR-384 (950 to 2,500 nm), to identify bruises on pomegranate fruit non-destructively. Hence, this study acquires the hyperspectral image of pomegranate fruits at different post bruise stages (0, 7 and 14 d) to achieve the following specific objectives:
a) To collect hyperspectral data for bruised and unbruised pomegranate fruit using visible near-infrared (Vis-NIR) (ranging from 400 to 1,000 nm) and short-wave infrared (SWIR) (ranging from 1,000 to 2,500 nm).
b) To select optimal wavelengths that provide the highest correlation between the spectral data and fruit bruising.
c) To create Feed Forward-Artificial Neural Network (FF-ANN) models for early pomegranate bruise classification prediction.
-
The present study obtained pomegranate fruit (cv. 'Wonderful') at the commercial harvest maturity stage from the 2021 harvest season. The fruit came from Sonlia Fruit Packhouse in Western Cape, South Africa. Pomegranate fruit samples weighing 280 ± 45 g were sorted, washed, and stored at optimal conditions (7.0 ± 1 °C and 90% ± 2% RH)[21]. Pomegranate fruits without visible surface defects were selected from the prepared samples. The fruit samples had an average TSS of 16.36 ± 1.05°Brix and a TSS/TA of 10.08% ± 2.13%. The measurement of TSS was conducted using a digital hand-held refractometer (Palette, PR-32α, Atago, Tokyo, Japan). TA was determined by diluting 2 mL of supernatant in 70 mL of distilled water and subsequently titrating with 0.1 M NaOH using a Metrohm 862 compact titrosampler (Herisua, Switzerland). This process allowed for the calculation of the TSS/TA ratio.
Bruise simulation
-
Samples were split into two groups of 30 samples, Group A, representing bruised samples, was created by dropping pomegranates from a height of 60 cm onto a ceramic surface according to the method of Hussein et al.[17] (Fig. 2). The fruit was bruised sideways around the equatorial area. The sample pomegranate fruits were of the same average size. Group B represents unbruised pomegranates.
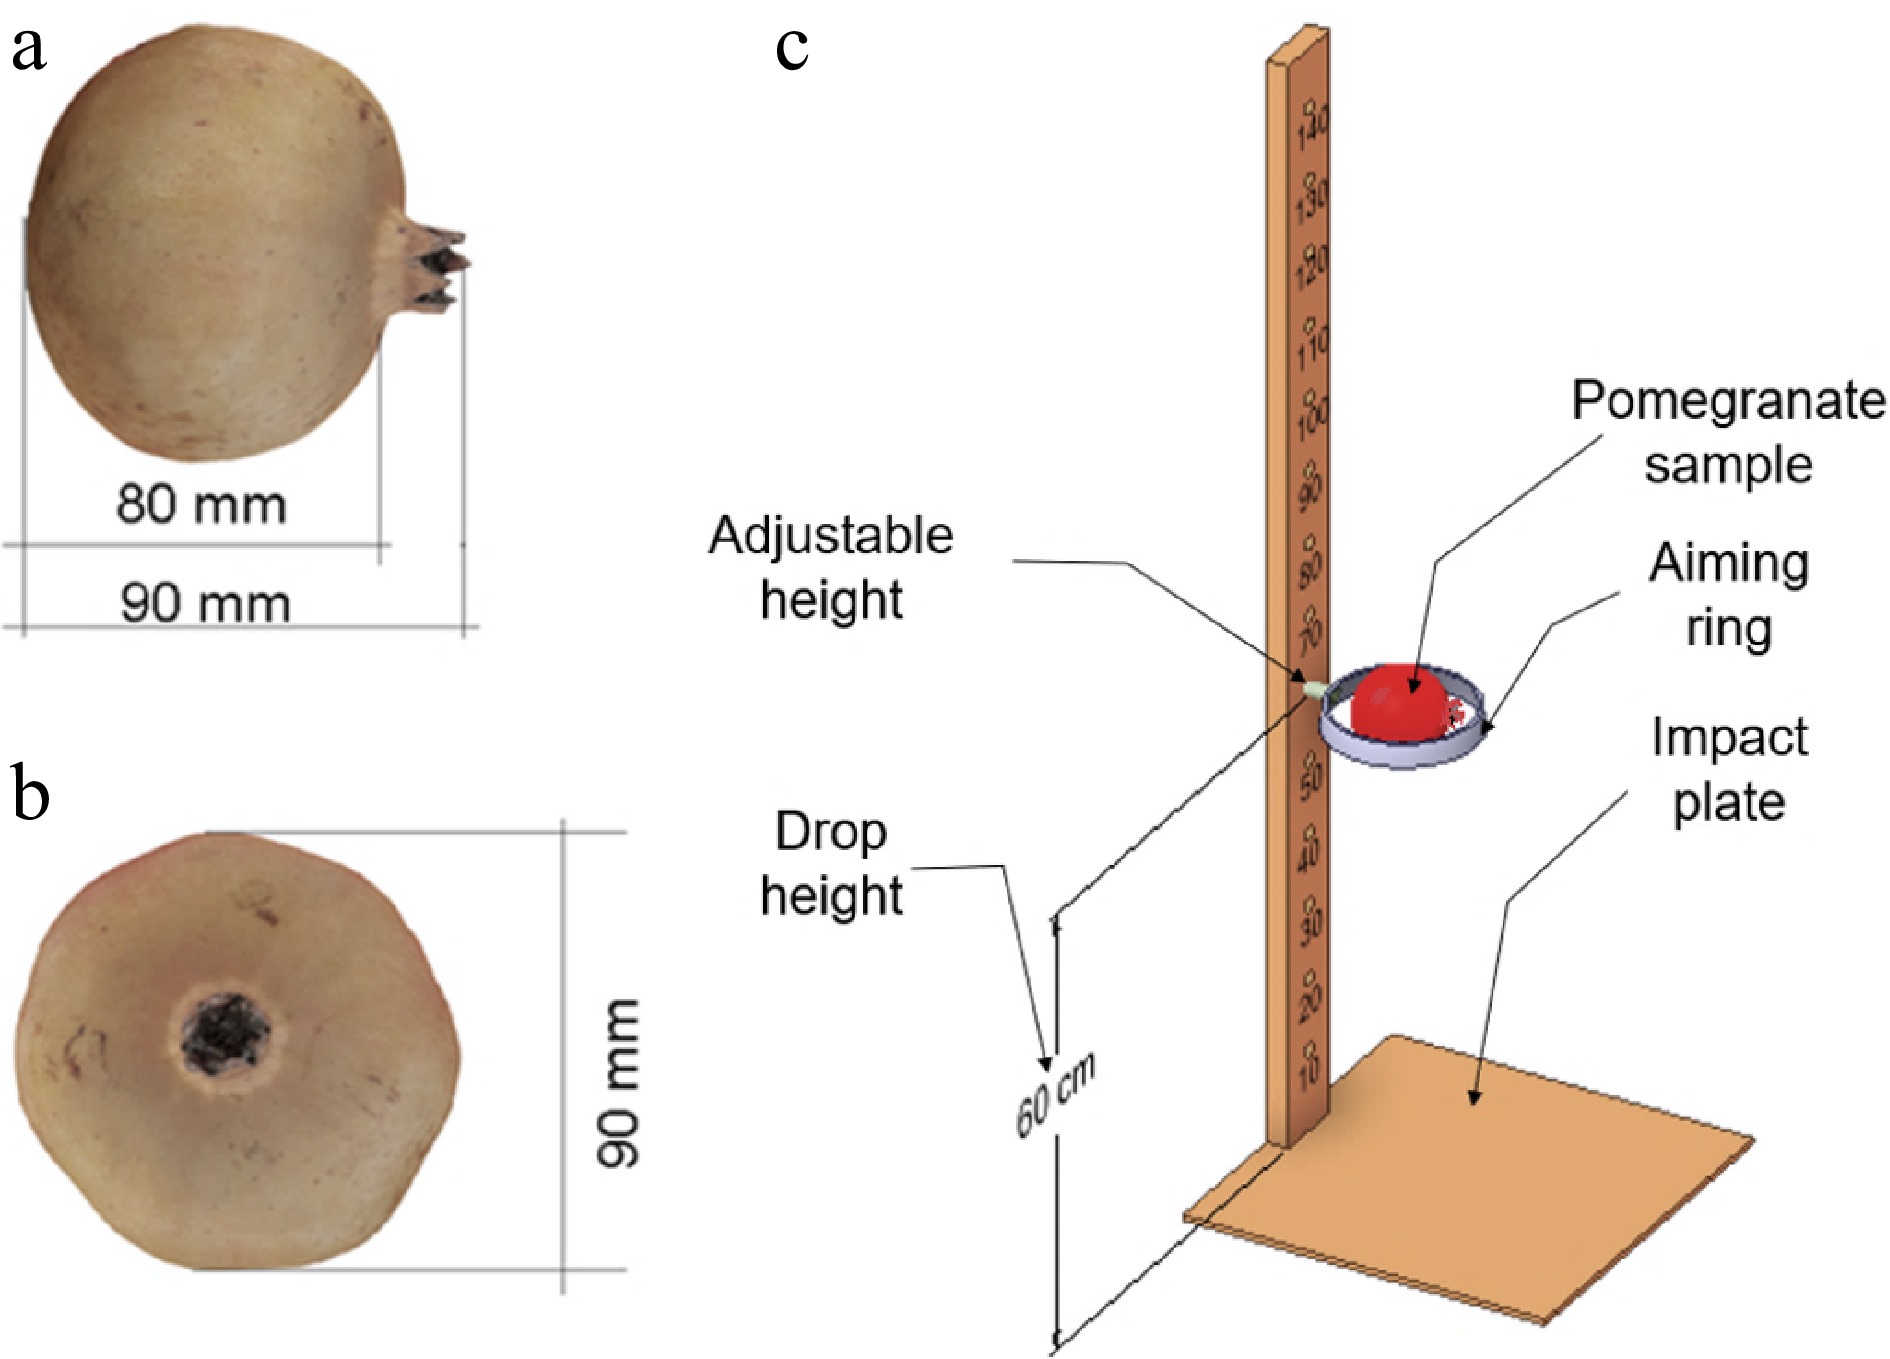
Figure 2.
Schematic showing dimensions of 'Class 1 pomegranate' (cv Wonderful) fruit used in the test ((a) front view and (b) side view) and (c) illustration of the drop simulation setup.
System for hyperspectral imaging
-
The research employs the two most commonly utilised spectral ranges, namely visible and near infrared (vis-NIR, 400 to 1,000 nm), as well as short wavelength infrared (SWIR, 1,000 to 2,500 nm) devices operating in line scan mode. The line scan mode is suitable for implementation in conveyor belt systems in a production line. Figure 3 depicts the schematic of the hyperspectral imaging system and hyperspectral 3D spectral image acquisition process. Samples were scanned with HySpex VNIR-1800 and SWIR-384 hyperspectral imaging cameras (NEO, Norway). The cameras were set up next to each other and imaging was done at the same time at Stellenbosch University's central analytical facility (CAF) vibrational spectroscopy unit (Fig. 3). The cameras were mounted atop a speed-controlled translation stage. The investigation used a 30 cm lens with a 9.470 cm SWIR and 9.733 cm VNIR field of view. The SWIR camera contains 384 spatial pixels and 288 spectral wavebands with a 6 nm spacing. The VNIR camera features 1,800 pixels and 186 wavebands with 3.26 nm spectral spacing. Table 1 compares both equipment's camera specs. Before scanning samples, the speed of sample movement across the camera and the time of exposure were assessed to avoid image distortion and to ensure the spectral images remained clear. Based on a trial and check pre-test, these parameters were set to 1.2 mm s−1 and 50 ms, respectively. The distance from the lens to the conveying stage was set to 450 mm. Two lamps were mounted at 45° angles from the horizontal plane, respectively. During the image acquisition, every pomegranate fruit sample was manually placed on the conveying stage and moved to the field of view (FOV) of the camera and then scanned line by line. The sample was placed with its side facing the camera so that the calix and stem end of the fruit were out of focus. The system operation and picture acquisition were performed using 'Breeze' software (version 2021.1.5, Umeå, Prediktera, Sweden) on a Windows 10 computer. Reflectivity reference data were collected for each fruit in less than a minute by both cameras. Each scan yields a three-dimensional hyperspectral picture cube comprising two-dimensional spatial (x, y) and one-dimensional spectral (λ) data. Hyperspectral images were taken immediately, 7 d, and 14 d later. Samples returned to the cold storeroom at 7.0 ± 1 °C and 90% ± 2% RH after imaging.
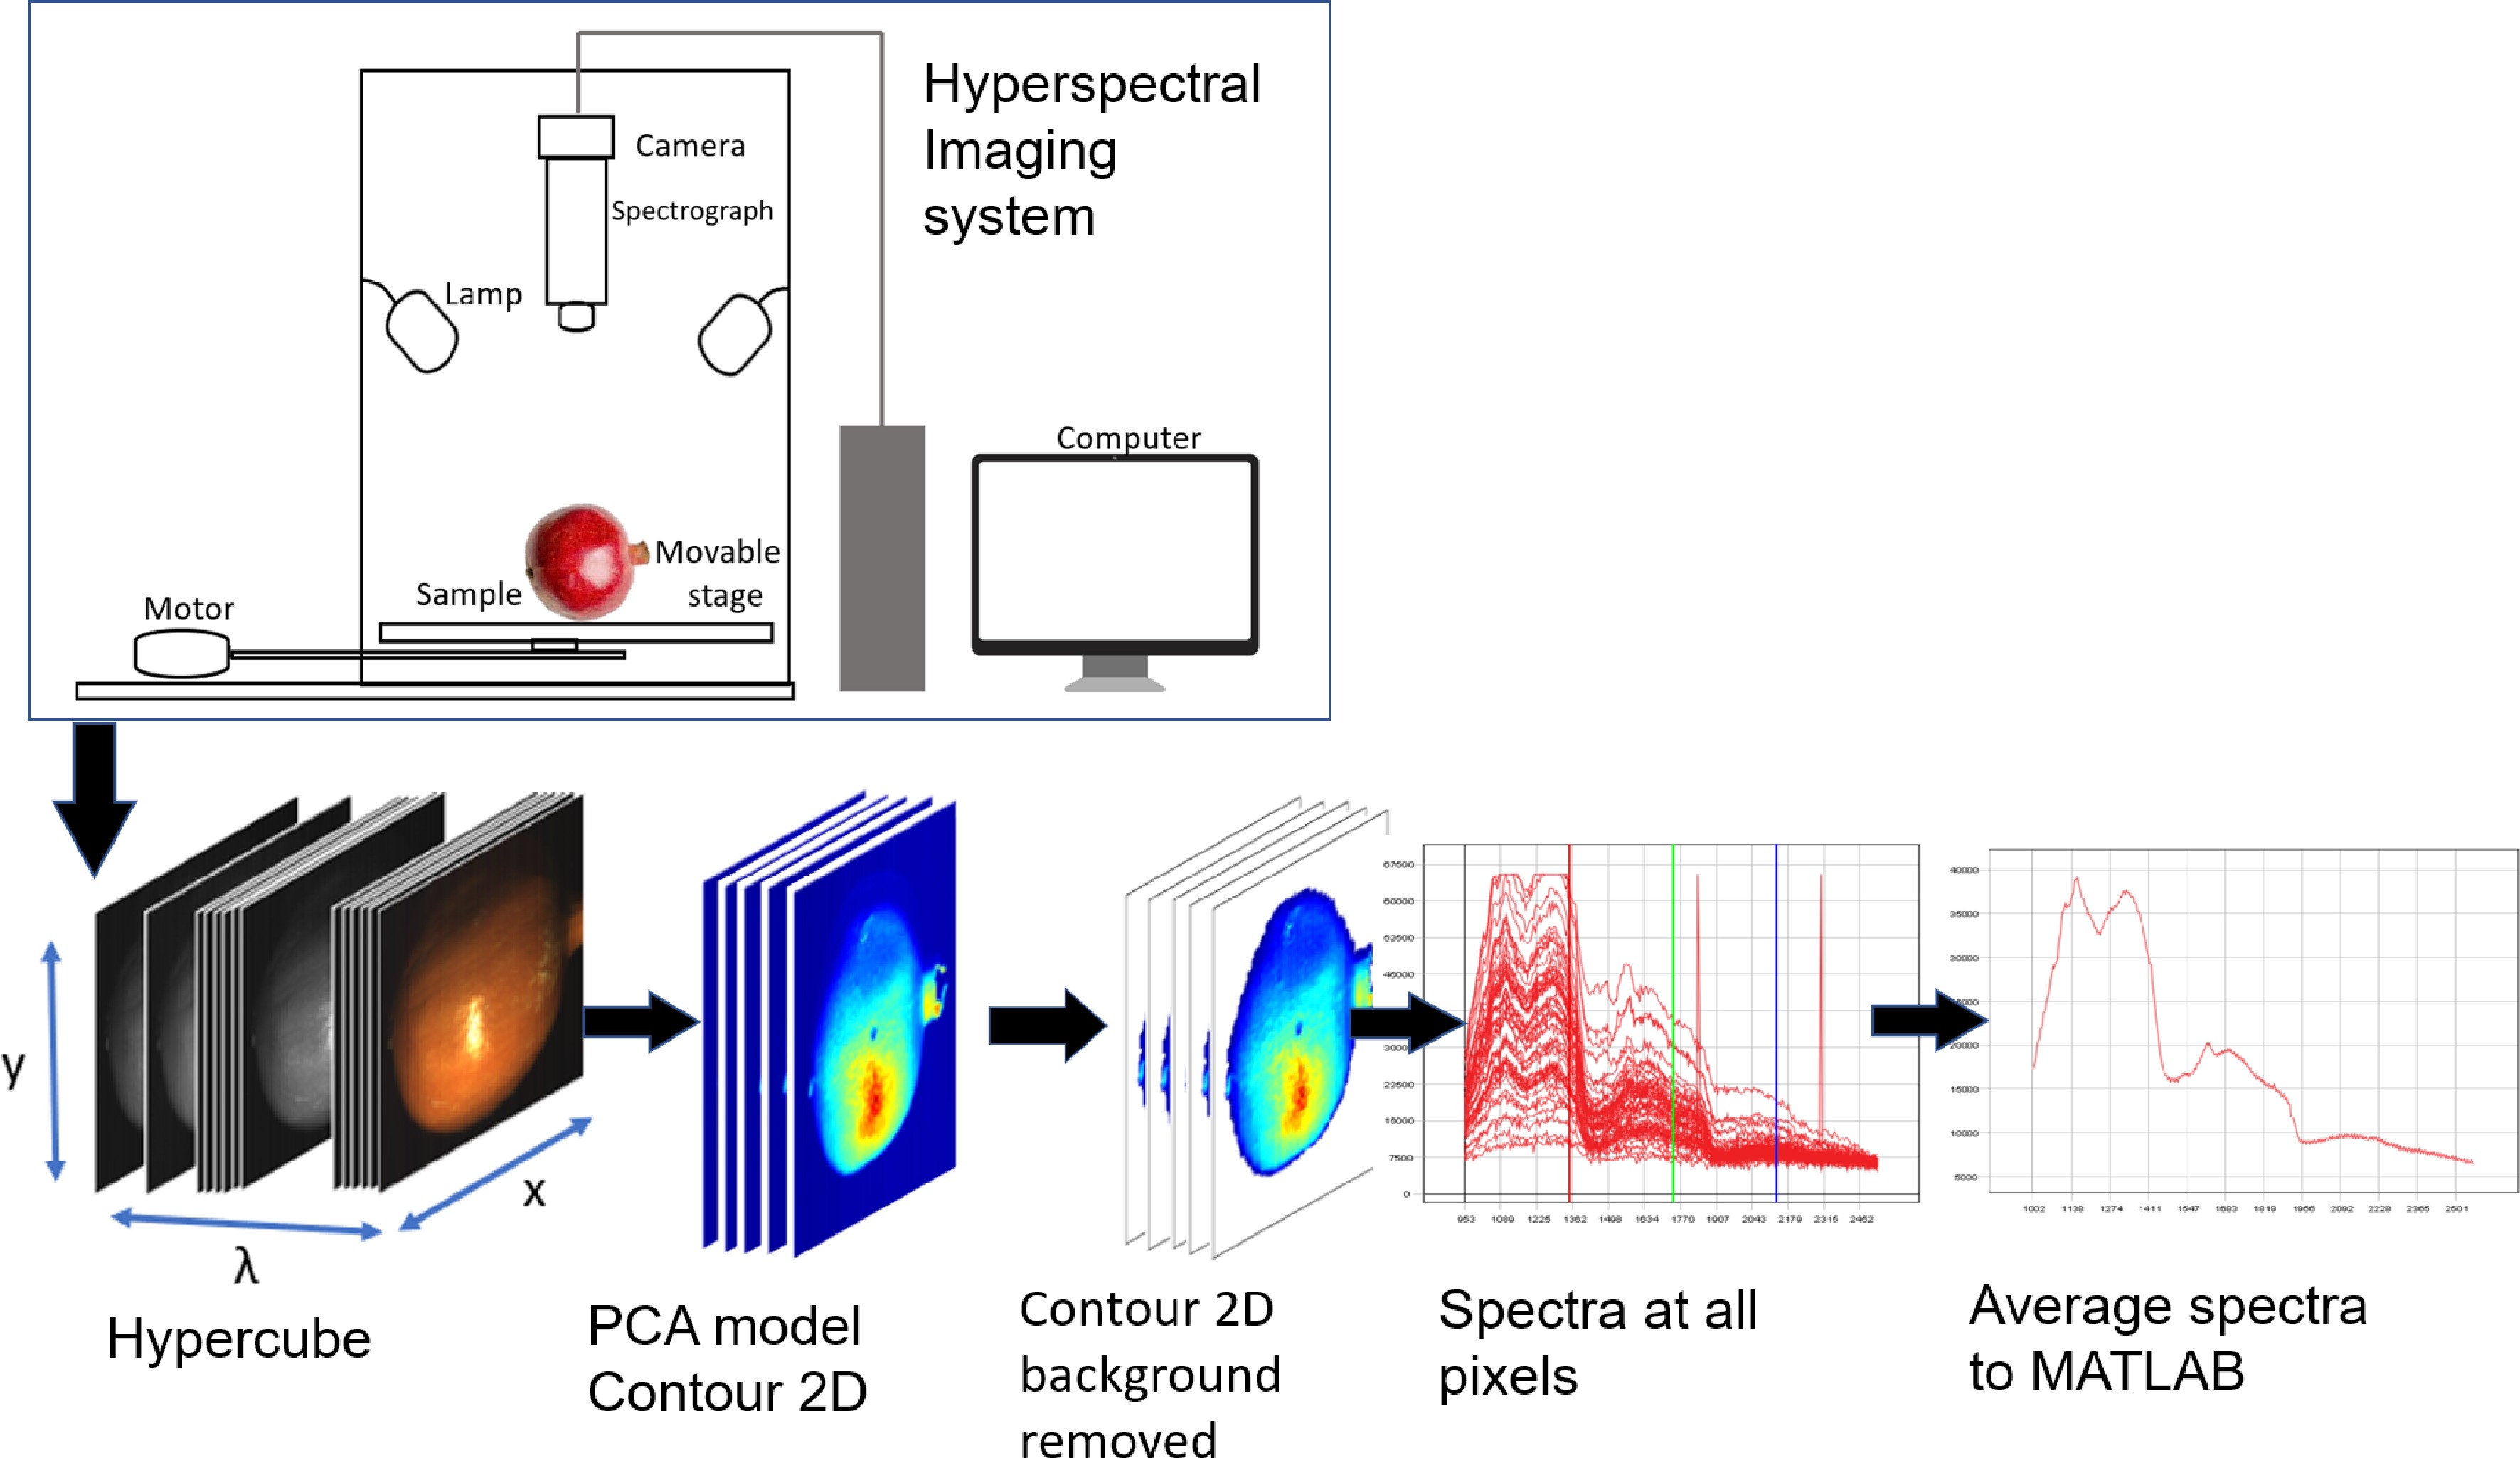
Figure 3.
Schematic showing the hyperspectral image system and image acquisition and preprocessing, process.
Table 1. Specifications of the HySpex SWIR and VNIR cameras used in the study.
Main specifications SWIR VNIR Spectral range 930–2,500 nm 400–1,000 nm Spatial pixels 384 1,800 Spectral channels 288 186 Spectral sampling 5.45 nm 3.26 nm FOV 16° 17° Pixel FOV across/along 0.73/0.73 mrad 0.16/0.32 mrad Bit resolution 16 bit 16 bit Dynamic range 7,500 20,000 Peak SNR (at full resolution) > 1,100 >255 Max speed (at full resolution) 400 fps 260 fps Power consumption 30 W 30 W Dimensions (l-w-h) 38–12–17.5 cm 39–9.9–15 cm Weight 5.7 kg 5.0 kg Camera interface CameraLink CameraLink FOV is field of view. Hyperspectral image calibration
-
The acquired raw hyperspectral images are usually with uneven intensity of illumination. Hence, the raw hyperspectral image was corrected by using grey reference image of a grey calibration plate and a dark reference image with 0% reflectance. The standard calibration method for most hyperspectral (HS) image investigations comprises a linear correction to the original image, as stated in Eqn (1). This equation compensates for non-uniform gain using an inverse-model perspective. Using this standard calibration method, spectral fingerprints from different HS cameras and scenarios with the same components are comparable. The corrected image (
$\rho_{ref}(\lambda) $ $ {\rho }_{xy}\left(\lambda \right)={\rho }_{ref}\left(\lambda \right)\dfrac{{R}_{xy}\left(\lambda \right)-{R}_{dark}\left(\lambda \right)}{{R}_{ref}\left(\lambda \right)-{R}_{dark}\left(\lambda \right)} $ (1) where
$\rho _{ref}(\lambda) $ $\rho_{xy}(\lambda) $ Hyperspectral image correction
-
Subsequently, the Evince version 2.7.13 software (Prediktera, Umeå, Sweden) was used to further explore and minimize irrelevant information including noise and background signal caused by random interferences. Explorative PCA analysis was used to segment the fruit from its background. In spectral preprocessing, the SNV transformation was applied. The SNV reduces spectral data disruption by correcting spectra using average and standard deviation[53]. Matlab Hyperspectral Toolbox was used to analyse the image and train, validate, and test a bruise classification prediction model.
Selection of effective wavelength
-
The noise-whitened Harsanyi–Farrand–Chang (NWHFC) method was used to perform optimal wavelengths selection. The NWHFC is a virtual dimensionality (VD) reduction technique developed from the Neyman–Pearson detection theory-based thresholding methods[54]. The NWHFC is an improvement on the Harsanyi–Farrand–Chang (HFC) method, with an inclusion of noise estimation that decorrelates noise with signal sources for improved signal detection[54,55]. The number of spectrally distinct endmembers in each sample was determined by the NWHFC, and the corresponding bands were identified by PCA for dimensionality reduction. After identifying the effective wavelength, ROI averaged and whole fruit surface (WFS) averaged reflectance values at the effective wavelengths were obtained and used as training data for the classification model development. The process of identifying and eliminating redundant bands from the dataset resulted in a significant reduction in data size, while retaining just the useful bands. This strategy resulted in the acquisition of a more concise classification model.
Classification prediction model
The MLP consist of simple processing units called neurons
-
They work on the relationship between a set of inputs and outputs by updating internal interconnections called weights using the back-propagation algorithm. Some of its advantages include the ability to work with nonlinear data, robustness, trainability and generalization of data and a lower test time[30, 33−35]. This study employed a two-layer feed-forward artificial neural network (ANN) for the sake of its advantageous characteristics of simplicity and robustness. The network model is composed of source nodes as the input layer, one hidden layer of computation nodes, and an output layer of two nodes (corresponding to the number of classification). This type of ANN is suited for multi-dimensional mapping problems given arbitrarily consistent data and enough neurons in its hidden layer[33−35]. Classification prediction models were developed based on average absorbance spectra data at full wavelengths and selected wavelengths of whole HS image and augmented HS image data and compared. The model development apportioned the data into training, validation, and testing sets with a 70-15-15 split.
The three widely used network training algorithms
-
Levenberg-Marquardt backpropagation algorithm (LMBA), Bayesian regularization algorithms (BRA) and scaled conjugate gradient algorithm (SCGA) were compared. The fitting process trains the neural network on the set of averaged reflectance values to produce an associated set of target bruise category. The problem of classifying bruises, which involves distinguishing between two classes - bruised and unbruised samples, is associated with a target matrix of size (1 × 2). In this matrix, each column represents a category and contains a one in either element 1 or 2 (refer to Fig. 4). The samples from the first class, which were bruised, were characterised by the dependent vector [1 0], whilst the class without bruises was represented by the vector [0 1]. Once the neural network has fit the data, it forms a generalization of the input-output relationship and can be used to generate outputs for inputs it was not trained on.
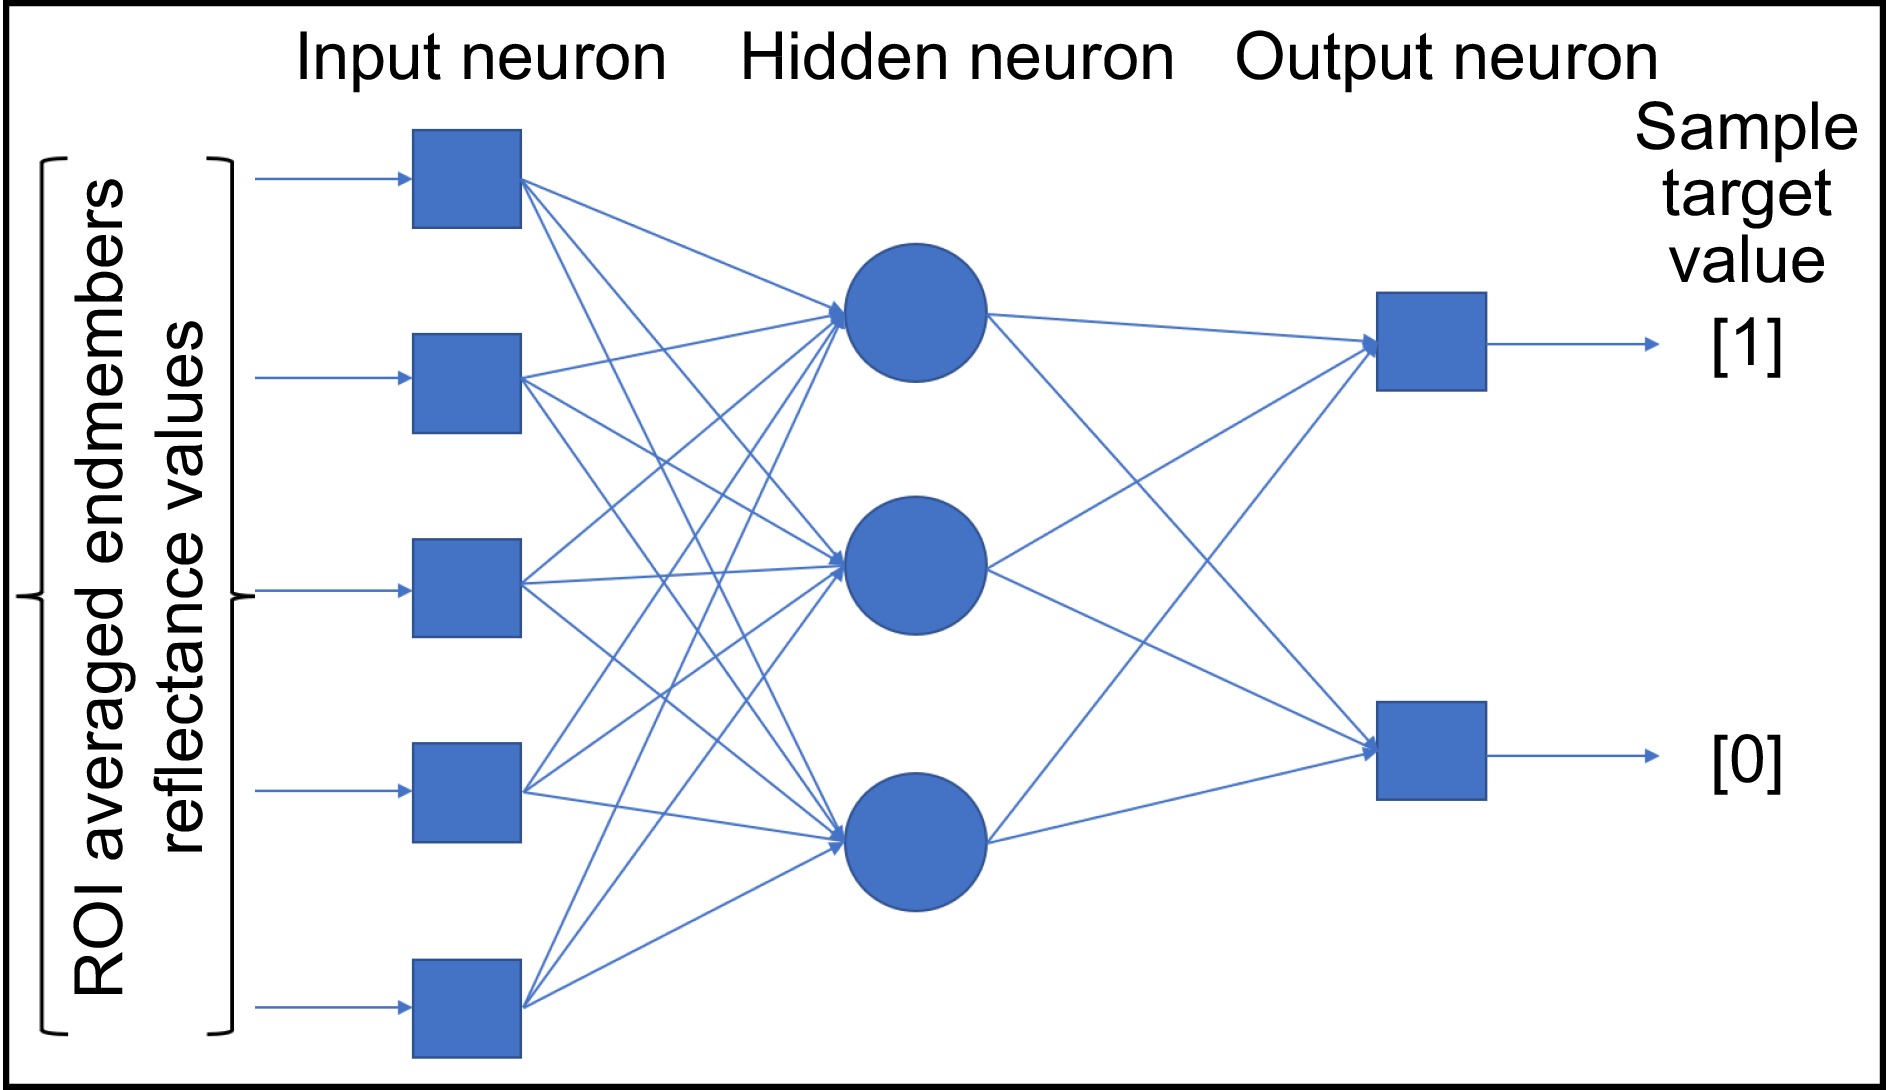
Figure 4.
Artificial neural network architecture for bruise classification.
The role of neural network structure—how many neurons should be used in the hidden layer? The question of how to divide the sample into training, testing, and validation sets was investigated in terms of classification performance. For this examination, the error histogram, confusion matrix, and ROC curve were examined. The confusion matrix, a common classification statistic, was utilised in this study to report classification performance findings.
-
Figure 5 depicts the segmentation and pre-processing of images from the VNIR and SWIR cameras. The VNIR camera has a characteristically high dynamic range which means that more detail in both highlights and shadows were captured using this camera. However, the size of the raw hyperspectral image data is considerably higher and larger data storage capacities are needed for analysis than the SWIR camera. The images shown in Fig. 5a−c for VNIR and (Fig. 5e−g) for SWIR) do not account for the spatial variations in the light intensities. Figure 4d & h depict the images after correcting the spatial intensity variations from uneven light scattering using the standard normal variable (SNV) transformation as shown in.
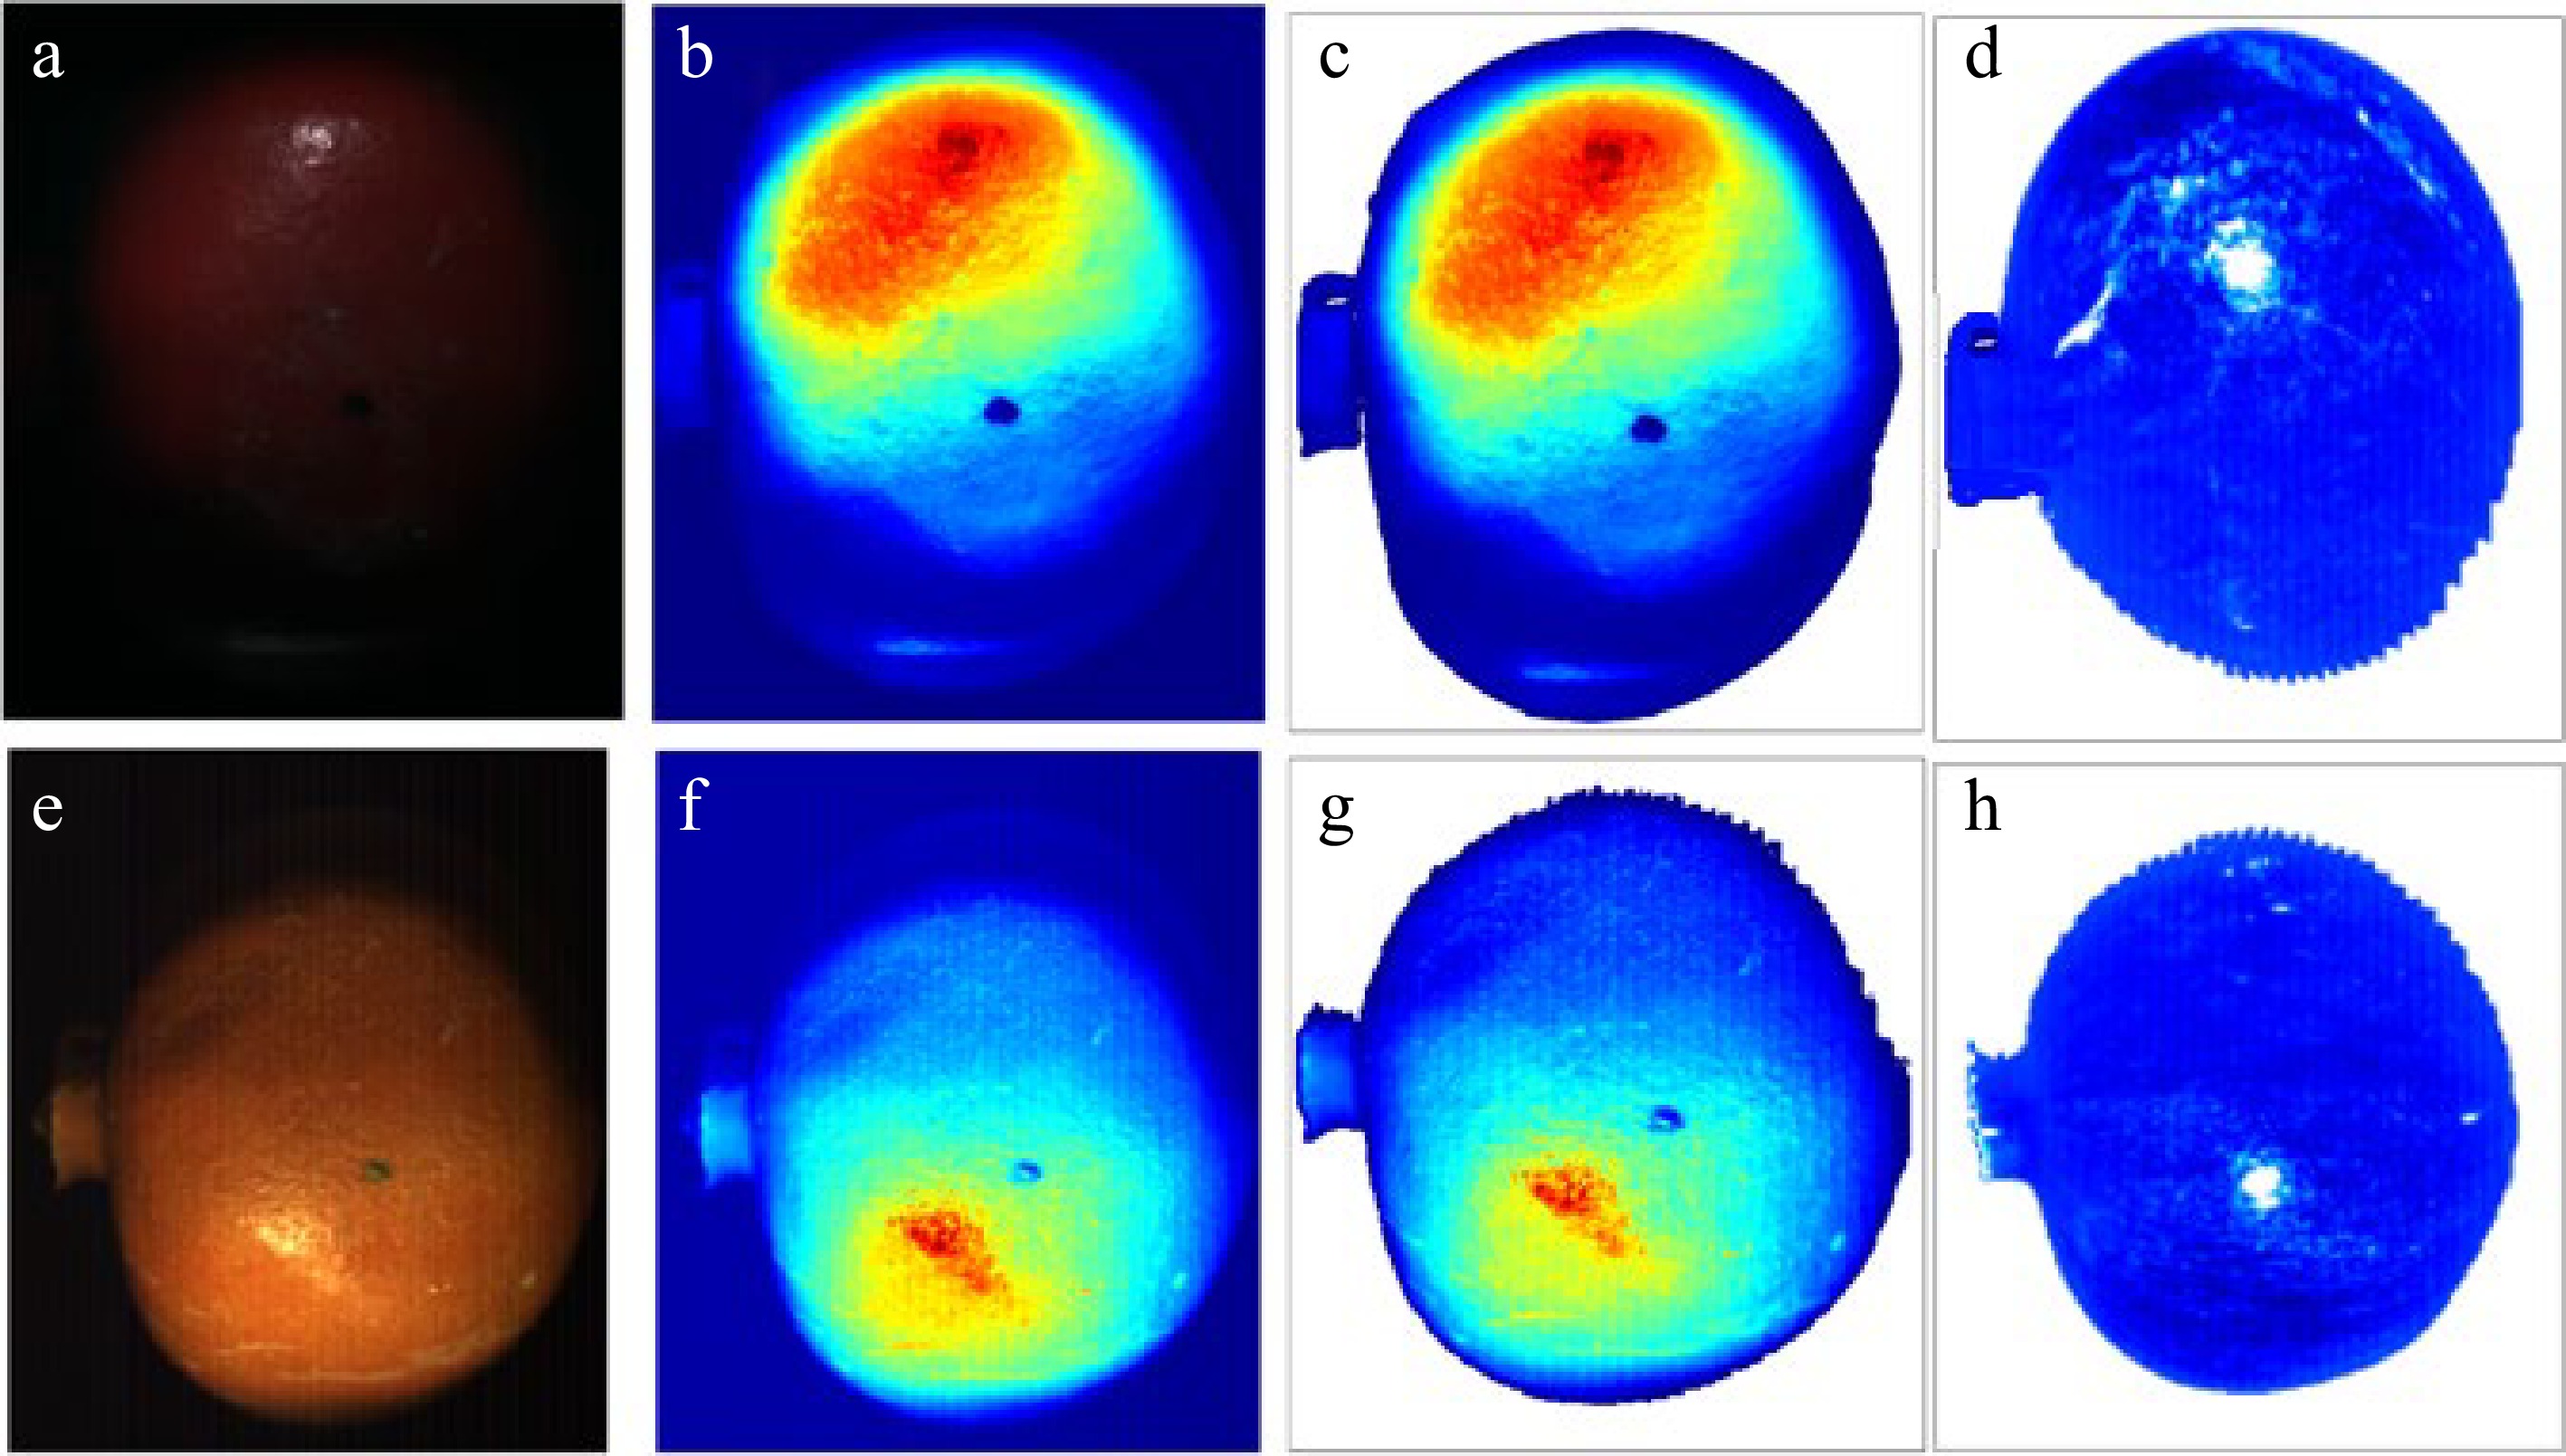
Figure 5.
Segmentation and pre-processing of images from the VNIR (upper raw) and SWIR (bottom raw) cameras. Raw (RGB) images (a) and (e), false color image (b) and (f), segmented images (c) and (g), with corrected spatial intensity variations (d) and (h).
Figure 6 shows the average absorbance spectra of unbruised (left) and bruised (right) pomegranates under VNIR (top) and SWIR (bottom) cameras. It is noted that the trend of spectral reflectance curves of damaged pomegranates is like that of sound samples. However, the absorbance spectra of the unbruised pomegranates are in a narrow absorbance range (variability) than that of the bruised pomegranates. Comparing the overall spectral absorbances of the bruised and unbruised samples revealed characteristic high absorbance values in the band between 600 and 1,300 nm for the bruised pomegranates (Fig. 6). This might be due to a relatively higher water content (strong absorbance capacity) on the surface of bruised pomegranates.
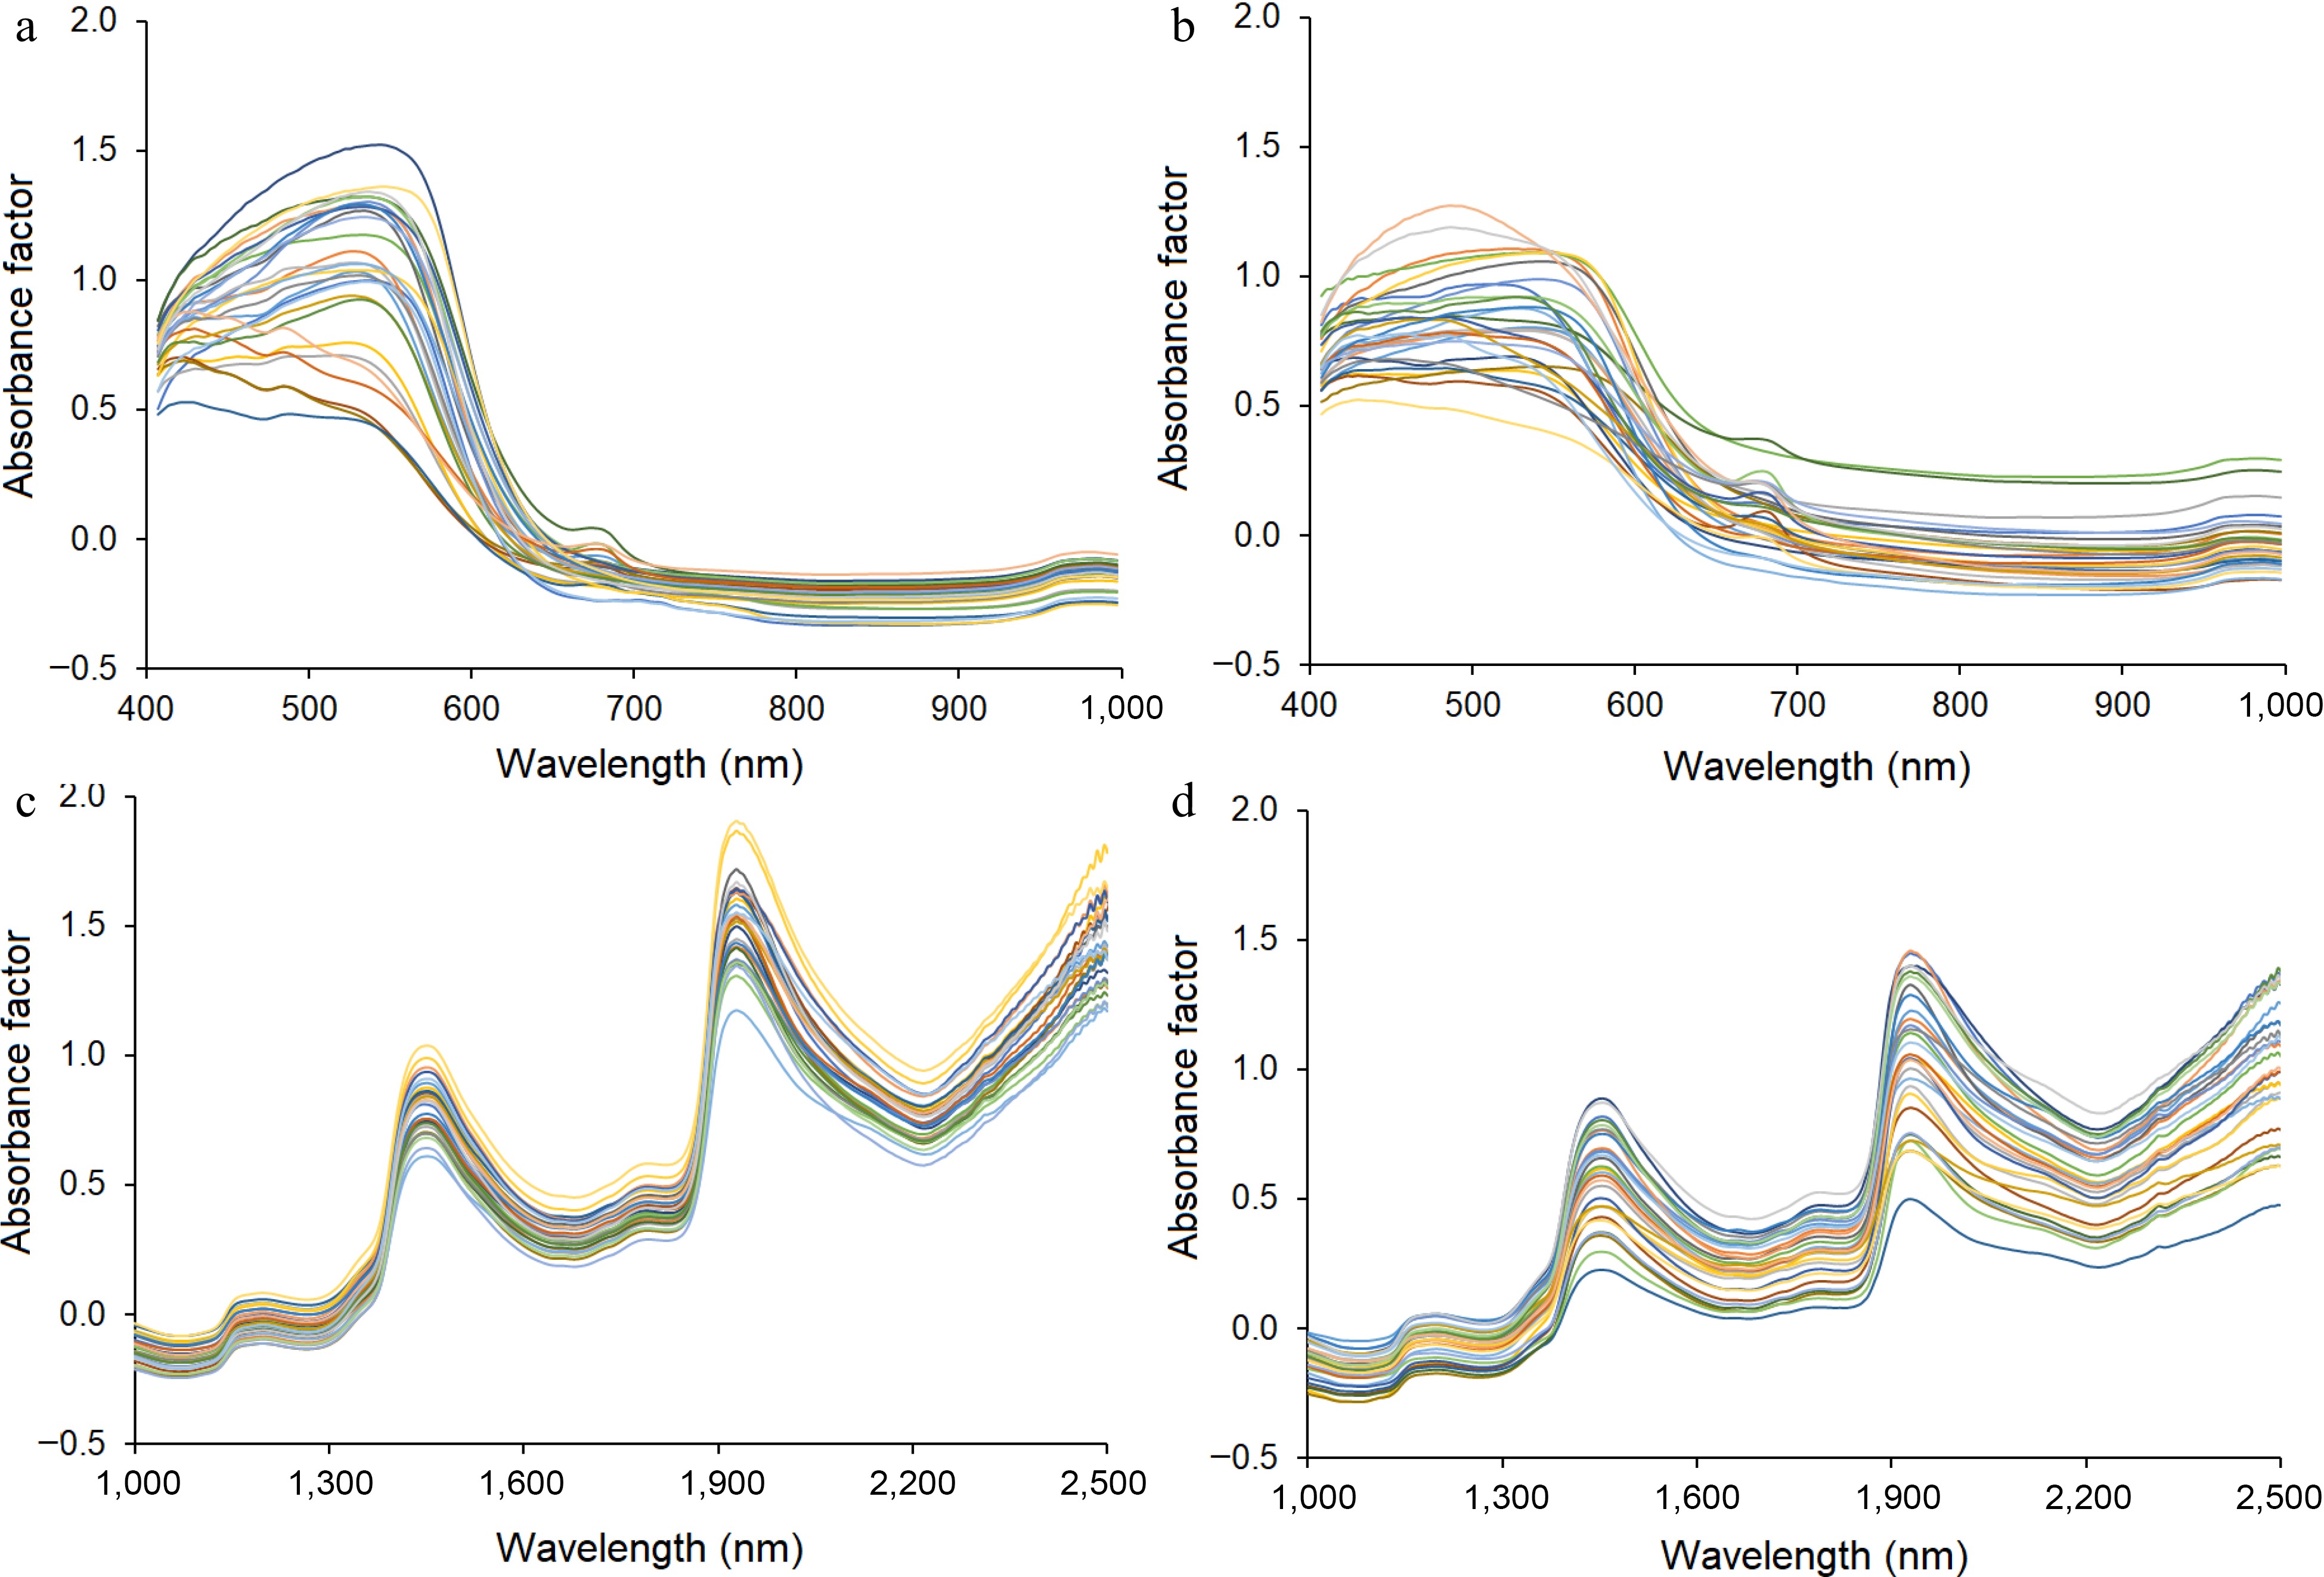
Figure 6.
Average absorbance spectra of (a) unbruised and (b) bruised pomegranates under the VNIR camera and (c) unbruised and (d) bruised under the SWIR camera. Data corresponds to imaging immediately after bruising.
Identification of location of effective bands
-
The average spectral absorbance curves of sound pomegranates and bruised pomegranates at three stages (day 0, 7 d, and 14 d after bruising) are shown in Fig. 7. Generally, the longer the sample is damaged, the lower the spectral absorbance. This may be due to the moisture loss and drying away (less absorbance capacity) of the pomegranate during storage. There is an absorption peak at 685 nm, this might be ascribed to the characteristics of chlorophyll on the surface of the pomegranates[25]. Nine hundred and seventy nm is a typical water absorption band, which is caused by the water content of the pomegranate samples. Clearly absorbance spectra decrease with storage time for both bruised and unbruised sample. The absorbance spectra of bruised samples were higher than the unbruised, and this agrees with the literature as reported for other fruit samples[56−58]. This is in collaboration with the fact that bruising increases moisture/water loss from fruit[19]. Hence, the potential of capturing the change in the moisture content of the surface of pomegranates immediately after bruising using hyperspectral imaging technique is promising. This phenomenon is in fact supported by the spectral absorbance values around 970 in the VNIR system (Fig. 7a). The spectra absorbance looks to be significantly affected by water loss and the colour change during storage.
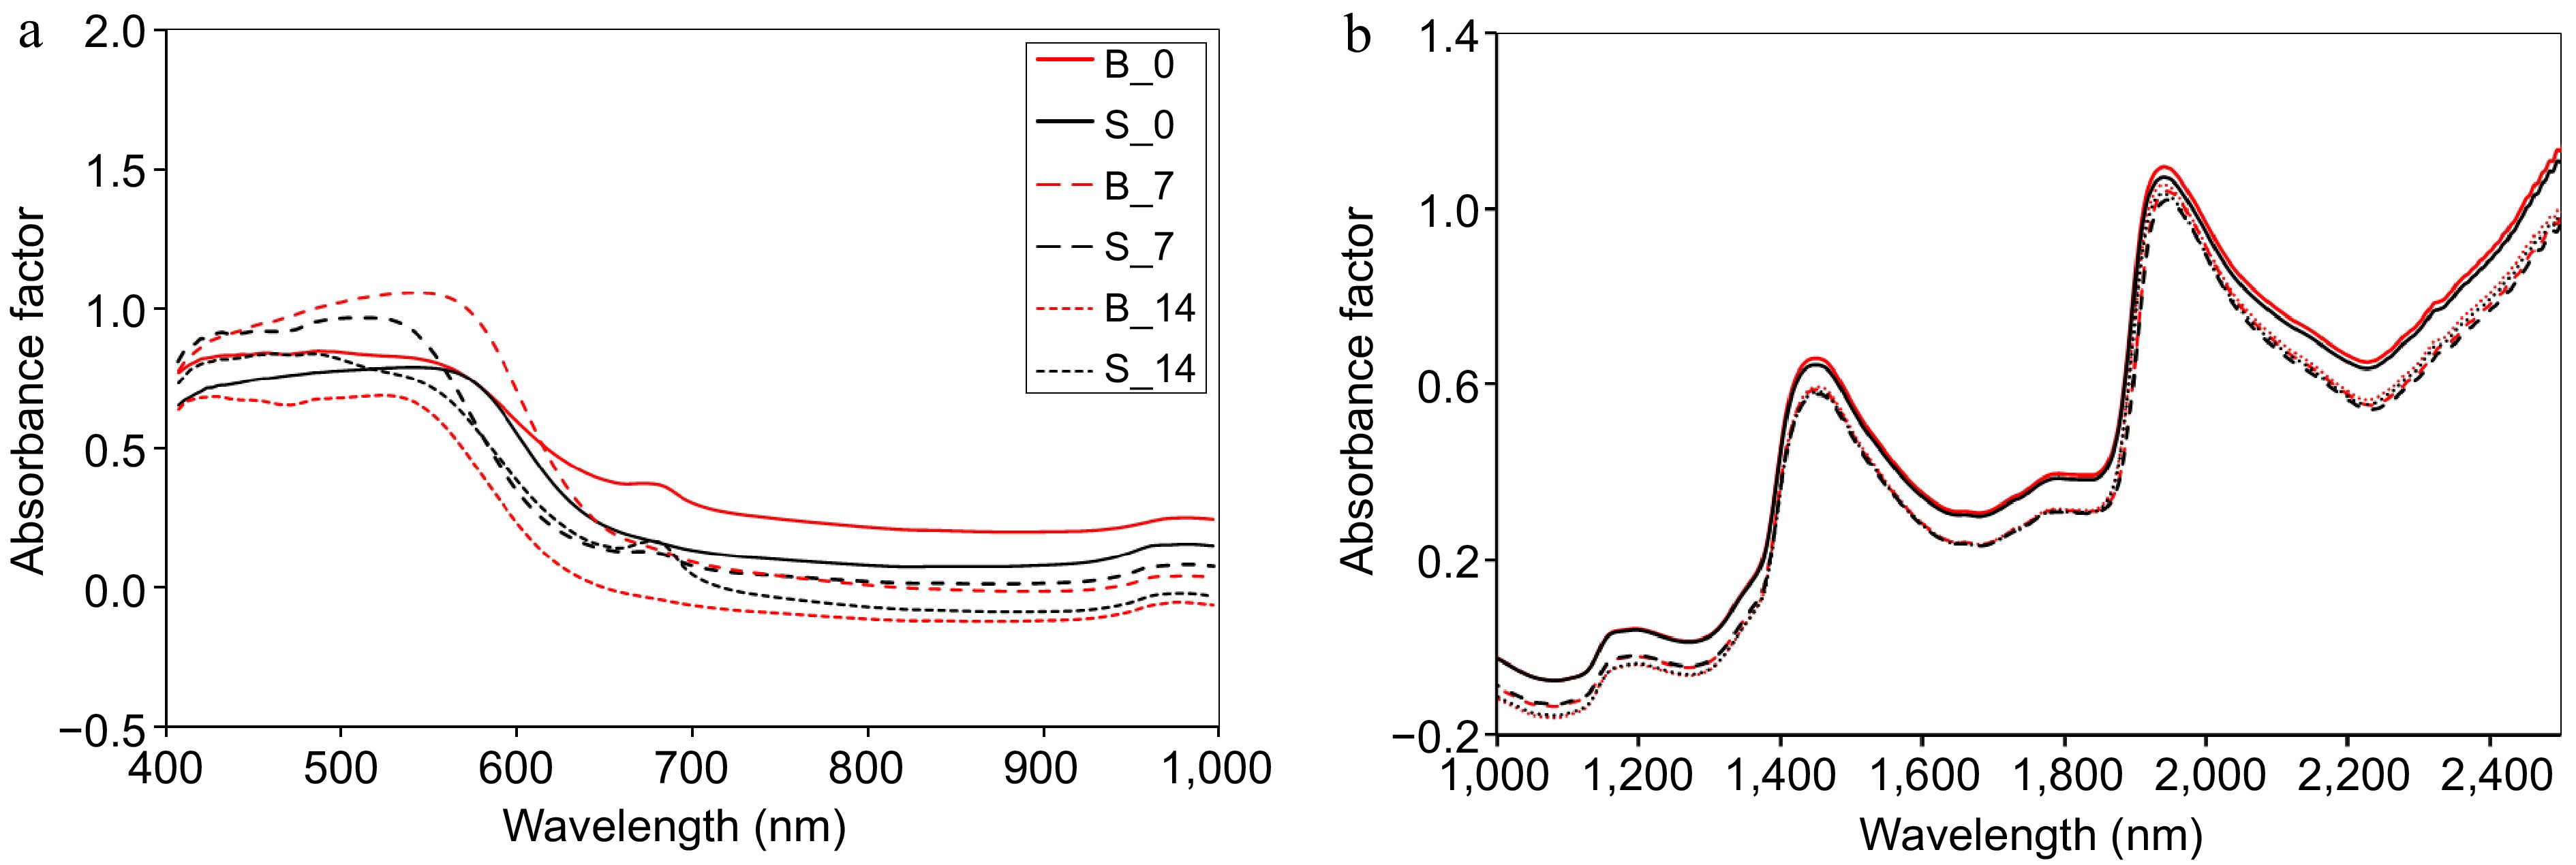
Figure 7.
The average spectra absorbance of unbruised (black curves) and bruised (red curves) of pomegranates under (a) VNIR and (b) SWIR cameras. Where the spectra of not bruised pomegranate in day 0 is S_0, sound fruit in day 7 is S_7, sound in day 14 is S_14, bruised in day 0 is B_0, bruised in day 7 is B_7 and bruised scanned in day 14 is B_14.
A single pixel in a hyperspectral image has 186 and 288 values representing absorbance at different wavelengths for the VNIR and SWIR systems, respectively. This is a huge amount of information to model a classification prediction model. Owing to the continuous nature of the spectral wavelength, information could be redundantly repeated. This will affect the robustness and accuracy of the classification prediction model. After preprocessing, the noise-whitened Harsanyi–Farrand–Chang (NWHFC) method was used to perform optimal wavelengths selection. The NWHFC is a virtual dimensionality (VD) reduction technique developed from the Neyman–Pearson detection theory-based thresholding methods[58,59]. The NWHFC is an improvement on the Harsanyi–Farrand–Chang (HFC) method, with an inclusion of noise estimation that decorrelates noise with signal sources for improved signal detection[54,55]. There was an evident absorption peak around 400 to 550 nm, which could be associated with carotenoid[59]. Peaks from 900 to 920 nm are reported to correlate with starch and cellulose[60]. In addition, peaks were observed around 1,000 nm, which is related to water and vitamin ingredients[59,60]. Peaks near 1,950 and 2,500 nm correspond to oils and faty acids. Figure 8 shows NWHFC-PCA-estimated input data cube spectral bands. The top row of the picture shows the input data cube's spectral bands, while the bottom row shows the five most informative bands for a sound pomegranate fruit. Informative bands show spatial and spectral distinction. Figure 9 shows the same investigation on a fruit bruised by a 60-cm drop. The lower row bruise mark is prominent (as seen through the informational bands). The five efficient bands use VNIR spectral bands of 440, 980, 950, 495, and 850 nm and SWIR bands of 2,348, 2,146, 2,517, 2,457, and 1,000 nm.
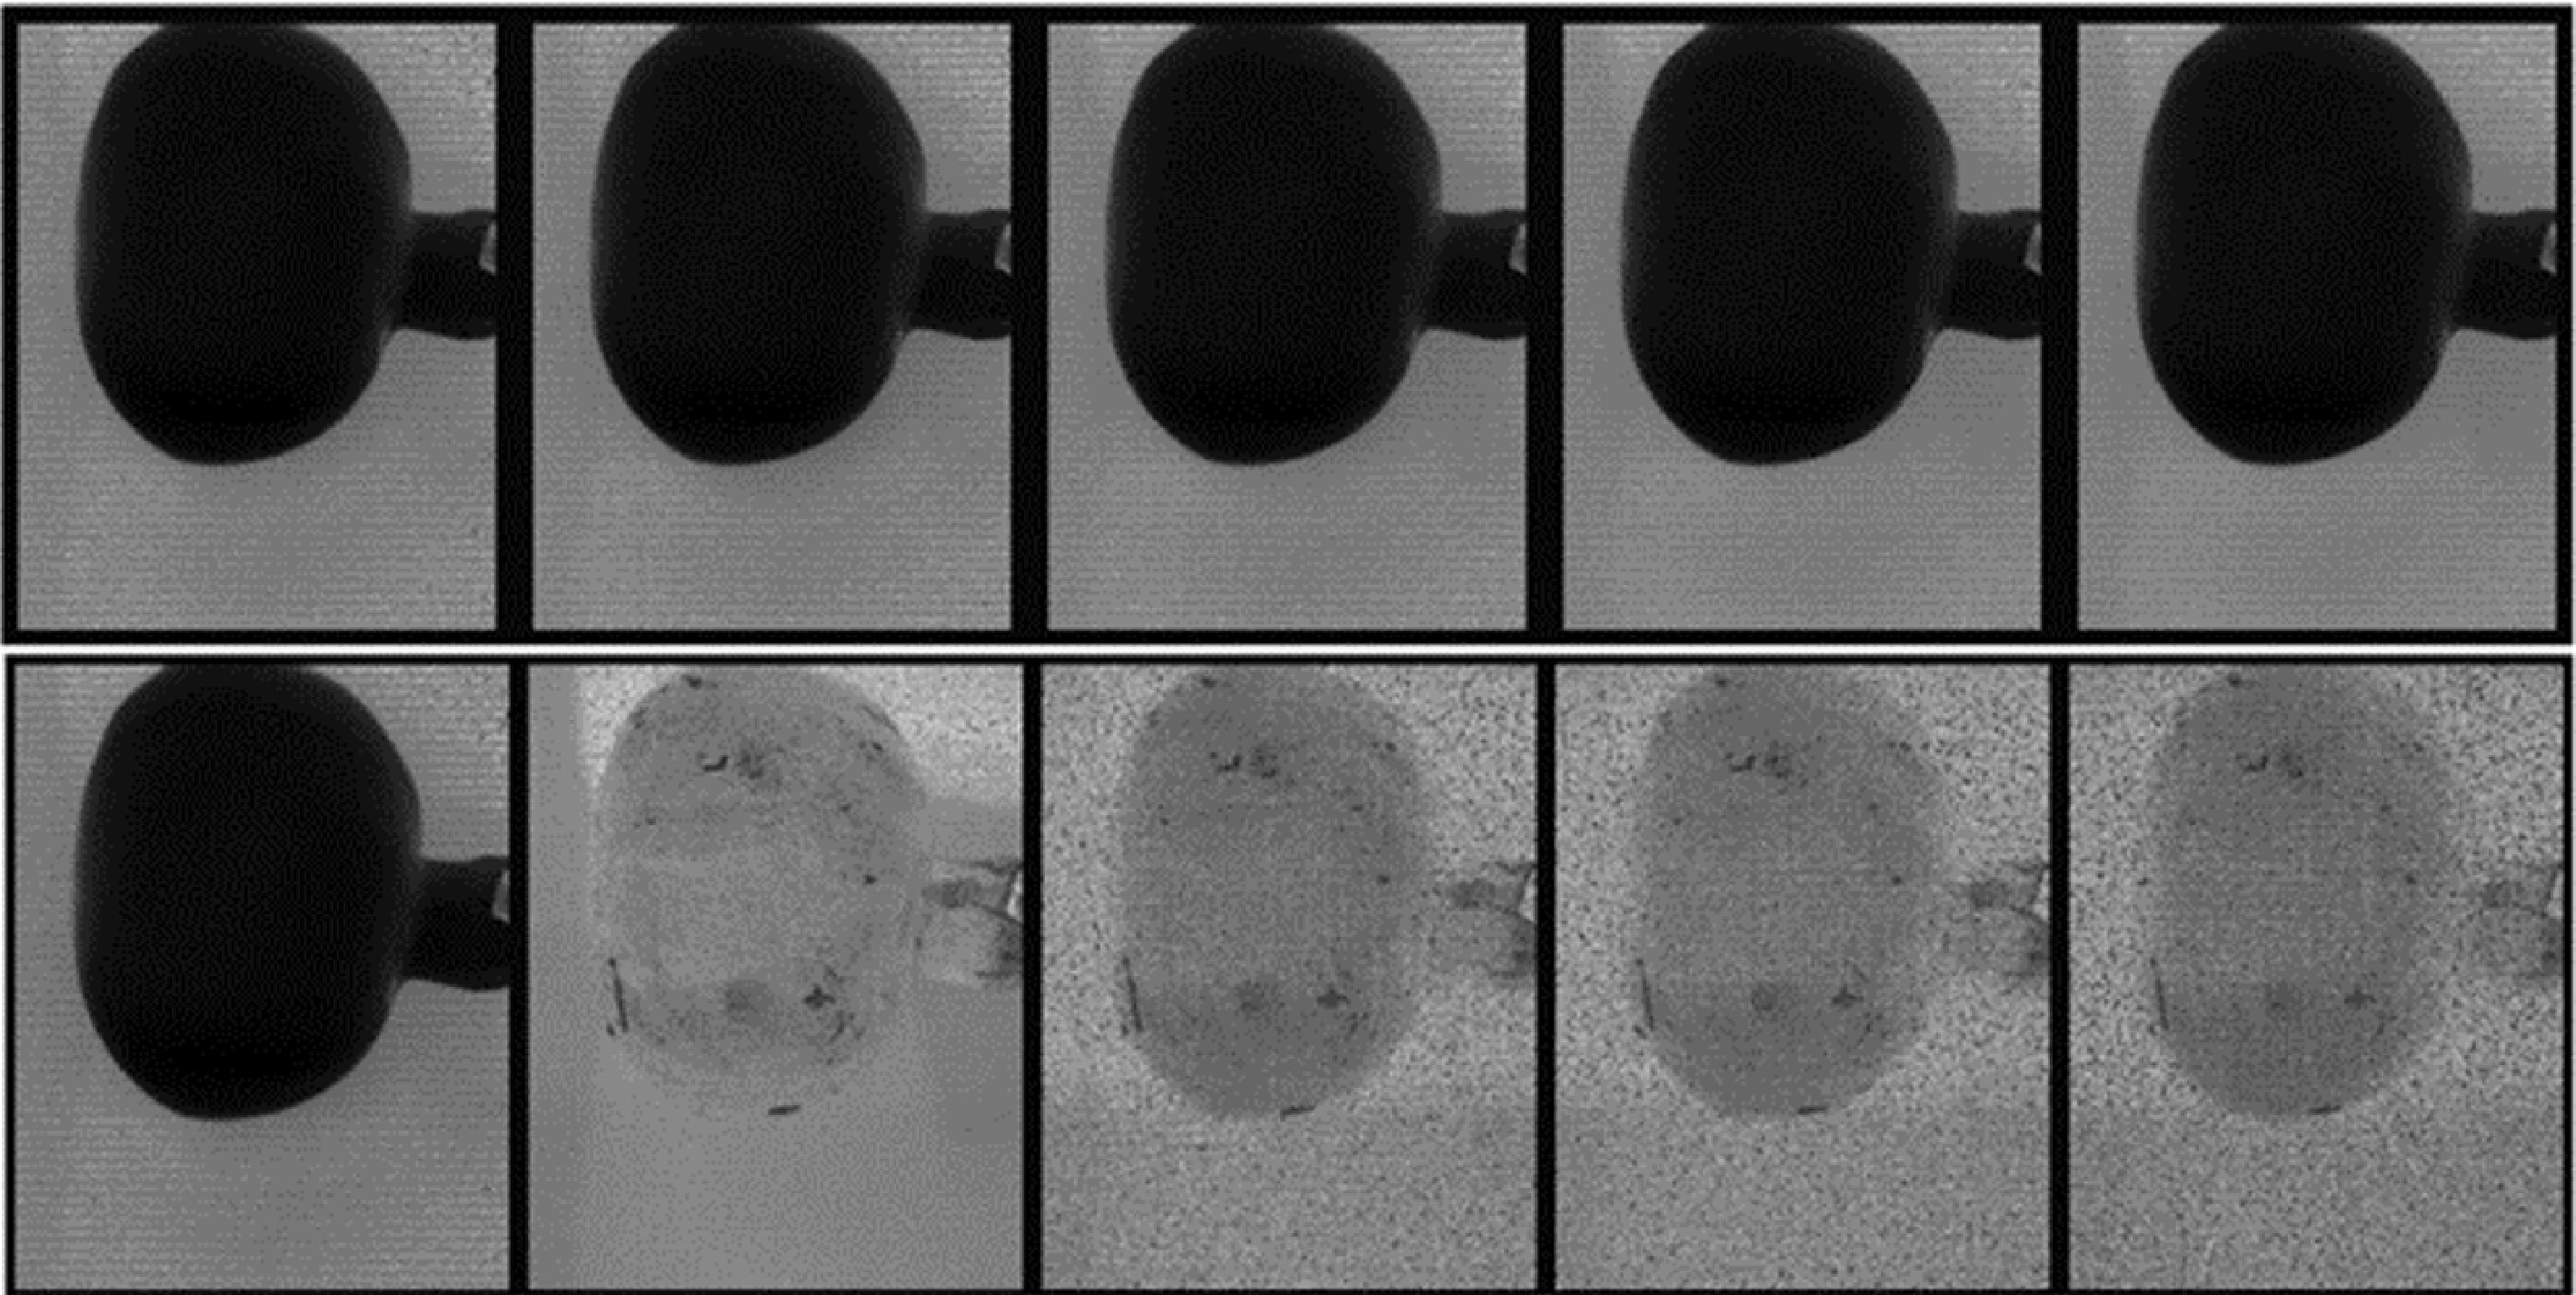
Figure 8.
Display of the first five spectral bands in the input data cube (top row) and the five most informative bands (bottom row) of a typical pomegranate fruit without bruising.

Figure 9.
Display of the first five spectral bands in the input data cube (top row) and the five most informative bands (bottom row) of a typical unbruised pomegranate fruit.
Classification prediction model using artificial neural networks
-
The artificial neural network (ANN) pattern recognition technique divides the data into three distinct sets at random: training (70%), testing (15%), and validation (15%). This divide occurs during the model's creation phase. A hidden layer of four neurons was discovered to be the best configuration for the artificial neural network (ANN). An assessment of the network's classification performance, which was tested using a confusion matrix, led to this finding. The performance of the network training algorithm (LMBA, BRA and SCGBA) were not significantly different. A trained and ready model takes reflectance values at the selected bands of a sample as input and predicts its classification as bruised and unbruised.
Table 2 summarizes the classification accuracies for the two cameras at the three storage days based on full or selected wavelengths. The classification prediction model, based on the full wavelength of the VNIR camera, achieved classification accuracies ranging from 83.3%–90% on immediate bruise identification (Fig. 10). The model recognized sound fruit with 90% accuracy while it recognizes bruised fruit with 86.7% accuracy. The recognition accuracy increased with storage period. In day 7 and day 14, the full wavelength-based model predicts the class of sound pomegranates with 100% accuracy and only wrongly classified one bruised pomegranate. The model based on selected wavelength has achieved an accuracy of 96.7% for sound samples and 90% for bruised samples on day 7 and 100% for day 14 after bruise damage. A similar trend was observed in the study on apple[64]. The authors reported recognition to increase from 1 min after bruising (87.04%) to an accuracy of 98.15% after day 4 of bruising. Fu & Wang[49] reported an increase in recognition accuracy from 86.67% immediately after bruising to 96.67% 3 d after bruising. Zhu & Li[64] employed PLS-DA algorithm for rapid detection of apple bruises and reported bruise development resulting in an increased recognition accuracy from 86.11% immediately to 97.22% after 4 d of bruising.
Table 2. Classification results of test data set of ANN model for distinguishing sound and bruised tissues based on VNIR and SWIR reflected for the extracted (ROI) and the WFS of pomegranate fruit.
SWIR VNIR Sample number Correct CA (%) OA (%) Sample number Correct CA (%) OA (%) Day 0 AW Sound 30 26 86.7 85.0 30 27 90.0 88.3 Bruised 30 25 83.3 30 26 86.7 SW Sound 30 25 83.3 81.7 30 27 90.0 86.7 Bruised 30 24 80.0 30 25 83.3 Day 7 AW Sound 30 30 100.0 96.7 30 30 100.0 98.3 Bruised 30 28 93.3 30 29 96.7 SW Sound 30 28 93.3 93.3 30 29 96.7 93.3 Bruised 30 28 93.3 30 27 90.0 Day 14 AW Sound 30 30 100.0 98.3 30 30 100.0 100.0 Bruised 30 29 96.7 30 30 100.0 SW Sound 30 30 100.0 96.7 30 30 100.0 100.0 Bruised 30 28 93.3 30 30 100.0 AW is a classification prediction model based on all wavelengths; SW is model based on selected wavelengths; CA is component accuracy; OA overall accuracy. 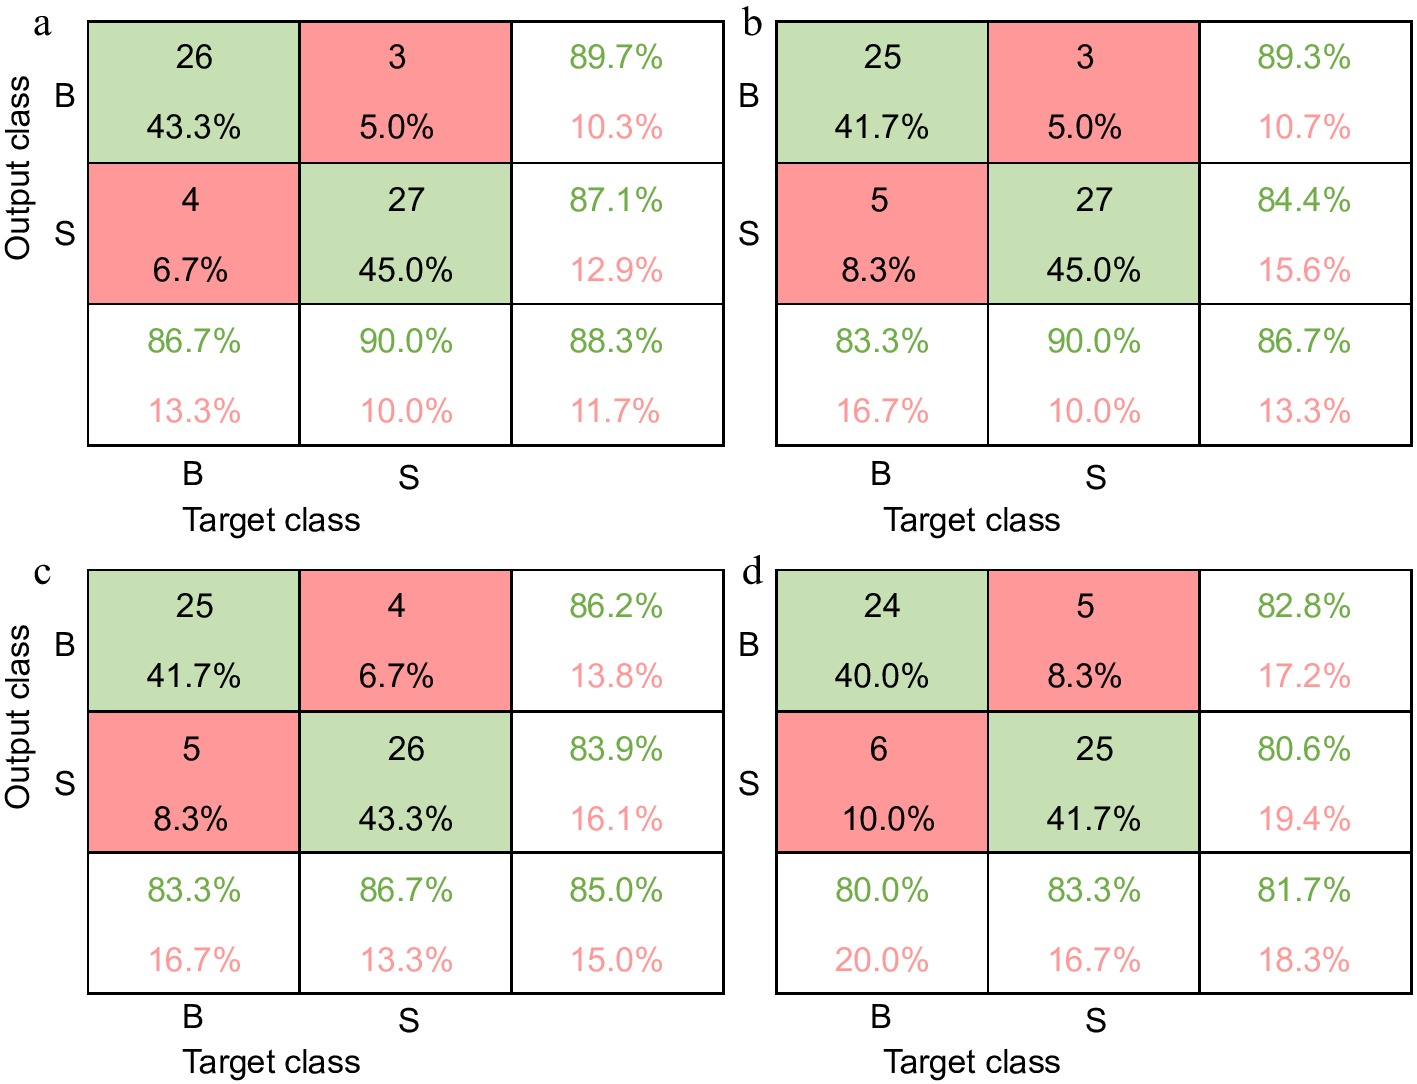
Figure 10.
Confusion matrix for the independent test set on the VNIR (upper raw) and SWIR (bottom raw) spectral data immediately after bruise damage. Model based on full wavelengths (left, (a) and (c)) and model based on selected wavelengths (right, (b) and (d)).
A similar trend was reported for 'Golden Delicious'[44]. The authors applied the whole signal and recognition rate was 64.23% and when an interval of 10 was considered, accuracy increased to 92.2%. Higher classification accuracy was obtained for the early detection of bruises on 'McIntosh' apples for older bruises as compared to recent ones[61].
Baranowski et al.[62, 63] also reported better model accuracies for the VNIR input data (90%) than the SWIR input (85%) in their study on apple. Model consistently showed slightly better recognition accuracy for sound fruit classification over bruised samples. This trend is observed in a similar study on strawberry[64]. The authors obtained the highest classification accuracy of 99.9% for healthy samples and 86.1% for bruised samples.
-
The present study resulted in the development of a classification model that is both efficient in terms of computational speed and compact in terms of data storage requirements. By employing this methodology, the development of a cutting-edge machine for sorting, grading, and packing solutions can be facilitated.
This study confirmed early bruise detection for pomegranate fruit with an accuracy of 88.3% and 86.7% based on full and selected wavelengths, respectively.
Fruit geometry and other factors including maturity, cultivar, measurement temperature and relative humidity may have an influence on model performances. We recommend that these variables be rigorously assessed in further research to uncover more intriguing information, accuracy, and methodologies, as well as to conduct a validation study to gauge the technique's resilience. The simplified and compact classification model outlined in this study enables the performance of a more practical investigation.
-
The authors confirm contribution to the paper as follows: study conception and design: Opara UL, Ambaw A; project administration and supervision: Perold WJ, Opara UL; data collection: Okere EE, Ambaw A; analysis and interpretation of results: Okere EE, Ambaw A; draft manuscript preparation: Okere EE. all authors reviewed the results and approved the final version of the manuscript.
-
The datasets generated during and/or analyzed during the current study are available from the corresponding author on reasonable request.
This work is based on the research supported wholly/in part by the National Research Foundation of South Africa (Grant Number: 64813). The opinions, findings and conclusions or recommendations expressed are those of the author(s) alone, and the National Research Foundation (NRF), South Africa, accepts no liability whatsoever in this regard. The authors would like to specially thank Dr. J. Collings, for her technical assistance during the hyperspectral image data acquisition phase of this project. Research reported in this publication was supported in part by the Foundation for Food and Agriculture Research under award number 434—grant ID: DFs-18- 0000000008.
-
The authors declare that they have no conflict of interest.
- Copyright: © 2023 by the author(s). Published by Maximum Academic Press, Fayetteville, GA. This article is an open access article distributed under Creative Commons Attribution License (CC BY 4.0), visit https://creativecommons.org/licenses/by/4.0/.
-
About this article
Cite this article
Okere EE, Ambaw A, Perold WJ, Opara UL. 2023. Early bruise detection on pomegranate (Punica granatum L.), using hyperspectral imaging coupled with artificial neutral network algorithm. Technology in Horticulture 3:27 doi: 10.48130/TIH-2023-0027 

Early bruise detection on pomegranate (Punica granatum L.), using hyperspectral imaging coupled with artificial neutral network algorithm
- Received: 21 April 2023
- Accepted: 03 November 2023
- Published online: 15 December 2023
Abstract: Fruit quality might suffer from bruising before and after harvest. Global focus is being paid to fruit bruise detection, especially early damage detection. In this study, a method was developed to identify bruised pomegranate fruit (cv. 'Wonderful') immediately after bruising. After splitting 60 pomegranates into bruised and unbruised parts, hyperspectral images were taken immediately, 7 and 14 d afterwards. Two 30-fruit groups were sampled. Group A had bruised pomegranates (dropped from a height of 60 cm onto a ceramic surface), whereas Group B had unbruised counterparts. The study analyzed a broad spectrum of wavelengths to collect vital information regarding the effects of injury. This was accomplished with Vis-NIR (400–1,000 nm) and SWIR (1,000–2,500 nm) line scan mode equipment. The line scan mode was selected due to its compatibility with conveyor belt systems typically utilized in fruit packaging lines. The classification prediction model employed the 2-Layer Feedforward artificial neural network due to its advantageous characteristics of simplicity and robustness. This study confirmed early bruise detection for pomegranate fruit with an accuracy of 88.3% and 86.7% based on full and selected wavelengths, respectively. Storage duration improves bruise recognition. Bruises are hard to spot early and become more visible with time. Hence, this technique's capacity to do so is a major benefit in the post-harvest handling. This research reduced the VNIR and SWIR input dimensions from 186 and 288 to five, resulting in a quicker and more compact classification algorithm. This will make it easier to create a cutting-edge sorting and grading system for bruise detection.