


-
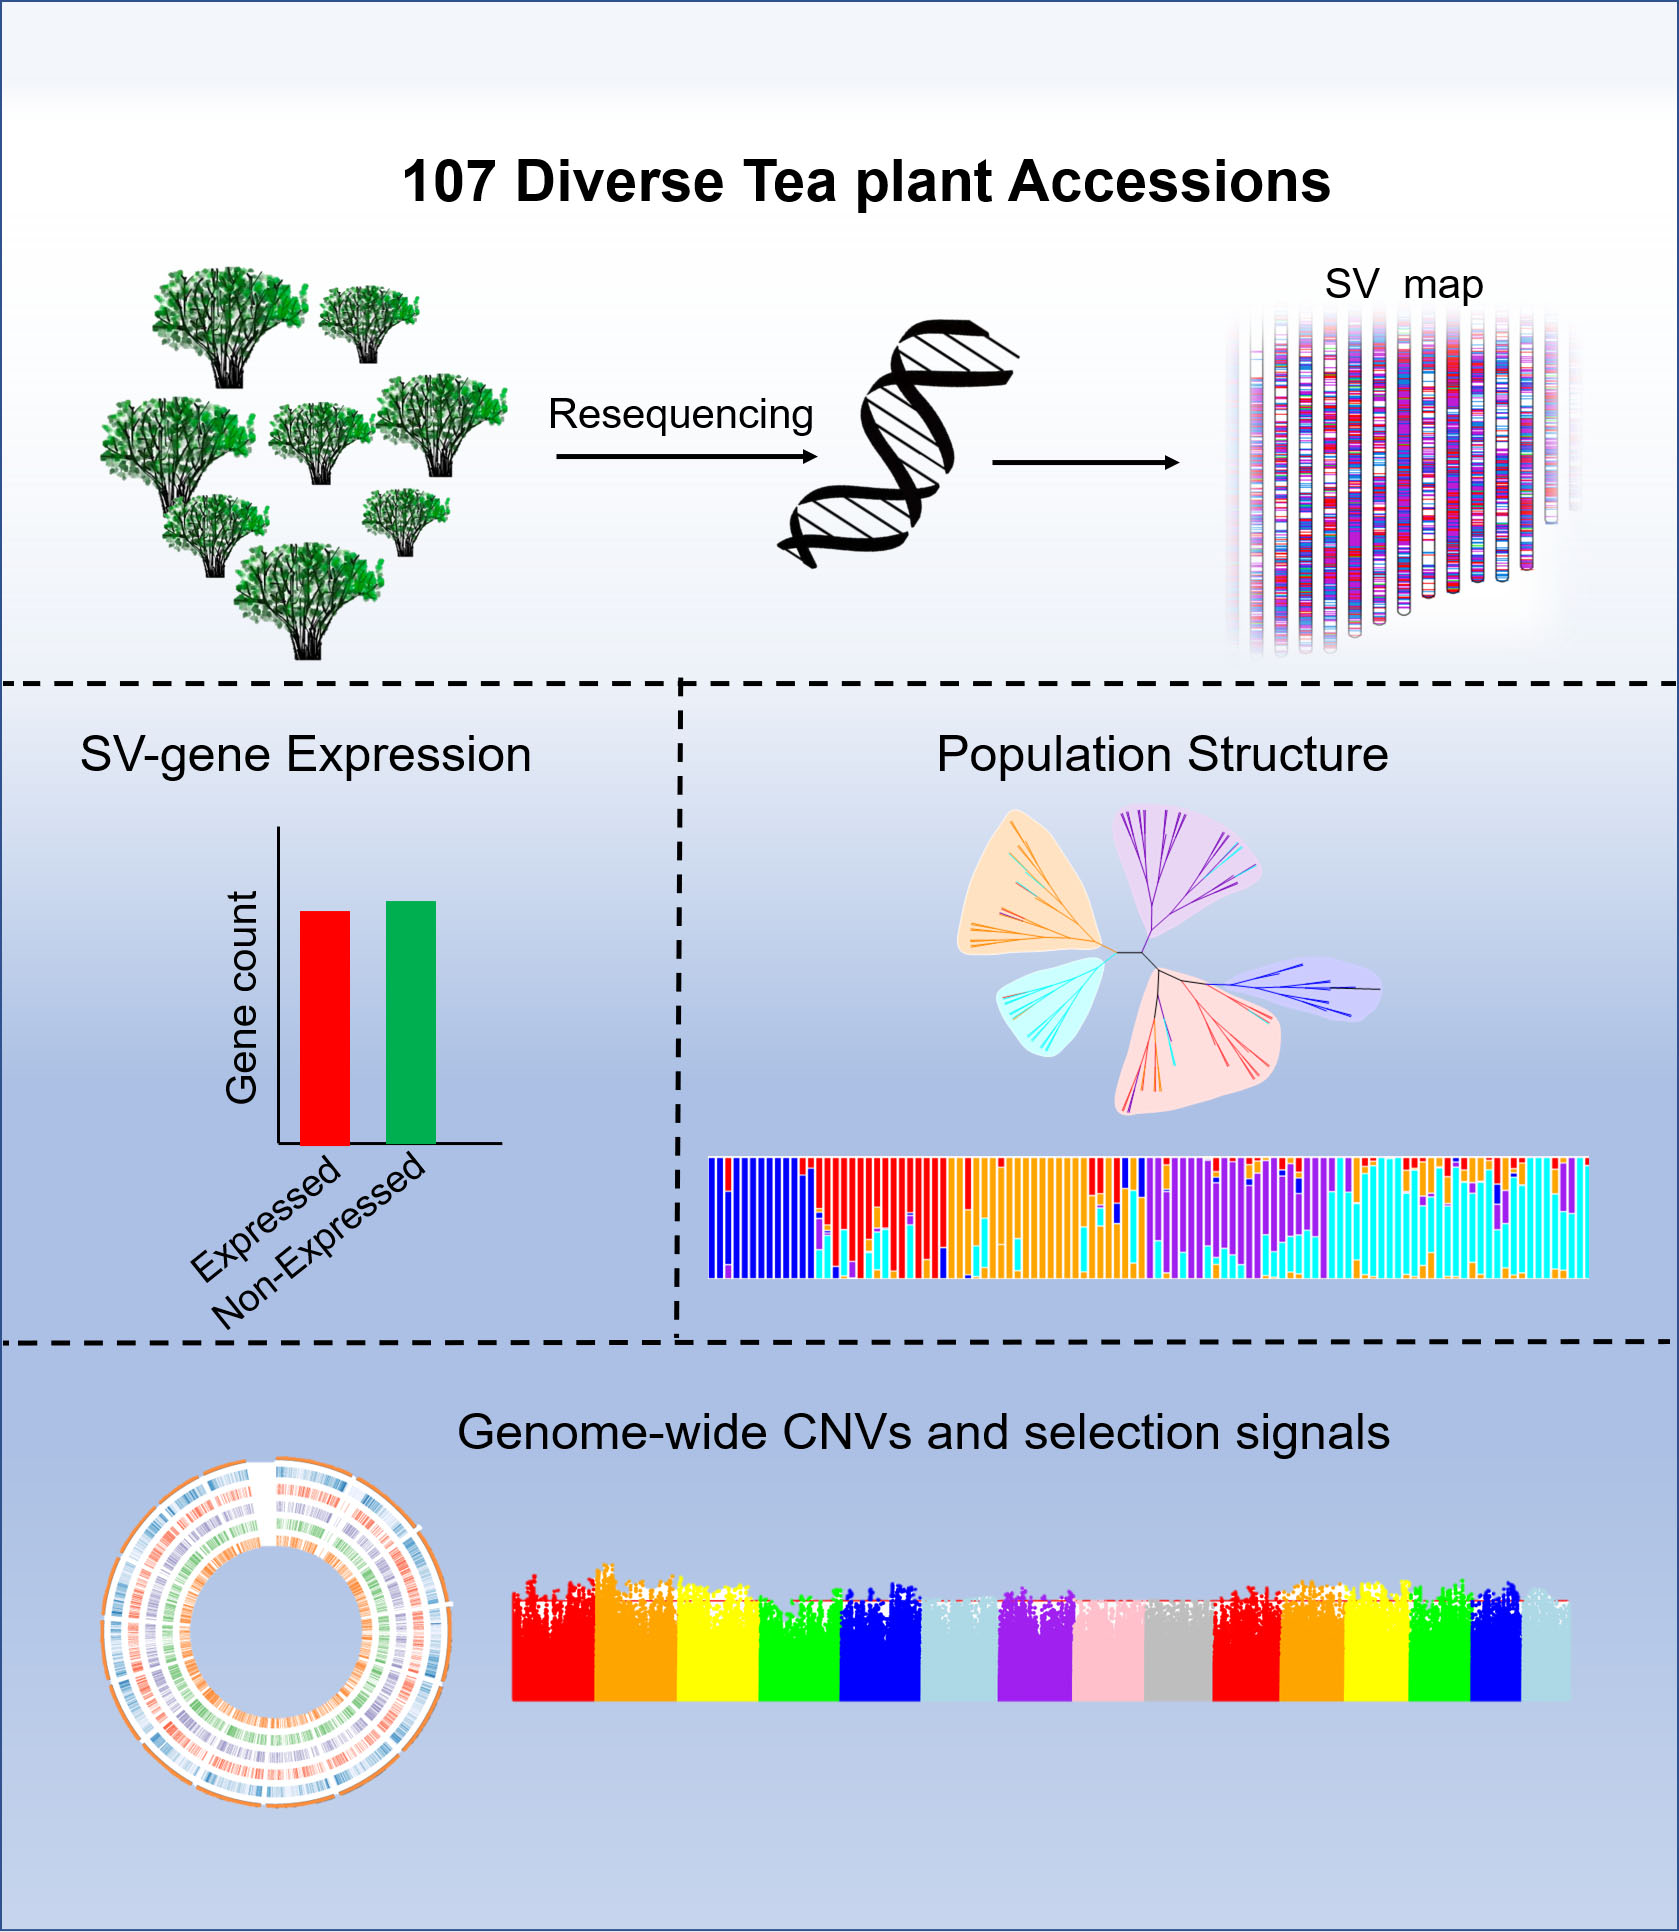
Tea [Camellia sinensis (L.) O. Kuntze] is one of the most popular non-alcoholic caffeine-containing beverages with outstanding medicinal and cultural properties worldwide[1,2]. The earliest credible archaeological evidence of tea being consumed as a beverage dates back to 59 BCE during the Western Han Dynasty[3]. In addition to the attractive aroma and mellow taste, tea possesses a plethora of characteristic secondary metabolites beneficial for human health and largely determine the tea flavor, such as catechins, theanine, caffeine, polysaccharides, and minerals[4−6]. Nowadays, commercial tea plants have been widely planted in China and worldwide[7]. The goal of tea breeding and improvement research has always been to breed high-quality tea germplasm resources. Chinese tea type Camellia sinensis var. sinensis (CSS) and Assam tea type Camellia sinensis var. assamica (CSA) are the two major groups of cultivated tea. Several high-quality tea plant genomes, including CSS and CSA, were recently assembled, and the related population genetic diversity landscapes have been thoroughly studied[5,6,8−12], providing a theoretical foundation for future research to understand and utilize the genome that determines the diversity of tea germplasm.
Various genetic variants can influence the phenotype of organisms, especially those related to human diseases[13]. They also play an essential role in the diversity and evolution of species. Early studies have suggested that single nucleotide polymorphisms (SNPs) are the main contributors to biological diversity[13,14]. However, extensive evidence from genetics and molecular biology has demonstrated that structural variants (SVs) are more common than SNPs[15] and can cause major phenotypic variations affecting agronomic traits[16−18]. Approximately one-third of reported crop phenotype changes are caused by structural variations[19]. A recent study of panSVs based on 100 tomato accessions showed that multiple SVs could change gene dosage and expression levels, thus modifying fruit flavor, size, and production[20]. The soybean pan-genome studies suggested that a 1.4 kb deletion in the promoter region of a Fe2+/Zn2+ regulated transporter gene (SoyZH13_14G179600) led to the decreased expression of this transporter, and the genetic diversity of this gene is responsible for the divergent ability in iron uptake among soybean accessions[21].
Advancements in genomic technologies and detection methodologies have allowed us to study the effect of chromosome-level structure variations on agronomic traits through plant population-scale genomics and genetic studies. SNP-based population genetic analysis is the most prevalent method applied in current genetic variations and domestication studies in the tea plant. For instance, population genetic relationships among different varieties and geographically distinct populations have been established through SNP-based strategies, providing some meaningful conclusions about the origin, domestication, and quality characteristics of the tea plant[9,10,12]. Compared to the SNP-based studies that can only locate a fraction of trait-associated genetic variations, SVs that play a greater impact on various biological processes and traits have been largely neglected in studies of tea plants.
Structural variants usually refer to large changes in chromosome structure, defined as more than 50 bp in length, including deletions, insertions, duplications, inversions, and translocations[22]. Copy number variants (CNVs) are specific SVs that contribute to genetic variations underlying important domestication traits. A copy number variation arising from a recent 30.2 kb duplication in the cucumber genome was found to involve four Female-determined genes, which gives rise to gynoecious cucumber plants that bear only female flowers and set fruit almost at each node[18]. Some crop populations undergo a strong bottleneck during the domestication process, like rice[23,24] and maize[25]. They have experienced bottlenecks of decreasing genetic diversity and repatterning the frequencies of genetic variants[26]. Analysis of CNVs in common crops with a bottleneck effect history may differ from inferences based on the tea plant. Furthermore, some evidence from rice[27,28] and maize[29] suggested that these bottlenecks contribute to domestication. These studies provided a theoretical and practical basis for the genome-wide characterization of CNVs among diverse tea populations. Large-scale resequencing has been undertaken in diverse elite germplasm accessions of the tea plant in this study. This resequenced dataset combined with the available draft tea genomes can represent a valuable resource for discovering causal structural variations underlying important traits associated with tea qualities and diversification. Our goal is to fill a major gap in our knowledge of tea genome diversity and trait-influencing mutations by investigating the population-scale SVs and CNVs in ancient and cultivated tea populations. We also compare the population genetic differences between SV-based and SNP-based analyses. To do so, we analyzed population genomic data of 107 high-coverage resequenced tea individuals from publicly available genomic resources, which cover most of the tea-growing areas. In this study, we mainly focus on the following questions: whether the population genetic variations based on SVs and SNPs analysis are consistent and whether SVs can provide insight into the domestication and selected genomic regions outside of SNPs. Finally, whether these CNVs identified across the whole genome could influence metabolic pathways associated with agriculturally important traits.
-
To deeply survey the landscape of population-scale SVs in the tea plants, we collected short-read resequencing data from 106 diverse Camellia accessions, including 13 ancient C. sinensis accessions, 92 C. sinensis cultivars and C. oleifera as an outgroup. The average coverage of each sample was more than 10× (Supplemental Table S1), providing sufficient data to detect genetic variations. The short read alignment method often results in a high false-positive rate in detecting SVs[30]. To limit the probability of this error, three mainstream pipelines were used for SVs detection in our analyses, including three inference software packages Manta, Lumpy and Delly[31−33]. Firstly, clean reads were mapped to TGY (Tieguanyin) monoploid genome[12], and three different SV callers were performed to gain the initial predictions, respectively. Subsequently, the population cut-offs were applied to filter overlapping SVs to obtain a high-quality set of SVs. An open-source tool, SURVIVOR[34] was used to merge predictions through all three SV callers, which accepted SVs detected by at least two callers. Finally, the remaining SVs were filtered by removing those SVs that were overlapped with the annotated transposable elements (TEs). In total, 44,240 high-quality SVs were detected for subsequent population genetic analysis.
These predicted SVs were composed of 34,124 DEL (deletions), 4,448 DUP (duplications), 2,503 INV (inversions), 544 INS (insertions) and 2,621 TRA (translocations) (Fig. 1a & c). Deletion events were the most numerous, accounting for 77%, while insertion events were the fewest, only accounting for 1.3%. SV length distribution was evaluated, which showed that most SVs ranged in size from 100 to 1,000 bp (17,164, 38.8%), followed by 1,000 to 10,000 bp (11,617, 26.3%). The length of deletions was generally shorter than duplications (Fig. 1b), and the longest duplication was more than 100 kb. We note that the length of translocations could not be identified (Fig. 1c), but only rough coordinates were given by our method, which may be caused by the limitation of the short-read sequencing strategy and the imperfection of current SV detection tools. Overall, SVs were distributed non-randomly across 15 chromosomes of the tea plant genome, with distinct regions of high and low variation (Fig. 2). All types of SVs, duplications, in particular, have a relatively concentrated density on Chr01 (chromosome 1), which can be interpreted as a large number of tandem repeats in this region[35]. Intriguingly, an obvious SV deficiency was observed in a 55 Mb region located in the anterior part of Chr07. Further observation of this region on Chr07 revealed that the gene density, TE density, and SNP density were also much lower than the rest of Chr07 (Supplemental Fig. S1). The Hi-C (High-throughput Chromosome Conformation Capture) interaction map of the Chr07 showed strong intrachromosomal signals in this region (Supplemental Fig. S2). A/B compartment characteristics of the HiC map showed that the B compartment is concentrated in the telomere region, with lower transposon density and gene density, suggesting that this is a transcriptional inhibition region[36,37].
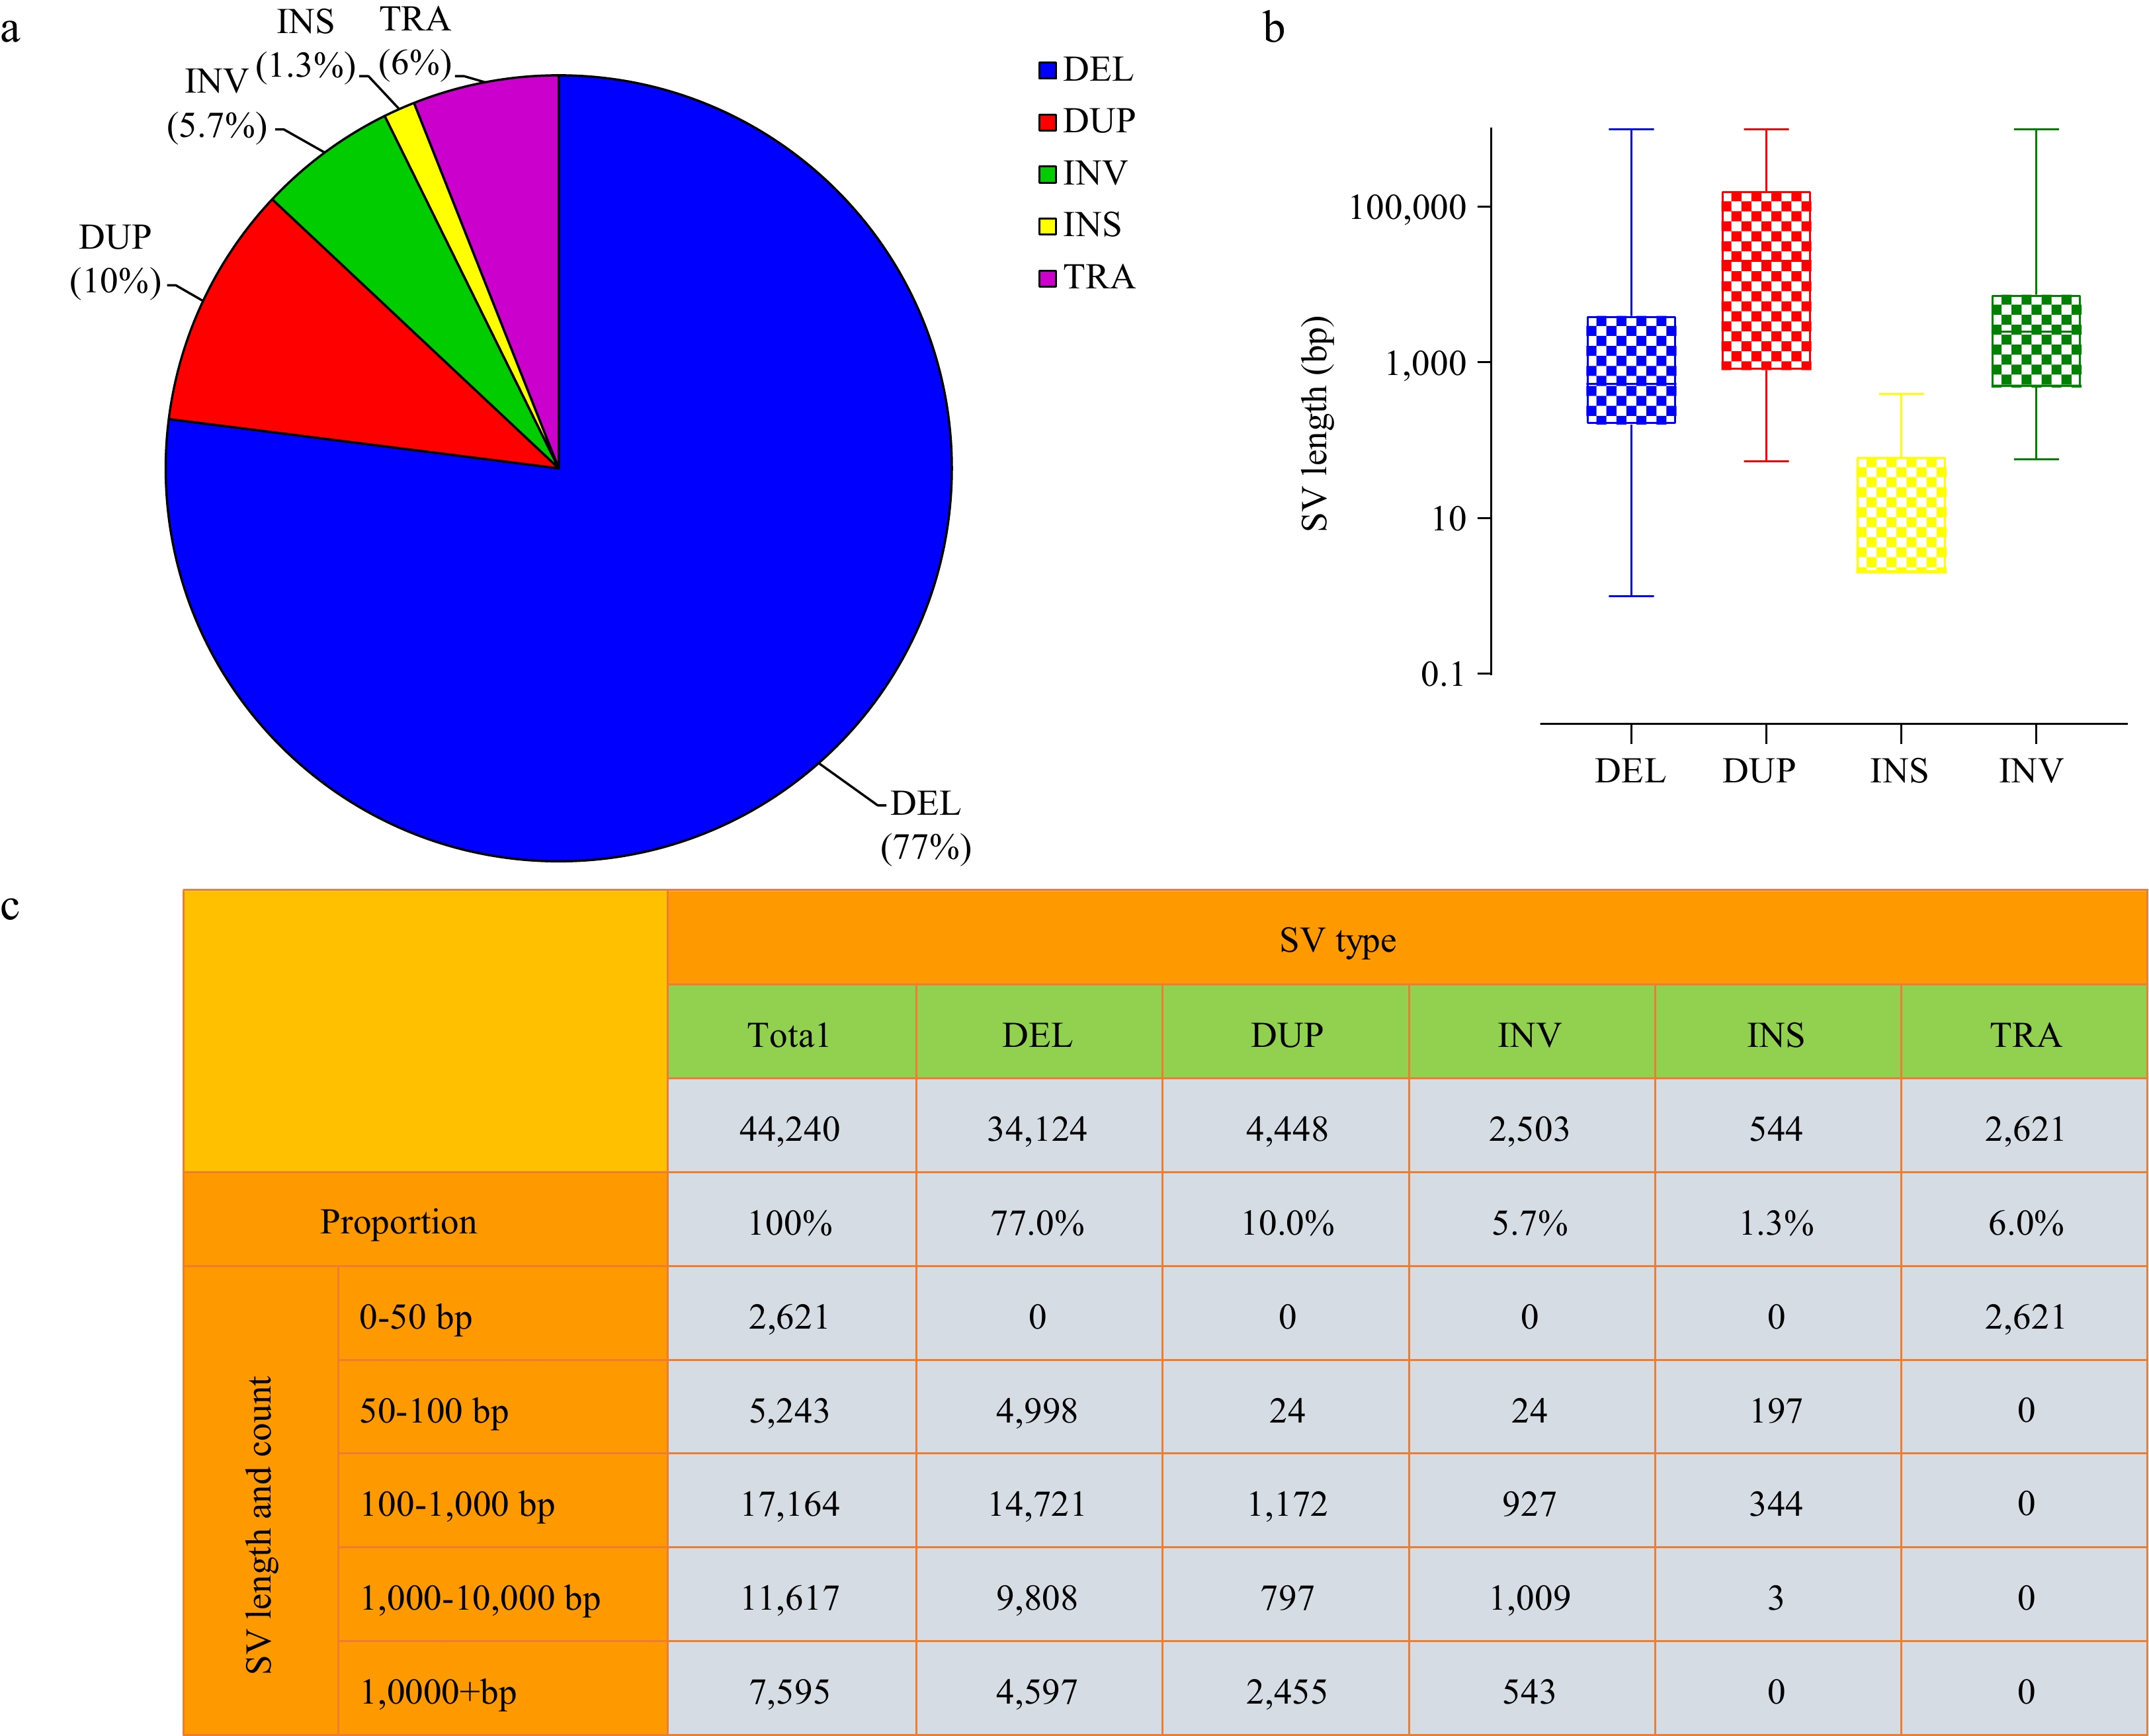
Figure 1.
Characteristics of SVs in tea plant genome. (a) Relative proportions of SVs identified. (b) Length distributions of SVs (log10 scale). (c) Statistics of complete SVs information.
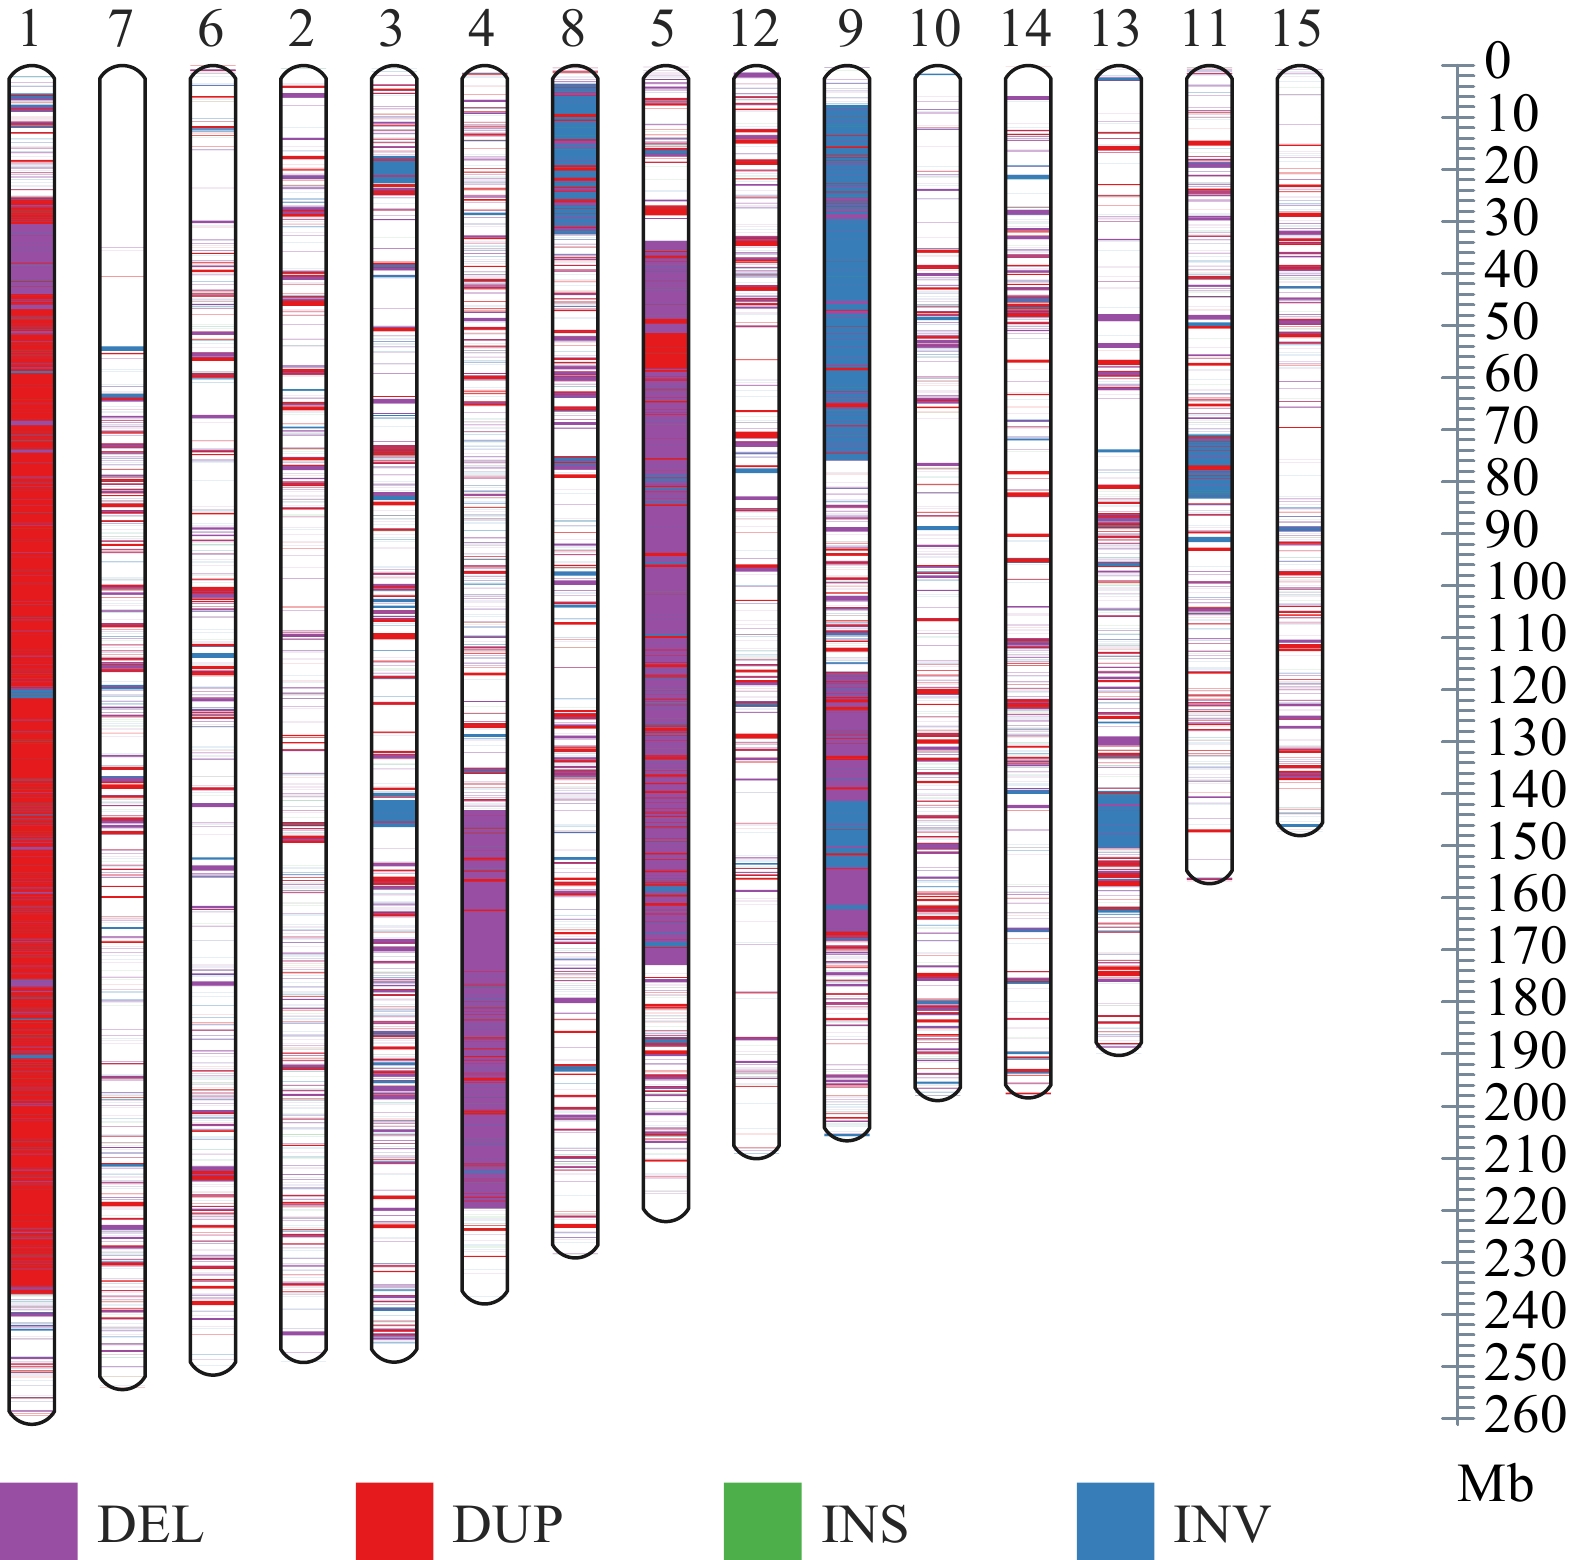
Figure 2.
Distribution of SV on different chromosomes.
The distribution of the population allele frequency of SVs was analyzed. The frequencies of less abundant alleles in the population, also referred to as minor allele frequencies, are shown in Fig. 3a providing rare variants in the population evolution.
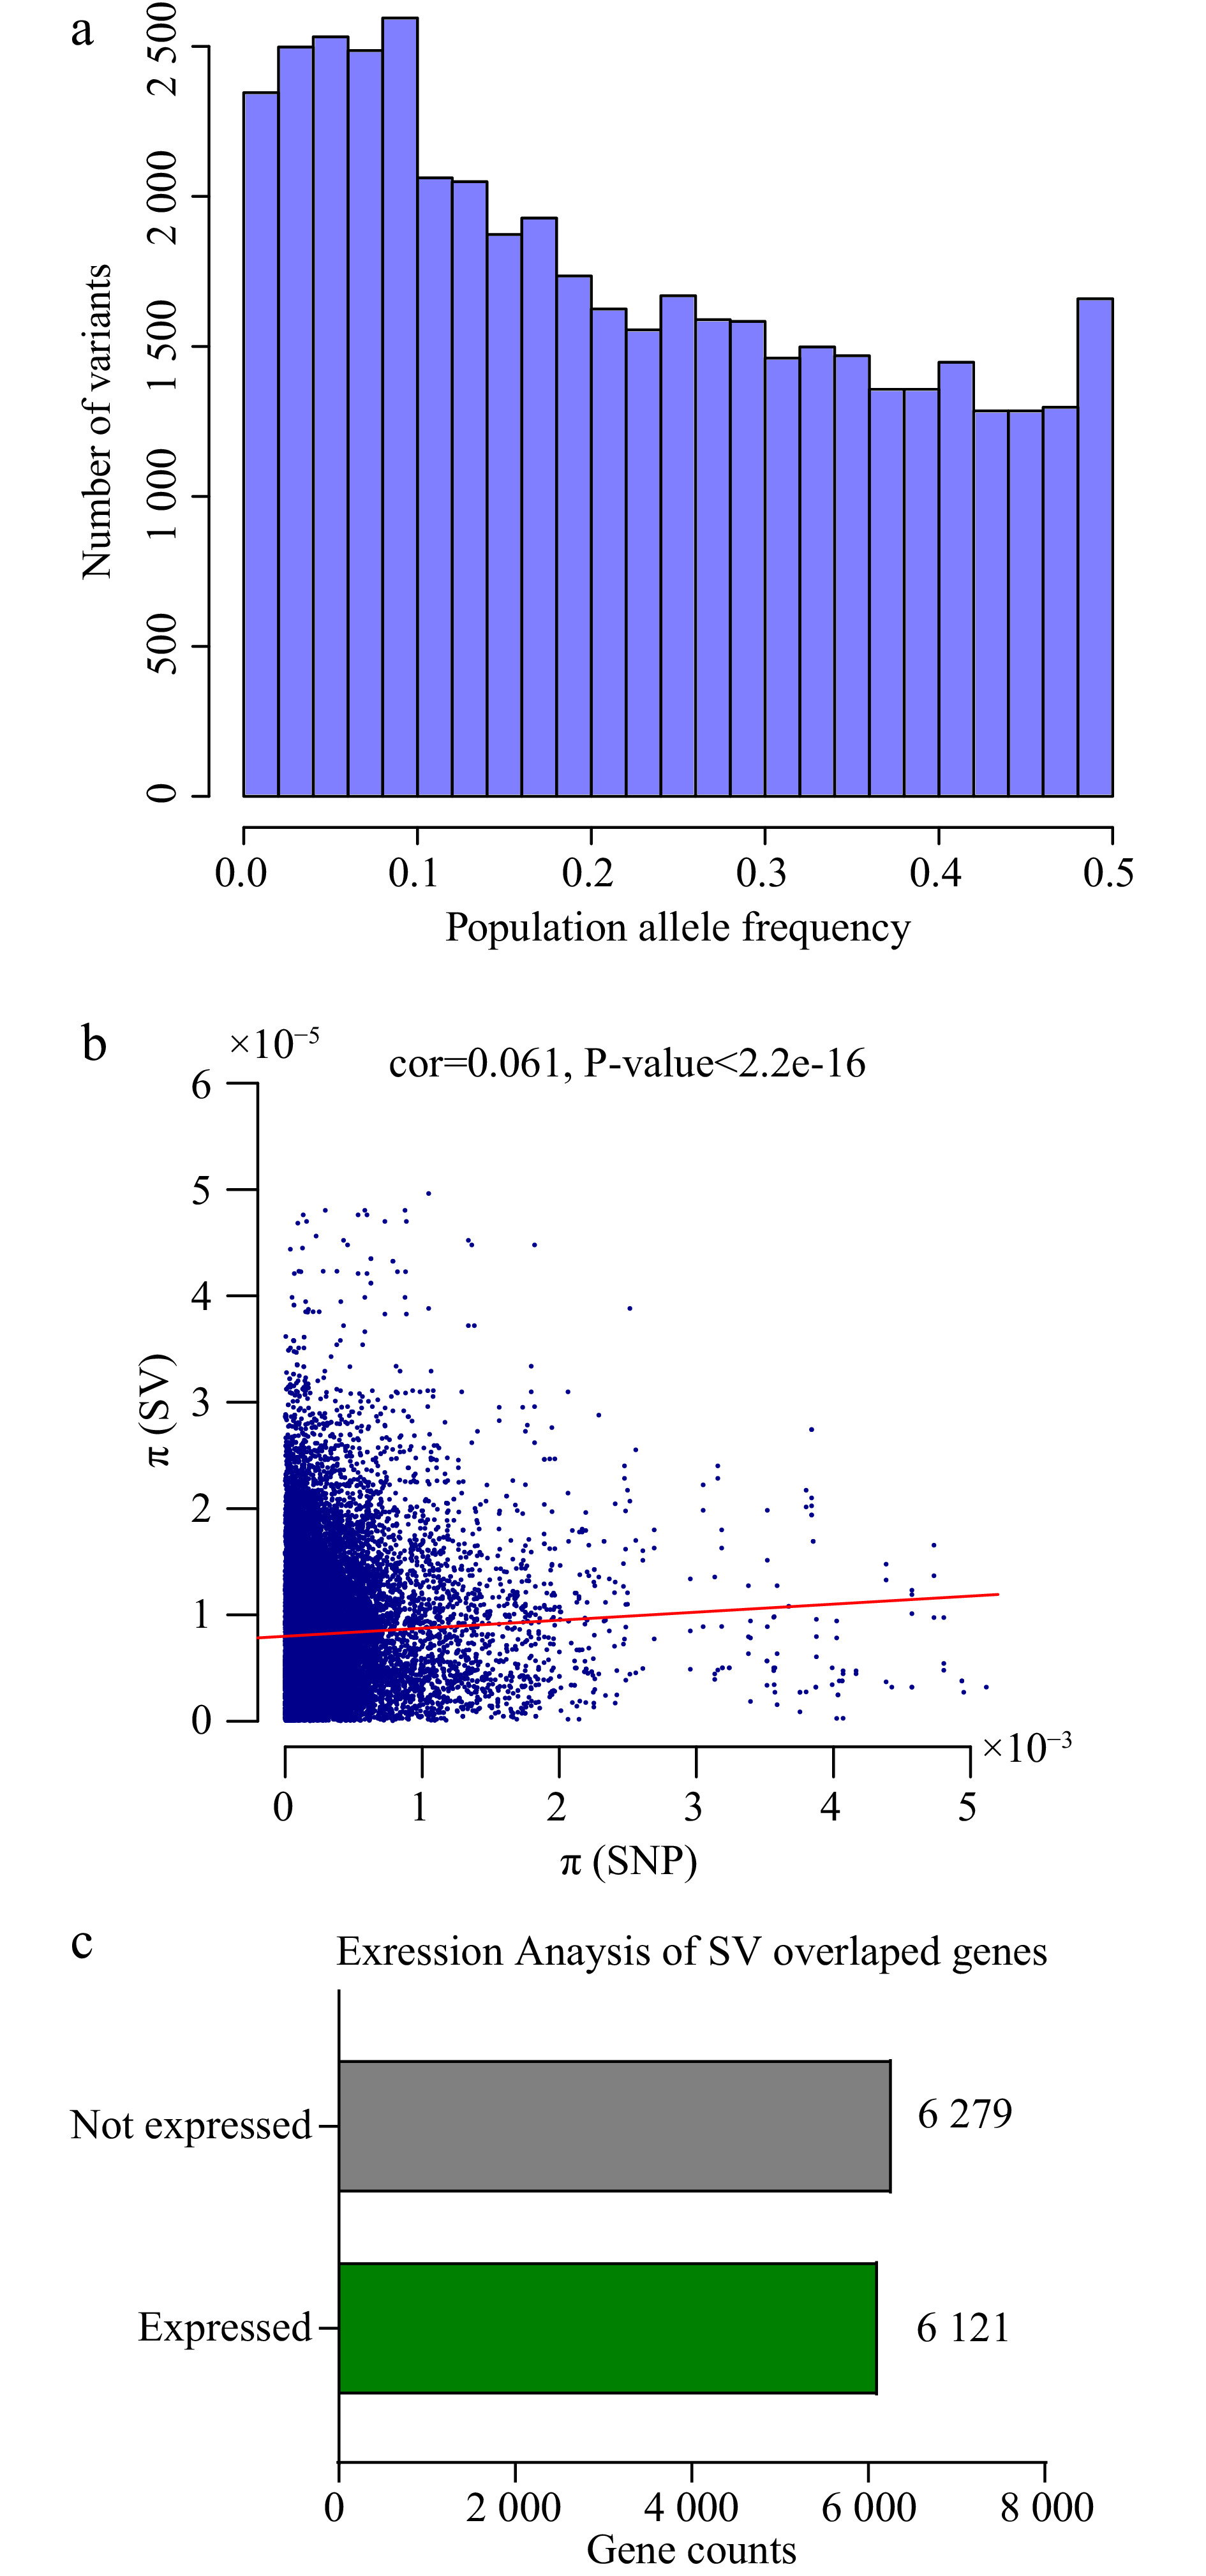
Figure 3.
Population information and expression level of SVs. (a) The barplot shows population allele frequency distribution of SVs. (b) The dotplot of SNPs and SVs genetic diversity (π) with 100kb windows of the genome, the red line accounts for the correlation (cor = 0.061, P < 2.2e-16). (c) Expression levels of SV overlapping genes (at least in one tissue) in six tissues of tea plant: root, stem, apical bud, young leaf, mature leaf and flower.
Functional impact of SV-associated genes
-
In total, nearly 28% (12,400) SV overlap protein-coding genes, of which 6,121 (49.5%) genes were expressed in all five tea plant tissues (root, stem, bud, leaf, and flower) (Fig. 3c). Since most SVs are deleterious, some SVs alter gene structure and make genes lose the ability of expression or changes the gene expression pattern.
To further investigate the effects of SVs on corresponding genes, we conducted Gene Ontology (GO) enrichment analysis. The SV-overlapped genes were mainly enriched in functional categories such as 'UDP-glucosyltransferase activity' (GO:0035251), 'quercetin 3-O-glucosyltransferase activity' (GO:0080043), 'plant-type hypersensitive response' (GO:0009626) and 'immune system process' (GO:0002376), suggesting their possible roles related to the biosynthesis of flavonoid glycosides (UGTs)[38] and response of an organism to potential internal or invasive threat in tea plant (Supplemental Figs. S7−S9 and Supplemental Table S3). For instance, A 400-bp indel was detected at the start of the UDP-glucosyltransferases (CsUGT) coding sequences in comparison between 'TGY' and 'JGY'. The indel modified open reading frame of the UGT gene, resulting in a completely different translation from scratch (Supplemental Fig. S11). These results suggest that these SVs may play a potential role in tea trait variation related to stress resistance and aromatic quality.
Population genetics analyses of SVs
-
To investigate the population genetic properties in tea plants, we first explored population genetic variations based on SNPs (< 50 bp). A total of 58,499,542 SNPs and 3,227,795 small variants (indels < 10 bp) were identified using GATK[39]. To construct a high-quality phylogenetic tree, a subset of 785,927 SNPs located at single-copy protein-coding regions was used for analyzing the phylogenetic relationship. Distinctly, the tea plant accessions could be separated into five clades (groups 1 to 5), in conformity with the geographic distribution of tea plant populations (Supplemental Fig. S3). All ancient individuals were clustered into a single clade (group 1), and groups 2 to 5 were renamed as 'Mid' (middle of China), 'SFJ' (South of Fujian Province), 'NFJ' (North of Fujian Province) and 'ZJ' (Zhejiang Province) respectively according to their geographic regions where most samples were collected. Moreover, we applied ADMIXTURE[40] to test the population structure based on SNPs data. The K ranges from 2 to 10 (Supplemental Fig. S5). As expected, when k = 5, we also obtained the same groupings as the phylogeny tree.
We also constructed a phylogenetic tree based on the full set of SVs, which had almost identical grouping clusters to the SNP-based tree (Fig. 4a). Likewise, using this SV set, population structure analysis also showed the same groups (Fig. 4c and Supplemental Fig. S4). Then we used SNPs and SVs to infer the whole-genome nucleotide diversity, respectively. The nucleotide diversity was slightly but significantly correlated across the whole genome (Correction rates: 0.061, P-value < 2.2e-16) (Fig. 3b), providing assurance of their reliability. This consistency of nucleotide diversity based on SNPs and SVs supports the suitability of SVs for population genetic analyses.
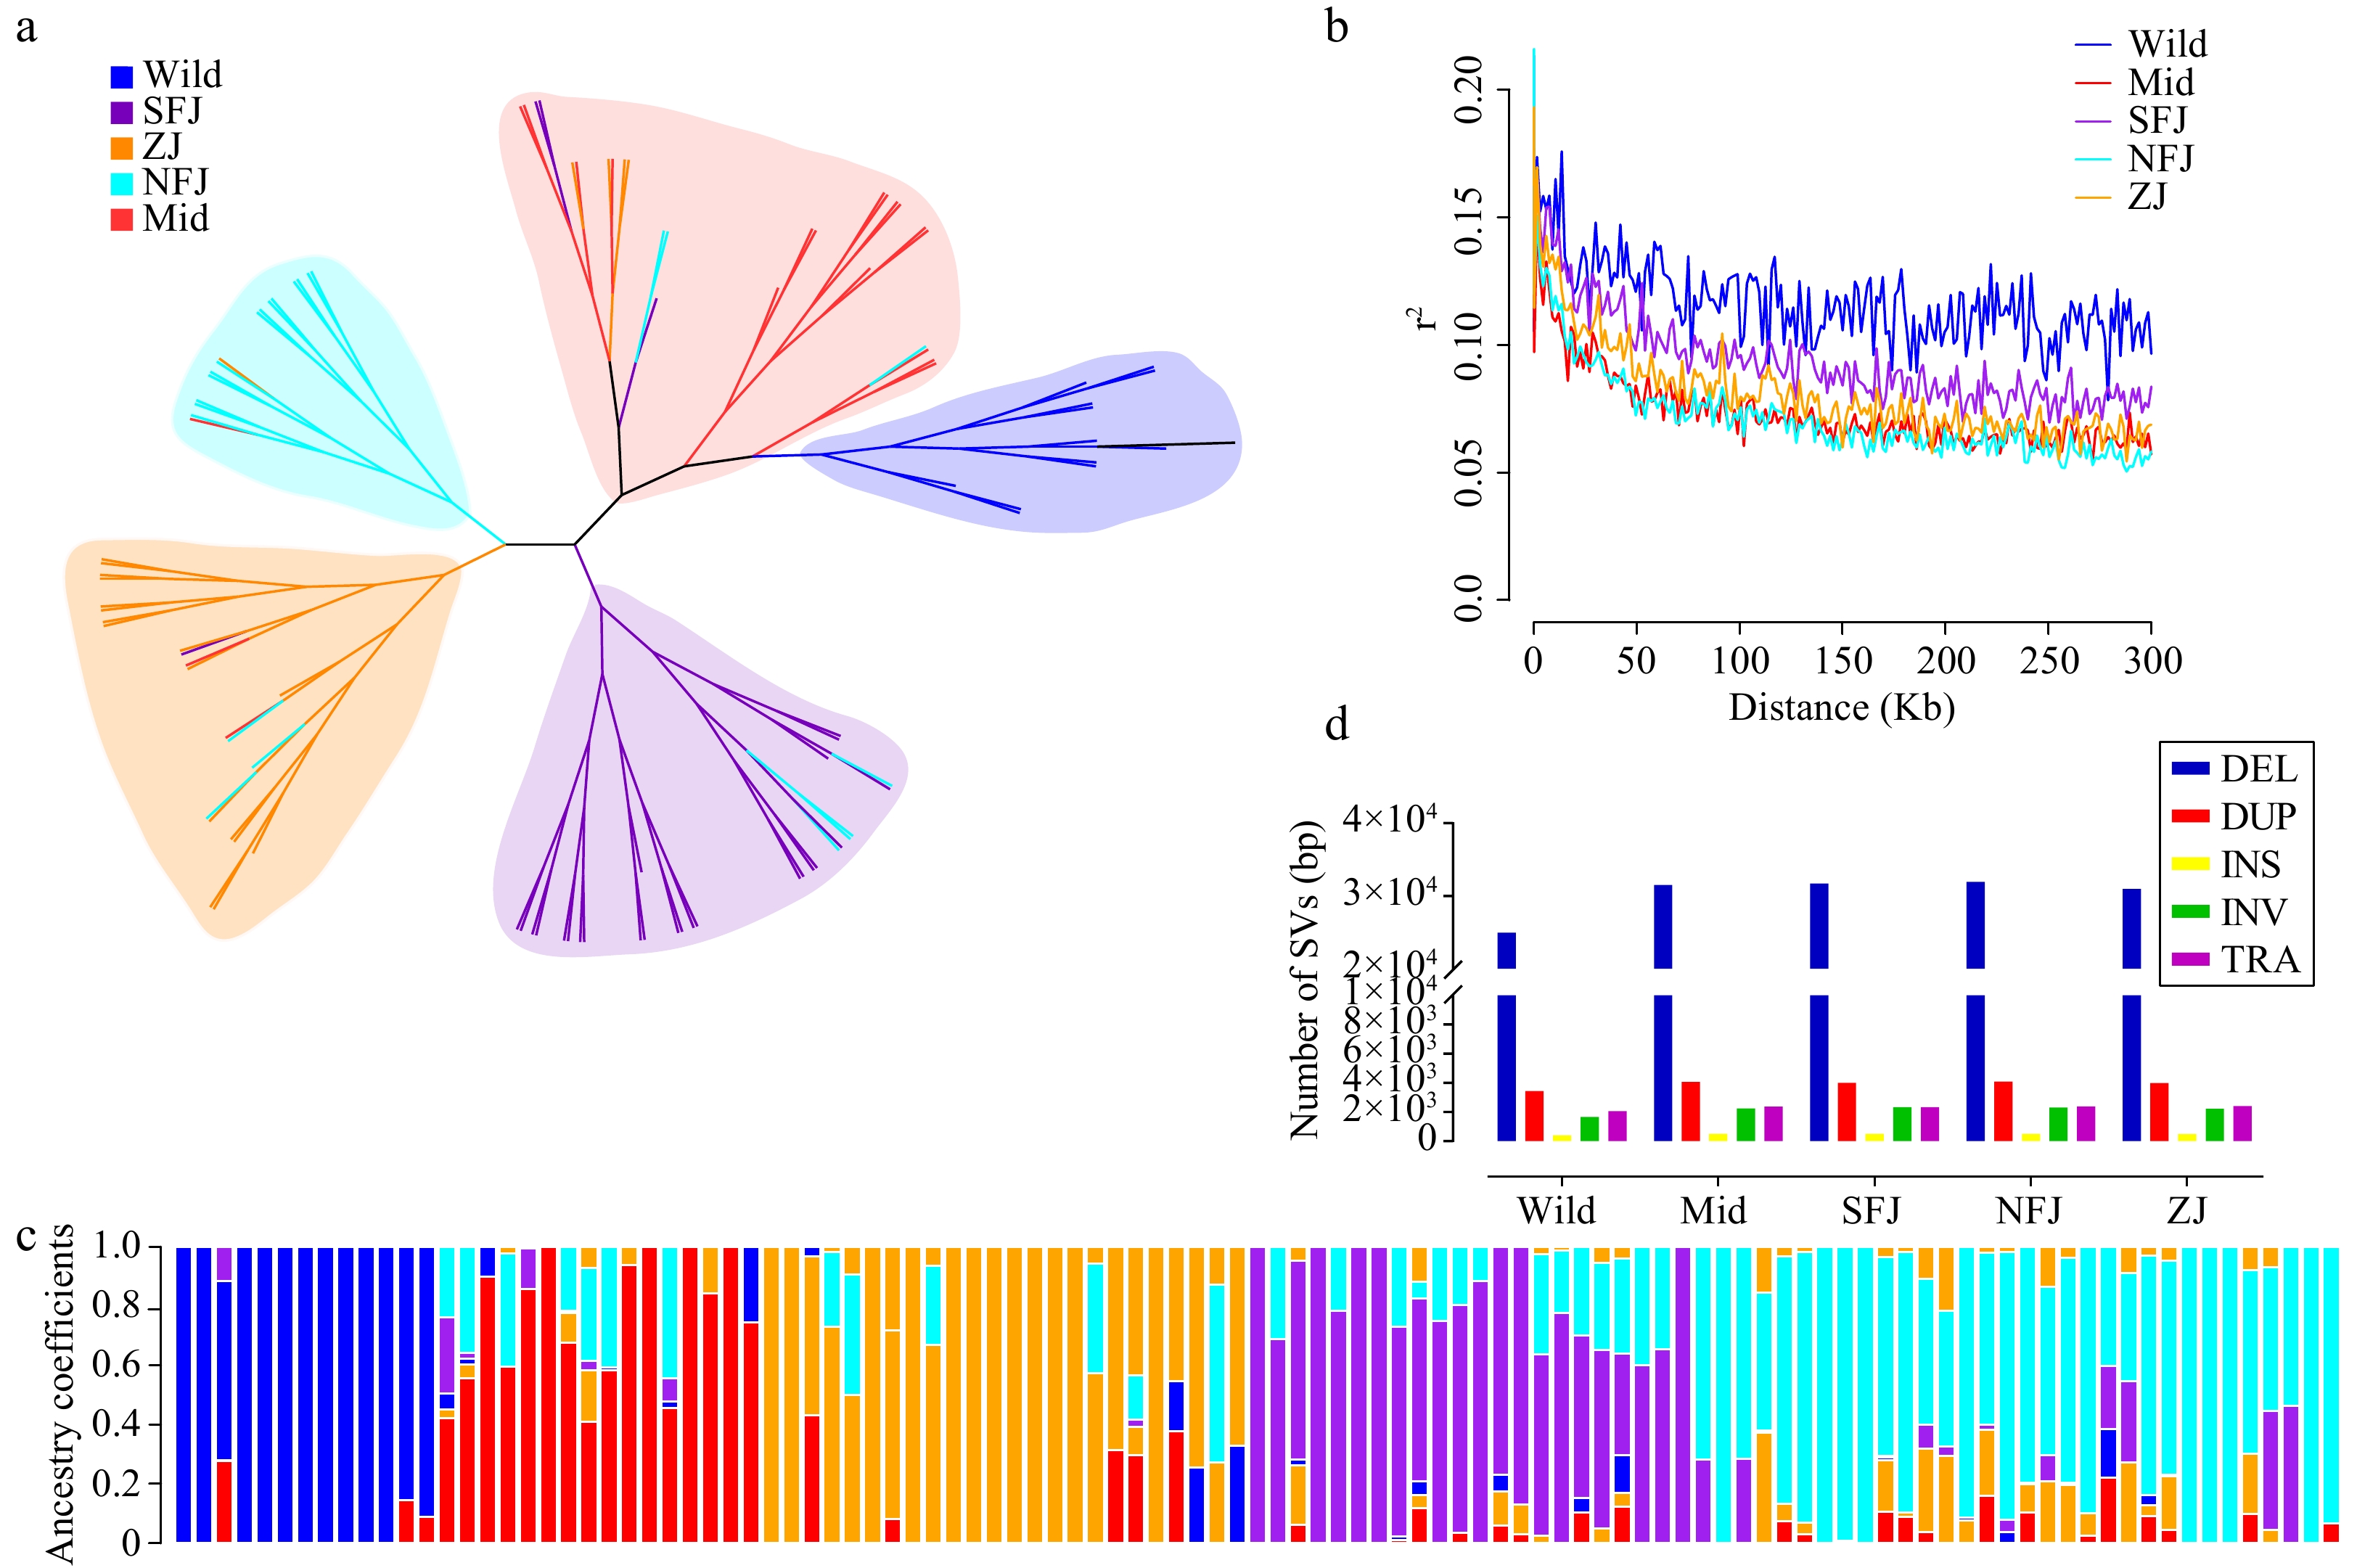
Figure 4.
Population structure analysis based on SVs. (a) The maximum likelihood phylogentic tree using 107 Camellia accessions (divided into five groups, different legend colors represent different sub populations, blue→ancient, red→Mid, orange→ZJ, cyan→NFJ, purple→SFJ). (b) Population LD decay anaysis. (c) Population structure inference based on SVs (K = 5). (d) Statistics of SVs in different sub populations.
SNP-based Linkage disequilibrium (LD) analysis is essential in plant genetic research. LD analysis showed that cultivated populations have relatively short LD distances and rapid LD decays in tea plant populations. The average distance over which LD decayed to ~50% of its maximum value in the cultivated population was very short. The LD extent in the ancient population was ~99.7 kb (Supplemental Table S2). Still, in the cultivated population, LD decreased to 2.3 kb (Mid: 17.3kb, SFJ: 27.5kb, NFJ: 11.5kb and ZJ: 25.1kb, respectively) (Supplemental Fig. S6). Adapted to it, SV-based Linkage disequilibrium (LD) showed a similar to these trend curves (Fig. 4b). Our findings of short LD distances and rapid LD decay in the cultivated population (Mid, SFJ, NFJ, ZJ) all support relatively weak selection signals during tea plant artificial domestication, presumably maintained by self-incompatibility caused by high outcrossing rates in tea plants, as well as the short-term domestication history and long generation cycle. Furthermore, the primary way to propagate tea plant cultivars is by cloning. This breeding method would contribute to the weak selection during domestication.
Domestication signatures based on SVs and related metabolic pathways
-
Although tea plants only experience a very short-term period of domestication history[41], frequent artificial interspecific hybridization has significantly accelerated the accumulation of SVs. Beneficial SVs have undergone the bottleneck and are inherited in plant organisms. Fixation index (Fst) was used to detect the selection signals across the whole genome, indicating population genetic differentiation between the ancient population and the cultivated population in our analyses. Based on the empirical distribution of Fst, candidate regions under selection were defined as outliers falling with the top 5% of the Fst ranked value. In total, 2,063, 2,714, 2,610, and 2,177 selected genes were under selection among Mid, SFJ, NFJ, and ZJ subpopulations, respectively (Supplemental Fig. S10). Six hundred and seventy genes were shared among the four cultivated populations (Supplemental Table S5), implying that natural selection might precede population differentiation, which also suggested involving the population-specific history of local domestication in tea plant growing regions. After we merged all of the cultivated population selective genes, 4,643 unique genes were obtained. However, we identified 471 domesticated genes based on selection signals of SNPs, which proved that SVs are more influential in the inheritance of organisms than SNPs. KEGG enrichment analysis showed that 38 genes were mainly enriched in 'Arginine and proline metabolism' (KO00330, P < 0.012), 'Valine, leucine degradation' (KO00280, P < 0.032), 'Amino sugar and nucleotide sugar' (KO00520, P < 0.037) and 'Purine metabolic pathways' (KO00230, P < 0.05) (Supplemental Table S4 and Supplemental Table S6). Arginine, proline, valine, and leucine are important free amino acids in theanine synthesis pathways, proving that genes in theanine synthesis pathways were strongly selected. Urine metabolic pathways involved purine alkaloids, including caffeine, theobromine, and theophylline, which are crucial flavor-forming chemicals in Camellia and other species.
Novel detection strategy of genome-wide CNVs and selected genes during domestication
-
Read depth (RD) was currently used as the prevalent method in detecting copy number variation (CNV)[42]. However, as the tea plant genome involves enormous quantities of transposon elements (TEs) (80%) existing in the tea genome, the accuracy of CNVs calling was seriously affected through conventional CNV detection pipelines based on short-read sequencing. Therefore, our lab developed a novel detection pipeline used for CNV calling. The influence of the repetitive sequence could be avoided through the direct calculation of CNV associated genes. In addition, we calculated relative frequency difference (RFD) in population CNVs to identify allelic differences among CNVs of ancient and cultivated populations[43]. The artificially selected CNVs among populations were obtained by carrying an F-test based on the theory of bottleneck effect (see Materials and Methods for a more detailed analysis procedure).
We performed this newly developed CNV pipeline to detect domestication genes. Finally, 2,200 selected genes were detected for each subpopulation, and a total of 4,797 CNV-associated unique genes were under selection among four cultivated populations (Fig. 5b). KEGG enrichment analysis displayed that these selected genes were mainly enriched in monoterpenoid, phenylpropanoid, fatty acid, and isoflavonoid biosynthesis (Supplemental Table S7). Several genes associated with catechin synthesis pathways (SCPL1A, ANR, LAR, CHS, F3'H, and SCPL1A) were under selection (Fig. 5a and Supplemental Table S8).
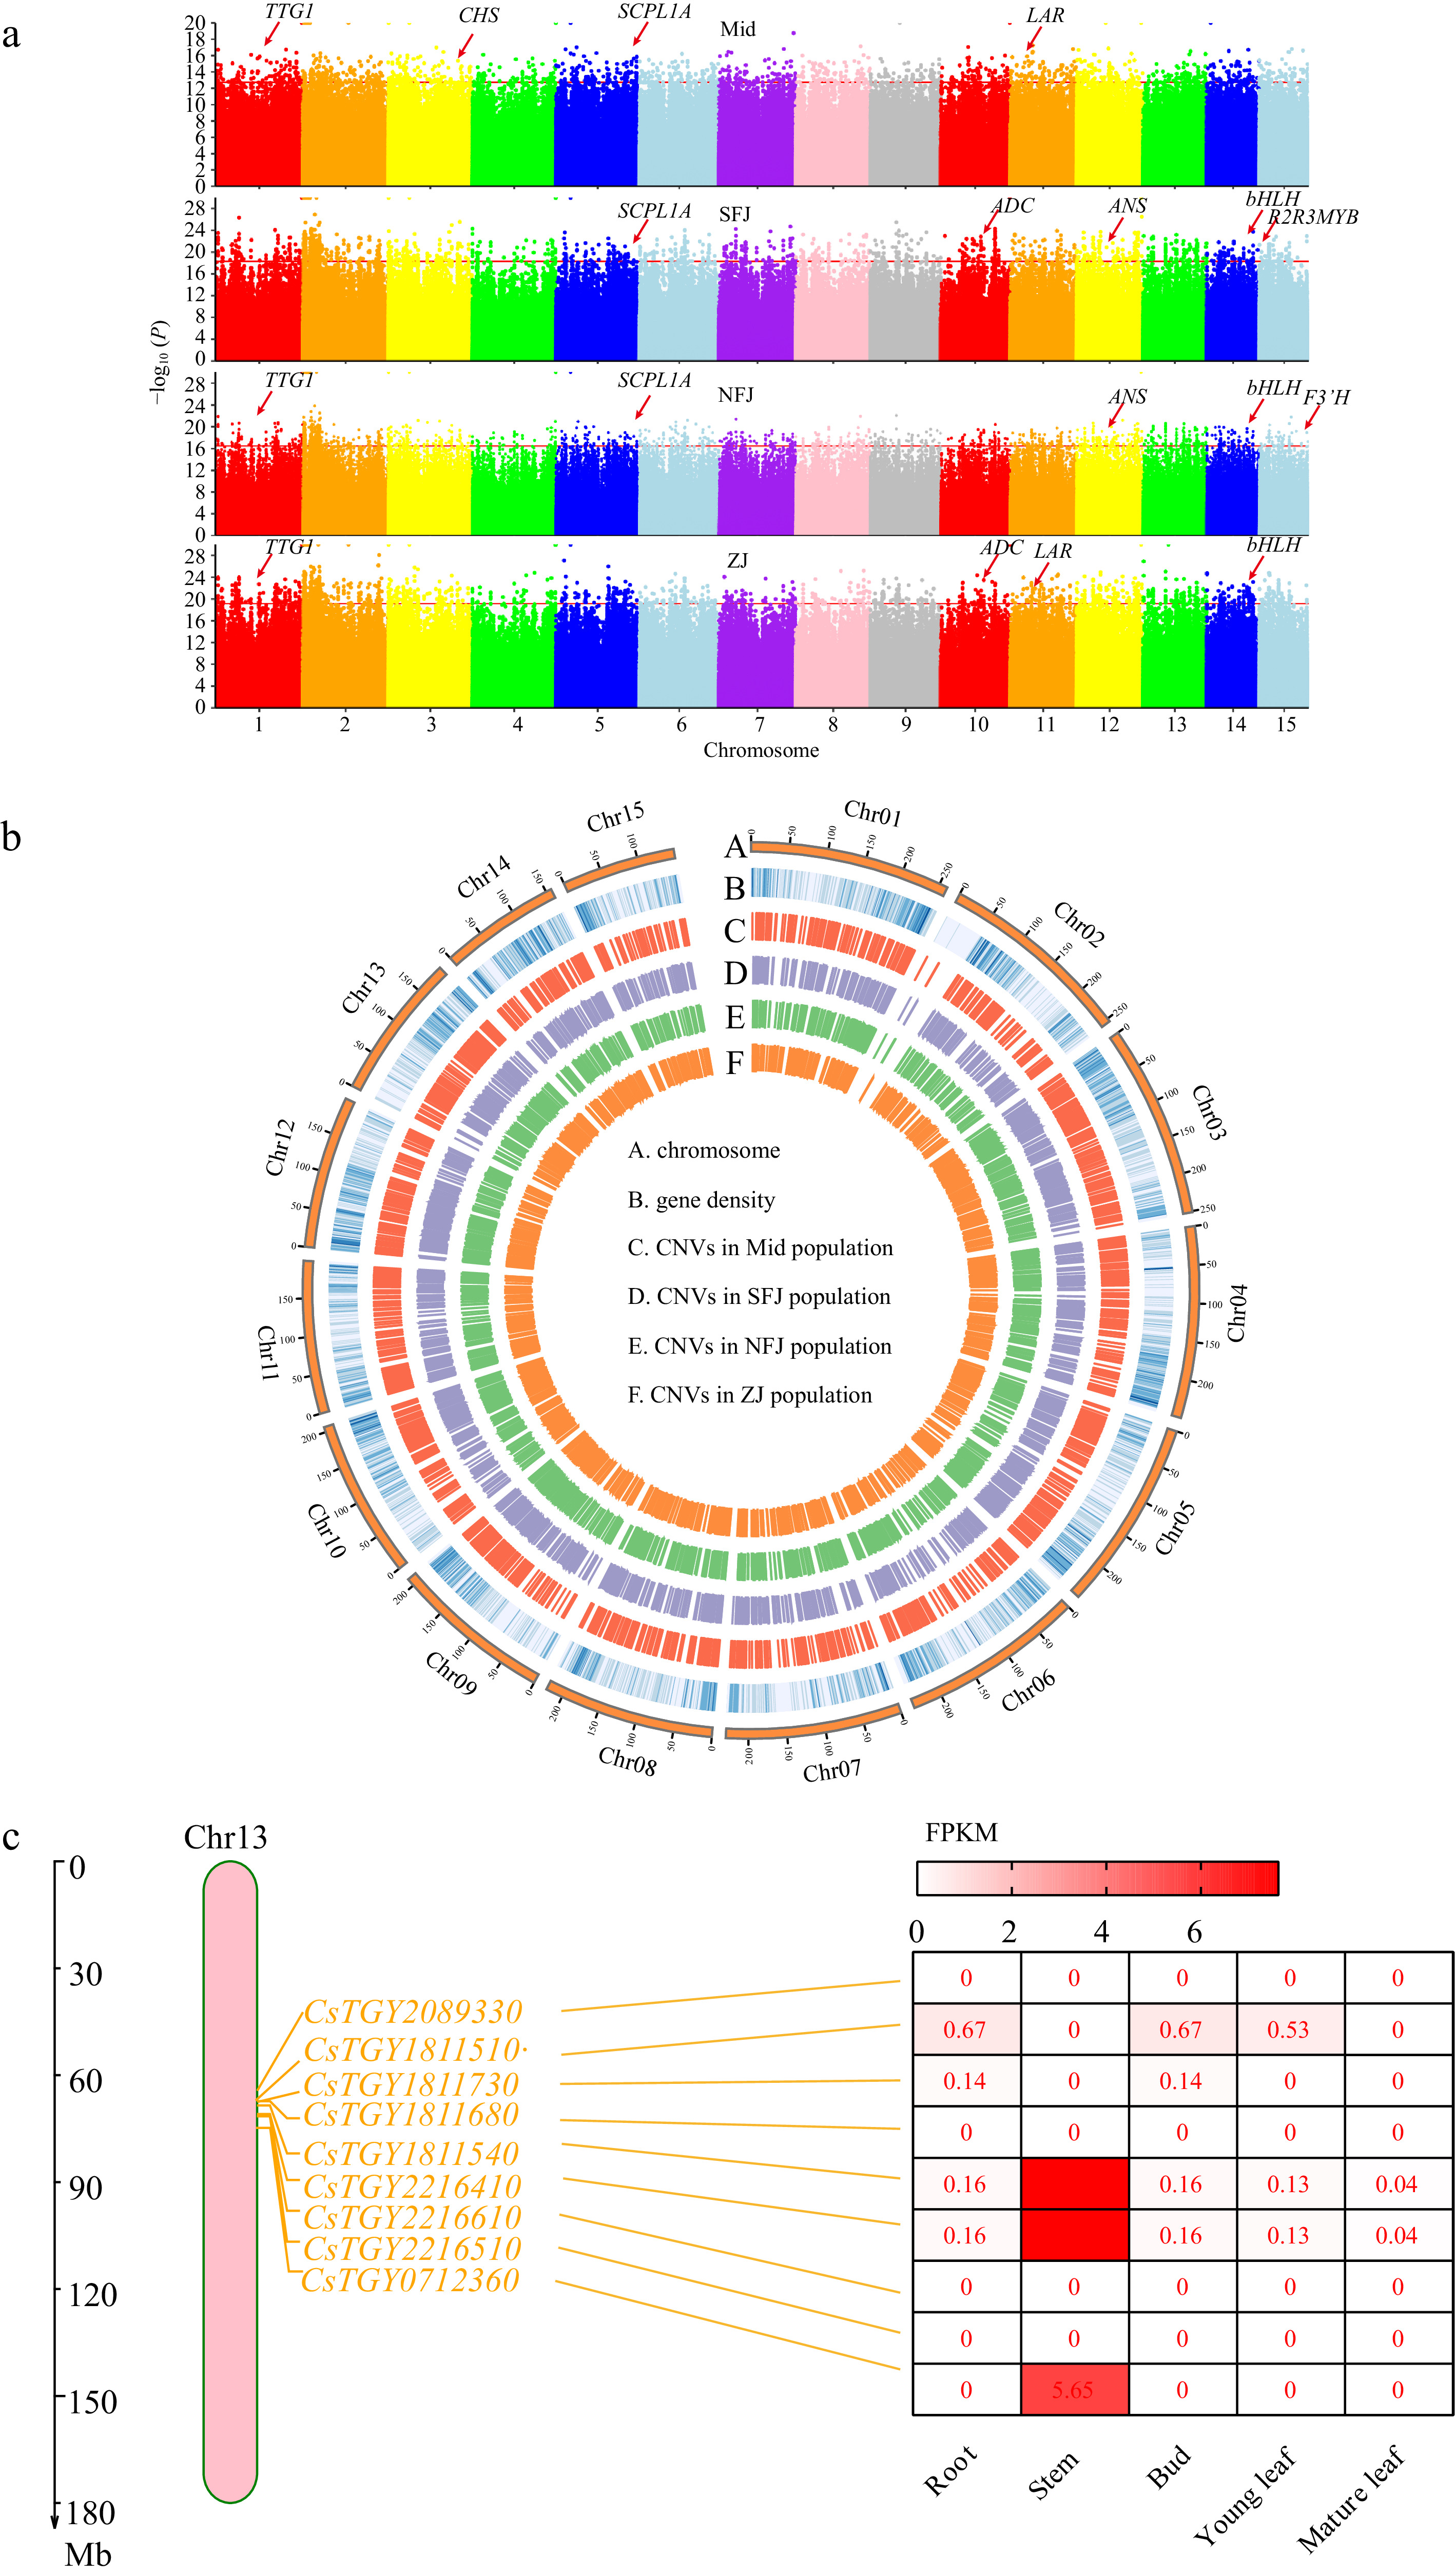
Figure 5.
Feature of CNVs associated with selection signals. (a) Manhattan plots of domesticated CNV sites based on 1kb windows in four sub populations (Mid, SFJ, NFJ and ZJ), genes associated with important functions of tea plant are highlighted in the Manhattan plots. (b) Distribution of CNVs across whole genome, circos plots represent CNV locations among four sub populations from the outside to the inside. (c) Under selected TPS family genes and these expression analysis on chromosome 13.
Analysis of selected TPS family genes
-
Interestingly, 27 CNV-genes were related to the Terpene synthase (TPS) gene family under domestication (Supplemental Table S9). The TPS gene family plays a pivotal role in synthesizing aromatic compounds in the tea plant and shows distinct characteristics in copy number and physiological functions[44,45]. Expansion of these genes would potentially contribute to the tea quality. To further investigate the function of TPS genes related to tea quality, we focused on a cluster of TPS genes, including nine consecutive TPS genes in Chr13. We speculated that these genes are derived from recent tandem repeats and have been selected for the long-term domestication of ancient tea plants. Most of these genes showed no or extremely low expression levels under normal conditions (Fig. 5c). Annotation of these genes showed that most of them contained an N-terminal structural domain, implying that these genes are related to disease resistance (Supplemental Table S10). Therefore, we concluded that the cluster of TPS genes in Chr13 expressed under stress conditions were genes related to adaptive traits and triggers defensive response processes against stress and disease in the organisms.
-
Structural variants (SVs) are becoming a frontier of plant population genomics and explain amounts of phenotype variations. Some studies on crops have proved interesting general patterns about crop domestication[46]. Until now, the SVs during domestication have been investigated in common crops such as rice[47], tomato[20], where SVs provided evidence that may have been under artificial selection and associated with cultivation and improvement. However, tea plants are clonally propagated, very different from rice, tomato, and other annuals plant, leading to the accumulation of recessive deleterious mutations[12], which also increased SV numbers in the domesticate. Our previous studies have found that artificial selection provided evidence of parallel domestication in CSA and CSS, which domestication traits were likely targets of artificial selection[12] Although numerous studies on the population genetics of tea plants have been published[10,48], most of them are based on SNPs, there is no systematic study on SVs in this field, and profound structural variants, in particular, are still unrevealed about the domestication of tea plants.
This study reported a genome-wide structural variation map with large-scale population resequencing data in tea plants. In total, 44,240 high curated SVs were detected and unevenly distributed across chromosomes; in particular, they have a relatively concentrated density on Chr01, which may be caused by a large number of tandem repeats in this region. In addition, a 55Mb segment of the SV-sparsed region was found on Chr07, speculated that a transcriptional inhibition region was observed by Hi-C technology. We still found that most SVs are deletion type, indicating that deletions are very common during plant genome evolution. Phylogenetic relationship and population structure analysis proved an almost consistent evolutionary process between SNPs and SVs.
We further performed domestication analysis of tea plants based on the SVs, where FST analyses indicated some of the selected genes were detected with SVs only. We believe that the selection regions identified by SV divergence between ancient and cultivated tea plants represent selection signals. Some of the genes potentially affecting agronomic traits were identified only in SV domestication analysis. Some of the selected genes were related to critical metabolic pathways of tea trees in different sub-populations. The genes under domestication we detected are important for theanine synthesis and flavor forming in tea plants, such as the presence of high concentrations of purine alkaloids in tea plants. One of the major steps of biosynthetic is the caffeine pathway[49−51]. Two hypotheses have been proposed for the ecological role of purine alkaloids, such as caffeine: the chemical defense theory and the allelopathic function theory[52], caffeine-producing tobacco has been proved to play an essential role in plant defense against fungal and insect pests by transgenic assays. Therefore, with the help of the practice basis, it is of epoch-making significance for resisting insect pests of tea plants through modifying related genes of tea plant by genetic engineering technology. In addition, underlying CNVs selected genes associated with the catechin synthesis pathway, for example, monoterpenoid, phenylpropanoid, and isoflavonoid biosynthesis, including 27 TPS family genes were selected during domestication. Previous evidence has demonstrated that TPS genes with no expression under normal conditions would show substantially increasing expression in response to the attack from Ectropis obliqua, one of the most destructive pests of tea plants[10]. Some SV-genes or CNV-genes we detected contribute to traits of agronomic interest.
In conclusion, this study provides insights into improving our understanding of SVs acting on tea domestication, and the comprehensive SV set introduces a reference for the subsequent development of genetic markers and future breeding strategies.
-
A total of 107 Camellia accessions were gathered for the population genetic variation analysis, of which 105 whole-genome resequencing data were from our lab (Supplemental Table S1). The remaining two sample data were previously published tea genome sequences, consisting of CSA[5] and CSS[6]. Camellia oleifera was used as the outgroup. In these plant materials, 32 were provided by the Jiangxi Sericulture and Tea Research Institute in Nanchang, 32 were collected from Wuyi mountain in Nanping, College of Horticulture provided five, Fujian Agriculture and Forestry University at Fuzhou, 12 ancient and other 24 accessions were collected from Yunnan, Hainan and Fujian provinces. Young leaves from each accession were flash-frozen in liquid nitrogen and transferred to a DNA sequencing provider (Annoroad Gene Tech., Beijing, China). Genomic DNA from each sample was isolated using DNeasy Plant Mini Kit (Qiagen, USA), following the manufacturer's instructions. The whole-genome resequencing was conducted on the Illumina NovaSeq platform with 150 bp read length, and 300-500 bp insert size.
Detection of the genetic variants
Mapping
-
Illumina pair-end reads with an average depth of 11× of each accession were trimmed by Trimmomatic[53] to remove adapters, and low-quality bases, followed by filtering reads for quality control by FastQC (
www.bioinformatics.babraham.ac.uk/projects/fastqc ). Obtained clean reads were mapped to the TGY monoploid reference genome using BWA[54] (Version: 0.7.17-r1188) with BWA-MEM algorithms and default parameters. The aligned results were processed by sorted and duplicates marked using SAMtools[55] (Version:1.3) and Picard (http://broadinstitute.github.io/picard ). After that, BAM files were realigned using the IndelRealigner to remove erroneous mismatches around small-scale insertions and deletions.SVs calling
-
We adopted three SV calling methods: Manta[31], Delly[33], and Lumpy[32]. These packages were used to call and genotype SVs across the 107 accessions. Before the clean bam files were obtained as the input data, SV calling was performed according to officially recommended pipelines using both Manta[31] and Delly[33]. For Lumpy, we first used SAMtools[55] to calculate the read lengths and then extracted split reads and discordant read-pairs from the clean bam file of each sample. The output SVs were genotyped using SVTyper[56]. SVs called from three methods were merged using SURVIVOR v1.0.3[34]. Using a curated TE library, those SVs were filtered by excluding overlapped existing TE regions based on the RepeatMasker Version 1.332 (
www.repeatmasker.org ). The final SV calls were further filtered by SV length > 50 bp, missing genotype < 80%, and identical breakpoints across 107 individuals.SNPs and small Indels calling
-
GATK[39] pipeline was performed to detect SNPs and Indels according to the officially recommended workflow. HaplotypeCaller program was used to identify SNPs and Indels for each accession following the default parameters, and GenotypeGVCFs were used to merge all of the individual gVCFs. In the meantime, SAMtools v1.3 was also applied to call variants with the mpileup parameter using the same data. We adopted the following criteria to filter SNPs: (1) SNPs were removed if they were present in only one of the two pipelines (GATK and SAMtools mpileup); (2) Low-depth, low-quality, and repetitive variants were removed from the raw VCF file if DP < 4 or DP > 100 and minQ < 30; (3) SNPs maximum missing rate was set at 0.40; (4) Only diploid SNPs were retained; (5) SNPs located at TE regions were excluded.
Phylogenetic and structure analyses
-
To get a high-quality phylogenetic tree, we detected all SNPs located at regions of single-copy genes. All SNP sites were concatenated and converted into aligned fasta format. RAxML[57] software based on the Maximum Likelihood (ML) algorithm was performed to construct the phylogenetic tree with the 'GTRCAT' substitution model and 2000 bootstraps. Finally, FigTree (v1.4.3) (
http://tree.bio.ed.ac.uk/software/figtree ) was applied to visualize the tree file.Ancestral population stratification among 106 accessions was examined using ADMIXTURE software[40]. Ten different K values (range from 1 to 10) were chosen, the optimal K values with the minimum cross-validation error[58]. The Q matrix assignment barplots were generated using a local R script.
HiC analysis
-
Hi-C reads were aligned to the chromosome-scale reference genome using HiC-Pro[59].
Detecting putative selection signals in population SVs
-
To identify candidate selective sweep locations between the ancient population and cultivated populations, the population divergence index (Fst) was calculated as a measuring method that sliding window with high Fst in cultivated compared to the ancient group have high divergence and population structure a hallmark of domestication related sweeps. Fst comparisons of the four cultivated groups to the ancient group were calculated in sliding windows of 100 kb with 50 kb step and using Weir and Cockerham's method[60] implemented in VCFtools[61] with '--weir-fst-pop' parameter.
Population CNVs detection and selection signal analyses
-
To detect the genome-wide CNVs, our lab developed a novel pipeline (
https://github.com/sc-zhang/popCNV ). The detailed procedures are as follows: (1) We first performed GC correction to avoid biases in GC-rich or GC-poor regions brought by sequencing technology; (2) we used the filtered BAM files (see Mapping methods) as the input of CNV calling and used Mosdepth[62] to calculate the BAM read-depth (RD) with 1 kb step for each sample; (3) we calculated the RD using 1 kb no-overlap slide windows to detect the CNVs region; (4) The RD was normalized to copy number and gene copy number was calculated; (5) to detect selection signals of CNVs, population frequency[43] was calculated and normalized. The relative frequency difference (RFD) measured CNV differentiation in populations based on variation frequency. The RFD formula as follows:$ RFD=\frac{Fcultivated-Fancient}{Fpopulation} $ where Fcultivated, Fancient and Fpopulation represent the frequency of CNV in cultivated, ancient and the population (all samples), respectively.
We adopted an F test as a complementary method based on the bottleneck effect to detect the CNVs of artificially selected genes. According to the theory of bottleneck effect, selected CNV polymorphisms will be significantly reduced in the cultivated population, while the corresponding CNV polymorphisms will be enriched in the ancient population. The differences of polymorphisms can be used to detect selection signals by calculating the variance of CNV among different populations and carrying out F test.
Gene expression analysis
-
We used RNA sequencing data to validate the candidate selective genes to observe the gene expression. RNA-seq data were downloaded from the National Center for Biotechnology Information (NCBI) database under the accession number SRP116394. RNA-seq reads were trimmed using Trimmomatic[53] program and then mapped onto the TGY reference genome using Bowtie2[63] with only uniquely mapped reads retained. FPKMs (Fragments per kilobase of exon per million fragments mapped) were calculated using RSEM[64] program. Gene ontology (GO) enrichment and Kyoto Encyclopedia of Gene and Genome (KEGG) pathway analysis were performed using an online platform named OmicShare tools (
www.omicshare.com/tools ). This work was supported by Shenzhen Science and Technology Program (Grant No. RCYX20210706092103024), two projects funded by the State Key Laboratory of Ecological Pest Control for Fujian and Taiwan Crops (No. SKL2018001 to X.Z. and No. SKL20190012 to H.Z.)
-
The authors declare that they have no conflict of interest.
-
accompanies this paper at (http://www.maxapress.com/article/doi/10.48130/TP-2022-0002)
-
Received 6 April 2022; Accepted 2 May 2022; Published online 22 May 2022
-
Resequencing of 107 tea plant genomes uncovered 44,240 structural variants
The dynamic changes of SVs functionally affect gene function, especially gene expression
A new pipeline was proposed to identify copy numer variations associated with artificial selection
- Supplemental Table S1 Information and statistics of re-sequenced tea accessions.
- Supplemental Fig. S1 Distribution of SVs, gene density and TE density on Chr07.
- Supplemental Fig. S2 Interaction frequency, A/B compartment, gene density and LTR density on Chr07. The colour scale represents normalized interaction matrix (Pearson’s correlation coefficient). A/B Compartments y-axis represents eigenvector value of correlation matrix.
- Supplemental Fig. S7 GO enrichment analysis(Cellular Component) of genes with the SV-overlapping genes .
- Supplemental Fig. S9 GO enrichment analysis(Biological Process) of genes with the SV-overlapping genes.
- Supplemental Table S3 GO enrichment analysis of SVs.
- Supplemental Fig. S11 Gene-Associated SVs example may impact expression. The pink rectangle represents UDP-glucosyltransferases gene (CsUGT), and red rectangle represents a 400 bp deletion of CDS start.
- Supplemental Fig. S3 Phylogenetic tree based on SNPs, accessions are represented in the same color code throughout this figure (blue=wild, red=Mid, Light purple=SFJ, Teal=NFJ, and Yellow=ZJ).
- Supplemental Fig. S8 GO enrichment analysis(Molecular Function) of genes with the SV-overlapping genes.
- Supplemental Fig. S5 SNP-based admixture analysis of tea accessions, including 12 ancient and 94 cultivated tea accessions (K = 2 to 10).
- Supplemental Fig. S4 SV-based admixture analysis of tea accessions, including 12 ancient and 94 cultivated tea accessions (K = 2 to 10).
- Supplemental Table S2 LD decay in each of the geographic groups.
- Supplemental Fig. S6 Decay of linkage disequilibrium (LD) in each of the geographic groups.
- Supplemental Fig. S10 Domestication analysis of SVs in four sub populations.
- Supplemental Table S5 Statistics of selected SV genes.
- Supplemental Table S4 KEGG enrichment analysis of cultivated selection genes.
- Supplemental Table S7 KEGG enrichment analysis of CNV genes in four sub populations.
- Supplemental Table S6 SV selected genes releated to the Theanine metabolism and purine metabolism.
- Supplemental Table S8 The CNV genes releated to metabolic pathway of tea plant.
- Supplemental Table S9 FPKM of 27 TPS family genes in domestication of CNVs.
- Supplemental Table S10 TPS gene function annotation on Chr13.
- Copyright: © 2022 by the author(s). Published by Maximum Academic Press on behalf of Hainan University. This article is an open access article distributed under Creative Commons Attribution License (CC BY 4.0), visit https://creativecommons.org/licenses/by/4.0/.
-
About this article
Cite this article
Chen S, Fang J, Wang Y, Wang P, Zhang S, et al. 2022. Evolutionary genomics of structural variation in the tea plant, Camellia sinensis. Tropical Plants 1:2 doi: 10.48130/TP-2022-0002 

Evolutionary genomics of structural variation in the tea plant, Camellia sinensis
- Received: 06 April 2022
- Accepted: 02 May 2022
- Published online: 22 May 2022
Abstract: Structural variants (SVs) are a type of genetic variation that contribute substantially to phenotypic diversity and evolution. Further study of SVs will help us understand the influence of SVs associated with tea quality and stress resistance and provide new insight into tea plant breeding improvement and genetic research. However, SVs have not been thoroughly discovered in the tea plant genomes. Herein, we constructed a large-scale SV map across a population of 107 resequenced genomes, including both ancient and cultivated tea plants. A total of 44,240 high-confident SVs were identified, including 34,124 DEL (deletions), 4,448 DUP (duplications), 2,503 INV (inversions), 544 INS (insertions) and 2,621 TRA (translocations). In total, 12,400 protein-coding genes were overlapped with SVs, of which 49.5% were expressed in all five tea tissues. SV-based analysis of phylogenetic relationships and population structure in tea plants showed a consistent evolutionary history with the SNP-based results. We also identified SVs subject to artificial selection and found that genes under domestication were enriched in metabolic pathways involving theanine and purine alkaloids, biosynthesis of monoterpenoid, phenylpropanoid, fatty acid, and isoflavonoid, contributing to traits of agronomic interest in tea plants. In addition, a total of 27 terpene synthase (TPS) family genes were selected during domestication. These results indicate that these SVs could provide extensive genomic information for tea quality improvement.
-
Key words:
- Structural variants /
- Tea plant /
- Population selection /
- Copy number variants