


-
The stability and health of ecosystems are fundamental to sustainable human development[1]. However, with the intensification of human activities, the global ecological environment is undergoing unprecedented transformations, resulting in ecological habitat loss, biodiversity decline, and reduced ecosystem services (ESs)[2,3]. These changes are primarily driven by the increasing demand for essential resources such as food, water, and livelihoods[4−7]. Such ecological degradation poses significant risks to environmental health, and directly threatens regional sustainable development[8,9]. Therefore, ensuring the structural stability and functional integrity of natural ecosystems while promoting regional health and sustainable development remains a critical challenge for human society[6,10,11]. High-latitude cold regions, distinguished by unique climatic conditions, vegetation, and ecological characteristics, serve as significant grain-producing regions and ecological reserves, and exhibit heightened sensitivity to global climate change[12−14]. These regions confront significant challenges such as environmental degradation, biodiversity loss, and soil deterioration, which are intensified by ongoing climate change.
As a strategic spatial planning tool, the ecological security pattern (ESP) aims to enhance regional ecosystem stability and connectivity by identifying critical nodes and ecological corridors (ECs) within the ecological network[15]. ESPs have become a key approach to reconciling conflicts between ecological protection and economic development[16]. By integrating landscape patterns with ecological processes and applying circuit theory models, ESPs can accurately identify critical ecological areas, ECs, and restoration bottlenecks, providing a scientific foundation for ecological protection[17−19].
Nevertheless, current studies on the ESP face two key limitations. First, the majority of studies emphasize the identification of ecological sources but neglect to optimize corridor structures or evaluate their functional widths[20−22]. Second, although spatial connectivity is frequently addressed, few studies integrate multi-dimensional assessments of ecological risk and economic feasibility, which are crucial for transforming ESP frameworks into practical strategies[23−26]. Corridor width, a key factor closely tied to ecological process integrity and species persistence, remains underexplored as a design parameter[27−29]. The integration of ecological risk assessment with genetic algorithms (GAs) offers an effective approach to delineate the spatial extent of ECs, optimize their layout and width, and enhance network connectivity and biodiversity conservation[30,31]. In China, ESP research has predominantly focused on urban agglomerations and karst areas[32−34], leaving a significant gap in understanding ESP construction in cold regions, areas that are vital for ensuring national food and ecological security.
To address the specific conflicts between human activities and ecosystems in cold regions, this study introduces several innovations in ESP construction. A novel connectivity–ecological risk–economic efficiency (CRE) framework is proposed that integrates ecological connectivity, risk assessment, and socio-economic costs into ESP design. First, we combine ES evaluation with morphological spatial pattern analysis (MSPA) model to identify ESs, thereby reducing the subjective bias inherent in traditional methods. Second, to adequately support species migration under winter conditions[35], the number of snow cover days is incorporated as a resistance factor, which more accurately reflects the environmental conditions and conservation needs of high-latitude cold regions. To evaluate the resilience of ESPs to environmental changes and anthropogenic disturbances, a complex network-based node attack simulation is employed. This method applies two attack strategies—sequential and targeted attacks—to remove nodes or edges from the ecological network. We construct the current ESP for high-latitude cold regions by prioritizing nodes based on their importance for conservation planning. Finally, we implement data-driven corridor planning under multiple development scenarios using a GA-based multi-objective optimization approach.
This study therefore aims to: (1) develop a replicable ESP construction framework tailored for cold-region landscapes and climate-vulnerable ecosystems; (2) identify and optimize the spatial distribution of multi-functional ecological sources; (3) evaluate ecological connectivity and system robustness across various development scenarios; and (4) delineate corridor networks with optimized dimensions, configurations, and ecological-economic trade-offs. By addressing the spatial mismatch between ecological processes and winter landscape dynamics, this study offers climate-resilient solutions essential for achieving sustainable development goals in vulnerable cryosphere environments.
-
The Songhua River Basin (SRB) is located in the northeastern region of China, spanning from 119°52′ E to 132°31′ E and 41°42′ N to 51°38′ N, with a total area of 561,200 km2 (Fig. 1). As a typical high-latitude cold basin, the SRB is characterized by diverse land use types, predominantly consisting of cropland (50.9%) and forest (34.9%), followed by grassland (8.8%). The basin's extensive geographic range and elevation variations result in complex meteorological and hydrological conditions. The average annual temperature ranges from –4.20 to 6.93 °C, decreasing from south to north, while annual precipitation varies between 341.30 and 1,010.90 mm, with a maximum-to-minimum ratio of approximately 3:1.
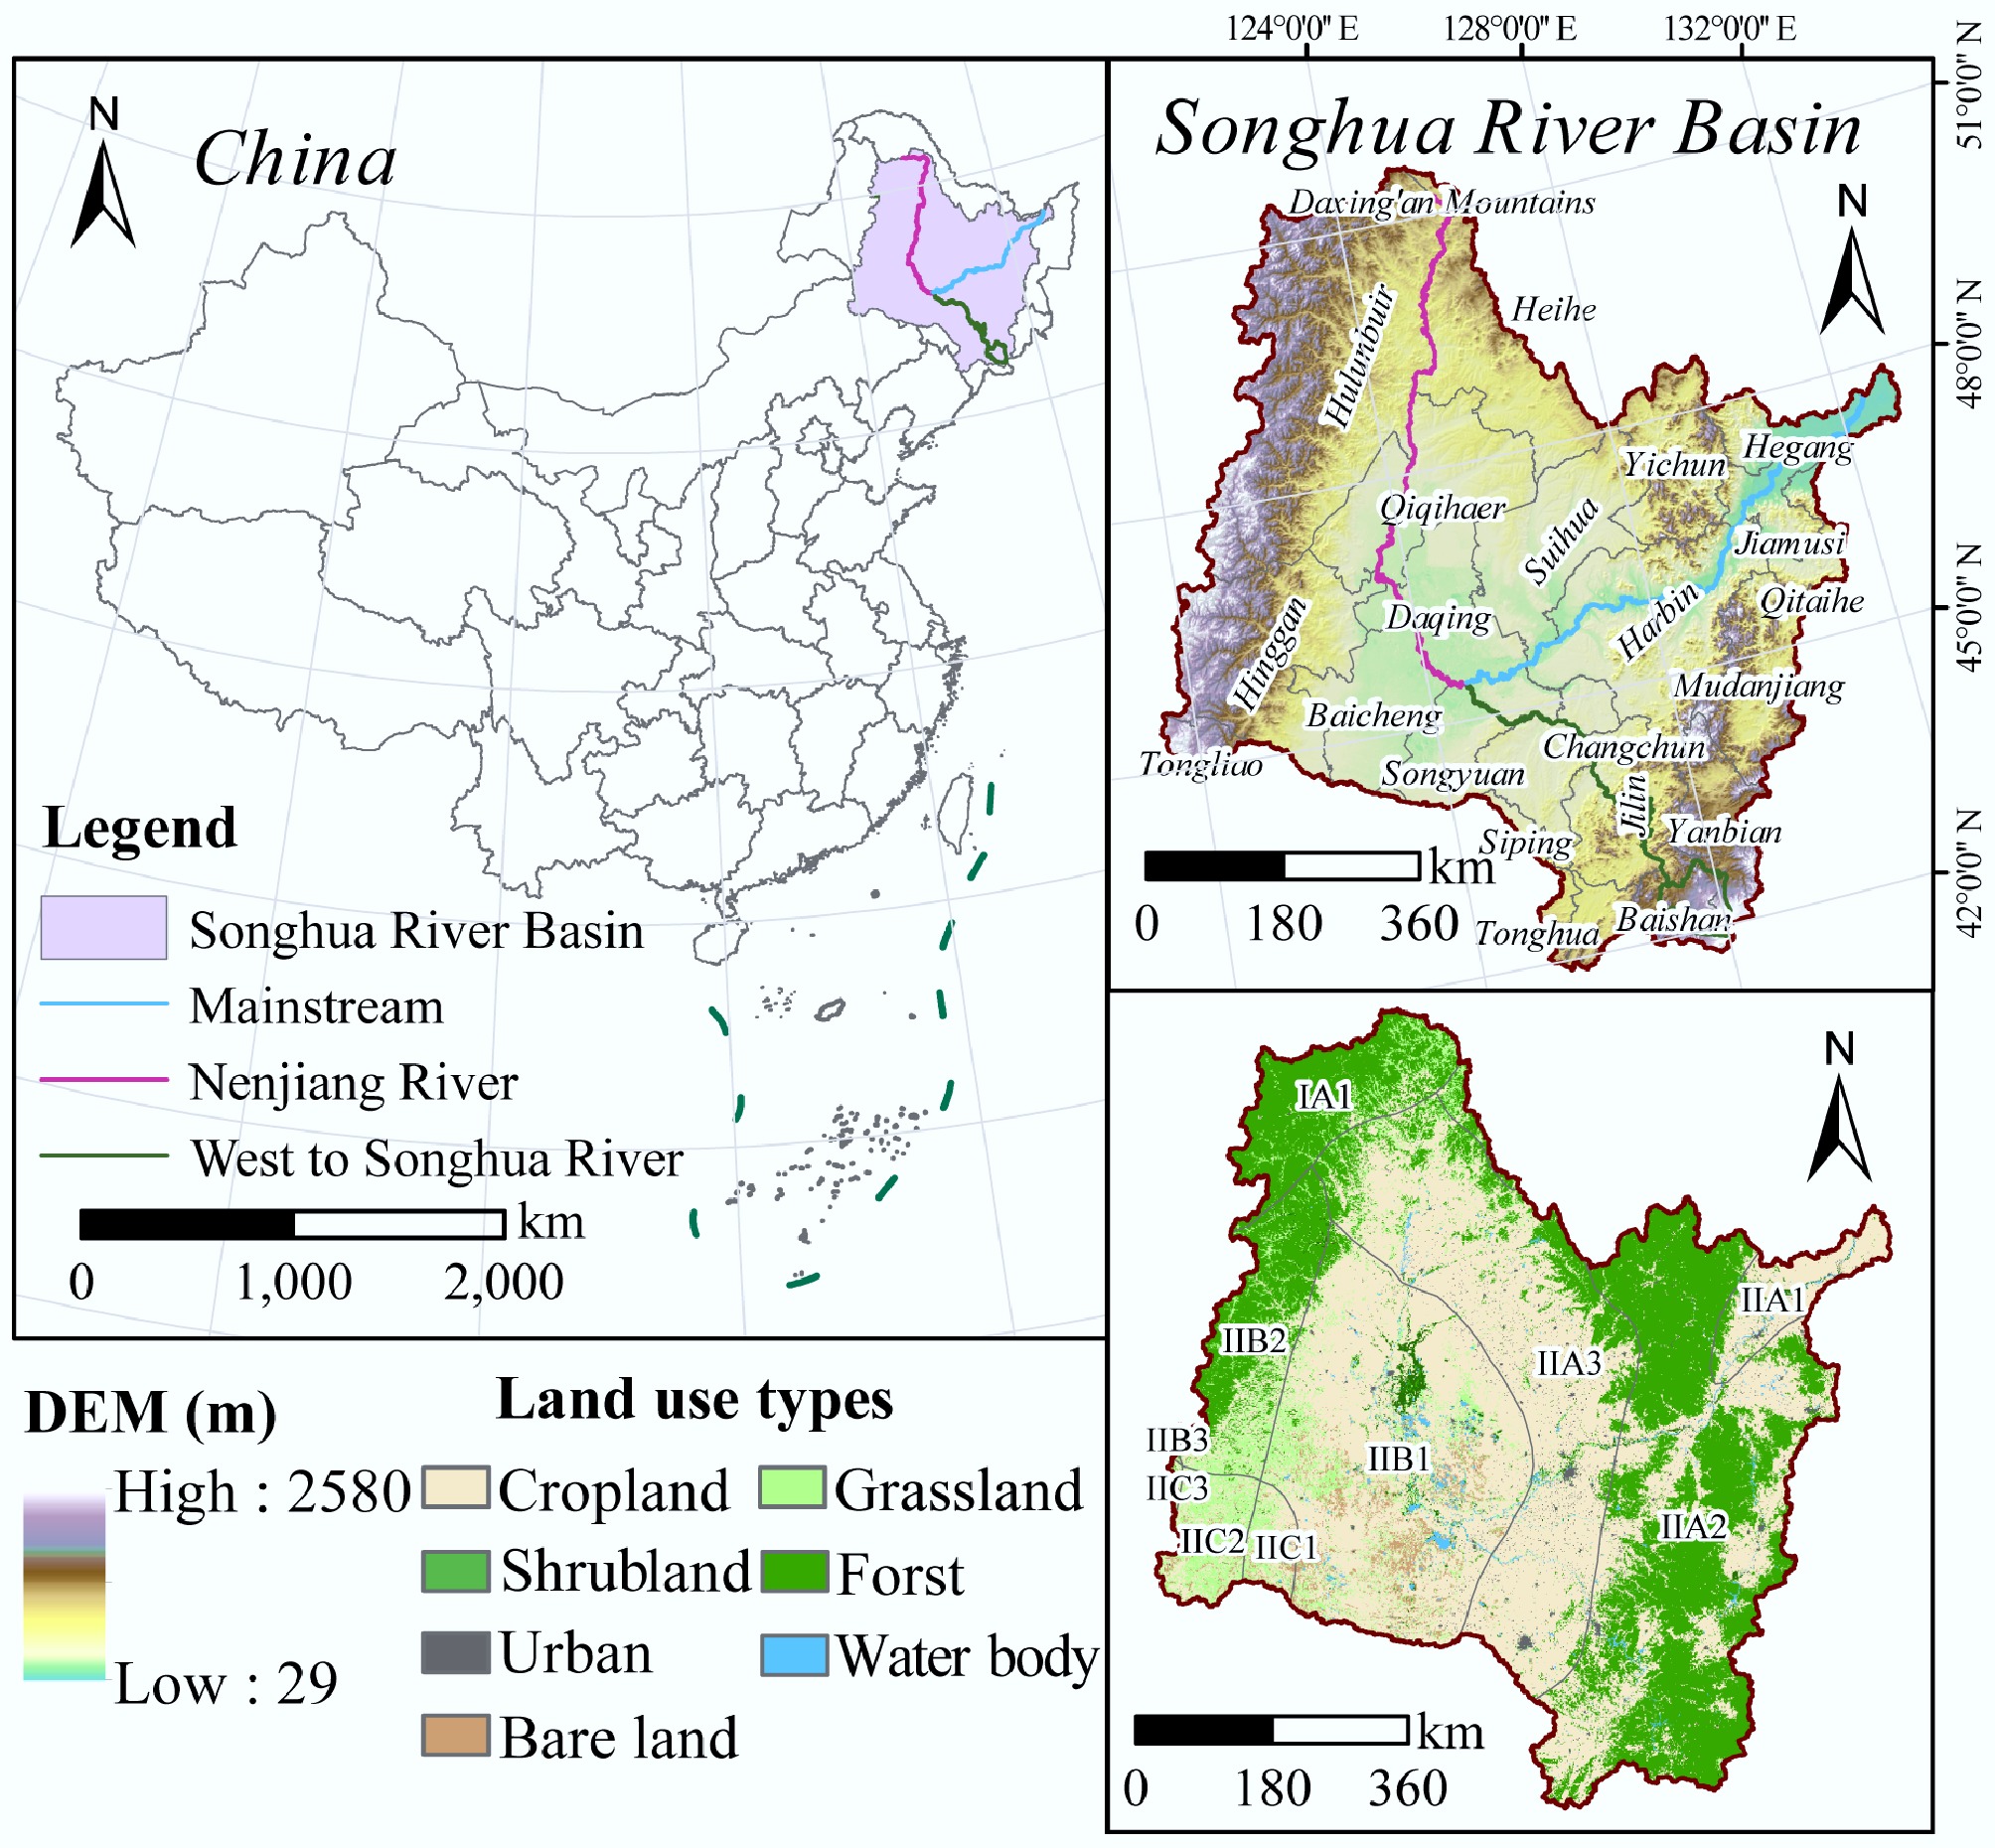
Figure 1.
Geographical location and land use types in the SRB. The basin is divided into ten eco-geographical sub-regions: IA1 (Greater Khingan Mountains), IIA1 (Sanjiang Plain), IIA2 (Eastern Uplands of Northeast China), IIA3 (Front Mountain Plain of Eastern Northeast China), IIB1 (Central Songliao Plain), IIB2 (Southern Greater Khingan Mountains), IIB3 (Plain and Hills Sanhe Piedmont), IIC1 (Southwestern Songliao Plain), IIC2 (Northern Greater Khingan Mountains), and IIC3 (Eastern Inner Mongolia Plateau).
The SRB's unique geographical conditions provide critical habitats for numerous species and support diverse ESs, ensuring food production and security in China. However, historical unsustainable development has led to ecological issues such as soil erosion and surface pollution[36,37], hindering sustainable development and increasing environmental risks. Therefore, constructing an effective ESP is essential for strategic planning[38]. In this study, the SRB was divided into 10 regions based on China's eco-geographical classification system (Supplementary Table S1).
Data sources
-
The fundamental datasets employed in this study are systematically summarized in Table 1 to ensure transparency and reproducibility. For constructing the ESP in the SRB, multisource datasets were integrated through the following procedures: first, land use classification was conducted by categorizing the regional landscape into seven distinct types: cropland, grassland, shrubland, forest, urban areas, water body, and bare land, based on the study objectives and the basin's geomorphological characteristics. Subsequently, spatial data processing involved resampling strategies: discrete variables were processed using nearest neighbor interpolation, while continuous data underwent bilinear resampling. All geospatial datasets were uniformly standardized to 1-km spatial resolution grids within the WGS_1984_Albers projection coordinate system.
Table 1. Data sources and description
Data Data sources Data description Land use data in 2020 Global ESA CCI land cover classification map ( http://maps.elie.ucl.ac.be/CCI/viewer )Raster, 300 m × 300 m Future scenario land use data in 2030
(SSP119, SSP245, and SSP545)Scientific Data[39] Raster, 1,000 m × 1,000 m Digital evaluation model (DEM) Geospatial Data Cloud (China) ( www.gscloud.cn )Raster, 30 m × 30 m Net primary productivity (NPP) United States Geological Survey (USGS) website ( https://lpdaac.usgs.gov/product_search/?view=list )Raster, 500 m × 500 m Soil profile Harmonized World Soil Database (HWSD v1.2) ( www.fao.org/soils-portal/data-hub/soil-maps-and-databases/harmonized-world-soil-database-v12 )Raster, 1,000 m × 1,000 m Road networks and river data China National Catalogue Service for Geographic Information ( www.webmap.cn )Vector Depth to bedrock map Scientific Data[40] Raster, 1,000 m × 1,000 m Eco-geographical region data Resource and Environment Science and Data Center ( www.resdc.cn/data.aspx?DATAID=125 )Vector Snow cover days (SCD) Earth System Science Data[41] Raster, 5,000 m × 5,000 m Methodology
-
The present research framework establishes a five-stage hierarchical analysis for ESP construction: (1) ecological source identification; (2) comprehensive resistance surface development; (3) EC extraction; (4) ecological network security evaluation, and (5) EC width optimization (Fig. 2). This integrated 'point-line-surface' approach incorporates the CRE framework to systematically analyze the SRB's ecological patterns and dynamics through the following sequence:
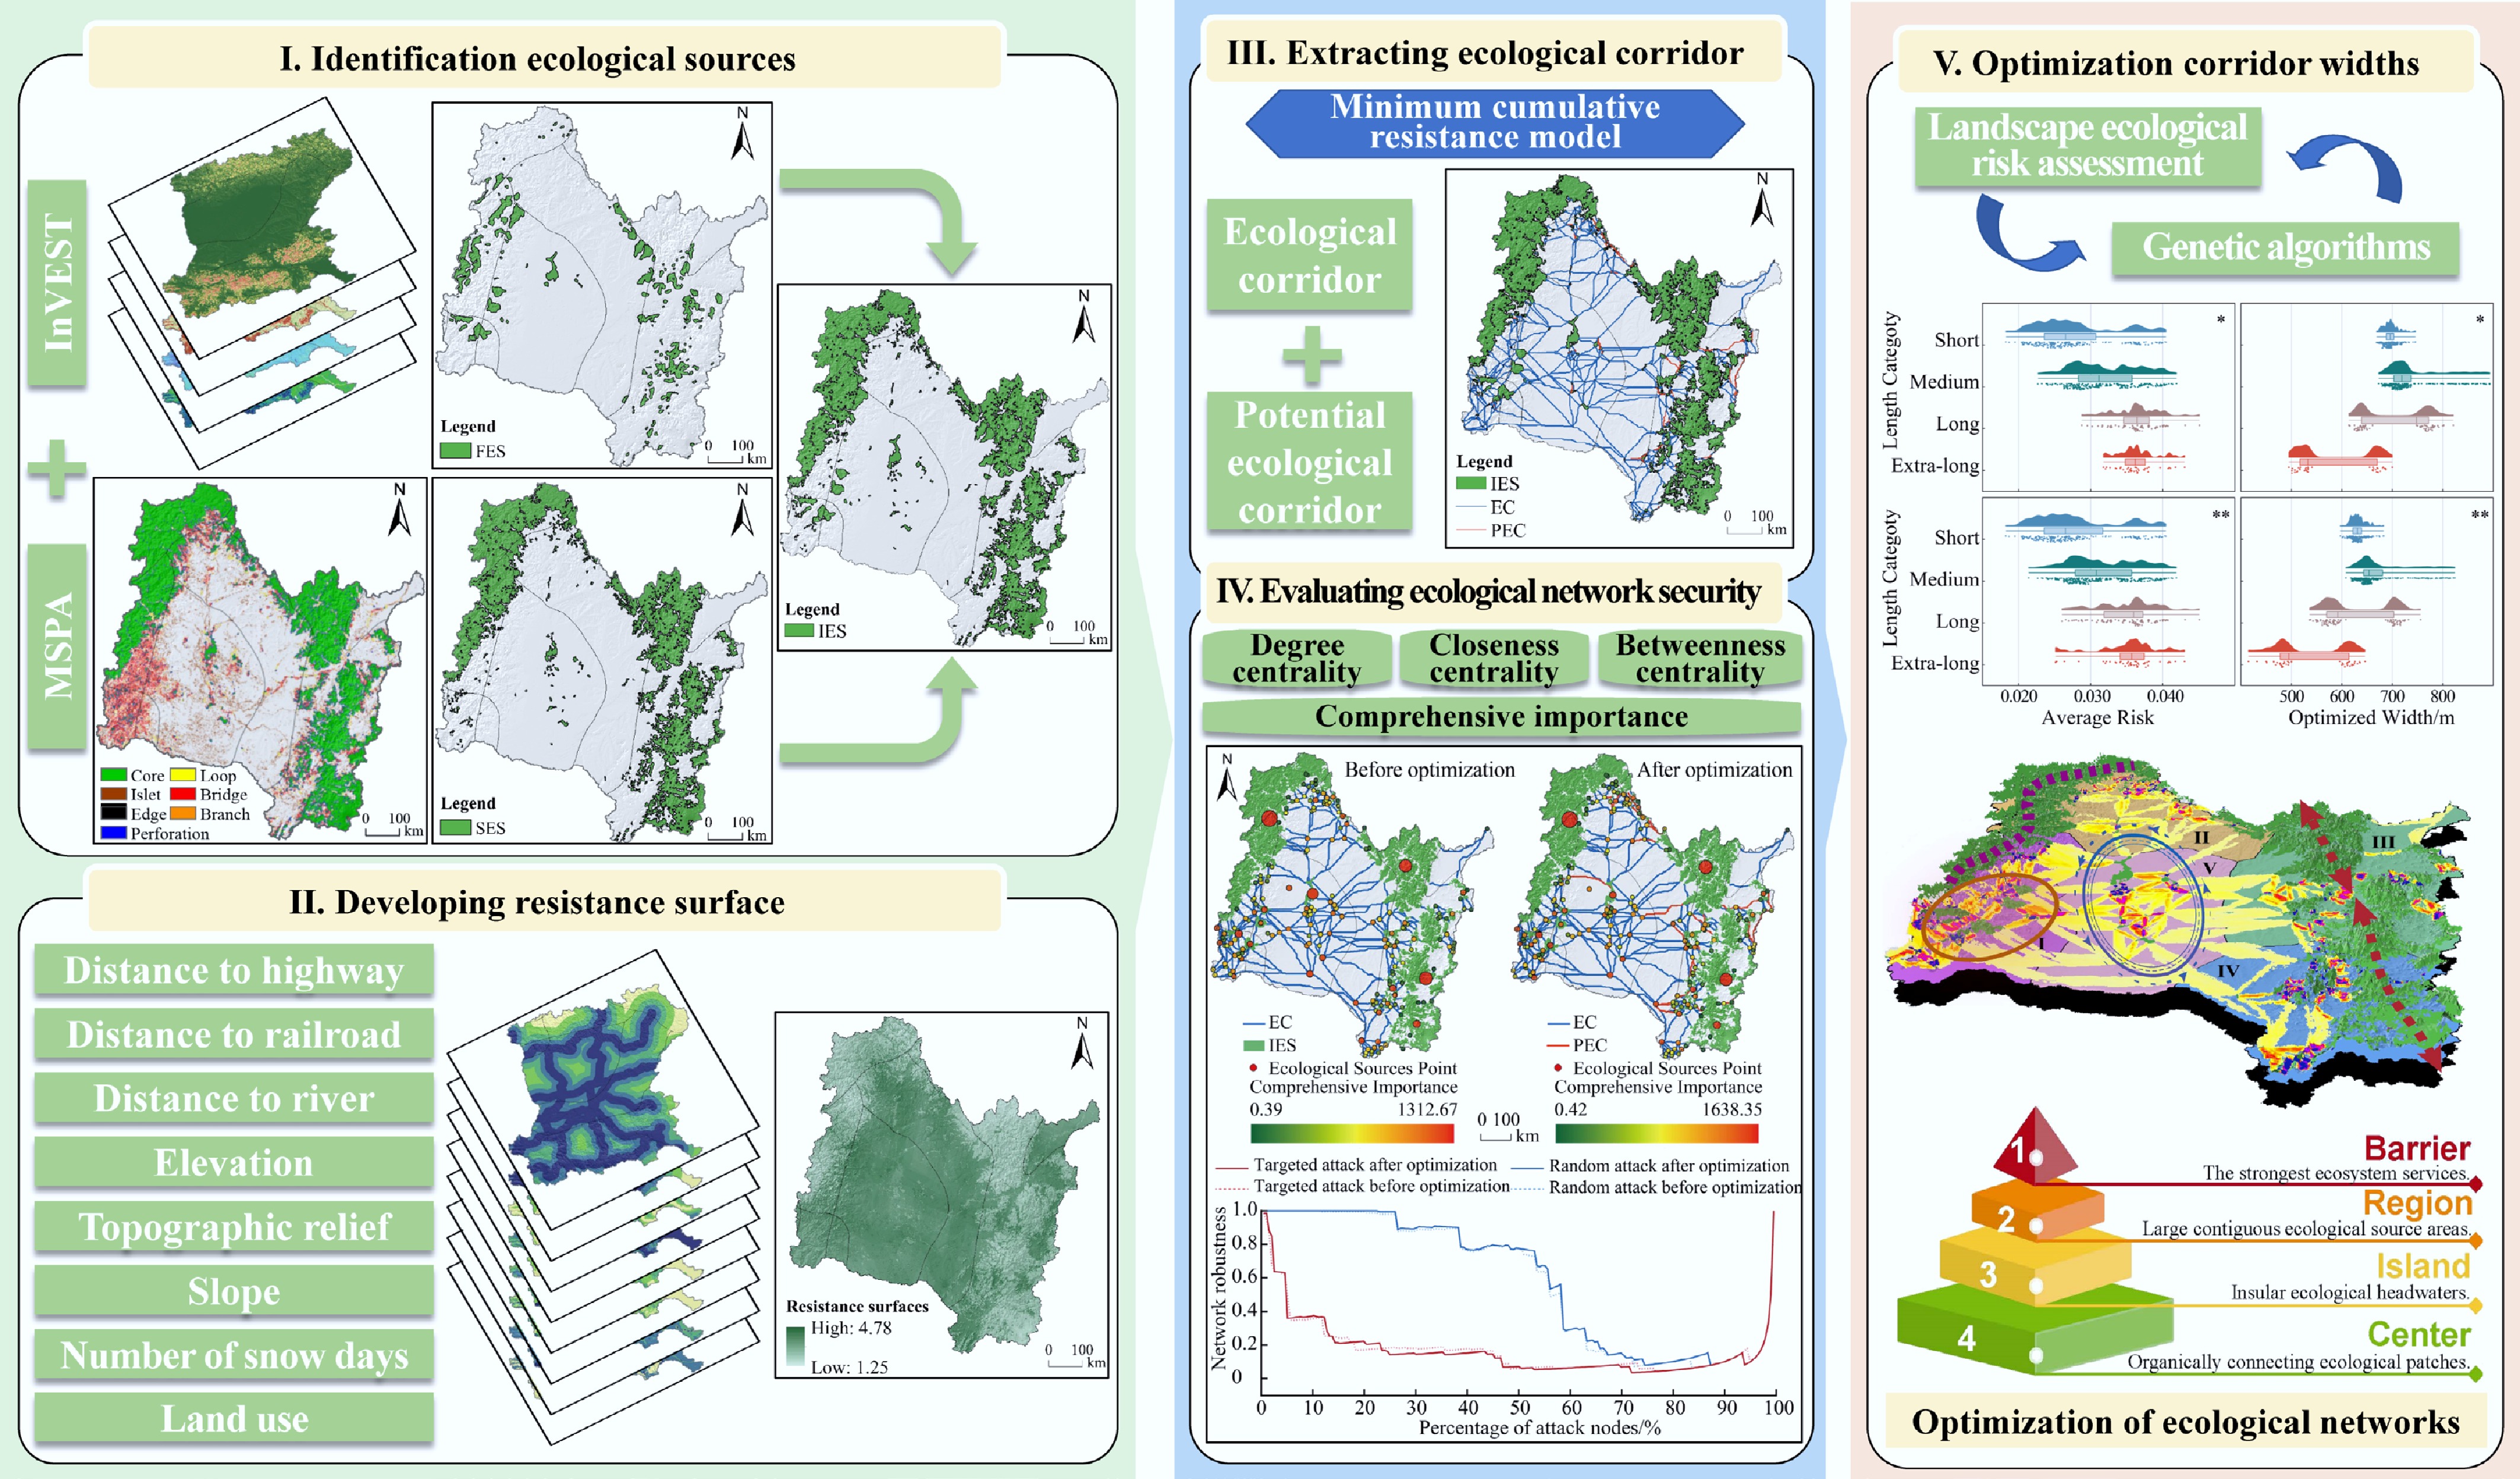
Figure 2.
The analysis framework of the study.
Stage 1: Identification of ecological sources
The InVEST model was synthesized with MSPA to derive both functional ecological sources (FESs; ecosystem service providers) and structural ecological sources (SESs; high ecosystem connectivity), which were subsequently integrated through spatial overlay to establish comprehensive integrated ecological sources (IESs).
Stage 2: Development of resistance surface
A multidimensional resistance model was constructed by quantitatively integrating anthropogenic disturbance indices (e.g., distance to highway) with natural constraint factors (e.g., elevation), serving as the basis for identifying ECs.
Stage 3: Extraction of ecological corridors
Using the minimum cumulative resistance model, both existing EC and potential ecological corridors (PECs) were identified through circuit theory-based simulations.
Stage 4: Evaluation of ecological network security
Network topology analysis was conducted to quantify network robustness, followed by structural optimization using various network indicators.
Stage 5: Optimization of corridor widths
A hybrid optimization framework was developed combining landscape ecological risk assessment with GAs to determine ecologically sustainable corridor widths while maintaining landscape functionality.
This multi-criteria framework (illustrated in Fig. 2) provides a spatially explicit decision-support tool for regional ecological conservation planning through its novel integration of structural-function coupling and risk-adaptive optimization mechanisms.
Ecological source identification
-
The dual-source identification approach comprised two complementary components:
(a) FESs were derived from four key ESs: habitat quality (HQ), water yield (WY), soil conservation (SC), and carbon storage (CS). The InVEST model quantified HQ, WY, and SC through process-based modeling[42], while NPP served as a proxy for CS[43]. For complete methodological details, refer to section S1 'Calculation of ecosystem services' in the Supplementary File 1. All indicators underwent min-max normalization and spatial summation to construct comprehensive ecosystem services (CESs), and natural breaks classification was used to determine ecosystem service thresholds (Supplementary Table S2). FES patches < 10 km2 were excluded to meet minimum habitat area requirements[44,45].
(b) SESs were identified via the MSPA model using seven landscape classes: Core, Islet, Perforation, Edge, Loop, Bridge, and Branch[46−48] (detailed metrics in Supplementary Table S3). Core areas (≥ 10 km2) were prioritized as primary SES due to their critical role in maintaining landscape connectivity and supporting meta-population dynamics[49].
Construction of comprehensive resistance surface
-
Ecological resistance reflects the barriers species encounter during migration and is critical for understanding landscape connectivity[50−52]. In this study, a comprehensive resistance surface was constructed by integrating natural and anthropogenic disturbance factors (Supplementary Table S4). Resistance factors were classified into five levels using the natural breakpoint method (Supplementary Fig. S1), with weights assigned through entropy weighting and GeoDetector analysis, as detailed in the Supplementary File 1.
Ecological security patterns construction based on circuit theory
-
Ecological resistance, represented as circuit resistance, and ecological flow, characterized as stochastic drift current, provide insights into species' stochastic migration patterns[53,54]. Pinch points, which are crucial for species migration and energy flow, enhance landscape connectivity. Using circuit theory, we constructed resistance surfaces to identify biotic migration pathways and ECs. The pinch point mapper tool was employed to detect corridors, treating them as conductive surfaces and ecological sources as nodes. Detailed methodologies and parameters are provided in the Supplementary File 1.
Ecological network topology calculation
-
Using complex network theory, ecological sources were modeled as nodes and corridors as edges. Node importance was quantified using three centrality metrics: degree centrality (DC), closeness centrality (CC), and betweenness centrality (BC). The topological structure of the network was computed using MATLAB. Node indices were normalized, and weights were assigned using the minimum redundancy maximum relevance (mRMR) method, which maximizes feature-target correlation while minimizing redundancy to enhance model generalization[55]. The comprehensive importance (CI) of each ecological patch was calculated based on the normalized centrality metrics with assigned weights. Stability, defined as the network's ability to maintain performance under uncertainty, was evaluated. The PEC, an optimized supplement to existing ECs, was assessed for its network topology and connectivity robustness. Detailed formulas are provided in the Supplementary File 1.
Determination of the range of ecological corridors
-
Delineating ECs is critical for facilitating species migration and resource connectivity[56,57]. To optimize corridor width configurations, this study employs GAs and spatial risk analysis. GAs mimic natural selection, iteratively optimizing solutions to balance ecological connectivity with risk impacts. Spatial risk analysis evaluates the average risk value (AR) of each corridor, classifies them based on length, and assigns adaptability weights. This approach integrates ecological risks, economic costs, and width uniformity, minimizing overall risk and cost via an objective function while maintaining consistent corridor width.
Construction of the landscape ecological risk model
-
The landscape ecological risk model provides a framework for assessing ecological risks based on land use. The study area was divided into 15 km × 15 km grid units, resulting in 2,651 evaluation units. Landscape pattern indices were calculated to analyze ecological risks, and the landscape ecological risk index (ERI) was developed as follows:
$ ER{I_i}{\text{ = }}\sum\nolimits_{i = 1}^N {\dfrac{{{A_{ki}}}}{{{A_k}}} \times {D_i}} \times {V_i} , $ (1) where, i is the landscape type, with higher values indicating greater ecological risk. Aki is the area of landscape type i in the kth risk district, Ak is the total area of the k-th risk district, and N is the number of landscape types. Di represents the landscape disturbance index, and Vi represents the landscape vulnerability index. The calculation method for Di and its parameters is detailed in Table 2. Based on previous studies[58,59], and the ecological characteristics of the study area, the normalized vulnerability indices for cropland, grassland, shrubland, forest, urban area, water body, and bare land were 0.179, 0.143, 0.107, 0.071, 0.036, 0.214, and 0.25, respectively.
Table 2. Landscape pattern indices and their significance
Index name Computing formula Parameter description Landscape disturbance index (Di) $ {D_i} = a{F_i} + b{S_i} + c{E_i} $ (2) Weights: a = 0.5, b = 0.3, c = 0.2 Landscape fragmentation index (Fi) $ {F_i} = \dfrac{{{n_i}}}{{{A_i}}} $ (3) ni: patch count of the land use type i; Ai: total area of land use type i Landscape separation index (Si) $ {S_i} = \dfrac{A}{{2{A_i}}}\sqrt {\dfrac{{{n_i}}}{{{A_i}}}} $ (4) Where, ni is the patch count of the A: total area of the study region Landscape fractal dimension index (Ei) $ {E_i} = \dfrac{{2\ln \left(\dfrac{{{p_i}}}{4}\right)}}{{\ln ({A_i})}} $ (5) pi: proportion of patch count of land use type i to total patch count Identification of ecological corridor widths using GAs
-
This study employs GAs to optimize EC widths, aiming to achieve a multi-objective balance and determine the optimal width configuration. GAs' parameters are detailed in the Supplementary File 1. To allocate risk values (RV) to each corridor, the coordinate points of vector corridors were spatially overlaid with the risk raster to extract RV for all points along each corridor. The AR was calculated as follows:
$ A{R_i} = \dfrac{1}{N}\sum\nolimits_{j = 1}^N {R{V_{ij}}} $ (6) where, i is the corridor index, N is the total number of path points in the i-th corridor, and RVij is the risk value of the jth grid point within the i-th corridor.
The study formulates an objective function that averages RV, total cost (TC), and variation coefficient of width (CW) balance considerations, and optimizes the corridor width to minimize the value of this objective function. Refer to the Supplementary File 1 for the relevant formulas and parameter settings.
$ \mathop {\min }\limits_W OF = {w_1} \cdot A{R_{{\text{norm}}}} + {w_2} \cdot T{C_{{\text{norm}}}} + {w_3} \cdot C{W_{{\text{norm}}}} $ (7) where, w1, w2, and w3 are the weights of AR, TC, and CW, respectively, with values of 0.7, 0.2, and 0.1. The subscript 'norm' denotes post-processed formulations, with the complete processing workflow documented in the Supplementary File 1.
Scenario development and assumptions
-
Future land-use scenarios (SSP119-2030, SSP245-2030, SSP545-2030) were developed based on the 1 km land-use data[39]. SSP119 represents a low-emission pathway characterized by stringent climate policies; SSP245 reflects a moderate mitigation scenario with intermediate emission levels; and SSP545 depicts a high-emission, fossil-fuel-driven trajectory. These scenarios were specifically extracted for the SRB and harmonized with the 2020 land use data to ensure temporal and spatial consistency across the dataset.
-
The spatial distribution of ESs for 2020 and future scenarios (SSP119-2030, SSP245-2030, SSP545-2030) is shown in Supplementary Fig. S2. High-value ESs were predominantly distributed in the eastern and western mountainous regions, particularly in high-altitude areas such as the IIA region, whereas the central plains exhibited relatively lower values (Supplementary Fig. S3). Under future scenarios, WY and SC remained relatively stable, while CS and HQ demonstrated a declining trend, especially under SSP545, where accelerated economic growth resulted in extensive habitat degradation and an expansion of low-value areas. Conversely, SSP119 effectively mitigated this degradation, maintaining higher ES levels through the implementation of ecological prioritization strategies. High levels of FES in 2020 were concentrated in forest-rich areas, including the Greater Khingan Mountains and IIA region, while the grassland- and cropland-dominated central plains exhibited weaker CESs due to lower CS and SC capacities. SSP119 preserved forest integrity and ecological connectivity, whereas SSP245 and SSP545 led to the progressive deterioration of ecological functions in central regions. Based on MSPA analysis, the core area of the SRB covered 150,956 km2 (59.4%) in 2020 (Supplementary Table S5). By 2030, the core area expanded under all scenarios, most significantly under SSP119 (209,509 km2, 75.4%), indicating enhanced habitat connectivity. In contrast, SSP245 and SSP545 exhibited more limited core area expansion, reflecting the adverse ecological consequences of intensified development. Similarly, the integrated ecological source (IES) area increased from 158,437 km2 in 2020 to 220,056 km2 under SSP119-2030, but remained restricted under SSP245 and SSP545 (around 180,880 km2) due to increased land use intensity and fragmentation impeding ecological connectivity.
A resistance surface was constructed, integrating natural and socio-economic factors to reflect spatial heterogeneity across scenarios. The mean resistance values were 3.13 (2020), 3.04 (SSP119-2030), 3.14 (SSP245-2030), and 3.14 (SSP545-2030). High resistance areas were concentrated in urbanized and agriculturally intensive zones in the central and southeastern regions, while forested and less disturbed areas in the northwest and east showed lower resistance (Fig. 3). Resistance remained stable under SSP119 due to ecological policies, while SSP245 and SSP545 saw increases driven by urban expansion and land-use changes. Based on the circuit theory, 498 ecological corridors (totaling 18,136 km) were identified in 2020. Under SSP119-2030, the number of corridors declined to 471 (totaling 14,985 km), indicating improved connectivity. In contrast, SSP245 and SSP545 showed more corridors (513 and 557, respectively), but with greater fragmentation, particularly under SSP545 in urban areas. Key ecological nodes in 2020 included 19 pinch points (covering 231 km2) and 200 barrier points (covering 745 km2), which decreased under SSP119 but increased under SSP245 and SSP545, reflecting rising ecological stress.
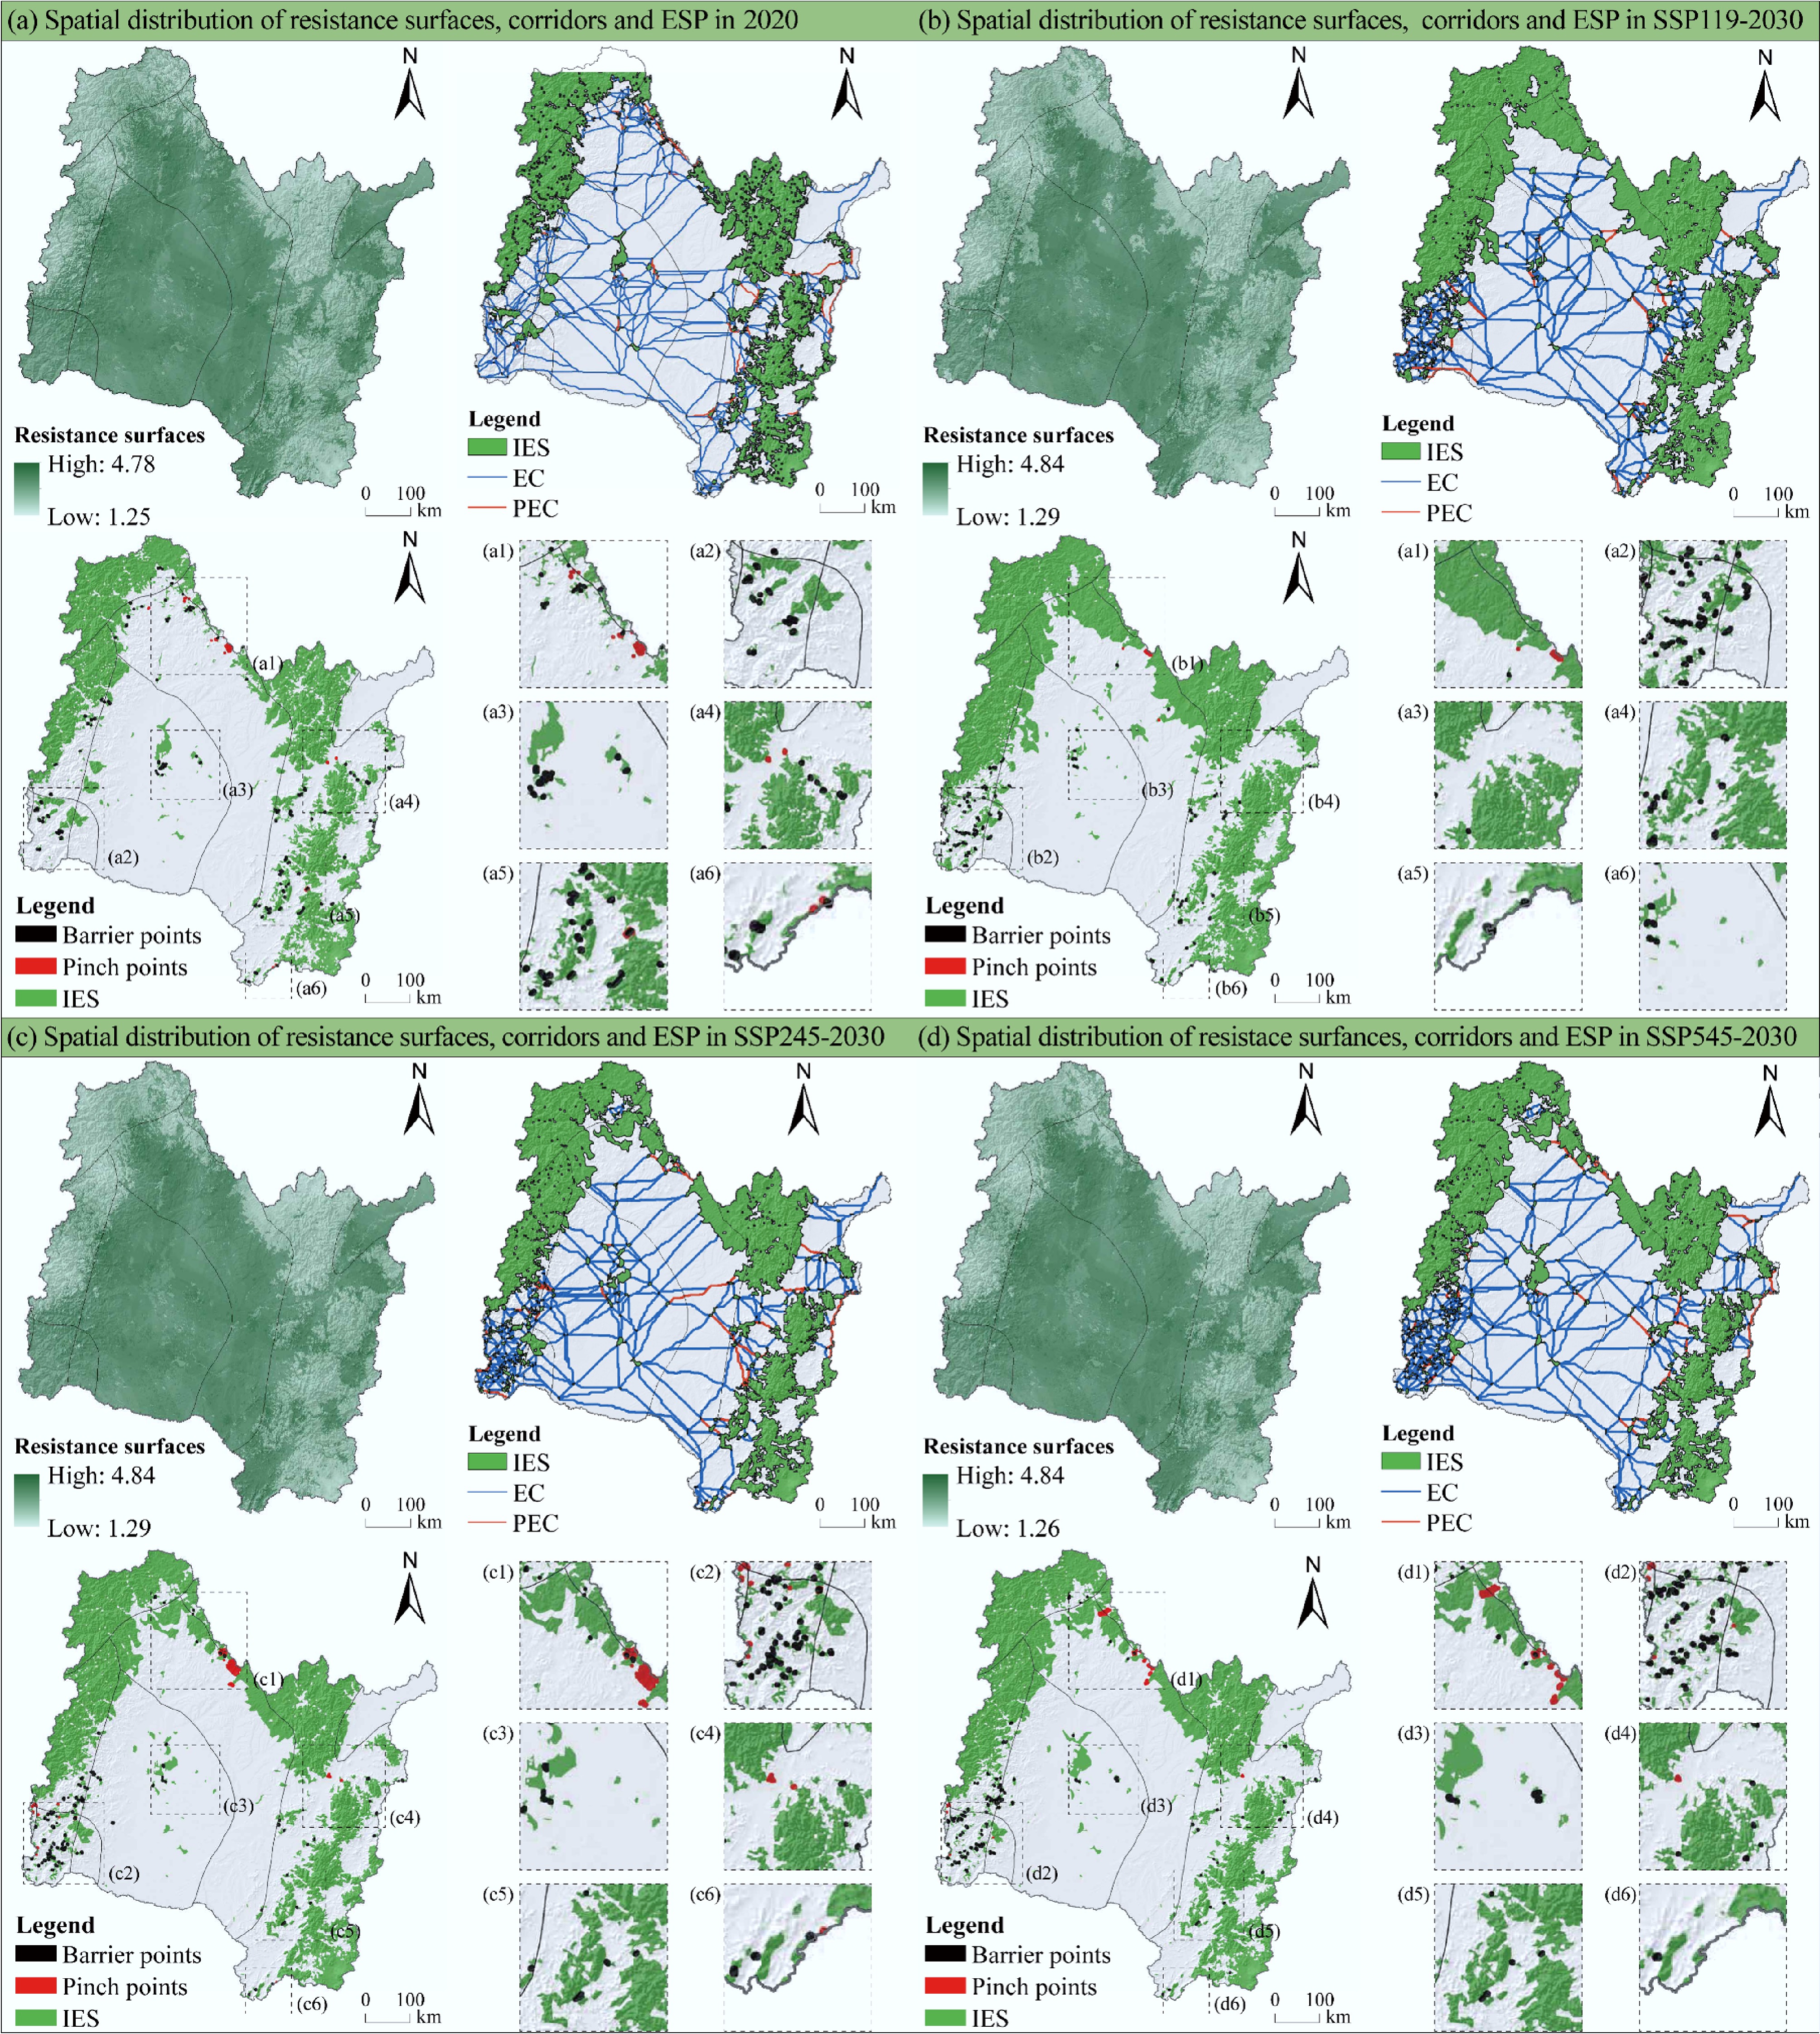
Figure 3.
Spatial distribution of resistance surfaces, corridors and the ESPs in the SRB. Panels (a)–(d) represent the years 2020, SSP119-2030, SSP245-2030, and SSP545-2030, respectively. ECs and PECs were identified using resistance surface methodology, and the specific locations of ecological pinch points and barrier points were analyzed. Panels (1)–(6) provide an enlarged view of these critical ecological pinch points and barrier points.
Relationship between ecosystem services and ecological network topology
-
This study examines the optimization of ecological networks by supplementing PEC to enhance connectivity and robustness across 2020 and three future scenarios (SSP119-2030, SSP245-2030, and SSP545-2030). Before optimization, the spatial distribution of CI was highly uneven, with mean CI values of 56.59 (2020), 48.04 (SSP119), 53.37 (SSP245), and 57.66 (SSP545), indicating strong dependence on limited core nodes and heightened vulnerability to disturbance (Table 3). Following optimization, CI distribution became more balanced, with slightly reduced average values, suggesting a dispersion of ecological pressure and improved network resilience.
Table 3. Mean values of the ecological network topology indicators
Indicator 2020 SSP119-2030 SSP245-2030 SSP545-2030 EC EC + PEC EC EC + PEC EC EC + PEC EC EC + PEC DC 5.08 5.68 5.29 5.58 5.21 5.66 5.30 5.65 CC 0.23 0.26 0.23 0.24 0.21 0.23 0.21 0.22 BC 189.92 189.32 171.71 171.42 190.79 190.34 203.70 203.35 CI 56.59 56.41 48.04 48.09 53.37 52.43 57.66 56.13 Figure 4 illustrates the changes in robustness curves of the ecological network under random and targeted attacks for 2020 and three future scenarios (SSP119-2030, SSP245-2030, SSP545-2030). Before optimization, the network was highly vulnerable to targeted attacks, with connectivity dropping sharply once the attack rate exceeded 40%–50%. Under random attacks, connectivity declined more gradually. Following optimization, robustness against targeted attacks improved significantly, especially in the SSP245-2030 scenario, where connectivity remained high even under attack rates exceeding 60%. In the 2020 scenario, the network showed lower robustness to targeted attacks compared to edge attacks, while random attacks had a relatively minor impact. After optimization, robustness against targeted attacks increased, and the decline rate due to random attacks slowed (Supplementary Fig. S4). In SSP119-2030 and SSP545-2030, network connectivity still dropped sharply when the attack rate exceeded 40%–50%, regardless of optimization. In contrast, the SSP245-2030 scenario demonstrated significant improvements, maintaining high connectivity even at elevated attack rates.
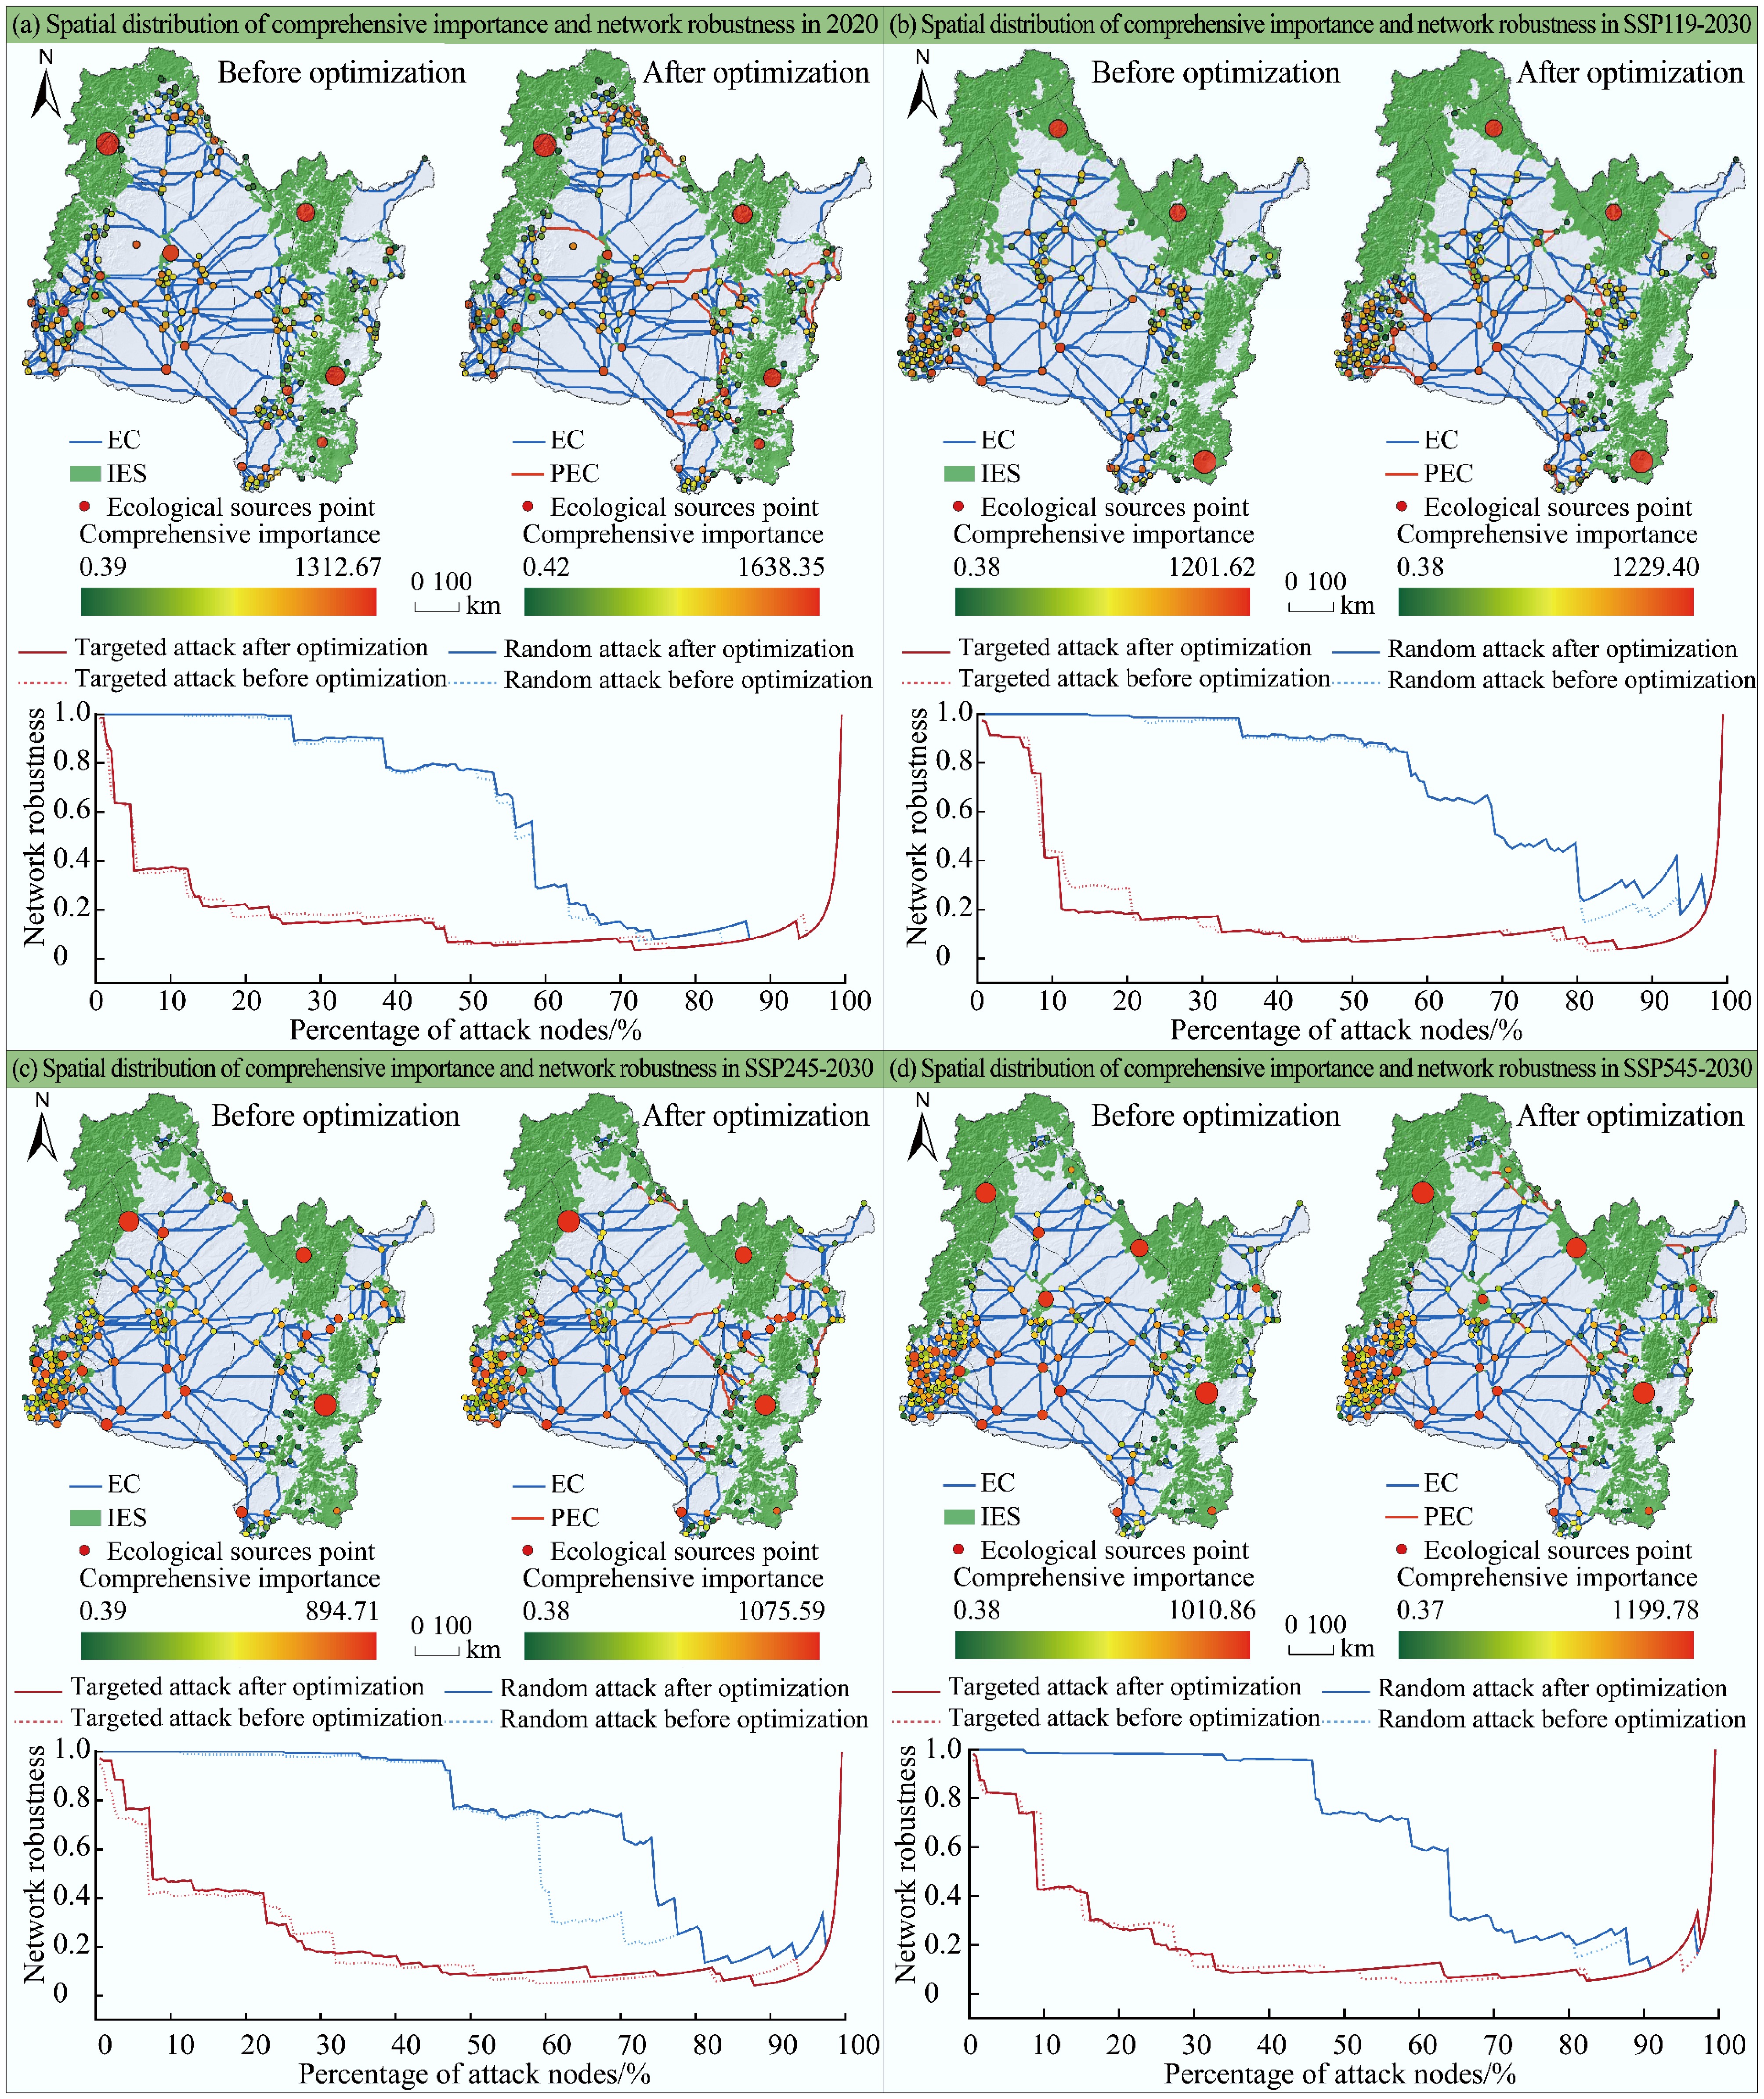
Figure 4.
Spatial distribution of CI and ecological network robustness in the SRB. Panels (a)–(d) represent the years 2020, SSP119-2030, SSP245-2030, and SSP545-2030, respectively. The figure compares overall importance metrics before and after optimization and evaluates the robustness of the ecological security network under both intentional and random attacks in the before and after optimization scenarios.
Ecological corridors risk assessment and width optimization
-
Based on their lengths, ECs were categorized into four groups: short, medium, long, and extra-long. Each corridor was assigned a fitness weight corresponding to its length category, and its width was optimized using GAs to achieve an optimal balance between ecological benefits and cost-effectiveness. The spatial distribution of ecological risks is shown in Supplementary Fig. S5. In 2020, the average risk for short ECs was 0.028, with an initial optimized width of 696.79 m. After optimization, the average risk remained at 0.028, while the optimized width decreased to 632.23 m (Fig. 5). This suggests that enhanced connectivity through PECs allows for narrower corridors without compromising ecological functionality, improving cost-efficiency in line with the economic dimension of the CRE framework. For medium corridors, after optimization, the average risk remained at 0.032, but the optimized width decreased from 739.61 to 674.79 m, suggesting a moderate reduction in width without altering the risk value. Similarly, extra-long and long corridors experienced a minor decrease in risk from 0.036 to 0.035, accompanied by a reduction in width from 586.36, and 706.62 m to 537.80, and 630.91 m, respectively.
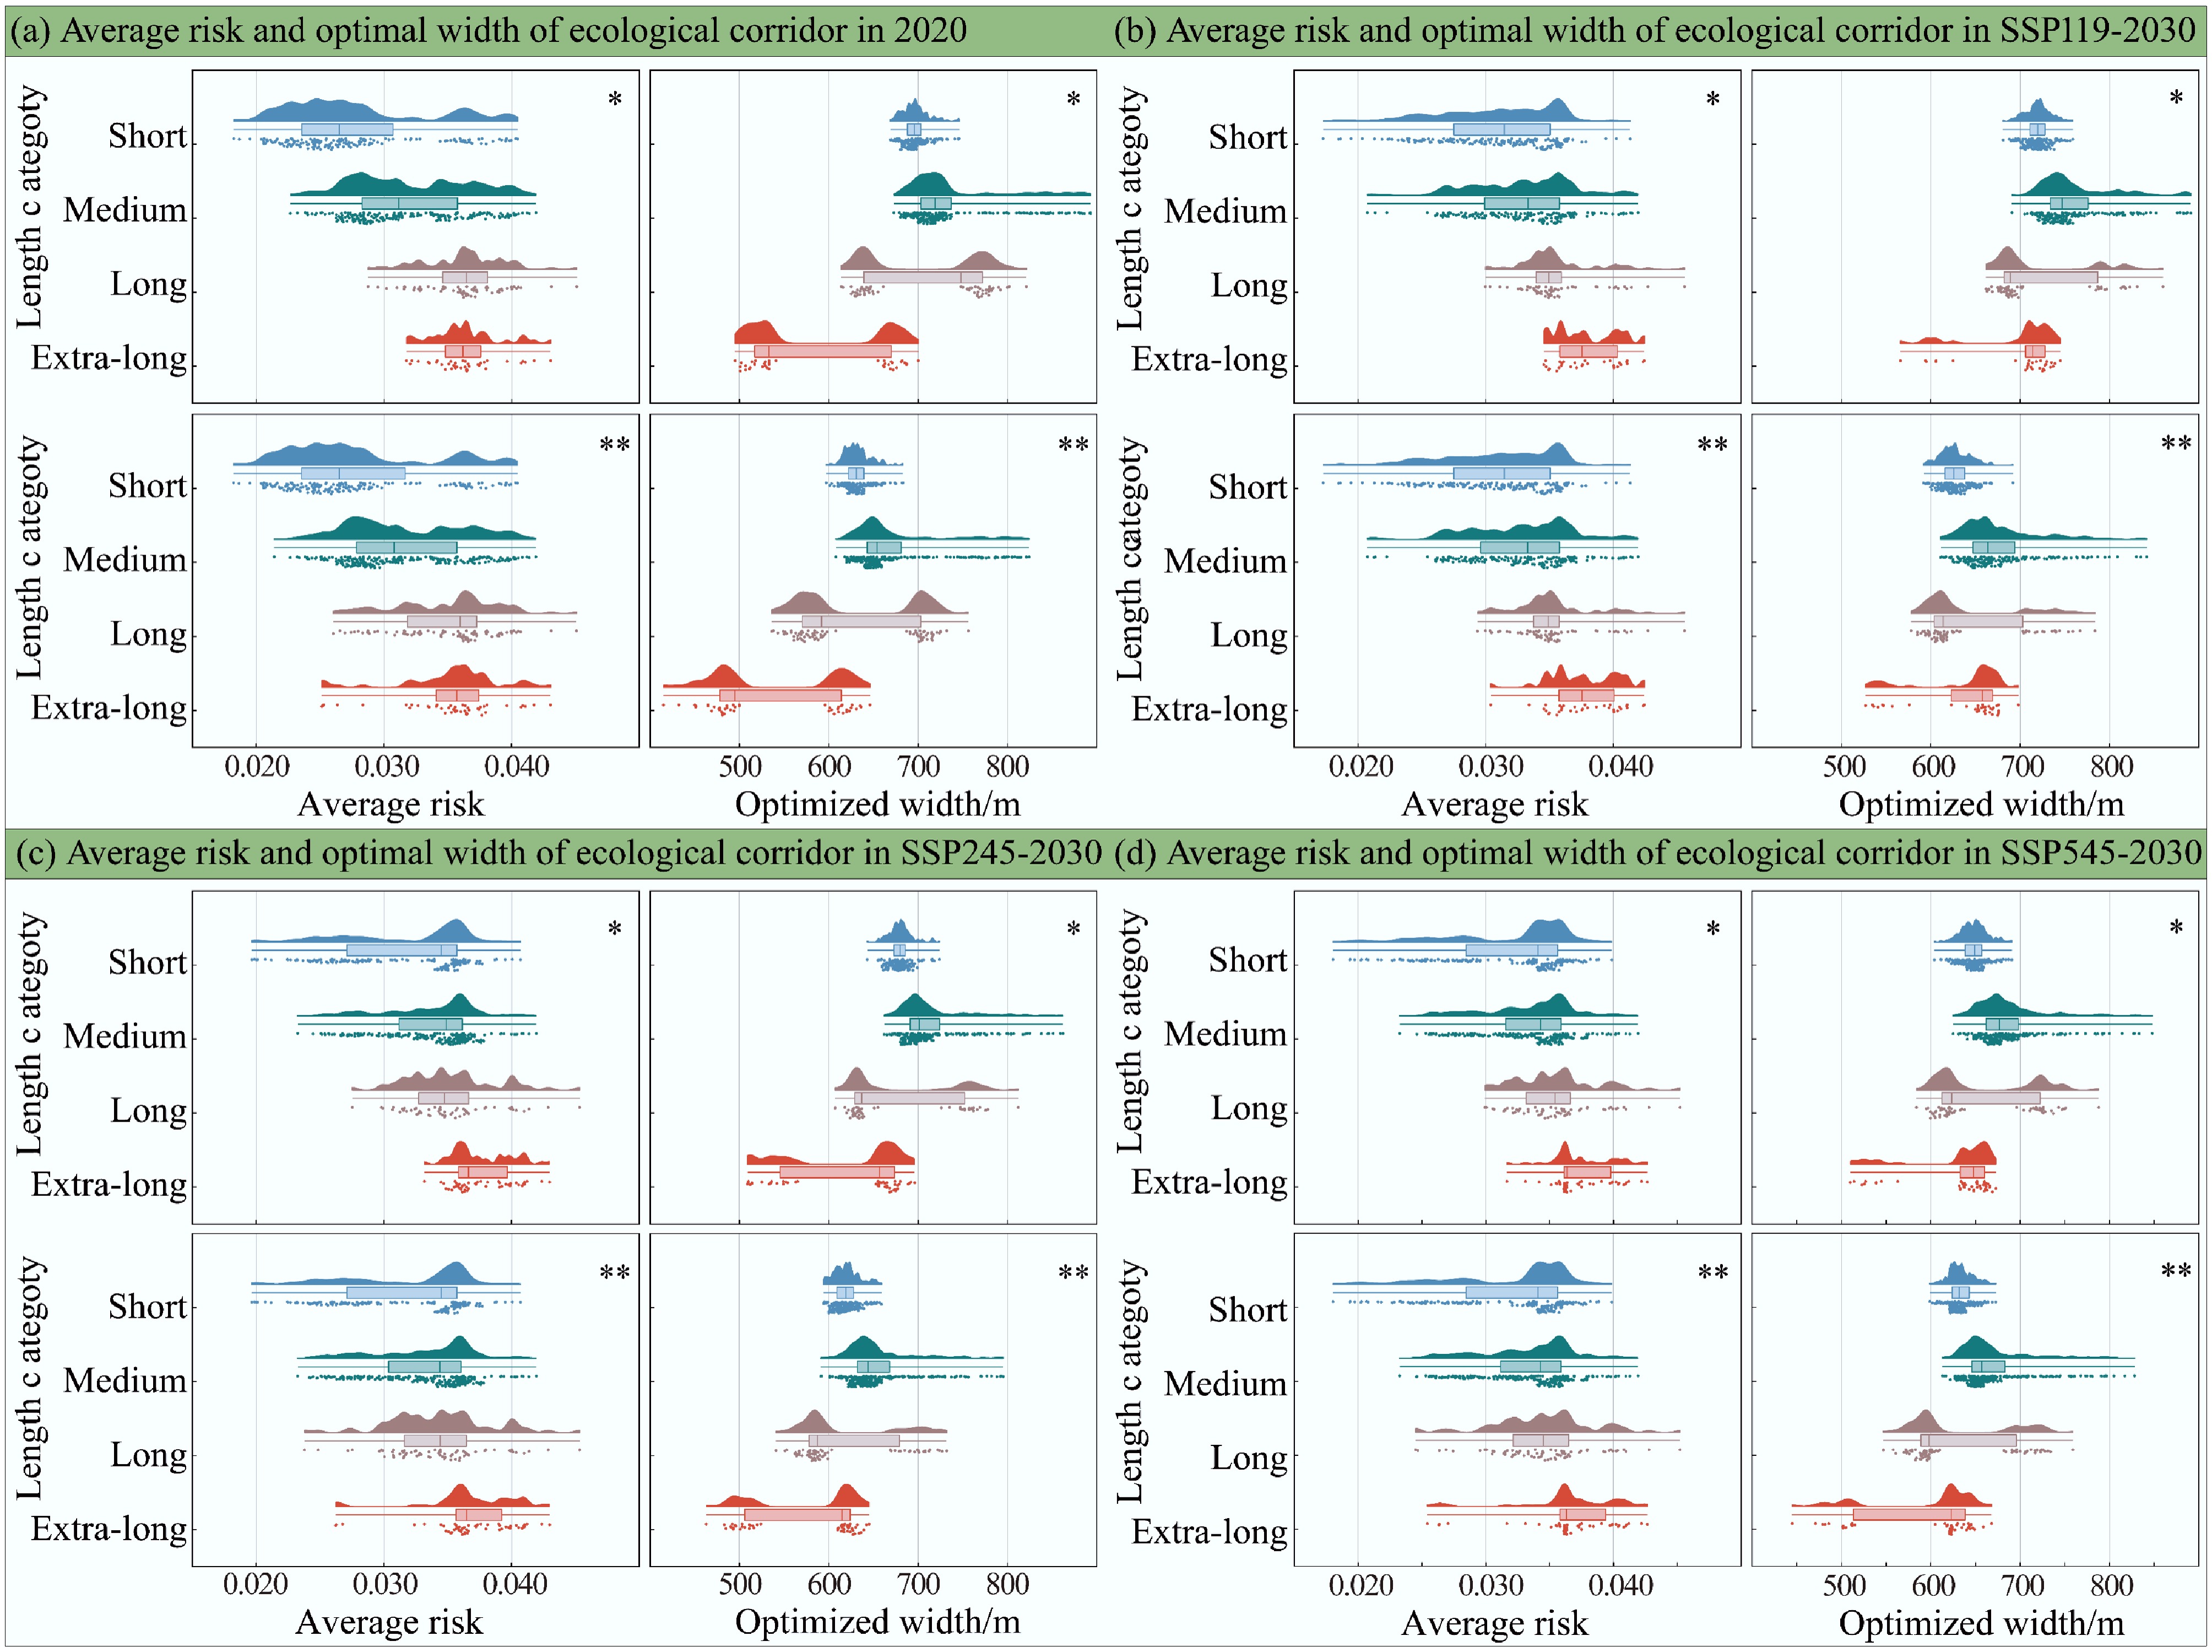
Figure 5.
Average risk and optimal width of ecological corridors in the SRB. Panels (a)–(d) represent the years 2020, SSP119-2030, SSP245-2030, and SSP545-2030, respectively. The figure compares the distribution of average risk and optimal corridor width both before (*) and after optimization (**).
In the SSP scenario for 2030, the average risk and optimized width of ECs exhibited significant differences following the introduction of PEC. In the low-carbon scenario (SSP119-2030), the average risk for extra-long corridors remained at 0.038 with a slight decrease, while the optimized width reduced from 696.90 to 635.49 m. Both long and medium corridors demonstrated reduced risk and adjusted widths, enhancing ecological benefits. In the medium carbon scenario (SSP245-2030), despite a slight increase in risk, the reduction in optimized width suggests that the EC network can maintain its ecological functions while requiring less width. In the high-carbon scenario (SSP545-2030), the introduction of PEC helped reduce corridor widths.
The spatial distribution of ECs across these scenarios is illustrated in Supplementary Fig. S6. In 2020, extra-long corridors predominantly occupied the central region with substantial widths, while shorter corridors were concentrated in peripheral areas. Under SSP119-2030, optimized corridor widths generally decreased, particularly for extra-long corridors, indicating enhanced efficiency in the low-carbon scenario. For SSP245-2030, medium and long corridors exhibited a clear redistribution pattern, with reduced widths reflecting the system's ability to balance risks and benefits in a moderate-carbon scenario. In SSP545-2030, despite higher overall risks, the inclusion of optimized corridors maintained connectivity with only slightly reduced widths compared to initial values.
-
The identification of ecological sources, the construction of resistance surfaces, and the extraction of ECs constitute the foundational steps in developing robust ESPs. Our findings highlight that the classification of ecological resources into FES, SES, and IES plays a pivotal role in shaping ESPs, particularly in terms of spatial distribution and network complexity (Fig. 3). These distinctions are not merely theoretical but have profound implications for the practical implementation of ecological conservation projects, as they directly influence the quantity, connectivity, and resilience of ecological networks. Despite significant advancements, ESP construction remains an evolving field, with methodological frameworks requiring further refinement to address the heterogeneity of geographic spaces. In this study, the InVEST model was employed for ecological source identification, leveraging its strengths in large-scale biodiversity and habitat condition assessment. To ensure spatial specificity and avoid oversimplification, we integrated ESs—specifically SC, WY, HQ, and CS—with eco-geographical regionalization (Fig. 3). This approach ensures a balanced representation of ecological sources across diverse zones, capturing the multifunctionality of ecosystems. Complementing this, we utilized the MSPA model, building upon the foundational work of Ortega et al.[54] and Almenar et al.[60]. The MSPA approach provides critical insights into the spatial relationships among ecological resources, enabling the identification of key areas essential for maintaining ecosystem connectivity and morphological stability. Compared to previous research[61], the present study not only identifies analogous ecological sources but also introduces a more robust ESP framework, emphasizing functional, structural, and composite attributes. The synthesis of spatial outputs from both models strengthens decision-making for ecosystem management[62] and establishes a reliable basis for integrating factors beyond ecological connectivity.
Trade-offs and synergies in ecosystem services
-
ESs exhibit complex interconnection mechanisms characterized by trade-offs and synergies[63,64]. The present analysis reveals a consistent trade-off between WY and HQ, while CS and HQ demonstrate a synergistic relationship with an increasing correlation (Supplementary Table S6). Notably, the relationship between WY and CS has transitioned from synergy to a trade-off, reflecting the dynamic nature of ES interactions under varying environmental conditions. These findings align with established ecological principles, where high soil and water retention are associatedwith efficient water conservation and enhanced vegetation carbon sequestration[65]. The intricate relationship between HQ and water conservation is highly context-dependent, influenced by local climate, geography, and ecosystem characteristics. WY is predominantly governed by soil type, elevation, slope, and precipitation regimes. It was observed that HQ degradation is strongly correlated with soil conditions prone to water loss, excessive slope gradients, and precipitation extremes. The positive correlation between vegetation CS and HQ underscores the importance of optimal ecosystem conditions for vegetation growth.
Habitat resistance and ecological corridor construction
-
The ecological resistance surface analysis demonstrates a significant inverse relationship with HQ (p < 0.01), consistent with previous findings[66,67]. This relationship indicates that higher-quality habitats present lower resistance to animal movement, a critical consideration in corridor design. The construction of ECs is widely recognized as an effective method to enhance landscape connectivity, which heavily relies on accurate estimates of landscape resistance. Given that resistance is influenced by multiple factors, the responses of ecosystems to anthropogenic pressures are correspondingly sensitive.
The study area, located in the northeast of China, experiences a seasonal snowy period[68], necessitating special consideration of snow-related resistance factors. Snow accumulation significantly impacts animal migration patterns through increased energy expenditure and reduced mobility[69]. Traditional resistance surface construction methods often suffer from subjective weighting or neglect of spatial factors, leading to inaccurate landscape resistance characterization. To address these limitations, GeoDetector analysis was employed, which offers superior capabilities in measuring spatial heterogeneity, identifying explanatory factors, and analyzing variable interactions. Compared to conventional statistical methods, GeoDetector provides enhanced analytical power and more robust causal inference, particularly in complex two-dimensional spatial distributions[70]. By employing a combination of entropy weighting and GeoDetector analysis, a more effective methodology was developed for determining weighting factors for the resistance surface. This integrated approach not only improves the accuracy of resistance surface construction but also enhances our understanding of the spatial dynamics influencing landscape connectivity. The resulting resistance surface exhibits both spatial autocorrelation and divergence, reflecting the complex interplay of environmental and anthropogenic factors in shaping ECs.
Ecological corridor optimization and corridor width determination
-
To address the challenges of constructing ecologically functional and cost-effective corridor networks, this study proposes an integrated CRE framework to guide the optimization of ECs and the determination of their widths. The CRE framework focuses on three core dimensions: enhancing species dispersal connectivity by providing alternative migration pathways, mitigating exposure to ecological risks through strategic corridor design, and maximizing economic efficiency by balancing costs with ecological benefits. By incorporating potential corridors into the network, its complexity is increased, thereby facilitating species migration under varying environmental conditions (Fig. 6). This enhancement not only enhances overall connectivity but also bolsters the network's resilience against environmental changes and anthropogenic disturbances[71]. To model species movement more accurately, circuit theory was employed, which simulates stochastic wandering behavior, offering a more realistic representation compared to the deterministic paths assumed in MCR models. Furthermore, complex network theory was utilized to evaluate and optimize the topology of ecological networks[72]. Key topological metrics—DC, CC, and BC—were calculated to quantitatively assess the importance of each ecological source node within the network. To ensure a balanced and non-redundant evaluation, an mRMR approach was employed to determine the weights associated with these metrics[73]. This comprehensive assessment enables the identification of critical nodes and corridors that are essential for maintaining network connectivity and functionality. The effectiveness of this optimization method is evidenced by the improved stability and connectivity of the ecological network, as demonstrated by robustness analysis under both random and targeted attack scenarios[19,74−76]. The optimized network exhibits high resilience, maintaining stability even with an increasing proportion of removed nodes.
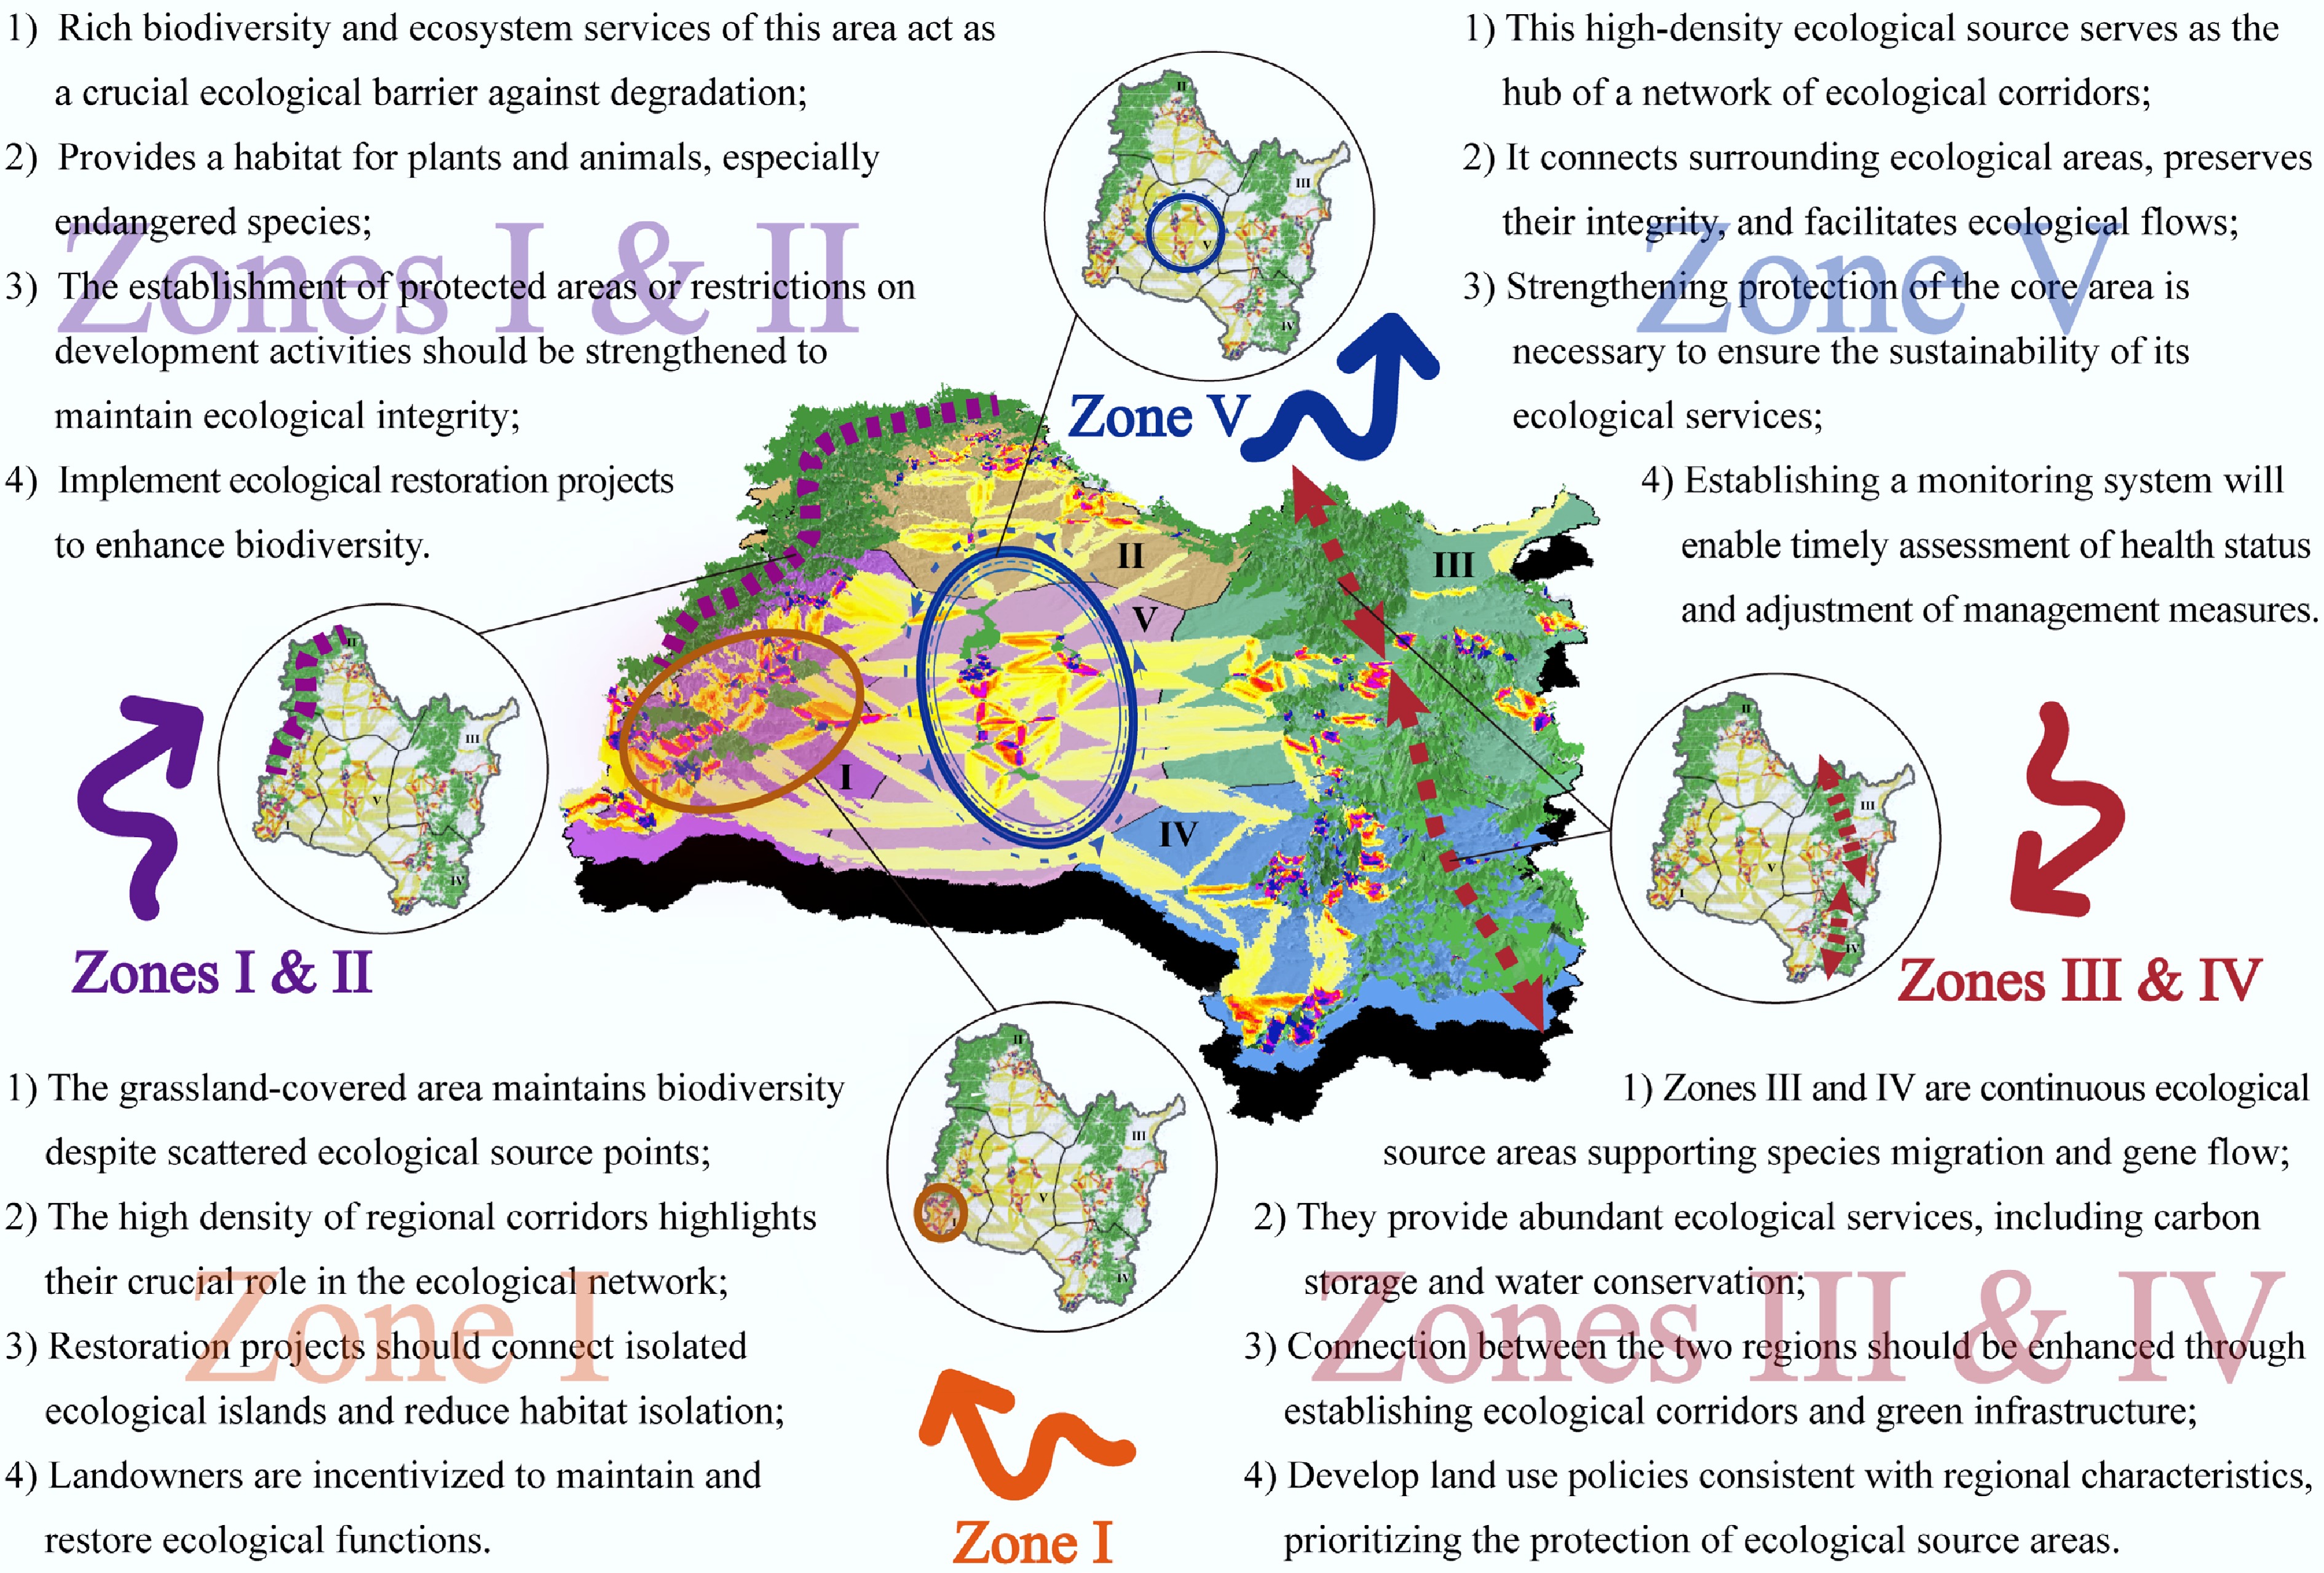
Figure 6.
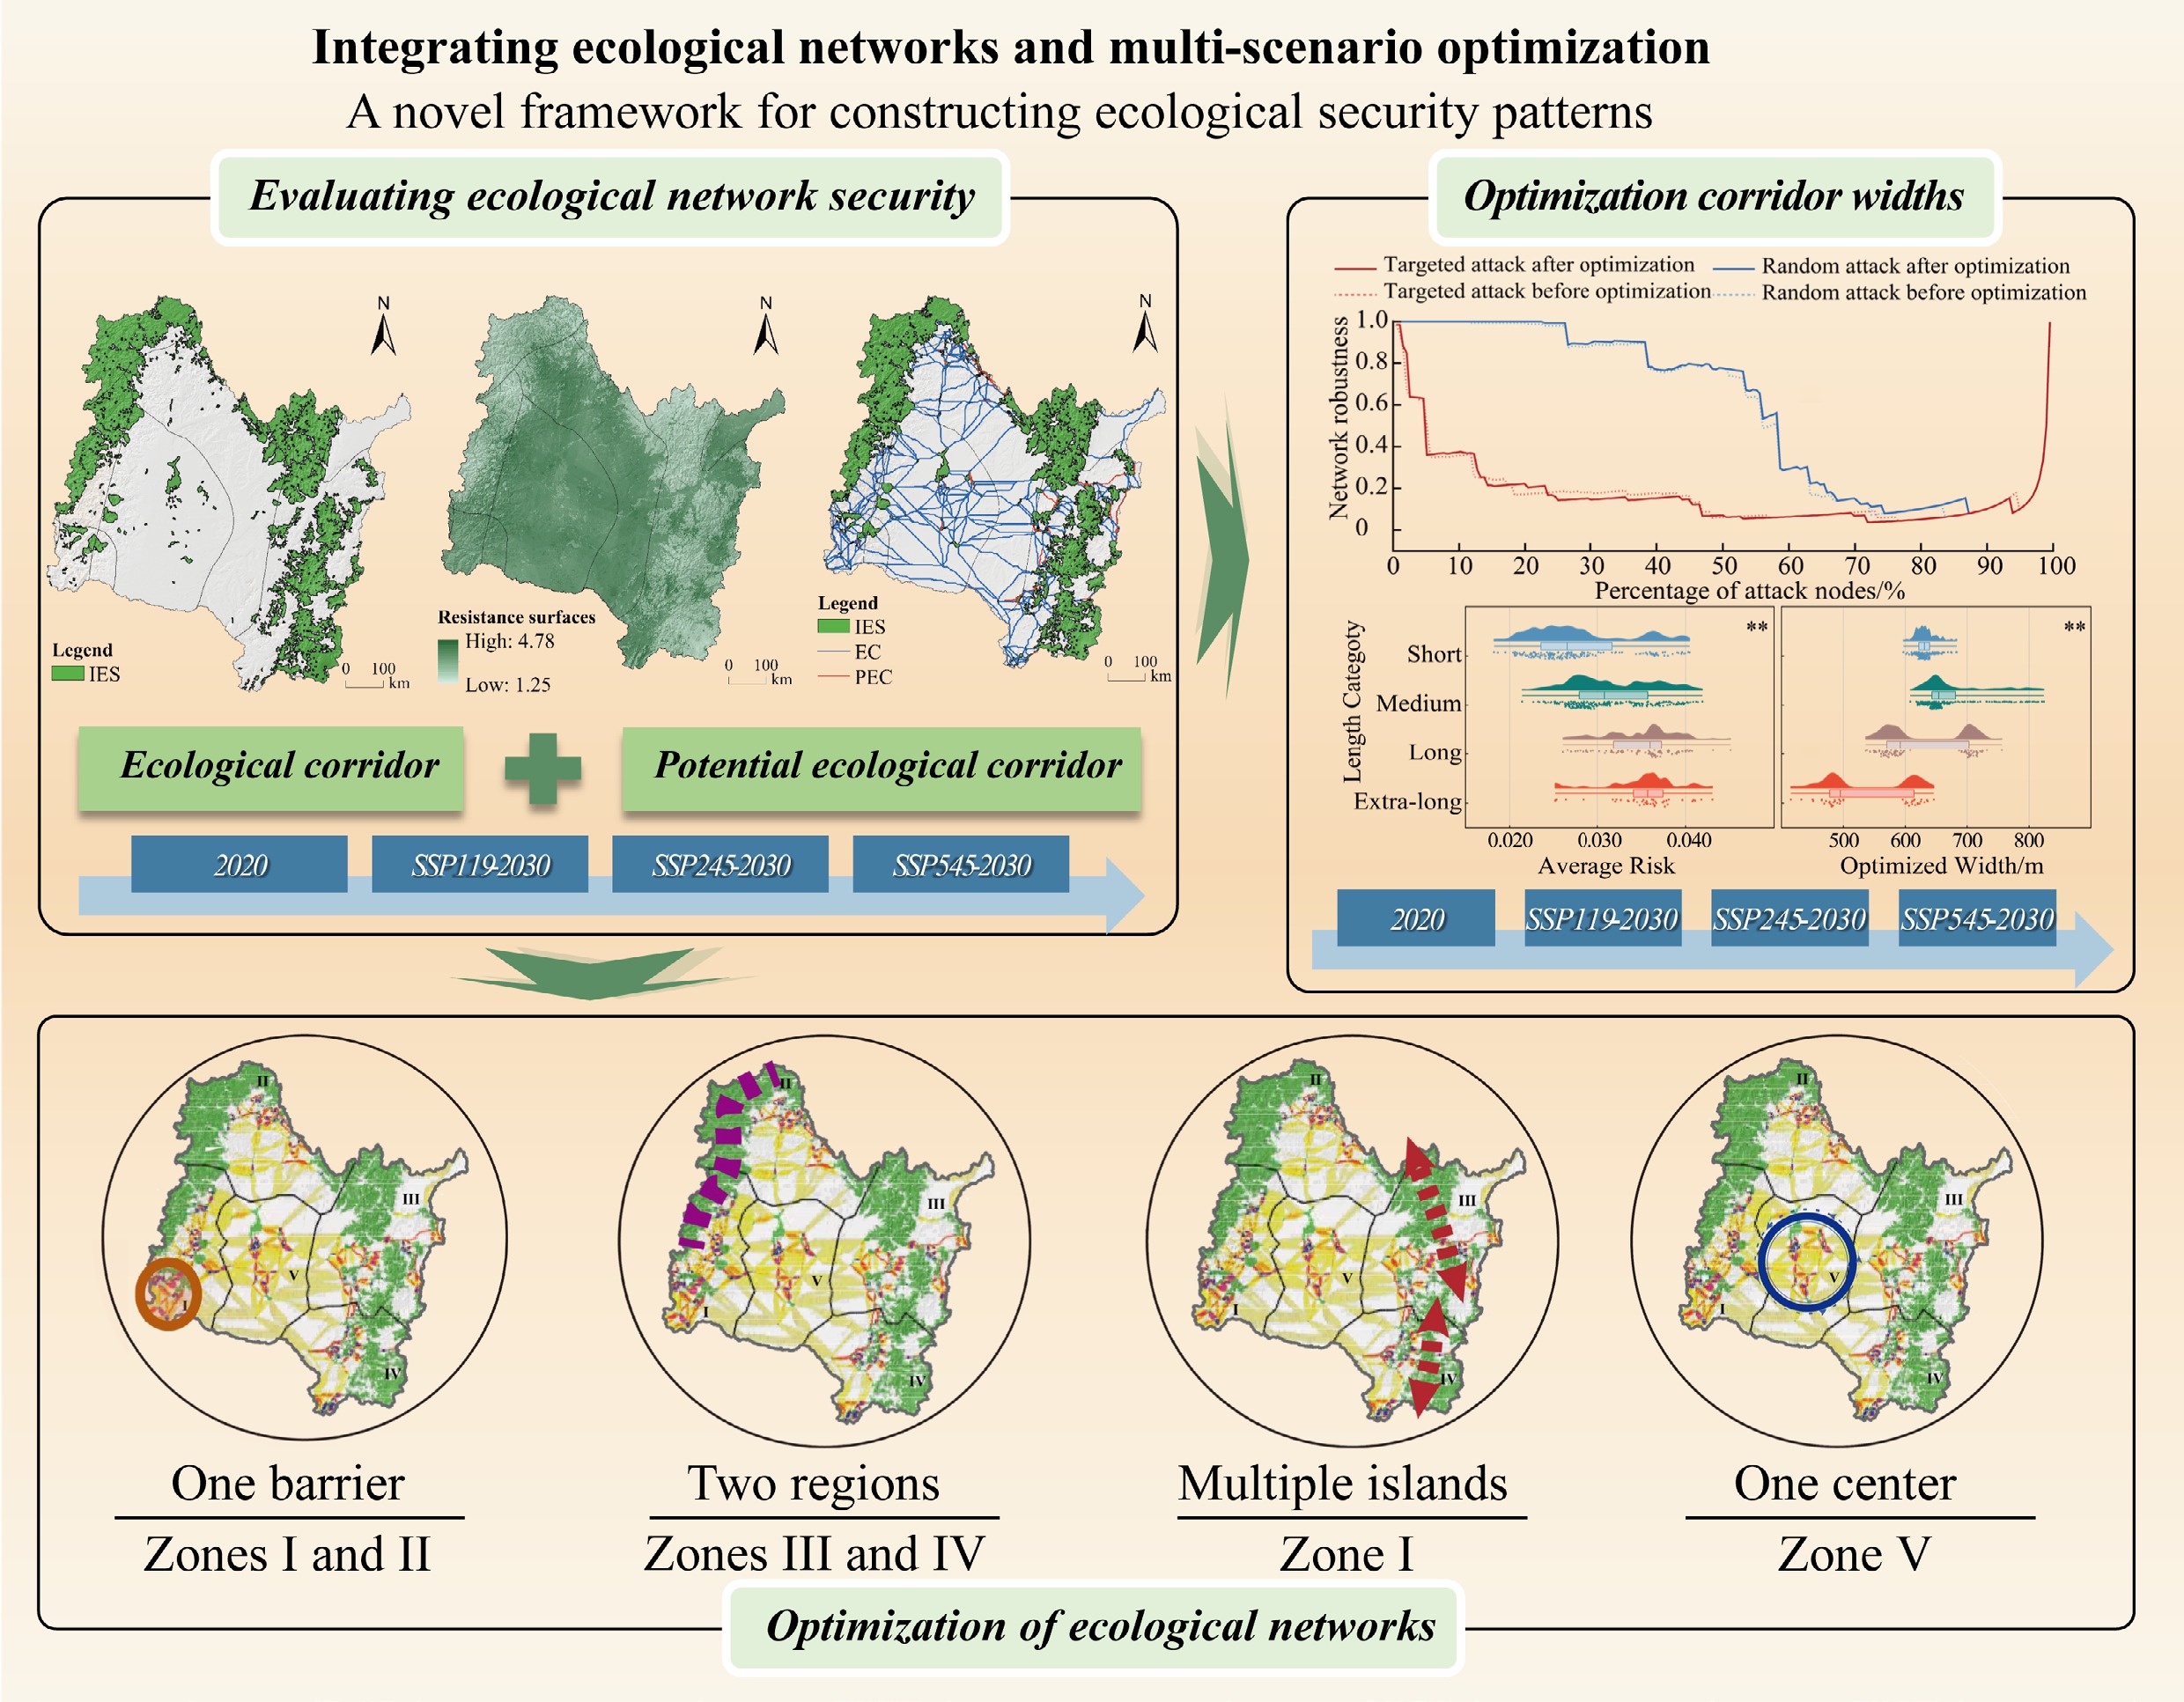
Ecological security optimization patterns in the SRB. An ecological security barrier, referred to as the 'One barrier', was established between zones I and II. Two ecological source regions, termed the 'Two regions', were identified in zones III and IV, respectively. Numerous fragmented ecological source islands, designated as the 'Multiple islands', were observed in zone I. In the center of zone V, a dense ecological source with high current density was identified, forming the intersection center of ECs, referred to as the 'One center'.
EC construction is pivotal for facilitating species migration and maintaining ecological integrity, thereby safeguarding ecological security and promoting resource recovery[77]. Corridor width, often overlooked in conventional studies, was optimized within the CRE framework using a GA[78,79]. Unlike previous studies that primarily focused on corridor delineation[80] or utilized circuit theory to establish corridor width thresholds[48,81], the objective function of the GA minimizes both ecological risk and economic cost while ensuring width uniformity for enhanced management feasibility. In this study, GAs were integrated with spatial risk zone analysis to develop a novel optimization strategy. By evaluating the AR of each corridor through spatial risk analysis and classifying them based on their length, adaptive weights were assigned accordingly. This approach generates corridors with more adaptive morphology, greater structural redundancy, and better alignment with dynamic ecological and socio-economic pressures. Overall, the CRE framework provides a comprehensive and scalable solution for ecological corridor design, supporting biodiversity conservation and ecological resilience while balancing risk and cost.
Optimal scheme of ecological security patterns
-
In this study, the k-means clustering algorithm was employed to classify ecological source points into five distinct categories based on the CI. These categorized ecological source points were subsequently utilized to construct Thiessen polygons (Supplementary Fig. S7). Building upon the distinct characteristics, current status, and projected development trajectories of each functional zone, a comprehensive strategic framework for the SRB, was established characterized as 'one barrier, two regions, multiple islands, and one center' (Fig. 6). The 'one barrier' refers to the robust ESs and rich biodiversity in the elevated western region of the SRB, which acts as a crucial ecological barrier between zones I and II. The 'two regions' encompass two extensive and contiguous ecological source areas located in zones III and IV, functioning as essential ecological pillars that uphold ecological security along both sides of the main stream of the Songhua River. The 'multiple islands' represent fragmented grassland-dominated ecosystems within zone I, predominantly located in the southwestern part of the SRB, which exhibit high current density. Optimization of these ESPs is crucial for enhancing biodiversity, pollination services, soil fertility, and water regulation[82]. Finally, the 'one center' signifies a densely populated ecological source area with high current density in zone V. This central hub forms an interconnected network, creating a complex web-like structure that ensures landscape connectivity while maintaining overall ecological integrity[83]. Collectively, this zoning framework facilitates the differentiated and spatially explicit implementation of the CRE strategy, effectively guiding corridor optimization and policy formulation across diverse ecological and development contexts.
Comparison of future ecological scenarios
-
In this study, the impacts of alternative future scenarios (SSP119-2030, SSP245-2030, and SSP545-2030) on the ecological-security network were simulated. The results reveal significant differences in the effectiveness of conservation strategies across these pathways. Specifically, the low-emission scenario (SSP119) markedly slows ecological degradation and sustains higher levels of ES provision compared with the high-emission scenarios (SSP245 and SSP545)[11]. Under SSP119, an ecological-priority strategy safeguards the integrity of forest ecosystems and enhances network connectivity. In contrast, accelerated economic growth under SSP245 and SSP545 increases land-use pressure and habitat fragmentation, leading to a decline in ecological functions and a reduction in ecosystem service values (Fig. 3). These findings demonstrate that low-emission pathways not only mitigate ecological decline but also enhance network resilience by strengthening ecological corridors and optimizing the spatial arrangement of ecological sources (Fig. 4). Consequently, future conservation policies should prioritize ecological network optimization under low-emission scenarios—particularly the protection of forests and grasslands—while incorporating strategic land-use planning and development controls to mitigate the negative effects associated with high-carbon trajectories[66].
Limitations and uncertainty
-
Despite the integrative potential of the CRE framework, several limitations and uncertainties persist in the current study that necessitate further exploration. The present approach did not comprehensively account for the trade-offs and synergies among ESs, which could potentially affect the precision of source delineation[84]. To enhance the accuracy of source site identification, future studies should examine the relationships between different ecological processes[85]. Furthermore, the selection of key ESs in this study does not encompass critical aspects such as food production, nitrogen fixation, and pollination, which may limit the comprehensiveness of the findings. Additionally, the holistic approach adopted for constructing the ESP in the SRB overlooks scale-dependent issues and fails to adequately address the differences and connections across multiple spatial scales. Future studies should focus on developing ESP frameworks at varying scales, to enable a more precise analysis of ecological security within the SRB[49]. Although circuit theory was applied to construct the ESP, future research is needed to optimize the ecological network layout to address ecological safety concerns more effectively[86].
The accuracy of ESP construction is limited by the resolution and consistency of available datasets. Specifically, enhancing model reliability requires high-precision spatial data and robust calibration methodologies. In this study, the existing ecological network was optimized by identifying potential ecological sources and constructing new corridors. For future work, integrating stakeholder engagement and empirical validation will be essential to refine the identification of potential ecological sources, reinforce vulnerable corridors, and strengthen critical ecological nodes, thereby improving the resilience and applicability of the CRE-based ecological security framework.
-
ESP construction has garnered increasing attention; however, few studies comprehensively integrate landscape connectivity, ecological risk, and economic efficiency under future scenarios. To address this gap, the CRE framework is proposed, which systematically incorporates connectivity, ecological risk, and economic efficiency for optimizing ecological networks. When applied to the SRB, a critical region in Northeast China, this framework integrates source identification, resistance refinement, and corridor delineation, thereby providing a scientific basis for guiding sustainable development in the region. The key contributions and implications of this study are as follows:
(1) Methodological advancements: the CRE framework serves as a guiding tool for ecological network optimization. By integrating the InVEST and MSPA models, this framework identifies multidimensional ecological sources, including functional, structural, and integrated aspects, thereby enhancing the comprehensiveness of ecological assessments. The incorporation of snow cover days as a resistance factor represents a significant innovation, addressing a critical gap in cold-region ESP construction. Furthermore, the application of circuit theory, mRMR feature selection, and GA optimization offers a replicable framework for ESP construction in diverse geographical contexts.
(2) Scenario-specific insights: the study reveals that future scenarios exert profound influences on ecological connectivity and environment quality. The ecological priority scenario (SSP119-2030) not only preserves ecological source integrity but also enhances landscape connectivity, underscoring the importance of proactive conservation strategies. In contrast, intensive development scenarios (SSP245-2030 and SSP545-2030) lead to increased habitat fragmentation, highlighting the trade-offs between economic development and ecological sustainability.
(3) Strategic framework for conservation: the proposed 'one barrier, two regions, multiple islands, and one center' framework provides a spatially explicit strategy for enhancing biodiversity and ecosystem services. By optimizing corridor widths through landscape risk analysis and GAs, this framework achieves a balance between ecological benefits and economic costs, ensuring robust connectivity even under significant node failures (e.g., maintaining a connectivity robustness value of 0.4 under 40%–50% node disruptions).
(4) Policy implications: the findings offer actionable insights for regional sustainability planning, emphasizing the need for scenario-specific conservation strategies. The study underscores the importance of integrating ecological network optimization into land-use planning and policy-making, particularly in ecologically sensitive and economically vital regions like the SRB.
In conclusion, this study significantly enhances the methodological foundations of ESP construction while clearly demonstrating the practical applicability of the CRE framework in achieving a balanced integration of connectivity, ecological risk management, and economic efficiency. By integrating topological network analysis into future scenario planning, the proposed framework offers a scalable, adaptive, and broadly applicable solution for ecological security planning, particularly suited to other ecologically critical regions grappling with analogous tensions between development and ecological preservation.
-
It accompanies this paper at: https://doi.org/10.48130/aee-0025-0007.
-
The authors confirm their contributions to the paper as follows: material preparation: Jia Z, Du X; data curation: Jia Z, Du X; analysis: Jia Z, Guo L, Fu Q, Liu D; draft manuscript preparation: Jia Z; writing − review & editing: Guo L, Cui S; manuscript revision: all authors. All authors reviewed the results and approved the final version of the manuscript.
-
Data used in this research are freely available. All other data (model input files and raw output files) in the study are publicly available at the Zenodo repository via https://doi.org/10.5281/zenodo.15128171.
-
This work was supported by the National Key R&D Program of China (Grant No. 2024YFD1501702), the Distinguished Youth Science Foundation of Heilongjiang Province, China (Grant No. JQ2023E001) and Young Leading Talents of Northeast Agricultural University, China (Grant Nos NEAU2023QNLJ-013 and NEAU2024QNLJ-01).
-
The authors declare that they have no conflict of interest.
-
A CRE framework was proposed to optimize ecological security pattern construction.
Snow cover days data were employed to assess ecological resistance.
Supplementing PECs significantly improves network robustness.
Corridor width was quantified through GA methods to measurable risk/cost reductions.
-
Full list of author information is available at the end of the article.
- Supplementary File 1 Supplementary materials and methods to this study.
- Supplementary Table S1 Information of each eco-geographical region of Songhua River Basin (SRB).
- Supplementary Table S2 The threshold of ecosystem services in eco-geographic regions of SRB.
- Supplementary Table S3 The class name, description, and byte values for MSPA.
- Supplementary Table S4 Ecological resistance factors, weights, and coefficients in the SRB.
- Supplementary Table S5 Area and proportion of MSPA under different scenarios.
- Supplementary Table S6 Correlation coefficients of four ecosystem services in 2020.
- Supplementary Fig. S1 Single-factor resistance surface in the SRB. In the study, the natural breaks method was used to classify each single-factor resistance surface into levels 1–5, where the first level has the lowest resistance value, and the fifth level has the highest resistance value.
- Supplementary Fig. S2 Spatial distribution of ecological source areas in the SRB.
- Supplementary Fig. S3 Spatial distribution of different ecosystem services in the SRB.
- Supplementary Fig. S4 Characteristics of ecological network stability changes after random attacks and targeted attacks on corridor in the SRB.
- Supplementary Fig. S5 Spatial distribution of ecological risk in the SRB.
- Supplementary Fig. S6 Spatial distribution of length category and optimal width in the SRB.
- Supplementary Fig. S7 Spatial distribution of Thiessen polygons ecological source point classification of the SRB in 2020.
- Copyright: © 2025 by the author(s). Published by Maximum Academic Press, Fayetteville, GA. This article is an open access article distributed under Creative Commons Attribution License (CC BY 4.0), visit https://creativecommons.org/licenses/by/4.0/.
-
About this article
Cite this article
Jia Z, Guo L, Fu Q, Liu D, Du X, et al. 2025. Integrating ecological networks and multi-scenario optimization: a novel framework for constructing ecological security patterns. Agricultural Ecology and Environment 1: e007 doi: 10.48130/aee-0025-0007 

Integrating ecological networks and multi-scenario optimization: a novel framework for constructing ecological security patterns
- Received: 28 July 2025
- Revised: 20 August 2025
- Accepted: 17 September 2025
- Published online: 13 October 2025
Abstract: Ensuring ecological security is vital for sustainability in cold regions, which face intensifying threats from anthropogenic pressures, and climate uncertainty. However, a critical gap exists in systematically integrating connectivity, economic feasibility, and climate-specific risks into ecological planning frameworks. To address this, a novel connectivity-ecological risk-economic efficiency (CRE) framework is presented to construct climate-resilient ecological security patterns (ESPs) by integrating ecosystem services (ESs), morphological spatial pattern analysis (MSPA), and using snow cover days as a novel resistance factor. Applying circuit theory, and the minimum redundancy maximum relevance method, prioritized ecological sources and corridors are identified, subsequently quantifying ecological risk using a landscape index, and evaluating economic efficiency with a genetic algorithm (GA) to minimize average risk, total cost, and corridor width variation. Results show significant spatial divergence in core areas, with prioritized sources covering 59.4% of the study area under baseline conditions, expanding to 75.4% in ecological conservation scenarios (SSP119), and contracting to 66.6% in intensive development scenarios (SSP545), while distinct ecological resistance gradients near infrastructure networks highlight intervention areas. An optimized network of 498 corridors (total length: 18,136 km) exhibits scenario-dependent width variations: 632.23 m (baseline), 635.49 m (SSP119-2030), and 630.91 m (SSP545-2030). This 'one barrier, two regions, multiple islands, and one center' strategic framework enhances connectivity and stability, offering critical insights for regional planning in vulnerable, dynamic landscapes by balancing conservation and development, and advancing sustainable practices.