-
The continued and sustainable development of the animal husbandry industry faces significant challenges due to diminishing resources and rising feed costs. The rapid expansion of the industry has created an urgent need to investigate non-traditional feed sources[1−5]. Compounded by China's policy prohibiting the use of growth-enhancing antibiotics in feed, there is a critical need to identify viable alternatives for promoting intestinal health and growth in animals[4,6,7]. A common alternative is the incorporation of appropriate amounts of insoluble dietary fiber into broiler diets, offering a range of benefits such as reducing bedding moisture, promoting stomach development, decreasing fat deposition, lowering gizzard pH, improving nutrient digestibility, and increasing consumption rates, all of which collectively stimulate chicken growth[3,8−12].
While the positive impacts of processed lignocellulose supplementation on performance metrics have been demonstrated, variations in the effects of different fiber types in broiler feed highlight the importance of identifying reliable fiber sources[3,13]. Bamboo stands out as a prime candidate, being a naturally occurring, renewable resource with rapid growth rates and abundant yields. Its availability and distribution are extensive[14,15]. Remarkably, pandas demonstrate an apparent digestibility of 33.8% for crude protein and 31.8% for crude fiber when fed whole bamboo[16]. Bamboo powder, derived from bamboo, is rich in polysaccharides, leaf flavonoids, and insoluble dietary fiber[17,18], which impart regulatory effects on animal immune systems and antioxidant capacities. Additionally, fibers from bamboo shoot shells exhibit significant prebiotic potential and cholesterol adsorption activity, promoting the growth of lactic acid bacteria and enhancing substrate fermentability, particularly beneficial in conditions such as hyperlipidemia in mice[5,19]. The incorporation of bamboo powder into sheep and pig feed further substantiates its potential as a valuable fiber source[20,21].
Historically, concerns have persisted regarding the negative impact of added fiber on overall nutrition, feed digestibility, and growth performance[22]. However, recent research has revealed positive outcomes associated with moderate levels of insoluble dietary fiber in broiler diets. Specifically, it helps lower litter moisture content and reduce fat deposition, while simultaneously enhancing broiler growth rates[8,12]. The inclusion of insoluble dietary fiber in the diet stimulates stomach development in chickens, improving nutrient utilization, and overall growth[10]. Similarly, supplementing low-fiber broiler diets with appropriate levels of structural insoluble dietary fiber yields comparable positive results[4].
The impact of processing technology and fiber sources on the chemical composition and nutritional characteristics of fibers is an important consideration[10]. Micronization, a processing method, can alter the particle size distribution and functional properties of insoluble dietary fiber in rice bran, influencing the digestibility of the raw material. For instance, micronized rice bran exhibits improved water-holding capacity, swelling ability, phenol extraction efficiency, and oxidative stability[23]. Bionic digestion studies on wheat have shown that reducing grain size enhances the in vitro digestibility of both dry matter and crude protein[24]. Decreasing grain size improves the apparent ileal digestibility of total energy, dry matter, total fiber, and insoluble dietary fiber. Notably, significant interactions between grain size and fiber source have been observed, influencing hindgut fiber digestibility[25]. The selection of fiber sources is also crucial. A comparison of fibers extracted from bamboo shoot shells and bamboo stem powder revealed differences in lignin content. Ultra-micronization can increase soluble fiber components, reduce lignin levels, and enhance the water-holding capacity and fat adsorption properties of raw materials[26].
Bamboo powder, known for its high content of insoluble dietary fiber, flavonoids, and polysaccharides, is a common feed ingredient in Chinese broiler diets. This study focuses on fermented bamboo powder (FBP) and aims to investigate its effects on Yellow-Feathered Broiler Chickens. Specifically, we aim to examine the impact of FBP supplementation on the expression of genes related to antioxidant activity, odorant receptors, growth, and immunity. The findings of this study are expected to provide valuable insights into the potential application of FBP in broiler diets, contributing to improvements in growth, health, and immune function.
-
This study aimed to evaluate the effects of fermented bamboo powder supplementation on the expression of genes associated with antioxidant activity, odorant receptors, growth, and immunity in Yellow-Feathered Broiler chickens. Six hundred healthy 1-day-old Yellow-Feathered Broiler chicks were randomly divided into two groups: Control (CON) and Fermented Bamboo Powder (FBP) supplementation groups. Each group consisted of 10 replicates, with 30 chicks per replicate. The CON group was fed a basal diet, while the FBP group received the basal diet supplemented with 1.0 g of FBP per kg of feed for phase I, 2.0 g for phase II, 4.0 g for phase III, and 6.0 g for phase IV. The first two phases were designated as the pretreatment period, followed by the experimental phase. Chickens, averaging 1.14 ± 5 kg in weight and of both genders with similar initial body weights, were used in the study. The experiment lasted 77 d, with the pretreatment phase extending from day 1 to day 45. The use of 45-day-old chickens enabled effective monitoring of growth and developmental changes over a relatively short duration. Tissue samples were collected at the conclusion of phase IV for analysis.
Diet composition and source
-
The basal and experimental diets were obtained from Jiangsu Yancheng Xiling Agricultural Science and Technology Co., Ltd. (Jiangsu, China), while the FBP used in the study was analyzed by Jiangsu Gaosheng Biological Feed Co., Ltd (Jiangsu, China). Details regarding the specific ingredients of FBP are provided in Table 1. The basal diets were formulated according to the nutritional requirements outlined by NRC (1994) for four phases. The CON group was fed the basal diet without supplementation, whereas the FBP group received varying levels of FBP (1.0, 2.0, 4.0, and 6.0 g/kg) during each phase. The composition of these diets is presented in Table 2.
Table 1. The composition of the fermented bamboo powder based on an as-fed basis.
Testing item Fermented bamboo powder (FBP) Moisture 11.21% Crude protein 17.07% Coarse fiber 17.66% Crude fat 3.48% Coarse ash content 9.21% Acid soluble protein 7.13% Acid washing lignin 3.41% Calcium 0.12% Total phosphorus 0.02% Unknown substance 18.81% Table 2. Basal diet ingredients and nutritional composition.
Items Basal diet
starter phase
(1−22 d)Basal diet
growth phase
(23−45 d)Basal diet
finisher phase
(46−77 d)Corn 40.66 29.73 20.5 Wheat 20 40 50 DGYC 0 0 0 Soybean meal (43%) 22.31 5.73 2.92 Palm kernel meal 0 2 4 Sunflower kernel meal (35%) 3 5 8 Lard 0 0 6.03 Rapeseed meal (38%) 3 4 0 Corn gluten meal (60%) 4 5 4.4 Rice husk oil 2.31 4.22 0 Calcium bisphosphate 1.4 1.03 0.87 Limestone 1.18 1.12 1.13 Liquid methionine (88%) 0.14 0.23 0.15 Premix* 2 2 2 Total 100 100 100 Calculation of nutrients Metabolizable energy (MJ/kg) 285.6 300.8 307.6 Crude protein 21.14% 20.87% 20.23% Crude fat 4.048% 4.41% 4.53% Methionine 0.486% 0.764% 0.491% Lysine 1.097% 1.364% 1.13% Calcium (%) 0.989% 0.962% 0.97% Available phosphorus 0.485% 0.51% 0.45% * Premix provides the following nutrients (per kilogram of diet): choline, 1 g; enzyme complex, 300 mg; broiler multivitamin, 300 mg; glyceryl tributyrate, 300 mg; probiotics, 200 mg; organomineral, 400 mg; phytase, 200 mg ; NaCl, 2.8 g; vitamin A, 9800 IU; vitamin D3, 2500 IU; vitamin E, 60 IU; vitamin K, 2.3 mg; vitamin B1, 2 mg; vitamin B2, 6 mg; vitamin B6, 4 mg; vitamin B12, 0.02 mg; nicotinic acid, 45 mg; pantothenic acid, 20 mg; folic acid, 1.25 mg; biotin, 0.02 mg; Fe, 75 mg ; Cu, 8 mg; Mn, 75 mg; Zn 60 mg; Cu, 8 mg; Se, 0.3 mg; Co, 0.3 mg. Data collection and sampling
-
Upon completion of the 77-d experiment, humane slaughter procedures were followed. Blood samples were collected for the evaluation of hormone levels (IGF-1, GH, T3, and T4). Plasma was separated after centrifugation for the analysis of immune indices and serum biochemical markers. Tissues from the liver, heart, spleen, muscle, gizzard, proventriculus, hypothalamus, and small intestine (jejunum) were rapidly frozen for subsequent mRNA expression analysis of specific genes, including β-actin, IGF-1, IGF-2, IGFBP-1, IGFBP-2, IGFBP-3, cGH, IL-10, IL-2, IL-6, SOD1, CAT, GPx1, COR1, COR2, COR4, COR6, COR8, COR9, OR52R1, OR51M1, OR1F2P, OR5AP2, and OR14J1L112, following excision and rinsing.
Determination of growth and thyroid peptides
-
To quantify the concentrations of IGF-1, GH, T3, and T4 in liver, muscle, and serum, an enzyme-linked immunosorbent assay (ELISA) was employed. Initially, tissues were meticulously ground, weighed, and subsequently diluted with PBS buffer (1:9 ratio). The resulting mixture underwent centrifugation (2,000–3,000 rpm for 20 min), and the collected supernatant was carefully extracted for further analysis. ELISA procedures involved the preparation of standard wells, sequential addition of samples with diluent and enzyme label reagent, followed by a 60-min incubation period. After incubation, the plate underwent multiple washes with a washing solution to remove unbound substances. Color reagent and stop solution were added to each well, and the optical density (OD) value of each well was measured using an enzyme-labeled instrument. Utilizing a standard curve, the concentrations of IGF-1, GH, T3, and T4 in liver, muscle, and serum were calculated, providing a quantitative assessment of these peptides.
Determination of immune parameters in serum
-
The levels of IgA, IgG, IgM, IL-1β, IL-2, IL-6, IL-10, and IFN-γ in serum samples were determined using Enzyme-Linked Immunosorbent Assay (ELISA) kits, following the manufacturer's instructions (Nanjing Aoqing Biotechnology Co., Ltd., Nanjing, China). The concentrations were reported in ng/ml.
Biochemical analysis of sera
-
Serum concentrations of Alanine transaminase (ALT), Alkaline phosphatase (ALP), Aspartate aminotransferase (AST), UREA, and CREA were measured using commercially available kits according to the manufacturer's protocols (Nanjing Aoqing Biotechnology Co., Ltd., Nanjing, China), offering insights into the enzymatic activity within the FBP-treated group.
Reverse transcription polymerase chain reaction (RT-PCR)
-
The primer sequences were designed to be 18 to 20 base pairs in length, with an annealing temperature set between 55 and 58 °C. The GC content was kept at 20%, and the expected product size ranged from 150 to 200 base pairs. The integrity of the cDNA from tissues of yellow broiler chickens was verified through PCR amplification using β-actin as the reference gene on a StepOnePlus Real-Time PCR system (Applied Biosystems, USA). PCR amplification was performed with cDNA as the template in a total reaction volume of 20 μl, consisting of 11.6 μl of nuclease-free water, 4 μl of MyTaq Reaction Buffer, 0.4 μl of MyTaq DNA Polymerase, 1 μl (10 mM) of each forward and reverse OR primer, and 2 μl (20 ng/μl) of cDNA template. The PCR cycling protocol included an initial denaturation at 95 °C for 1 min, followed by 35 cycles of denaturation at 95 °C for 30 s, annealing at 55 °C for 30 s, and extension at 72 °C for 20 s, with a final extension at 72 °C for 7 min. The resulting PCR products were analyzed on a 1.5% agarose gel.
Real-time quantitative PCR analysis
-
The real-time quantitative PCR technique was used to evaluate the mRNA expression levels of 11 genes in Yellow-Feathered Broiler chickens, including β-actin, IGF-1, IGFBP-1, IGFBP-3, cGH, IL-10, IL-2, IL-6, SOD1, CAT, and GPx1, as well as 11 olfactory receptor-related genes (ORs), such as COR1, COR2, COR4, COR6, COR8, COR9, OR52R1, OR51M1, OR1F2P, OR5AP2, and OR14J1L112. Gene-specific primers were designed using primer software, based on Gallus gallus sequences from the NCBI database (Table 3).To ensure accurate normalization and facilitate comparisons across different samples, the reference gene β-actin, known for its stable expression, was included. The primer for β-actin was also designed based on gallus gallus β-actin sequences in the NCBI database. Real-time quantitative PCR with the designed primers enabled determination of relative mRNA expression levels for the 13 genes of interest along with β-actin. Total RNA extraction from frozen liver, heart, spleen, and breast muscle tissue samples employed RNAiso Plus (TaKaRa) reagent following the manufacturer's protocol. The concentration and quality of extracted total RNA were assessed using a micro-spectrophotometer (Thermo Scientific). The RNA samples, dissolved in Diethyl pyrocarbonate (DEPC) water, were analyzed for concentration and purity. First-strand cDNA was synthesized from total RNA using 5× PrimeScript RT Master Mix and RNase-free water (TaKaRa). Real-time PCR reactions were carried out with a mixture of 2× SYBR Green I PCR Master Mix (TaKaRa BIO INC), Rox Reference Dye 1, primers, cDNA, and PCR-grade water. Amplification and detection were performed using SYBR Green I fluorescent dye on a StepOnePlus Real-Time PCR system (Applied Biosystems), following the established cycling conditions. Data analysis utilized the ΔCt method, which involved calculating the difference in Ct values between the target gene and β-actin. Gene expression was determined using the 2−ΔΔCᴛ equation. RNA samples were stored at −80 °C until further use[27,28].
Table 3. Primers used for Real-Time Quantitative PCR.
Genes NCBI gene ID Primer Sequence Product length (bp) β-actin NM_205518.2 Forward GCCCTCTTCCAGCCATCTTT 150 Reverse CAATGGAGGGTCCGGATTCA CAT NM_001031215.2 Forward GGTAACTGGGATCTTGTGGGA 112 Reverse CCTTCAAATGAGTCTGAGGGTTC CGH NM_204359.2 Forward TGAGAAACTAAAGGACCTGGAAGA 110 Reverse TGTCGAACTTATCGTAGGTGGG GPX1 NM_001277853.3 Forward GCCCGCACCTCTGTCATAC 156 Reverse GCTTCTCCAGGCTGTTCCC IGF1 NM_001004384.3 Forward AGTTCGTATGTGGAGACAGAGGC 83 Reverse TCCCTTGTGGTGTAAGCGTC IGF2 NM_001030342.5 Forward TGCCAACAACCTTGACACCT 98 Reverse GGCCTCACTACCCAAACCTC IGFBP1 NM_001001294.2 Forward GCAAGATCAGGTCCTCCAGTC 199 Reverse AGTAGCATCATTTCTCCAGCGTA IGFBP2 NM_205359.2 Forward GCATGAAGGAGATGGCGGT 99 Reverse TCTTTGAGTCCTCGTGGTTGTG IGFBP3 NM_001395957.1 Forward ATCAGGAAAGAGCAAGCCAAA 121 Reverse TACGACAGGGACCATATTCAGTT IL-2 NM_204153.2 Forward TATCCCGTGGCTAACTAACCTG 159 Reverse ACCGACAAAGTGAGAATCAATCA IL-6 NM_204628.2 Forward CGTTTATGGAGAAGACCGTGAG 92 Reverse CAGAGGATTGTGCCCGAAC IL-10 NM_001004414.4 Forward AGTGCTGTTGTATTCCTTGCTTC 164 Reverse AGGGCTCGTCTGGTGTTTG SOD NM_205064.2 Forward CGCTCGTAGGTGGTTGTATTG 127 Reverse CCTGCTGCTGGAAGTGGAT COR1 NM_001031545.2 Forward CTTCCATCATGACCAAGGCG 197 Reverse CAGCAGCTCACTGATAGCG COR2 NM_001396933.2 Forward GTCATCTACACCACCACCTTGC 245 Reverse AGCAAGCACTCTGAGGTTGT COR4 NM_001031176.2 Forward ATCCCTATGCTGAACCCCCT 70 Reverse TAACTCTGCGTAGAGCGTCC COR6 NM_001031544.2 Forward GCACCTCTCAACTGATGGCT 210 Reverse ACAAAACAGCGGTGGCTATG COR8 NM_001396932.1 Forward GGACCCAGGTTCAGGCTTAC 120 Reverse TTATGGCTTCGACCCACACC COR9 NM_001305217.2 Forward TTTACATGCTCCACCAGGCG 355 Reverse GATCATGCCAAGGTTCCCCA OR52R1 NM_001009878.2 Forward ATCCATGGTCTGATGCCCAC 141 Reverse GGTGGTGGACGTTGATCTGA OR51M1 NM_001008754.4 Forward CATGGGAGTGACTGTGTCCC 516 Reverse CAGCCCTCTGTCTGGACTTG OR1F2P XM_040685819.1 Forward CACCATCACTGTGCCGAAGA 113 Reverse TCTCTGTGCCAACAACGTCA OR5AP2 XM_040685466.1 Forward GTCCAGACAGGAGTGTGCTC 179 Reverse GTGCAAAGCGTGTGTCAGAG OR14J1L112 XM_040654712.1 Forward TCCTGCACTTCTGGCTCTTG 778 GCTGGAGGCACTACCGAATA Statistical analysis
-
The study parameters were evaluated by calculating mean values and their corresponding standard errors. Statistical analyses were performed using SPSS version 25. To compare gene expression across multiple groups, a one-way analysis of variance (ANOVA) was applied, followed by Tukey's Honestly Significant Difference (HSD) post hoc test to identify specific group differences. For comparisons between two independent group, an independent sample t-test was utilized. A threshold of p < 0.05 was set to establish statistical significance. OR gene expression in various tissues, including the gizzard, proventriculus, small intestine, and hypothalamus of broiler chickens, was quantified using the delta delta Ct (ddCt) method, normalizing the Ct values of OR genes to β-actin, the reference gene.
-
In this experimental study, the effects of FBP supplementation were investigated by measuring the levels of growth and thyroid hormones, including IGF-1, GH, T4, and T3, in the serum, muscle, and liver tissues of yellow-feathered broiler chickens, as illustrated in Fig. 1.
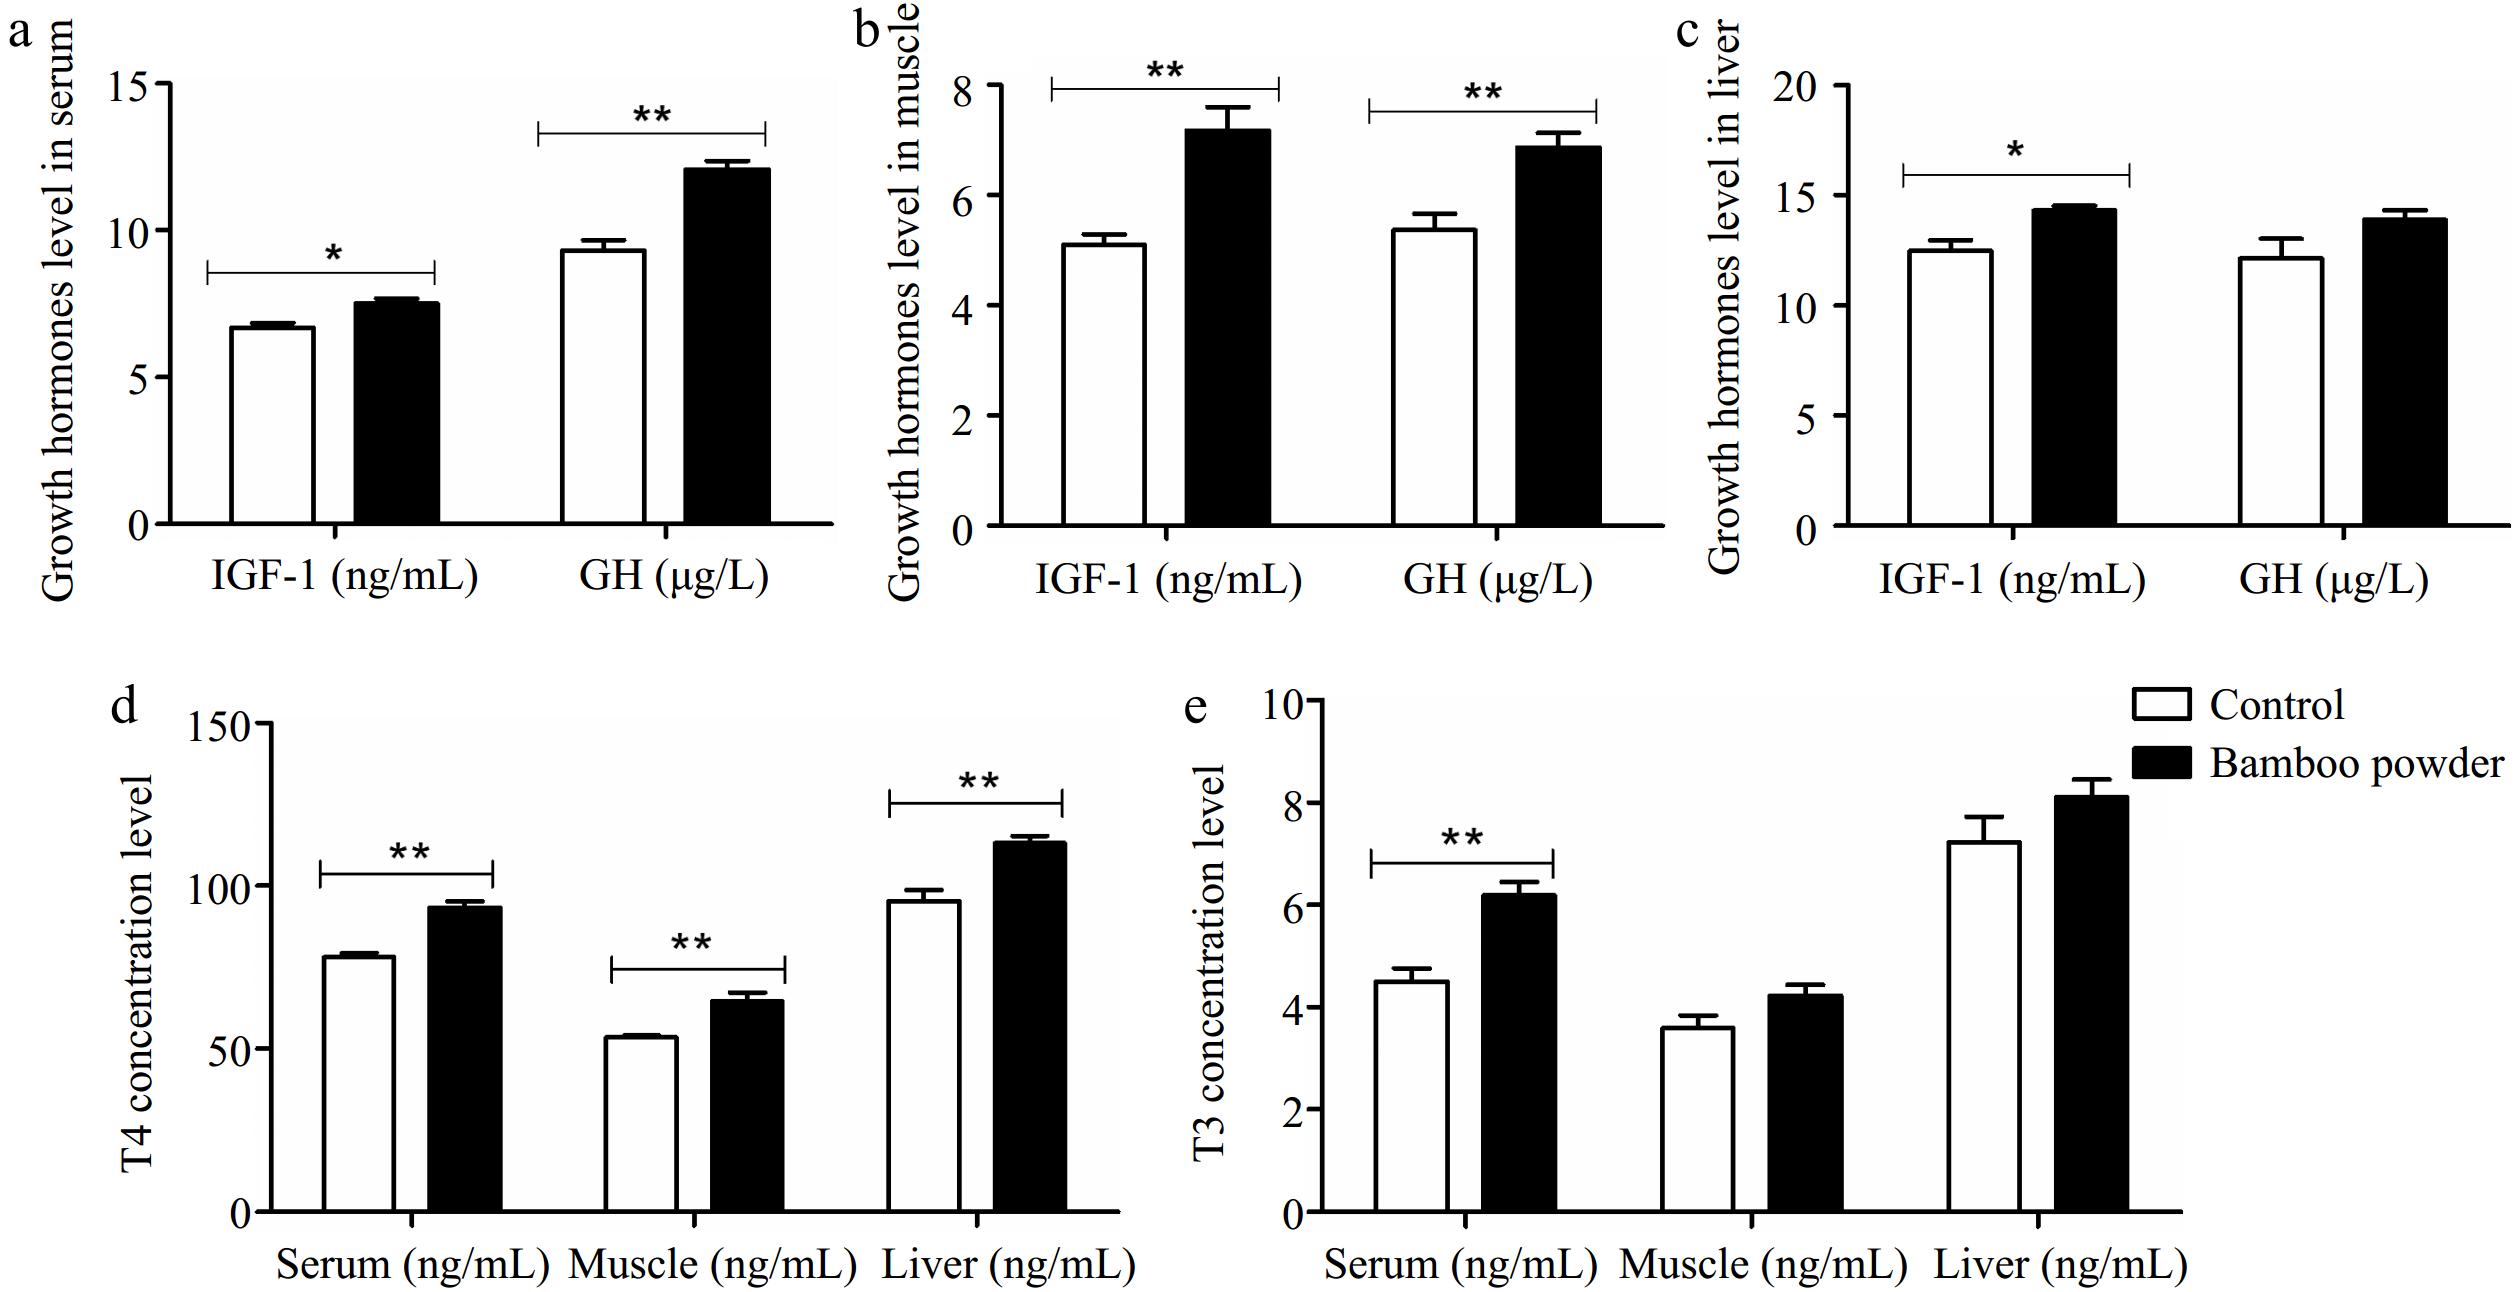
Figure 1.
Impact of FBP supplementation on growth and thyroid hormone concentrations. The figure illustrates the effects of FBP supplementation on growth and thyroid hormone concentrations in yellow-feathered broiler chickens (n = 10). The figure comprises five panels: (a) growth hormone levels in serum, (b) growth hormone levels in muscle, (c) growth hormone levels in liver, (d) thyroxine (T4) levels across serum, muscle, and liver, and (e) triiodothyronine (T3) levels across serum, muscle, and liver. The bar graphs display the mean values for each variable, with error bars representing the standard error of the mean. Statistical significance is indicated by asterisks (* and **), denoting different significance levels (p < 0.05). The experiment's results reveal that FBP supplementation significantly elevated growth and thyroid hormone concentrations in the serum, muscle, and liver tissues of yellow-feathered broiler chickens.
In this study, a comparison was made between a control group and an experimental group that received FBP as a dietary supplement. Thyroid and growth hormone levels were assessed using enzyme-linked immunosorbent assays (ELISA). Statistical analysis revealed significant differences in hormone concentrations between the control and FBP-supplemented groups. The FBP group exhibited significantly higher serum levels of GH (µg/L), T4 (ng/ml), and T3 (ng/ml) (p < 0.01) compared to the control group. In muscle tissue, growth and thyroid hormone concentrations were also significantly elevated (p < 0.01) in the FBP group relative to the control, although the increase in muscle T3 (ng/ml) did not reach statistical significance. Additionally, in liver tissue, the levels of IGF-1 (ng/ml) and T4 (ng/ml) were significantly higher (p < 0.01) in the FBP-supplemented group compared to the control. However, no significant differences were observed in GH (ng/L) and T3 (ng/ml) levels in liver tissue between the two groups. These findings provide strong scientific evidence that FBP supplementation induces significant changes in the levels of growth and thyroid hormones (IGF-1, GH, T4, and T3) in the liver, muscle, and serum of Yellow-Feathered Broiler Chickens.
Impact of FBP supplementation on serum biochemical index levels
-
To evaluate the effects of FBP supplementation on inflammation and injury markers in the liver, heart, and kidneys, an extensive analysis of serum levels of Aspartate Transaminase (AST), Alanine Transaminase (ALT), Alkaline Phosphatase (ALP), creatinine (CREA), and urea were conducted in yellow-feathered broiler chickens, as illustrated in Fig. 2.
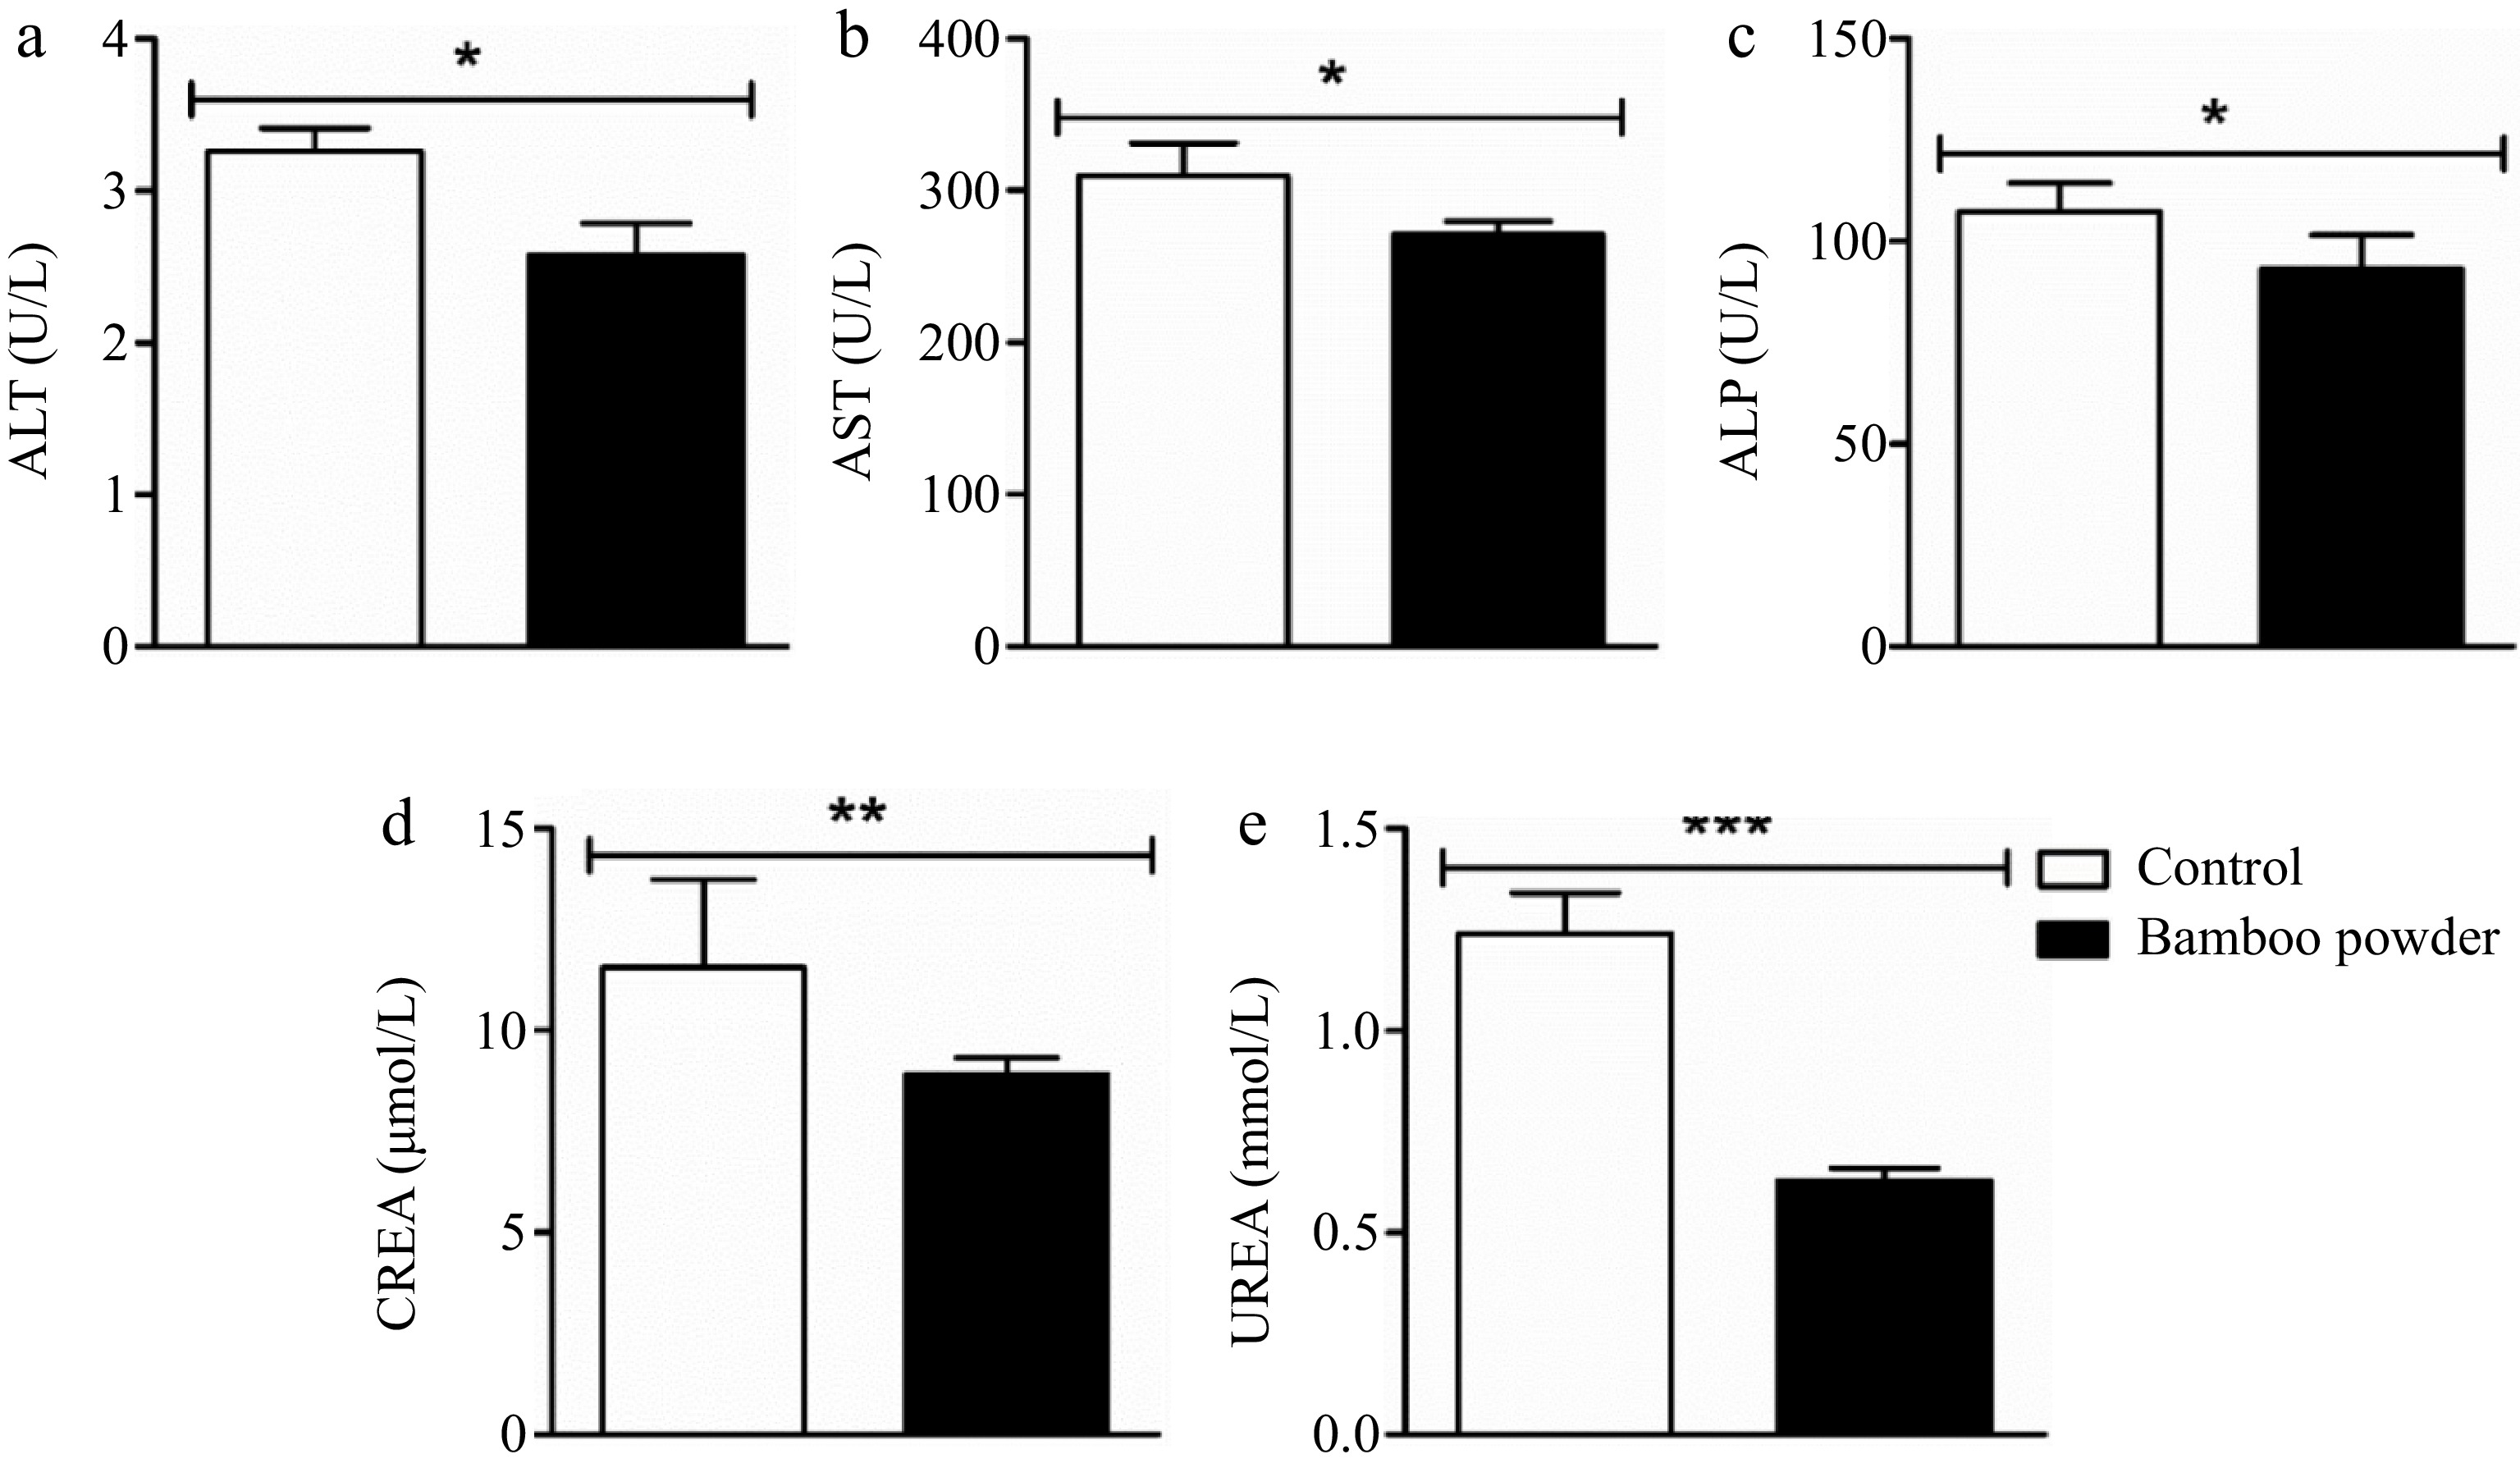
Figure 2.
Impact of FBP on serum biochemical indexes. The figure provides a comprehensive analysis of the effects of FBP supplementation on serum biochemical indices in Yellow-Feathered Broiler Chickens (n = 10). The parameters examined include (a) ALT (U/L), (b) AST (U/L), (c) ALP (U/L), (d) CREA (nmol/L), and (e) UREA (nmol/L). The bar graphs depict the mean values for each parameter, with error bars representing the standard error of the mean. Statistical significance between groups is indicated by symbols (*, **, ***), with the specific number of asterisks corresponding to different levels of significance (p < 0.05).
The present findings demonstrate a significant reduction in the activity of ALT, AST, ALP, CREA, and UREA enzymes in the experimental group treated with FBP compared to the control group. Statistical analysis revealed significant differences (p < 0.05), highlighting the efficacy of FBP supplementation in protecting liver, heart, and kidney tissues in yellow-feathered broiler chickens.
Impact of FBP supplementation on immune indicators
-
To evaluate the impact of FBP supplementation on immune indicators, we conducted a comprehensive analysis of serum immunoglobulins and inflammatory cytokines were conducted, as detailed in Table 4.
Table 4. Effects of FBP supplementation on serum immunoglobulins and inflammatory cytokines of broilers.
Item Control Bamboo powder p-Value IgA (ng/ml) 113.16 ± 7.23 150.98 ± 8.89 0.01 IgG (ng/ml) 62.28 ± 3.25 89.47 ± 1.18 0.04 IgM (ng/ml) 1.40 ± 0.04 1.74 ± 0.03 0.01 IL-2 (ng/ml) 19.13 ± 0.99 40.99 ± 1.23 0.001 IL-6 (ng/ml) 23.38 ± 1.29 40.66 ± 0.61 0.03 IL-10 (ng/ml) 16.41 ± 1.58 24.70 ± 1.32 0.04 IL-1β (ng/ml) 19.63 ± 1.19 43.65 ± 1.04 0.001 TNF-α (ng/ml) 23.13 ± 1.57 11.27 ± 1.14 0.01 IgG, immunoglobulin G; IgA, immunoglobulin A; IgM, immunoglobulin M; IL-2, interleukin-2; IL-6, interleukin-6, and IL-10, interleukin-10 (n = 10). Data presented are mean ± SE. p-value in the same row less then (p < 0.05) significantly different from each other. The present findings reveal a significant upregulation in the levels of immunoglobulins (IgA, IgG, and IgM) and inflammatory cytokines (IL-2, IL-6, IL-1β, and IL-10) in the serum of broiler chickens treated with FBP (p < 0.01). Notably, the increase in immunological markers correlated positively with the inclusion level of FBP. Additionally, the TNF-α level showed a significant decrease (p < 0.01) compared to the control group, indicating a potential anti-inflammatory effect of FBP supplementation. These results highlight the immunomodulatory impact of FBP on broiler chickens, suggesting its potential role in enhancing immune responses and reducing inflammatory processes. The observed changes in immune indicators further emphasize the promising immunotherapeutic properties of FBP for poultry health.
Effects of FBP supplementation on antioxidant gene expression in broiler chickens
-
To assess the impact of FBP supplementation on the expression of antioxidant-related genes, a thorough examination of the SOD1, GPX1, and CAT genes in liver and heart tissues were conducted, as illustrated in Fig. 3.

Figure 3.
Effects of FBP on antioxidant genes expression. The figure illustrates the expression levels of GPX1, SOD1, and CAT genes in (a) liver, and (b) heart tissues of broilers. The bar graphs represent the mean expression values, while the error bars indicate the standard error of the mean. Statistical significance is denoted by asterisks (*, **, ***), with * indicating p < 0.05, ** representing p < 0.01, and *** corresponding to p < 0.001, highlighting differences among the means.
The present results demonstrate a substantial increase in the mRNA expression levels of antioxidant-related genes (SOD1, GPX1, and CAT) in both liver and heart tissues of broilers treated with FBP. In the liver, the FBP-supplemented group exhibited significantly higher mRNA levels of SOD1, GPX1, and CAT compared to the control group (p < 0.01). Similarly, in heart tissue, the expression levels of these genes were also significantly elevated in the FBP-supplemented group compared to the control group (p < 0.05). These findings strongly suggest that FBP supplementation plays a pivotal role in activating antioxidant defense systems in liver and heart tissues. The observed upregulation of antioxidant genes implies a potential enhancement of antioxidant defense mechanisms, highlighting the positive impact of FBP supplementation on the overall health and resilience of these vital organs in broiler chickens.
Expression of OR genes in yellow broiler chicken tissues
-
RT-PCR was conducted to confirm the expression of 11 specific OR genes in the hypothalamus, gizzard, proventriculus, and small intestine tissues of broiler chickens, as shown in Fig. 4.
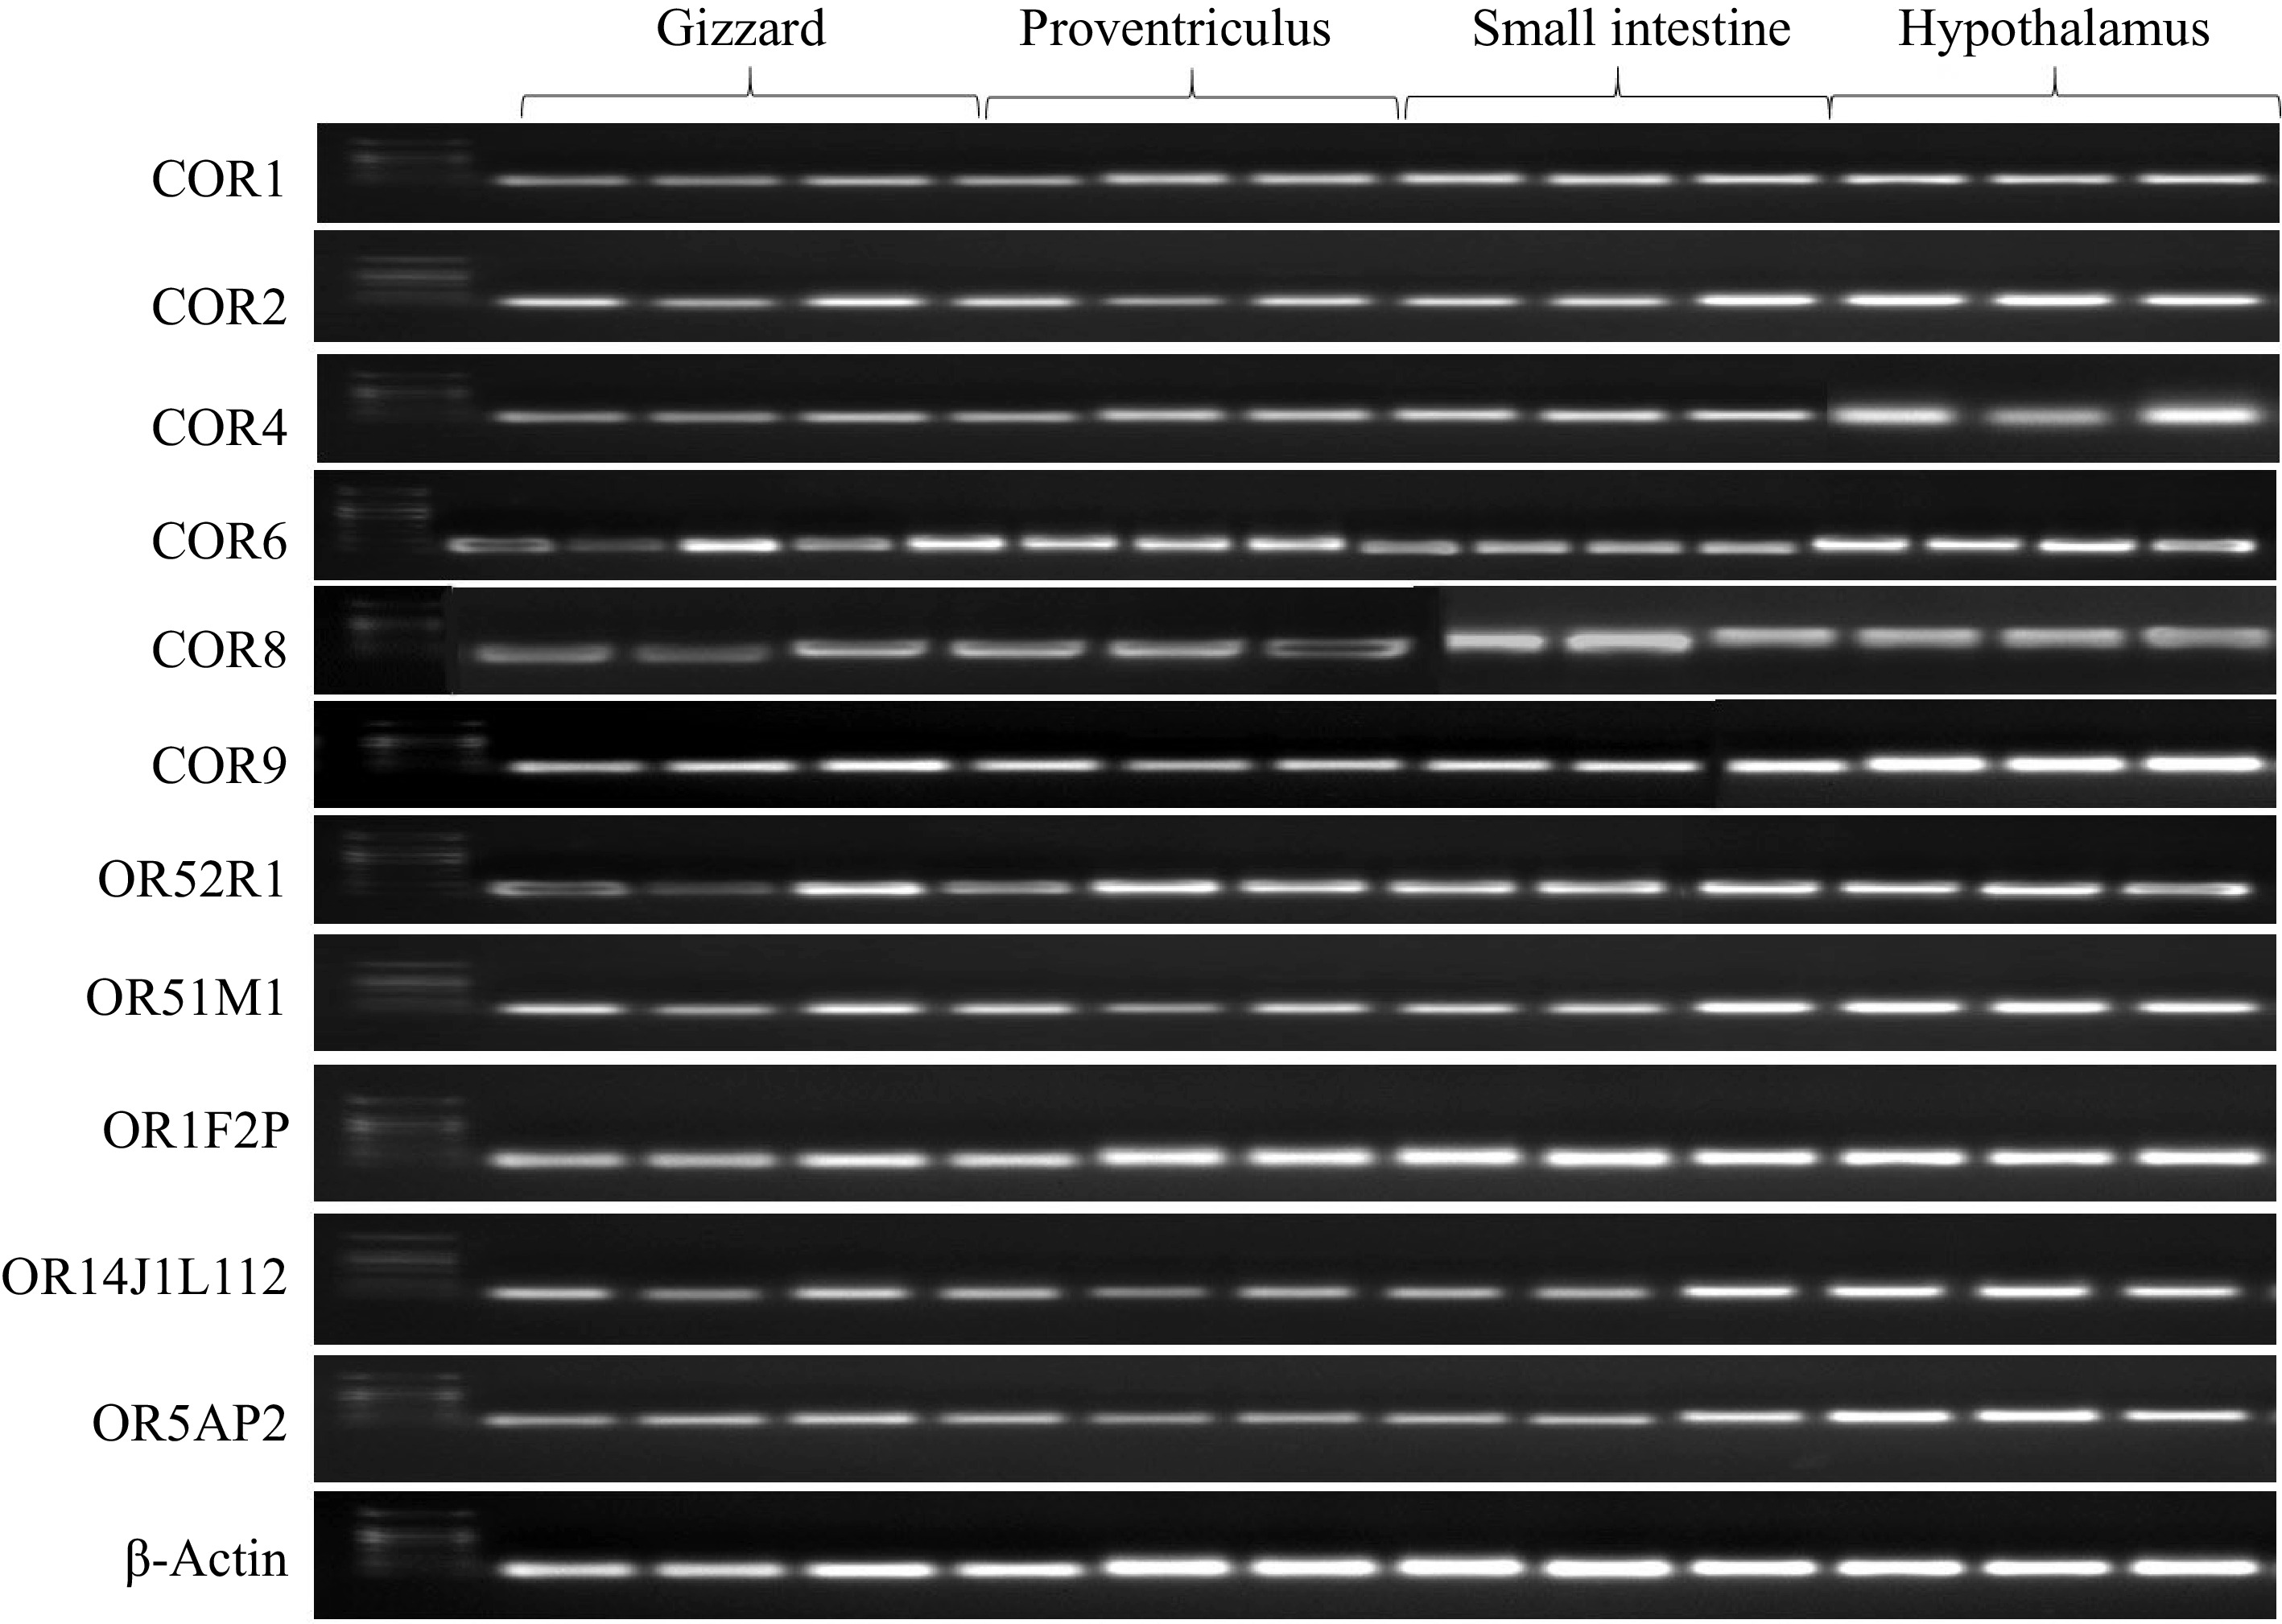
Figure 4.
Illustrates the tissue-specific expression patterns of odorant receptor genes, including COR1, COR2, COR4, COR6, OR14J1L112, OR5AP2, COR8, COR9, OR52R1, OR51M1, and OR1F2P, across various tissues such as the gizzard, proventriculus, small intestine, and hypothalamus. The analysis was conducted using RT-PCR, with cDNAs prepared from each tissue and gene-specific primers. PCR products were subjected to gel electrophoresis, and all observed bands corresponded to the expected sizes based on the designed primers.
The quality of the cDNA preparations was validated using β-actin primers, which produced consistent band intensities across cDNA samples from the hypothalamus, gizzard, proventriculus, and small intestine tissues. RT-qPCR analysis revealed significant expression of specific OR genes, including COR1, COR2, COR4, COR6, COR8, COR9, OR14J1L112, OR5AP2, OR52R1, OR51M1, and OR1F2P, in these tissues from broiler chickens supplemented with fermented bamboo powder. The expression levels of these OR genes differed noticeably from those of the β-actin gene. A comparative assessment of gene expression profiles further indicated that OR gene expression was considerably lower in the gizzard and proventriculus compared to the small intestine and hypothalamus, with the highest OR gene expression observed in the hypothalamus (Figs 4 & 5). These findings demonstrate distinct tissue-specific expression patterns of OR genes in broiler chickens.
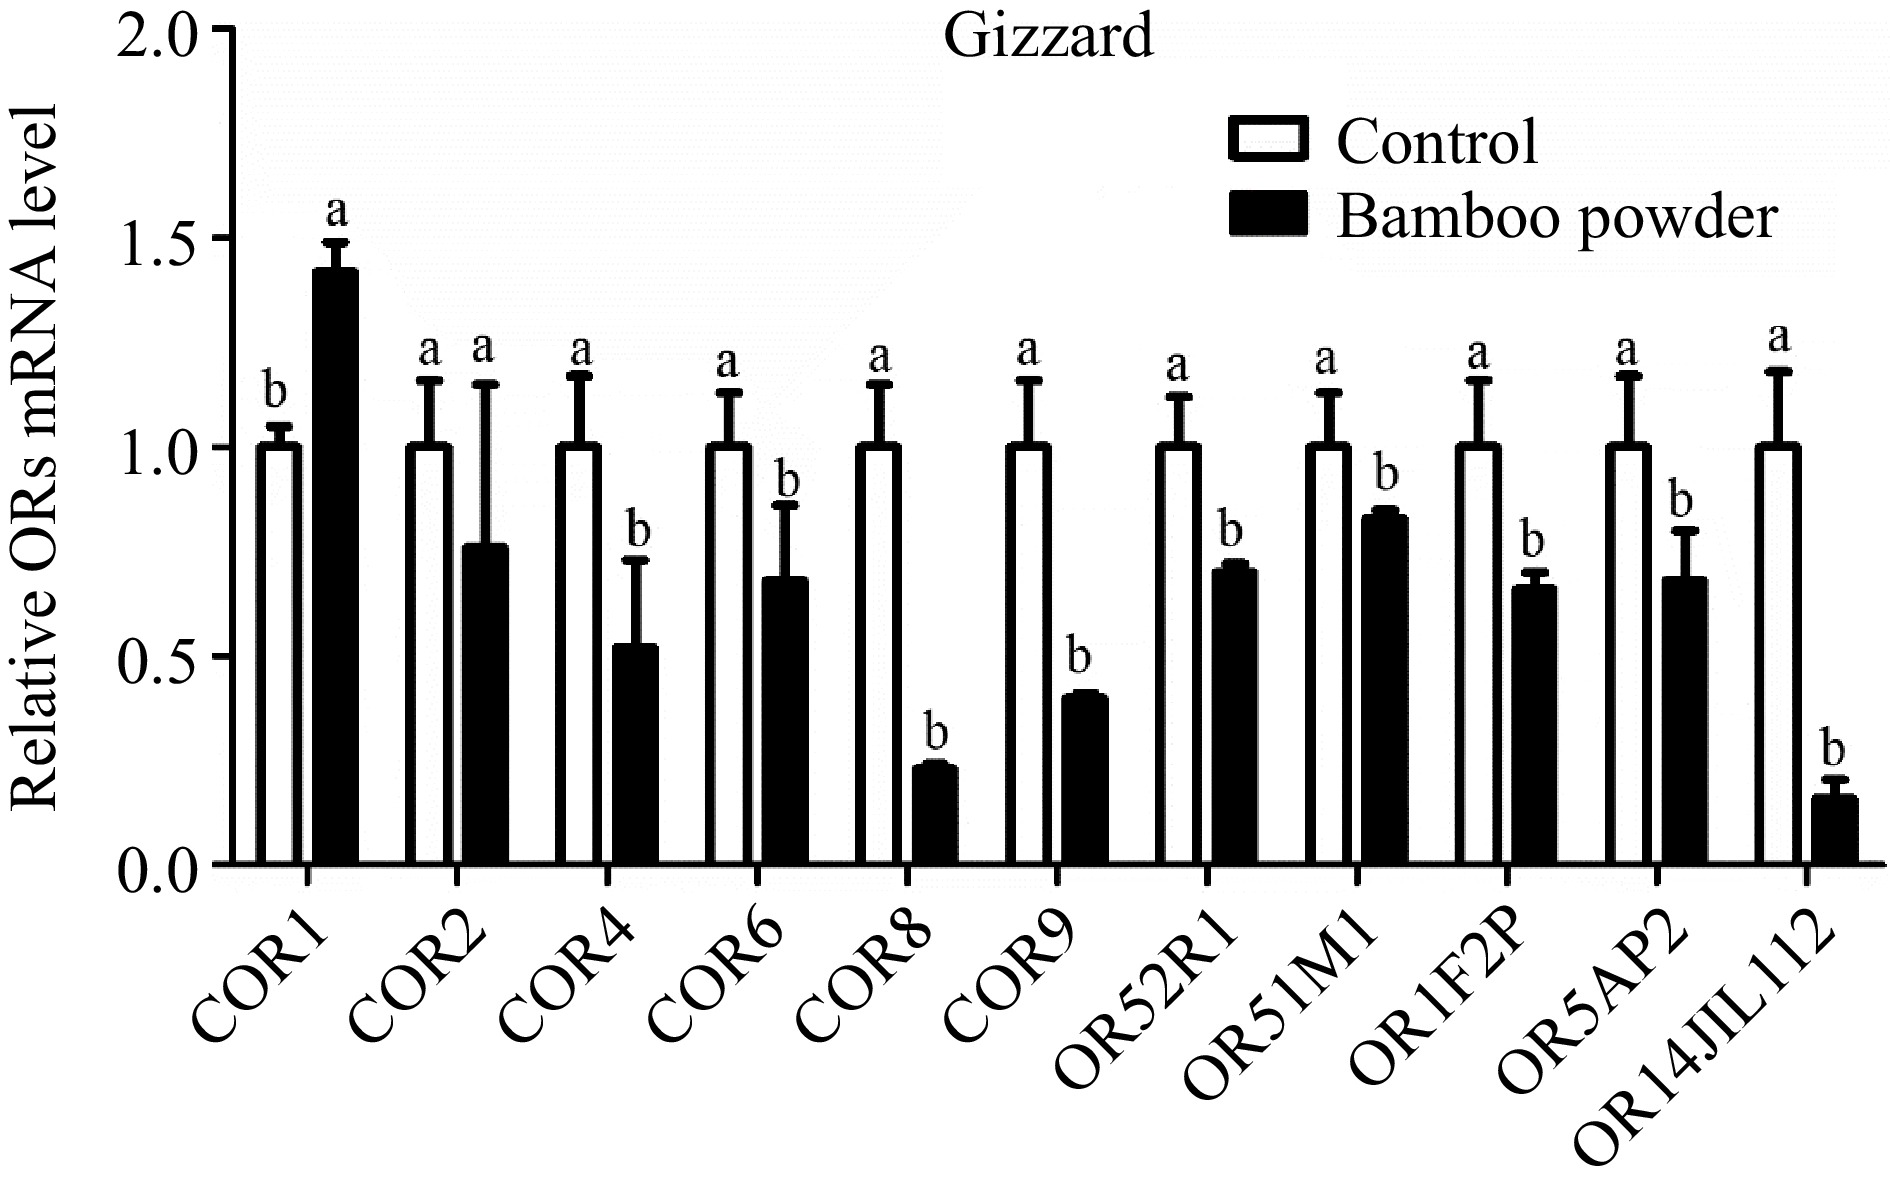
Figure 5.
Shows the qPCR expression levels of OR genes in the gizzard tissue of yellow broilers. For accurate comparison, expression values were normalized against control data from the same samples. The letters in the figure represent significant differences: 'a' indicates higher expression levels, while 'b' denotes lower expression levels. The bar graphs display the mean values, with error bars representing the standard error of the mean. Statistical significance at p < 0.05 is indicated by the letters 'a' and 'b' highlighting differences among the means.
Expression profile of OR genes in gizzard of yellow broiler chickens tissues
-
The expression levels of OR genes in the gizzard tissue of broiler chickens were measured using RT-qPCR (Fig. 5 & Table 5). The results showed a significant overall downregulation of these genes in the gizzard tissue. However, it is noteworthy that although the expression of the COR2 gene was downregulated, the difference was not statistically significant.
Table 5. Odorant receptor genes relative expression values in broiler chicken gizzard, proventriculus, small intestine, and hypothalamus tissues
Genes Gizzard tissue Proventriculus tissue Small intestine tissue Hypothalamus tissue 2−ΔΔCᴛ SEM 2−ΔΔCᴛ SEM 2−ΔΔCᴛ SEM 2−ΔΔCᴛ SEM COR1 1.420c 0.070 2.600b 0.41 2.97b 0.54 5.20a 0.52 COR2 0.760c 0.390 1.710b 0.20 2.23b 0.30 5.27a 0.46 COR4 0.520c 0.210 1.010c 0.35 2.30b 0.35 3.75a 0.38 COR6 0.680c 0.180 0.930c 0.11 1.57b 0.31 3.47a 0.26 COR8 0.230c 0.010 0.600c 0.04 2.03b 0.60 8.24a 0.57 COR9 0.400c 0.010 0.710c 0.04 1.34b 0.26 3.38a 0.27 OR52R1 0.700c 0.020 1.150b 0.17 1.40b 0.20 2.81a 0.26 OR51M1 0.830c 0.020 1.007c 0.17 1.72b 0.29 2.41a 0.31 OR1F2P 0.660c 0.040 1.340b 0.11 3.90a 0.85 1.47b 0.04 OR5AP2 0.680c 0.120 1.010c 0.15 1.91b 0.40 2.40a 0.13 OR14J1L112 0.160c 0.045 0.450c 0.09 1.59b 0.23 12.29a 0.96 The relative expression values (2−ΔΔCᴛ) for the gizzard, proventriculus, small intestine, and hypothalamus tissues of yellow broiler chickens are displayed. The values in each column represent the mean along with the standard error of the mean (SEM). Significant differences at the 0.05 level are indicated by the letters a, b, and c. Means within the same row that share a lowercase letter are considered significantly different. Expression profile of OR genes in proventriculus of yellow broiler chickens tissues
-
The study examined the expression profile of OR genes in the proventriculus tissue of yellow broiler chickens using RT-qPCR to measure their relative expression levels (Fig. 6 & Table 5). The findings showed both upregulation and downregulation of various OR genes in the proventriculus tissue. Notably, the COR6 gene was downregulated, although this change was not statistically significant. Similarly, while the COR4 and OR52R1 genes were upregulated, these differences were also not statistically significant. The expression of OR5AP2 showed no significant change. However, the COR1, COR2, and OR1F2P genes were significantly upregulated, while OR14JIL112 was significantly downregulated in the proventriculus tissue.
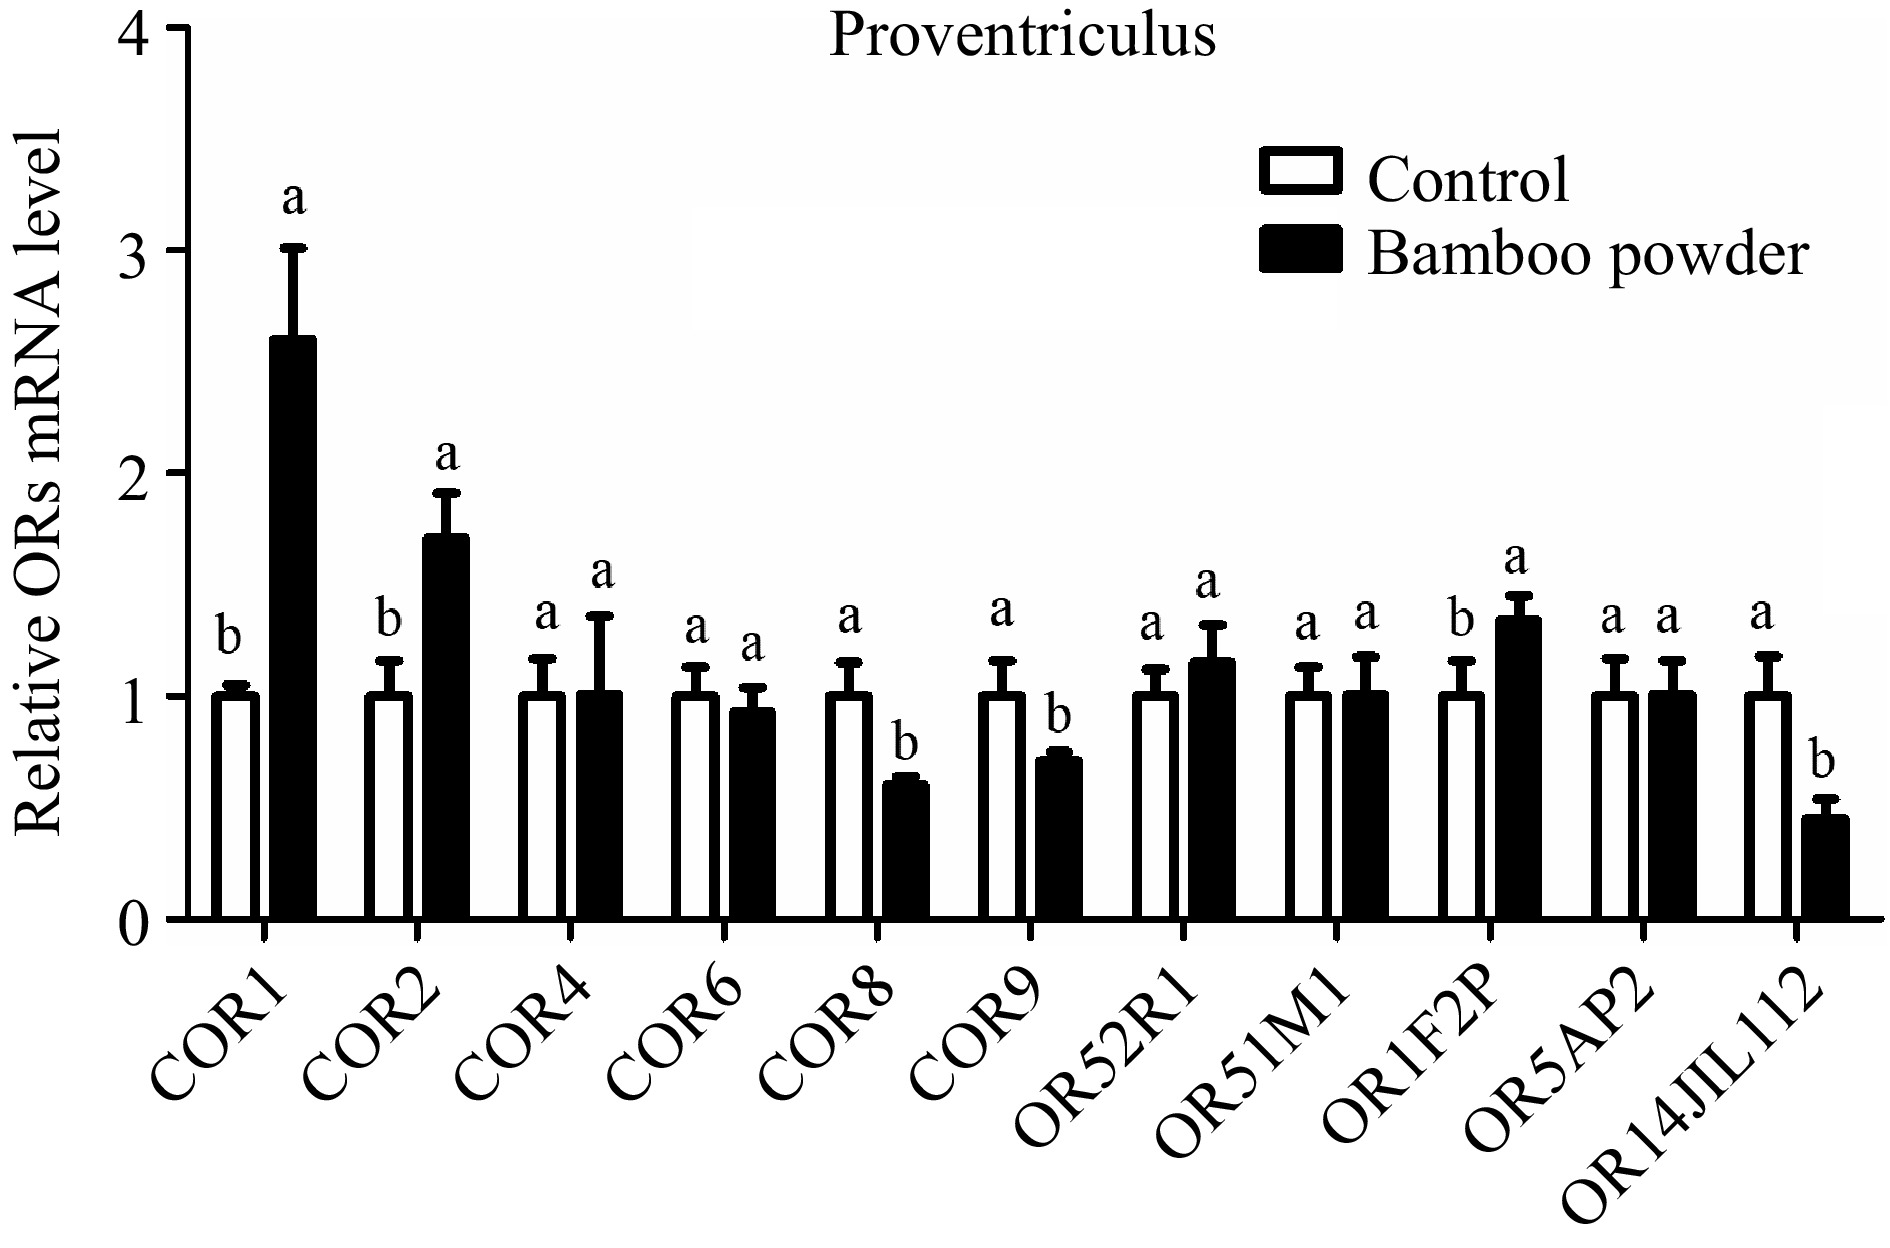
Figure 6.
Illustrates the qPCR expression levels of OR genes in the proventriculus tissue of Yellow broilers. The expression values were normalized against control data from the same samples to ensure accurate comparison. Significant differences are denoted by letters: 'a' indicates significantly higher expression, while 'b' represents significantly lower expression. The bar graphs display the mean values, with error bars reflecting the standard error of the mean. Statistical significance, determined at p < 0.05, is indicated by the letters 'a' and 'b' highlighting differences among the means.
Expression profile of OR genes in small intestines of yellow broiler chickens tissues
-
The study aimed to examine the expression of OR genes in the small intestine tissue of yellow broiler chickens. RT-qPCR was used to assess the relative expression levels of these genes (Fig. 7 & Table 5). The results revealed a notable upregulation in the expression of several OR genes, including COR1, COR2, COR4, COR6, COR8, COR9, OR52R1, OR51M1, OR1F2P, OR5AP2, and OR14JL112, in the small intestine tissues of yellow broilers.
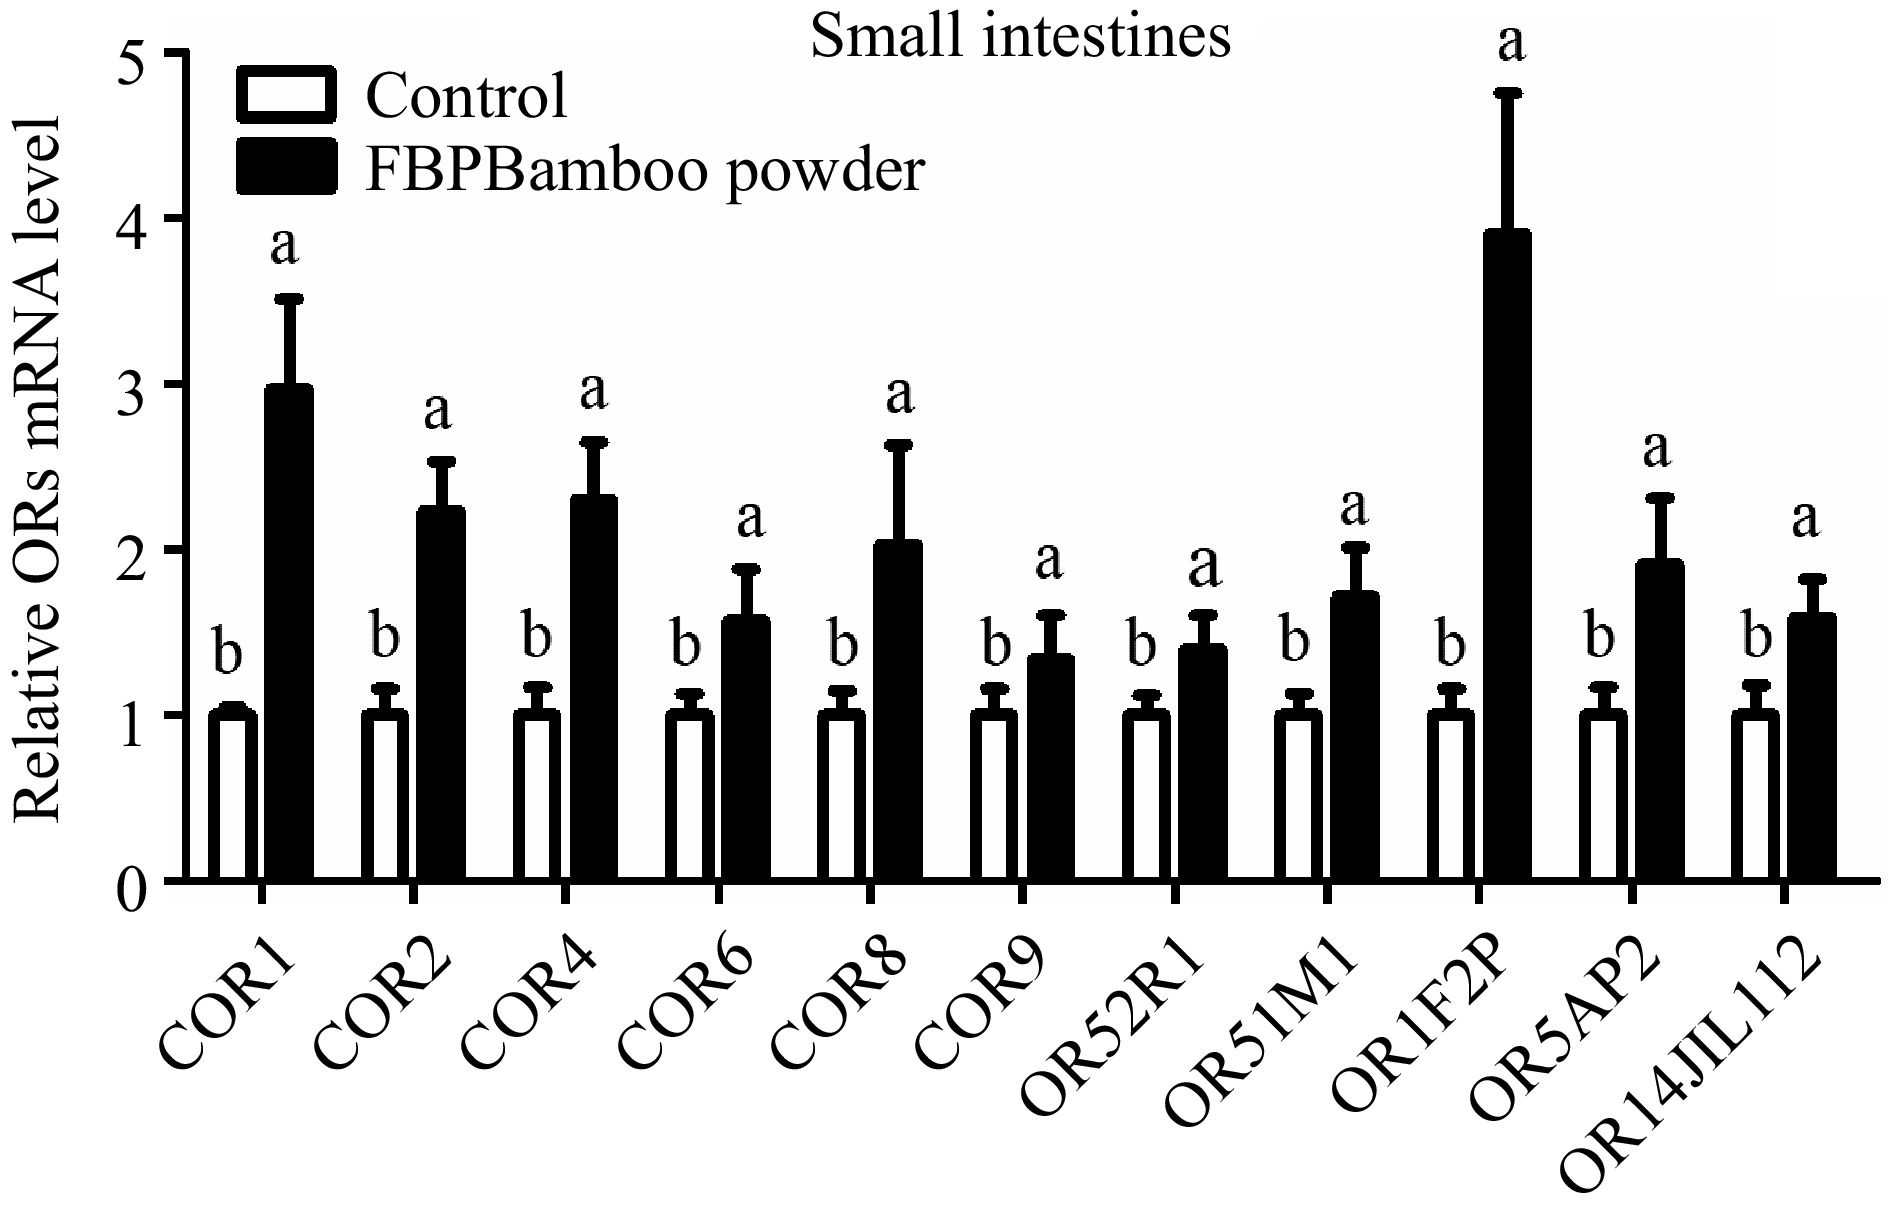
Figure 7.
Depicts the qPCR expression levels of OR genes in the small intestine tissue of yellow broilers. The expression values were normalized against control data from the same samples to ensure accurate comparisons. Significant differences are indicated by letters: 'a' represents higher expression levels, while 'b' denotes lower expression. The bar graphs display the mean values, with error bars reflecting the standard error of the mean. Statistical significance is denoted by the letters 'a' and 'b' at a threshold of p < 0.05, highlighting differences among the means.
Expression profile of OR genes in hypothalamus of yellow broiler chickens tissues
-
This study aimed to evaluate the expression profile of OR genes in the small intestine tissue of yellow broiler chickens. RT-qPCR was used to quantify the relative expression levels of these genes (Fig. 8 & Table 5). The findings revealed a significant reduction in the expression of several OR genes, including COR1, COR2, COR4, COR6, COR8, COR9, OR52R1, OR51M1, OR5AP2, and OR14JL112, in the hypothalamus tissues of yellow broilers. Conversely, the expression level of the OR1F2P gene remained unchanged, showing no significant difference.
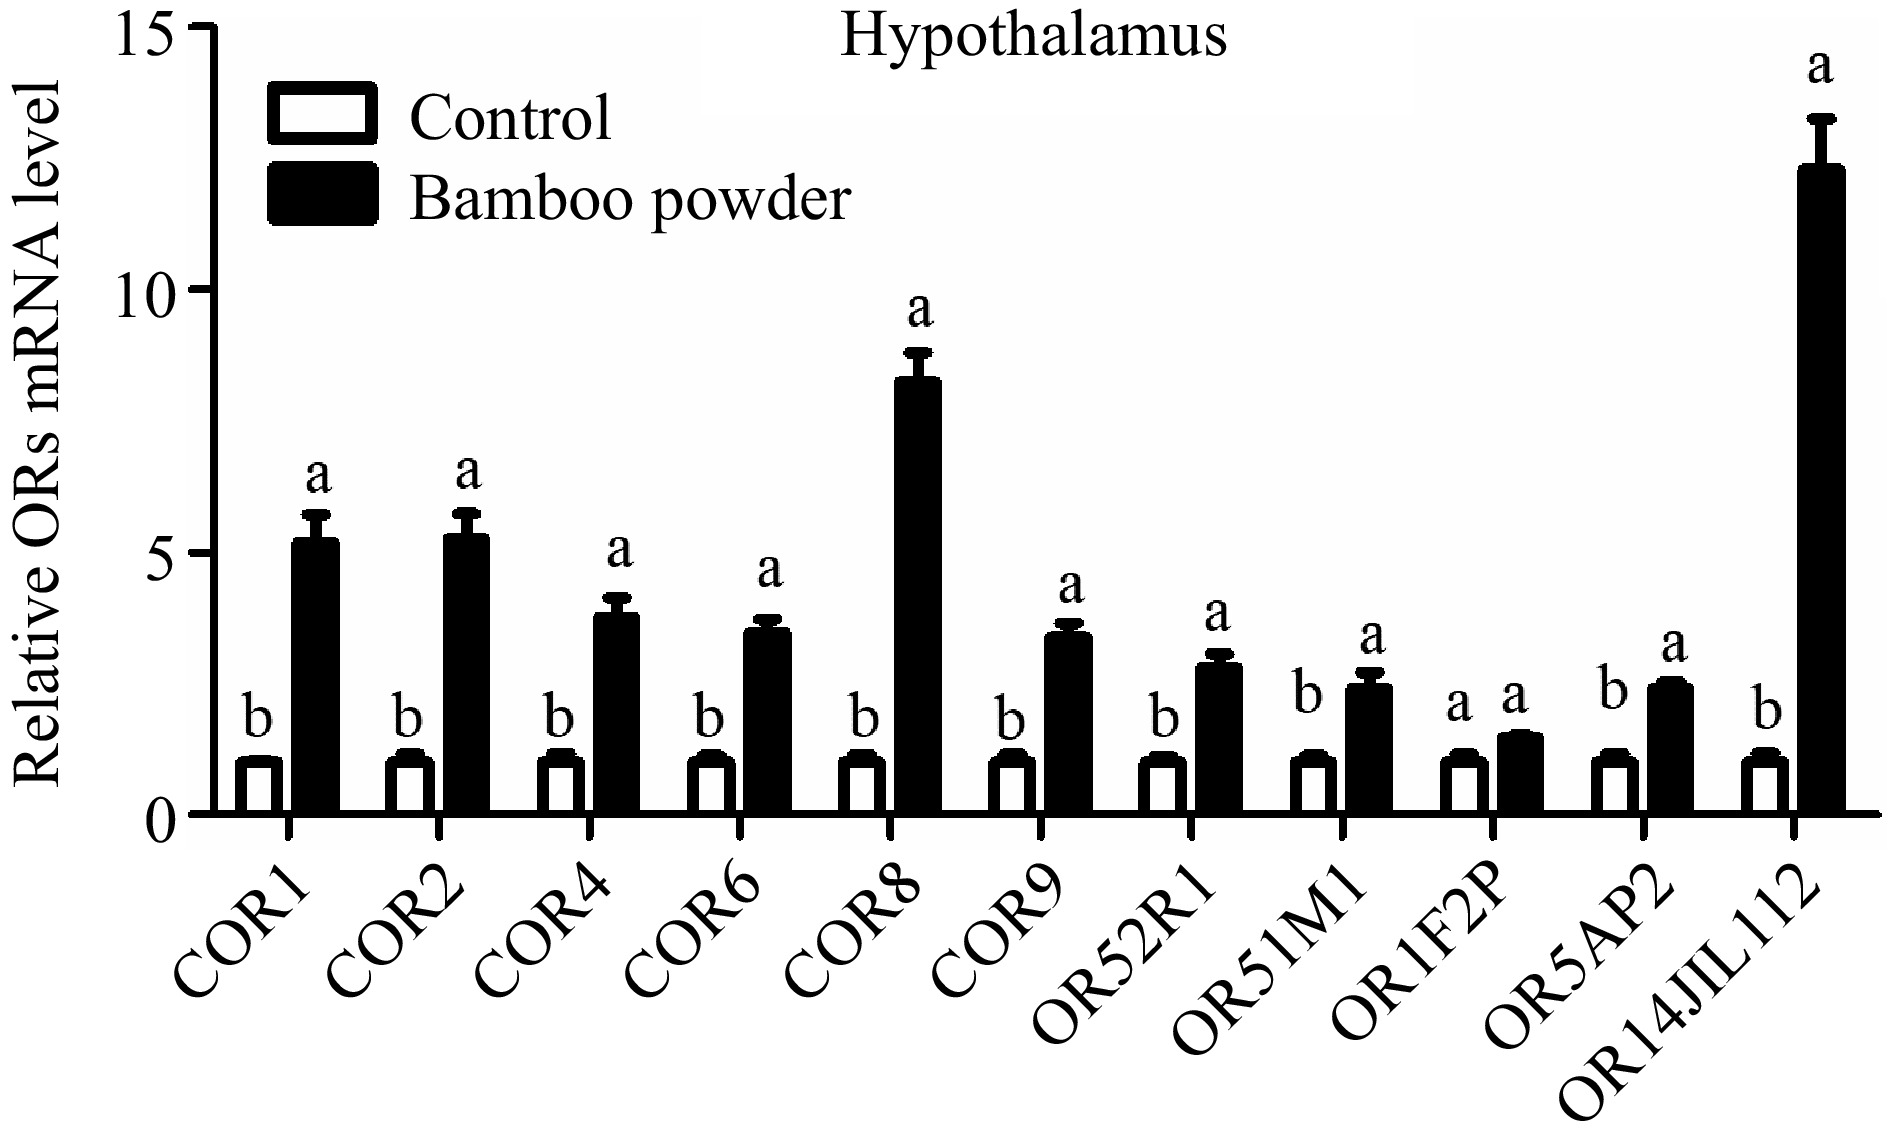
Figure 8.
Illustrates the qPCR expression levels of OR genes in the hypothalamus tissue of yellow broilers. The expression values were normalized against control data from the same samples to ensure accurate comparisons. Different letters in the figure indicate significant differences: 'a' represents higher expression levels, while 'b' indicates lower expression. The bar graphs depict the mean values, with error bars representing the standard error of the mean. Statistical significance at p < 0.05 is denoted by the letters 'a' and 'b', highlighting differences among the means.
Heatmap analysis
-
The heatmap analysis illustrates the variations across different groups, using a color gradient to represent value differences. Warmer colors indicate higher values, while cooler colors represent lower ones. This visualization method effectively highlights patterns and distinctions among the samples and groups (Fig. 9).
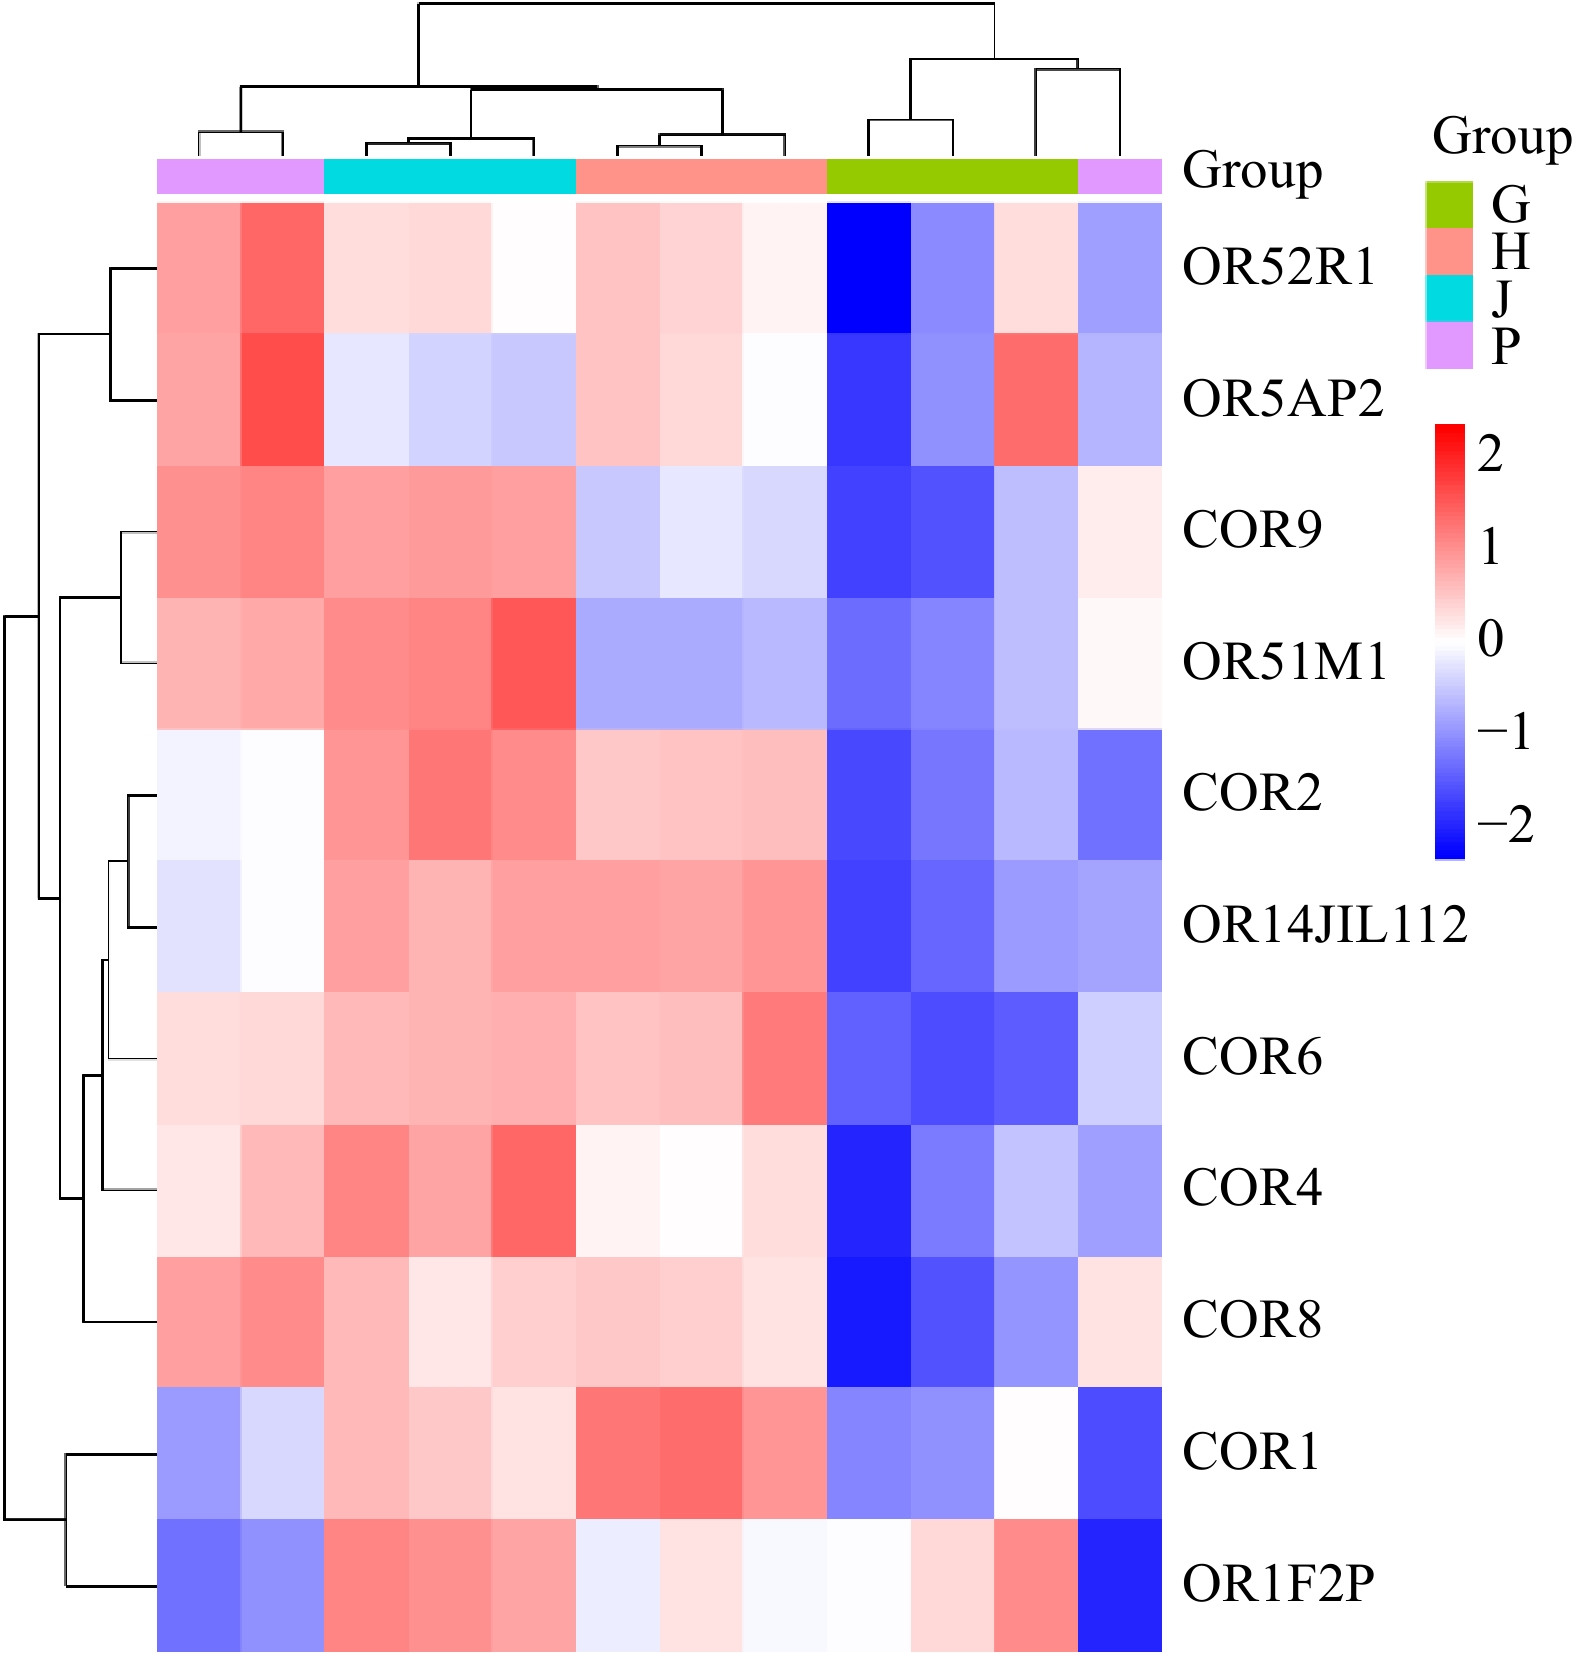
Figure 9.
Heatmap analysis of the samples across different organs samples. P: Proventriculus, G: Gizzard, J: Jejunum, H: Hypothalamus.
Correlation matrix of the samples
-
The correlation matrix of samples in the image shows high correlations among different tissues of yellow broiler chickens: the gizzard (G), proventriculus (P), jejunum (J), and hypothalamus (H). The matrix uses a color gradient where warmer colors represent higher correlations, while cooler colors represent lower correlations. The gizzard samples are highly correlated with each other, showing correlation coefficients of 1.00. Their correlations with the proventriculus, jejunum, and hypothalamus are slightly lower but still high, mostly above 0.98. Moreover, the proventriculus samples are also strongly correlated within their group (correlations of 1.00). There is a moderate decrease in correlation with the hypothalamus samples (correlation ranging between 0.96 and 0.97). Additionally, Jejunum samples show strong correlations within their group (1.00). Their correlations with other tissue types (Gizzard, Proventriculus, and Hypothalamus) are above 0.99, indicating very close relationships. Furthermore, Hypothalamus samples have strong correlations among themselves (1.00). Their correlations with the gizzard and jejunum are very high (above 0.98), but correlations with the proventriculus are slightly lower, reaching down to 0.96 (Fig. 10).
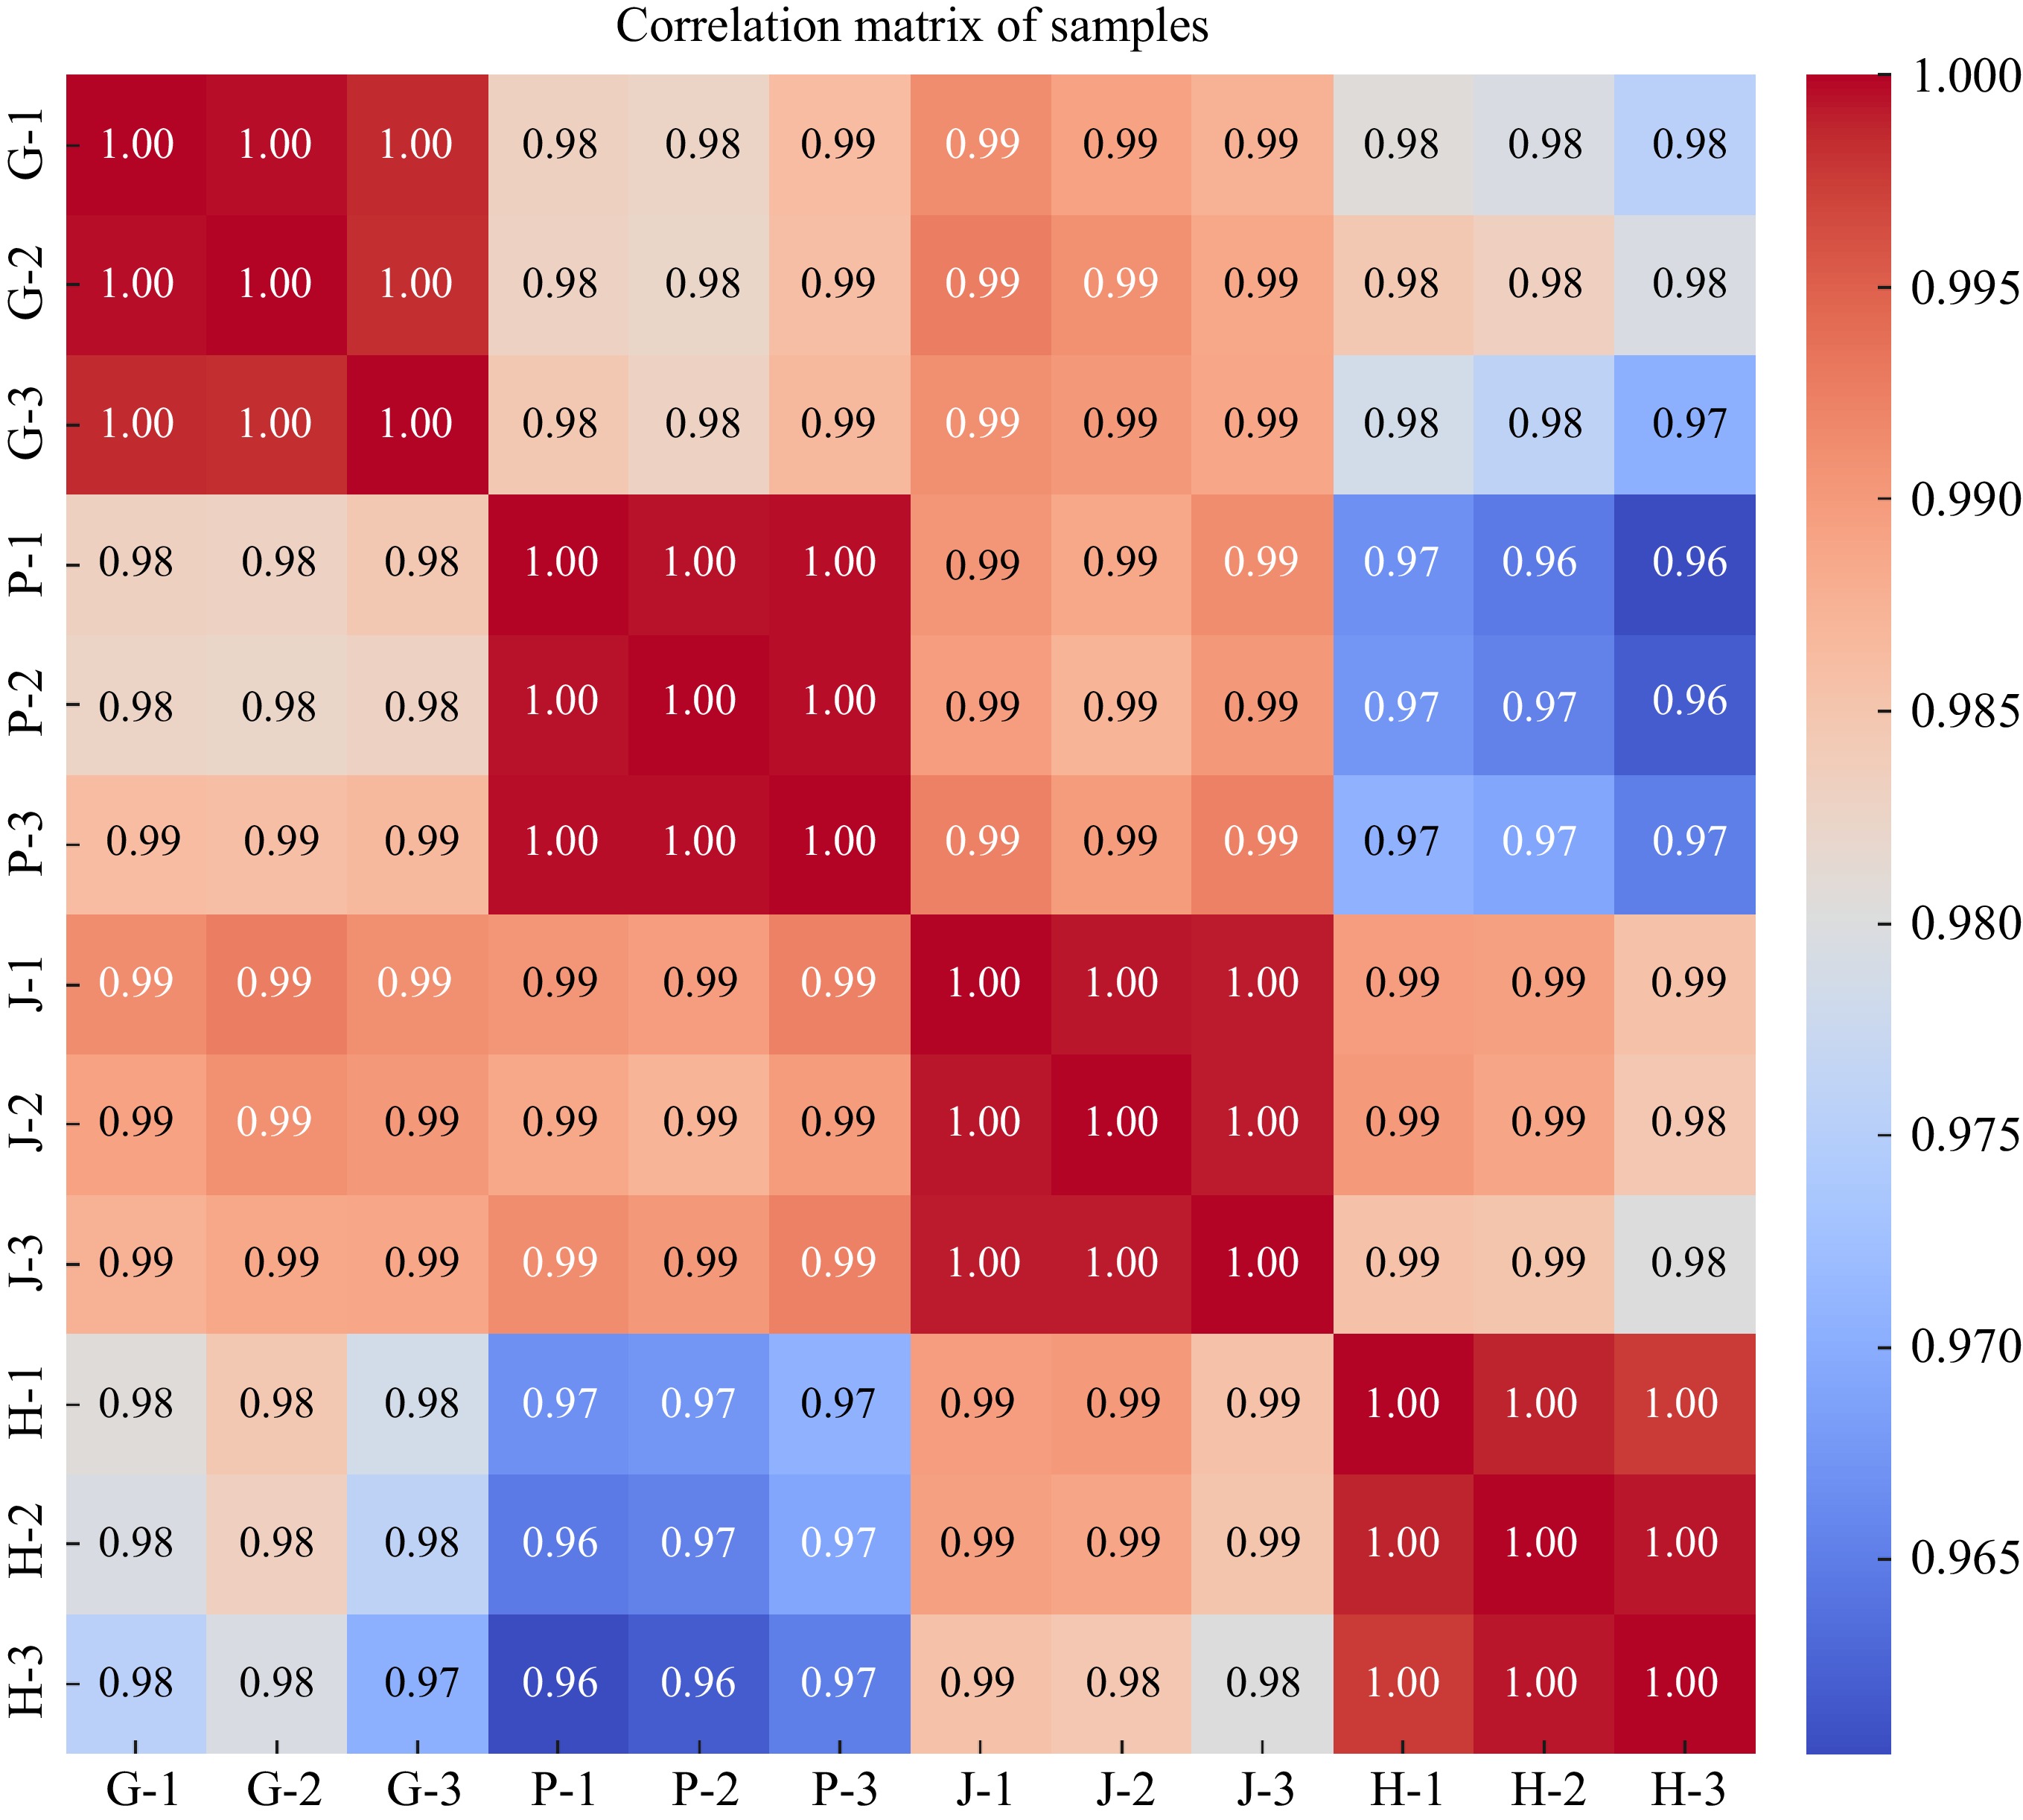
Figure 10.
The image displays the correlation matrix of the samples, represented as a heatmap. This heatmap visualizes the correlation coefficients between each pair of samples. The color gradient reflects the strength of the correlations, with values near 1 (red) indicating a strong positive correlation, while values closer to −1 (blue) represent a strong negative correlation. The samples are labeled as follows: P for Proventriculus, G for Gizzard, J for Jejunum, and H for Hypothalamus.
Effects of FBP supplementation on immune-related gene expression
-
To investigate the impact of FBP supplementation on immune-related genes expression, an in-depth analysis of IL-10, IL-2, and IL-6 genes in liver and spleen tissues were conducted, as elucidated in Fig. 11.

Figure 11.
Effects of FBP on immune-related gene expression. The figure presents a detailed analysis of the expression levels of IL-10, IL-2, and IL-6 genes in (a) liver, and (b) spleen of broilers. The bar graphs illustrate the mean values, with error bars representing the standard error of the mean. Statistical significance is indicated by asterisks (*, **), where * denotes p < 0.05 and ** denotes p < 0.01, reflecting differences among the means.
The present results demonstrate a marked upregulation in the mRNA expression levels of IL-10, IL-2, and IL-6 in the liver and spleen tissues of broilers supplemented with FBP. In the liver, the FBP-treated group exhibited a significant increase (p < 0.01) in the expression of IL-10, IL-2, and IL-6 compared to the control group. Similarly, in the spleen tissue, the FBP-supplemented group showed significantly (p < 0.05) elevated expression levels of these immune-related genes relative to the control group. These observed changes suggest enhanced immune regulatory activity, improved immune defense mechanisms, and the potential activation of the inflammatory response. The results underscore the positive impact of FBP supplementation on the modulation of immune-related genes in both the liver and spleen of broiler chickens, highlighting its potential role in bolstering immune responses and regulating inflammatory processes.
Effects of FBP supplementation on growth-related gene expression
-
To investigate the effects of FBP supplementation on the expression of growth-related genes, a detailed analysis of IGF-1, IGF-2, IGFBP-1, IGFBP-2, IGFBP-3, and cGH genes in liver and breast muscle tissues were conducted, as illustrated in Fig. 12. The present findings demonstrate a significant increase (p < 0.01) in the mRNA expression levels of growth-related genes, including IGF-1, IGF-2, IGFBP-1, IGFBP-2, IGFBP-3, and cGH, in the liver of the FBP-supplemented group compared to the control group. Likewise, the breast muscle tissue of the FBP-supplemented group exhibited a notable upregulation (p < 0.05) in the expression of these genes relative to the control group. In summary, the overexpression of growth-related genes in both liver and breast muscle tissues indicates potential positive effects on development and growth. This upregulation reflects enhanced tissue differentiation and growth, emphasizing the beneficial role of FBP supplementation in modulating growth-related genes in broiler chickens.
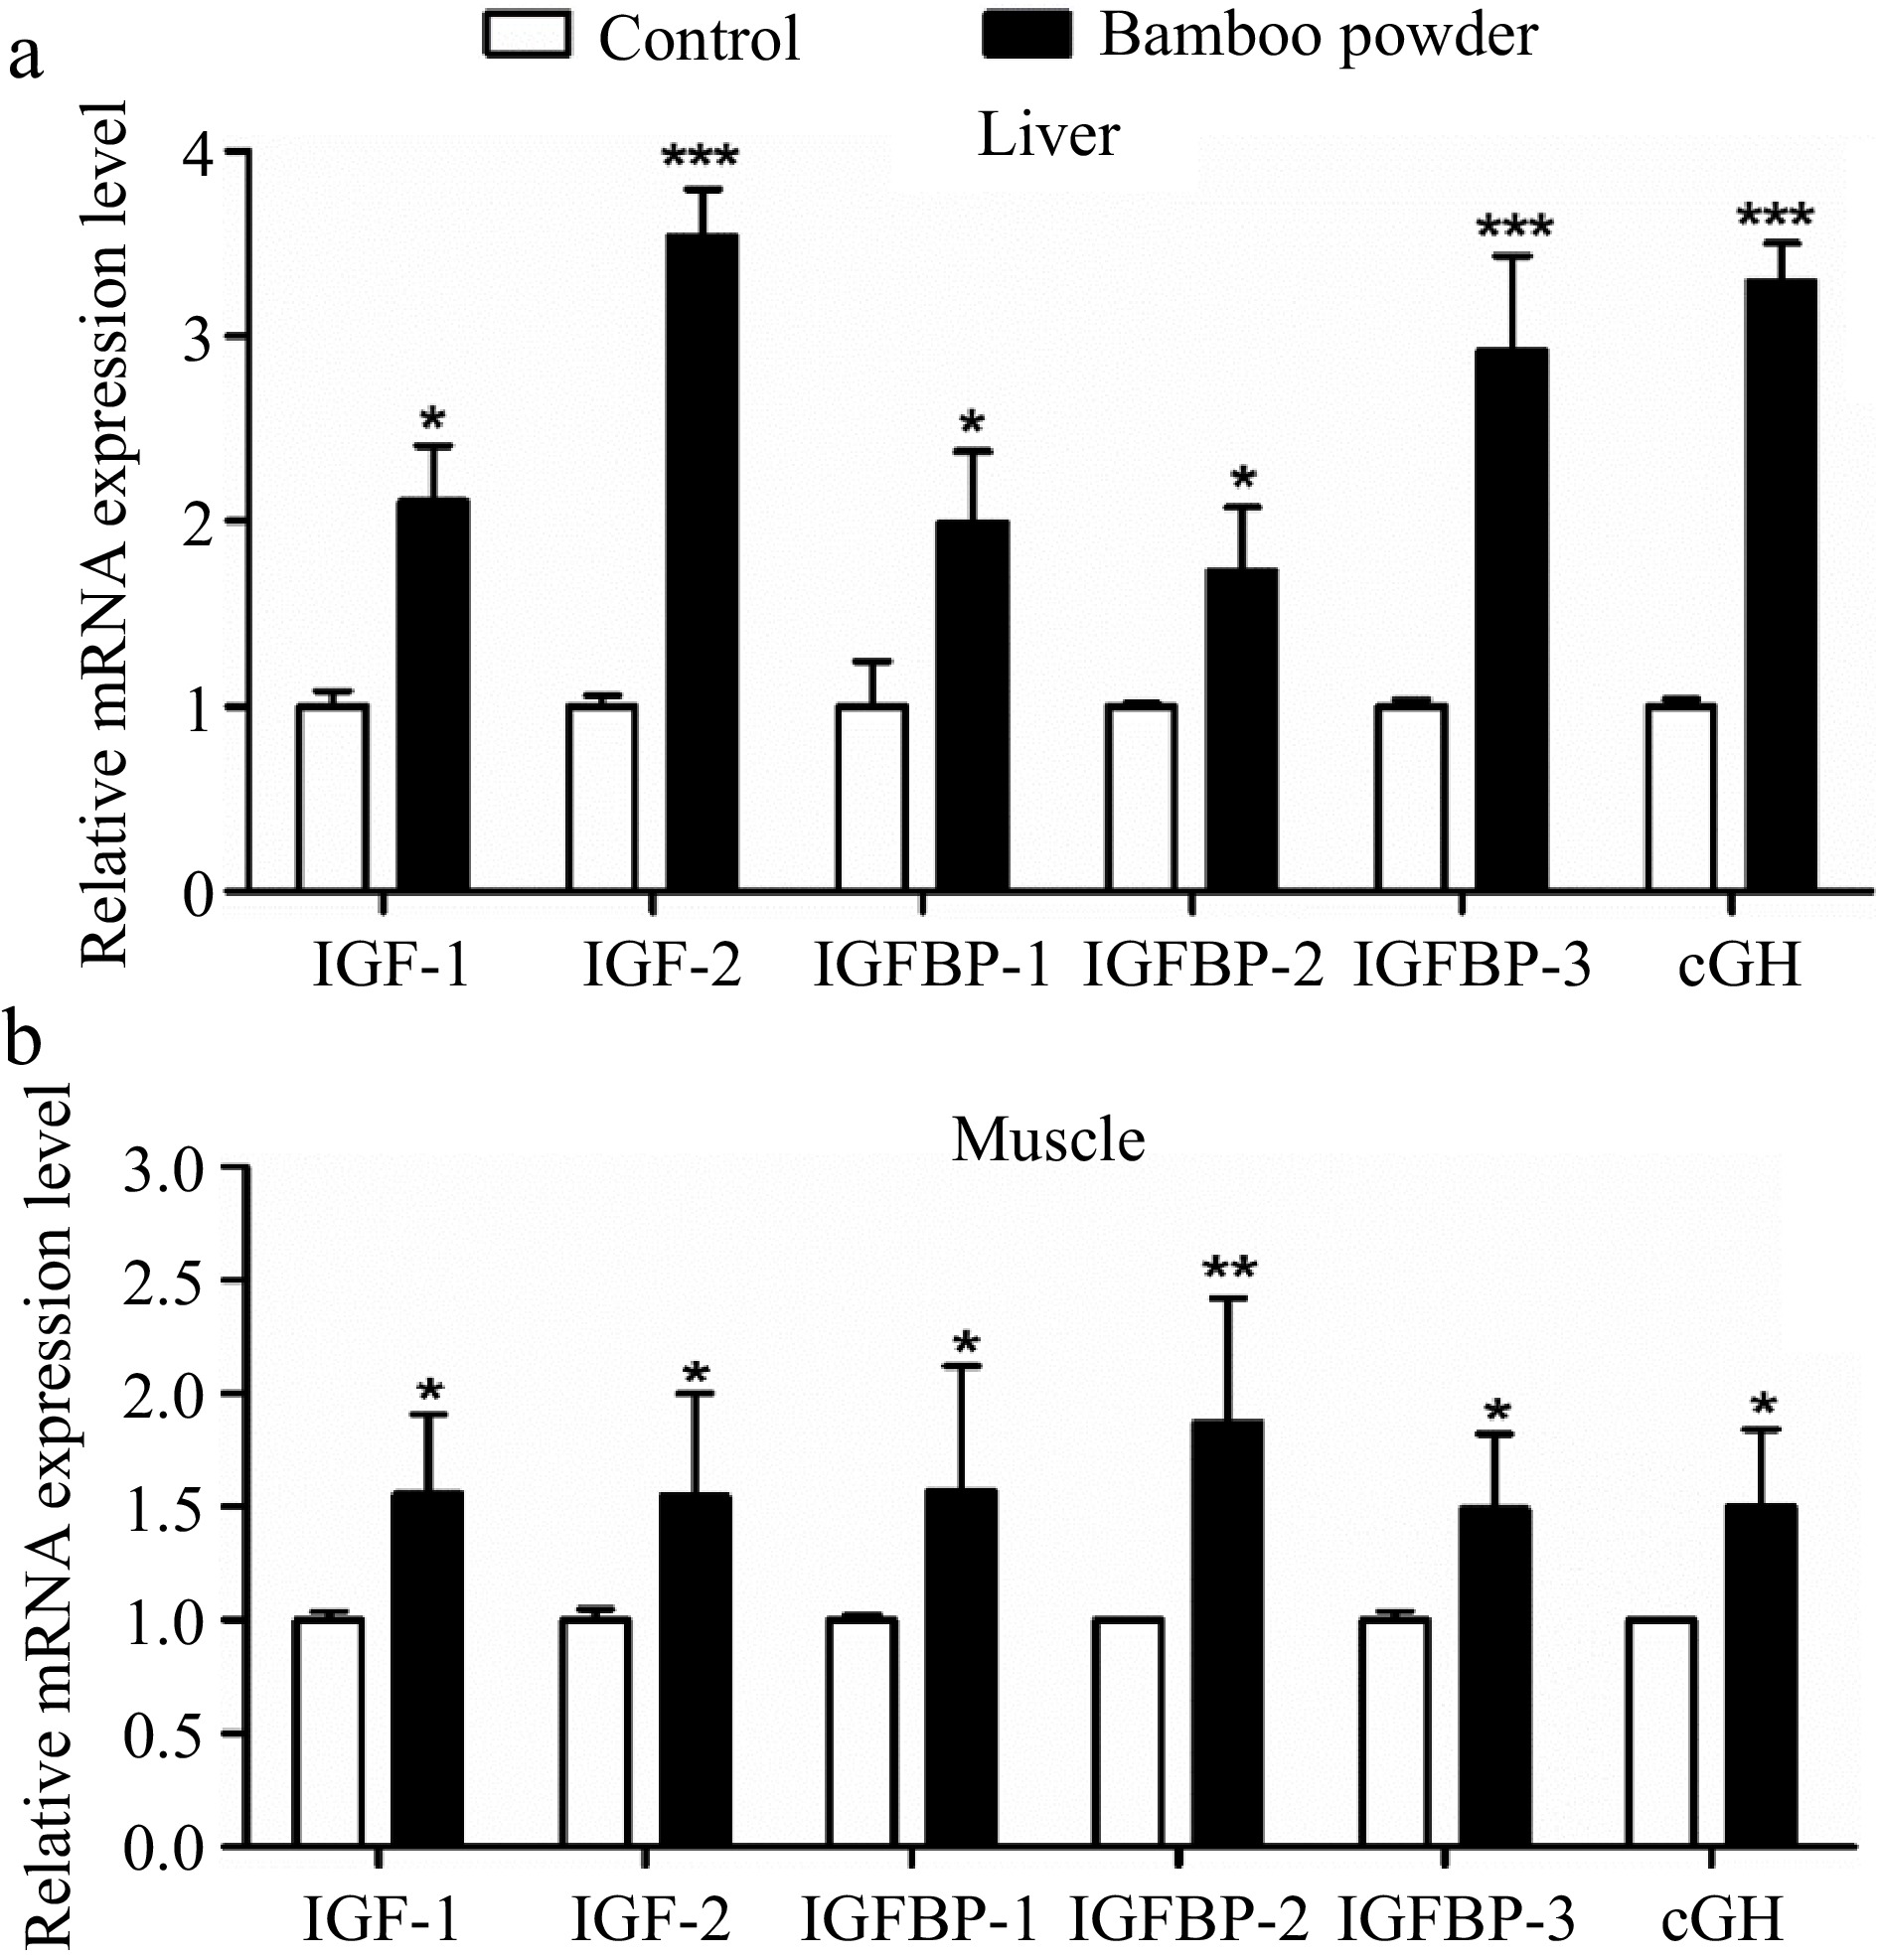
Figure 12.
Effects of FBP on growth-related gene expression. The figure presents a comprehensive analysis of the expression levels of IGF-1, IGF-2, IGFBP-1, IGFBP-2, IGFBP-3, and cGH genes in (a) liver, and (b) muscle of broilers. The bar graphs represent the mean values for each gene, with error bars displaying the standard error of the mean. Statistical significance is indicated by asterisks (*, **, ***), where * denotes p < 0.05, ** indicates p < 0.01, and *** represents p < 0.001, highlighting differences among the means.
Heat map analysis of gene expression related to antioxidant, growth, and immunity in broilers
-
In the present study, a comprehensive heat map analysis was conducted to visualize the expression levels of genes associated with antioxidant, growth, and immunity in various tissues of Yellow-Feathered Broiler Chickens (Fig. 13). The heat map provided a graphical representation of gene expression patterns, with the intensity of color serving as an indicator of the relative expression of each gene. The heat map analysis corroborates and reinforces the earlier findings reported in Figs 3, 11 & 12, affirming the trends observed in gene expression levels. The visualization of antioxidant, growth, and immunity-related gene expressions provides a holistic understanding of the impact of FBP supplementation on the molecular dynamics within different tissues of broiler chickens. This comprehensive analysis further strengthens the evidence supporting the positive influence of FBP on gene expression profiles associated with antioxidant defense, growth promotion, and immune enhancement in Yellow-Feathered Broiler Chickens.
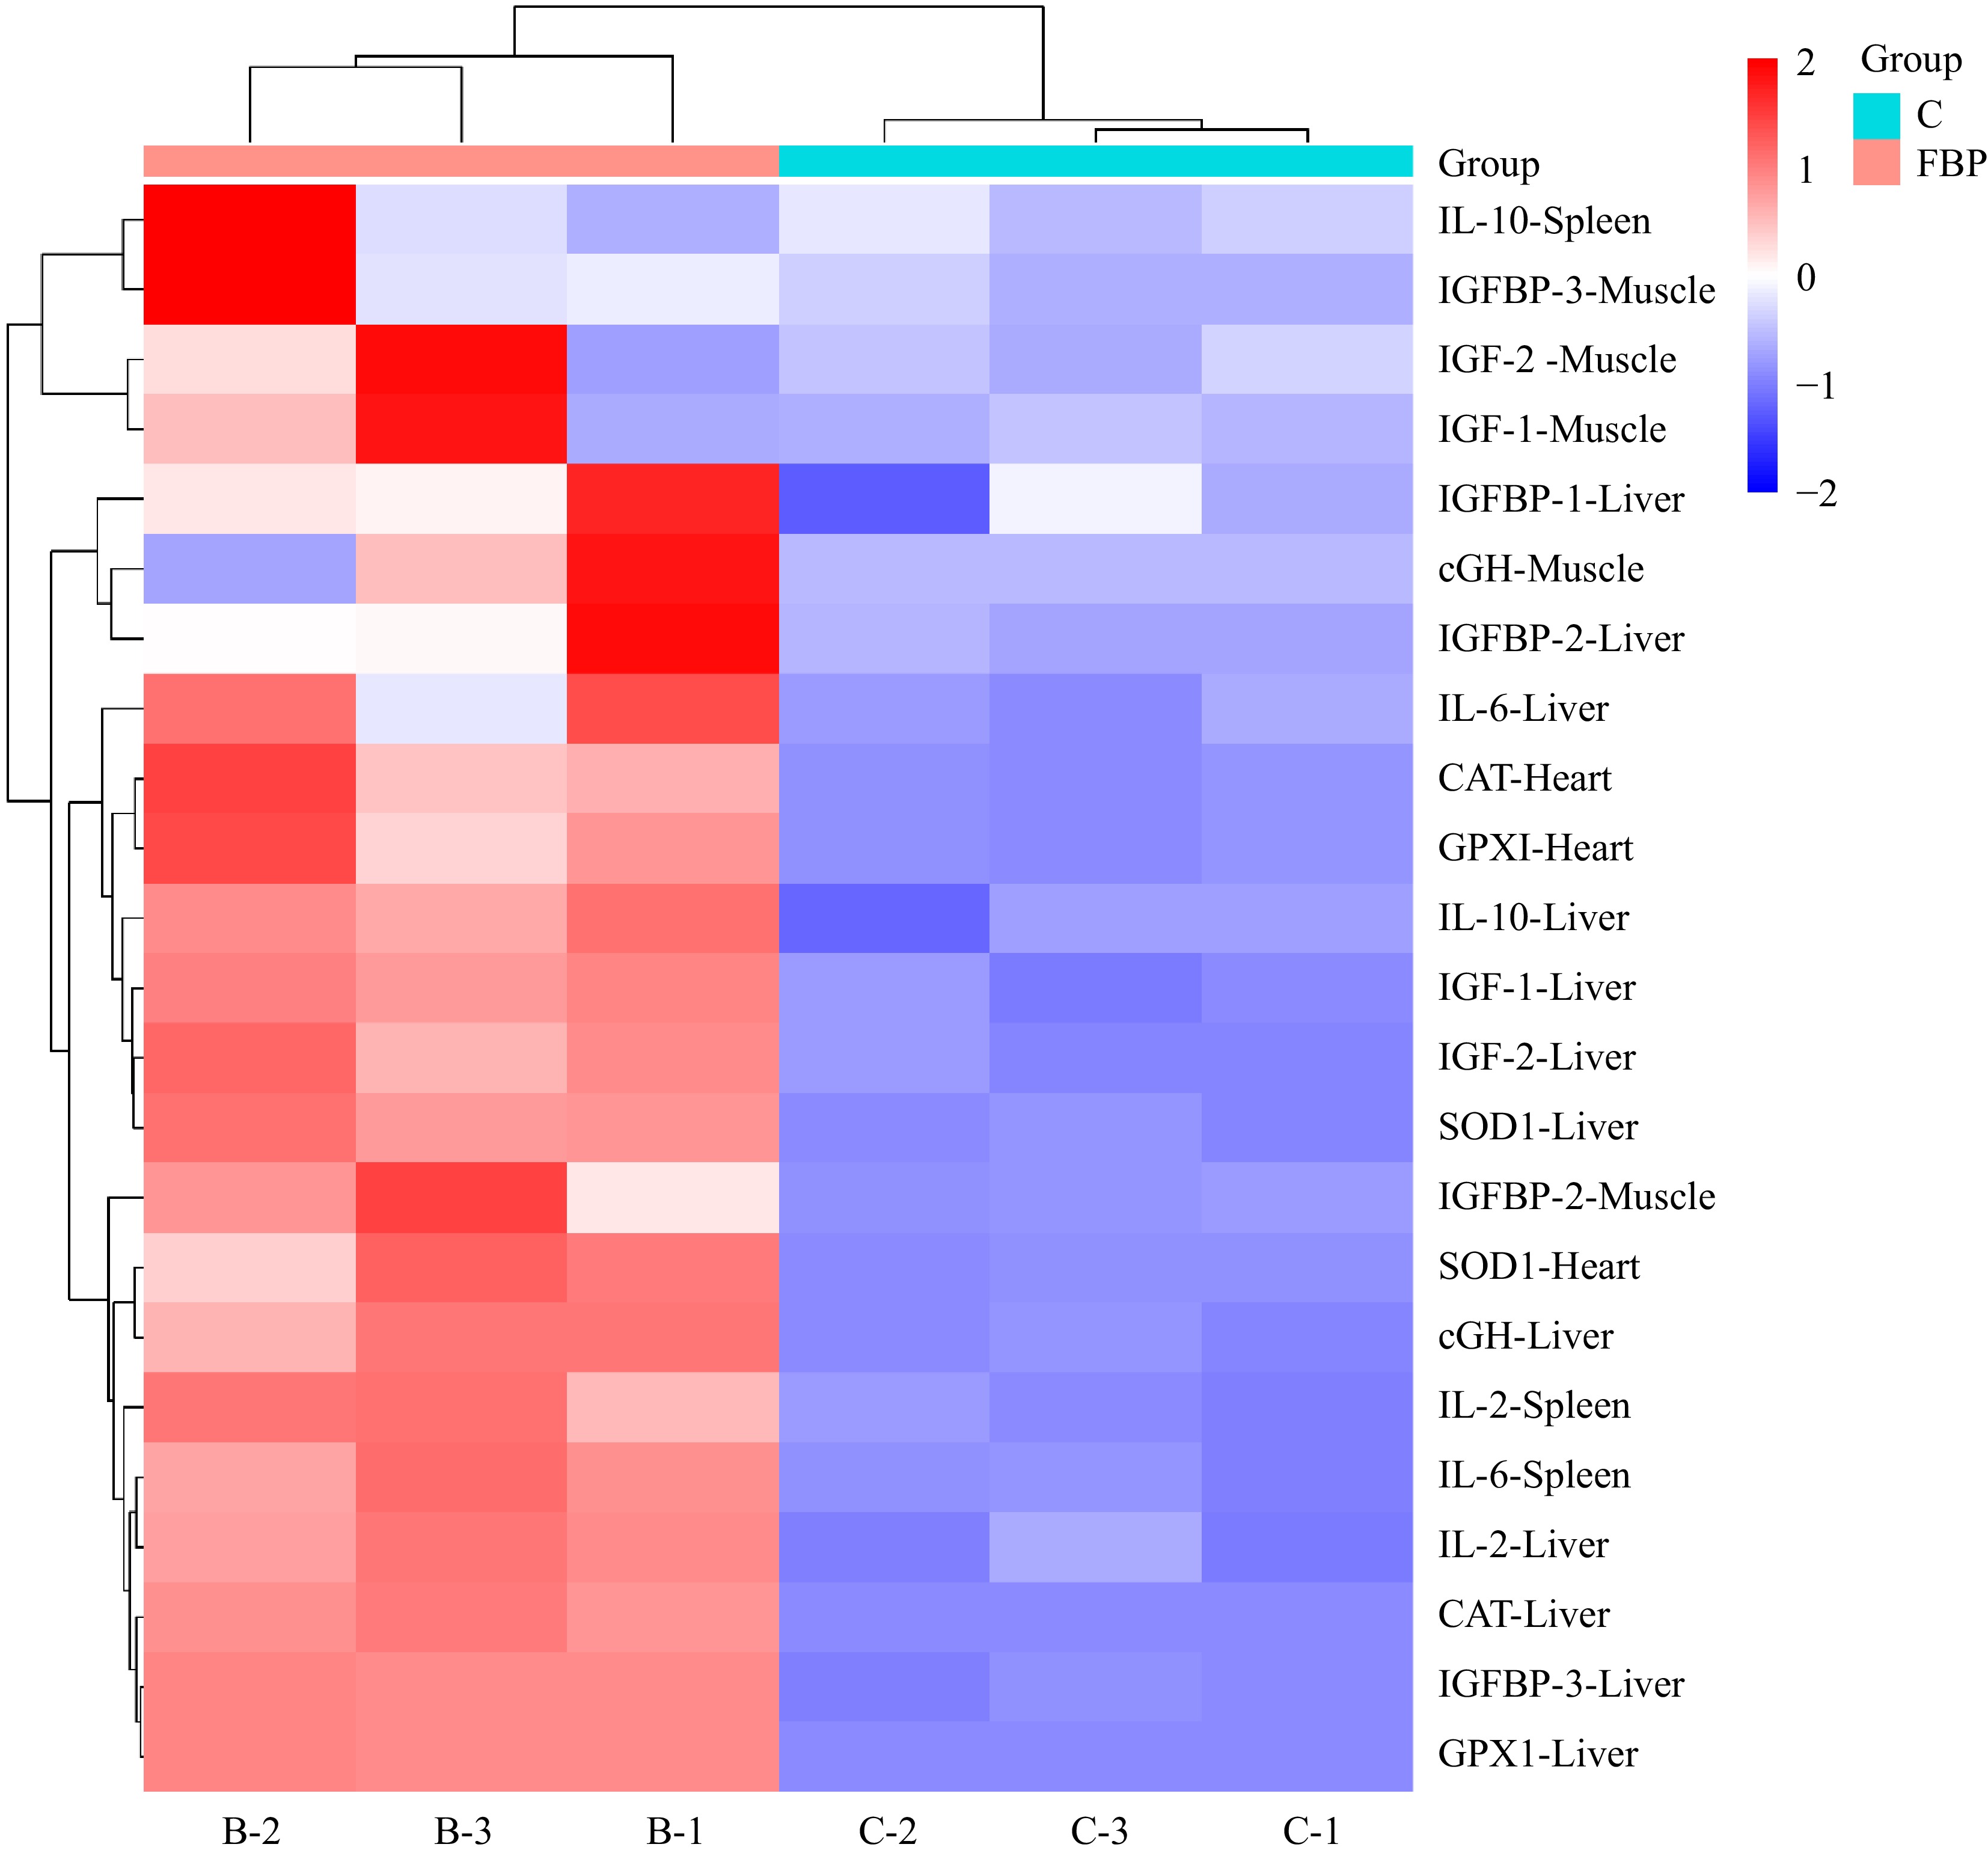
Figure 13.
Heat map analysis of FBP-supplemented broiler chickens. The figure presents the heat map analysis of antioxidant, growth, and immunity-related genes in Yellow-Feathered Broiler Chickens supplemented with FBP. The color intensity in the heat map reflects the relative expression of genes in different tissues. Higher intensities of red signify elevated expression levels of the respective genes, whereas lower intensities of blue indicate diminished expression levels.
-
This study investigated the effects of supplementing Yellow-Feathered Broiler chicken diets with fermented bamboo powder on various physiological parameters, including growth performance, immune response, and antioxidant status. The results demonstrated significant changes in gene expression, serum biochemical markers, and hormone levels, highlighting the notable impact of FBP supplementation.
Enhancements in intestinal morphology and organ development improve nutrient absorption, positively impacting growth performance. Incorporating an optimal amount of bamboo powder into broiler diets strengthens immune function and promotes intestinal health, leading to better growth outcomes[29]. Additionally, including 1%–1.5% insoluble dietary fiber from cassava pulp-modified fiber improves nutrient digestibility, reduces abdominal fat, and enhances muscle and gastric function in broilers[30]. Incorporating 3%–6% insoluble fiber into a wheat-based diet has been shown to improve broiler growth performance[31]. Similar outcomes have been observed with the addition of appropriate levels of structural insoluble dietary fiber[4]. However, a significant increase in fiber content considerably reduced the digestion of organic matter and energy[32]. Including 3%–6% insoluble fiber in the diet, such as sawdust, rice bran, or alfalfa meal, had no noticeable impact on broiler performance at slaughter[31]. Studies in chickens have shown that fasting leads to an increase in intrahepatic T4 levels and a decrease in T3 levels compared to chickens fed ad libitum[33]. Overall, feed additives have been investigated for their potential to modulate growth hormone levels in poultry. These additives may influence gut health and nutrient absorption, thereby indirectly affecting growth hormone regulation. Based on our research, adding FBP to broiler chicken diets can improve growth hormone levels in the serum, muscle, and liver, including IGF-1, GH, T3, and T4. As a previous study reported, chicken growth hormones, including cGH and IGF-I, are among the most crucial for growth performance and carcass quality in chickens[34].
In nutritional evaluations, serum biological markers, immunoglobulins, and inflammatory cytokines are commonly used to assess the quality of test feedstuffs or additives, as they reflect the animals' physiological, metabolic, and immune status[35−38]. In this study, the addition of FBP significantly affected immunoglobulins, inflammatory cytokines, and several serum biochemical markers. FBP supplementation increased AST, ALT, and ALP levels while reducing UREA and CREA levels compared to the control group. It also caused significant changes in inflammatory cytokines and immunoglobulins, including TNF-α, IL-10, IgA, IgG, IgM, IL-2, IL-6, and IL-1β. These findings align with previous research, which suggests that serum biochemical parameters are inversely related to the risk of cardiovascular disease, metabolic syndrome, liver and kidney disorders, and obesity[39]. In addition to improving immunological and serum biochemical markers, the addition of FBP to the diet also altered the pigs' fecal microbiome. These findings suggest that FBP could be a potential fiber-rich component for growing and finishing pigs, with a recommended inclusion of 5% in their diet[40]. Consistent with previous studies, the addition of FBP increased serum IgA concentrations, supporting findings from earlier research[41]. IgA plays a crucial role in defending against bacterial and viral infections in both serum and mucosal secretions[42].
Published studies suggest that the antioxidant properties of flavonoids in biological systems are attributed to their ability to transfer electron free radicals, chelate metal catalysts, activate antioxidant enzymes, and inhibit oxidase activity[43]. It is likely that the flavonoids in bamboo leaf extract (BLE) significantly contribute to increased antioxidant enzyme activity. The study indicates that BLE can scavenge peroxide[44]. As previously reported, dismutase mRNA expression in ileum tissue was significantly elevated when 1.0, 2.0, or 4.0 g/kg of BLE was added to poultry feed[45]. The current study found that the addition of FBP positively influenced the expression of genes related to antioxidants. Compared to the control group, FBP supplementation enhanced the expression of SOD1, GPX1, and CAT in the liver and heart. Similarly, research revealed that treating broiler chicks with BLE increased the expression of many of these antioxidant enzymes and their antioxidant capacity[46].
In this study, the expression levels of odorant receptors were investigated in various tissues, specifically the hypothalamus and gut. Our findings revealed significantly higher expression levels of odorant receptors in the hypothalamus compared to the gut. These results are consistent with previous studies, which also reported higher expression of odorant receptor genes in the brain than in the gut[47]. An intriguing hypothesis emerging from these findings is that odorant molecules encountered during food consumption may be transported to the brain, where they could influence neural regions involved in regulating food-related behaviors[47]. This aligns with previous studies suggesting that odorant receptors (ORs) may play significant roles in the central nervous system beyond olfaction. For example, Jiang et al. demonstrated that ORs in the hypothalamus are involved in detecting metabolic states and mediating feeding behaviors. The abundant presence of ORs in this brain region suggests they may sense endogenous or exogenous chemical signals that influence hypothalamic functions[48]. Although the expression levels of ORs were lower in gut tissues compared to the hypothalamus, their presence in the gastrointestinal tract is still noteworthy. ORs in gut tissues are thought to contribute to various physiological processes, including digestion, nutrient absorption, and gut motility. Previous research has shown that ORs can detect dietary chemicals and microbial metabolites, influencing gut function and health[49]. Additionally, in rodents, odorant receptors are found in several brain regions, such as the hypothalamus and the ventral tegmental area (VTA)[50]. In vitro experiments have shown that dopaminergic neurons in the VTA, which express odorant receptors, respond to natural odorant molecules. However, the exact endogenous ligands responsible for activating these receptors have yet to be identified. Notably, all odorant receptors analyzed in the study were expressed in the adult brain, with a particular presence in the habenula and hypothalamus. The hypothalamus is well-established as a key regulator of food intake[51,52] , while recent research has also implicated the habenula in the modulation of food-related behaviors[53−55].
This study explored the expression levels of odorant receptors (ORs) across various tissues of the model organism, focusing on the small intestines, gizzard, and proventriculus. Using molecular techniques such as RT-PCR and qRT-PCR, the findings revealed that ORs were expressed at significantly higher levels in the small intestines compared to the gizzard and proventriculus. These results provide new insights into the potential physiological roles of ORs within distinct regions of the avian gastrointestinal tract, suggesting specific functions related to nutrient detection and gut health. Notably, the small intestines are the primary site for nutrient digestion and absorption in birds. The significantly higher OR expression levels in this tissue suggest that these receptors play a key role in detecting and responding to various chemical cues related to ingested food. Previous studies in mammals have shown that ORs in the gut can detect dietary components and microbial metabolites, influencing digestion, nutrient absorption, and gut motility[49,56]. The present findings support the idea that ORs in the small intestines of birds may serve similar functions. The high expression levels of ORs in the small intestines could facilitate the detection of specific nutrients and other chemical signals, optimizing the digestive process and enhancing nutrient uptake. This capability may be particularly important for avian species with varied diets, enabling them to efficiently process and utilize a wide range of dietary components. Additionally, ORs in the small intestines might play a role in regulating the gut microbiota by detecting microbial metabolites and modulating immune responses to maintain gut health[57]. Overall, these results highlight the potential benefits of FBP supplementation, including enhanced health and development, as well as positive effects on growth hormone levels, biochemical markers, antioxidant activity, and the expression of immune-related and odorant receptor genes.
-
The study findings demonstrated that adding FBP to the diet had a significant positive impact on several aspects of biological functioning. FBP also increased growth hormone levels, serum biochemical markers, and growth-related functions. Overall, the results suggest potential benefits of FBP supplementation for immune-related gene expression, activation of odorant receptors, growth hormone regulation, biochemical indicators, antioxidant activity, and growth processes. These findings highlight FBP’s potential as a natural dietary supplement to promote general health and well-being. However, it is crucial to conduct further investigations to fully understand the mechanisms underlying these effects and to evaluate the long-term efficacy and safety of FBP supplementation.
-
All procedures were reviewed and preapproved by the the Institutional Animal Care and Ethical Committee of Nanjing Agricultural University (Nanjing, China), identification number: NJAULLSC2022008 approval date: 2022/1/1. Temperature was carefully controlled throughout the study, starting at 32–35 °C for the first five days, then gradually reduced to 22 °C and maintained consistently until the end of the experiment. At the conclusion, a total of 10 chickens were humanely euthanized. The research aimed to examine the effects of fermented bamboo powder (FBP) on the expression of genes related to antioxidants, odorant receptors, growth, and immunity in Yellow-Feathered Broiler chickens. The research followed the 'Replacement, Reduction, and Refinement' principles to minimize harm to animals. This article provides details on the housing conditions, care, and pain management for the animals, ensuring that the impact on the animals is minimized during the experiment.
This research was funded by the Jiangsu Provincial Seed Industry Revitalization Project (JBGS (2021) 108). The study was conducted at the College of Animal Science and Technology, Nanjing Agricultural University, Nanjing, Jiangsu, China.
-
The authors confirm contribution to the paper as follows: study conception and design: Malyar RM, Shi F; data collection: Malyar RM, Hou L, Elsaid SH; analysis and interpretation of results: Malyar RM, Ali I, Shi F; draft manuscript preparation: Malyar RM, Ding W, Wei Q, Zhou W. All authors examined the findings and gave their approval for the final version of the manuscript.
-
All data generated or analyzed during this study are included in this published article.
-
This article does not have any conflicts of interest. Weisheng Zhou and Fangxiong Shi are the Editorial Board members of Animal Advances who were blinded from reviewing or making decisions on the manuscript. The article was subject to the journal's standard procedures, with peer-review handled independently of these Editorial Board members and the research groups.
- Copyright: © 2024 by the author(s). Published by Maximum Academic Press on behalf of Nanjing Agricultural University. This article is an open access article distributed under Creative Commons Attribution License (CC BY 4.0), visit https://creativecommons.org/licenses/by/4.0/.
-
About this article
Cite this article
Malyar RM, Ding W, Wei Q, Sun J, Hou L, et al. 2024. Effects of fermented bamboo powder supplementation on gene expressions of antioxidant, odorant receptors, growth and immunity in yellow-feather broiler chickens. Animal Advances 1: e005 doi: 10.48130/animadv-0024-0005
Effects of fermented bamboo powder supplementation on gene expressions of antioxidant, odorant receptors, growth and immunity in yellow-feather broiler chickens
- Received: 24 August 2024
- Revised: 23 September 2024
- Accepted: 18 October 2024
- Published online: 08 November 2024
Abstract: Bamboo powder, an economically advantageous supplement for broiler diets, contains a significant amount of insoluble fiber, making its inclusion essential. This study aimed to investigate the effects of fermented bamboo powder (FBP) on the expression of genes related to antioxidants, odorant receptors, growth, and immunity in Yellow-Feathered Broiler chickens. Six hundred healthy 1-day-old chicks were randomly divided into two groups: Control (CON) and Fermented Bamboo Powder (FBP) supplementation. Each group consisted of 10 replicates, with 30 chicks per replicate. The CON group was fed a basal diet, while the FBP group received the basal diet supplemented with FBP across four distinct phases. The first two phases were designated as pretreatment, while the latter phases comprised the experimental period. Tissue samples were collected for analysis at the end of phase IV. The results revealed that supplementation with FBP (p < 0.05) significantly increased the mRNA levels of genes related to antioxidants, odorant receptors, growth, and immunity. Additionally, growth hormone levels, including IGF-1, GH, T4, and T3, were significantly higher (p < 0.01) in the FBP group compared to the control. Moreover, the FBP group exhibited a notable increase in biochemical markers (ALT, AST, and ALP) and immune indicators (IgA, IgG, IgM, IL-2, IL-6, and IL-1β), while levels of TNF-α, CREA, and UREA were significantly reduced (p < 0.01) compared to the control group. These findings highlight the potential of FBP as a natural supplement, positively influencing growth, immunity, and antioxidant mechanisms in broiler chickens.
-
Key words:
- Antioxidant /
- Fermented Bamboo powder /
- Growth hormone /
- Immunity /
- Broiler Chickens /
- Odorant receptors.


