


-
Tea aroma is regarded as a key indicator for evaluating tea quality, with the composition and concentration of aroma compounds varying significantly based on tea cultivars, geographical origin, and processing techniques[1−3]. However, tea quality also depends on the raw material, as fresh leaves are rich in various chemical components, including tea polyphenols, theanine, alkaloids, and aromatic substances. Although aromatic compounds represent a relatively minor proportion of fresh leaves, they are highly diverse.
Green tea cultivars are widely grown throughout China, with major production concentrated in Zhejiang and Anhui provinces. Representative cultivars include 'Longjing 43', 'Jiaming 1', and 'Shuchazao'[4,5]. Green tea is predominantly characterized by faint scents, sweet, and chestnut-like notes. On the other hand, cultivars for manufacturing oolong tea are cultivated in regions such as southern and northern Fujian, Guangdong, and Taiwan, represented by cultivars like 'Tieguanyin', 'Jinmudan', 'Zhilanxiang', and 'Jinxuan'[6,7]. It exhibits more complex aroma characteristics, renowned for its natural floral and fruity notes. The aromatic characteristics of green tea and oolong tea have long been a focal point of extensive research within the field of tea science[1,8,9]. Relevant studies have demonstrated that 'Taipinghoukui' green tea is characterized by floral, chestnut-like, and faint scent aromas. The floral aromas are largely attributed to elevated levels of linalool and its oxides, whereas the chestnut-like aroma is primarily intensified through the combined effects of 3-methylbutanal, 2-ethyl-1-hexanol, and indole[10]. Wuyi rock tea's aroma is mainly defined by floral, cinnamon, and roasted notes. Throughout the roasting process, volatile compounds, particularly linalool and β-ionone, play a crucial role in shaping its distinctive fragrance[11]. Research into the aroma characteristics of green tea and oolong tea has largely concentrated on dry tea, with an emphasis on how processing techniques influence aromatic composition, and analyzing the aromatic compounds associated with different aroma types[12−15]. Nevertheless, there are also a few studies that focus on the aromatic properties of tea plant cultivars. Research indicates that oolong tea made from 'Huangmeigui' and 'Zimudan' has a distinct floral aroma, accompanied by exceptionally strong popcorn, cream, and caramel aromas[16]. In addition, green tea made from 'Zhonghuang 1' has a unique aroma of ripe corn, which is completely different from green tea produced from other cultivars[17].
Research on the aroma of fresh leaves suitable for producing specific tea types remains limited and fragmented. To comprehensively compare the volatile compound characteristics of GT (tea cultivars suitable for producing green tea) and OT (tea cultivars suitable for producing oolong tea) fresh leaves, this study employs headspace solid-phase microextraction coupled with gas chromatography-mass spectrometry (HS-SPME-GC-MS) to extract and analyze aroma volatile compounds from 31 tea cultivars collected from different regions. SPME is widely recognized for its exceptional sensitivity and selectivity, making it a preferred method for isolating tea aroma compounds[18−20]. The findings of this study establish a theoretical framework for understanding cultivar-specific aroma signatures and support the breeding of high-aroma tea varieties.
-
The classification of cultivars as suitable for green tea (GT) or oolong tea (OT) production was based on their processing suitability and prevalent regional usage. GT cultivars such as 'Fuding Dabaicha', 'Shuchazao', and 'Longjing 43' are widely recognized in prior agronomic and breeding studies for their use in green tea manufacturing[4,5]. Similarly, cultivars like 'Tieguanyin', 'Huangdan', and 'Rougui' have long been cultivated and processed as oolong tea due to their biochemical profiles and sensory characteristics conducive to oolong tea quality[6,7]. The full list of cultivars and their categorization is provided in Supplementary Table S1. The 31 tea cultivars analyzed in this research were collected from the tea germplasm resource garden of Fujian province, China, in May 2024, under uniform conditions. For each cultivar, three to five one-bud and two-leaf (healthy and free of pests and diseases) samples were picked as the experimental materials. The fresh leaves were immediately placed into 25 mL centrifuge tubes and rapidly frozen with liquid nitrogen. After freezing, the tea samples were dried in a freeze dryer (EYELA-FDU-1200, China), ground into fine powder (40-mesh sieve), and then stored at −20 °C for subsequent analysis.
Collection and analysis of volatile compounds in tea samples
SPME extraction of volatile compounds
-
Volatile compounds were extracted using a solid-phase microextraction (SPME) fiber needle (57328-U, 50/30 μm, DVB/CAR/PDMS), which was preconditioned by thermal desorption at 230 °C for 5 min in the GC-MS injection port to eliminate potential contaminants. Then, 0.1g (accurate to 0.001g) of tea powder was weighed and placed into a 20 mL headspace vial. To this, 10 μL of the internal standard, ethyl decanoate (50 μg/mL), and 5 mL of boiling distilled water were added. The vial was securely sealed and equilibrated in a 60 °C water bath for 5 min, followed by the insertion of the SPME fiber needle for headspace extraction over 60 min. Subsequently, the fiber needle was transferred to the GC-MS injector port at 250 °C, where it was extended for 5 min to allow for desorption[21]. Perform three biological replicates on each tea sample.
GC-MS analysis
-
The GC analysis was carried out using a Shimadzu GC-MS-QP2020 NX (Shimadzu, Japan) coupled with a DB-5MS capillary column (30 m × 0.25 mm, 0.25 μm, Agilent, USA). The column temperature program was as follows: Initial temperature 40 °C for 3 min, then increased to 200 °C for 2 min (4 °C/min), and then reached 270 °C for 2 min (10 °C/min). The injection port temperature was set to 250 °C in splitless mode. The carrier was helium gas (purity ≥ 99.999%, 1.2 mL/min), and a solvent delay of 4 min was applied[22,23].
The MS analysis utilized electron impact ionization (EI), with the ion source temperature configured at 230 °C, the quadrupole at 150 °C, and the interface temperature set to 280 °C. The electron energy was consistently maintained at 70 eV. The analysis was conducted using the selected ion monitoring (SIM) mode to enable accurate qualitative and quantitative ion detection[24,25].
Qualitative, relative quantitative, and rOAV analysis of volatile compounds
Qualitative
-
The mass spectrometry peaks from the raw data were matched against the NIST 20 database, screening for compounds with a match score exceeding 75. Redundant peaks, background noise, and unidentified low-intensity signals were removed. Only compounds with well-defined peak shapes and reliable retention times were included in the final dataset. The retention indices (RI) of the target compounds were calculated by referencing the retention times of n-alkanes (C8−C40) measured under identical mass spectrometry conditions. The calculated RI values were then validated by comparing them with previously reported data in the literature or accessible through established online resources (
https://webbook.nist.gov/chemistry/ ).Relative quantification
-
The relative concentration of the compound (μg/L) was calculated using the formula: [Concentration of the internal standard (50 μg/mL) × Volume of the internal standard added (0.01 mL)/Volume of water (5 mL)] × 1,000 × Peak area of the target compound/Peak area of the internal standard[26].
rOAV (relative Odor Activity Value) analysis
-
The odor activity value is a widely applied metric for evaluating the impact of volatile compounds on the perceived aroma characteristics. The odor threshold is defined as the minimum level of a compound at which its smell becomes detectable in water[27,28].
$\rm rOAV\; calculation\; formula : rOAV= \dfrac{{\mathrm{C}}_{\mathrm{i}}}{{\mathrm{O}\mathrm{T}}_{\mathrm{i}}} $ where Ci represents the amount of the compound present in the sample (μg/L). OTi denotes the compound's odor threshold in water (μg/L)[29].
Construction of a random forest model
-
Using the differential volatile compounds identified across 31 tea cultivars, a random forest model was developed with the R package random forest (version 4.2.0, with the varSeIrf 0.7.8). Prior to running the model validation, the quantitative data of the volatile compounds were centered and standardized. The model's accuracy was subsequently assessed using the receiver operating characteristic (ROC) curve[30]. To assess the performance of the selected features in an independent validation cohort, an ROC curve was generated with the R package pROC (version 3.5.1, with pROC 1.16.2)[31].
Statistical analysis
-
In the study, volatile compounds were collected and analyzed from tea samples, with three biological replicates for each sample. After comparing the raw data with the database, organize it into clean data using Microsoft Office Excel 2012. Duncan's multiple range tests and independent sample t-tests were carried out with IBM SPSS Statistics version 26[32]. Multivariate analysis (Principal Component Analysis, PCA, and Orthogonal Partial Least Squares Discriminant Analysis, OPLS-DA) was performed using the Metware Cloud platform (
https://cloud.metware.cn ). Differential volatile compounds were screened according to a p-value < 0.05 and a variable importance in projection (VIP) value ≥ 1. Draw a visual heatmap using TBtools (version 2.112) software and construct a column chart using Origin 2021 (version 9.8.5). -
Tea plants from different origins often exhibit distinct quality characteristics. The primary production regions for OT are concentrated in Fujian, Guangdong, and Taiwan, where the tea produced is typically characterized by a high-aroma quality. GT is widely cultivated across several provinces in China, including Anhui, Zhejiang, Sichuan, Hunan, and Shaanxi, with green tea from Zhejiang and Anhui being particularly renowned. Previous studies have reported that green tea and oolong tea exhibit distinct aroma profiles due to differences in processing technologies. In this study, we observed that GT contained higher levels of volatile compounds compared to OT, with significant differences in the composition of these compounds (Supplementary Fig. S1). On this basis, this study selected 15 tea plant cultivars suitable for making GT and 16 cultivars suitable for making OT, and systematically explored the differences in volatile components in their fresh leaves (Fig. 1).
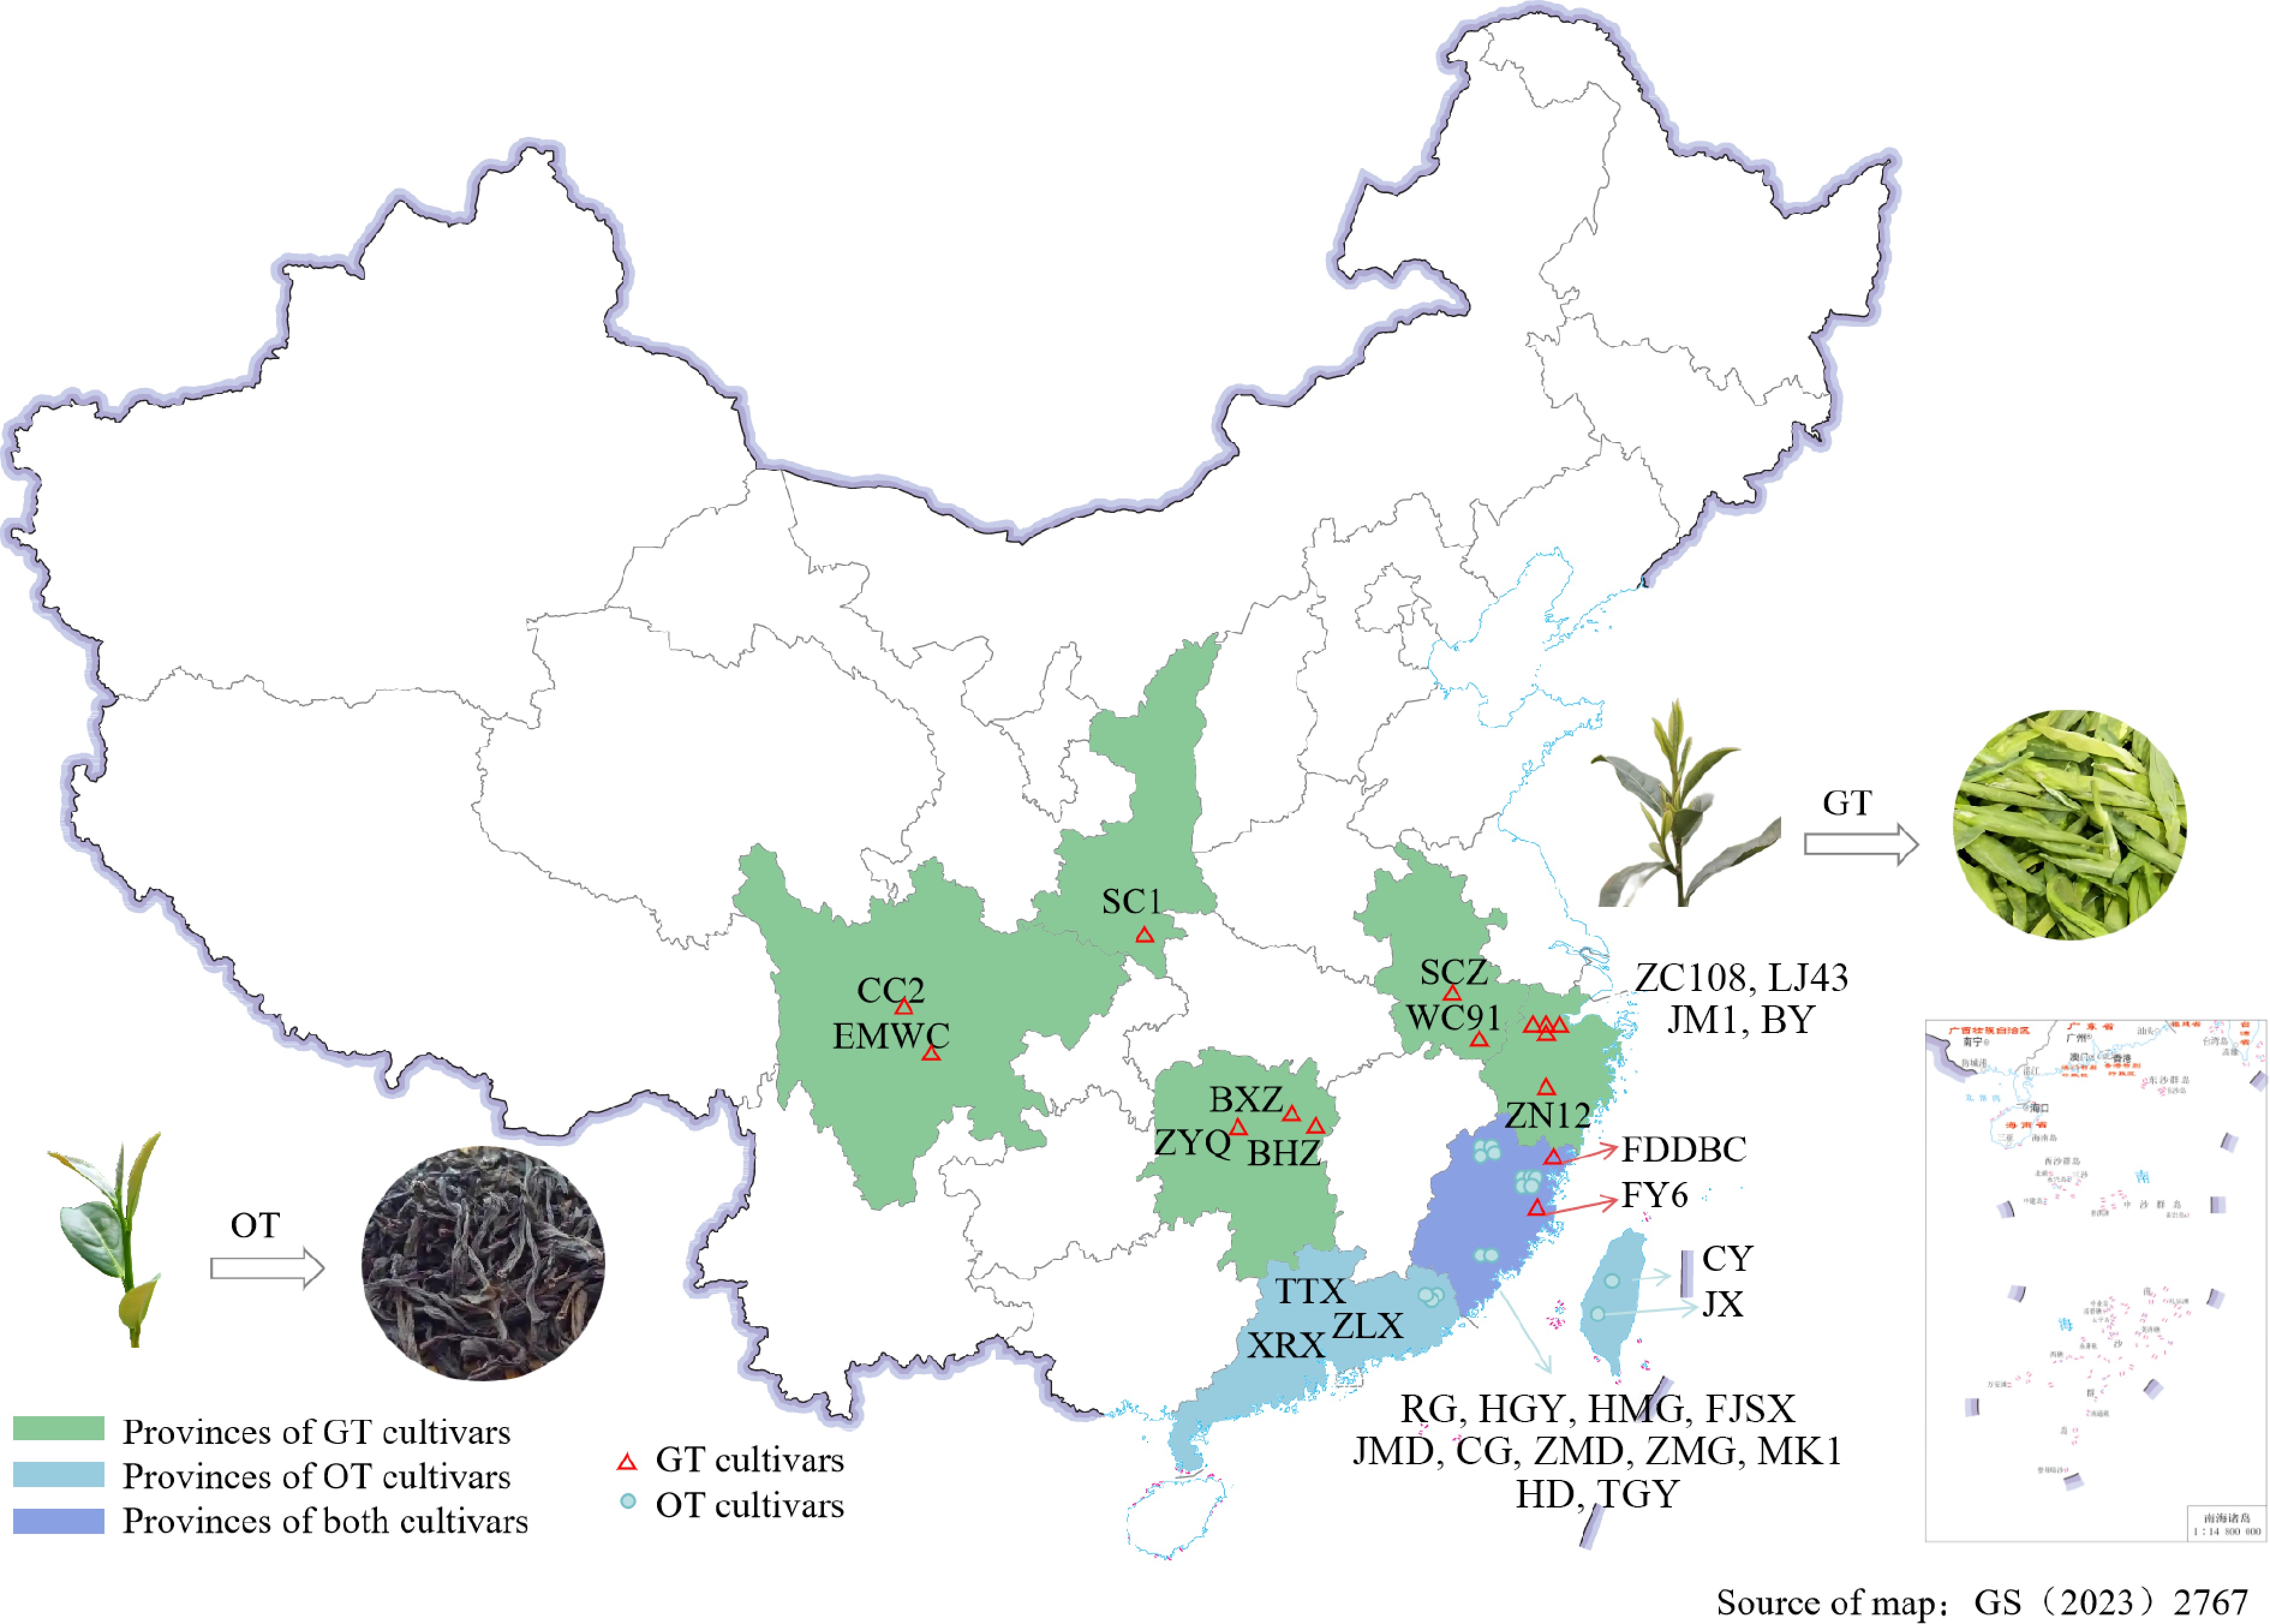
Figure 1.
Geographical distribution of 31 tea cultivars. * Map lines delineate study areas and do not necessarily depict accepted national boundaries.
Identification and comparison of volatile components in GT and OT
-
An overall count of 239 volatile compounds was successfully identified across 31 tea plant cultivars. These compounds were categorized into nine distinct groups (Fig. 2a), consisting of 49 alkanes, 47 alcohols, 44 esters, 27 ketones, 24 alkenes, eight aromatic hydrocarbons, five heterocyclic compounds, and three acids. Among these, alkanes, alcohols, and esters together comprise over half of the volatile compounds, contributing 20.5%, 19.67%, and 18.41%, respectively, highlighting their dominant presence among the volatile constituents in fresh leaves. Notably, Alkanes account for a high proportion of volatile compounds, but they mainly present a waxy and oily odor, with limited influence on the overall fragrance of green and oolong teas. In contrast, alcohols and esters play a dominant role in shaping the floral and fruity aromas in green and oolong teas[33,34]. Based on processing suitability, the 31 tea plant cultivars were classified into two groups: those suitable for green tea processing (GT) and those suitable for oolong tea processing (OT). From the analysis of the Venn diagram (Fig. 2b), it is found that both GT and OT shared 206 volatile compounds. The GT contains 32 volatile compounds with specificity, including 2,6-dimethyl-1,7-octadiene-3,6-diol, ethyl hexanoate, and 2-octanone, among others. However, E,Z-2,6-dimethylocta-2,4,6-triene was only found within OT, which may be an important reason for its floral and balsamic aromas. Further investigation identified notable differences in the total amounts of volatile compounds among different categories between GT and OT (Fig. 2c). The overall level of alcohol compounds in GT (33,662.78 μg/L) is markedly greater compared to that in OT (2,399.53 μg/L), with the main differences observed in the contents of linalool, Z-linalool oxide (furanoid), and phenylethanol. These glycosidically bound volatile compounds (GBVs), considered precursors of tea aroma, are highly enriched in green tea, but do not contribute to aroma production during oolong tea processing[35−38]. The observed differences highlight the importance of volatile alcohols in shaping the sweet and floral aromas of GT. Moreover, variations exist in the overall concentration of ester compounds between the fresh leaves of GT (27,575.02 μg/L) and OT (10,784.90 μg/L). Research indicates that esters, which contribute floral and fruity notes, are more identified in OT[39]. Among the esters in GT, methyl salicylate (17,022.62 μg/L) exhibited the highest relative concentration, followed by geranyl isovalerate (2,777.80 μg/L). In contrast, the trend was reversed in OT, where geranyl isovalerate (6,117.11 μg/L) was the dominant ester, and methyl salicylate (2,071.62 μg/L) ranked second. The results highlight distinct differences in the major esters that characterize GT and OT. Methyl salicylate is identified as the predominant ester in GT, whereas geranyl isovalerate is the principal ester in OT.
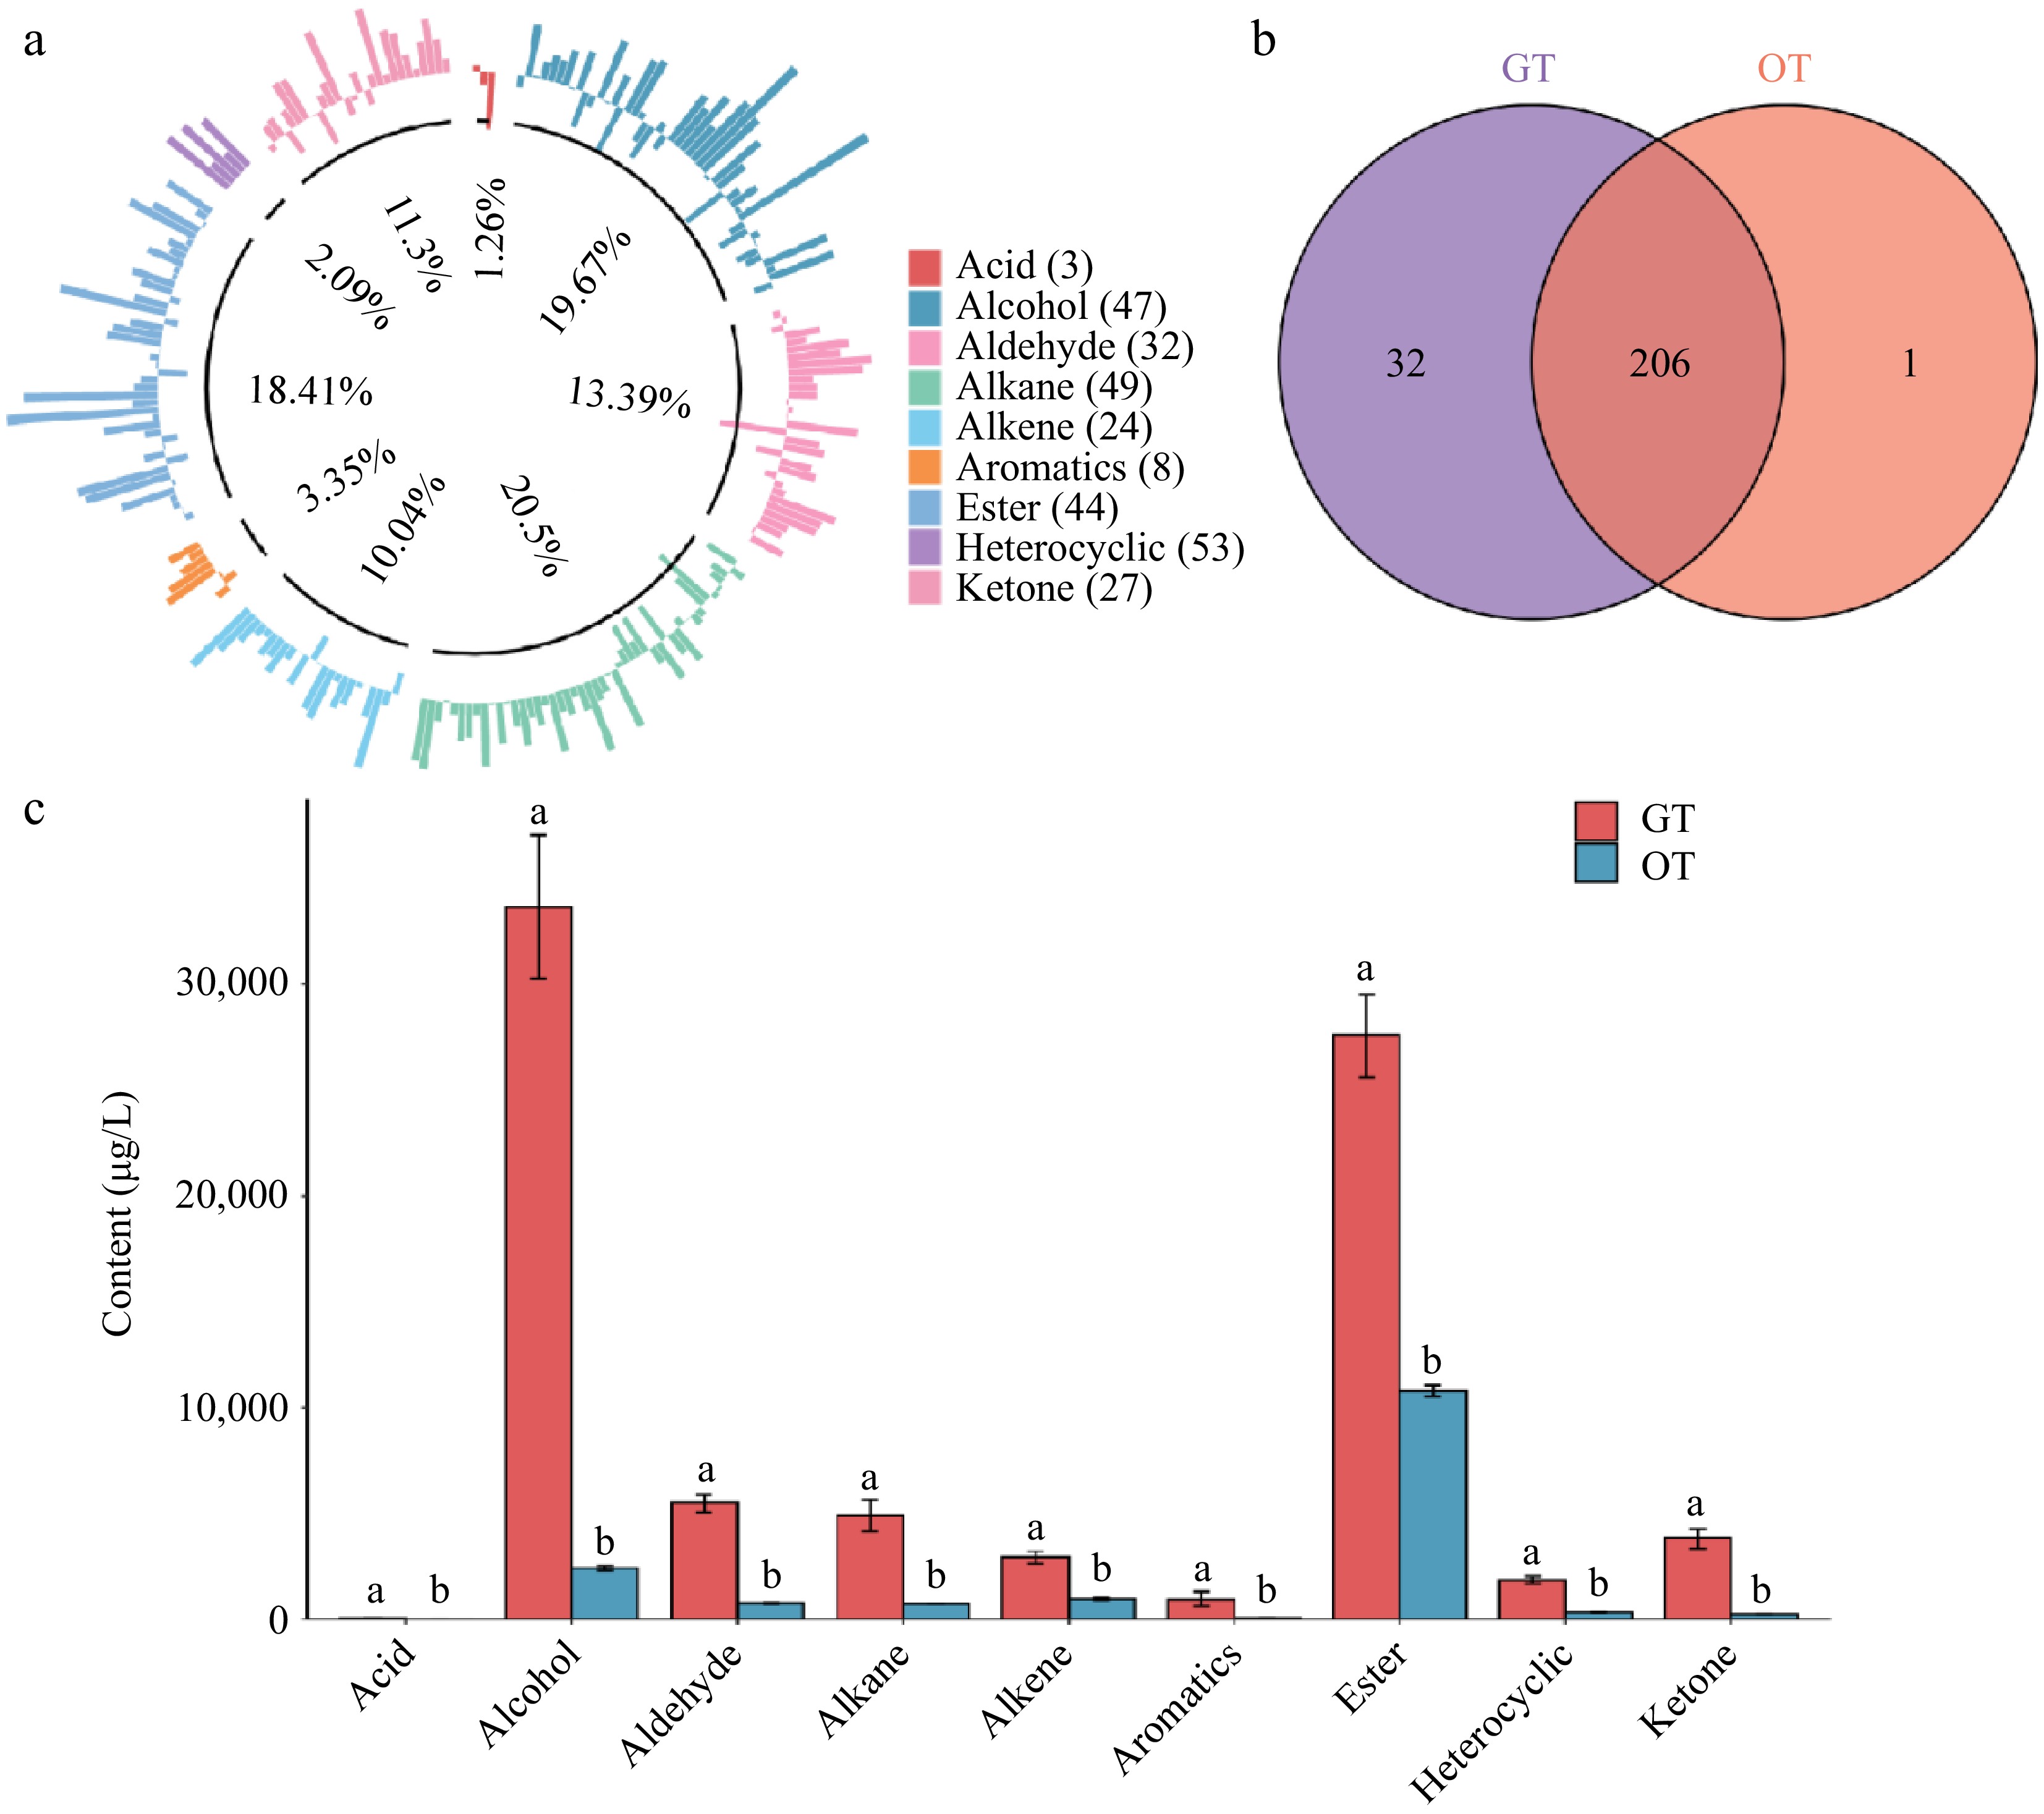
Figure 2.
GC-MS analysis of volatile compounds in GT and OT. (a) The proportion of volatile compounds in the total components. (b) Venn diagram of the volatile compounds of GT and OT. (c) Total amount of different volatile compound categories in GT and OT (different letters indicate significant differences, p < 0.05, GT: n = 15; OT: n = 16).
Multivariate analysis and differential analysis of volatile compounds in GT and OT
-
Principal component analysis (PCA) revealed (Fig. 3a) that PC1 explained 20.39% of the total variation, while PC2 contributed 7.13%, showing a distinct differentiation between the GT and OT groups. One outlier was identified in the OT group that did not significantly affect the overall distribution. Based on the PCA results, orthogonal partial least squares discriminant analysis (OPLS-DA) was performed to determine the classification and differences within the data (Fig. 3b). The OPLS-DA analysis clearly demonstrated a pronounced segregation between GT and OT, with inter-group differences contributing 18.3% and intra-group differences contributing 19.5%. These findings aligned closely with those of PCA. The model evaluation metrics, including Q2 = 0.985, R2Y = 0.995, and R2X = 0.47 (Fig. 3c), indicated a reliable model. Following 200 permutation tests (Fig. 3d), the results confirmed that the model was not overfitted and its validation was reliable. Therefore, the findings effectively highlight the substantial differences in volatile components of fresh leaves between GT and OT.
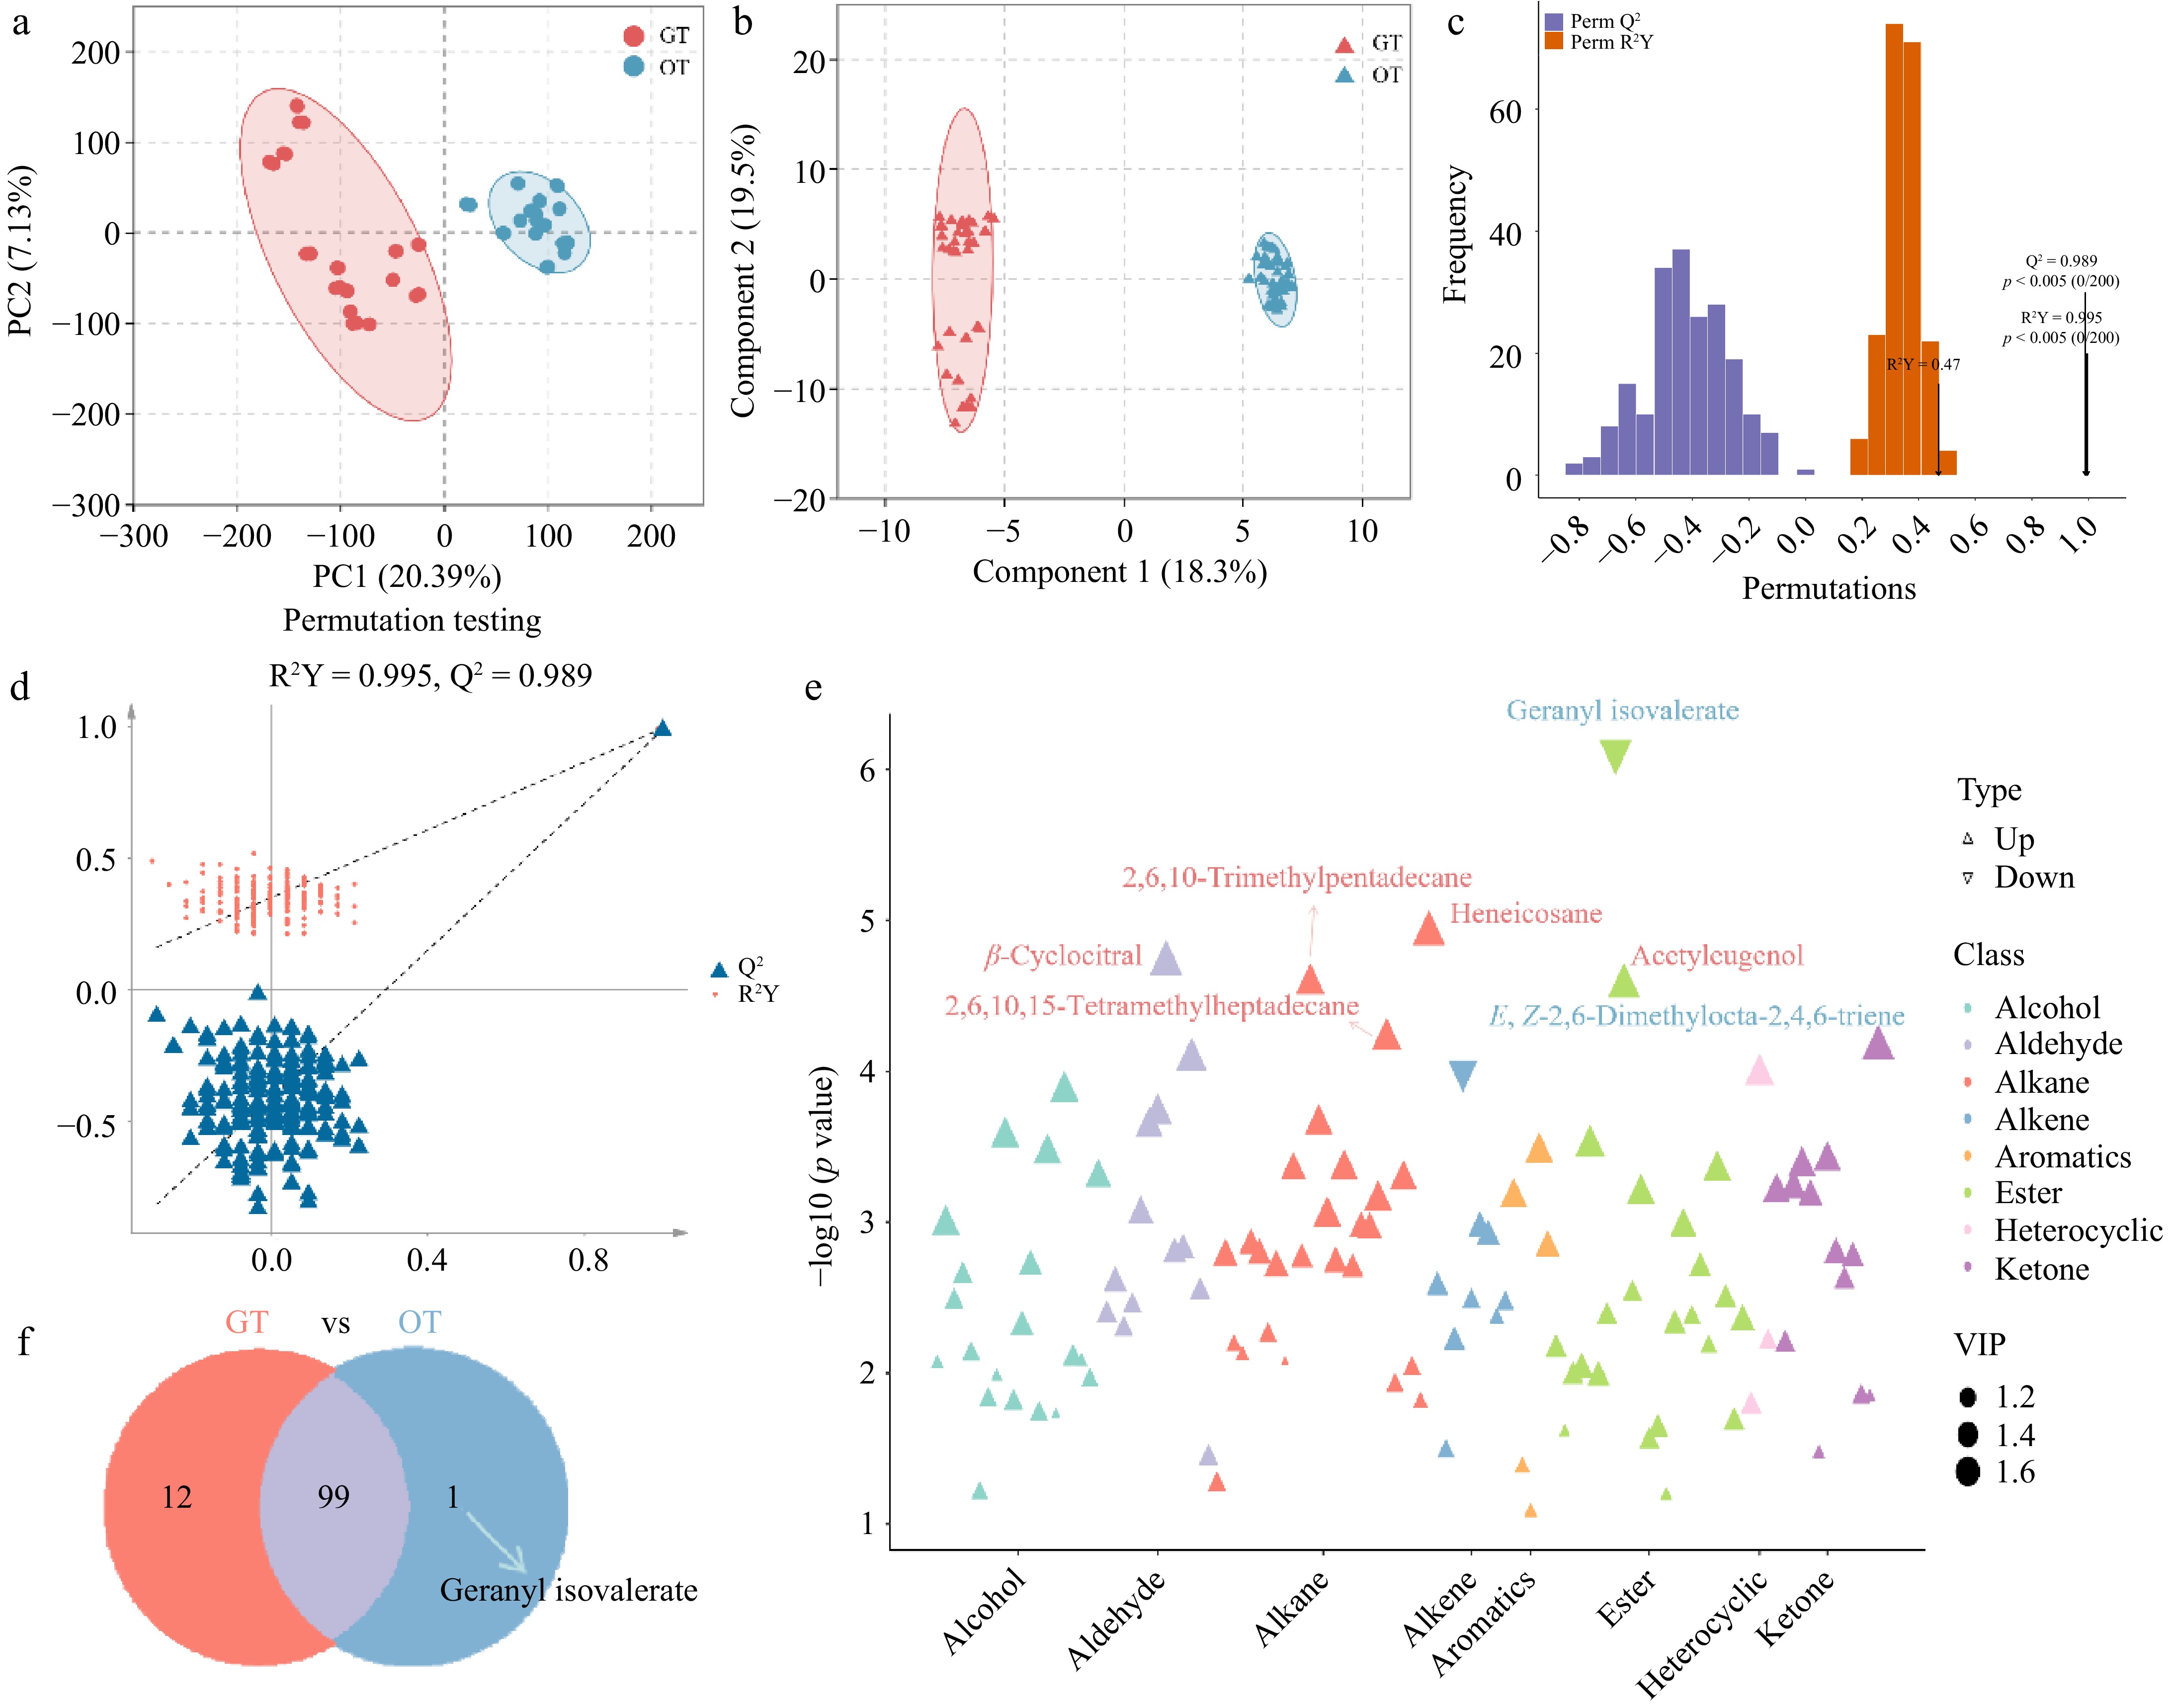
Figure 3.
Multivariate analysis of volatile compounds and screening of differential volatile compounds. (a) Score plots for the PCA analysis of the volatile compounds. (b) Score plots for the OPLS-DA analysis of the volatile compounds. (c), (d) OPLS-DA model validation and 200 permutation tests. (e) Scatter plot of differential volatile compounds. (VIP > 1, p < 0.05). (f) The Venn diagram of differential volatile metabolites between GT and OT.
To investigate the variation in volatile compounds in the fresh leaves of GT and OT, 112 differential compounds were identified using the criteria of p < 0.05 and VIP > 1 (Fig. 3f). Among these, 99 compounds were detected in both groups, 12 compounds were unique to GT, and only one compound was unique to OT. The differential compounds were predominantly concentrated in the categories of alkanes, esters, and alcohols, indicates that esters and alcohols are the primary contributors to the aroma of fresh leaves in GT and OT, which is consistent with previous findings (Fig. 3e). Among the 112 differential volatile compounds, 110 exhibited significantly higher abundance in GT, including heneicosane, β-cyclocitral, 2,6,10-trimethylpentadecane, acetyleugenol, 2,6,10,15-tetramethylheptadecane, phytone, and tridecanal, among others. Notably, the VIP value of β-cyclocitral exceeded 1.6, with its odor characteristics described as sweet, faint scent, and floral[36,40], highlighting its substantial impact on the overall fragrance of GT. Phytone and tridecanal primarily contribute woody and waxy aromas to tea, while acetyleugenol contributes sweet and fruity aromas. Comparatively, acetyleugenol plays a more prominent role in shaping the aroma of fresh leaves. In contrast, E,Z-2,6-dimethylocta-2,4,6-triene and geranyl isovalerate were found at higher levels in OT, both of which contribute to its characteristic floral aroma. Meanwhile, the former was only detected in OT, indicating its unique contribution to OT's aroma. Overall, these findings support the distinctive role of E,Z-2,6-dimethylocta-2,4,6-triene within OT's aroma, which we will focus on in subsequent analyses.
rOAV analysis of differential volatile compounds
-
rOAV represents the significance of individual aroma compounds within the overall fragrance and acts as a standard for identifying key aromatic components in tea[41]. Research indicates that an rOAV value ≥ 1 suggests that the aroma compound is crucial in defining the overall aroma, whereas an rOAV value ≥ 10 signifies an extremely significant contribution to the overall aroma[42−44]. We calculated the odor thresholds of 67 compounds and analyzed their rOAV (Table 1; Supplementary Table S2). Among them, 23 volatile compounds in GT had rOAV > 1, while only eight compounds in OT exhibited rOAV > 1. These compounds include aldehydes, esters, alcohols, ketones, and alkenes. It is noteworthy that the only alkene, E,Z-2,6-dimethylocta-2,4,6-triene, is a unique differential volatile compound in OT (rOAV > 10), with an rOAV exceeding 100 in MK1. It possesses floral and balsamic notes and may be a key compound in high-aroma OT. Nonanal, hexyl formate, geranyl butyrate, methyl salicylate, and geranyl isovalerate all exhibited rOAVs greater than one in both OT and GT, and these compounds are predominantly linked to floral, fruity, and sweet aromas. At the same time, the rOAV of Z-3-hexenyl butyrate exceeds 10, while the rOAV of linalool is greater than 100. Both compounds are associated with floral and fruity aromas, and their rOAVs in GT are more than 10 times higher than those in OT. These findings demonstrated their significant contributions to the aroma of both tea types. Moreover, the rOAV values of volatile compounds, including 2,6-dimethyl-1,7-octadiene-3,6-diol, Z-jasmone, heptanal, 3-heptanone, 2-nonanone, 1-decanol, 1-nonanol, and nerol in GT, were all greater than one. These compounds are mainly associated with faint scents and sweet and floral and fruity aromas. Earlier research has identified nonanal and Z-jasmone as key volatile compounds influencing the floral aroma of green tea[33,45]. Therefore, the above-mentioned volatile compounds are likely critical in defining the aromatic profile of GT.
Table 1. Differential volatile compounds between GT and OT.
Category RT RI Compounds Content (μg/L) Threshold
(μg/L)Odor characteristics GT OT Aldehyde 1 6.390 796 Hexanal 116.98 ± 13.97 a 25.14 ± 0.44 b 4.5A Grassy, green, leafy, vinegar 2 10.210 902 Heptanal 262.74 ± 11.05 a 25.92 ± 1.28 b 2.8C Faint scent, herbal, citrusy 3 12.449 960 Benzaldehyde 1,008.64 ± 144.59 a 67.81 ± 10.30 b 350C Sweet, bitter, almond, cherry 4 12.562 962 1,2-Benzenedicarboxaldehyde 711.78 ± 35.67 a 2.60 ± 0.21 b 1,000F Mild, aromatic 5 14.105 1,002 Octanal 88.24 ± 1.90 a 16.17 ± 1.09 b 7A Citrusy, fruity, waxy 6 17.921 1,103 Nonanal 578.00 ± 7.10 a 40.67 ± 1.30 b 1F Citrus, orange, peel 7 21.577 1,204 Decanal 114.07 ± 10.61 a 24.33 ± 0.87 b 2.6A Citrusy, waxy 8 21.987 1216 β-Cyclocitral 160.36 ± 2.49 a 15.46 ± 1.23 b 3A Lemon, citrus, floral 9 23.887 1,272 4-Propyl-benzaldehyde 268.71 ± 3.44 a 63.65 ± 0.72 b 10F Floral, almond 10 28.276 1,407 Dodecanal 98.92 ± 17.18 a 7.27 ± 0.39 b 14F Citrusy, waxy, fruity, fatty 11 28.277 1,408 Tridecanal 91.29 ± 1.28 a 2.81 ± 0.37 b 70F Citrus, faint scent, soapy 12 36.369 1,686 3-Methyl-butanal 27.11 ± 4.59 a 0.56 ± 0.01 b 0.1B Pungent, fruity, nutty 13 41.828 1,900 Pentadecanal 123.51 ± 6.32 a 17.79 ± 0.65 b 430F Waxy, fatty, floral Ester 14 9.086 871 Hexyl formate 19.91 ± 1.18 a 2.35 ± 0.23 b 0.1F Fruity 15 13.394 984 Vinyl hexanoate 39.90 ± 1.49 a 1.01 ± 0.30 b 50F Faint scent, fruity 16 13.690 992 Geranyl butyrate 318.80 ± 12.74 a 13.80 ± 0.36 b 0.1F Sweet, fruity, floral, orange 17 13.883 997 Ethyl hexanoate 26.88 ± 3.34 a 0 b 5A Fruity, sweet, faint scent 18 17.581 1,094 Benzyl acetate 15.66 ± 1.04 a 0 b 364G Sweet, floral, fruity, balsamic 19 20.838 1,184 Z-3-Hexenyl butyrate 295.40 ± 6.60 a 35.37 ± 2.14 b 0.1F Faint scent, fruity, green, sweet 20 21.082 1,190 Methyl salicylate 17022.62 ± 975.42 a 2071.62 ± 116.92 b 40A Caramel, minty, herbal 21 23.102 1,249 Geranyl isovalerate 2,777.80 ± 77.04 b 6,117.11 ± 153.55 a 100F Floral, fruity, herbal, citrus 22 26.122 1,339 Acetyleugenol 29.22 ± 1.75 a 5.02 ± 0.83 b n.f. Spicy, sweet, fruity, woody 23 26.440 1,349 Cinnamyl isovalerate 44.19 ± 6.57 a 1.35 ± 0.08 b n.f. Sweet, spicy, fruity 24 27.031 1,368 Hexyl hexanoate 28.89 ± 1.07 a 1.52 ± 0.09 b 6,400A Fruity, sweet, creamy 25 27.322 1,377 4Z-4-Hexenyl butyrate 304.75 ± 14.37 a 1.47 ± 0.09 b n.f. Fruity, sweet, faint scent, apple 26 27.337 1,378 Neryl hexanoate 232.94 ± 2.00 a 17.08 ± 1.46 b 781C Fruity, green, pear, pineapple 27 27.590 1,385 E-2-Hexenyl hexanoate 16.36 ± 2.75 a 0.91 ± 0.10 b n.f. Fruity, sweet 28 33.074 1,568 Nerol benzoate 152.34 ± 2.19 a 51.13 ± 2.35 b 500C Faint scent, floral 29 33.531 1,584 2,2,4-Trimethyl-1,3-pentanediol diisobutyrate 37.89 ± 1.07 a 0 b n.f. Mild, sweet, fatty 30 33.737 1,591 Ethyl laurate 35.88 ± 5.61 a 3.56 ± 0.56 b n.f. Sweet, fruity, fatty 31 34.710 1,626 Decyl decanoate 131.49 ± 21.24 a 20.23 ± 0.88 b n.f. Mild, fatty, oily 32 39.104 1,791 Ethyl tetradecanoate 46.03 ± 3.72 a 17.34 ± 0.55 b 4,000F Sweet, fatty, fruity 33 42.374 1,922 Methyl palmitate 70.55 ± 1.01 a 8.60 ± 0.65 b 2,000E Waxy, sweet 34 44.065 1,990 Ethyl palmitate 555.70 ± 1.19 a 171.98 ± 5.31 b 2,000E Mild, fatty 35 46.868 2,061 Phytyl acetate 270.72 ± 24.58 a 11.79 ± 2.61 b 2C Floral, green, faint scent 36 47.879 2,085 Ethyl linolenate 214.69 ± 16.09 a 63.76 ± 0.48 b 450G Oily, fatty, nutty, green Alkane 37 14.034 1,001 3,6-Dimethyldecane 14.24 ± 0.45 a 0 b n.f. Mild, fatty, hydrocarbon 38 14.678 1,017 Undecane 40.26 ± 1.81 a 0 b 10,000E Odorless, oily, waxy 39 16.129 1,056 5-(2-Methylpropyl)-nonane 137.29 ± 23.92 a 19.82 ± 0.10 b n.f. Mild, fatty, hydrocarbon 40 16.131 1,057 3-Ethyl-3-methyl-heptane 64.16 ± 3.05 a 19.70 ± 1.46 b n.f. Mild, fatty, hydrocarbon 41 16.199 1,058 2,3,5,8-Tetramethyl-decane 176.24 ± 10.97 a 8.25 ± 0.86 b n.f. Odorless, oily 42 16.335 1,061 3,7-Dimethyl-decane 66.14 ± 1.73 a 0 b n.f. Odorless, oily 43 21.429 1,200 Dodecane 376.64 ± 23.67 a 49.92 ± 3.52 b 1000E Mild, hydrocarbon, petroleum 44 21.733 1,209 3,4-Dimethyl-undecane 31.33 ± 2.28 a 2.29 ± 0.07 b n.f. Odorless 45 23.539 1,262 3-Ethyl-3-methyl-decane 52.59 ± 3.52 a 10.34 ± 0.95 b n.f. Mild, hydrocarbon 46 23.989 1,275 4,6-Dimethyl-dodecane 582.01 ± 80.64 a 86.94 ± 0.96 b n.f. Odorless, oily 47 24.257 1,283 5-Butyl-nonane 95.06 ± 17.35 a 0.49 ± 0.10 b n.f. Odorless 48 26.890 1,371 2,6,10-Trimethylpentadecane 69.46 ± 1.95 a 5.41 ± 0.32 b n.f. Oily,waxy 49 28.047 1,399 Tetradecane 339.47 ± 33.31 a 48.08 ± 0.89 b 1,000E Mild, waxy, odorless, oily 50 28.398 1,411 3,8-Dimethyl-decane 44.83 ± 0.80 a 2.19 ± 0.11 b n.f. Hydrocarbon 51 29.075 1,433 2,6,11-Trimethyl-dodecane 65.22 ± 8.29 a 7.33 ± 0.41 b n.f. Odorless, oily 52 29.898 1,460 2,6,10-Trimethyl-tridecane 191.03 ± 22.37 a 30.74 ± 1.70 b n.f. Odorless, oily 53 30.719 1,487 5-Methyl-5-propylnonane 143.54 ± 21.80 a 37.71 ± 0.56 b n.f. Odorless 54 31.749 1,522 2,6,10-Trimethyl-tetradecane 26.96 ± 2.17 a 5.95 ± 0.29 b n.f. Odorless 55 33.947 1,598 Hexadecane 438.21 ± 32.59 a 11.97 ± 0.91 b 13,000,000E Odorless, oily 56 33.971 1,599 3-Methyl-5-propylnonane 50.05 ± 3.83 a 1.19 ± 0.14 b n.f. Odorless, oily, waxy 57 35.296 1,647 2,6,10,15-Tetramethyl-heptadecane 117.06 ± 9.36 a 16.75 ± 0.63 b n.f. Oily, waxy, petroleum 58 36.697 1,698 8-Methyl-heptadecane 139.98 ± 5.29 a 17.17 ± 0.25 b n.f. Mild, hydrocarbon 59 36.828 1,703 Phytane 47.43 ± 1.29 a 4.03 ± 0.10 b n.f. Odorless, oily 60 37.776 1,740 3,8-Dimethyl-undecane 25.78 ± 1.40 a 3.67 ± 0.31 b n.f. Mild, fatty, hydrocarbon 61 39.330 1,799 Octadecane 70.36 ± 0.45 a 1.91 ± 0.19 b 20E Mild, waxy, petroleum 62 48.494 2,100 Heneicosane 393.56 ± 19.59 a 30.00 ± 1.74 b n.f. Waxy, oily, greasy Ketone 63 5.896 782 3-Hexanone 74.30 ± 0.79 a 0 b 1,000C Herbaceous, fruity 64 6.224 791 2-Hexanone 9.51 ± 0.19 a 0.91 ± 0.05 b 24F Mild, fruity, solvent 65 9.614 885 3-Heptanone 66.35 ± 1.62 a 6.82 ± 0.39 b 1F Fruity, banana, spicy, solvent 66 12.202 953 6-Methyl-2-heptanone 188.52 ± 5.75 a 24.91 ± 0.90 b 8.1F Fruity, banana, spicy, solvent 67 13.521 987 2-Octanone 786.02 ± 85.85 a 0 b 350F Fruity, banana, spicy, buttery 68 16.043 1053 2-Tetradecanone 24.05 ± 0.84 a 0.65 ± 0.07 b 10F Mild, fatty, fruity 69 16.212 1,058 2-Dodecanone 74.54 ± 4.57 a 1.34 ± 0.15 b 42F Fatty, waxy 70 16.467 1,064 Acetophenone 854.90 ± 65.93 a 29.31 ± 0.90 b 170D Sweet, almond, fruity, floral 71 17.414 1,089 2-Nonanone 259.56 ± 51.80 a 24.21 ± 1.03 b 5F Herbaceous, spicy 72 27.717 1,389 Z-Jasmone 221.25 ± 5.09 a 11.07 ± 0.30 b 7A Sweet, floral, herbaceous, fruity 73 29.430 1,445 6,10-Dimethyl-5,9-undecadien-2-one 111.62 ± 1.68 a 20.60 ± 1.49 b 3,000D Fruity, sweet 74 31.486 1,513 2-(2-Propenyl)-1,3-cyclohexanedione 107.72 ± 0.60 a 22.54 ± 1.40 b n.f. Mild, herbal, spicy 75 40.304 1,838 Phytone 48.91 ± 1.10 a 7.71 ± 0.22 b n.f. Woody, herbaceous, earthy Alcohol 76 8.878 865 6-Methyl-1-heptanol 75.94 ± 3.40 a 9.50 ± 1.00 b n.f. Faint scent, fatty,herbal 77 9.018 869 1-Hexanol 140.47 ± 9.33 a 3.95 ± 0.54 b 500A Fruity, alcoholic, sweet, green 78 10.243 903 4-Methyl-2-hexanol 17.39 ± 0.96 a 0.84 ± 0.06 b n.f. Faint scent, alcoholic, mild, floral 79 14.172 1,004 2,6-Dimethyl-1,7-octadiene-3,6-diol 432.70 ± 8.06 a 0 b 10F Faint scent, herbal, citrus, lemon 80 14.538 1,014 2-Butyl-1-octanol 38.72 ± 3.21 a 4.42 ± 0.05 b n.f. Mild, fatty, hydrocarbon 81 14.782 1,020 4-Pentenol 10.83 ± 0.63 a 1.81 ± 0.17 b 1F Faint scent, herbal, fruity 82 16.674 1,035 1-Decanol 542.52 ± 25.03 a 40.97 ± 1.24 b 23C Mild fatty, waxy, floral, orange 83 17.274 1,086 Z-Linalool oxide (furanoid) 830.56 ± 104.82 a 77.69 ± 2.41 b 320C Earthy, floral, sweet, herbal 84 17.699 1,097 Linalool 8,805.09 ± 298.70 a 1,424.74 ± 32.19 b 0.6A Sweet floral, citrus 85 19.675 1,151 Z-3-Nonenol 25.93 ± 1.18 a 0.85 ± 0.03 b n.f. Faint scent, herbal, green 86 20.369 1,171 1-Nonanol 379.02 ± 23.01 a 26.90 ± 0.51 b 5.3C Faint scent, floral,dusty 87 20.456 1,173 E-Linalool oxide (pyranoid) 104.72 ± 6.25 a 25.07 ± 1.61 b 3,000G Sweet, floral, woody, herbaceous 88 21.910 1,214 7-Methyl-3-methylene-6-octenol 59.19 ± 5.26 a 0 b n.f. Faint scent, herbal,green 89 22.344 1,227 3Z-3,7-Dimethyl-3,6-octadienol 114.09 ± 0.66 a 1.78 ± 0.41 b n.f. Sweet, floral, rose, citrusy 90 22.879 1,242 2-(4-Methylidenecyclohexyl) prop-2-enol 34.60 ± 1.38 a 4.53 ± 0.31 b n.f. Mild, herbal, floral 91 23.084 1,248 Nerol 18,033.70 ± 2247.35 a 296.16 ± 38.27 b 290A Floral, fruity, lemon, faint scent 92 28.280 1,407 E-2-Decenol 42.70 ± 1.80 a 2.40 ± 0.14 b n.f. Faint scent, fatty, waxy, herbal 93 29.294 1,440 Dihydro-β-ionol 30.35 ± 1.97 a 3.36 ± 0.22 b n.f. Floral, woody 94 32.648 1,453 2-Isopropyl-5-methyl-1-hexanol 13.52 ± 1.23 a 2.16 ± 0.35 b 50F Faint scent, floral,herbal 95 42.868 1,491 Phytol 41.35 ± 0.71 a 3.33 ± 0.55 b 640E Herbaceous, woody, faint scent Alkene 96 5.610 774 1,3,5-Cycloheptatriene 11.15 ± 0.58 a 1.50 ± 0.11 b n.f. Mild, solvent 97 8.894 865 2,6-Dimethyl-2-heptene 40.50 ± 0.82 a 14.93 ± 0.37 b n.f. Mild, hydrocarbon 98 15.760 1,046 3-Carene 45.07 ± 3.96 a 0 b 770F Faint scent, pine, citrusy, sweet 99 18.843 1,128 E,Z-2,6-Dimethylocta-2,4,6-triene 0 b 10.29 ± 0.06 a 0.03F Floral, herbal, balsamic 100 18.848 1,129 2,6-Dimethyl-2,4,6-octatriene 104.78 ± 12.48 a 15.90 ± 0.29 b n.f. Strong, herbal, green, faint scent 101 29.622 1,451 E-β-Farnesene 118.87 ± 14.63 a 15.47 ± 1.12 b 87B Sweet, floral, fruity, woody 102 31.511 1,514 Copaene 56.27 ± 5.40 a 19.76 ± 0.44 b 6C Spicy, honey, faint scent, piney, woody, citrusy 103 31.604 1,517 (+)-Delta-cadinene 74.74 ± 2.43 a 16.49 ± 1.44 b 1.5C Herbal, woody 104 31.689 1,520 E-Calamenene 37.46 ± 0.36 a 6.81 ± 0.28 b n.f. Spicy, woody Aromatics 105 8.481 854 Ethylbenzene 27.87 ± 2.53 a 0 b 170C Aromati 106 9.718 888 Styrene 237.98 ± 22.96 a 9.99 ± 0.70 b 730D Balsamic, gasoline, sweet, 107 13.245 980 α-Methylstyrene 93.35 ± 1.74 a 17.97 ± 6.59 b n.f. Aromatic, sweet 108 14.981 989 p-Cymene 54.96 ± 0.79 a 3.96 ± 1.16 b 11.4A Woody, citrus, aromatic, sweet 109 24.602 1,293 1-Methylnaphthalene 111.86 ± 3.83 a 17.52 ± 1.09 b 14D Aromatic, coal-tar, oily, solvent Heterocyclic compound 110 28.991 1,430 Coumarin 95.51 ± 3.87 a 7.25 ± 1.09 b 11A Sweet, vanilla, hay ,almond 111 31.174 1,502 2,4-Di-tert-butylphenol 652.49 ± 20.81 a 59.30 ± 2.73 b 500C Phenol, sweet, rubbery, plastic 112 40.098 1,830 Caffeine 352.30 ± 26.56 a 110.84 ± 5.90 b n.f. Mild bitter, herbal 'n.f.', odor thresholds of related compounds not found in the literature. All the odor thresholds and odor description were obtained from: A[26]; B[56]; C ( www.thegoodscentscompany.com/search2.html ); D[16]; E[57]; F[58]; G[59]. 'a, b', significant differences in the relative content of differential volatile compounds between GT and OT. (p < 0.05, GT: n = 15, OT: n = 16).Identification of key volatile compounds using a random forest model
-
To further analyze the key volatile compounds between GT and OT, we constructed a random forest model utilizing 112 differential volatile compounds (Fig. 4a), and evaluated the model using ROC curve analysis. The ROC curve's area (AUC) functions as a critical measure for determining the accuracy and reliability of the classification model, with an AUC value closer to one indicating higher accuracy. When 0.5 < AUC < 1, the model is considered optimal. The AUC value of this classifier model is one, manifesting the model's effectiveness (Fig. 4b)[46,47]. Based on the constructed model, the mean decrease in accuracy for each compound was calculated, and a higher value reflected a greater importance of the volatile compound[48]. According to this value, the top 10 differential volatile compounds were identified as nerol, geranyl isovalerate, 2,6-dimethyl-1,7-octadiene-3,6-diol, geranyl butyrate, 2,6,10-trimethyltridecane, hexadecane, 2,4-di-tert-butylphenol, phthalaldehyde, 3-ethyl-3-methylheptane, and 1-decanol. Building on previous analysis, the impact of alkanes on the overall aroma is very low, so we focus on alcohol and ester compounds. Among them, the average reduction accuracy of nerol is the highest (> 30), and its prominent floral and faint scent characteristics help strengthen overall aroma of the tea[49]. Geranyl isovalerate and geranyl butyrate have faint scent, sweet, and floral notes[50]. 2,6-Dimethyl-1,7-octadiene-3,6-diol has a faint scent and citrus aroma, and is a unique aromatic compound in GT. ROC curve analysis was performed on the selected 10 volatile compounds (Fig. 4c), yielding an AUC value of 1, demonstrating the reliability and accuracy of these compound combinations in distinguishing the aroma of GT and OT.
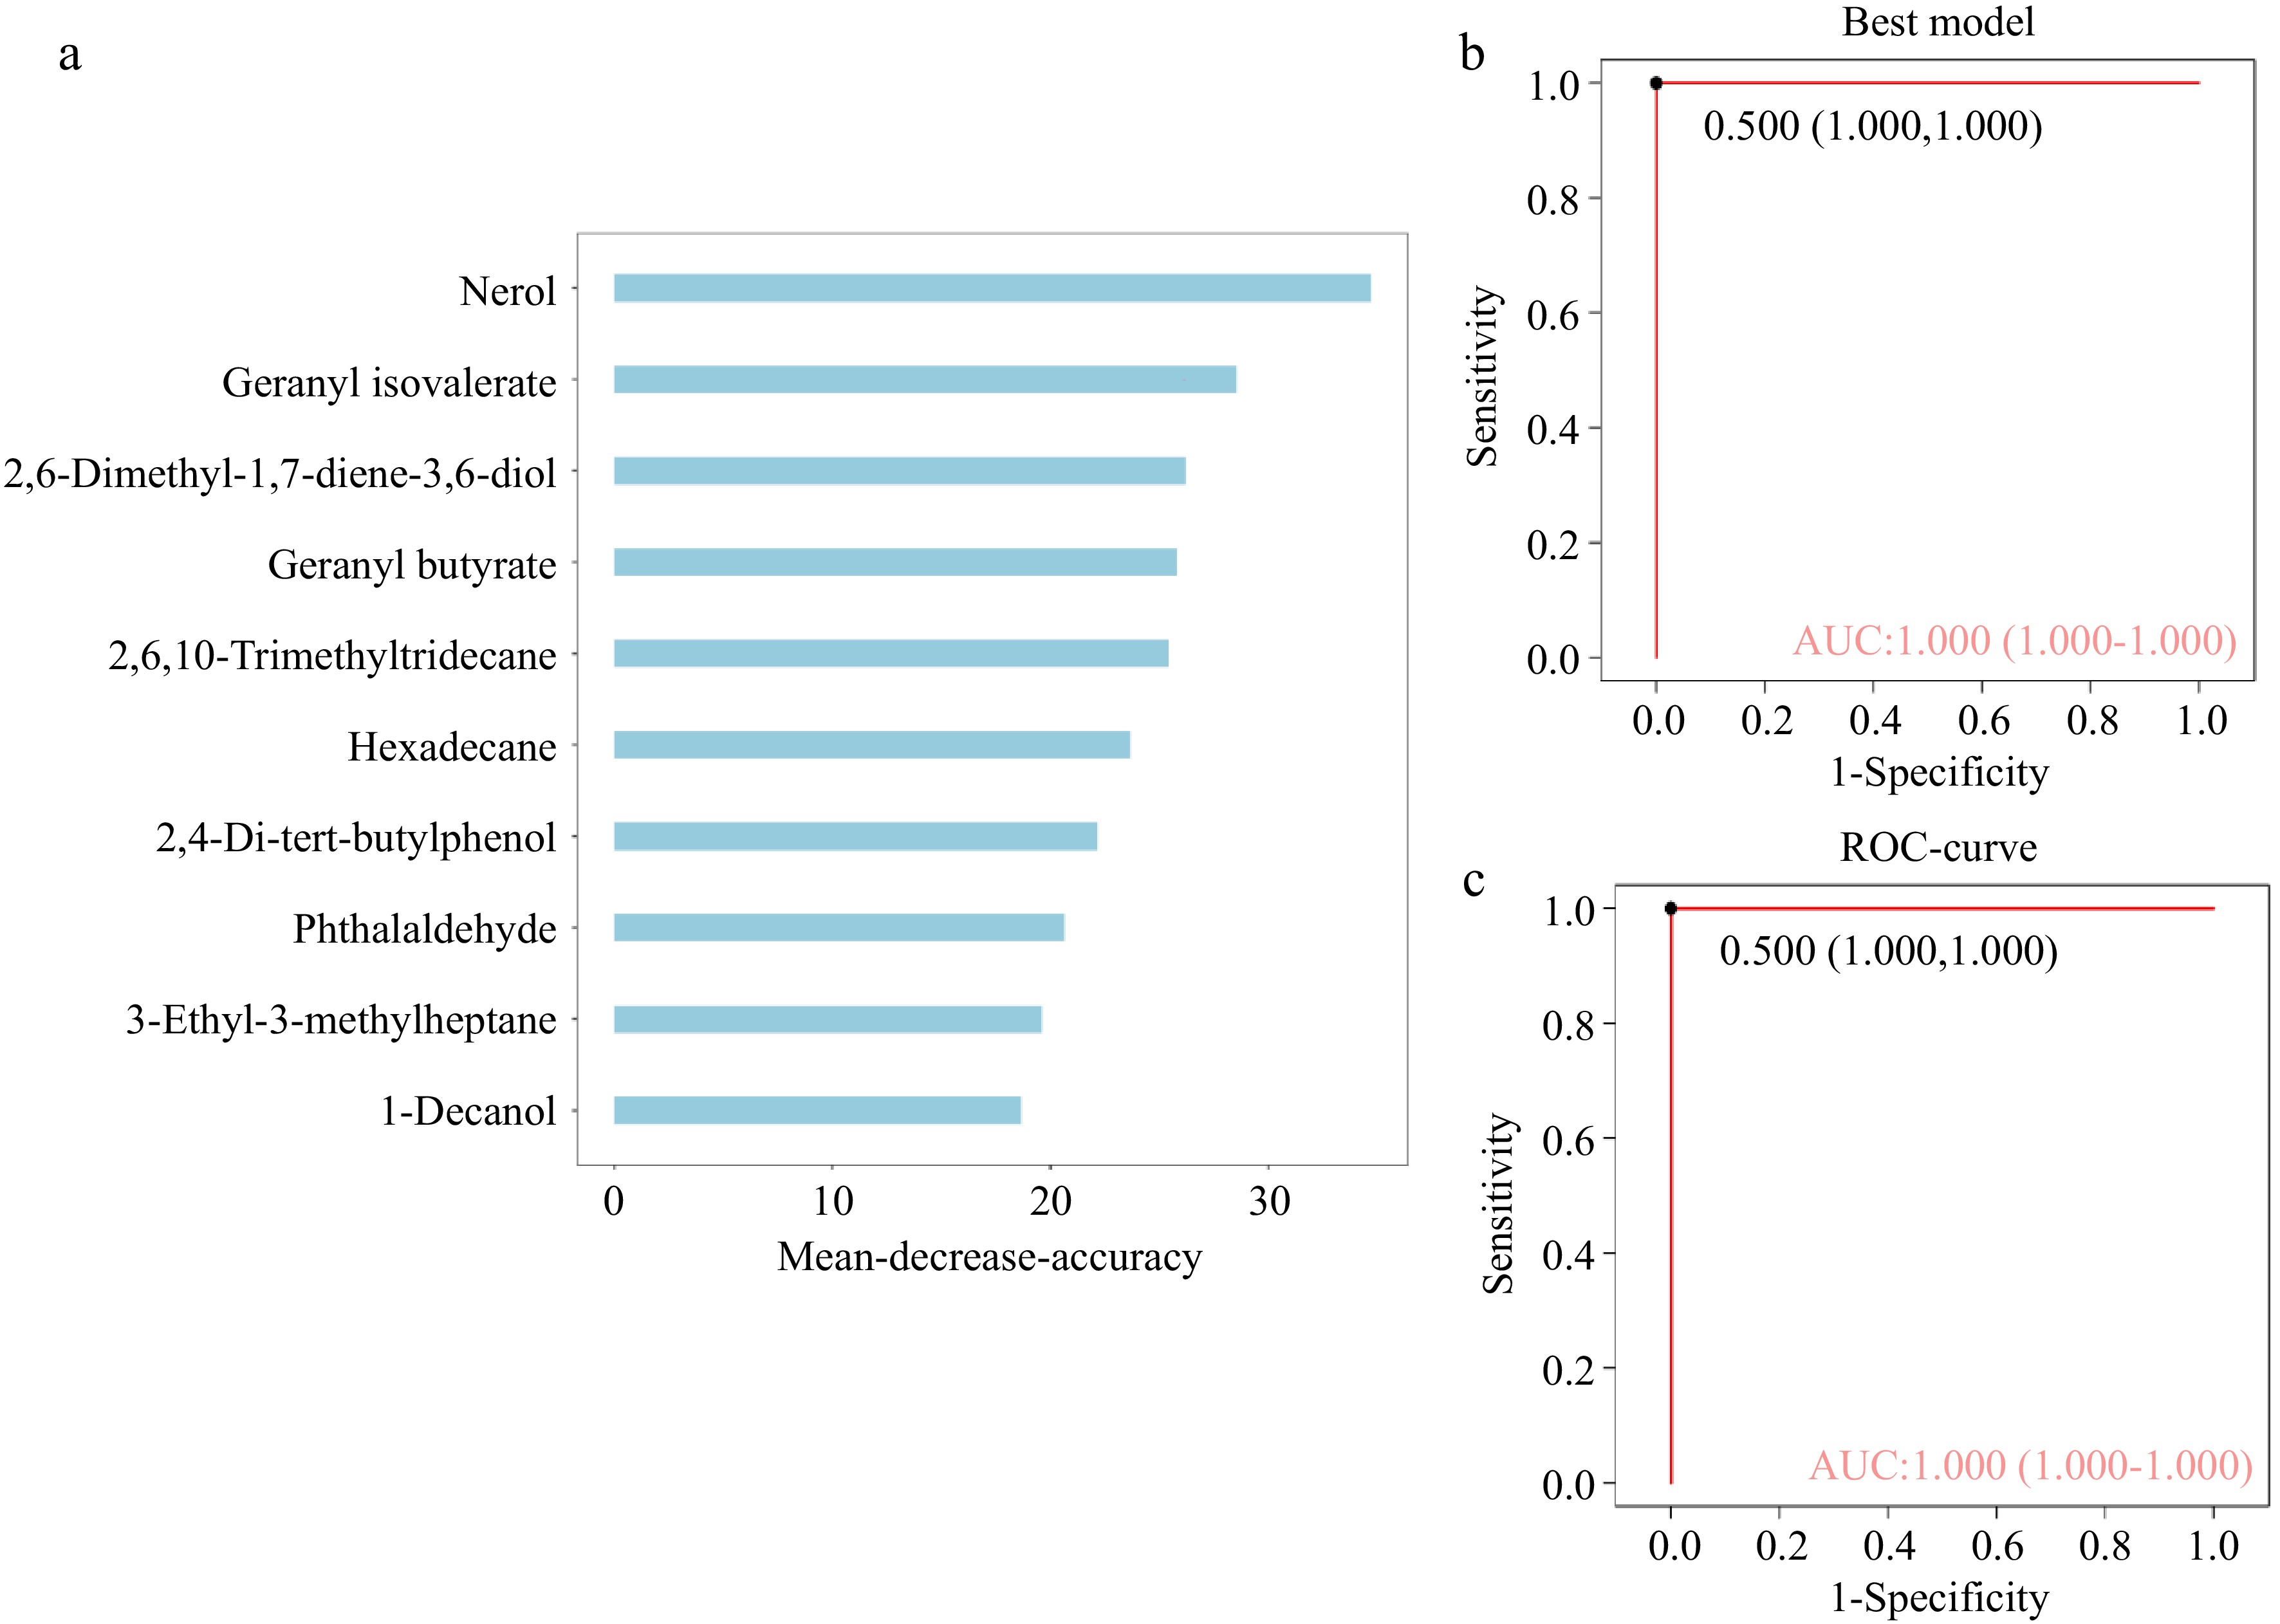
Figure 4.
Random forest analysis and ROC curve of differential volatile compounds between GT and OT. (a) Ranking of mean decrease accuracy, the higher the accuracy, the greater the importance of the metabolite, and the top 10 compounds were selected for display. (b) The ROC curve was used to assess the performance of the random forest classifier. (c) ROC curve assessment of the top 10 key compounds.
Comparative analysis of volatile compound variations among cultivars
-
Eight major volatile compounds with high mean decrease accuracy and rOAV > 1 were selected. To observe the variation trends of these compounds between GT and OT, their relative content at the sample level was normalized, followed by heatmap and clustering analysis (Fig. 5a). The results demonstrated that E,Z-2,6-dimethylocta-2,4,6-triene, within the OT group, showed the highest relative content in MK1 and CY cultivars. In the GT group, 2,6-dimethyl-1,7-octadiene-3,6-diol, with distinctive aroma characteristics, had the highest content in ZC108, followed by LJ43 and ZN12. At the same time, the results revealed that the dominant alcohols in GT are associated with floral and faint scents, which aligns with existing research showing that linalool enhances the floral aroma of green tea[8,51]. Geranyl butyrate was found in higher concentrations in JM1 and BY cultivars, while other esters contributing to floral and fruity aromas were mainly concentrated in OT, including RG, MK1, CY, and JX. In terms of sensory evaluation, RG is not only known for its unique cinnamon flavor but also for its floral and fragrant aroma[52]. At the same time, MK1 also exhibits obvious floral and fruity characteristics[53], which is a manifestation of high-quality oolong tea. These findings indicate that compounds with floral and fruity aromas play a significant role in shaping the overall aroma of OT. To analyze the impact of these eight volatile compounds on the overall aroma profile of tea, they were divided into GT and OT groups and visualized in a flavor wheel based on their specific aroma characteristics (Fig. 5b). Among them, E,Z-2,6-dimethyl-2,4,6-octatriene, which has floral and balsamic notes, and geranyl isovalerate, with floral and fruity aromas, play a major role in determining the flavor quality of OT. The remaining six volatile compounds, including linalool, Z-3-hexenyl butyrate, and 2,6-dimethyl-1,7-octadiene-3,6-diol, help form floral and faint scents of GT. This visual analysis allows for a clear comparison of the aroma differences between GT and OT. In summary, the aroma characteristics of the GT group are primarily composed of alcohols with faint and floral scents, while esters with floral and fruity notes are the primary compounds responsible for shaping the aroma of the OT group.
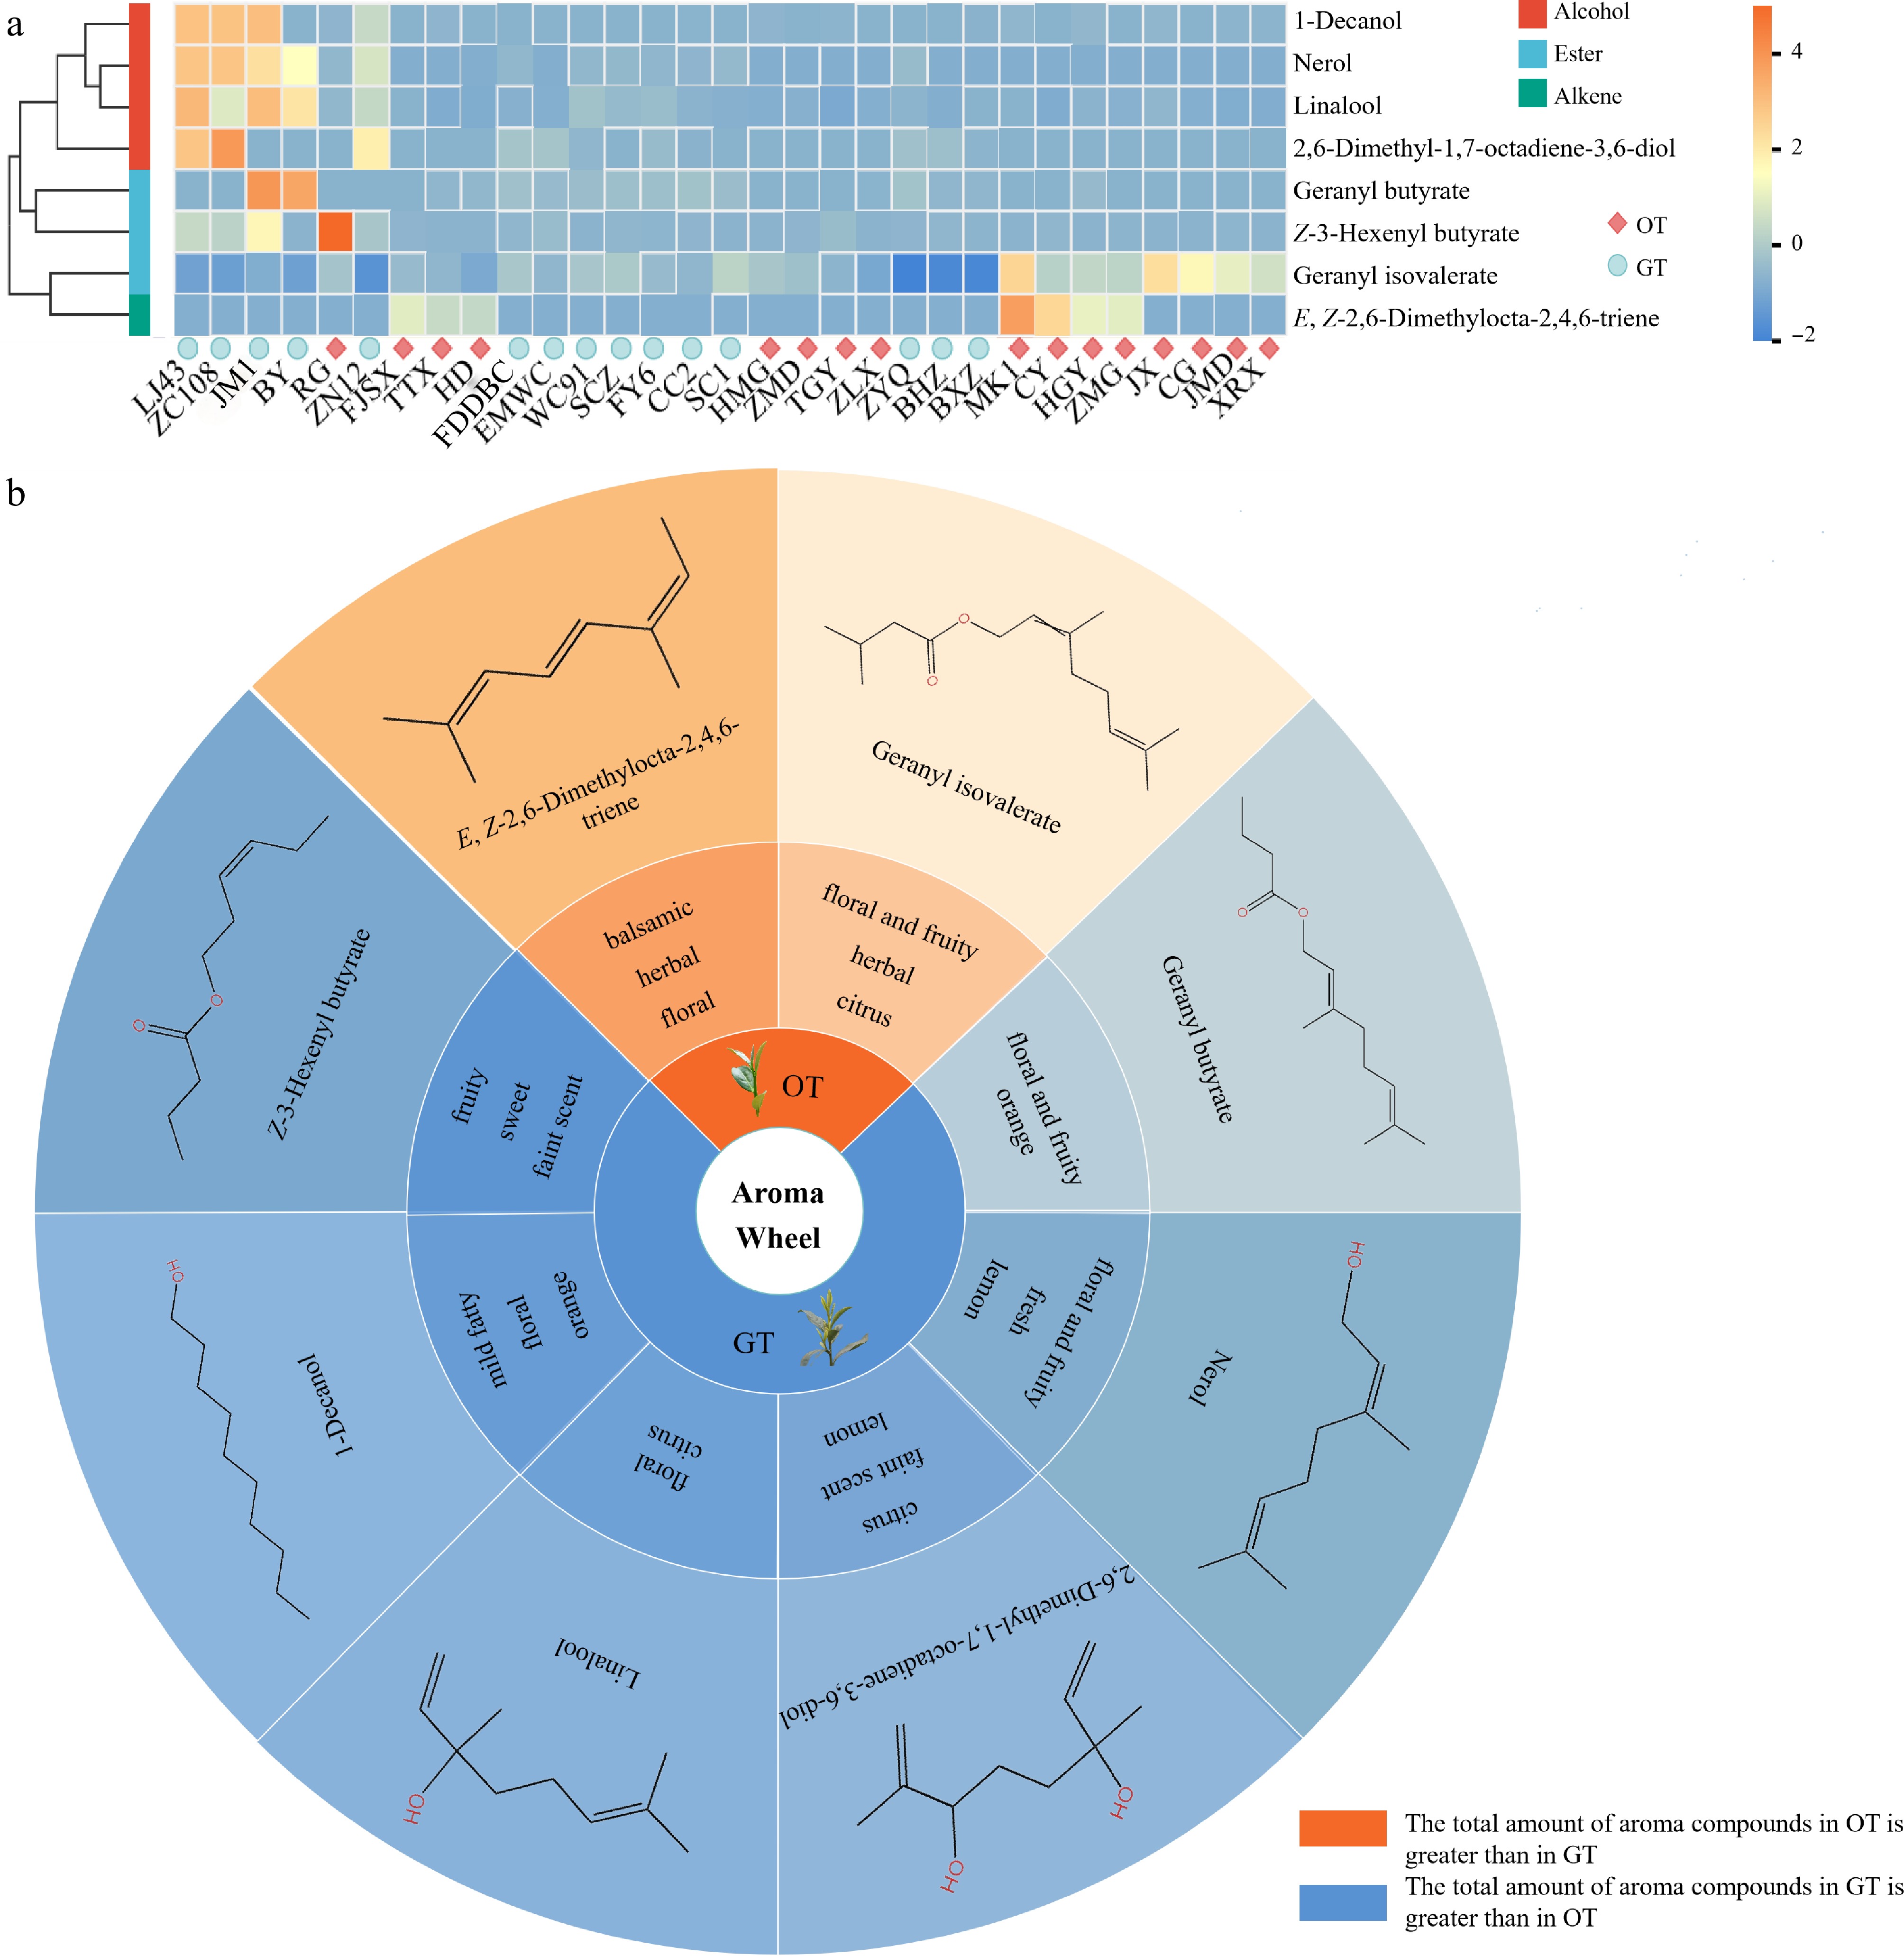
Figure 5.
Heatmap of volatile compounds across different varieties and flavor wheel of aromatic compounds. (a) Heatmap analysis of key volatile compounds selected across different cultivars. (b) Flavor wheel of eight key volatile compounds in GT and OT (rOAV > 1).
Although the current analysis was conducted on fresh tea leaves, many of the identified key compounds, such as linalool, nerol, and E,Z-2,6-dimethyl-2,4,6-octatriene, are known to persist through tea processing or transform into other aroma-active derivatives[54]. Previous studies have reported that linalool and its oxides contribute significantly to the floral aroma of both green and oolong teas after processing[6,10,11,51]. Notably, nerol has been reported to significantly increase during the 'yaoqing' (tossing) stage of oolong tea processing. E,Z-2,6-dimethyl-2,4,6-octatriene has been shown to accumulate during the 'zuoqing' (green-making) process, contributing to the formation of oolong-specific aroma traits[55]. Therefore, the presence and abundance of these compounds in fresh leaves may serve as effective indicators for the aroma potential of different cultivars, contributing to the final flavor quality of the dry tea.
-
In this study, volatile compounds in fresh leaves from 15 cultivars suitable for GT and 16 cultivars suitable for OT were analyzed using HS-SPME-GC-MS. A comprehensive analysis identified 239 distinct volatile compounds. Multivariate analysis further revealed notable distinctions in the aroma profiles between GT and OT, with alcohols and esters being the main classes of differential compounds. Alcohol compounds with floral and faint scent notes are predominantly found in GT, including linalool, nerol, 1-decanol, and 2,6-dimethyl-1,7-octadiene-3,6-diol. Additionally, key aroma compounds unique to GT also included 1-nonanal and Z-jasmone. In contrast, ester-based volatile compounds with floral and fruity aromas were primarily found in OT, with geranyl isovalerate being the predominant compound. The aroma compound unique to OT was E,Z-2,6-dimethylocta-2,4,6-triene. Future investigations should aim to elucidate the specific mechanisms underlying these key volatile compounds and their metabolic regulatory networks, thereby advancing our understanding of aroma formation in tea and facilitating the optimization of tea cultivation and processing practices.
This work was funded by the National Natural Science Foundation of China (Grant Nos 32202550 and 32472794).
-
The appropriate protocols for protecting the rights and privacy of all participants were utilized during the execution of this research.
-
The authors confirm contribution to the paper as follows: conceptualization: Lei X, Yan J, Wang P; methodology: Lei X, Yan J, Xiao Y, Lei W, Fan W, Zhang Y, Li H, Wang P; investigation: Lei X, Xiao Y, Lei W, Fan W; data curation, formal analysis, software: Lei X; experimental designing: Wang P; writing – original draft: Lei X, Yan J; writing – review & editing: Yu Y, Wang P; funding acquisition, project administration: Xu Q, Ye N, Yu Y, Wang P. All authors reviewed the results and approved the final version of the manuscript.
-
The datasets generated during and/or analyzed during the current study are available from the corresponding author on reasonable request.
-
The authors declare that they have no conflict of interest.
-
# Authors contributed equally: Xiaomei Lei, Jiawei Yan
- Supplementary Table S1 Summary table of test samples.
- Supplementary Table S2 rOAV values of 112 different volatile compounds in different cultivars (GT).
- Supplementary Fig. S1 Visualization heatmap of 239 volatile compounds in 15 cultivars suitable for making green tea and 16 cultivars suitable for making oolong tea.
- Copyright: © 2025 by the author(s). Published by Maximum Academic Press, Fayetteville, GA. This article is an open access article distributed under Creative Commons Attribution License (CC BY 4.0), visit https://creativecommons.org/licenses/by/4.0/.
-
About this article
Cite this article
Lei X, Yan J, Xiao Y, Lei W, Fan W, et al. 2025. Aromatic markers and differences between green and oolong teas: insights from 31 representative cultivars. Beverage Plant Research 5: e020 doi: 10.48130/bpr-0025-0018 

Aromatic markers and differences between green and oolong teas: insights from 31 representative cultivars
- Received: 26 March 2025
- Revised: 17 April 2025
- Accepted: 03 May 2025
- Published online: 14 July 2025
Abstract: Oolong and green teas are two types of tea with distinct aroma characteristics primarily shaped by their processing methods; yet, the influence and contribution of cultivar differences remain insufficiently understood. This research applied headspace solid-phase microextraction combined with gas chromatography–mass spectrometry (HS-SPME-GC-MS) to identify 239 volatile compounds in fresh leaves of 15 green tea (GT) and 16 oolong tea (OT) cultivars. These cultivars, originally bred in various provinces, were cultivated under uniform conditions in a tea germplasm resource garden in Fujian Province. Principal component analysis (PCA) and orthogonal partial least squares discriminant analysis (OPLS-DA) showed a clear separation between GT and OT. Using the criteria of variable importance in projection (VIP) > 1 and p < 0.05, 112 volatile compounds with significant differences were identified. Among them, E,Z-2,6-dimethylocta-2,4,6-triene and geranyl isovalerate were detected at significantly higher levels in OT, with the highest concentrations observed in 'Mingke 1'. Relative odor activity value (rOAV) analysis combined with random forest analysis revealed that key compounds in GT included nonanal, Z-jasmone, 2,6-dimethyl-1,7-octadiene-3,6-diol, linalool, nerol, and 1-decanol. This study analyzed the volatile component variation between GT and OT cultivars, providing a reference for breeding tea cultivars with distinct processing suitability.
-
Key words:
- Tea cultivar /
- Volatile metabolomics /
- HS-SPME-GC-MS /
- rOAV