


-
Vanilla planifolia Andrews, a perennial climbing vine belonging to the Orchidaceae family, is native to the tropical rainforests of Mexico, Central America, the West Indies, and northern South America[1,2]. Widely acclaimed worldwide as 'the King of Natural Food Flavors', V. planifolia has been extensively utilized in the production of high-end cigarettes, famous wines, and top-grade teas. It also serves as a key raw material in the food, beverage, and cosmetics industries. Furthermore, V. planifolia is recognized as a natural herb and has been included in the pharmacopeias of European and American countries. The annual global consumption of V. planifolia exceeds 2,000 tons[3−5]. With the continuous improvement of people's living standards, the demand for V. planifolia is steadily increasing. The presence of the rostellum structure renders it challenging for V. planifolia to be pollinated by insects when it is outside its native range[6], and its unique structure has become a major impediment to the industrial development of V. planifolia. Additionally, the rostellum, a characteristic trait of orchids, is extremely small and develops synchronously with other flower organs, thus presenting obstacles to experimental research and sequencing.
The MADS-box transcription factors (TFs) gene family, so named because of its possession of an evolutionarily conserved MADS domain, has been widely detected across a diverse spectrum of eukaryotes. Generally, the MADS-box gene family can be classified into two lineages: type I and type II. Type I genes are primarily involved in the development of seeds, embryos, and female gametophytes[7]. Type II genes, characterized by a conserved MIKC structure, encode proteins. At the amino-terminus of these proteins is the highly conserved DNA-binding MADS domain (M). The central region consists of a less conserved I domain and a moderately conserved K domain, both of which are crucial for protein-protein interactions and the formation of coiled-coil structures. The variable carboxyl-terminal (C) region is thought to potentially function as a transactivation domain[8,9]. Type II genes, also referred to as MIKC genes[10−12], can be further sub-divided into MIKCC and MIKC* subtypes. Notably, MIKCC genes are well-known for their roles in the 'ABCDE' model[13].
The classic 'ABC' model of floral organogenesis was first proposed according to the genetic studies in Antirrhinum majus and Arabidopsis thaliana[14] and was subsequently defined as the 'ABCDE' model after incorporation of class D, class E, and MIKCC genes[15,16]. The MADS-box gene family is believed to play a crucial regulatory role in the flower development and act synergistically during the process of primordial floral organogenesis: the A + E class genes determine the development of sepals; the class A + B + E genes determine the development of petals; the class B + C + E genes specify stamens; the C + E genes specify the carpels[17,18]. Studies have revealed that MIKCC genes play a role in each category of the ABCDE model, including AP1 (APETALA1) in A, AP3 (APETALA3) and PI (PISTILLATA) in B, AG (AGAMOUS) in C, STK (SEEDSTICK) in D, and SEP1-4 (SEPALLATA1-4) in E[19−21].
Studies have shown that the MADS-box gene family in orchid plants bears a high degree of similarity to that of A. thaliana. Moreover, homologous genes corresponding to their respective groups can also be identified within orchids[22,23]. While the 'ABCDE' model is generally conserved across species[24,25], there are still numerous differences in the composition, function, and evolutionary relationships of MADS-box genes among various species. Additionally, whether the development of some unusual flower structures of the Orchidaceae family are related to the MADS-box gene family merits further investigation.
In this study, a genome-wide identification and functional analysis of the MADS-box gene family in V. planifolia was carried out. All the VpMADSs were identified using 'HMMER' and 'BLASTP', and the MIKCC genes were selected for subsequent analysis. Concurrently, gene characterizations, chromosomal locations, gene structures, and conserved motifs were also examined. Phylogenetic relationships were investigated in comparison with AtMADSs (MADS-box proteins from A. thaliana) and OsMADSs (MADS-box proteins from Oryza sativa) through the NJ method, and gene duplications were also explored. Moreover, the expression patterns of VpMADSs during the process of flower development were evaluated, which will offer valuable insights for further functional studies of these VpMADSs in V. planifolia.
-
The vanilla plants for this experiment were planted in the germplasm nursery of the Spice and Beverage Research Institute, Chinese Academy of Tropical Agricultural Sciences (Wanning, China). Before they flowered, flower buds were divided into four stages according to size. For stage 1 (S1), two samples were collected, one was the whole flower, and the other flowers without gynostemium. For stage 2 (S2), in addition to the above two samples, another sample of gynostemium was added. For stage 3 (S3) and stage 4 (S4), in addition to the above three samples, other rostellum samples were added. For each stage, more than five buds were prepared for sample collection. Each sample was collected with three replicates, placed in liquid nitrogen, frozen, and then stored at −80 °C for RNA-sequencing (Majorbio, Shanghai, China).
RNA isolation and quality assessment
-
Total RNA was extracted from tissue samples using TRIzol® Reagent (Thermo Fisher Scientific, USA) following the manufacturer's instructions, followed by genomic DNA removal using DNase I (Takara). RNA quality and integrity were evaluated using a NanoDrop ND-2000 spectrophotometer (Thermo Fisher Scientific, USA), and an Agilent Bioanalyzer 5300 (Agilent Technologies, USA), respectively. Samples meeting stringent quality criteria (OD260/280 ratio: 1.8−2.2; OD260/230 ratio: ≥ 2.0; RNA integrity number RIN ≥ 6.5) were selected for library construction.
Library construction and RNA sequencing
-
Library preparation and sequencing were performed at Shanghai Majorbio Bio-pharm Biotechnology Co., Ltd. (Shanghai, China). Stranded mRNA libraries were constructed using the Illumina® Stranded mRNA Prep, Ligation protocol with 1 μg of total RNA input. Briefly, mRNA was isolated by polyA selection using oligo(dT) beads and subsequently fragmented. Double-stranded cDNA was synthesized using random hexamer primers, followed by end-repair, phosphorylation, and adapter ligation. Size selection was performed using magnetic beads to isolate cDNA fragments of 300−400 bp, followed by 10−15 cycles of PCR amplification. Libraries were quantified using Qubit 4.0 and sequenced on an Illumina NovaSeq 6000 platform with 2 × 150 bp paired-end reads.
Data sources preparation
-
The genomic sequences of V. planifolia were obtained from NCBI database (National Center for Biotechnology Information,
www.ncbi.nlm.nih.gov ), with GenBank assembly version of GCA_016413885.1. The genomic data of A. thaliana were obtained from TAIR database (accessed on 30 December 2022), and sequences of OsMADS for O. sativa were downloaded from PlantTFDB database (http://planttfdb.gao-lab.org/ )[26].Transcript analysis
-
Raw sequencing reads were processed using 'fastp'[27] with default parameters for quality control and adapter trimming. High-quality reads were aligned to the reference genome using HISAT2 in orientation mode[28]. Transcript assembly was then performed using StringTie through a reference-guided approach[28]. Transcript abundance was quantified using RSEM[29] and normalized to transcripts per million reads (TPM).
Identification and characterization of the V. planifolia MADS-box gene family
-
Both 'HMMER' and 'BLASTP' were performed to accurately predict MADS-box genes V. planifolia[30,31]. For the 'HMMER' search, the profiles of the SRF (serum response factor) domain (PF00319) and the MEF2 (myocyte enhancer factor-2) domain (PF09047) were retrieved from the Pfam database (
http://pfam.xfam.org/ )[32]. The well-characterized A. thaliana protein sequences of the MADS-box gene family were collected from PLantTFDB as queries for 'BLASTP' search (e-value ≤ 1 × 10⁻¹⁰). The protein structural integrity was confirmed using an online program called SMART[33]. The ExPASy Proteomics Server toolkit was used to predict physicochemical properties, including protein lengths, molecular weights, isoelectric points (pI), instability index, aliphatic index, and grand average of hydropathicity (GRAVY)[34]. Subcellular locations were predicted using the WoLF PSORT tool (www.genscript.com/wolf-psort.html ).Gene structures, conserved motif predictions, and phylogenetic analysis
-
Gene structures including CDS, UTR, and intron were displayed by GSDS (v2.0) (
http://gsds.gao-lab.org/ ) with annotation information that extracted from NCBI (GCA_016413885.1)[35]. The conserved motifs of MADS proteins were predicted using an online toolkit of MEME[36]. Multiple sequence alignment of MADS-box protein sequences was performed using MUSCLE v3.8, and a neighbor-joining tree was also generated using MEGA 11 with 1,000 bootstrap replicates[37,38]. IQTREE (v2.0) was also adopted to reconstruct the maximum likelihood tree[39], and guarantee a more reliable phylogenetic relationship.Chromosomal localizations, and detection of gene duplications
-
All MADS-box genes were mapped to chromosomes, according to their annotations in the genome. Both tandem duplications and segmental duplications were predicted according to the Plant Genome Duplication Database[40]. The all-against-all 'BLASTP' comparison (e-value ≤ 1 × 10⁻¹⁰) was performed to give similarities among all genes. MCScanX was used to detect segment duplications and results were manually confirmed[41]. Tandem duplications were accepted as those genes next to each other, or separated by one unrelated gene.
Estimation of synonymous (Ks), and nonsynonymous (Ka) substitutions per site and their ratio (Ka/Ks)
-
All duplicated gene pairs were used to estimate Ka, Ks, and Ka/Ks. Coding sequences from duplicated genes were aligned using 'PRANK'[42]. The estimation of Ka, Ks, and Ka/Ks was developed using the KaKs_Calculator (v3.0)[43], and the MA model was adopted.
Expression profiles, WGCNA analysis, and GO enrichment
-
The expression profiles of MADS-box genes response to different stages (S1 to S4) were analyzed. Furthermore, gene co-expression correlations were also displayed with R package WGCNA (Weighted Gene Co-expression Network Analysis)[44]. All the genes that were aligned to the V. planifolia genome through RNA-seq sequencing were used as the primary gene set. Then genes with extremely low expression were manually filtered out, and the expression data of all remaining genes were used as input for WGCNA analysis. Based on the WGCNA software, through further processing, the genes were clustered into different modules. The modules show the correlation with different tissues and the degree of strength of the correlation. GO enrichment analyses were performed with DAVID[45], and the input gene set from each WGCNA module that contained VpMADS genes.
Real-time quantitative PCR (qRT-PCR) analysis
-
Whole vanilla flowers at four developmental stages (S1–S4) were collected and dissected into different tissues according to the transcriptome sampling method. Samples were immediately frozen in liquid nitrogen and stored at –80 °C. Total RNA was extracted using the Vazyme VeZol-Pure Total RNA Isolation Kit (Cat# RC202-01). Approximately 100 mg of powdered tissue was lysed in 1 mL Trizol reagent following the manufacturer's protocol. First-strand cDNA was synthesized using the Vazyme HiScript IV 1st Strand cDNA Synthesis Kit (Cat# R412-01) with the reaction components as follows: 1 μL of total RNA, 7 μL RNase-free water, and 2 μL 5 × gDNA wiper Mix were incubated at 42 °C for 2 min; then 5 μL 4 × HiScript IV RT SuperMix, 1 μL Oligo (dt)20VN, and 2 μL Random Primers were added, followed by incubation at 37 °C for 15 min and 85 °C for 5 s. qRT-PCR was performed using the Vazyme SupRealQ Ultra Hunter SYBR qPCR Master Mix (Cat# Q713-02) on an ABI QuantStudio 6 instrument. The 20-μL reaction mixture contained 1 μL of 100-fold diluted cDNA, 10 μL 2 × Master Mix, 1 μL each of forward and reverse primers, and 7 μL ddH2O. Thermal cycling conditions were 95 °C for 30 s, followed by 40 cycles of 95 °C for 3–10 s and 60 °C for 10–30 s, with a melting curve analysis. Relative gene expression levels were calculated using the comparative CT method, and biological replicates were analyzed for mean values and linear regression. Fourteen flowering-related genes and nine MADS-box genes were selected for validation. Log2-transformed values of transcriptome counts and qRT-PCR expression levels were subjected to linear regression analysis, with R2 > 0.8 indicating a strong correlation between the two datasets. The primers were shown in Supplementary Table S1.
-
Based on the results of 'HMMER' and 'BLASTP', a total of 47 MADS-box genes were identified. The chromosome locations, molecular weights, number of amino acids, exon numbers, pI, instability index, aliphatic index, GRAVY, and predicted subcellular locations are all presented in Table 1. As demonstrated in Table 1, the lengths of these MADS-box proteins ranged from 53 aa (KAG0449578.1) to 397 aa (KAG0468859.1). The molecular weights were between 6.09 kDa (KAG0449578.1), and 43.42 kDa (KAG0468859.1), and the pIs varied from 3.95 (KAG0468269.1) to 11.87 (KAG0500929.1), respectively. The instability indices were between 30.65 and 98.81 and six VpMADSs (VpMADS4, VpMADS5, VpMADS14, VpMADS15, VpMADS16, VpMADS17) were lower than 40. Nearly all VpMADSs exhibited negative GRAVY values, except for VpMADS21, suggesting that the majority of VpMADSs were hydrophilic, while VpMADS21 was hydrophobic (Table 1). It was predicted that nine MADS-box proteins might be expressed in the chloroplast, mitochondrion, and cytoplasm. In contrast, the other 38 members were predicted to be expressed in the nucleus (Table 1). Additionally, SMART results indicated that there were 22 genes belonging to the MIKCC type, which were named VpMADS1 to VpMADS22. Since the 'ABCDE' model is derived from MIKCC genes, we primarily concentrated on the MIKCC type genes in this study, and the subsequent analyses were also centered around this type.
Table 1. Characterization information of MADS-box genes in V. planifolia.
Number Gene name Gene ID Protein ID Chromosome Location Exon Lengths
(aa)Molecular
weight (kDa)pIs Instability
indexAliphatic
indexGRAVY Subcellular
locations1 VpMADS1 HPP92_008009 KAG0491146.1 CM028166.1 53926398−53889497 8 243 27.70 9.13 59.86 81.15 −0.627 nucl 2 VpMADS2 HPP92_025895 KAG0452056.1 Scaffold 4610−28001 5 143 16.72 9.95 50.35 86.57 −0.671 nucl 3 VpMADS3 HPP92_002365 KAG0502293.1 CM028164.1 41951176−41971594 8 239 27.47 10.18 46.05 75.19 −0.724 nucl 4 VpMADS4 HPP92_008272 KAG0486177.1 CM028167.1 13125651−13163619 13 333 37.84 8.46 38.89 76.55 −0.664 nucl 5 VpMADS5 HPP92_004657 KAG0493663.1 CM028165.1 19723207−19699540 7 170 19.48 10.28 37.52 76.94 −0.710 nucl 6 VpMADS6 HPP92_012311 KAG0477592.1 CM028169.1 913908−940568 7 233 27.02 8.74 55.83 78.84 −0.738 nucl 7 VpMADS7 HPP92_019641 KAG0465477.1 CM028173.1 1750461−7467554 11 273 31.37 10.01 58.54 73.66 −0.897 nucl 8 VpMADS8 HPP92_000523 KAG0500451.1 CM028164.1 7310328−7337810 8 238 27.74 9.66 58.97 76.68 −0.912 nucl 9 VpMADS9 HPP92_004659 KAG0493665.1 CM028165.1 19759650−19739731 7 206 23.77 7.44 59.50 88.50 −0.594 nucl 10 VpMADS10 HPP92_018645 KAG0469317.1 CM028172.1 35561818−35564488 8 196 22.62 9.65 49.77 93.06 −0.501 nucl 11 VpMADS11 HPP92_013585 KAG0478866.1 CM028169.1 39304241−39332580 8 306 35.00 10.09 48.99 84.54 −0.727 chlo 12 VpMADS12 HPP92_011874 KAG0483790.1 CM028168.1 46902542−46875786 6 158 18.43 9.89 48.19 89.49 −0.715 nucl 13 VpMADS13 HPP92_005378 KAG0494384.1 CM028165.1 34246112−34242902 7 210 24.46 9.73 54.20 80.33 −0.847 nucl 14 VpMADS14 HPP92_014026 KAG0474340.1 CM028170.1 4454990−4456550 7 227 26.12 9.79 30.65 76.43 −0.690 nucl 15 VpMADS15 HPP92_025189 KAG0453885.1 CM028177.1 12379231−12385185 7 226 26.11 9.4 37.58 71.19 −0.907 nucl 16 VpMADS16 HPP92_027258 KAG0449499.1 Scaffold 27238−28686 7 224 25.72 8.59 33.14 75.76 −0.816 nucl 17 VpMADS17 HPP92_027253 KAG0449534.1 Scaffold 23870−25317 7 224 25.75 8.59 32.46 75.31 −0.827 nucl 18 VpMADS18 HPP92_022688 KAG0459560.1 CM028175.1 27880086−27881205 6 199 23.30 6.26 55.70 90.10 −0.734 nucl 19 VpMADS19 HPP92_016068 KAG0471522.1 CM028171.1 15727789−15751238 6 237 27.44 6.86 53.86 85.61 −0.701 nucl 20 VpMADS20 HPP92_019895 KAG0465731.1 CM028173.1 22873092−22859226 8 233 26.90 9.95 44.53 80.39 −0.768 nucl 21 VpMADS21 HPP92_028185 KAG0447715.1 Scaffold 162889−180657 8 241 27.70 9.55 50.31 88.96 0.673 nucl 22 VpMADS22 HPP92_003653 KAG0503581.1 CM028164.1 71467560−71483956 8 236 26.67 9.49 52.95 85.97 −0.676 nucl 23 VpMADS23 HPP92_018187 KAG0468859.1 CM028172.1 25621594−25623473 2 397 43.42 8.33 51.10 75.47 −0.390 nucl 24 VpMADS24 HPP92_018217 KAG0468889.1 CM028172.1 25806044−25805443 1 201 22.20 10.51 49.06 84.48 −0.359 nucl 25 VpMADS25 HPP92_018216 KAG0468888.1 CM028172.1 25804775−25804159 1 206 22.59 5.89 57.61 69.66 −0.424 nucl 26 VpMADS26 HPP92_024103 KAG0456315.1 CM028176.1 13269344−13271121 2 227 25.23 8.38 42.41 69.25 −0.348 chlo 27 VpMADS27 HPP92_007552 KAG0490689.1 CM028166.1 47024798−47015510 2 285 30.46 7.84 49.59 76.35 −0.161 chlo 28 VpMADS28 HPP92_015891 KAG0471345.1 CM028171.1 8420535−8419862 1 225 24.75 9.32 56.46 79.47 −0.323 mito 29 VpMADS29 HPP92_017597 KAG0468269.1 CM028172.1 7523285−7522378 1 303 34.16 3.95 75.21 66.40 −0.351 cyto,nucl 30 VpMADS30 HPP92_020940 KAG0462464.1 CM028174.1 24936725−24936913 1 62 71.15 11.24 46.35 81.77 −0.715 cyto 31 VpMADS31 HPP92_021120 KAG0462644.1 CM028174.1 30103735−30104316 1 193 21.65 4.35 49.19 81.92 −0.244 nucl 32 VpMADS32 HPP92_003394 KAG0503322.1 CM028164.1 65572515−65571935 1 194 21.89 4.43 43.42 88.56 −0.268 nucl 33 VpMADS33 HPP92_021141 KAG0462665.1 CM028174.1 30322958−30322552 1 136 15.02 8.49 48.82 71.91 −0.425 chlo 34 VpMADS34 HPP92_021123 KAG0462647.1 CM028174.1 30109707−30110117 1 136 15.02 8.49 51.65 77.57 −0.421 nucl 35 VpMADS35 HPP92_018629 KAG0469301.1 CM028172.1 35292006−35292752 1 248 27.44 5.06 54.23 86.45 −0.328 mito 36 VpMADS36 HPP92_001001 KAG0500929.1 CM028164.1 17746641−17746100 1 181 20.59 11.87 98.81 70.17 −0.703 chlo 37 VpMADS37 HPP92_001047 KAG0500975.1 CM028164.1 18592118−18591250 1 290 31.94 8.37 71.18 75.41 −0.388 chlo 38 VpMADS38 HPP92_016507 KAG0471961.1 CM028171.1 25992721−25993493 2 232 26.96 9.85 55.03 72.33 −0.736 nucl 39 VpMADS39 HPP92_010957 KAG0482873.1 CM028168.1 21521752−21514509 10 334 38.02 5.63 52.66 78.50 −0.678 nucl 40 VpMADS40 HPP92_024526 KAG0456738.1 CM028176.1 20634534−20642107 5 158 18.14 9.28 58.00 58.10 −0.872 nucl 41 VpMADS41 HPP92_024533 KAG0456745.1 CM028176.1 20692383−20699955 5 158 18.22 9.24 55.56 58.10 −0.875 nucl 42 VpMADS42 HPP92_012718 KAG0477999.1 CM028169.1 8293060−8290817 3 93 10.50 9.88 43.58 93.33 −0.269 nucl 43 VpMADS43 HPP92_007709 KAG0490846.1 CM028166.1 49599440−49599250 1 64 7.44 10.46 74.37 88.44 −0.608 nucl 44 VpMADS44 HPP92_009109 KAG0487014.1 CM028167.1 33211407−33248681 9 292 32.97 8.6 42.97 93.84 −0.020 nucl 45 VpMADS45 HPP92_025155 KAG0453851.1 CM028177.1 11703058−11704492 2 62 7.08 10.81 48.70 84.84 −0.369 nucl 46 VpMADS46 HPP92_027213 KAG0449578.1 Scaffold 20952−21112 1 53 6.09 11.03 62.05 88.30 −0.232 nucl 47 VpMADS47 HPP92_004675 KAG0493681.1 CM028165.1 20125812−20119937 5 157 18.10 10.82 79.68 64.01 −0.810 nucl Gene structures and conserved motif analysis
-
In V. planifolia, three MIKCC-type VpMADS genes (VpMADS3, VpMADS10, and VpMADS11) were found to possess 3'UTRs (Fig. 1). All VpMADS genes consisted of multiple exons, with VpMADS4 having the highest number of 13 exons and VpMADS2 having the least number of five exons (Table 1, Fig. 1). The gene lengths ranged from approximately 1 kb (VpMADS18) to 37 kb (VpMADS4). Through phylogenetic analysis, it was observed that most VpMADSs with similar gene structures were grouped into the same clusters, suggesting that they might have comparable functions (Fig. 1).
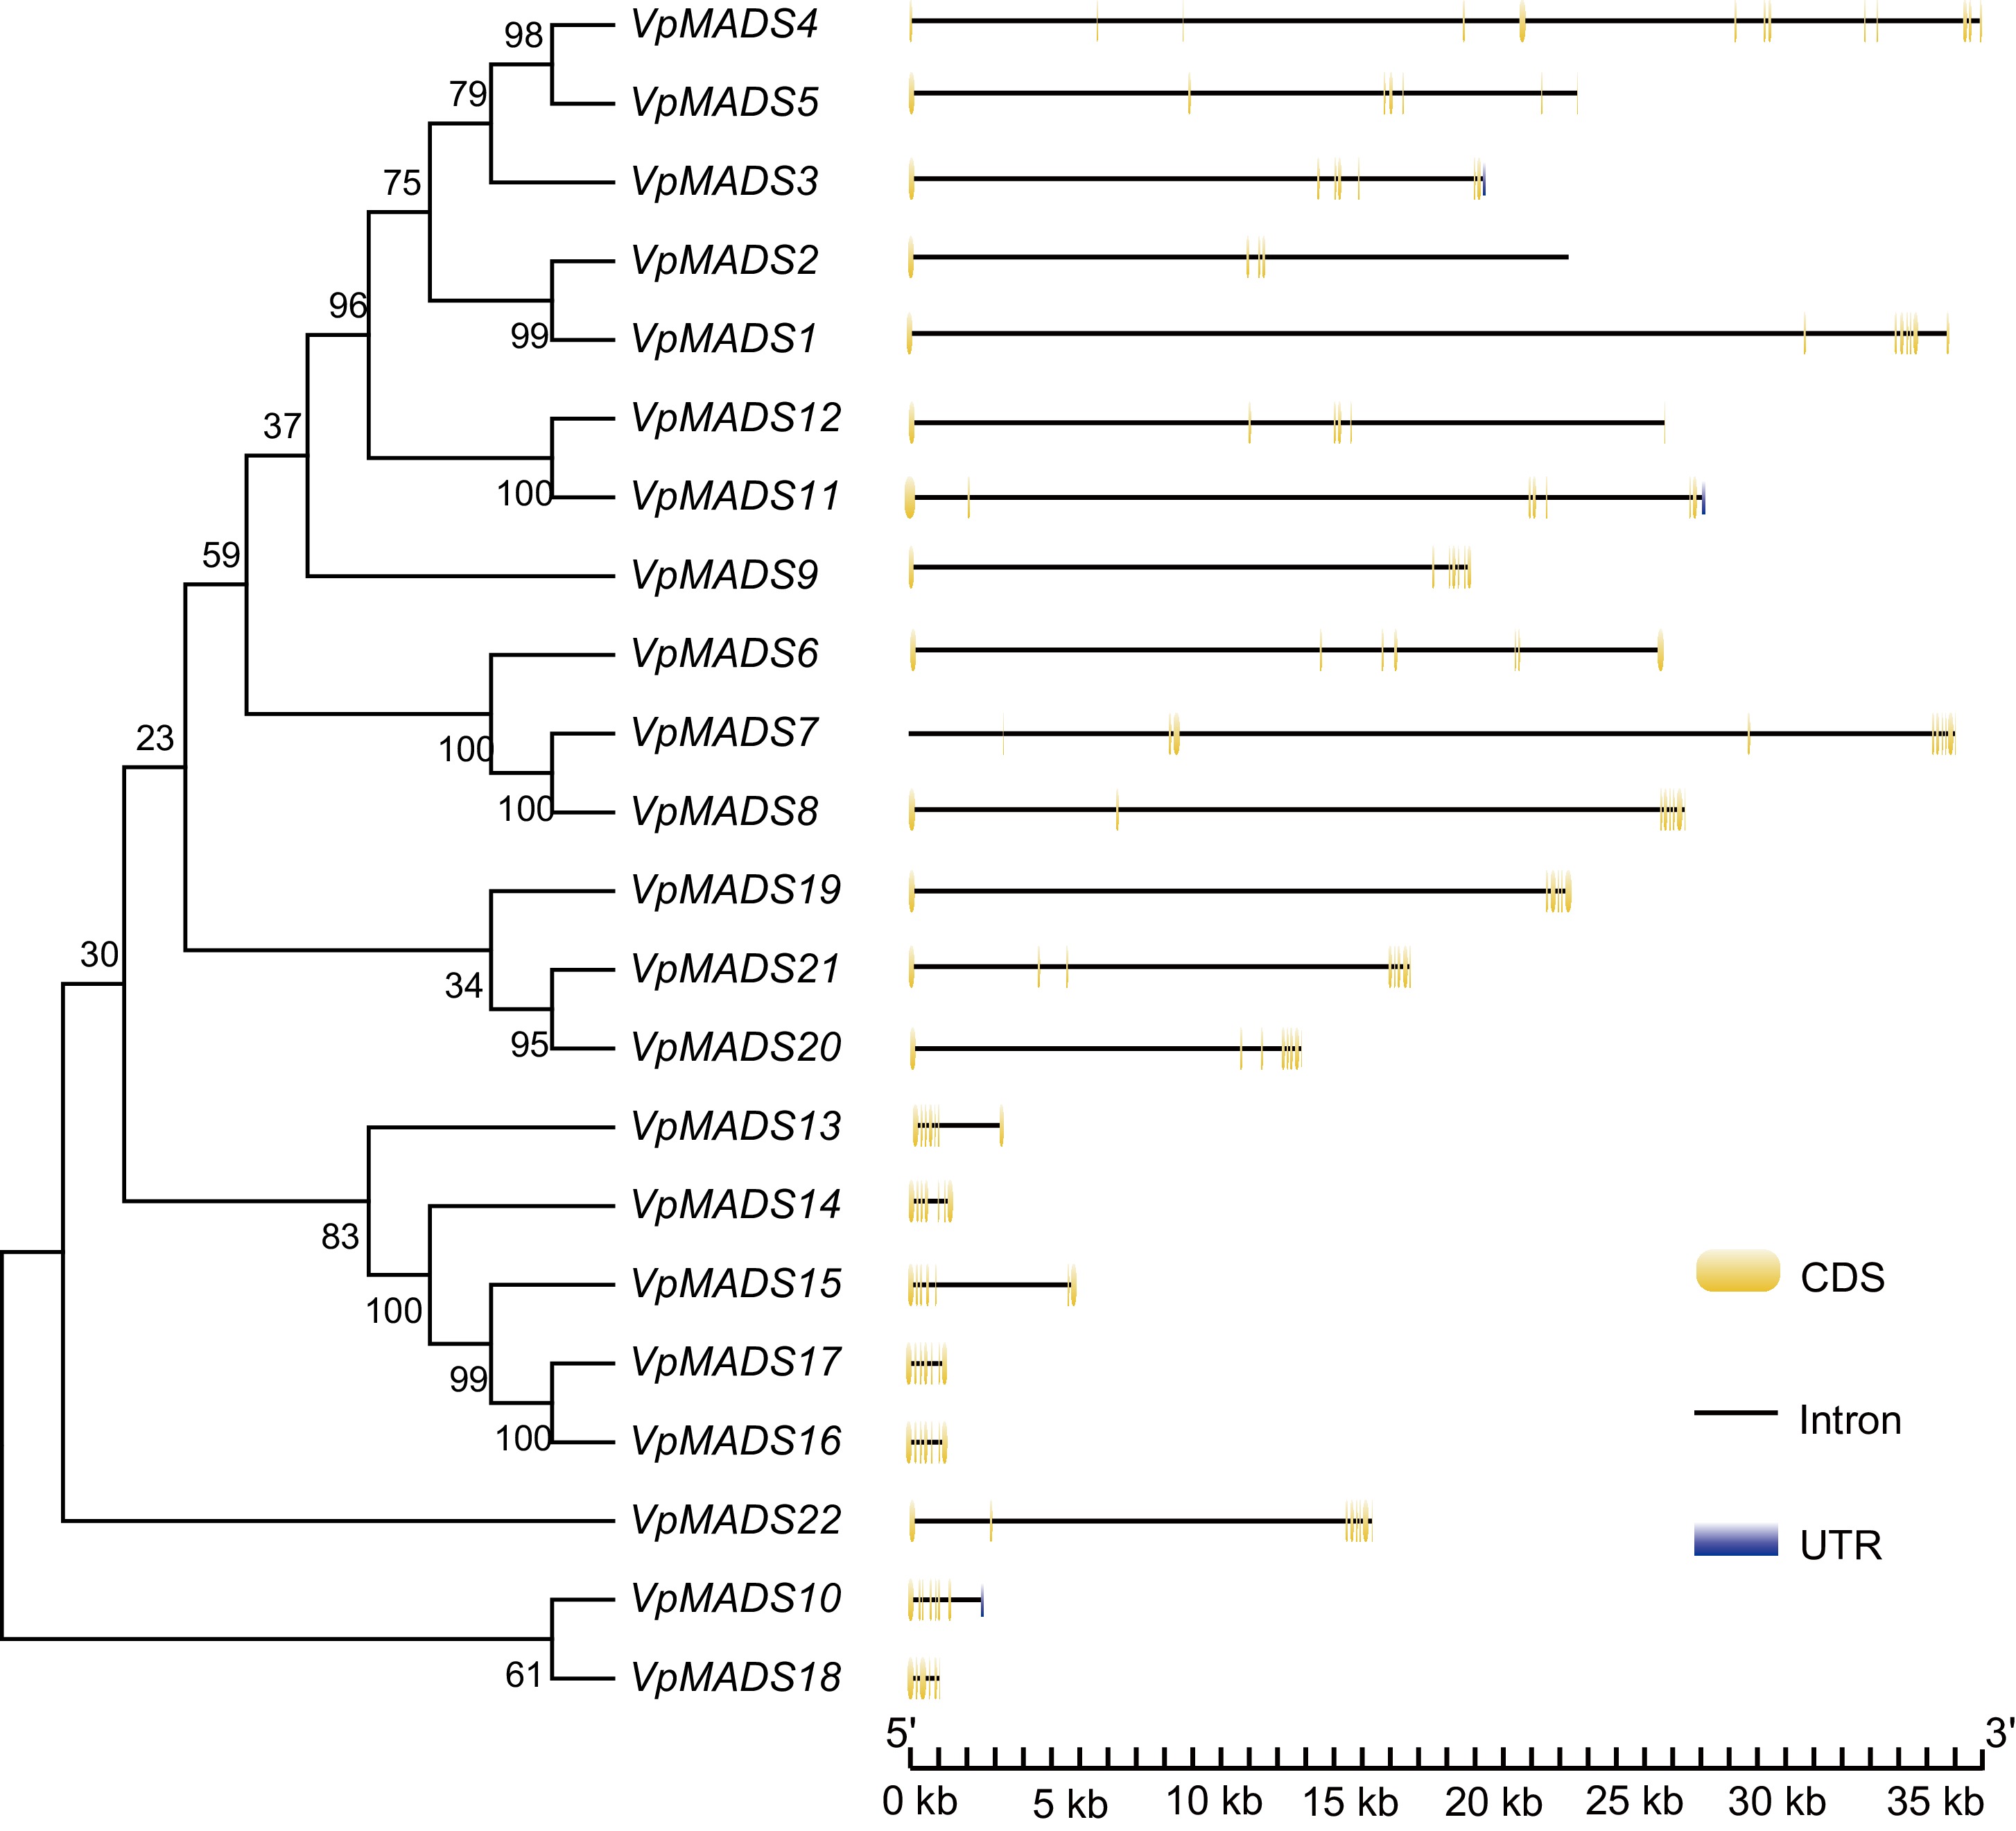
Figure 1.
Gene structures of MIKCC-type VpMADS genes with exons, introns, and UTRs.
Conserved motif analysis was carried out using The MEME suite (
https://meme-suite.org/meme/ ), and the results are presented in Fig. 2. Among the top 10 motifs, all VpMADSs encompassed motif 1, within which the MADS conserved domain was situated. Nearly all VpMADSs contained motif 3, except VpMADS10. Both motif 2 and motif 5 were present in 20 MIKCC-type VpMADSs, where VpMADS5 and VpMADS10 lacked motif 2, and VpMADS18 and VpMADS22 lacked motif 5 (Fig. 2). Additionally, VpMADSs possessing similar conserved motifs might have comparable functions, as exemplified by VpMADS14, VpMADS15, VpMADS16, and VpMADS17 (Fig. 2).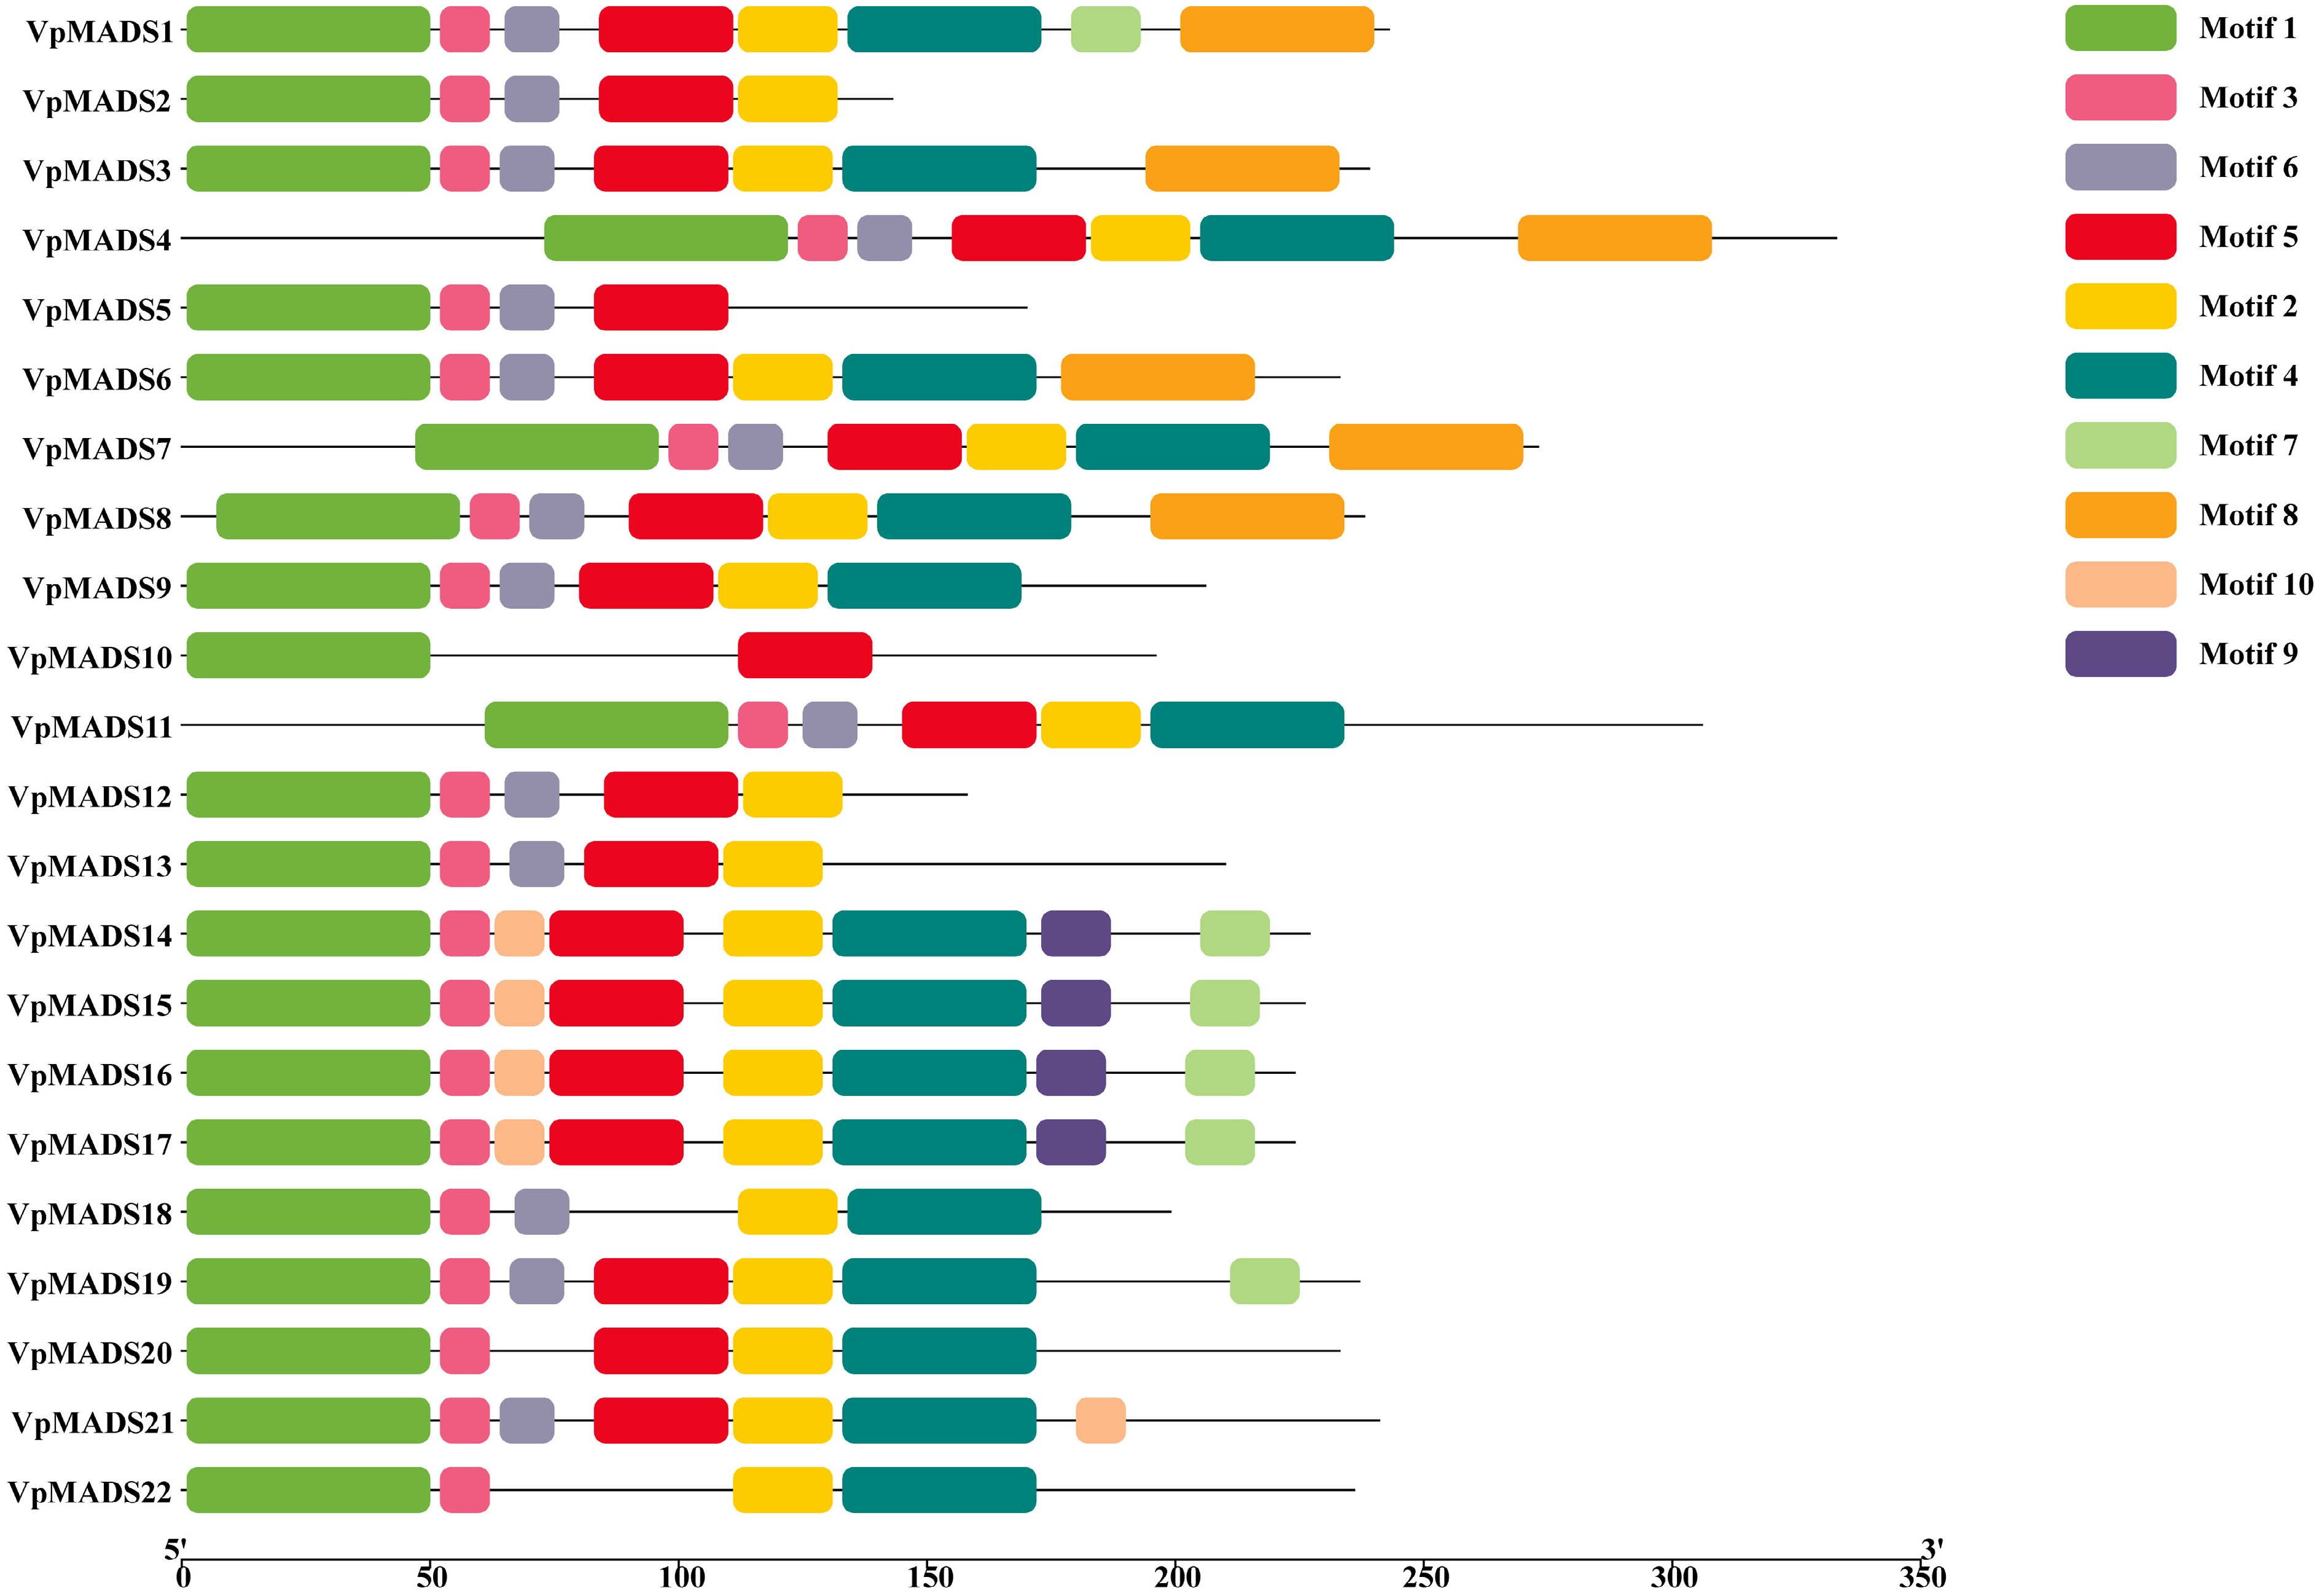
Figure 2.
Conserved motif analyisis of MIKCC-type VpMADSs.
Multiple sequence alignment and phylogenetic analysis
-
V. planifolia represents a monocotyledonous plant species. To investigate its evolutionary trajectory and the classification pattern of the MADS-box gene family, A. thaliana and O. sativa were selected as reference species to reconstruct the phylogenetic relationships, as depicted in Fig. 3. Overall, VpMADSs, OsMADSs, and AtMADSs were clustered into 14 subgroups. Specifically, VpMADSs shared eight common groups, namely SEP-like, RSB1-like, AG-like, SOC1-like, SQUA-like, ANR1-like, SVP-like, and P1/AP3, with OsMADSs and AtMADSs. Notably, two groups, FLC-like and AGL15/18, were not present in both V. planifolia and O. sativa. Additionally, two groups, XAL1-like and TT16-like, consisted solely of OsMADSs and AtMADSs, with no corresponding VpMADS homologous genes. In the case of the GOA-like group, there was only one VpMADS10 and one GOA, and no OsMADSs were involved, as shown in Fig. 3. There was also a particular group, designated as 'unique', which encompassed both OsMADSs and VpMADSs but did not include AtMADSs. Among the ten groups that contained VpMADSs, the P1/AP3 group exhibited the highest abundance of VpMADSs, while the GOA-like and SOC1-like groups had the lowest number of VpMADSs, as illustrated in Fig. 3.
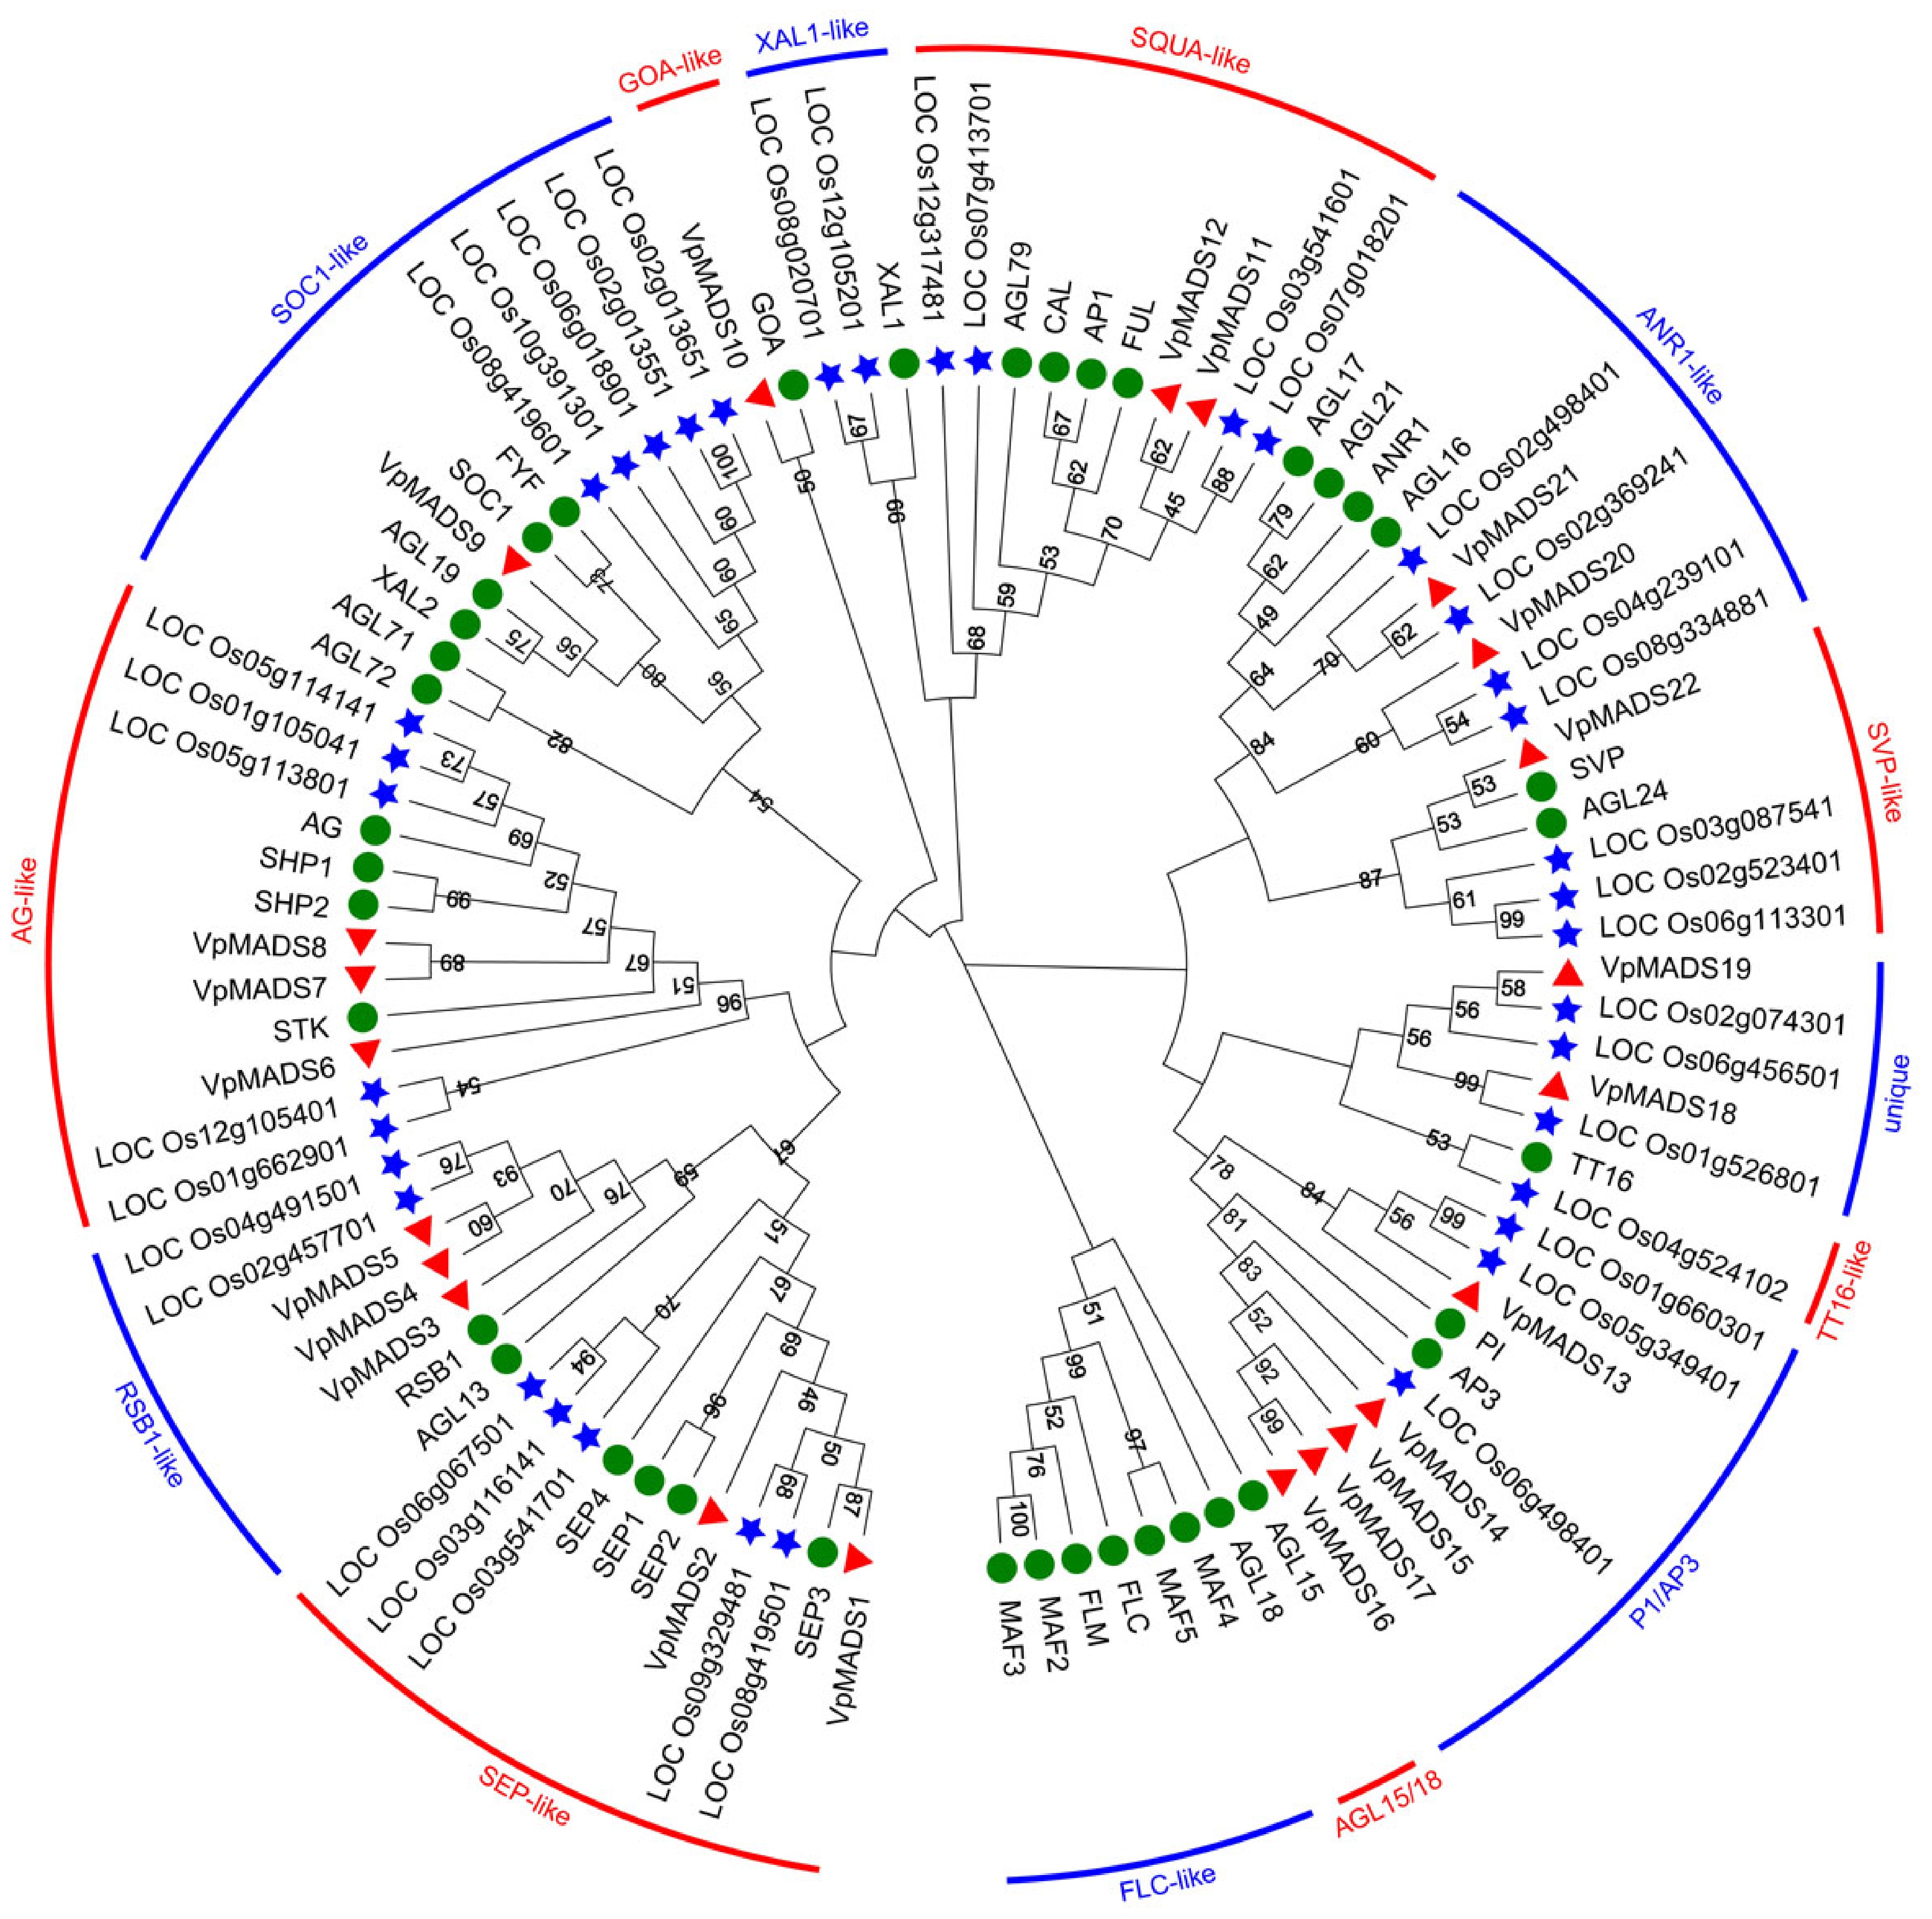
Figure 3.
The phylogenetic tree of MIKCC-type MADS-box proteins in V. planifolia, A. thaliana, and O. sativa. The red triangles referred to VpMADSs, green circles referred to AtMADSs, and blue stars referred to OsMADSs. Two adjacent groups were alternately distinguished by bands of two colors.
Chromosomal localizations and gene duplications
-
The chromosomal distributions of 22 VpMADSs are presented in Fig. 4. These genes are distributed unevenly across 12 chromosomes and four scaffolds. Both CM028164.1 and CM028165.1 harbor three VpMADSs, which represent the highest number of members. Simultaneously, there are two VpMADSs located on both CM028169.1 and CM028173.1, while the remaining chromosomes or scaffolds possess only one member each (Fig. 4). Gene duplications within the V. planifolia genome were also computed and documented in Supplementary Table S2. Through MCScanX searching and manual screening, 48 pairs of duplications were identified as segment duplications. These duplications encompassed 35 VpMADSs, and some duplicated pairs between MIKCC and other types were also detected. Segment duplications serve as the primary driving force for the expansion of the MADS-box genes in V. planifolia, while only two pairs of tandem duplications could be observed (Supplementary Table S2). Moreover, it was demonstrated that the Ka values were mainly concentrated in the range of 0.5 to 0.8, the Ks values were mainly clustered around 1.8 to 2.4, and the Ka/Ks values were predominantly centered around 0.2 to 0.5 (Supplementary Fig. S1). The aforementioned results suggested that VpMADSs have been subject to negative selection during the evolutionary process.
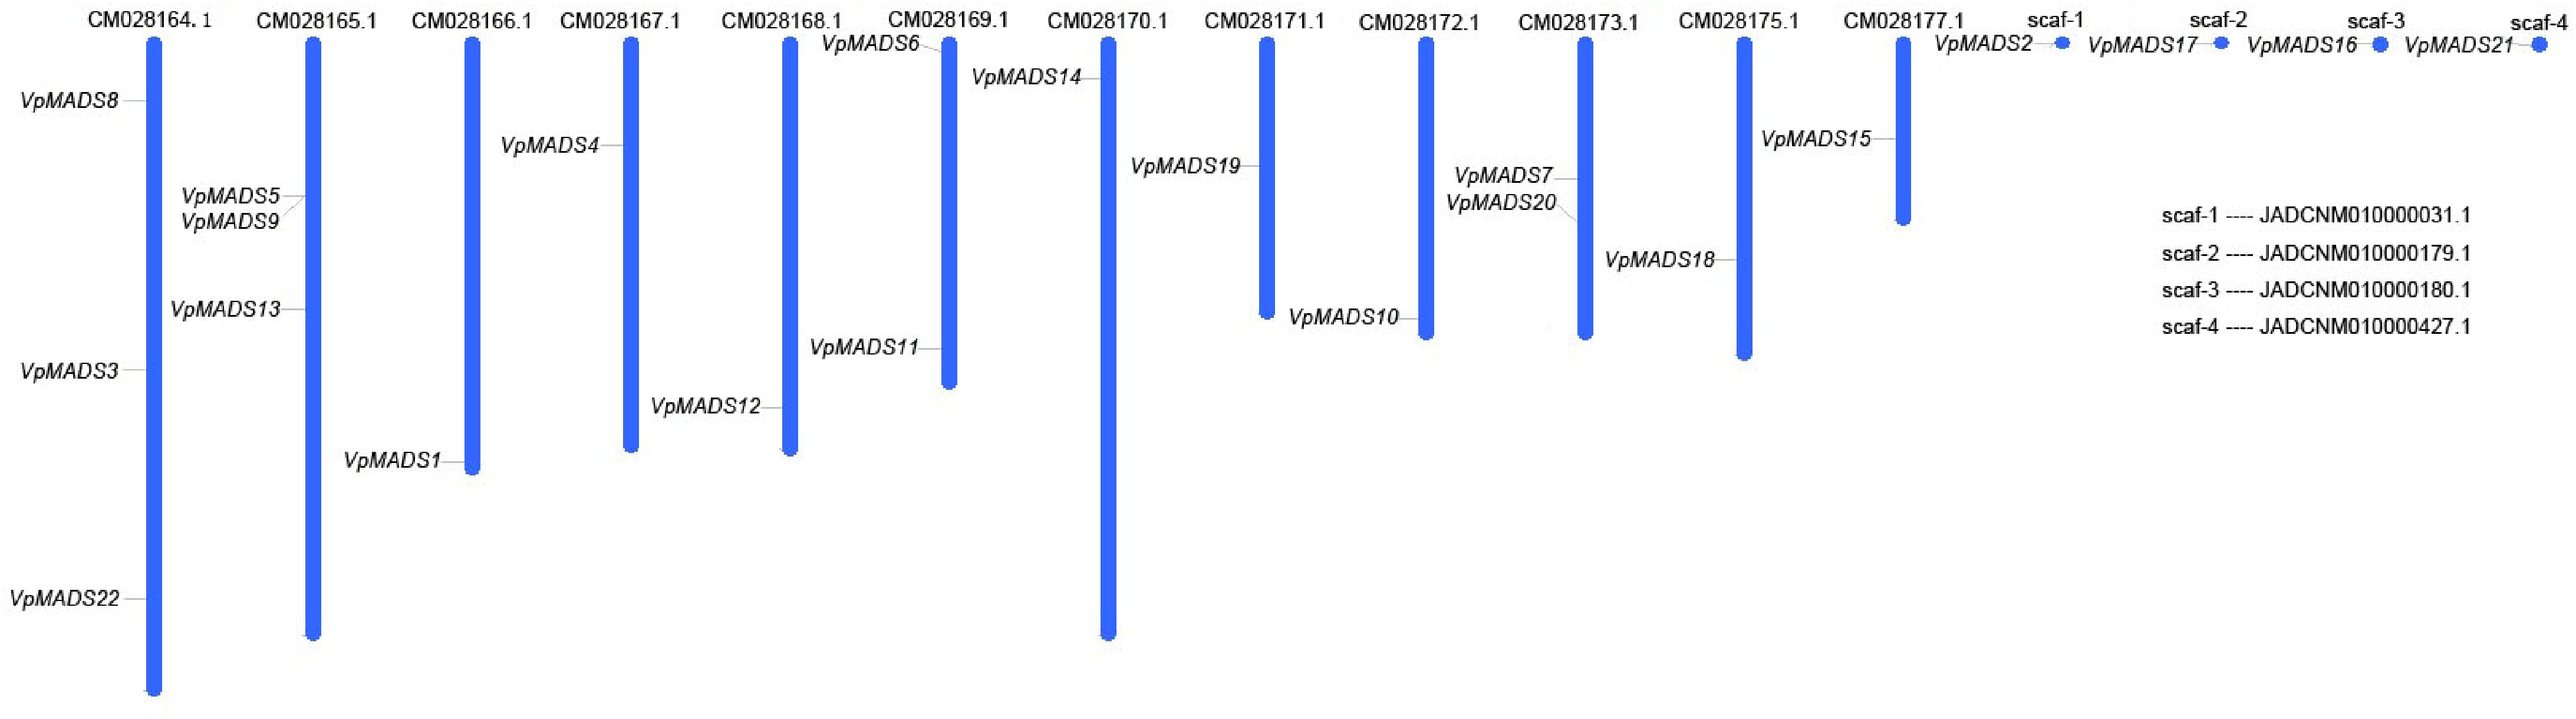
Figure 4.
Gene distributions of MIKCC type VpMADSs in V. planifolia.
RNA-sequencing and expression profiles of VpMADSs during bud formation
-
In this study, a novel sampling approach for the small rostellum was adopted to conduct RNA-seq sequencing. Figure 5 illustrates the four stages, where A and B respectively depict the overall and internal differences among the four stages. For the sake of convenient representation, we use 'R' to denote the rostellum, 'G' to represent the gynostemium excluding the rostellum, and 'B' to stand for the buds with both the rostellum and the gynostemium removed. The composition of tissues in each sample is indicated by a combination of the corresponding letters. For example, a complete bud is represented as 'BGR'. To investigate the gene expression during rostellum development, samples including the whole flower (BGR), a whole flower without the gynostemium (BG), gynostemium (GR), and gynostemium without the rostellum (G) were collected for subsequent RNA-seq sequencing. In phase S1, only BG and BGR were gathered and compared. During the S2 stage, as the buds grew slightly larger, G samples were incorporated. In the S3 and S4 stages, with the further development of the flower, G and GR samples were added at both stages. Consequently, we were able to acquire differential expression genes from different tissues and stages, which effectively circumvented the challenge of obtaining flower organ samples.
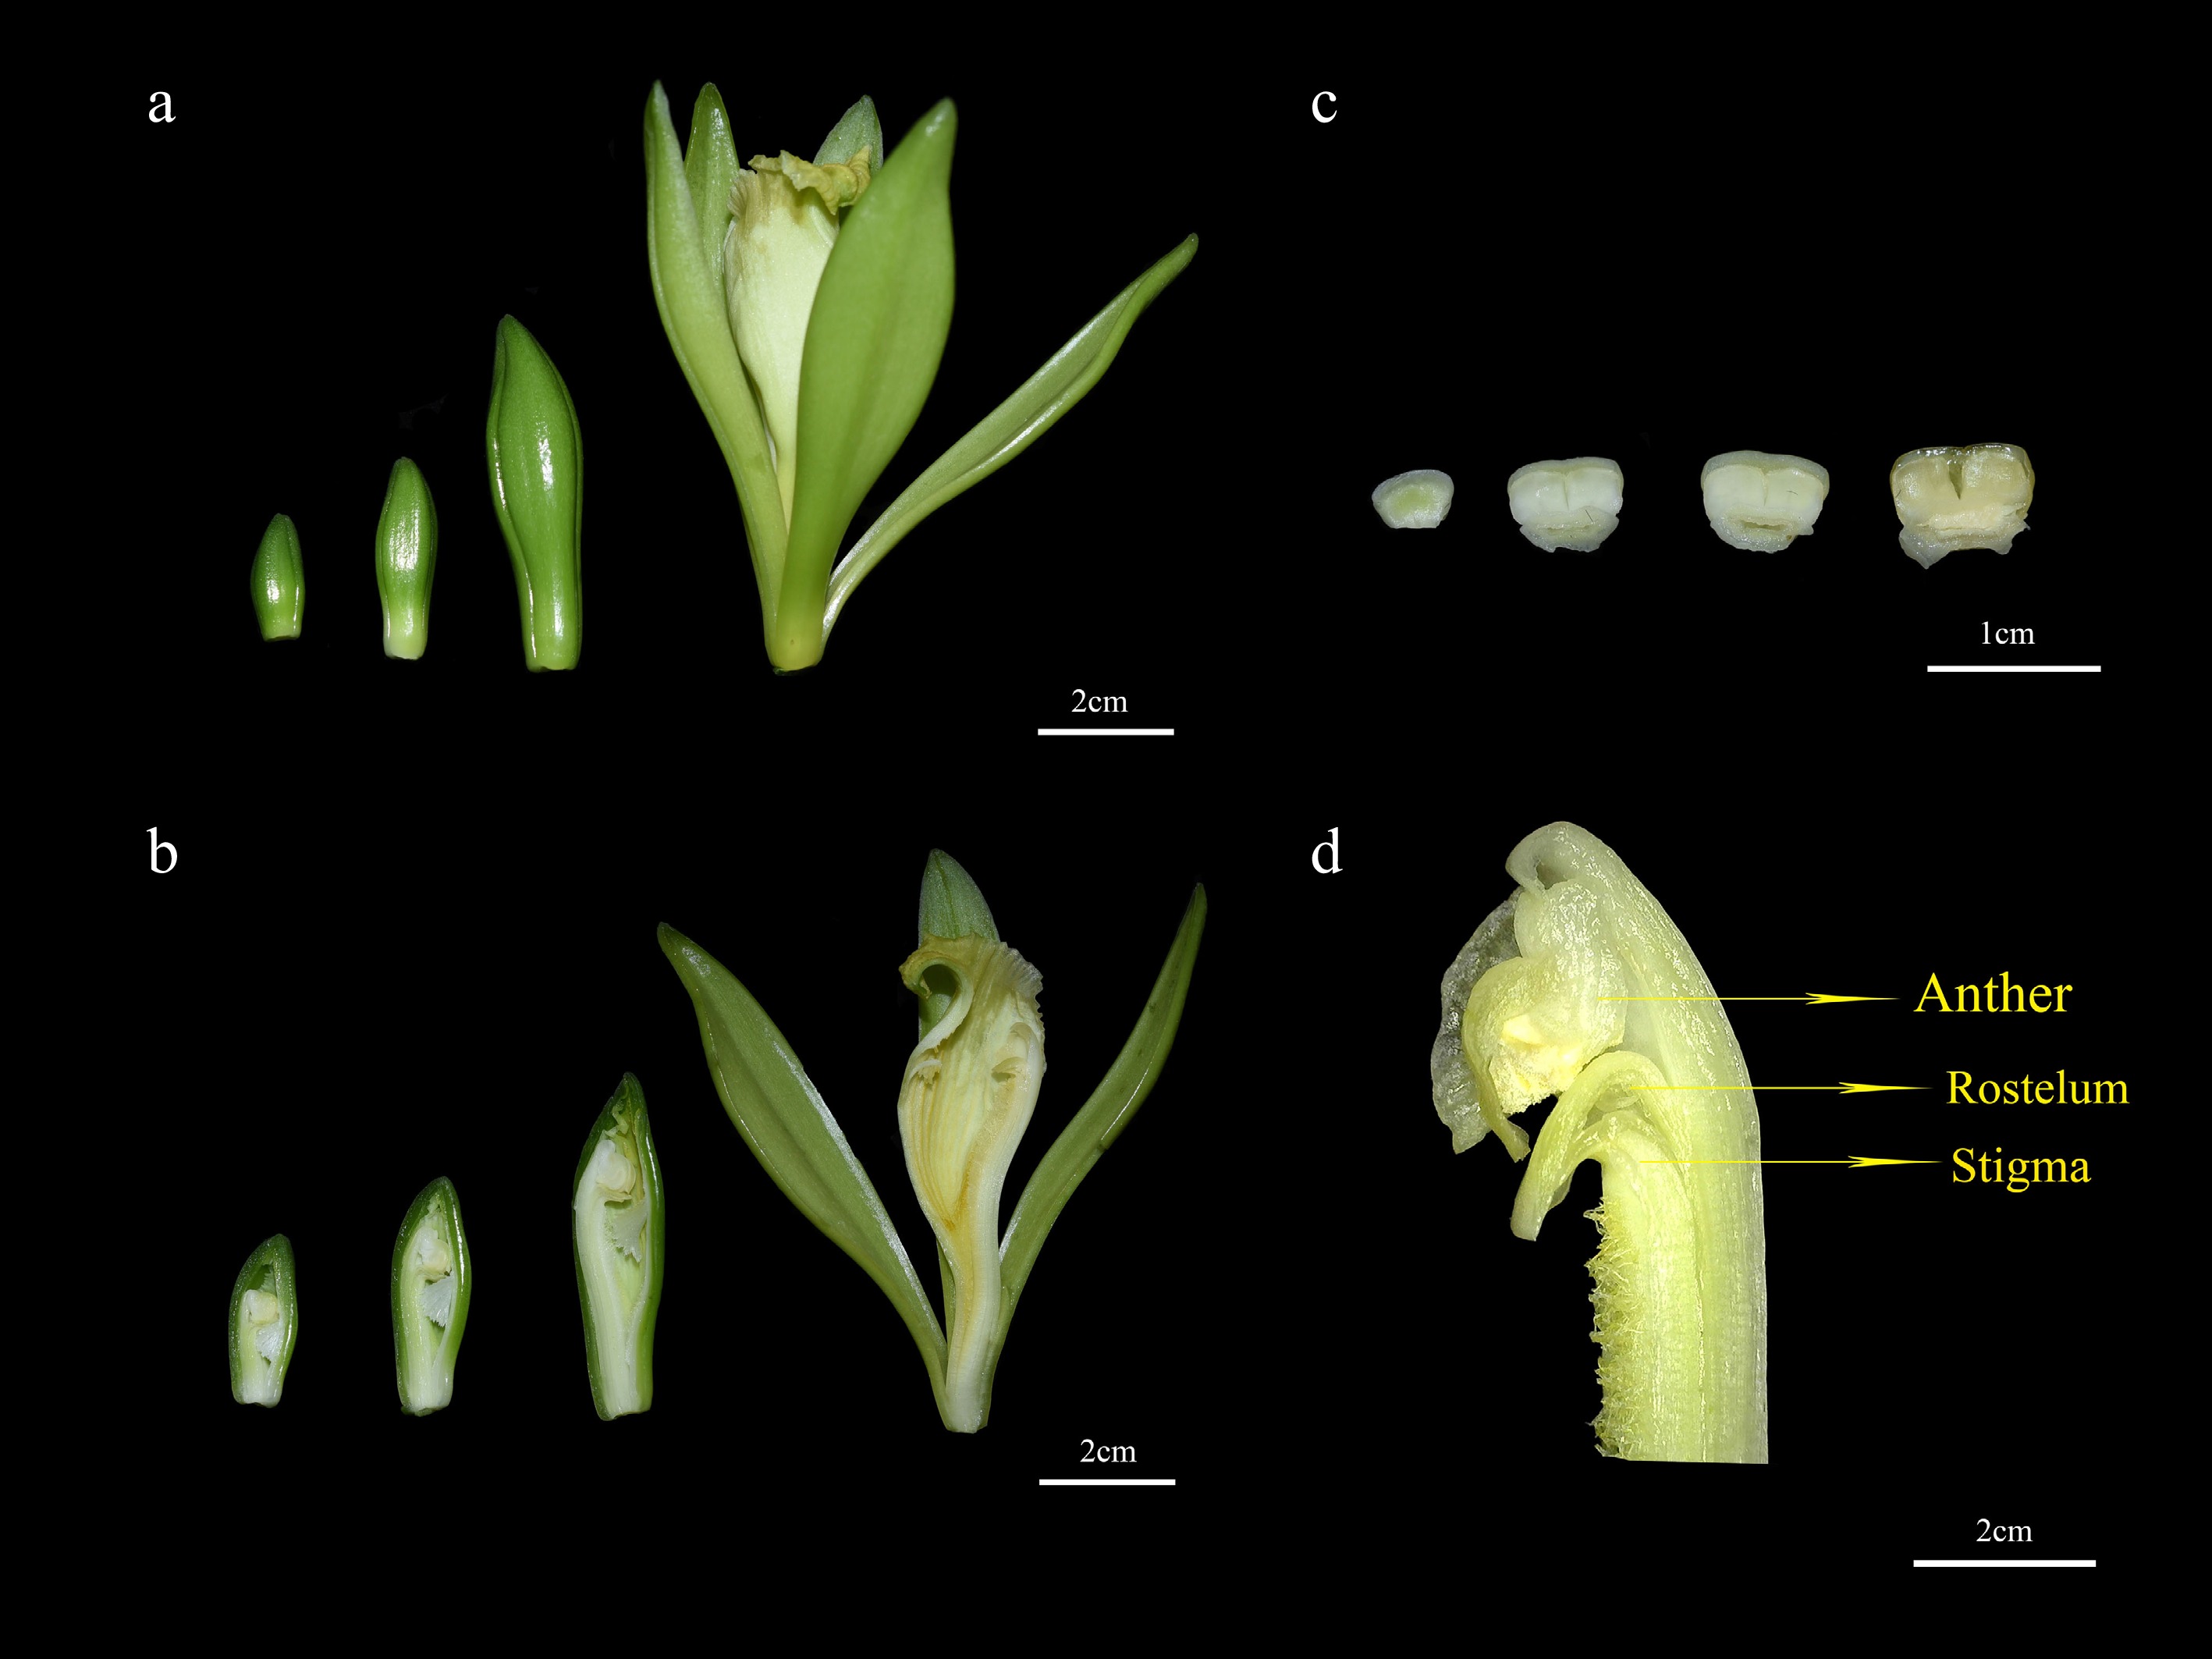
Figure 5.
Different periods and structures of V. planifolia flowers. (a) Whole flower in four stages S1 to S4 (from left to right); (b) flower internal structure S1 to S4 (from left to right); (c) rostellum S1 to S4 (from left to right); (d) magnified view of flower internal structure.
Based on the RNA-seq results, 15 genes with differential expression profiles were obtained, as depicted in Fig. 6. The expression levels of VpMADS3, VpMADS4, VpMADS5, VpMADS11, VpMADS12, VpMADS13, VpMADS14, VpMADS16, and VpMADS17 in BGR exhibited a significant decrease from the S1 to S4 phase, particularly prominent in the S4 stage (Fig. 6). In contrast, the expressions of VpMADS9, and VpMADS21 displayed an opposite tendency, showing an evident up-regulated expression profile in the S4 stage. The expression profiles of most genes were comparable in both GR and G, yet significantly differed from that in BG (VpMADS9, VpMADS11, VpMADS14, VpMADS17). In numerous instances, there was no significant difference in expression between BG and BGR; nevertheless, certain genes, such as VpMADS3, VpMADS11, VpMADS17, and VpMADS18 were remarkably differentially expressed in specific stages between BG and BGR (Fig. 6).
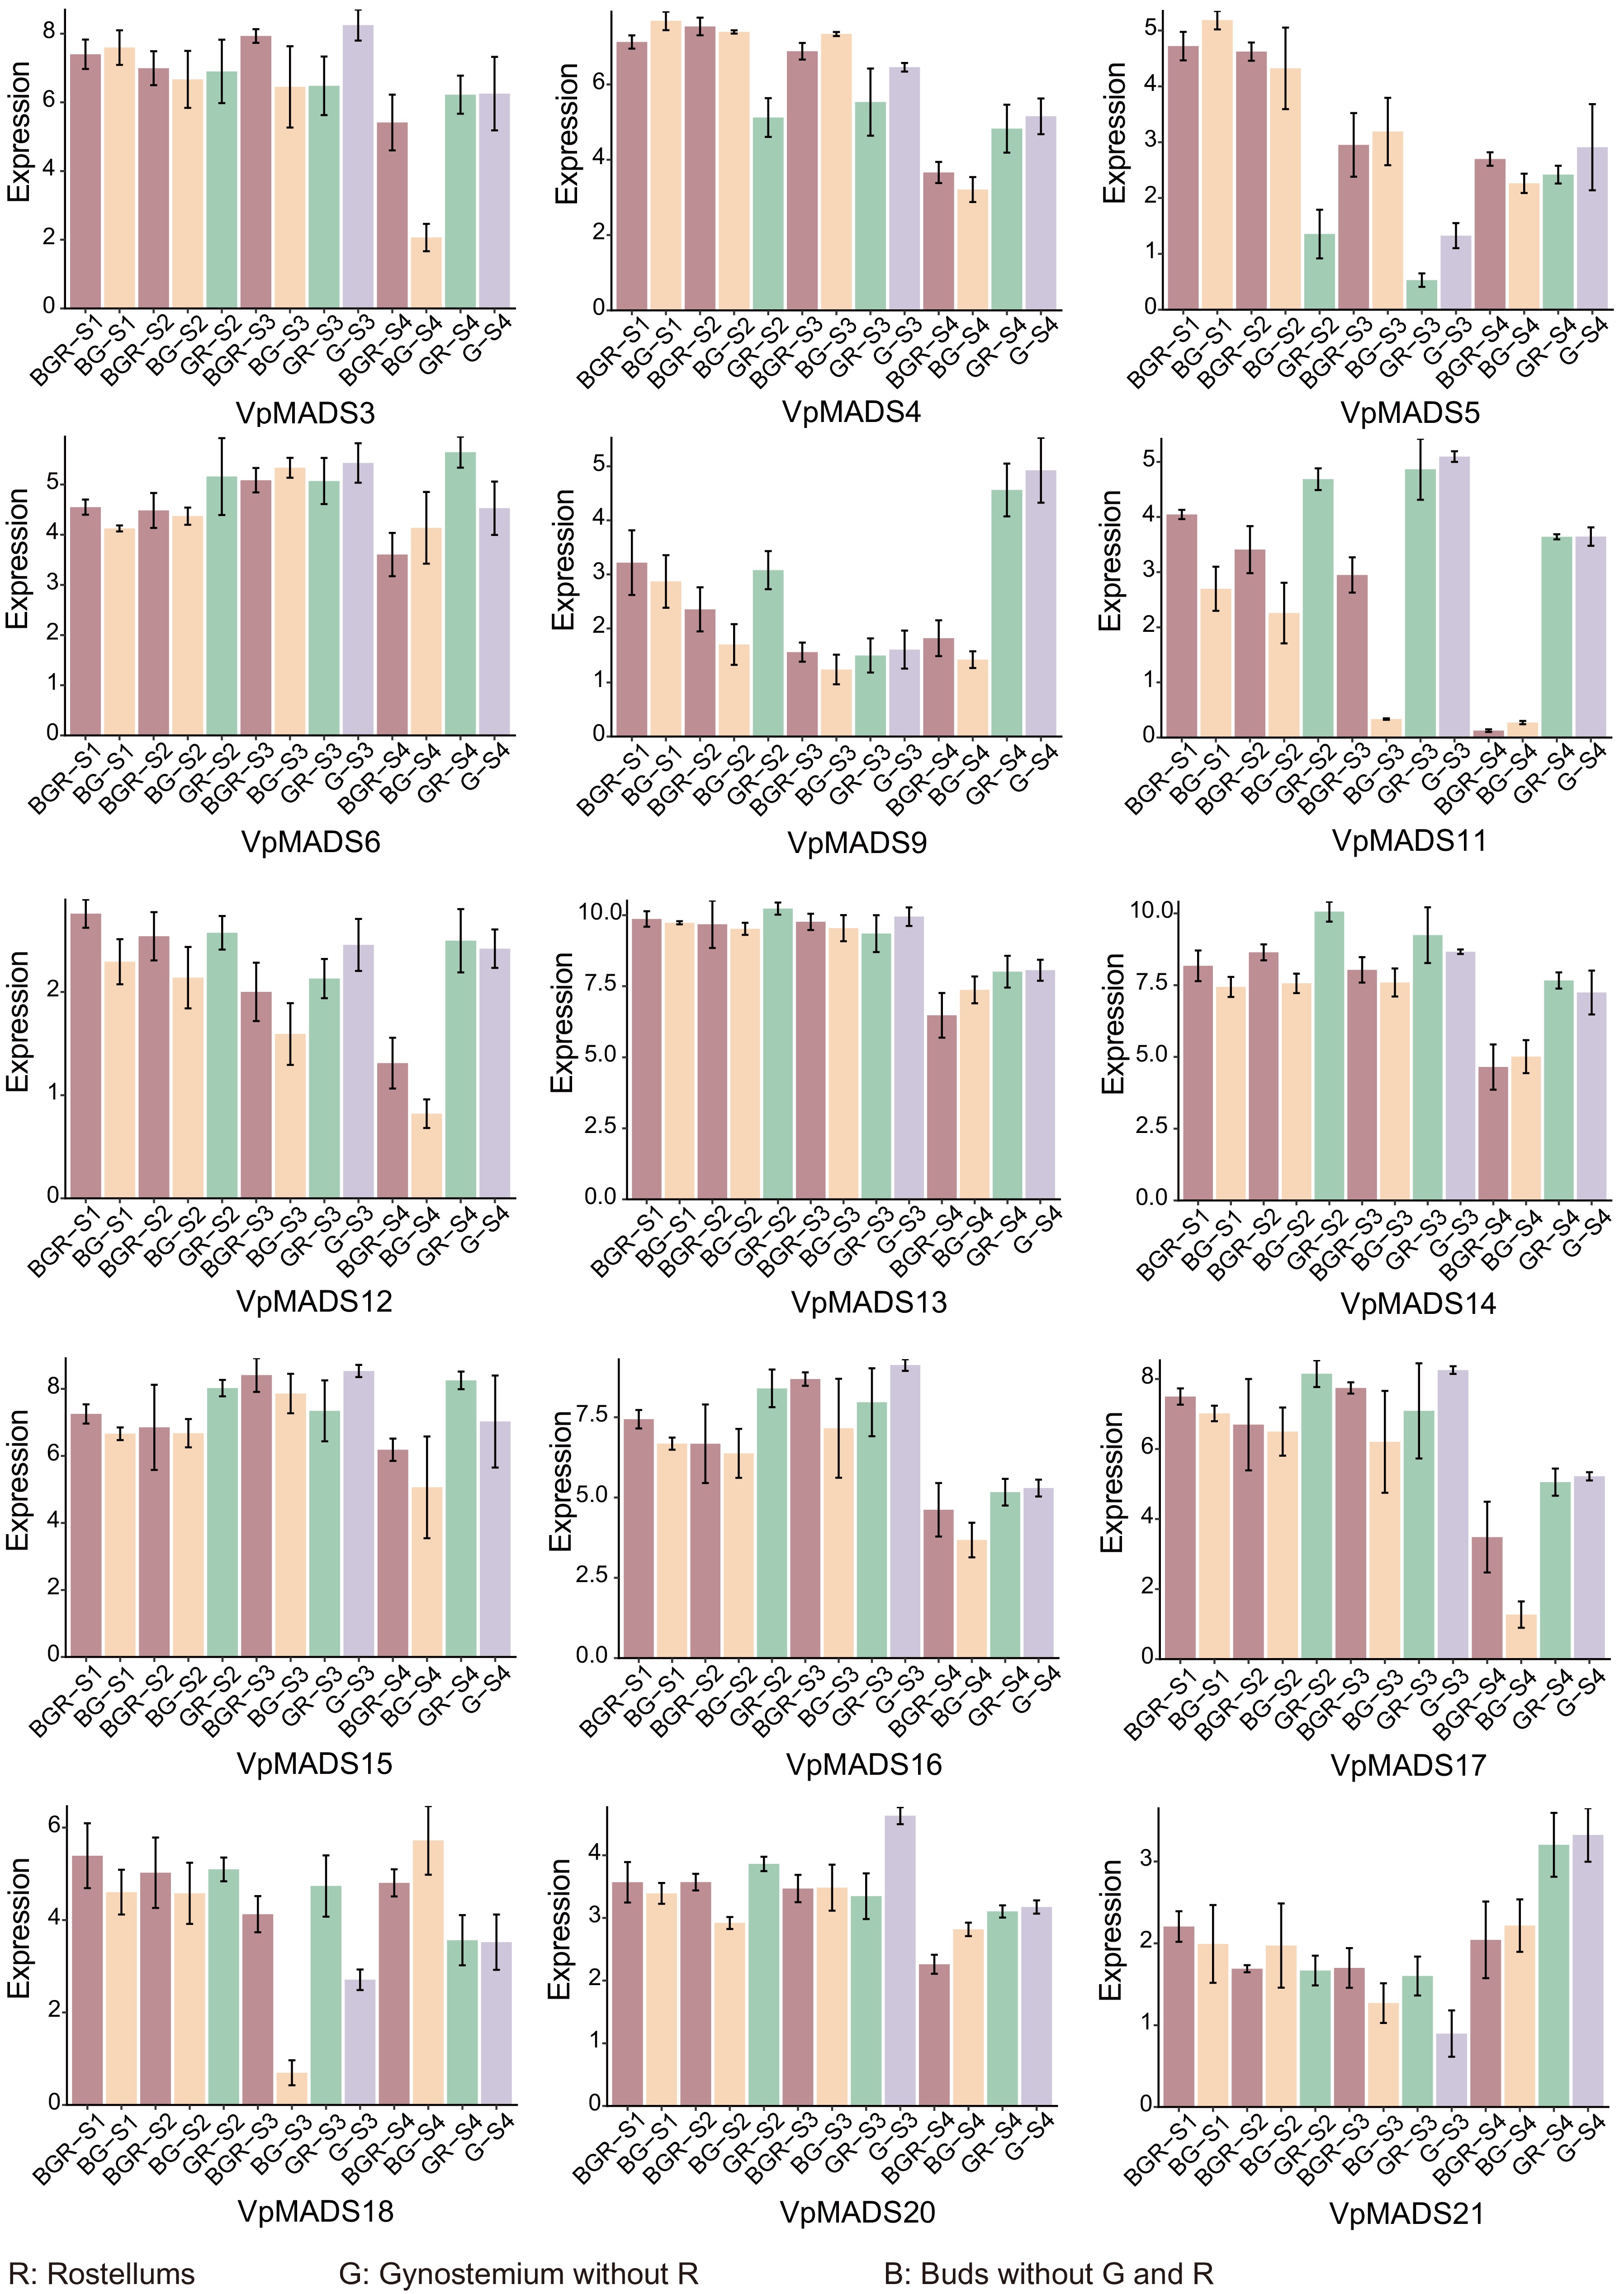
Figure 6.
The expression profiles of VpMADSs from RNA-seq data. The X-axis represented tissues including R (rostellum), G (gynostemiums without rostellums), and B (buds without gynostemium and rostellum). S1−S4 refer to the four stages displayed in Fig. 5. The Y-axis represented expression values after being standardized.
WGCNA and GO enrichment analysis
-
It is widely acknowledged that Weighted Gene Co-expression Network Analysis (WGCNA) can group genes into diverse modules in accordance with their co-expression relationships. On the basis of this, 11 modules were acquired and named black, brown, red, magenta, yellow, turquoise, blue, green, pink, purple, and gray respectively (Fig. 7). In total, there were seven modules that encompassed VpMADSs. Specifically, two members were included in the brown module (VpMADS1, VpMADS13), three in the yellow module (VpMADS7, VpMADS8, VpMADS9), four in the turquoise module (VpMADS5, VpMADS12, VpMADS14, VpMADS22), four in the blue module (VpMADS2, VpMADS3, VpMADS4, VpMADS20), two in the green module (VpMADS6, VpMADS18), one in the pink module (VpMADS15), and three in the purple module (VpMADS11, VpMADS16, VpMADS17) (Supplementary Table S3). As illustrated in Fig. 7, the correlations between the modules and traits were also presented. Among the seven modules containing VpMADSs, the majority, namely purple, pink, green, blue, yellow, and brown, demonstrated a significantly positive correlation with GR or G tissues.
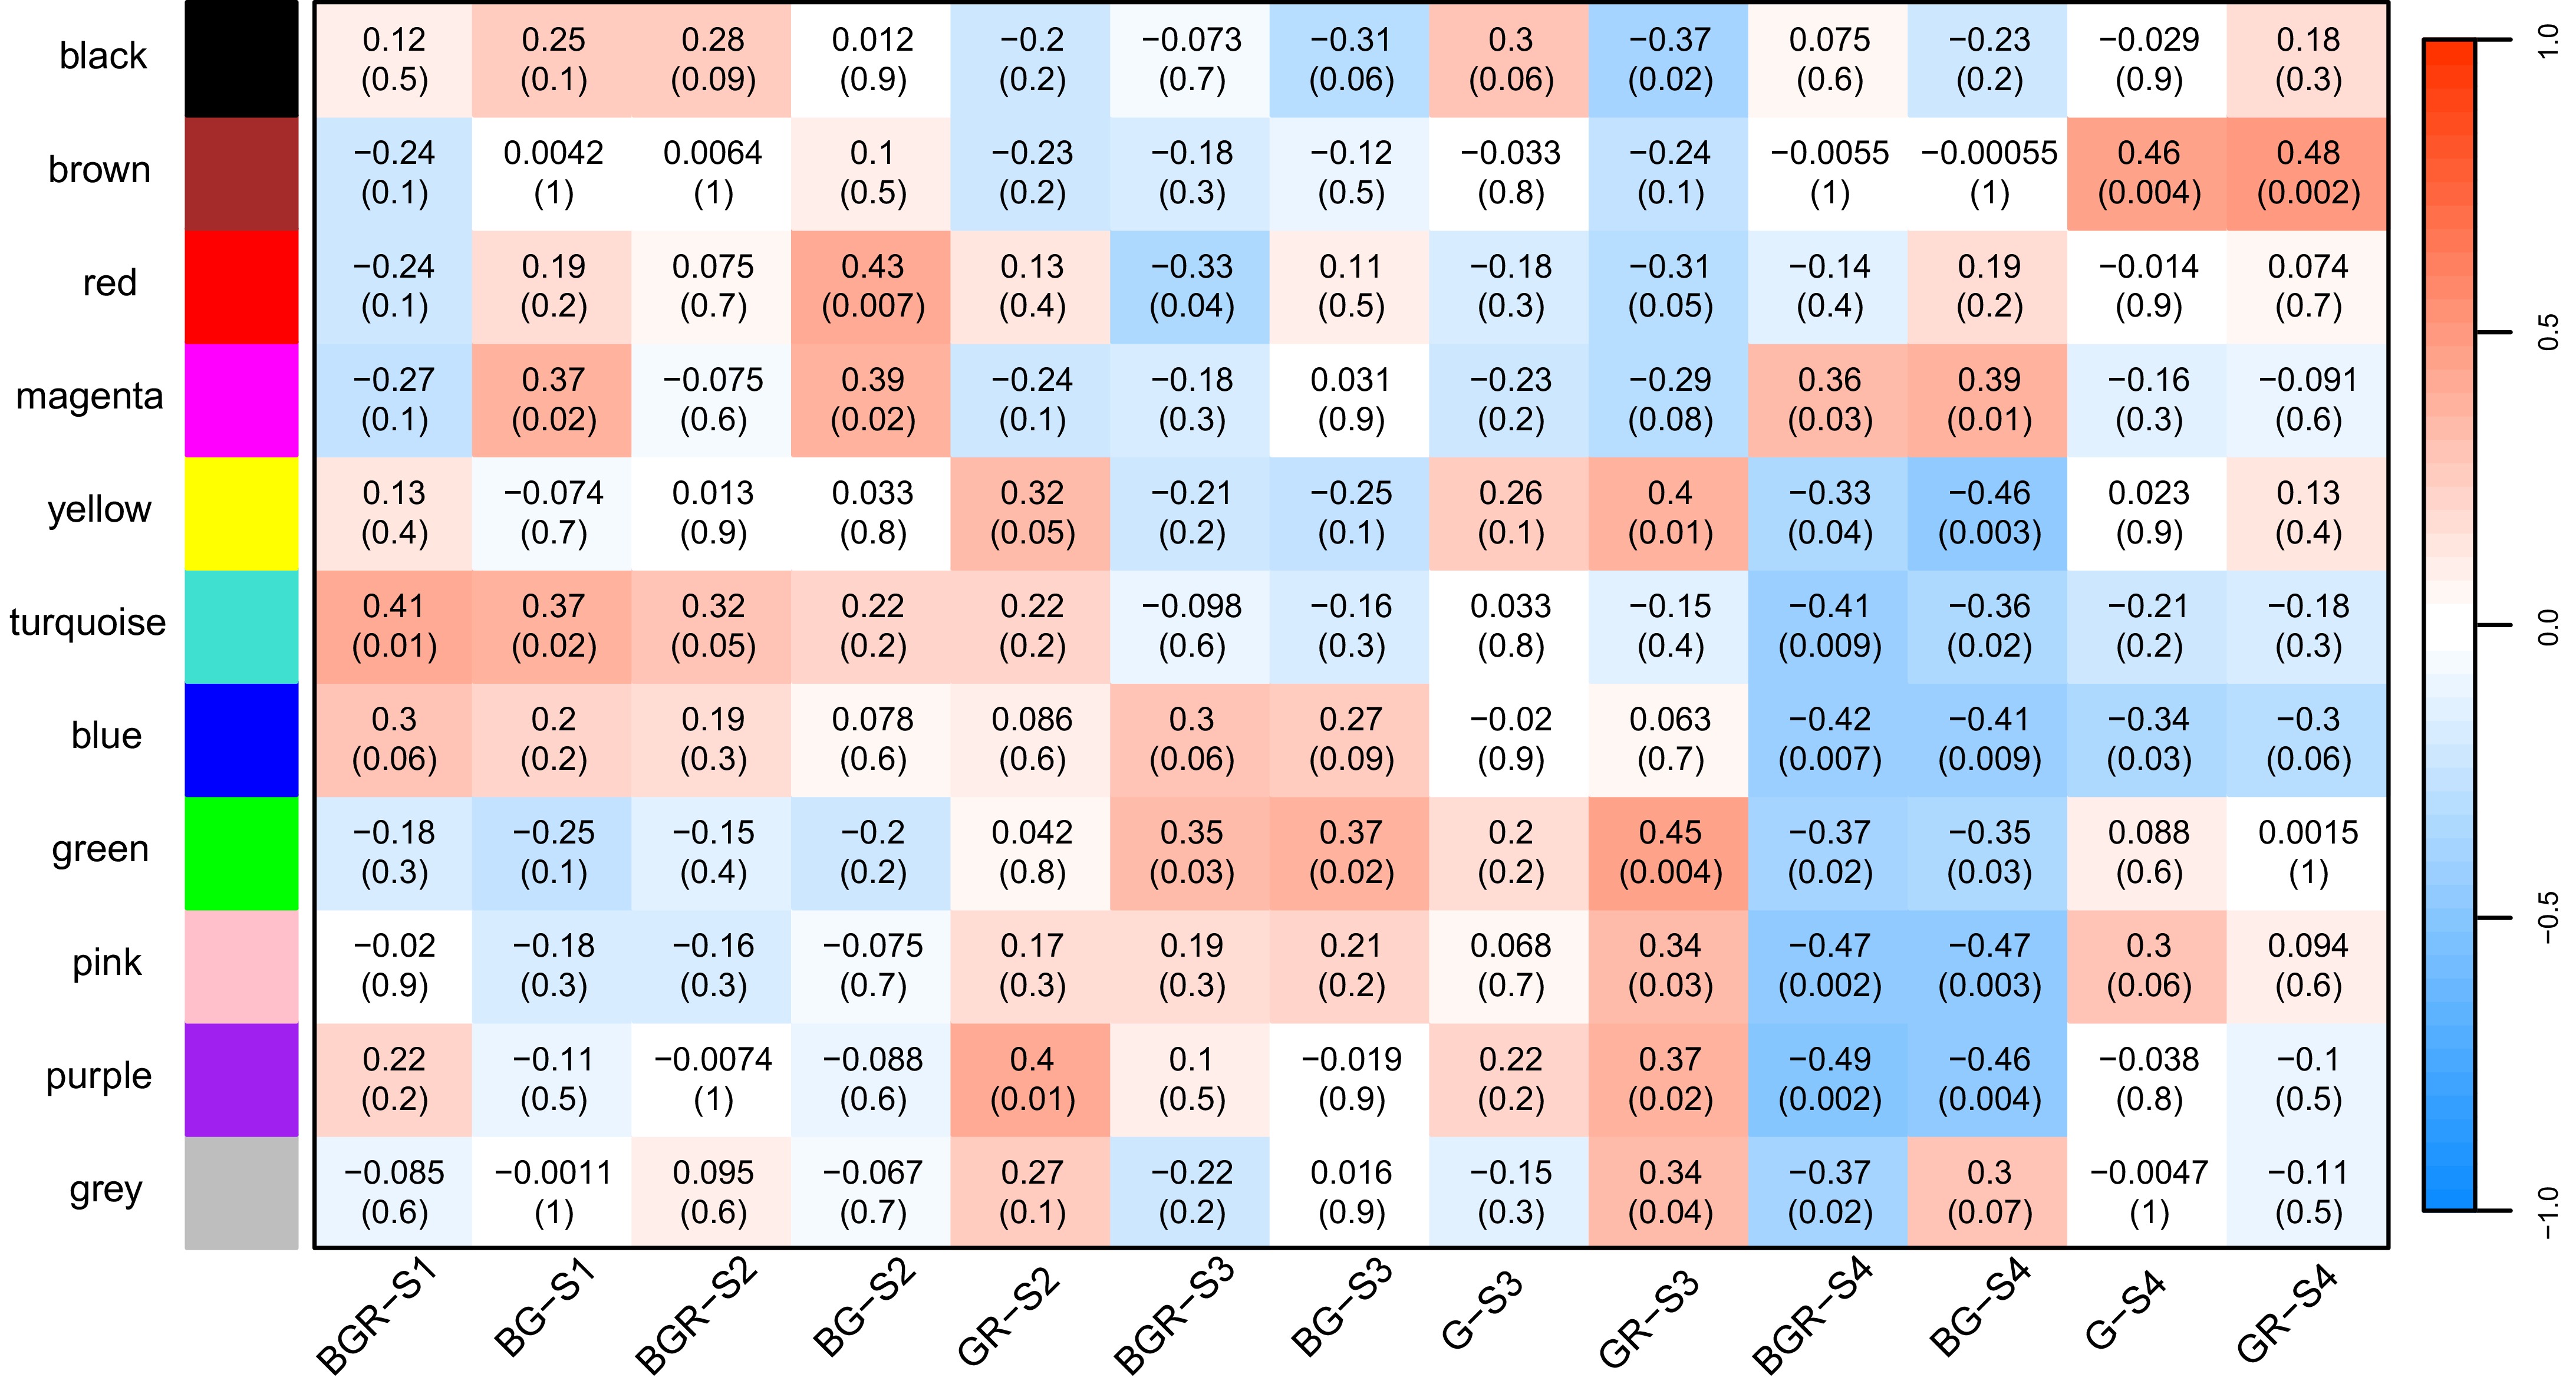
Figure 7.
The correlations between gene modules and tissues from WGCNA results. Each gene module was assigned a particular color. Greater than zero was a positive correlation, and less than zero was a negative correlation. The values in the module represent the magnitude of the correlation, and the values in parentheses denote the p-value.
Gene ontology (GO) analysis was performed for the modules (yellow, brown, grey, blue, green, purple, and turquoise) containing VpMADSs. For each module, except for the purple and gray modules in which fewer than 20 GO terms were enriched, the top 20 GO terms were presented (Fig. 8). Seven modules were enriched with GO terms related to cell differentiation, cell division, development, growth, auxin response, and others. These terms were associated with the growth and development of shoots, meristems, cells, and flowers (Fig. 8).
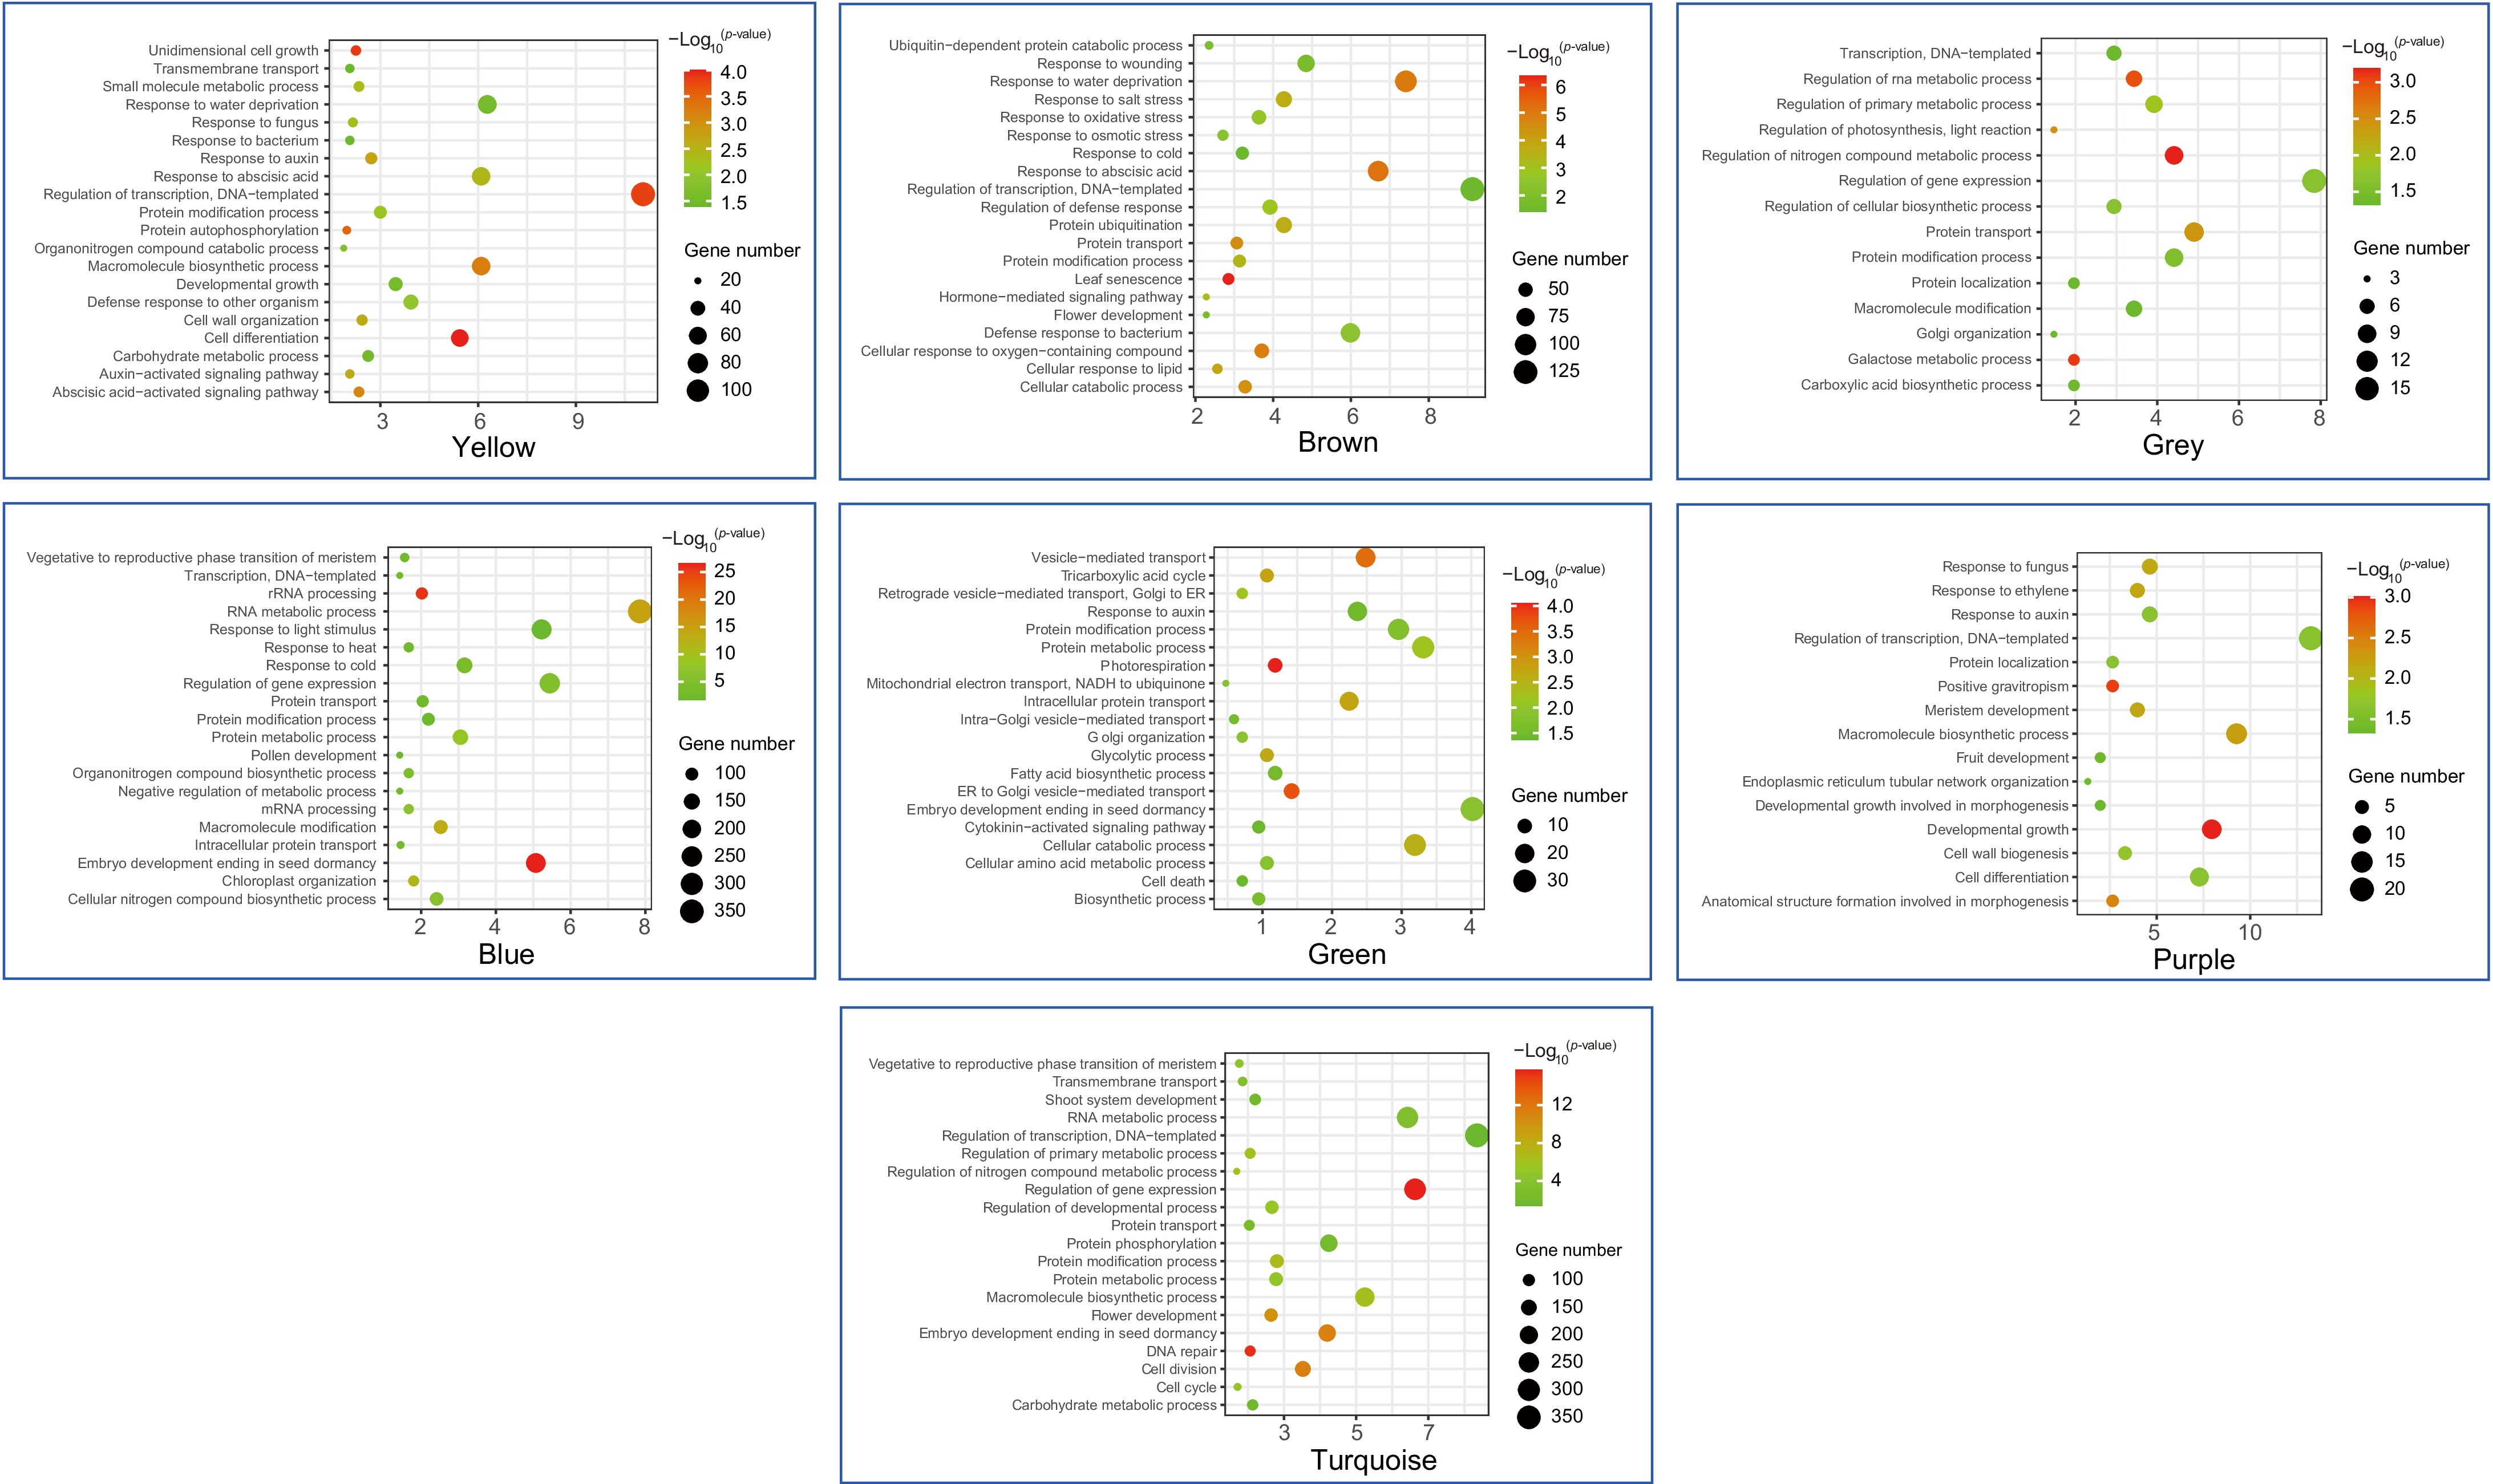
Figure 8.
The GO enrichment analysis of seven modules containing VpMADSs. Yellow, brown, grey, blue, green, purple, and turquoise meant different modules in WGCNA analysis.
qRT-PCR analysis
-
To further ensure the accuracy of the results, we repeated the sample collection using the same sampling method and performed real-time quantitative PCR (qRT-PCR) validation on nine out of the 15 VpMADS genes screened by RNA-seq and conducted a correlation analysis between the expression results of RNA-seq and qRT-PCR (Fig. 9; Supplementary Table S4). The results showed a high positive correlation between the two methods for these nine genes, with an R-value of 0.8075.
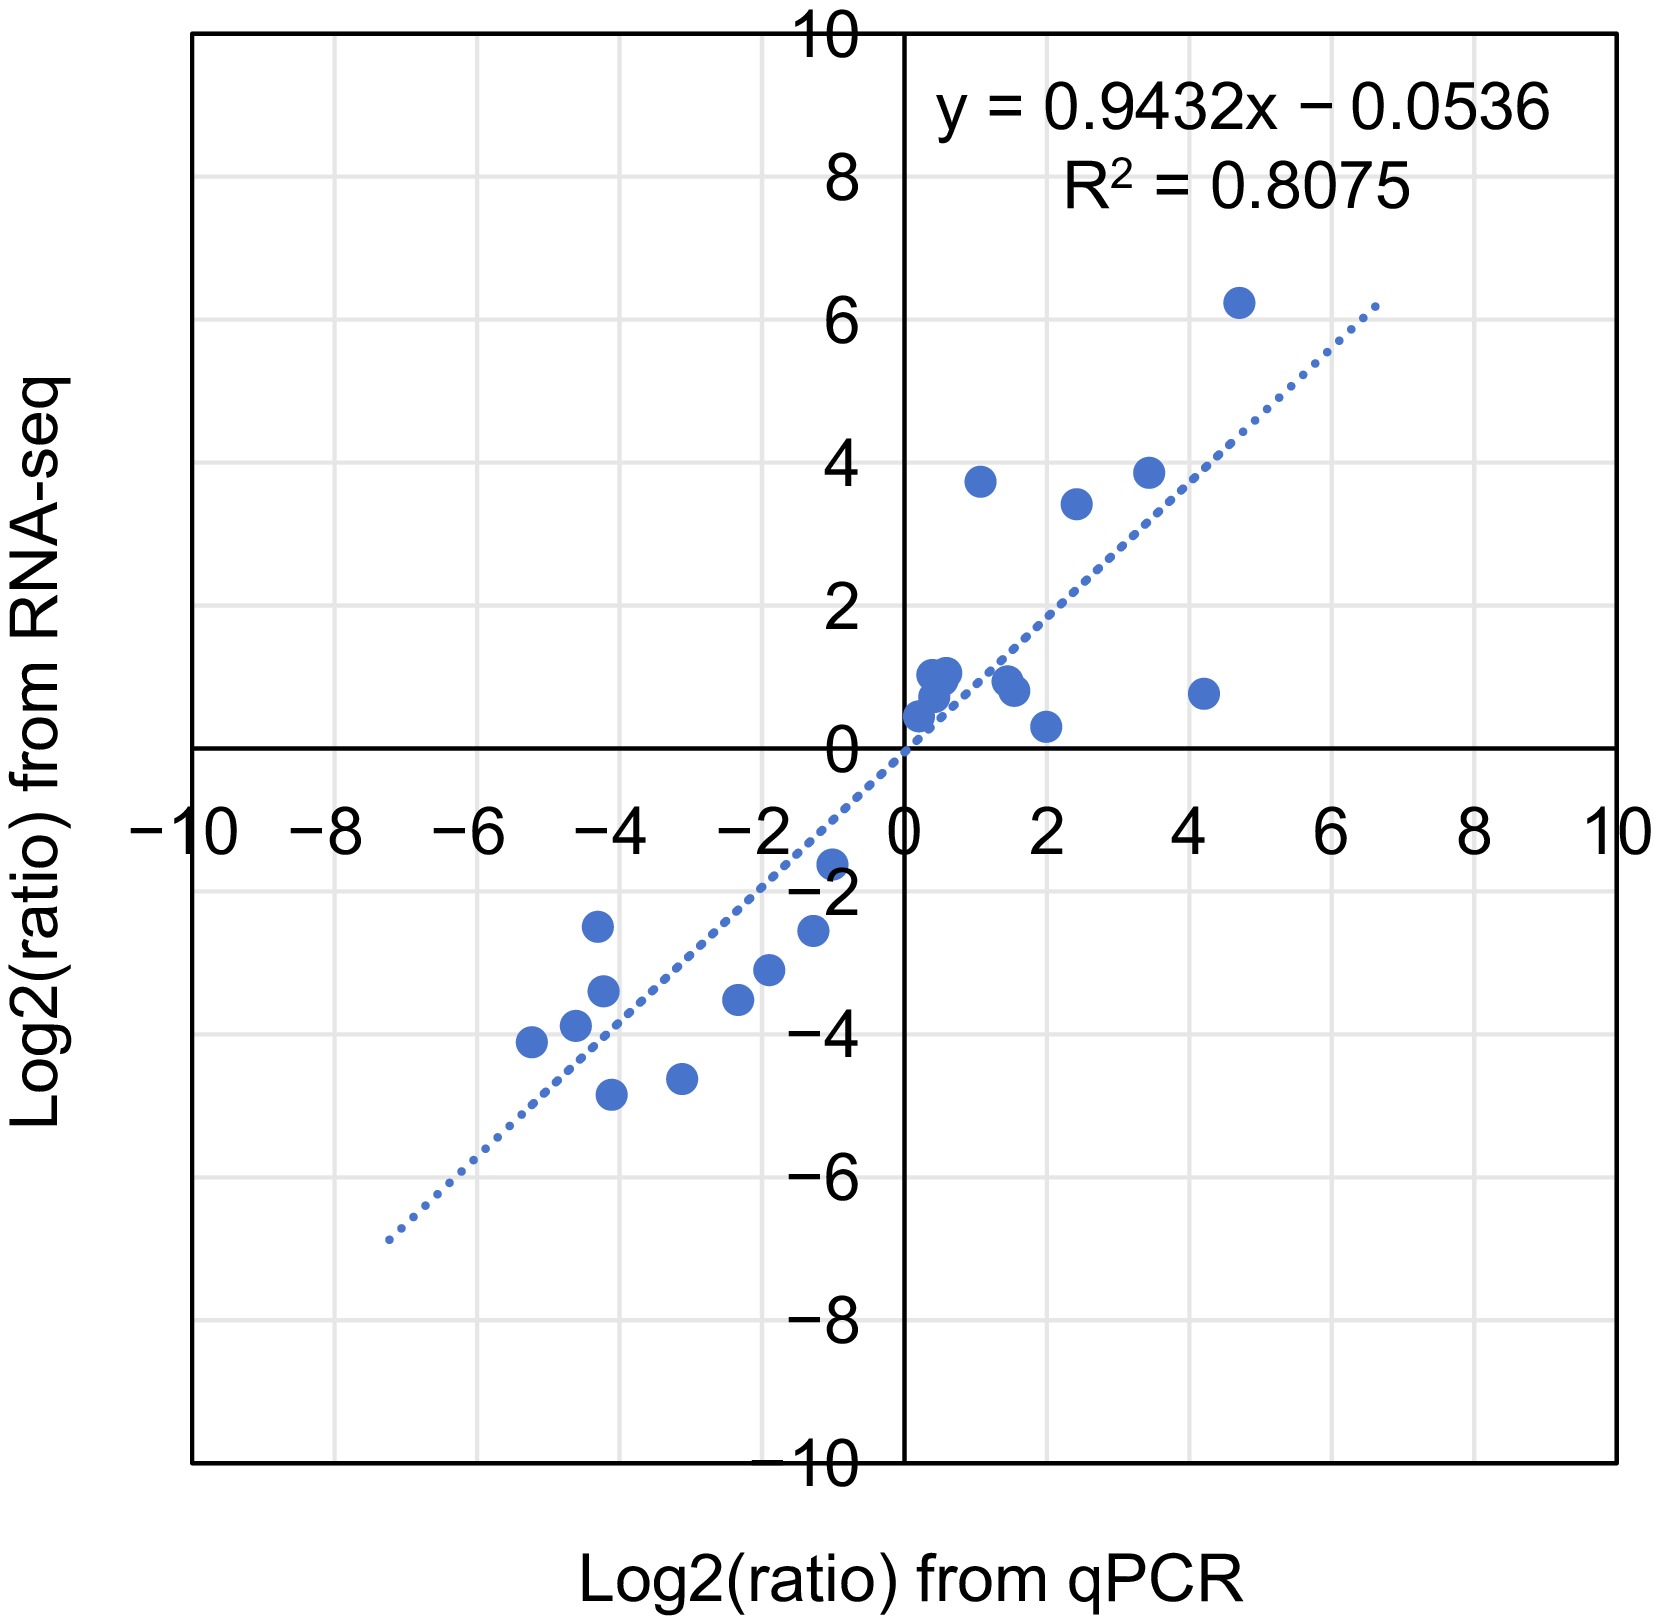
Figure 9.
Coefficient analysis of fold change data between qPCR and RNA-seq.
As shown in Fig. 10, the expression intensity of the two genes VpMADS4 and VpMADS5 are significantly higher in the early stages S1 and S2 than in stages S3 and S4, and they tend to be more strongly expressed in buds outside the GR or G. Both genes exhibit a significant decrease in expression intensity at stages S2 and S3, but their expression values increase at stage S4, particularly notably in the G or GR, and this trend is highly consistent with the profile of RNA-seq. For VpMADS9, its expression intensity in GR and R at stage S4 increases significantly, which is consistent with the results of RNA-seq. The expression intensity of VpMADS9, VpMADS11, and VpMADS13 in G may be lower than that in GR, indicating a decrease in their expression intensity after removing R. VpMADS15 is mainly expressed in GR and G at the S4 stage. The expression of VpMADS16 and VpMADS17 decreases significantly at the S4 stage.
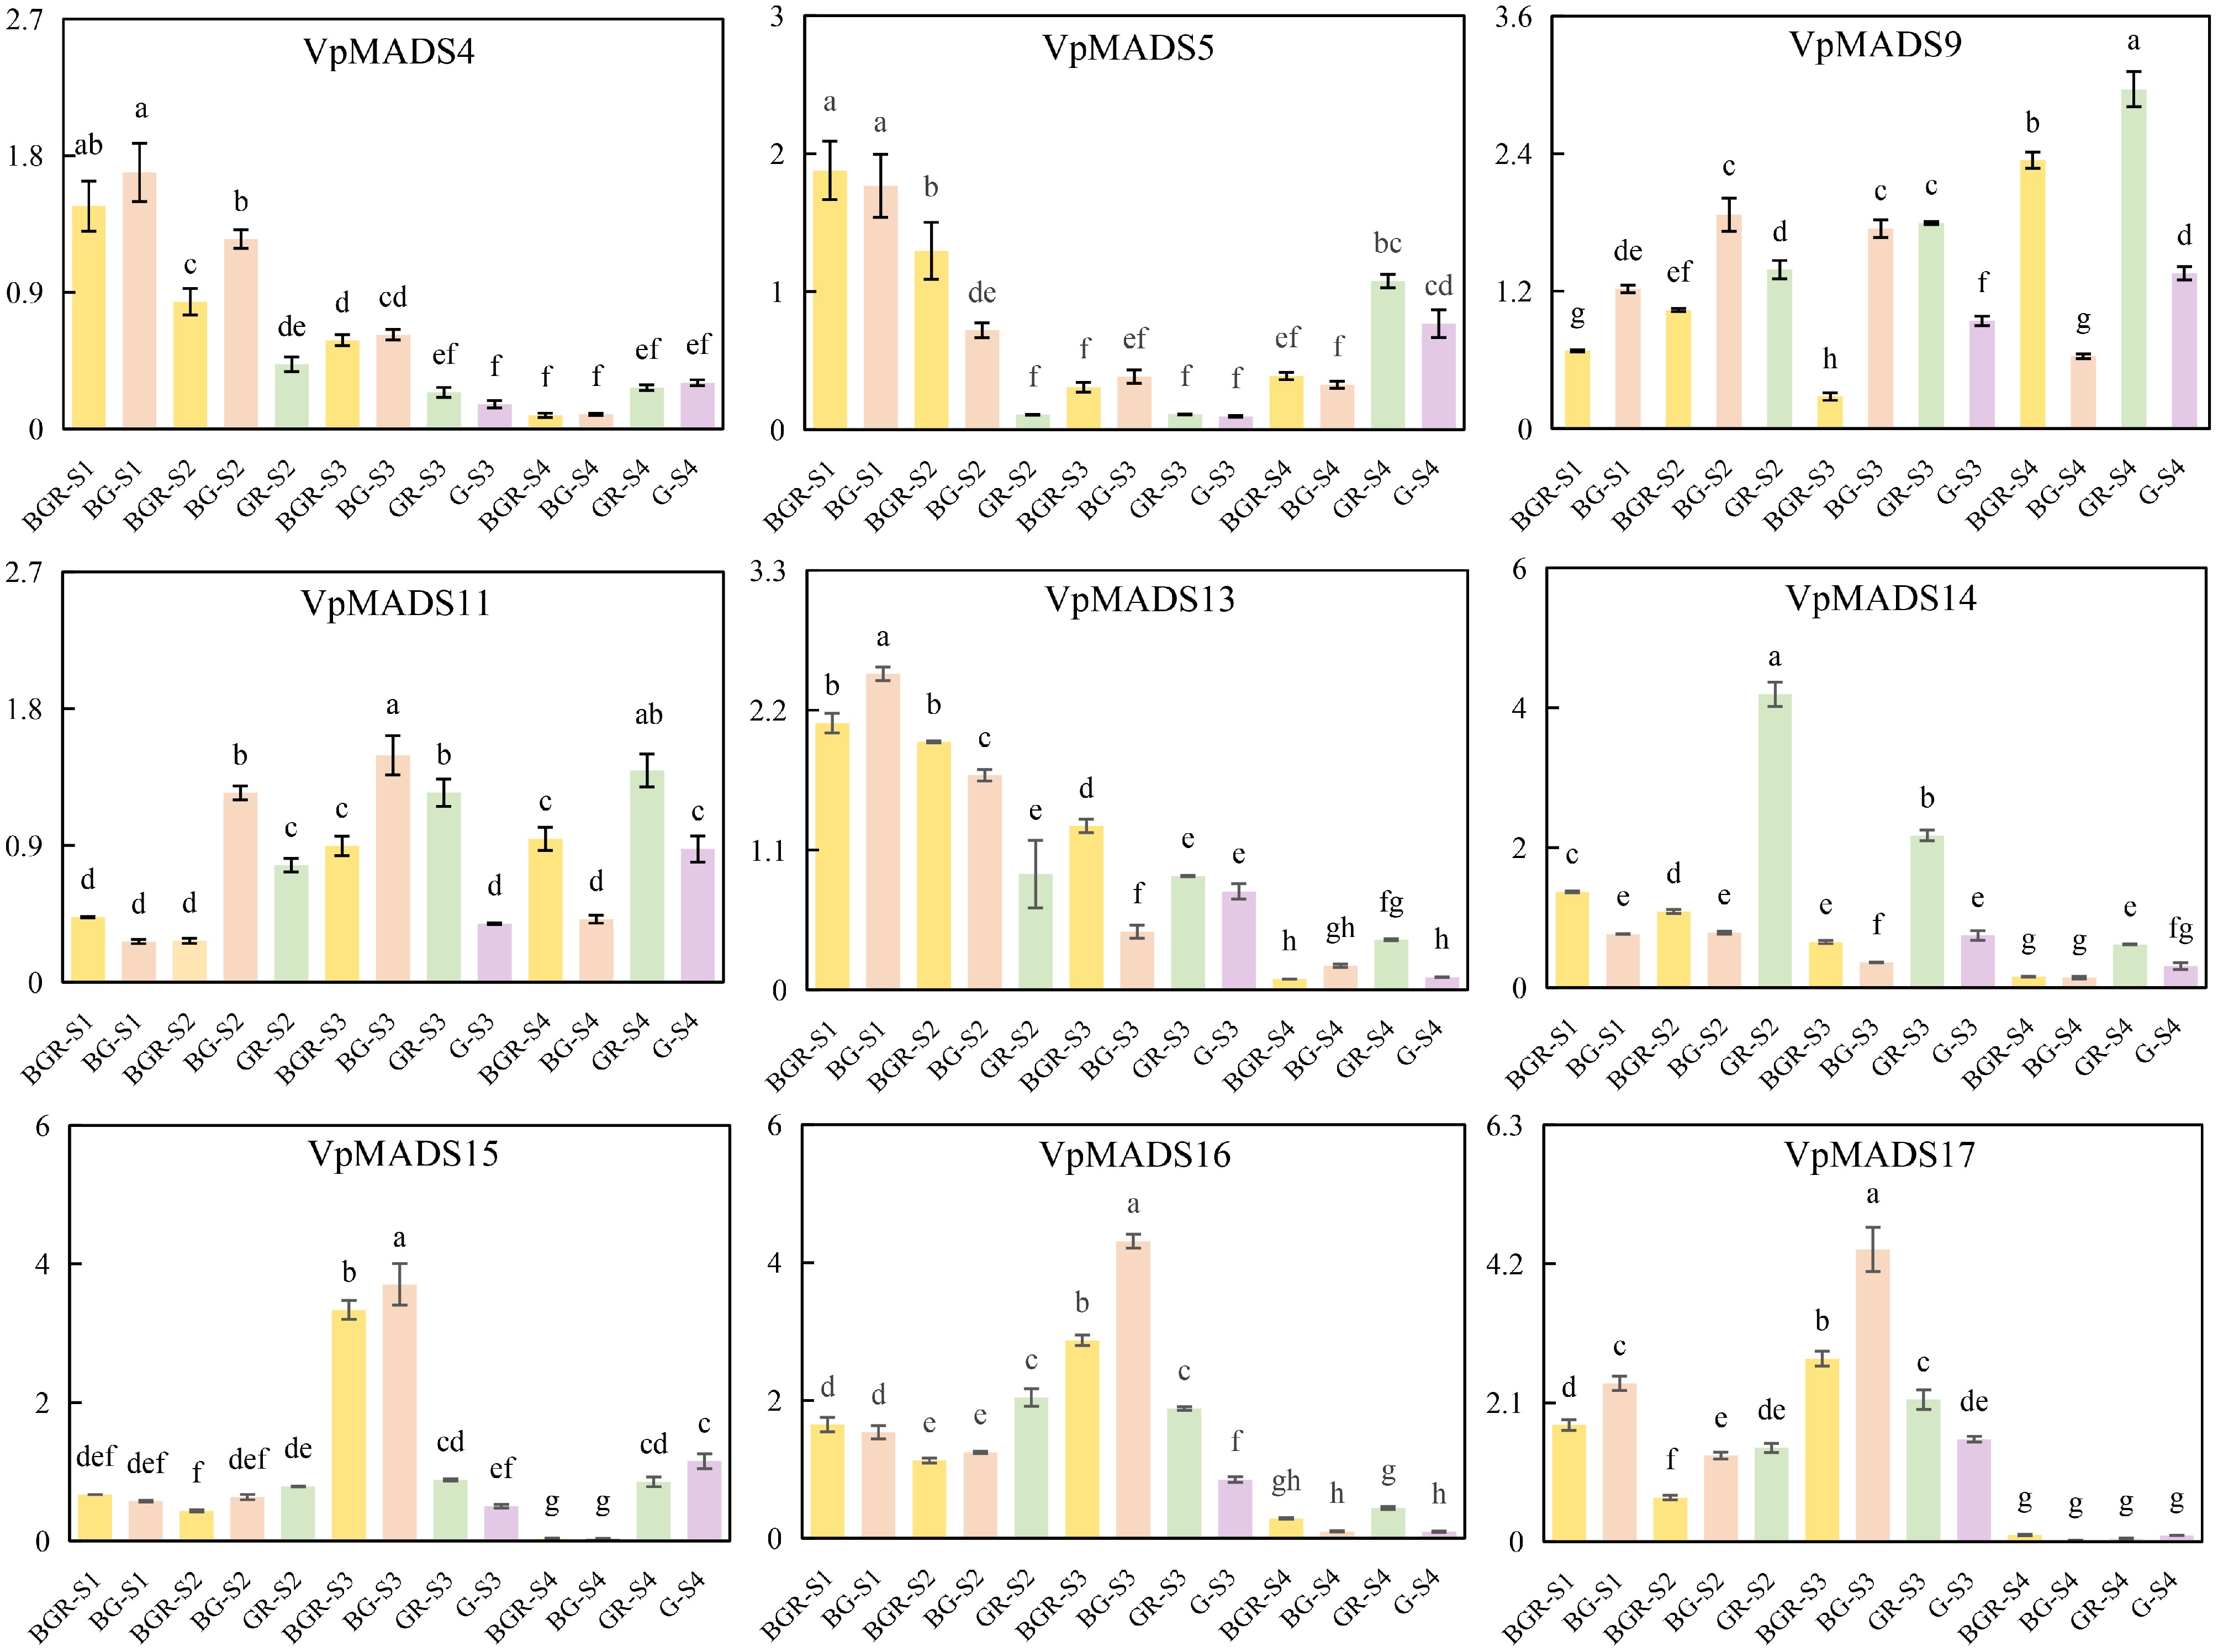
Figure 10.
The expression profiles of qRT-PCR results.
-
V. planifolia, akin to the vast majority of orchid plants, exhibits a comparable pollination mechanism. It relies on fragrant pollen to attract bees or butterflies. This explains why some introduced orchid plants encounter challenges in natural pollination when local natural pollination conditions are lacking[46,47]. As a result, investigating the genetic formation mechanism of the rostellum in orchid plants to resolve pollination issues represents a significant scientific leap. MADS-box genes are intricately linked to flower development. Their diverse combination mechanisms are likely the key determinant in the formation of different flower organs in plants. It has been documented that the MADS-box gene family participates in the formation of styles. The rostellum develops on the gynostemium, and its growth and development show a high level of temporal and spatial synchronization with the gynostemium. Hence, we postulate that VpMADSs might also play a pivotal role in the growth and development of the rostellum in V. planifolia.
Phylogenetic analysis revealed a relatively close phylogenetic relationship among VpMADSs and AtMADSs, which was consistent with previous studies on orchid plants[22,48,49]. Eight groups possessed homologous genes in V. planifolia when compared with A. thaliana (Fig. 3). Given that both V. planifolia and O. sativa are monocotyledonous plants, they share certain characteristics of the MADS-box gene family typical of monocotyledonous plants. For instance, neither of them contains any FLC-like homologous genes (Fig. 3). Additionally, two VpMADS genes and three OsMADS genes were clustered into a single subgroup (termed the 'unique group'), suggesting that they might possess some unique functions distinct from those of other monocotyledonous plants (Fig. 3). Moreover, not every monocotyledonous plant has MADS-box genes in each subgroup. It was observed that VpMADS10 belongs to the GOA-like group, yet there are no homologous genes in O. sativa. Simultaneously, two OsMADSs (LOC_Os08g020701 and LOC_Os12g105201) are in the XAL1-like group, while no corresponding genes are present in V. planifolia (Fig. 3).
MIKCC-type genes, being key genes, actively participate in plant flower development and serve as major constituents of the 'ABCDE' model. In this study, our focus was on the MIKCC-type MADS-box genes in V. planifolia. According to the 'ABCDE' model, MADS-box genes are widely implicated in the formation of flower organs. The functions of MADS-box genes in A. thaliana have been elucidated, whereas numerous unknown functions are still being uncovered in other monocotyledonous plants. Since the gynostemium is formed through the metamorphosis of the pistil stigma, it might also be involved in the development of the rostellum. The SQUA-like subgroup encompasses two VpMADS genes (VpMADS11 and VpMAMS12) (Fig. 3). One of them (VpMADS11) is clustered into the purple module, and the other (VpMADS12) is clustered into the turquoise module (Fig. 8). These two genes might play a crucial role in the formation of the gynostemium in V. planifolia, as they not only exhibit a significantly high expression in G or GR (Fig. 6) but also the modules in which they are located are highly positively correlated with G or GR (Fig. 8). Moreover, many GO terms related to flower development are also enriched in both modules (Figs 8, 9). Additionally, it has been reported that AG-like genes are involved in the regulation of gynoecium and ovule development[22,50]. This research also indicates that AG-like genes VpMADS6/7/8 are significantly highly expressed in G or GR tissues (Fig. 6). The yellow module, which contains VpMADS7 and VpMADS8, enriches several types of GO terms including auxin, cell differentiation, and developmental growth (Figs 8, 9). Meanwhile, the results of WGCNA analysis also suggest that the yellow module might be positively correlated with the growth and development of GR in V. planifolia (Fig. 9).
This study also introduced a novel sampling approach. The strategy of retention and exclusion might prove to be an effective means for samples that are challenging to collect. The limited number of flowers and the diminutive size of rostellum in V. planifolia pose difficulties in obtaining sufficient samples for RNA-seq sequencing, particularly during the early flower bud stages. Consequently, we aimed to ascertain whether the expression of a specific organ was modified by manipulating the gynoecium to either remove or retain the rostellum and by manipulating the flower bud to remove or retain certain parts. Through this, we could deduce the role of a gene in a particular organ. It was evident from the expression profiles obtained using this method that it was effective to a certain degree. Since the BG tissue represents the remaining portion of BGR after the removal of the gynoecium, the expression profiles of some VpMADSs in BGR were notably higher than in BG, implying that these genes might be highly expressed in the gynoecium (Fig. 6). In reality, most of these genes under such circumstances were precisely highly expressed in either G or GR tissues (VpMADS7/8/11/17/22), suggesting that these genes might exhibit G- or GR-specific expression (Fig. 6).
The expression profiles of qRT-PCR further validated the results of RNA-seq, and overall, the expression trends of RNA-seq were similar to those of qRT-PCR. VpMADS genes may play different roles at different stages. For example, VpMADS5 may play a role in the development of G or GR at the S4 stage. VpMADS9 and VpMADS14 may play key roles in the development of R, as they are not only highly expressed in GR but also show a significant decrease in expression in G after removing R. VpMADS13, VpMADS16, and VpMADS17 may primarily function in G or GR from S1 to S3, with their roles decreasing at the S4 stage. VpMADS9 and VpMADS11 may play key roles in R development, as they are highly expressed in GR across multiple stages and show a significant decrease in expression in G after removing R.
In general, the expression levels of VpMADSs exhibited a gradual decline from S1 to S4 (Fig. 6). This phenomenon might be attributed to the fact that the MADS-box is a crucial gene family in flower development and plays a significant role in the formation of flower organs[51,52]. Consequently, the expression of VpMADSs diminishes as the flowers progress towards maturity. Conversely, certain VpMADSs, such as VpMADS9/10/21, displayed an increasing expression at elevated levels during the S4 stage (Fig. 6). Additionally, we hypothesized that the regulatory mechanism of VpMADSs on the rostellum and gynoecium might not be different. Moreover, based on the similar expression profiles of many VpMADSs in G and GR tissues, it can be inferred that the development of the rostellum and gynoecium might occur concurrently (Fig. 6).
-
In this research, a comprehensive and in-depth analysis of the MADS-box gene family in V. planifolia was conducted. This encompassed whole genome-wide identification, gene characterization, gene structure dissection, conserved domain analysis, phylogenetic relationship reconstruction, gene duplication determination, and gene expression evaluation. A total of 47 VpMADS genes were successfully identified, with 22 of them falling into the MIKCC types, which could further be categorized into 10 subgroups. It was discovered that the expression profiles of VpMADSs exhibited significant disparities between the gynostemium and the bud-without-gynostemium. This strongly indicates that VpMADSs are likely to play a crucial and indispensable role in the development of the gynostemium and the rostellum. Moreover, the strategies of retaining and removing certain specific tissues could prove highly beneficial and instrumental in the functional study of tissues that are otherwise difficult to analyze. All of the aforementioned findings not only offer novel and valuable insights into the MADS-box gene family in V. planifolia but also propose potential functions of the VpMADS genes in relation to rostellum development, thereby laying a solid foundation for further research and understanding in this field.
This research was funded by the Hainan Provincial Natural Science Foundation of China (321QN326), Hainan Provincial Natural Science Foundation of China (321QN328), and the Hainan Province Science and Technology Special Fund (ZDYF2022XDNY268).
-
The authors confirm contribution to the paper as follows: conceptualization, methodology, software, formal analysis: Li J; investigation, resources, writing—review and editing: Su F, Yan L, Xing Y; writing—original draft: Su F, Li J. All authors reviewed the results and approved the final version of the manuscript.
-
The RNA-seq sequencing data is available in the NCBI database via accession number PRJNA985237.
-
The authors declare that they have no conflict of interest.
-
# Authors contributed equally: Fan Su, Lin Yan
- Supplementary Table S1 The primers of qRT-PCR.
- Supplementary Table S2 All duplications among V. planifolia genome.
- Supplementary Table S3 All modules containing VpMADS genes.
- Supplementary Table S4 The qRT-PCR expression values of 9 VpMADS genes.
- Supplementary Fig. S1 Selection pressure of duplications.
- Copyright: © 2025 by the author(s). Published by Maximum Academic Press, Fayetteville, GA. This article is an open access article distributed under Creative Commons Attribution License (CC BY 4.0), visit https://creativecommons.org/licenses/by/4.0/.
-
About this article
Cite this article
Su F, Yan L, Xing Y, Li J. 2025. Genome-wide identification of the MIKCC-type genes in Vanilla planifolia and expression studies in the development of the rostellum. Beverage Plant Research 5: e021 doi: 10.48130/bpr-0025-0026 

Genome-wide identification of the MIKCC-type genes in Vanilla planifolia and expression studies in the development of the rostellum
- Received: 29 October 2024
- Revised: 05 June 2025
- Accepted: 09 June 2025
- Published online: 23 July 2025
Abstract: Vanilla planifolia, a highly valued spice in the beverage, food, and cosmetics industries, is faced with a significant challenge. Its unique flower structure restricts natural pollination and impedes industrial progress. MADS-box transcription factors are essential in multiple biological processes, especially in the formation of flower organ structures. In response, we launched investigations to identify the MADS-box gene family in V. planifolia and explored their functions in the development of the gynostemium and rostellum. Through genome-wide screening, 47 VpMADS genes were identified, with 22 members classified into the MIKCC subgroup. Based on genomic data, we analyzed the locations, structures, and conserved motifs of the genes. All MIKCC-type genes were grouped into 10 phylogenetic clusters. Gene duplication analysis revealed that segmental duplications were the main driver of MADS-box gene expansion in V. planifolia. Samples were collected and underwent RNA-seq to identify differentially expressed genes. qRT-PCR was also used to validate differentially expressed genes. Weighted gene co-expression network analysis (WGCNA), and Gene Ontology (GO) enrichment analysis were conducted to study co-expressed genes related to MADS-box genes in the gynostemium. Overall, this study provides fundamental insights into the MADS-box gene family in V. planifolia, serving as a vital reference for future research on the development of the gynostemium and rostellum in this plant.
-
Key words:
- MADS-box gene family /
- Vanilla planifolia /
- Genome-wide identification /
- Gynostemium /
- Rostellum /
- RNA-sequencing /
- qRT-PCR