


-
According to the World Health Organization (WHO), nearly 1.3 million people die and 50 million are injured in preventable traffic crashes globally each year, and traffic accidents are the leading cause of death for children and young people[1]. WHO also reported that the number of traffic accident casualties in China in 2019 was estimated at 250,272, ranking first in the world. Two important issues related to traffic safety are accident frequency and accident severity; this paper focuses on the latter. Traffic accident severity is subject to various factors that are related to demographics (age and gender), vehicles (mode of travel, vehicle type, and vehicle condition), roadways (road class and road type), the environment (weather and lighting conditions), and accidents (accident time, cause, and type), etc. Therefore, the ability to predict traffic fatalities accurately and analyze their causes in detail is critical to reducing the severity of traffic accidents.
Numerous studies have been conducted to predict the risk or severity of traffic accidents, with the prediction results interpreted using statistical models[2]. Due to the unobserved heterogeneity in traffic accident data (such as driver traits, accident-specific attributes, etc.) and the fact that accident severity is an ordinal variable, random parameter and ordered discrete choice models, as well as their variants, have been shown to have a wide range of applicability. Such models include the random-parameter ordered logit model[3], hierarchical Bayesian random-intercept logit model[4], random-parameter logit models with unobserved heterogeneity in means and variances[5,6], random-parameter generalized ordered probit model with heterogeneity in means[7], correlated random-parameter bivariate tobit model[8], binary scobit model[9], random-thresholds random-parameters hierarchical ordered probit model[10], conditional autoregressive Poisson-lognormal model[11], etc. Considering that no-injury accidents may be subject to two underlying injury severity levels, Fountas & Anastasopoulos[12] proposed a zero-inflated hierarchical ordered probit model with correlated disturbances to explore contributing factors and their effects on single-vehicle accident severity. Ahmed et al.[8] collected multi-year segment-specific freeway crash data before and after a speed limit increase, selected various explanatory variables such as road traffic flow characteristics, geometric characteristics, and road surface, and investigated the impacts of the speed limit increase on injury and non-injury crash rates using a correlated random-parameter bivariate tobit model. Munira et al.[11] proposed a multivariate spatial (conditional autoregressive) Poisson-lognormal model to explore the effects of contributing factors, which included traffic characteristics, roadway geometry, built environment characteristics, and pedestrian exposure volume on pedestrian crash severity (fatal injuries, disabling injuries, and non-disabling injuries) at signalized intersections in the Austin, Texas (USA) area.
Traditional statistical models for traffic accident data have simple structures, require less computation, and are easy to interpret. However, their learning capabilities are weak, leading to lower prediction accuracy. For example, Iranitalab & Khattak[13] showed that a multinomial model was the weakest in a comparison of four statistical and machine learning methods for accident severity prediction. In recent years, machine learning algorithms for traffic accident prediction and causal analysis have gained increasing attention, offering the advantage of capturing the association between accident severity and contributing factors more efficiently and accurately than statistical models, thereby significantly improving prediction accuracy. Common machine learning algorithms include Bayesian networks[14], support vector machines[15], artificial neural networks (ANNs), and deep neural networks[16,17], etc. Traffic accident data generally include numerous categorical features, and thus, an association rule algorithm is an appropriate choice. Cai[18] collected traffic accident data from a city in northern China from January to September 2018, mined multi-dimensional rules using an improved association rule algorithm, and revealed the interaction effects of different features as well as their influence on accident type and severity. With an increased focus on efficient algorithm performance in large-scale machine learning methods, boosted learning is a method that has developed rapidly and offers the benefits of fast training and superior performance. Numerous researchers have applied boosting algorithms for traffic accident severity prediction and causal analysis. Commonly used algorithms include gradient boosting decision tree (GBDT)[19,20], XGBoost[21], LightGBM[22], etc.
Machine learning achieves high prediction accuracy due to its strong learning capability. However, as a black-box model, it lacks interpretability, making it difficult to analyze the effects of contributing factors. Interpretable machine learning has addressed this problem effectively and is now widely applied to interpret traffic accident severity. Commonly used algorithms include permutation feature importance[23], partial dependency plots[24,25], local interpretable model-agnostic explanation (LIME)[14,26], and Shapley additive explanation (SHAP)[27,28], etc. The SHAP algorithm is applied the most extensively due to its integration of global and local interpretation, its solid theoretical foundation, and its rich functions. Yang et al.[29] selected features related to population, road networks, and land use, and employed the XGBoost algorithm to classify three levels of crash severity of freight trucks, i.e., possible injury crash, evident injury crash, and fatal injury crash and analyzed the correlation between the features using the SHAP algorithm. Guo et al.[30] used the XGBoost algorithm to predict three types of accidents involving elderly pedestrians, i.e., property damage, injury, and fatal, with areas under the curve (AUCs) of 81%, 68%, and 74% respectively, and then employed the SHAP algorithm to interpret the impacts of the contributing factors. Kang & Khattak[17] used deep neural networks to predict crash severity and addressed interpretability using SHAP values.
In summary, although numerous studies on the prediction and interpretation of accident severity have been conducted, they have five primary shortcomings. First, earlier studies have been unable to balance prediction accuracy and interpretability. Specifically, statistical models have good interpretability but offer relatively low prediction accuracy, whereas studies that use machine learning algorithms usually pursue only high accuracy and ignore the analysis and interpretation. Both prediction accuracy and interpretability are crucial. High accuracy ensures that the model effectively captures the relationship between accident severity and influential factors, while interpretability allows humans to understand the learned rules. Second, traffic accident data usually contain many categorical features, and algorithms such as LightGBM, XGBoost, and ANN require manual preprocessing (e.g., one-hot encoding) for these features, which may lead to information loss or increased dimensionality. Therefore, they are not the most efficient or effective choices for this kind of data. Third, the number of fatal accidents in a dataset is usually very small, so the findings for fatalities often lack persuasiveness. Some studies have combined fatal accidents with injury accidents, which diminishes the emphasis on fatalities. Fourth, many studies have focused on specific scenarios (e.g., motorway), groups of people (e.g., elderly people), or modes of transport (e.g., large vehicles), leading to a lack of generalizability. Fifth, in some studies, each categorical feature contains relatively few feature values to facilitate modeling and interpretation, which is not conducive to obtaining high accuracy or comprehensive in-depth analysis. For example, the categorical feature 'time' is usually designated in terms of four seasons instead of each of the twelve months, and 'vehicle type' usually includes pedestrians, non-motor vehicles, and motor vehicles instead of bicycles, motorcycles, etc.
To address these shortcomings in the current literature, this paper proposes a framework for traffic accident severity (fatal/non-fatal) prediction and causal analysis based on CatBoost and SHAP. CatBoost efficiently handles datasets with many categorical features, making it well-suited for classification tasks. This framework leverages CatBoost's strong learning capability to maximize prediction accuracy and capture complex nonlinear relationships in accident severity. To enhance interpretability, SHAP was applied for a detailed mechanism analysis. Four popular machine learning algorithms and a statistical model for accident severity analysis, i.e., LightGBM, XGBoost, GBDT, ANN, and multinomial logit (MNL), were employed for comparison to verify the effectiveness of CatBoost. Also, official traffic accident data collected in a city in Jiangsu Province, China, supports this research.
The three primary salient contributions of this paper are as follows. First, the accurate prediction of fatal traffic-related accidents is achieved using an advanced boosting algorithm, i.e., CatBoost, which is designed for datasets that include many categorical features. The prediction results indicate that CatBoost significantly outperformed the other five widely used algorithms in terms of accident severity analysis. Second, the effects of multiple traffic fatality contributing factors that are related to people, vehicles, road, environment, and accident characteristics are analyzed using SHAP. This detailed analysis captures the four perspectives referred to here as feature importance, total effect, main effect, and interaction effect to provide a theoretical basis for traffic infrastructure planning, driver safety training, and traffic law formulation. Third, the official dataset used in this study includes a variety of scenarios, road types, and drivers and passengers of different ages and has a high fatality rate, which helps to ensure emphasis on fatal accidents and the representativeness of the data.
-
This study proposes a practical framework for fatal traffic accident prediction and causal analysis based on interpretable machine learning. The framework has the following four steps:
● Data preparation: A traffic accident dataset, which includes people (demographic information), vehicle, road, environment, and accident characteristics, is collected and preprocessed.
● Model construction: The CatBoost algorithm is employed to classify fatal and non-fatal accidents. Five algorithms, LightGBM, XGBoost, GBDT, ANN, and MNL, are employed for comparison against CatBoost.
● Model evaluation: Various evaluation metrics, i.e., precision, recall, F1-score, the receiver operating characteristic (ROC) curve, and AUC, are used to evaluate the prediction results.
● Model interpretation: The SHAP algorithm is used to reveal the distribution of the different contributing factors and their impacts on fatal accidents from four perspectives: feature importance, total effect, main effect, and interaction effect.
Figure 1 shows the structure of the proposed framework, and Fig. 2 shows the model structure of CatBoost and SHAP. The four steps are discussed in detail in the paragraphs that follow the figure.
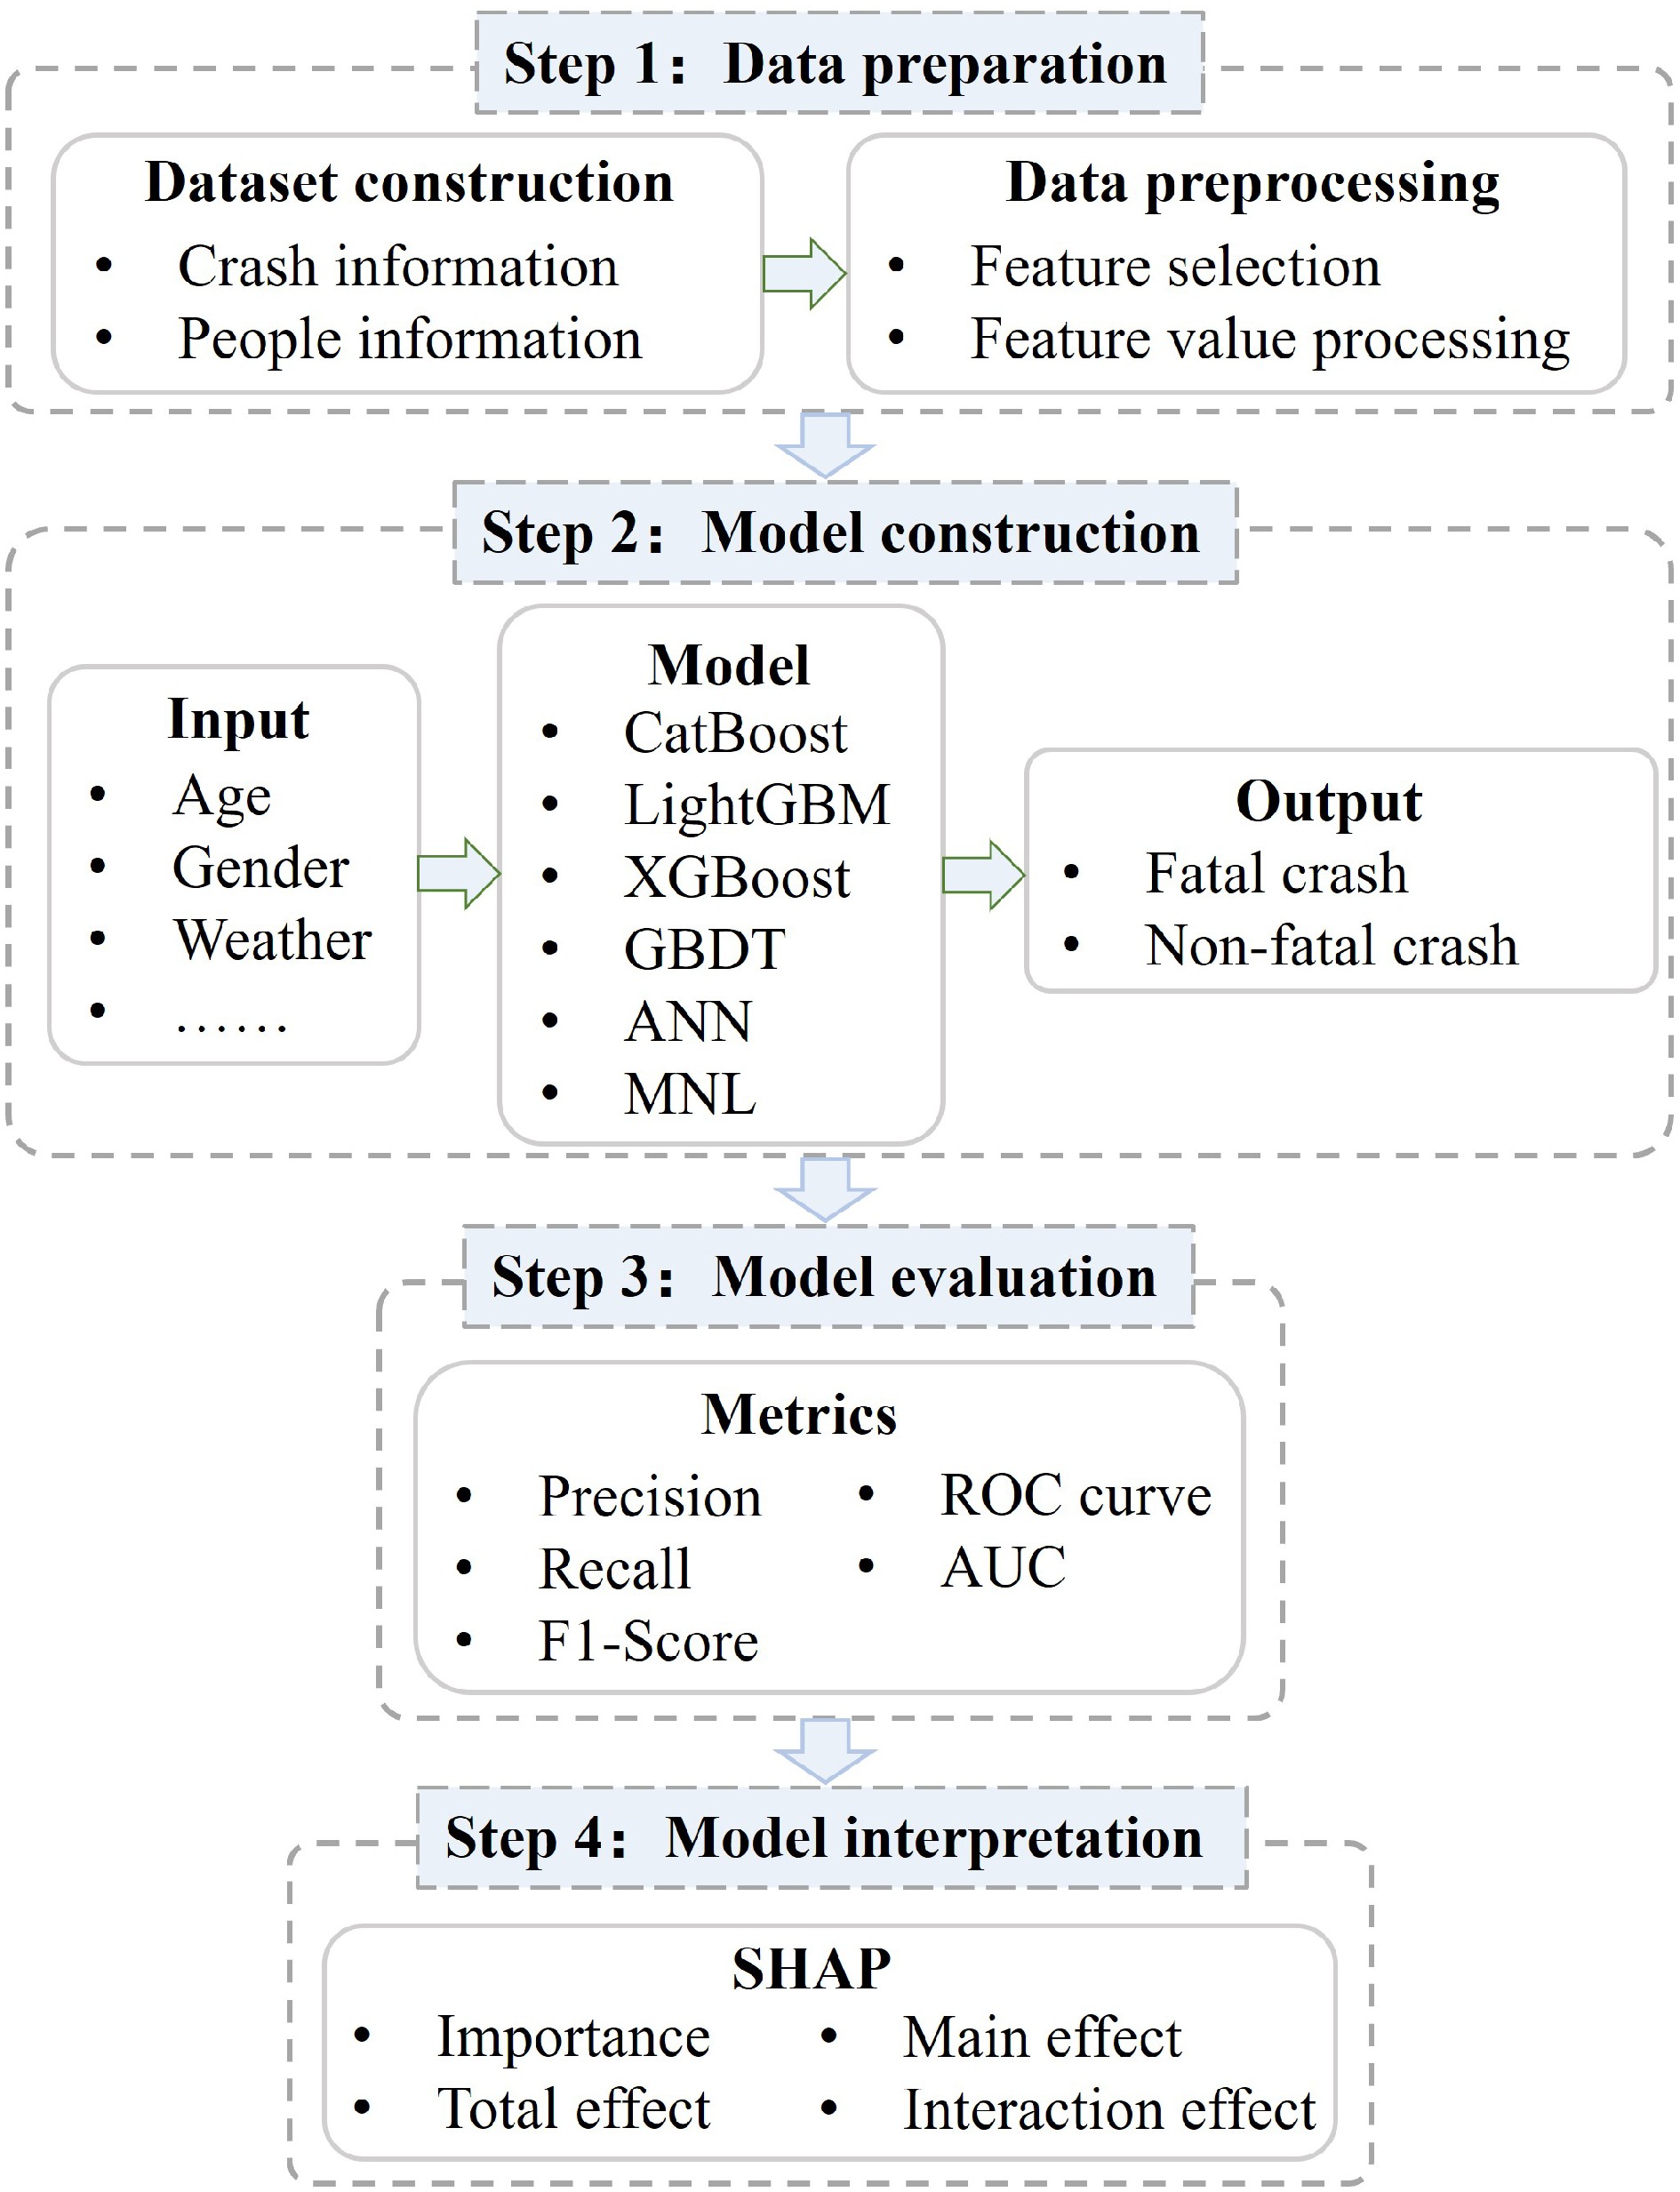
Figure 1.
Framework for fatal traffic accident prediction and causal analysis.
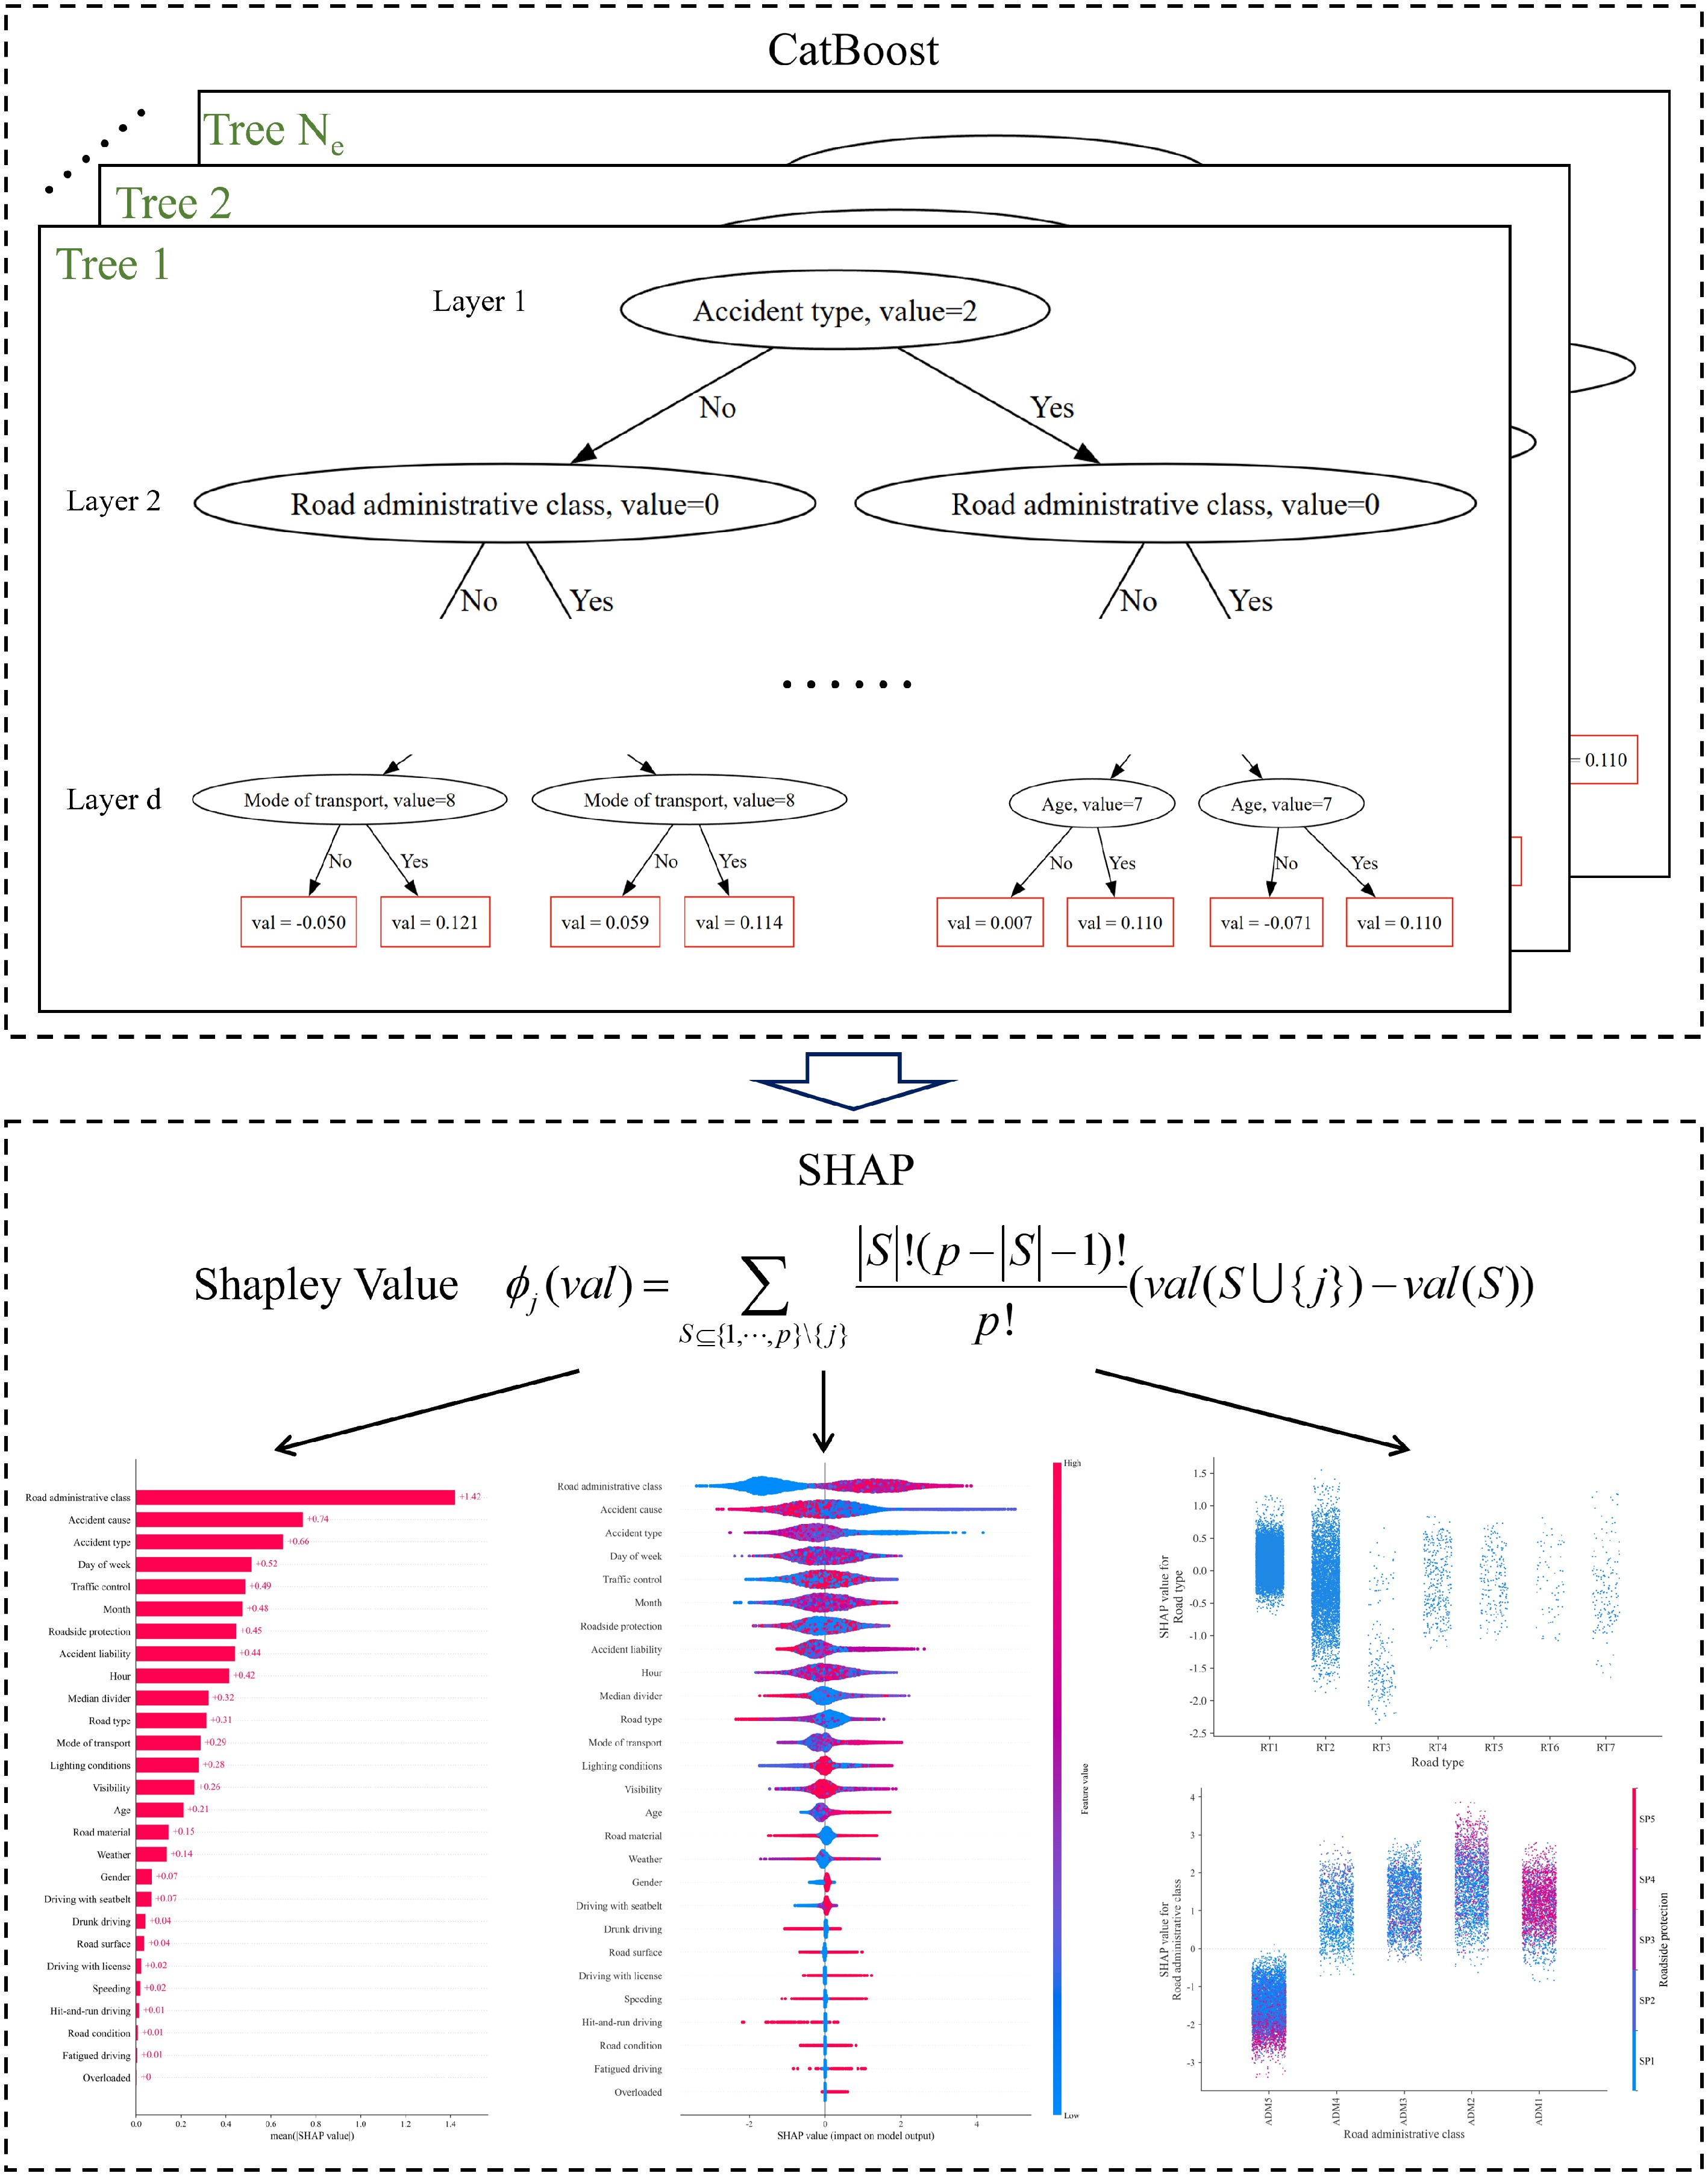
Figure 2.
Model structure of CatBoost and SHAP.
Data preparation
-
This study used official traffic accident data collected by the traffic department of a city in Jiangsu Province, China, from 2016 to 2020. The city is located in the Yangtze River Delta region and has an area of 10,030 square kilometers and a population of 4.55 million. Its geographical landscape features a mix of urban districts, suburban towns, and rural areas, contributing to a variety of road environments. The city's transportation infrastructure consists of arterial roads, expressways, highways, and local streets, facilitating both intra-city mobility and regional connectivity. Additionally, the city experiences four distinct seasons, with occasional extreme weather conditions such as heavy rainfall and fog, which can influence driving behavior and accident risk. The dataset utilized in this study is derived from officially recorded traffic accident reports collected by the local government. These reports are compiled through on-site police investigations and contain detailed records of traffic incidents. The dataset includes the following key components:
• Accident characteristics: Time, location, and severity classification (fatal, injury, and property damage-only).
• Road conditions: Type of roadway, lane configurations, traffic control measures, and surface conditions.
• Environmental factors: Weather conditions, lighting, and visibility at the time of the accident.
• Vehicle and driver information: Type and number of vehicles involved, driver demographics, license status, and recorded violations.
• Contributing factors: Identified causes such as speeding, reckless driving, impaired driving, or pedestrian-related factors.
The dataset contains a total of 7,579 traffic accidents and 17,777 pieces of demographic information and includes three accident severity levels, namely, fatal, injury, and property damage. A total of 3,367 fatal accidents, 3,985 injury accidents, and 227 property damage-only accidents are included in the dataset.
The data preprocessing process is as follows. First, the traffic accident data and demographic data were merged according to the 'accident number'. Then, unnecessary features ('accident number', 'road number', etc.) and redundant features ('initial cause of accident', etc.) were deleted. Next, to ensure the focus on fatal accidents, 'property damage' accidents and 'injury' accidents were combined into one class, i.e., non-fatal accidents. The machine learning algorithms used in this paper have a strong nonlinear mapping capability, whereby the rich feature values are conducive to improving the prediction results, so the original feature values were retained as much as possible and not merged. For example, months were not merged into seasons, weeks were not converted to weekdays and weekends, and the unit (h) used for 'accident time' was retained. Finally, the preprocessed dataset contained 17,777 records and 28 categorical features. The feature 'accident severity' (which includes fatal and non-fatal accidents) was employed as the target, whereas the other 27 features were employed as input features.
Table 1 presents the data distribution. Some of the features and values are intended specifically for use in this paper and are explained further as follows. For the drivers' age, '(20, 30]', for example, means that a driver is older than 20 or 30 years old or younger. 'Overloaded' refers to transport trucks that are carrying or weigh more than the maximum allowable load or passenger vehicles (cars, buses, etc.) that are carrying more than the maximum allowable number of passengers. 'Combination vehicle' (under 'Mode of transport') refers to a combination of trucks, trailers, or semi-trailers that transport freight. 'Pier' (under 'Median divider' and 'Roadside protection') refers to a line of spherical piers that have a concrete base. Although 'Side-swipe' and 'Side collision' (both under 'Accident type') may sound similar, a side-swipe typically leads to a much less serious accident than a side collision. 'Side-swipe' refers to one vehicle brushing against the side of another vehicle, usually causing only paint damage and potentially knocking both vehicles slightly off course. 'Side collision' refers to one vehicle crashing headlong into the side of another vehicle. In this case, the two vehicles are roughly perpendicular to each other, which causes a much greater impact than a side-swipe, where the two vehicles are roughly parallel to each other. 'Accident liability' refers to the responsibility of a party or parties for an accident. For the road administrative class, in China, roads are classified based on the official administrative classification system established by the Ministry of Transport. The classification is as follows:
Table 1. Data description.
Feature Value Abbreviation of value Age (0,20] / (20,30] / (30,40] / (40,50] / (50,60] / (60,70] / (70, ) 0-20 / 20-30 / 30-40 / 40-50 / 50-60 / 60-70 / > 70 Gender Female / Male − Driving with license True / False T / F Driving with seatbelt True / False / Unknown T / F / U Drunk driving True / False T / F Fatigued driving True / False T / F Speeding True / False T / F Overloaded True / False T / F Hit-and-run driving True / False T / F Mode of transport Pedestrian / Bicycle / Electric bicycle / Motorcycle / Tricycle / Car / Bus / Small truck / Large truck / Combination vehicle / Other MOD1 / MOD2 / MOD3 / MOD4 / MOD5 / MOD6 / MOD7 / MOD8 / MOD9 / MOD10 / MOD11 Road administrative class National road / Provincial road / Country road / Township road / Urban road ADM1 / ADM2 / ADM3 / ADM4 / ADM5 Road type Road segment / Intersection / Road access / Ramp / Bridge or tunnel / Elevated road / Other RT1 / RT2 / RT3 / RT4 / RT5 / RT6 / RT7 Traffic control No control / Marking / Sign / Traffic light / Other TC1 / TC2 / TC3 / TC4 / TC5 Median divider No divider / Greenbelt / Pier / Guardrail CI1 / CI2 / CI3 / CI4 Roadside protection No protection / Greenbelt / Pier / Guardrail / Other SP1 / SP2 / SP3 / SP4 / SP5 Road condition Intact / Damaged RC1 / RC2 Road material Asphalt / Cement / Other RM1 / RM2 / RM3 Road surface Dry / Wet / Ponding / Icy / Other RS1 / RS2 / RS3 / RS4 / RS5 Month January / February / March / April / May / June / July / August / September / October / November / December Jan / Feb / Mar / Apr / May / Jun / Jul / Aug / Sept / Oct / Nov / Dec Day of week Monday / Tuesday / Wednesday / Thursday / Friday / Saturday / Sunday Mon / Tue / Wed / Thur / Fri / Sat / Sun Hour 0 / 1 / 2 / 3 / 4 / 5 / 6 / 7 / 8 / 9 / 10 / 11 / 12 / 13 / 14 / 15 / 16 / 17 / 18 / 19 / 20 / 21 / 22 / 23 − Weather Sunny / Cloudy / Rainy or snowy / Foggy / Other W1 / W2 / W3 / W4 / W5 Lighting conditions Night without street lamp / Night with street lamp / Nightfall / Dawn / Daytime LC1 / LC2 / LC3 / LC4 / LC5 Visibility < 50 m / 50−100 m / 100−200 m / > 200 m VIS1 / VIS2 / VIS3 / VIS4 Accident cause Pedestrian or non-motor vehicle violation / Distracted driving/ Natural disaster / Substandard vehicle / Driving in the wrong lane / Failure to give way according to traffic rules / Traffic light or sign violation / Failure to maintain safe distance / Illegal parking / Illegal overtaking or lane changing / Driving in the opposite direction / Other AC1 / AC2 / AC3 / AC4 / AC5 / AC6 / AC7 / AC8 / AC9 / AC10 / AC11 / AC12 Accident type Overturned vehicle / Bumping into fixed object / Bumping into pedestrian(s) / Side-swipe / Side collision / Rear-end collision / Head-on collision / Other AF1 / AF2 / AF3 / AF4 / AF5 / AF6 / AF7 / AF8 Accident liability Unknown / No liability / Secondary / Equal / Primary / Full AL1 / AL2 / AL3 / AL4 / AL5 / AL6 Accident severity Injury or property damage (non-fatal) / Fatal AS0 / AS1 • National roads: Major highways forming the national trunk road network primarily connecting provincial capitals and major cities.
• Provincial roads: Regional highways linking major cities within a province and serving as key transportation routes at the provincial level.
• Country roads: Roads managed at the county level, mainly connecting towns and villages to higher-level road networks.
• Township roads: Roads managed at the township level, facilitating local transportation within townships and linking villages.
• Urban roads: Roads within city boundaries, including expressways, arterial roads, secondary roads, and local streets, primarily serving intra-city traffic.
For the road type, road accesses refer to minor roads or entryways that connect private properties or secondary roads to the main road network. These include, but are not limited to, driveways, access roads to industrial facilities, and minor roads leading to residential or commercial buildings.
As shown, the dataset has rich features related to people (age, gender, etc.), vehicle (mode of transport), road (administrative class of the highway, road structure, etc.), environment (weather, visibility, etc.), and accident (accident cause, accident type, etc.).
Model construction
-
In the proposed framework, LightGBM, XGBoost, GBDT, ANN, and MNL are employed for comparison purposes against CatBoost. The underlying principles of these algorithms have been described in detail in numerous studies and thus are not repeated here. However, CatBoost is discussed briefly.
CatBoost, an open-source machine learning algorithm developed by the Russian company Yandex in 2017, is a high-performance boosting algorithm framework with an oblivious decision tree as the base predictor, which is good at handling categorical features[31]. CatBoost uses the ordered TS (target statistics) algorithm to handle the categorical features efficiently and uses the ordered boosting algorithm to solve the problem of prediction shift. The ordered TS and ordered boosting algorithms are discussed in detail in the subsequent paragraphs.
During the modeling process for machine learning, one-hot encoding is typically used to process categorical features to make the values of each feature equidistant from the origin. However, such encoding can cause a curse of dimensionality for high-cardinality categorical features. Greedy TS is a standard solution that substitutes the average target values over the training examples using the same category for the corresponding feature value of a specific sample and introduces a prior distribution term to reduce the noise and impacts of the low-frequency categories on the overall data distribution. However, this approach can cause target leakage. To this end, CatBoost uses the ordered TS that generates a random permutation, introduces the concept of a sequential order of samples, and uses only the average target values of the samples that appear before a specific sample during the training process; see Eq. (1).
$ \begin{gathered} \hat x_k^i = \dfrac{{\sum\nolimits_{{x_j} \in {D_k}} {{{\text{1}}_{\{ x_j^i = x_k^i\} }} \cdot {y_j}} + aP}}{{\sum\nolimits_{{x_j} \in {D_k}} {{{\text{1}}_{\{ x_j^i = x_k^i\} }}} + a}}, \\ {D_k} = \left\{ {{x_j}\left| {\sigma (j) \lt \sigma (k)} \right.} \right\},\;\;when{\text{ }}training \\ {D_k} = D,\;\; when{\text{ }}testing \\ \end{gathered} $ (1) where,
$ x_k^i $ $ \hat x_k^i $ $ \hat x_k^i $ $\sigma $ This concept is adopted again when constructing trees during the boosting stage. A total of n trees is retained (n is the number of samples), where only part of the samples is used for each tree. In short, the CatBoost algorithm has excellent performance and robustness and thus is well suited for regression and classification tasks that have numerous categorical input features.
Model evaluation
-
Accident severity prediction is a typical classification problem, so commonly used evaluation metrics, i.e., precision, recall, and F1-score, are employed here. Equations (2)−(4) provide the calculations for these metrics, respectively.
$ {\text{Precision}} = \dfrac{{TP}}{{TP + FP}} $ (2) $ {\text{Recall}} = \dfrac{{TP}}{{TP + FN}} $ (3) $ {\text{F1-score}} = \dfrac{{2 \cdot Precision \cdot Recall}}{{Precision + Recall}} $ (4) where, TP is true positive, FP is false positive, and FN is false negative.
To compare algorithm performance more intuitively, an ROC curve is used. The horizontal coordinate of the ROC curve is the false positive rate (FPR), defined in Eq. (5), whereas the vertical coordinate is the true positive rate, namely, the recall, defined in Eq. (3). The measurement variable AUC is the total area under the ROC curve, with a larger area indicating better model performance.
$ {\text{FPR}} = \dfrac{{FP}}{{FP + TN}} $ (5) where, FPR is false positive rate, FP is false positive, and TN is true negative.
Model interpretation
-
Following the accident severity prediction and performance evaluation, a popular interpretable machine learning algorithm, i.e., the SHAP algorithm, was employed to explain and analyze the model results. SHAP was proposed by Lundberg et al.[32] in 2017 to explain individual predictions based on game-theoretic optimal Shapley values. SHAP offers both global and local interpretability, with support for feature importance, interaction effects, and visualization, especially for tree-based models. SHAP interprets the prediction results of machine learning algorithms by calculating the Shapley value of each feature value of each sample. A positive Shapley value indicates that the feature value of a specific sample increases the predicted probability, whereas a negative value indicates a decrease in the probability. The Shapley value is calculated as shown in Eqs (6) and (7).
$ {\phi _j}(val) = \sum\limits_{S \subseteq \{ 1, \cdots ,p\} \backslash \{ j\} } {\dfrac{{\left| S \right|!(p - \left| S \right| - 1)!}}{{p!}}} (val(S \cup \{ j\} ) - val(S)) $ (6) $ va{l_x}(S) = \int {\hat f({x_1}, \cdots ,{x_p})} d{P_{x \notin S}} - {E_X}(\hat f(X)) $ (7) where,
$ {\phi _j}(val) $ $ \hat f $ $ val(S \cup \{ j\} ) - val(S) $ The absolute Shapley value indicates the degree of influence of the feature value of a specific sample on the predicted probability. Therefore, the feature importance can be measured using the average absolute Shapley value; see Eq. (8).
$ {I_j} = \dfrac{1}{N}\sum\limits_{i = 1}^N {\left| {\phi _j^{(i)}} \right|} $ (8) where, N is the number of samples, and Ij is the importance of the j-th feature.
SHAP can also be used to explore the interaction effect between two features via the Shapley interaction index. The underlying principle of the index is that the individual effects of two features can be subtracted from their combined effect to obtain their pure interaction effect, as expressed in Eqs (9) and (10).
$ {\phi _{i,j}} = \sum\limits_{S \subseteq \{ 1, \cdots ,p\} \backslash \{ i,j\} } {\dfrac{{\left| S \right|!(p - \left| S \right| - 2)!}}{{2(p - 1)!}}} {\delta _{ij}}(S),(i \ne j) $ (9) $ {\delta _{ij}}(S) = {\hat f_x}(S \cup \{ i,j\} ) - {\hat f_x}(S \cup \{ i\} ) - {\hat f_x}(S \cup \{ j\} ) + {\hat f_x}(S) $ (10) where,
$ {\phi _{i,j}} $ -
The dataset was divided into a training set, validation set, and test set with a ratio of 6:2:2, respectively. The hyper-parameters of the CatBoost, LightGBM, XGBoost, GBDT, ANN, and MNL algorithms were selected using a grid search and five-fold cross-validation. Table 2 shows the results of the parameter selection.
Table 2. Parameter selection for each compared algorithm.
Algorithms Parameters Parameter range Optimal parameters CatBoost Learning rate lr lr $ \in $ {0.1, 0.2, 0.3, 0.5} lr = 0.1 Number of estimators Ne Ne $ \in $ {300, 500, 1,000, 2,000} Ne = 500 Depth of each tree d d $ \in $ {9, 10, 11, 12} d = 10 LightGBM Learning rate lr lr $ \in $ {0.01, 0.05, 0.1, 0.2} lr = 0.1 Number of estimators Ne Ne $ \in $ {300, 500, 1,000, 2,000} Ne = 1,000 Maximum depth of each tree d d $ \in $ {10, 20, $ \infty $} d = $ \infty $ Maximum tree leaves of each tree ml ml $ \in $ { 10, 31, 100, 200} ml = 100 XGBoost Learning rate lr lr $ \in $ {0.1, 0.2, 0.3, 0.5} lr = 0.1 Number of estimators Ne Ne $ \in $ {200, 300, 500, 1,000} Ne = 500 maximum depth of each tree d d $ \in $ { 6, 20, 30, 50} d = 30 Minimum decreasing value of loss function gamma gamma $ \in $ {0, 0.1, 0.2, 0.3} gamma = 0.1 GBDT Learning rate lr lr $ \in $ {0.01, 0.05, 0.1, 0.2} lr = 0.1 Number of estimators Ne Ne $ \in $ {200, 300, 500, 1,000} Ne = 500 Maximum depth of each tree d d $ \in $ { 3, 10, 30, 50} d = 30 ANN Number of hidden layer units Nunit Nunit $ \in $ {64, 128, 256, 512} Nunit = 256 Learning rate lr lr $ \in $ {10−4, 10−3, 10−2} lr = 10−3 MNL Penalty p p $ \in $ {none, l2} p = l2 Inverse of regularization strength C C $ \in $ {0.1, 1, 10, 100} C = 10 Table 3 and Fig. 3 show the prediction performance for all six compared algorithms in terms of the test set. As shown in Table 3, the precision, recall, and F1-score values for CatBoost are all above 0.9, which is significantly higher than those of the other five algorithms. Figure 3 shows that the ROC curve for CatBoost is closer to the upper left than that of the other algorithms, also indicating CatBoost's better prediction performance. CatBoost integrates a practical categorical feature processing module into the training process, which makes it more suitable than the other algorithms for prediction tasks that have a large number of categorical features. In addition, the base predictor in CatBoost is an oblivious tree with the same splitting criterion across an entire level, which offers the benefits of being balanced and less prone to overfitting compared to the other five algorithms. By contrast, LightGBM does not process categorical features as efficiently as Catboost. XGBoost and GBDT do not have the capability to handle categorical features automatically, so these features must be handled manually using a one-hot encoder. In addition, MNL assumes linear relationships and independence of irrelevant alternatives, which can limit its ability to capture complex patterns. ANN is more flexible but requires large datasets and extensive tuning to achieve optimal performance. As a result, both models exhibited unsatisfactory performance in this analysis.
Table 3. Metrics for each compared algorithm.
Algorithms Precision Recall F1-score CatBoost 0.912 0.942 0.927 LightGBM 0.826 0.872 0.848 XGBoost 0.820 0.847 0.833 GBDT 0.808 0.852 0.829 ANN 0.727 0.817 0.769 MNL 0.596 0.651 0.622 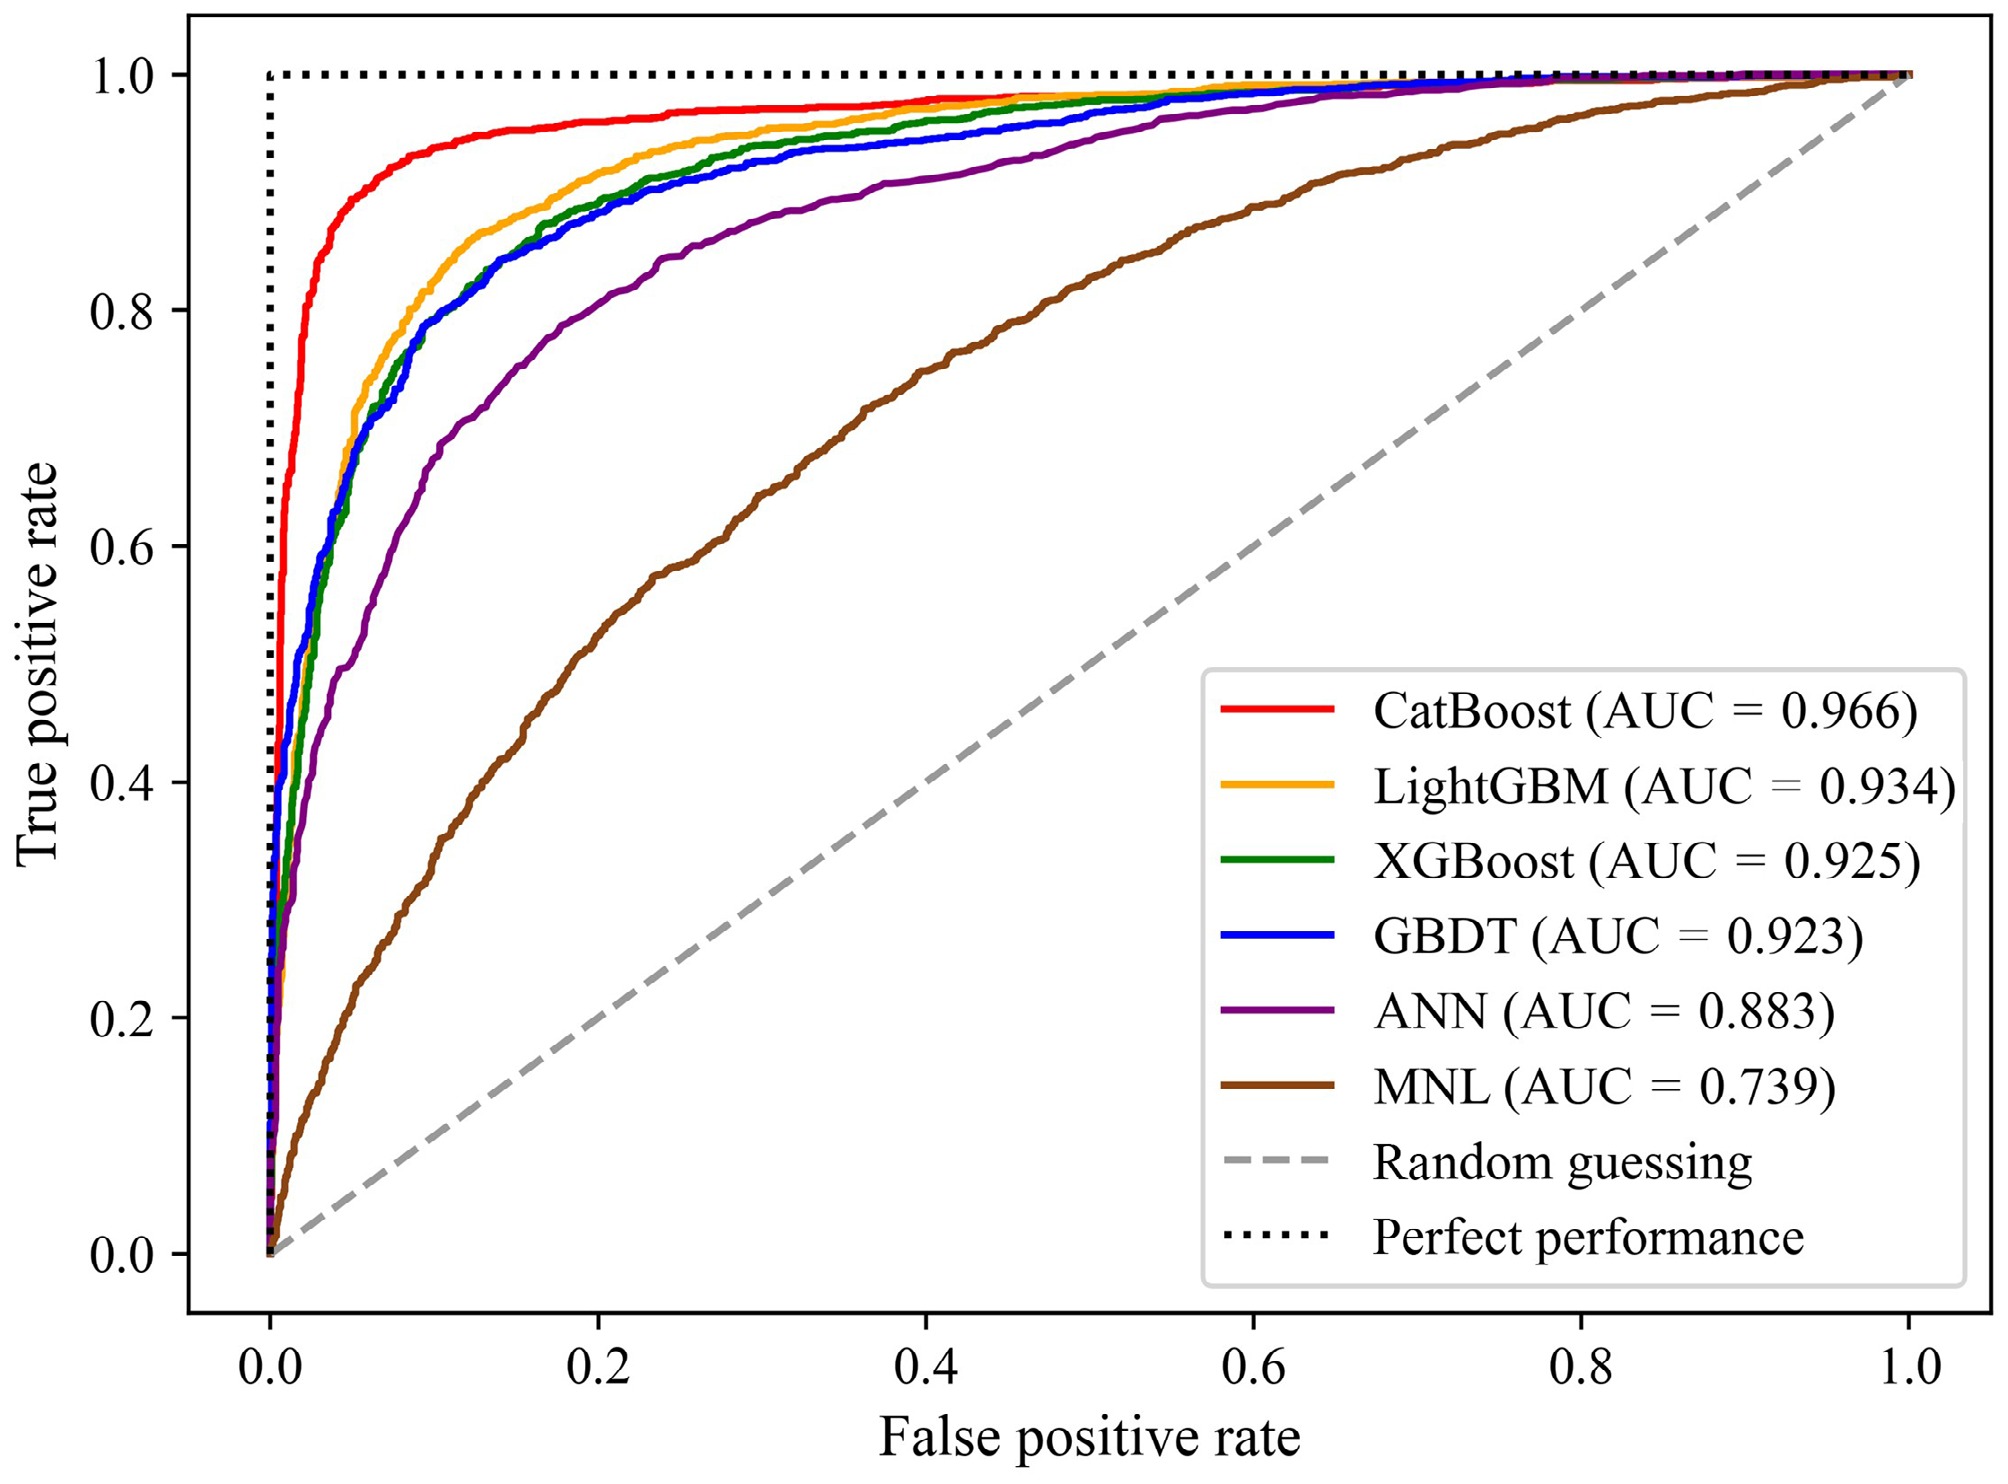
Figure 3.
Receiver operating characteristic curve for each compared algorithm.
Importance and total effects
-
Figure 4a, b, respectively, shows the importance of each feature and the total effect of the factors that contribute to fatal accidents. Figure 4a measures the feature importance by the average absolute Shapley value. In Fig. 4b, the vertical coordinate indicates the different features, and the horizontal coordinate indicates the Shapley value of each feature value of each sample. The positive values indicate a greater probability of a fatal accident, whereas the negative values indicate less probability. The color of the dots represents the magnitude of the feature values, corresponding to the color bar on the right. Figure 4 shows that the road administrative class, accident cause, and accident type are the most important features, and their influence on the probability of fatal accidents has significant linear characteristics. The temporal features, i.e., month, day of week, and hour, are also important factors, but their influence is more complex than the others. With regard to demographic features, older ages generally increase the probability of fatalities. Also, male drivers have a greater probability of death than females because male drivers typically can be over-confident in their driving skills, are less attentive, have lower levels of risk perception, and are more likely to perform risky driving behaviors[33]. Therefore, safety training, especially for male drivers, should be strengthened.
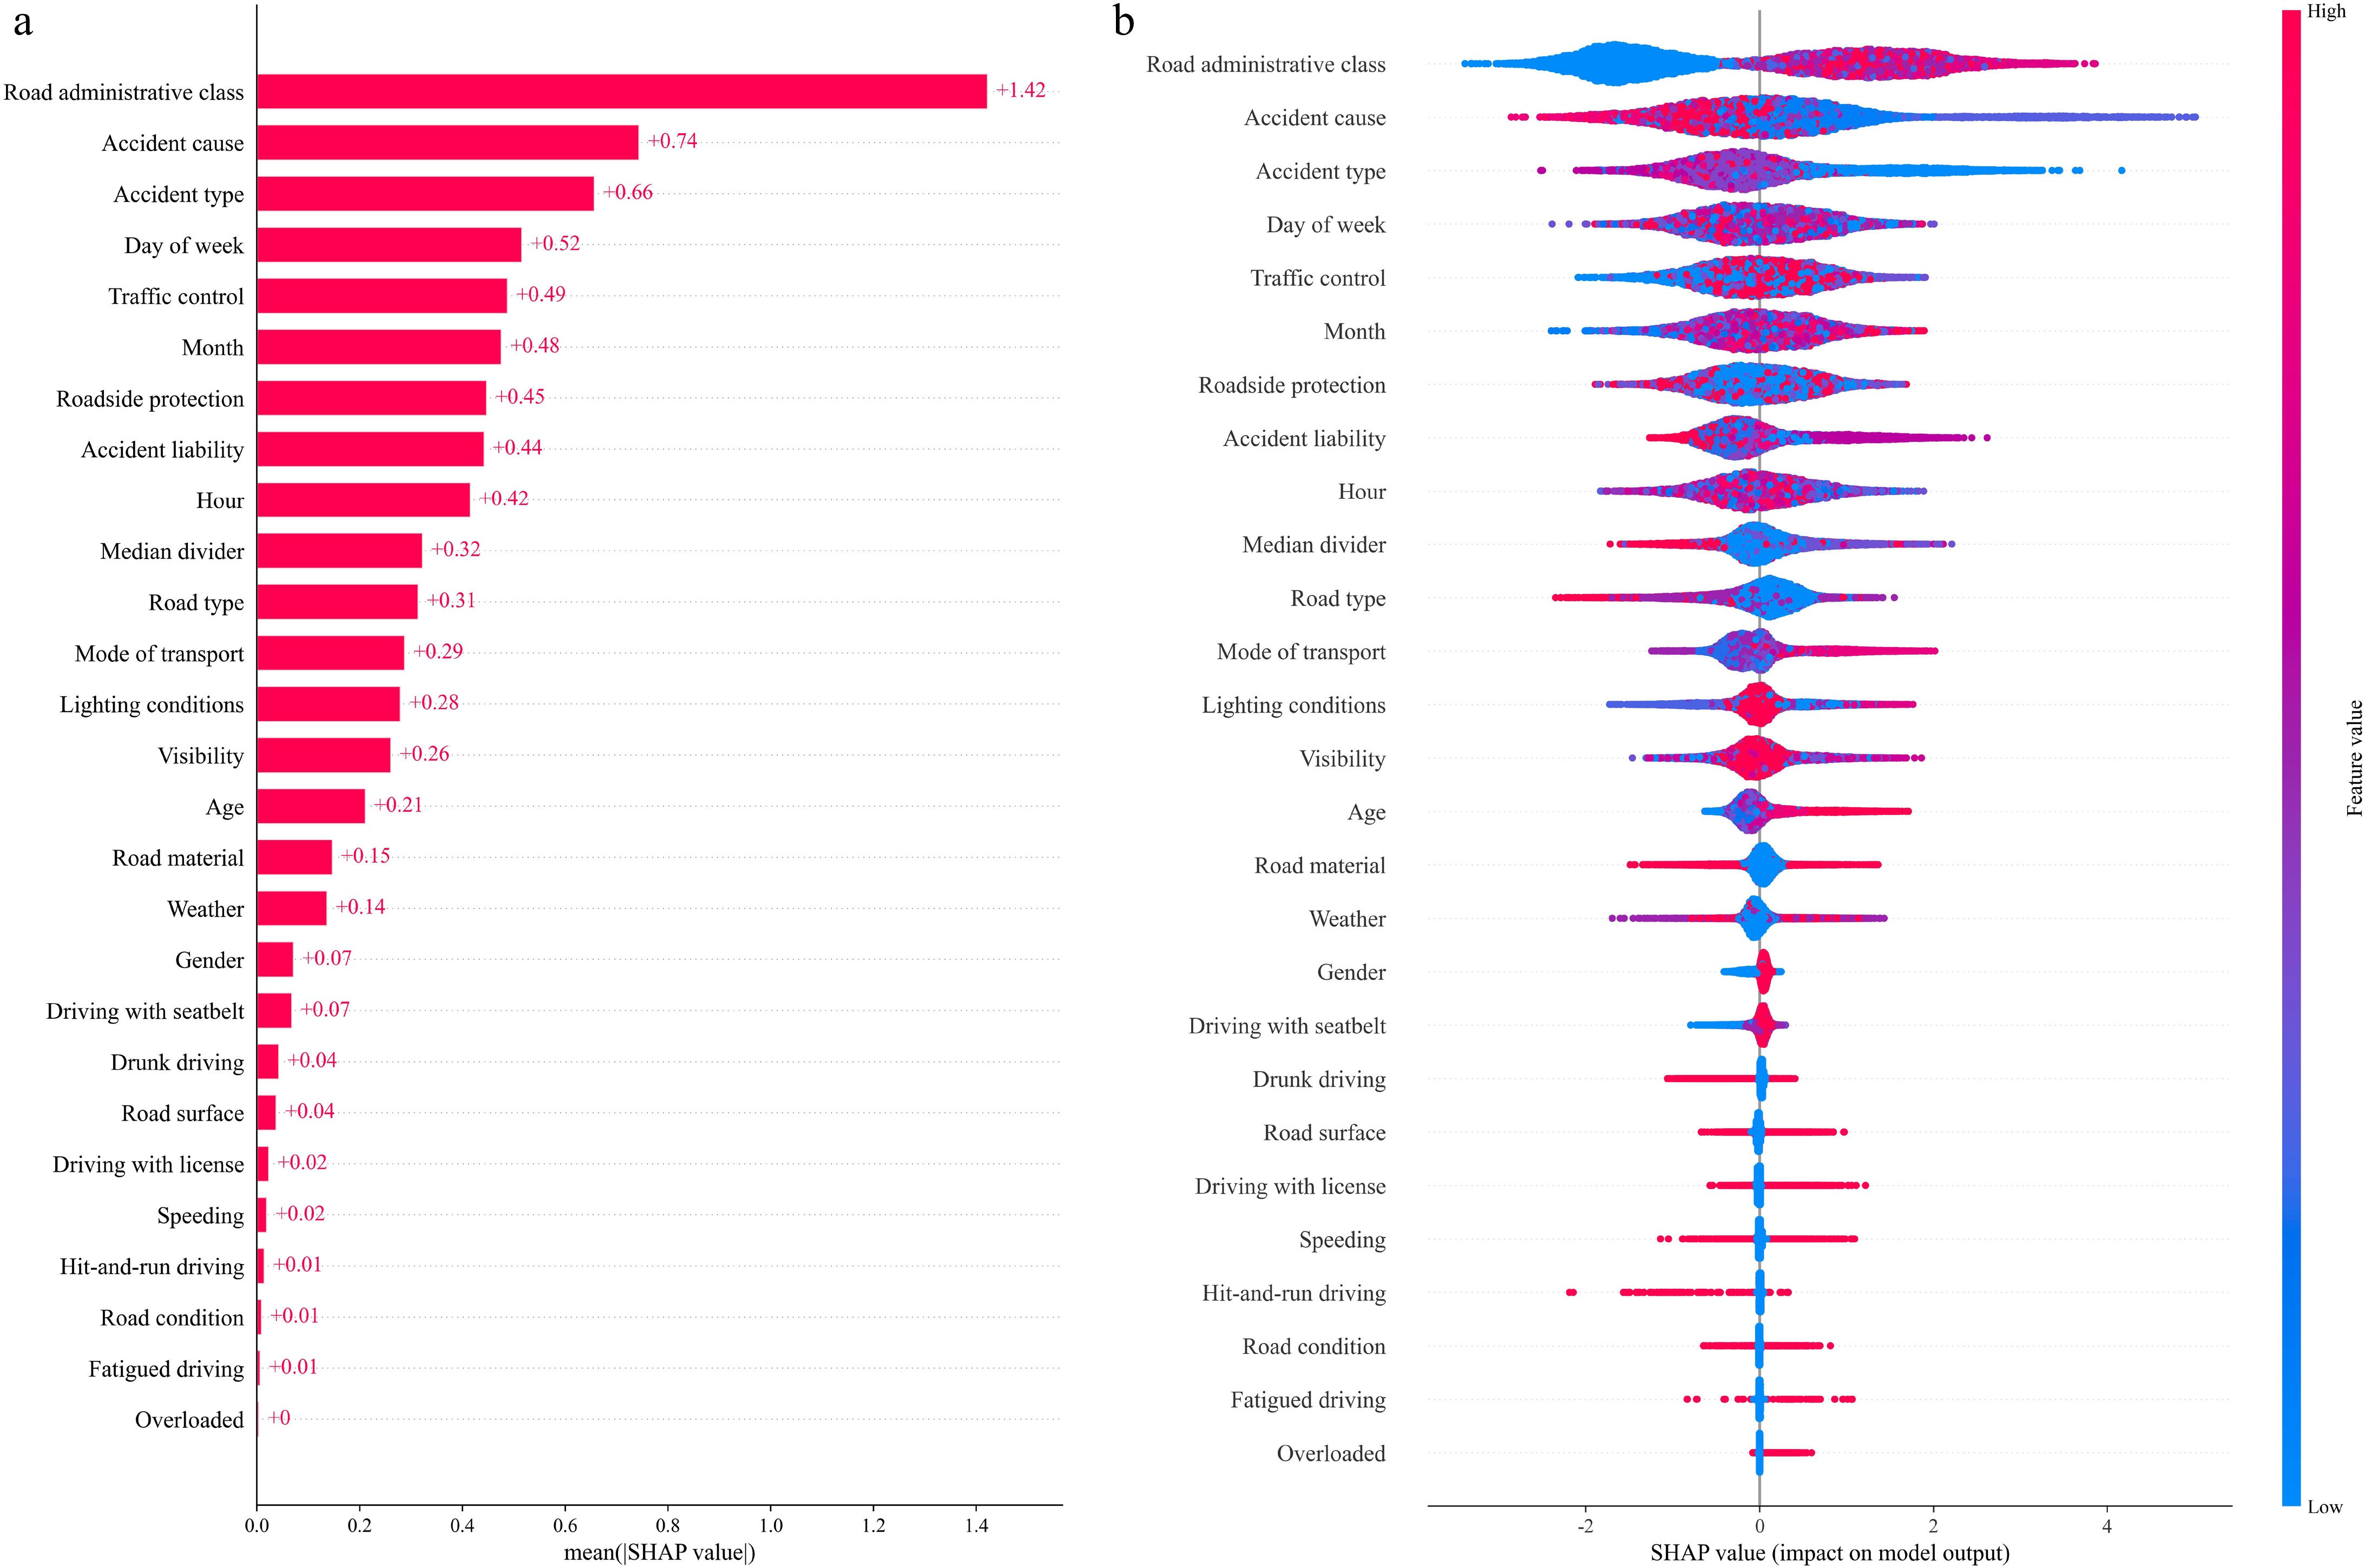
Figure 4.
Contributing factors for fatal accidents: (a) feature importance, and (b) total effect.
Main effects
-
Figure 5 shows the main effects of each of the contributing factors for fatal traffic accidents. The left-hand graphs, i.e., (a), (c), (e), and (g), show the number, average target value, and predicted fatality probability of the samples of each feature value. As shown, the average target value and predicted fatality probability overlap entirely, indicating desirable prediction results. The right-hand figures, i.e., (b), (d), (f), and (h), show the distribution of the Shapley values for each feature value.
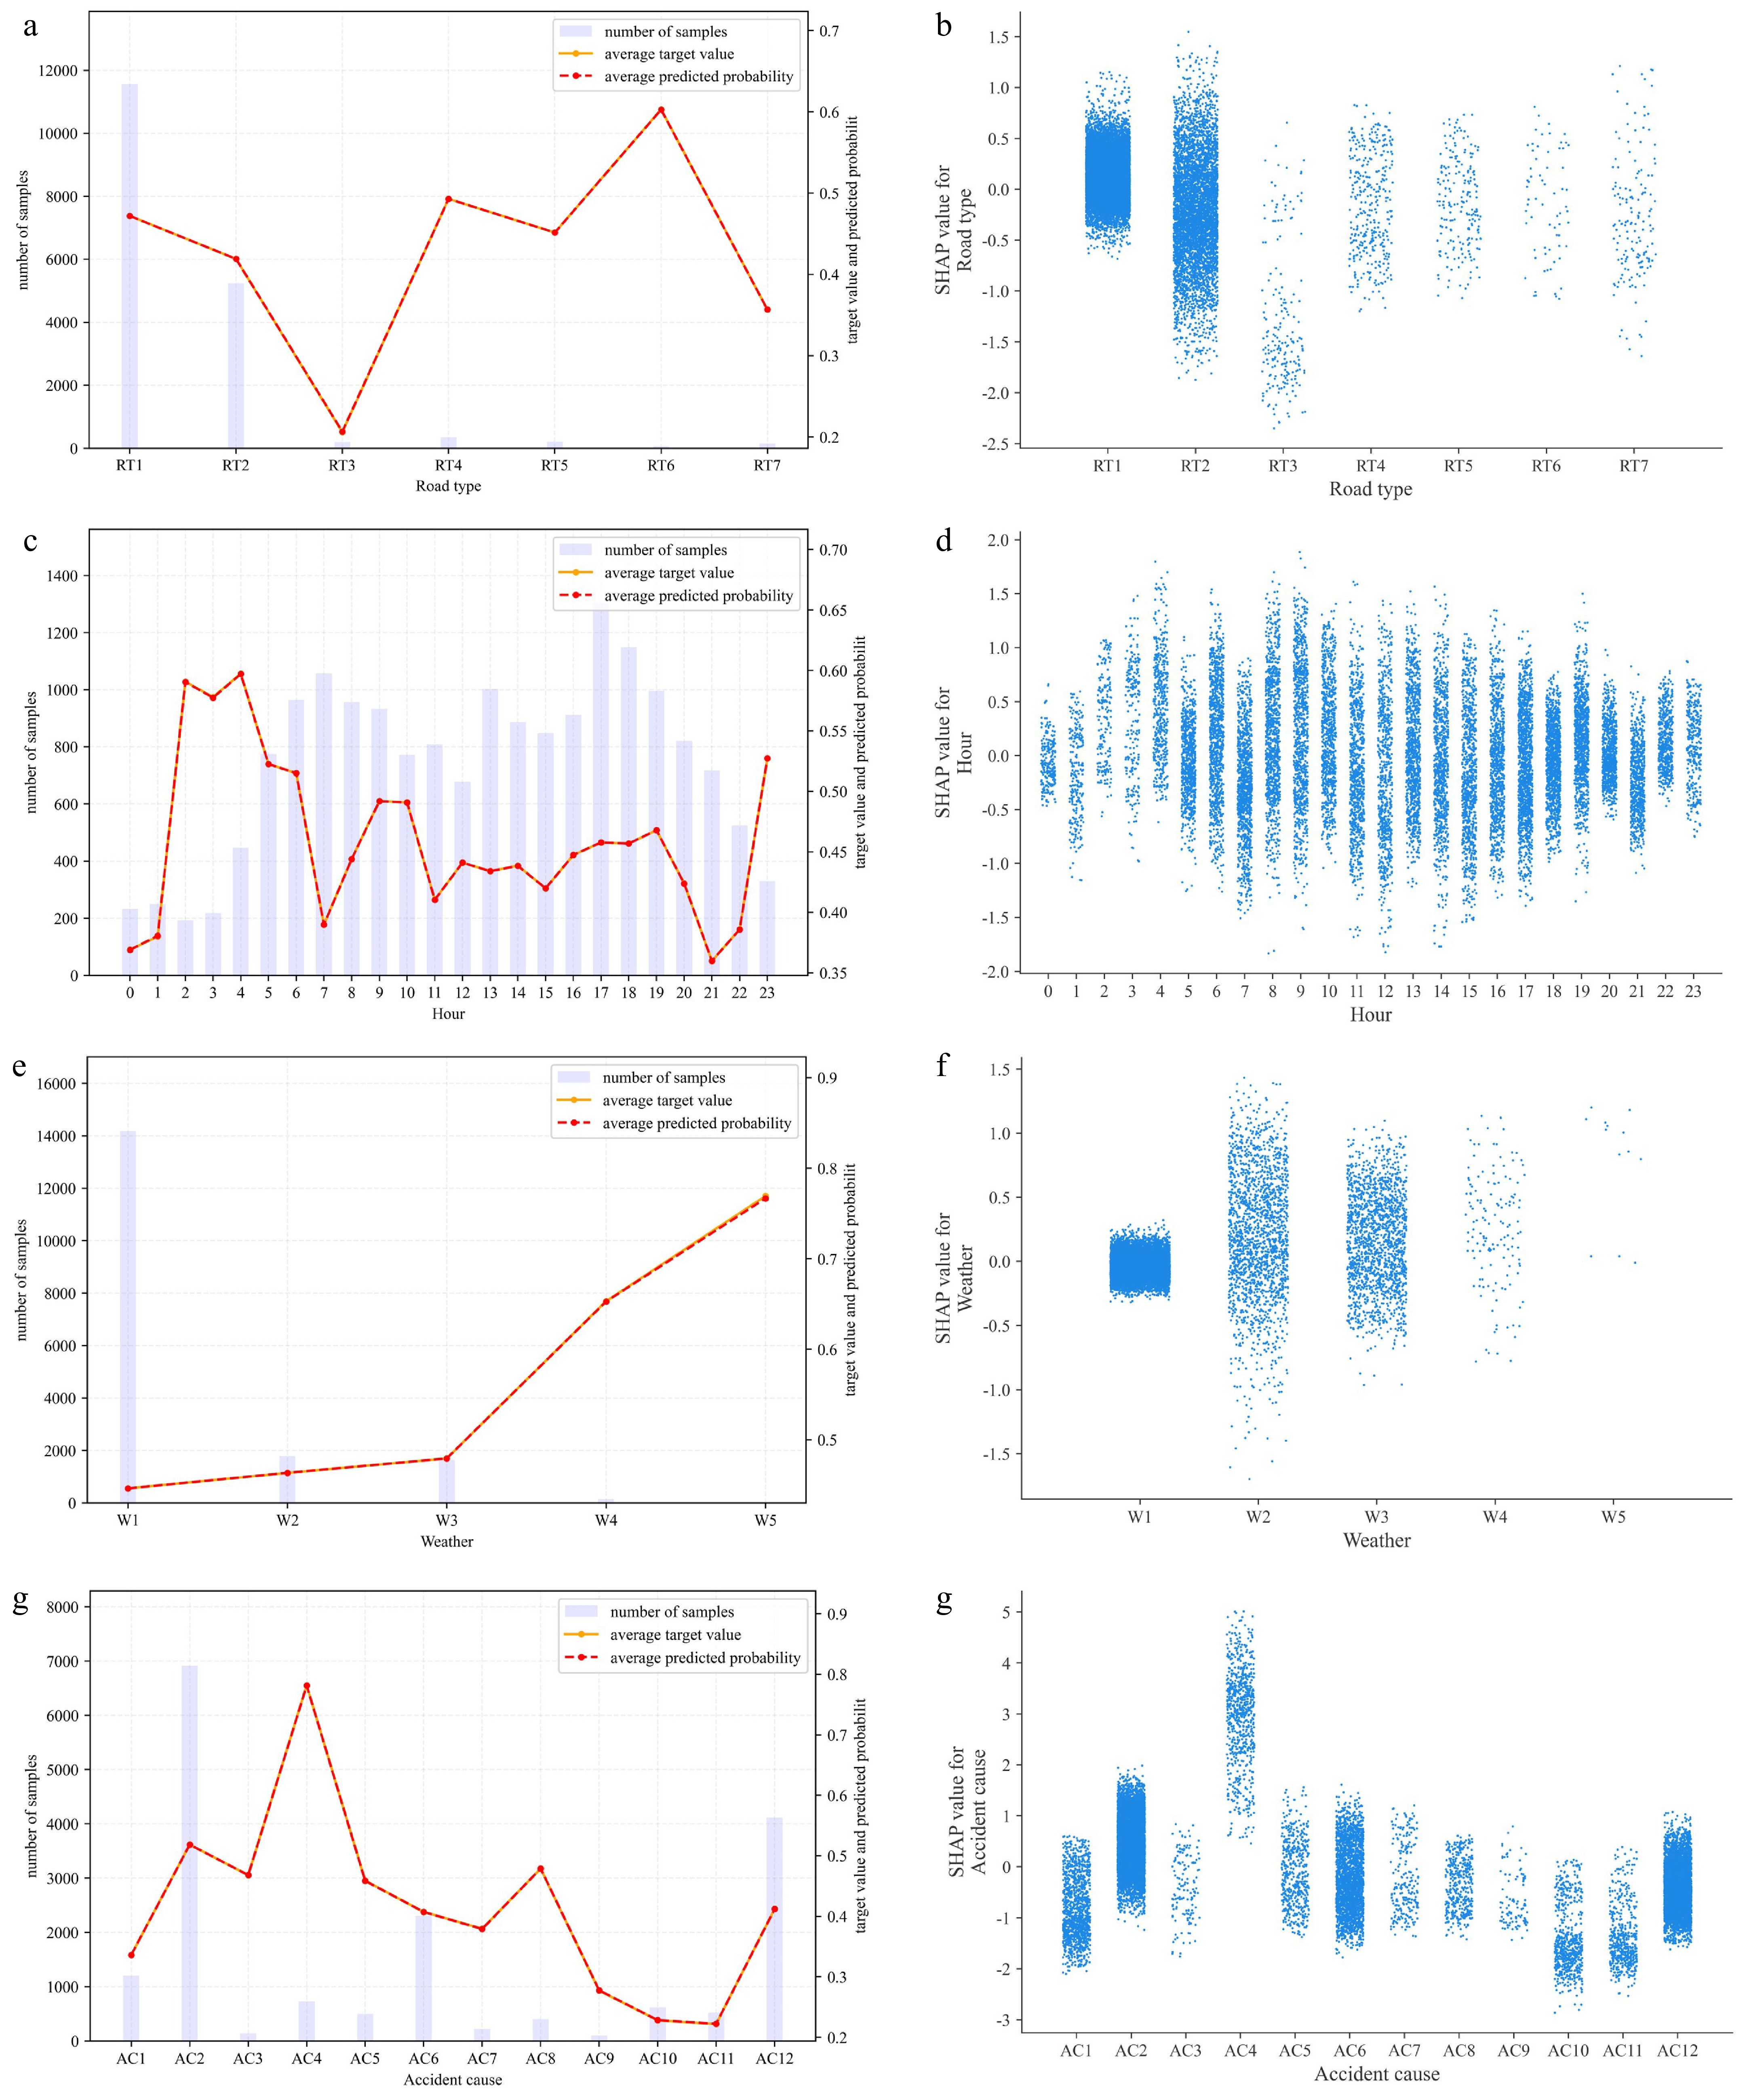
Figure 5.
Feature values and main effects of contributing factors for fatal accidents: (a) road type (feature value), (b) road type (main effect), (c) hour (feature value), (d) hour (main effect), (e) weather (feature value), (f) weather (main effect), (g) accident cause (feature value), and (h) accident cause (main effect).
Figure 5a, b indicates that the road segment and intersection are the most common road types with the highest frequency of traffic accidents, and elevated roads correlate with the highest fatality probability. Road access correlates with the lowest probability, with most samples having negative Shapley values. The reason for this outcome may be that drivers usually drive at a lower speed at the entry or exit of the road segment and are usually more cautious at a road access, thus leading to lower accident severity levels.
Figure 5c, d illustrates that most accidents occur in the morning and evening peak periods as a result of the large traffic volume and complex traffic environment during these periods. The period from 2:00 a.m. to 5:00 a.m. has the highest fatality probability, which is a finding that is generally consistent with previous studies[34,35]. Specifically, people who work night shifts feel sleepy from 2:00 a.m. to 5:00 a.m. Their alertness and hazard perception are significantly compromised during this window, thereby increasing the risk and severity of accidents when driving home[36]. Low visibility at night is another important cause of greater crash risk[37].
As shown in Fig. 5e and f, the probability of fatalities increases with increasing severity of the weather. Specifically, rain, snow, and fog can severely affect road conditions and driver visibility[38]. Edwards[39] found that, in rainy or foggy weather, although drivers tend to drive more slowly, the lower speed is not sufficient to compensate for the increased risk of accidents caused by extreme weather and poor visibility.
Figure 5g, h shows that distracted driving is the most common cause of traffic accidents. Most of the Shapley values are positive, indicating an increase in the overall probability of fatalities. Therefore, distracted driving needs to be detected in real time and feedback given to drivers to help minimize distracted driving behavior. The government and business community can facilitate the development of advanced driver assistance systems to achieve this goal. In addition, substandard vehicles significantly increase the probability of fatalities compared to other causes, which is a finding that is consistent with previous findings[40,41], although at least one study has suggested that drivers who drive substandard vehicles tend to be more cautious[42]. The government should formulate relevant laws and regulations to strictly regulate and monitor substandard vehicles.
Interaction effects
-
Figure 6 illustrates the interaction effects of the contributing factors on fatal accidents. The magnitude of the secondary variable values is indicated by the color bar on the right, whereby the interaction effect of any two features on the prediction results can be visualized intuitively.
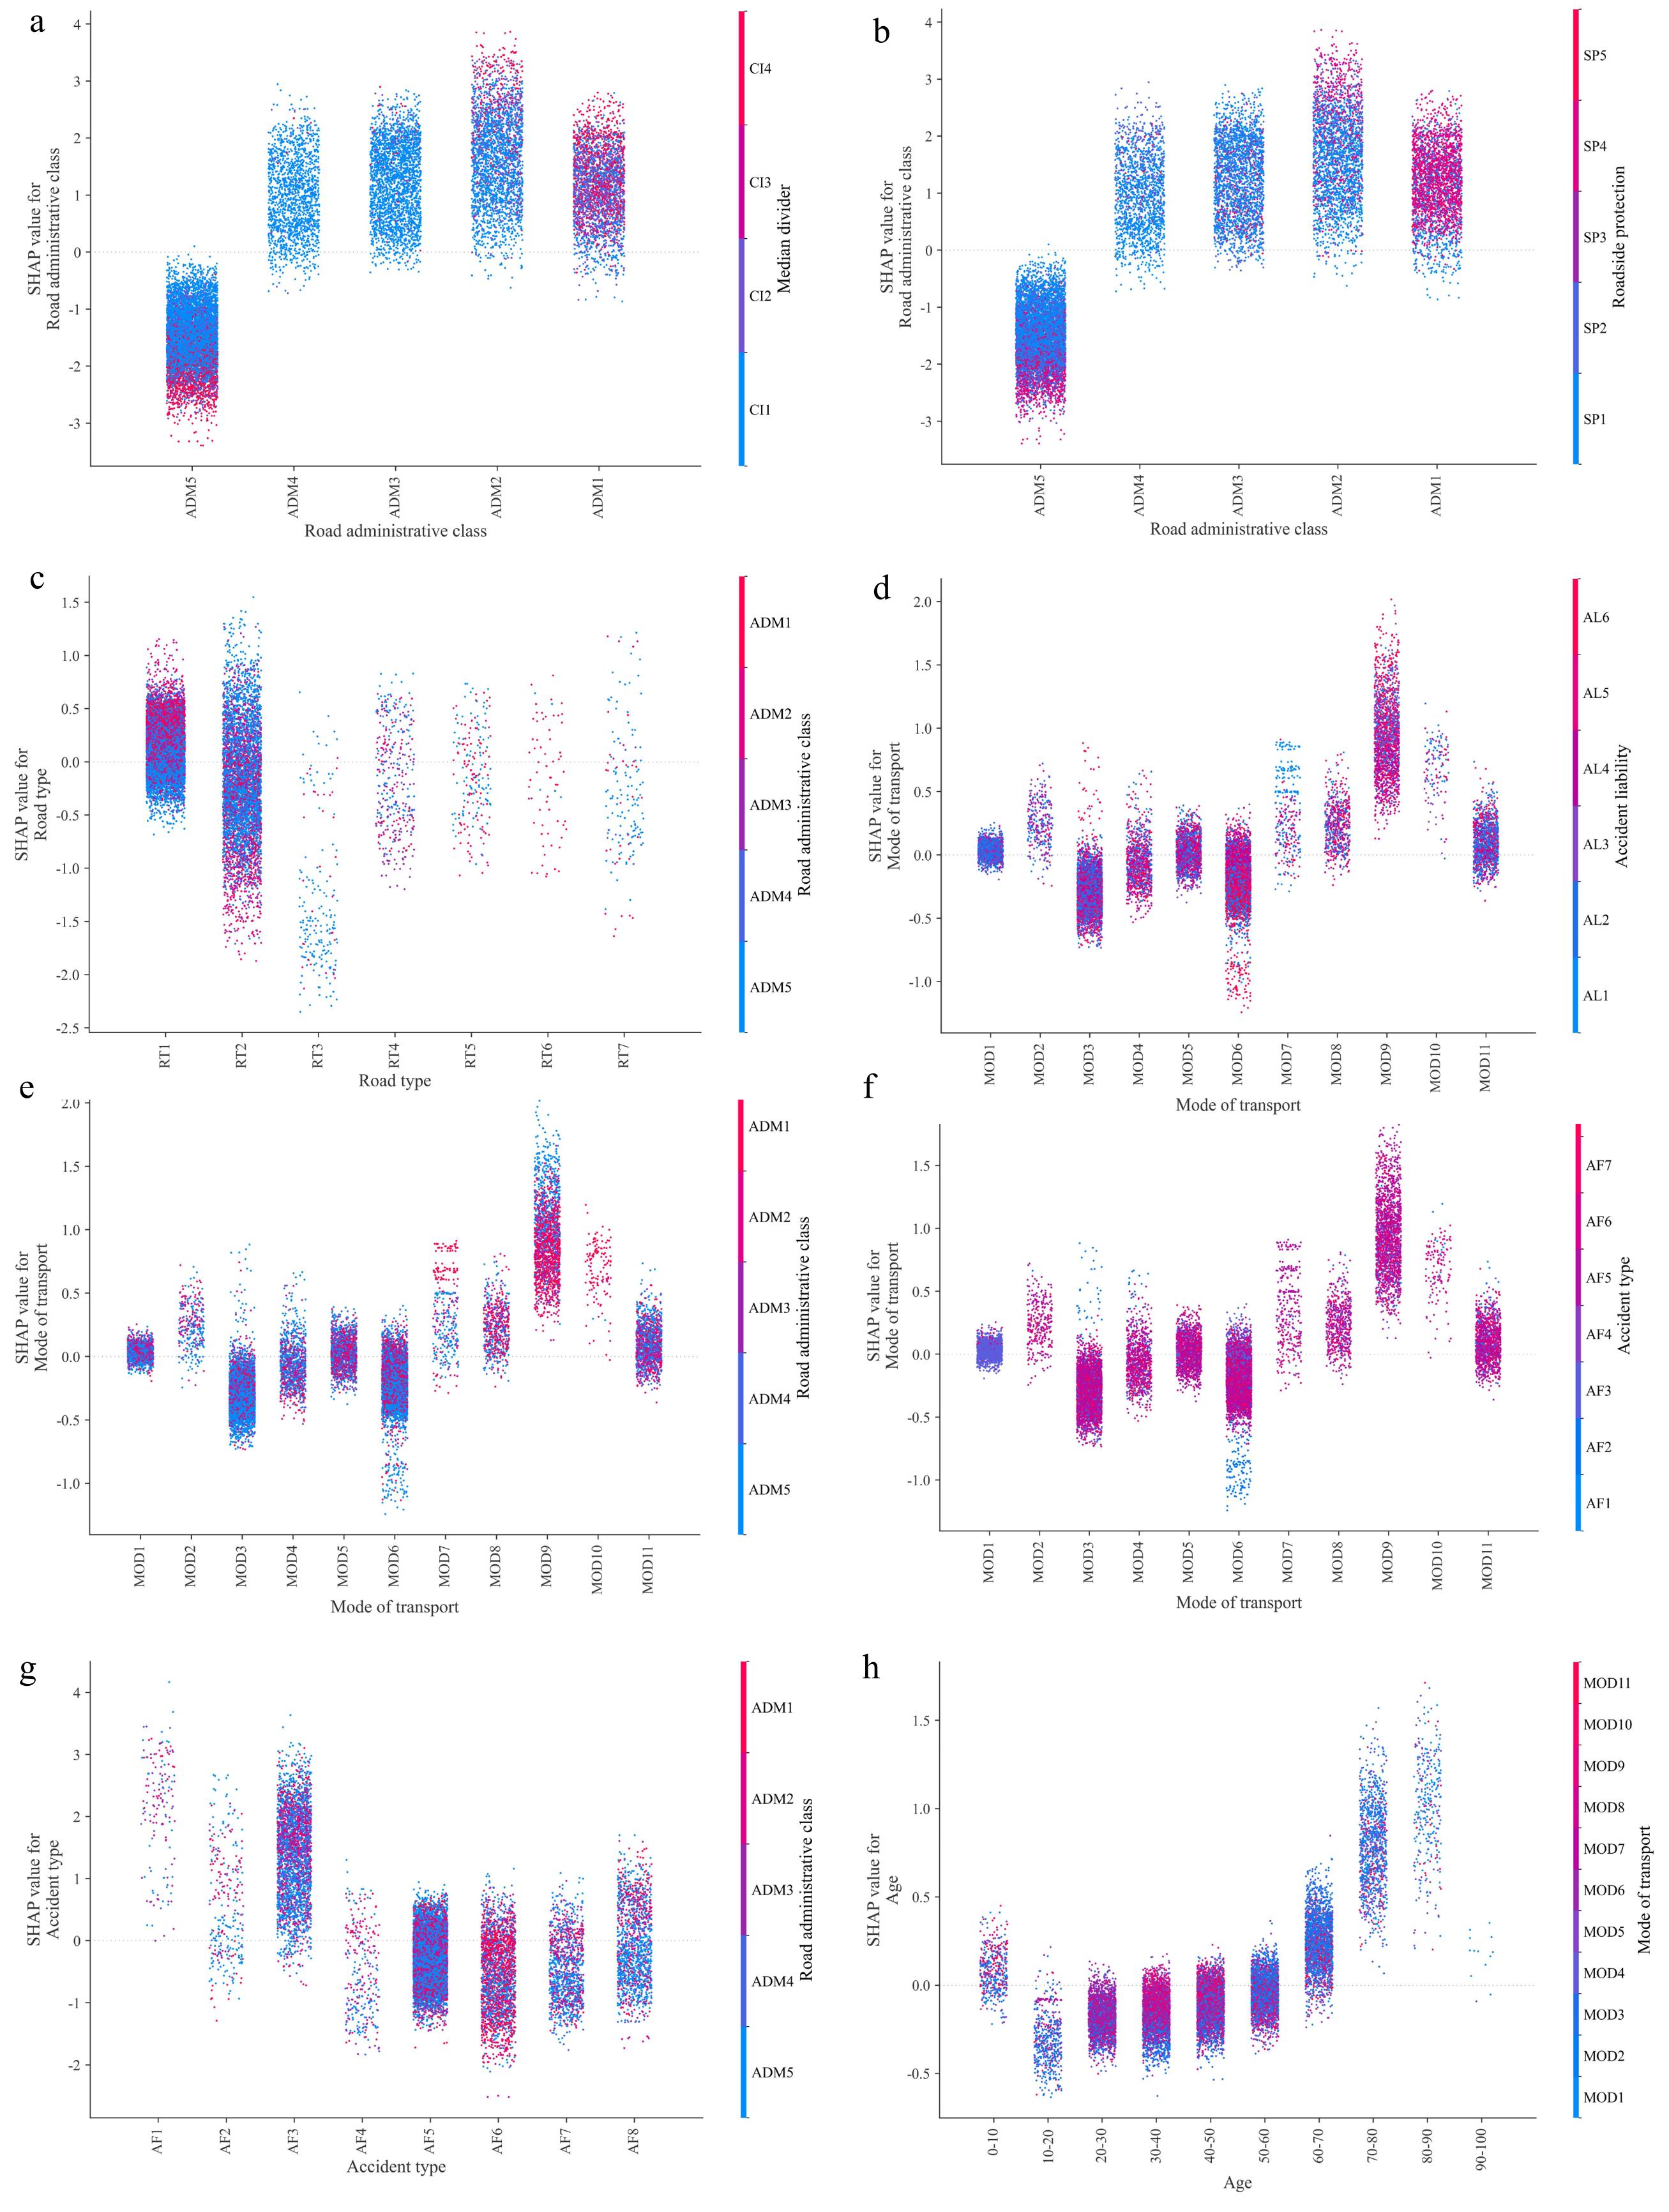
Figure 6.
Interaction effects of contributing factors for fatal accidents: (a) road administrative class vs median divider, (b) road administrative class vs roadside protection, (c) road type vs road administrative class, (d) mode of transport vs accident liability, (e) mode of transport vs road administrative level, (f) mode of travel vs accident type, (g) accident type vs road administrative class, and (h) driver age vs mode of transport.
Figure 6a shows that traffic fatalities are significantly more likely to occur on high-grade roads than on low-grade roads. High-grade roads usually have higher speed limits, which pose a greater threat to motor vehicles and pedestrians[43]. Guardrails on urban roads decrease the probability of fatalities, indicating that improving safety facilities on urban roads is conducive to reducing traffic accident severity. Counterintuitively, guardrails in the median or at the roadside on national and provincial roads increase the probability of fatalities, probably because guardrails on high-grade roads may give some drivers a false sense of security such that they feel their safety is guaranteed. Drivers may relax their vigilance accordingly, which compromises the driver's hazard perception and caution to some extent. Figure 6b illustrates that different types of roadside protection have a similar effect as a median divider on accident fatalities.
Figure 6c illustrates that the road segment feature on high-grade roads increases the probability of fatalities, which is consistent with the results shown in Fig. 6a and b. Figure 6d indicates that buses, trucks, and combination vehicles significantly increase the probability of fatal traffic accidents, whereas electric bicycles and motorcycles decrease the probability. Pedestrians have a high fatality rate and low level of accident liability, indicating that pedestrians involved in a collision are almost always victims and are especially vulnerable when walking on or along roadways. Specifically, compared to trucks, buses, cars, etc., pedestrians are more fragile, move much slower, and do not have inherent devices (such as lighting systems, cameras, advanced driver assistance systems, etc.) to help them obtain information about their surroundings accurately and effectively[44]. Moreover, electric bicycles and motorcycles that are fully responsible for the cause of an accident increase the likelihood of fatal accidents, indicating that these modes of transport need to be given more attention and protection than other modes. Interestingly, cars correlate with a decrease in the likelihood of fatalities when car drivers have full accident liability.
Figure 6e shows that most combination vehicles travel on national roads and significantly increase the accident severity level compared to other modes of transport, which is a finding that is consistent with that of a previous study[45]. Interestingly, buses on high-grade roads increase the probability of fatal accidents, and large trucks on low-grade roads also increase the probability.
Figure 6f shows that side collisions account for the most significant proportion of accident types. Additionally, an electric bicycle overturning or hitting a fixed object increases the probability of a fatality.
Figure 6g indicates that overturning and bumping into pedestrians increase the probability of fatalities overall. Common sense also suggests that rear-end collisions and hitting pedestrians on high-grade roads will lead to higher fatality rates. Specifically, with higher speed limits on high-grade roads, a rear-end collision has a powerful impact, and pedestrians tend to be injured more severely accordingly[46]. Therefore, conspicuous traffic signs are necessary on high-grade roads to remind drivers continuously to keep a safe distance and watch out for pedestrians.
Figure 6h shows that people aged 20 years and younger, and 60 years and older are more vulnerable than people in other age groups and, therefore, have a higher probability of being killed in traffic accidents, which is a finding that is consistent with a previous study[47]. The highest proportion of those who drive trucks and combination vehicles is associated with people aged 30 to 40, and the fatality rate in this age group is higher than for small and light vehicles (bicycles, electric bicycles, motorcycles, tricycles, and cars). The reasons for this finding probably include that this age group is more confident in their driving skills, and large vehicles (trucks and combination vehicles) pose a greater threat to roadway safety, resulting in a higher fatality rate.
-
This paper proposes a novel framework for predicting and analyzing traffic accident severity that balances accuracy and interpretability. The framework uses traffic accident data collected by the traffic department of a city in Jiangsu Province, China, from 2016 to 2020.
A total of 28 categorical features related to people, vehicles, roads, the environment, and accident characteristics were used to build a classification model with CatBoost and interpret the results using SHAP.
CatBoost was compared with five widely used algorithms, including LightGBM, XGBoost, GBDT, ANN, and MNL. The results show that CatBoost outperformed the other models, achieving a precision of 0.912, recall of 0.942, and F1-score of 0.927. This confirms its advantage in handling categorical data for accident severity prediction.
SHAP analysis indicated that road administrative class, accident cause, and accident type were the most influential features. Elevated roads, crashes occurring between 2:00 and 5:00 a.m., and substandard vehicles significantly increased the risk of fatal accidents. These findings provide useful insights for identifying high-risk conditions and guiding safety improvements.
In terms of practical application, the government can refer to these results when formulating traffic safety policies, such as enforcing stricter controls on substandard vehicles, supporting the development of driver distraction warning systems, and installing guardrails and warning signs on high-grade roads.
Future research will integrate multi-source data (e.g., vehicle kinematics, driving videos, and accident scene images), apply deep learning methods for improved accuracy, and compare different interpretable machine learning approaches to enhance the depth of causal analysis.
This research was supported by the Key R&D Program of Ningxia Hui Autonomous Region (Grant No. 2022BEG02017).
-
The authors confirm their contribution to the paper as follows: study conception and design, software, formal analysis, data collection, writing − draft manuscript preparation: Xie Z; supervision, conceptualization, funding acquisition: Ma Y; project administration: Ma Y, Chen S, Liu H; data curation: Ma Y, Chen S; writing − reviewing and editing: Ma Y, Khattak AJ, Chen S. All authors reviewed the results and approved the final version of the manuscript.
-
The data used in this study cannot be shared due to confidentiality agreements with the data provider.
-
The authors declare that they have no conflict of interest.
- Copyright: © 2025 by the author(s). Published by Maximum Academic Press, Fayetteville, GA. This article is an open access article distributed under Creative Commons Attribution License (CC BY 4.0), visit https://creativecommons.org/licenses/by/4.0/.
-
About this article
Cite this article
Xie Z, Ma Y, Khattak AJ, Chen S, Liu H. 2025. An interpretable machine learning-based framework for fatal traffic accident prediction and causal analysis. Digital Transportation and Safety 4(4): 215−226 doi: 10.48130/dts-0025-0021 

An interpretable machine learning-based framework for fatal traffic accident prediction and causal analysis
- Received: 16 January 2025
- Revised: 14 April 2025
- Accepted: 19 May 2025
- Published online: 31 December 2025
Abstract: Traffic accidents are a leading cause of unnatural human fatalities. Numerous researchers have investigated ways to predict traffic fatalities and interpret the prediction results. However, they have been unable to balance prediction accuracy and interpretability, and they usually lack emphasis on fatal accidents due to the small sample size of fatalities in the dataset. To address these issues, this paper proposes a framework for traffic accident severity prediction with four steps. First, the traffic accident dataset, which includes features related to people (demographics), vehicles, roads, the environment, and accidents, is constructed and preprocessed. Then, the CatBoost algorithm is employed to classify traffic accident severity (fatal/non-fatal). Five other algorithms - LightGBM, XGBoost, a gradient boosting decision tree, an artificial neural network, and multinomial logit - are employed for comparison. Next, various evaluation metrics are used to comprehensively evaluate the prediction results. Finally, the Shapley additive explanation (SHAP) algorithm is used to interpret the effects of the factors that contribute to fatal traffic accidents. The results show that CatBoost significantly outperforms the other five algorithms, with precision, recall, and F1-score values of 0.912, 0.942, and 0.927, respectively. Moreover, the SHAP algorithm intuitively shows the relationship between fatal accidents and contributing factors. Specifically, the presence of high-grade roadways, bad weather, substandard vehicles, and large trucks significantly increases the probability of traffic accident deaths. The proposed framework is efficient for traffic fatality prediction and interpretation and thus can provide theoretical guidance for transportation infrastructure planning, driver training, and traffic law formulation.