


-
With the accelerating pace of urbanization and motorization, urban traffic congestion has become increasingly severe in recent years. In addressing the issue of traffic congestion, many approaches and trials on management have been implemented[1−3]. For instance, Athens and Mexico City alternate restrictions on specific license plate endings each week to control vehicle usage[4]. Singapore and Tokyo employ additional charges, such as congestion fees and parking fees, during peak hours in controlled zones[5]. Melbourne, Sydney, and London utilize real-time traffic information via GPS, mobile phones, cameras, and online resources to provide drivers with optimal travel routes, while Vancouver and Curitiba focus on reducing urban traffic volumes through market regulations, government oversight, and public awareness[6,7]. Beijing restricts private vehicle numbers through monthly license plate lotteries and enforces area-based vehicle restrictions based on plate numbers to control overall traffic volumes[8]. Shanghai emphasizes the park and pide (P+R) strategy for connecting with public transport, and sets dedicated bicycle lanes to enhance non-motorized transportation options[9].
These congestion management experiences reveal that most of these measures for addressing traffic congestion are primarily expected to reduce the travel demands at the expense of somewhat limiting travel freedoms. Policies like "ring + radial" in Paris and the "Dual Ten Project" in Beijing that highlight road structure management have been discussed worldwide[10]. Furthermore, these strategies on the supply side primarily focus on increasing the traffic capacity of the main roads at the city level, i.e, improving traffic macrocirculation[11]. By contrast, traffic microcirculation, which is mainly composed of branch roads, also plays a crucial role in addressing the issue of traffic congestion. Traffic microcirculation enables branch roads to divert or gather from the macrocirculation of urban traffic effectively, thus alleviating congestion on main arteries[12,13]. However, few studies have paid attention to addressing traffic congestion from the perspective of traffic microcirculation.
Simultaneously, the rapid urbanization in China has brought challenges for urban areas with old neighborhoods. Traffic congestion in old neighborhoods is becoming increasingly severe, causing urban problems such as severe air pollution, increased economic and social costs, and an increased risk of traffic accidents[14,15]. At the same time, with the rapid progress of urbanization in China, urban planning has gradually evolved from the previous "incremental planning" model to the "stock planning" model[16]. The areas with old neighborhoods are usually the focus of urban renewal, indicating the necessity of improving urban quality. In particular, these areas contain microcirculation roads and serve as core congestion areas due to issues like traffic congestion, parking difficulties, and slow traffic flow. Optimizing the traffic condition of urban roads and improving the connectivity of microcirculation in these areas are the major challenges for urban renewal in old neighborhoods, particularly as traffic demand continues to rise in these areas.
Therefore, this study focused on alleviating traffic congestion in urban areas with old neighborhoods in Chinese cities through proposing a framework for optimizing traffic microcirculation in old neighborhoods. We take Tianjin as a case study to explore the key determinants that affect the operation of the microcirculation system, followed by identifying the traffic characteristics and problems through a field survey. Through scenario simulations and bi-layer planning models, the study seeks to optimize and improve traffic microcirculation in old neighborhoods. The study contributes to planning strategies for improving the microcirculation in old neighborhood, thereby supporting high-quality urban renewal in old metropolitan neighborhoods.
-
The theory of microcirculation, originally a concept in medical science, typically refers to the microvascular circulation system, which includes capillaries, arterioles, venules, and other microvascular structures. The microcirculation system is designed to transport oxygen and nutrients to tissue cells, regulate blood flow, and maintain a normal metabolism. Microcirculation plays a crucial role in maintaining the internal environmental stability of our body and supporting the normal physiological functions of organs[17].
In recent years, scholars have increasingly extended the concept of medical microcirculation to urban transportation systems and constructed the framework of urban traffic microcirculation. The urban traffic microcirculation theory views the city as an organic whole, where main and secondary roads are likened to the "arteries" of the urban organism, while branch roads and residential roads are akin to the "capillaries". Traffic flow represents the "blood" of the urban organism, distributed through these "capillaries" branching off from the "arteries" (Fig. 1). Traffic microcirculation can be seen as a microscopic circulation network within the urban traffic system, distributing the traffic flow from the main arteries to branch roads, thereby providing efficient travel routes for residents and vehicles[18,19].
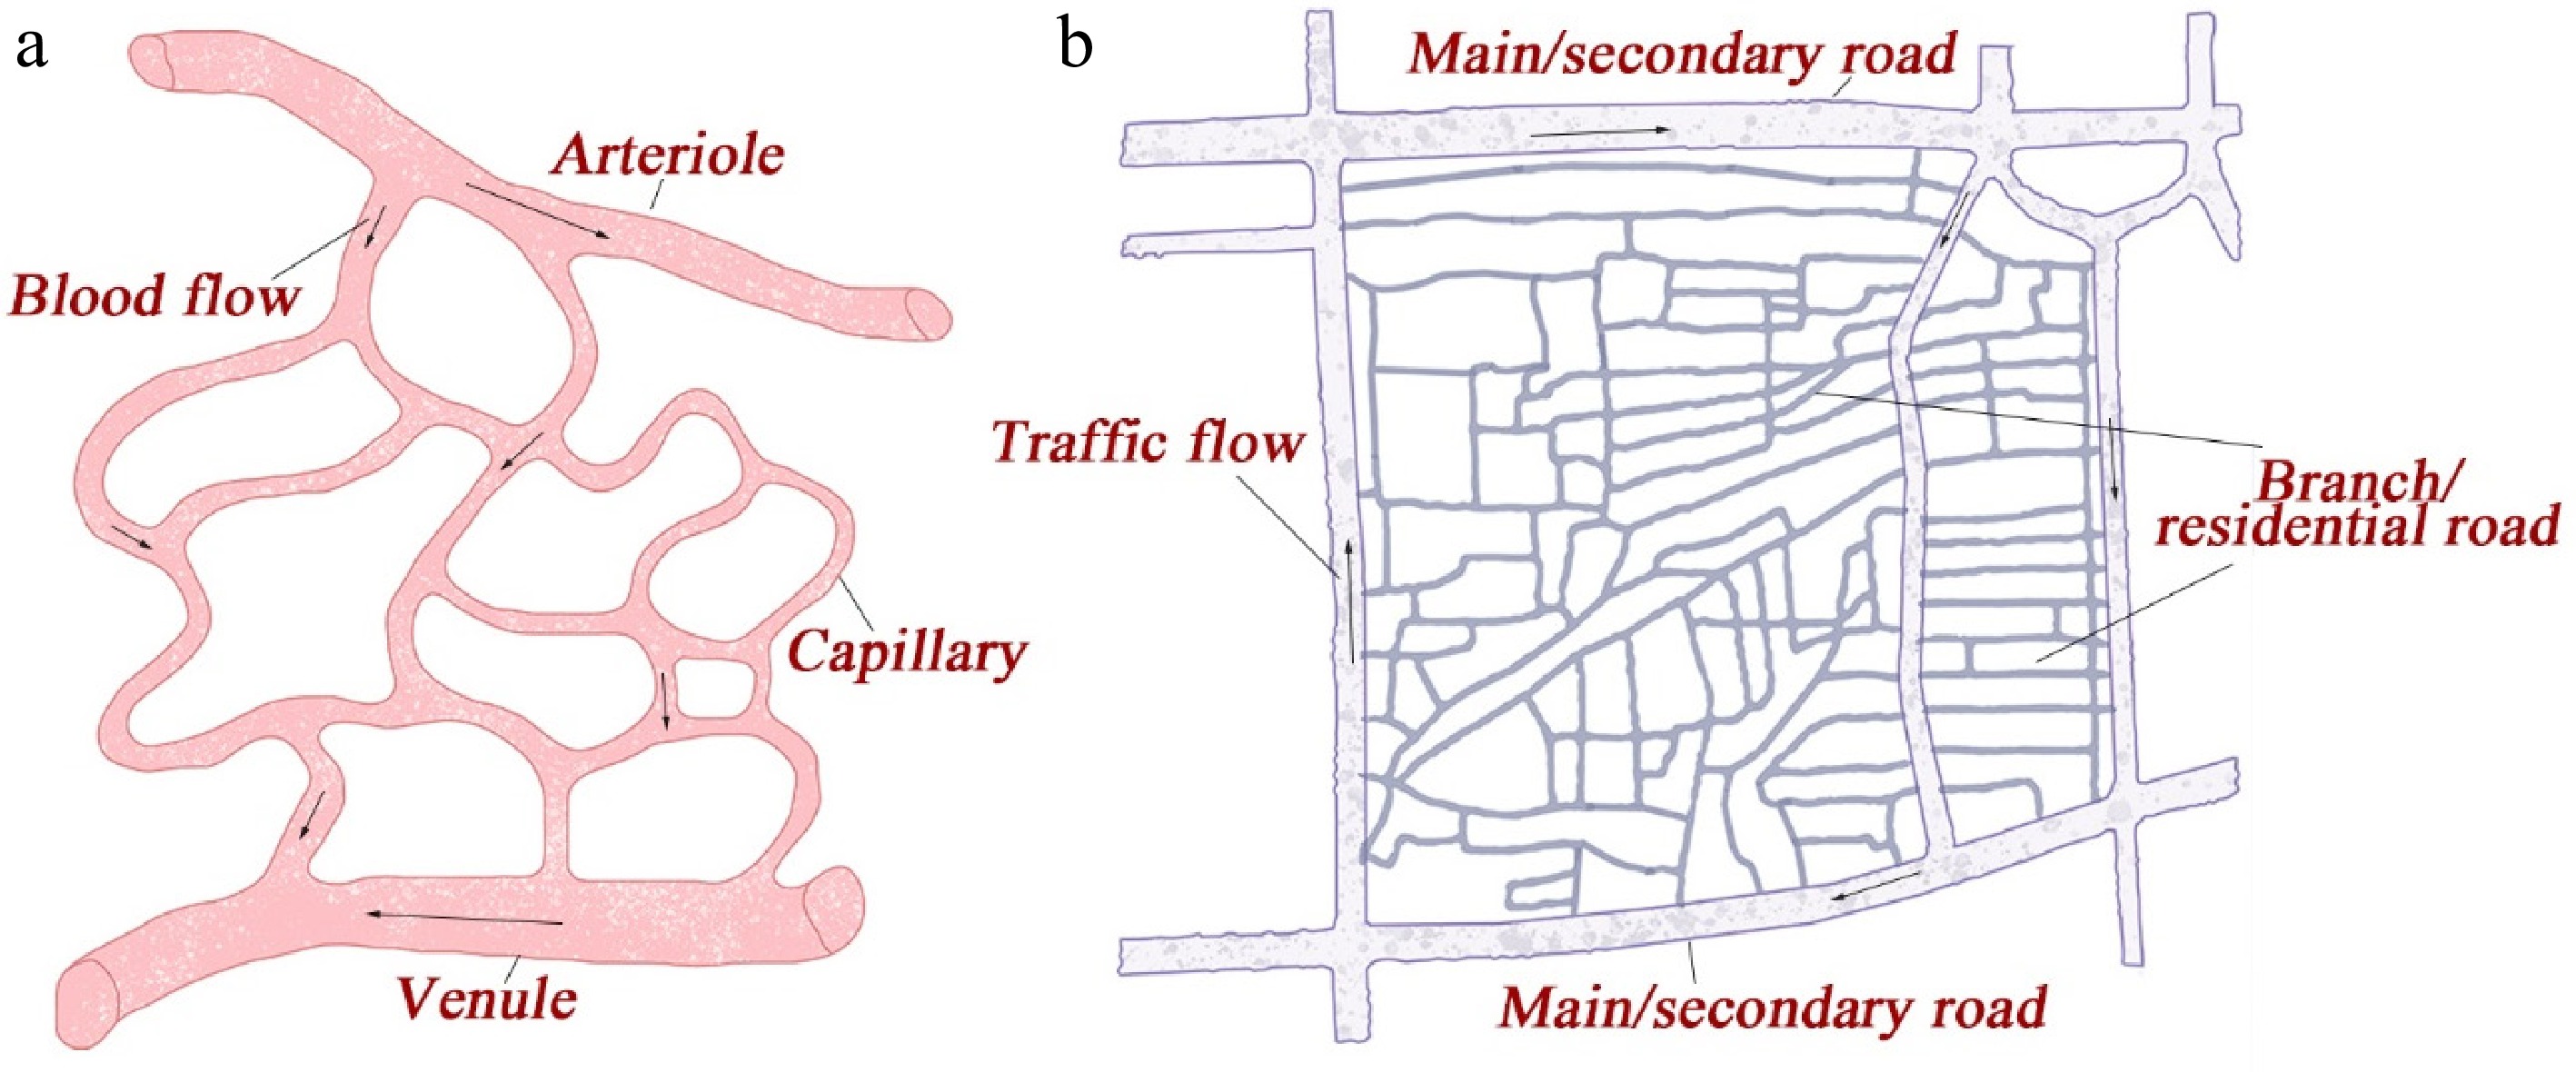
Figure 1.
(a) Microvascular circulation and (b) traffic microcirculation system.
In this definition of traffic microcirculation, branch roads play a crucial role as the core elements that constitute the system. Typically, branch roads facilitate the connections between major traffic arteries and the surrounding communities, residential areas, and commercial districts[20]. They are pivotal in traffic microcirculation by diverting or gathering from the macrocirculation of urban transport, thus alleviating congestion in the main arteries and providing residents with convenient travel routes. The design and layout of branch roads have significant importance in traffic planning, as they can influence the operational efficiency of the entire traffic system and the urban traffic environment[12].
Furthermore, from the perspective of traffic microcirculation, neighborhoods where the travel demand is usually generated from can be defined as relatively enclosed areas within cities surrounded by main roads, secondary roads, and branch roads[21]. They serve as the basic spatial units for analyzing traffic flows. Within the broad concept of traffic microcirculation, traffic microcirculation is not only composed of urban roads but also includes the traffic flow along the roads and the areas that the urban roads serve. Generally, traffic within neighborhoods tends to be dense, which requires thoughtful planning and management to ensure smooth traffic flow and convenient travel mobility.
Traffic problems in old neighborhoods
-
Old urban neighborhoods typically refer to areas within a city characterized by historical significance, aged infrastructure, and outdated transportation conditions. These neighborhoods may serve as core areas of a city in the early stage and have advantages such as convenient transportation, high pedestrian traffic, and commercial concentration. The old neighborhoods in the urban centers remain highly valued due to their advantages in terms of transport accessibility and commercial vibrancy[22]. However, these areas also face many traffic challenges, which primarily present four aspects: street traffic congestion, insufficient parking spaces, poor road connectivity due to neighborhood walls, and inadequate microcirculation roads that fail to effectively distribute the traffic flow[23].
The inadequate integration of old residential areas with urban traffic leads to mixed flows of bicycles, motor vehicles, non-motorized vehicles, and pedestrians, causing congestion at the entrances and exits of the neighborhoods[24,25]. Meanwhile, the limited parking spaces result in streets and squares frequently being dominated by motor vehicles, which hinders public activities and leads to underutilization of the public spaces' resources[26]. This issue exacerbates traffic congestion and reduces the quality of life for residents. Additionally, it increases the risk of traffic accidents and makes it more difficult for emergency vehicles to pass through. Poor road connectivity in old neighborhoods is often exacerbated by the presence of walls and gated communities, which restrict the flow of traffic between adjacent areas. These physical barriers lead to a lack of direct routes and force drivers to take longer, more convoluted paths, contributing to traffic congestion on main roads[20]. The fragmented road network not only reduces accessibility but also hinders emergency response times and the overall mobility of the community. Moreover, inadequate microcirculation roads in old neighborhoods contribute to inefficient traffic distribution within the area[18]. The secondary roads are often narrow, poorly maintained, and unable to handle the volume of traffic needed to relieve pressure in the main thoroughfares. The lack of a well-planned microcirculation system leads to frequent traffic jams and increased travel times, particularly during peak hours. As a result, the overall traffic flow within the neighborhood remains chaotic and congested, diminishing the quality of life for residents.
Currently, insufficient overall attention has been paid to traffic microcirculation in old urban neighborhoods. There is a need for further exploration of the unique characteristics of traffic microcirculation in these areas through conducting quantitative analyses across multiple periods and multiple modes to address variations in the efficiency of microcirculation operations.
Relevant planning of the traffic microcirculation road network
-
Urban road planning is the major planning practice related to the traffic microcirculation. Urban road planning requires different types of roads to follow a hierarchical structure to make the urban traffic operate efficiently. Moreover, the open block theory advocates for the removal of closed walls and barriers within neighborhoods to promote free passage and open communication between inside and outside the block, enhancing the connectivity and vitality of urban public spaces[27,28]. The concept of "narrow streets–dense road network" aims to optimize traffic flows by reducing road widths, which is expected to increase the road network's density[29]. Furthermore, this strategy can enhance the convenience of walking and cycling, thereby improving accessibility[30,31]. In light of this, these items are important planning practices for optimizing traffic microcirculation.
In addition to the planning strategies used to improve traffic microcirculation at the city level, some scholars and experts in the transportation sector have also proposed some theoretical insights to support traffic microcirculation planning. In 1980, Poulton proposed that cost-effectiveness in residential areas can be enhanced through optimizing the lower-grade roads, such as increasing the supply of secondary and tertiary roads[32]. Wright et al. advocated for organizing and managing traffic circulation routes through guided vehicle paths[33]. Furthermore, works such as Refocusing Transportation Planning for the 21st Century by Meger in 2001[34] and Reducing Traffic Congestion in Los Angeles by Sorensen et al.[35] have extensively researched traffic microcirculation. They analyzed the impacts of the road network's structure and land use layout on urban development. These studies focused on theoretical research covering the road infrastructure, traffic management, and the road network's layout. Meanwhile, technical research into areas such as safety assessment models of the urban road system, travel time network equilibrium models, and Intelligent Transportation Systems (ITS) have been also steadily advanced[36].
Moreover, many cities have adopted various measures to improve their traffic conditions. Common practices include increasing the number of branch and tertiary roads to form a dense grid-like road network structure. For instance, adopting a "checkerboard" layout to disperse the traffic flow helps alleviate pressure on the main arteries. Increasing the road network's density and diversifying travel paths can reduce congestion on main roads and enhance the utilization of secondary roads and tertiary streets[37]. In light of this, this approach expects to improve the overall efficiency of the road network by reducing the delay times and enhancing the traffic flow. Additionally, integration among the different transport modes is encouraged[38]. Moreover, planning for slow-moving traffic, an emphasis on transportation equity, and improvements of the traffic signage and control facilities have been also highlighted[39]. For example, the central business district (CBD) in the downtown Boston area features dense building spaces and a grid-like road system with an intersection spacing ranging from 60 to 200 m. This layout enables the area to accommodate high-intensity traffic flows and improve the roads' operational efficiency. In central London, the road network is dense with a balanced ratio of main and branch roads, and intersection spacing ranges from 250 to 700 m. By implementing congestion charging zones, redesigning intersections, and introducing one-way streets, traffic congestion and vehicle volumes have been collectively reduced by 30% and 15%, respectively. Barcelona's downtown area also boasts a dense road network with nearly square-shaped blocks of approximately 130 m per side.
Optimization of the traffic microcirculation road network
-
Evaluating the performance of traffic microcirculation is the basis of optimizing it. The performance can be evaluated either statically or dynamically. For evaluating the static performance of traffic microcirculation, the physical attributes of urban road networks, such as road density and intersection density were the indicators initially adopted[40,41]. Subsequently, the technical characteristics of urban road networks, such as network connectivity and non-linearity coefficient, have been explored. Furthermore, the static performance has extended to the societal, economic, and environmental effects of traffic microcirculation. For example, accessibility, safety, and CO2 emissions are the most commonly applied indicators. More importantly, some scholars have also conducted subjective evaluations of traffic microcirculation systems from a satisfaction perspective, which can be also viewed as an approach to measuring the static performance[42].
With the continuous development of open platform data and enhanced data acquisition capabilities, there has been an emergence of evaluations focusing on the dynamic characteristics of traffic microcirculation, i.e., the dynamic performance[43,44]. For instance, indicators such as vehicle diversion time, travel time, delay time, vehicles' passage time through the network, average network travel speed, parking turnover rate, Origin-Destination (OD) flow diversion distance, section saturation, intersection impedance, network saturation, network load, and the congestion ratio have been commonly used to measure the performance of traffic microcirculation[45].
The object of optimizing traffic microcirculation is to improve its static and dynamic performance. In line with planning measures and practices, optimization involves the following aspects: (1) adjusting road layouts, intersection designs, and lane configurations to enhance traffic flow within the microcirculation; (2) optimizing traffic signals within the microcirculation, including signal timing and phase settings, to adjust the waiting times; (3) implementing traffic restrictions and vehicle controls to manage traffic volume within the microcirculation so as to reduce the likelihood of traffic jams and accidents; (4) enhancing support for the public transport on the basis of traffic microcirculation, which may encourage residents to shift their trips from private cars to public transport; and (5) rational planning of parking facilities, including parking lots and spaces, to minimize roadside parking and parking chaos so as to improve the parking environment within the microcirculation system.
-
The methodological framework proposed in this paper includes three major parts (Fig. 2), with several steps.
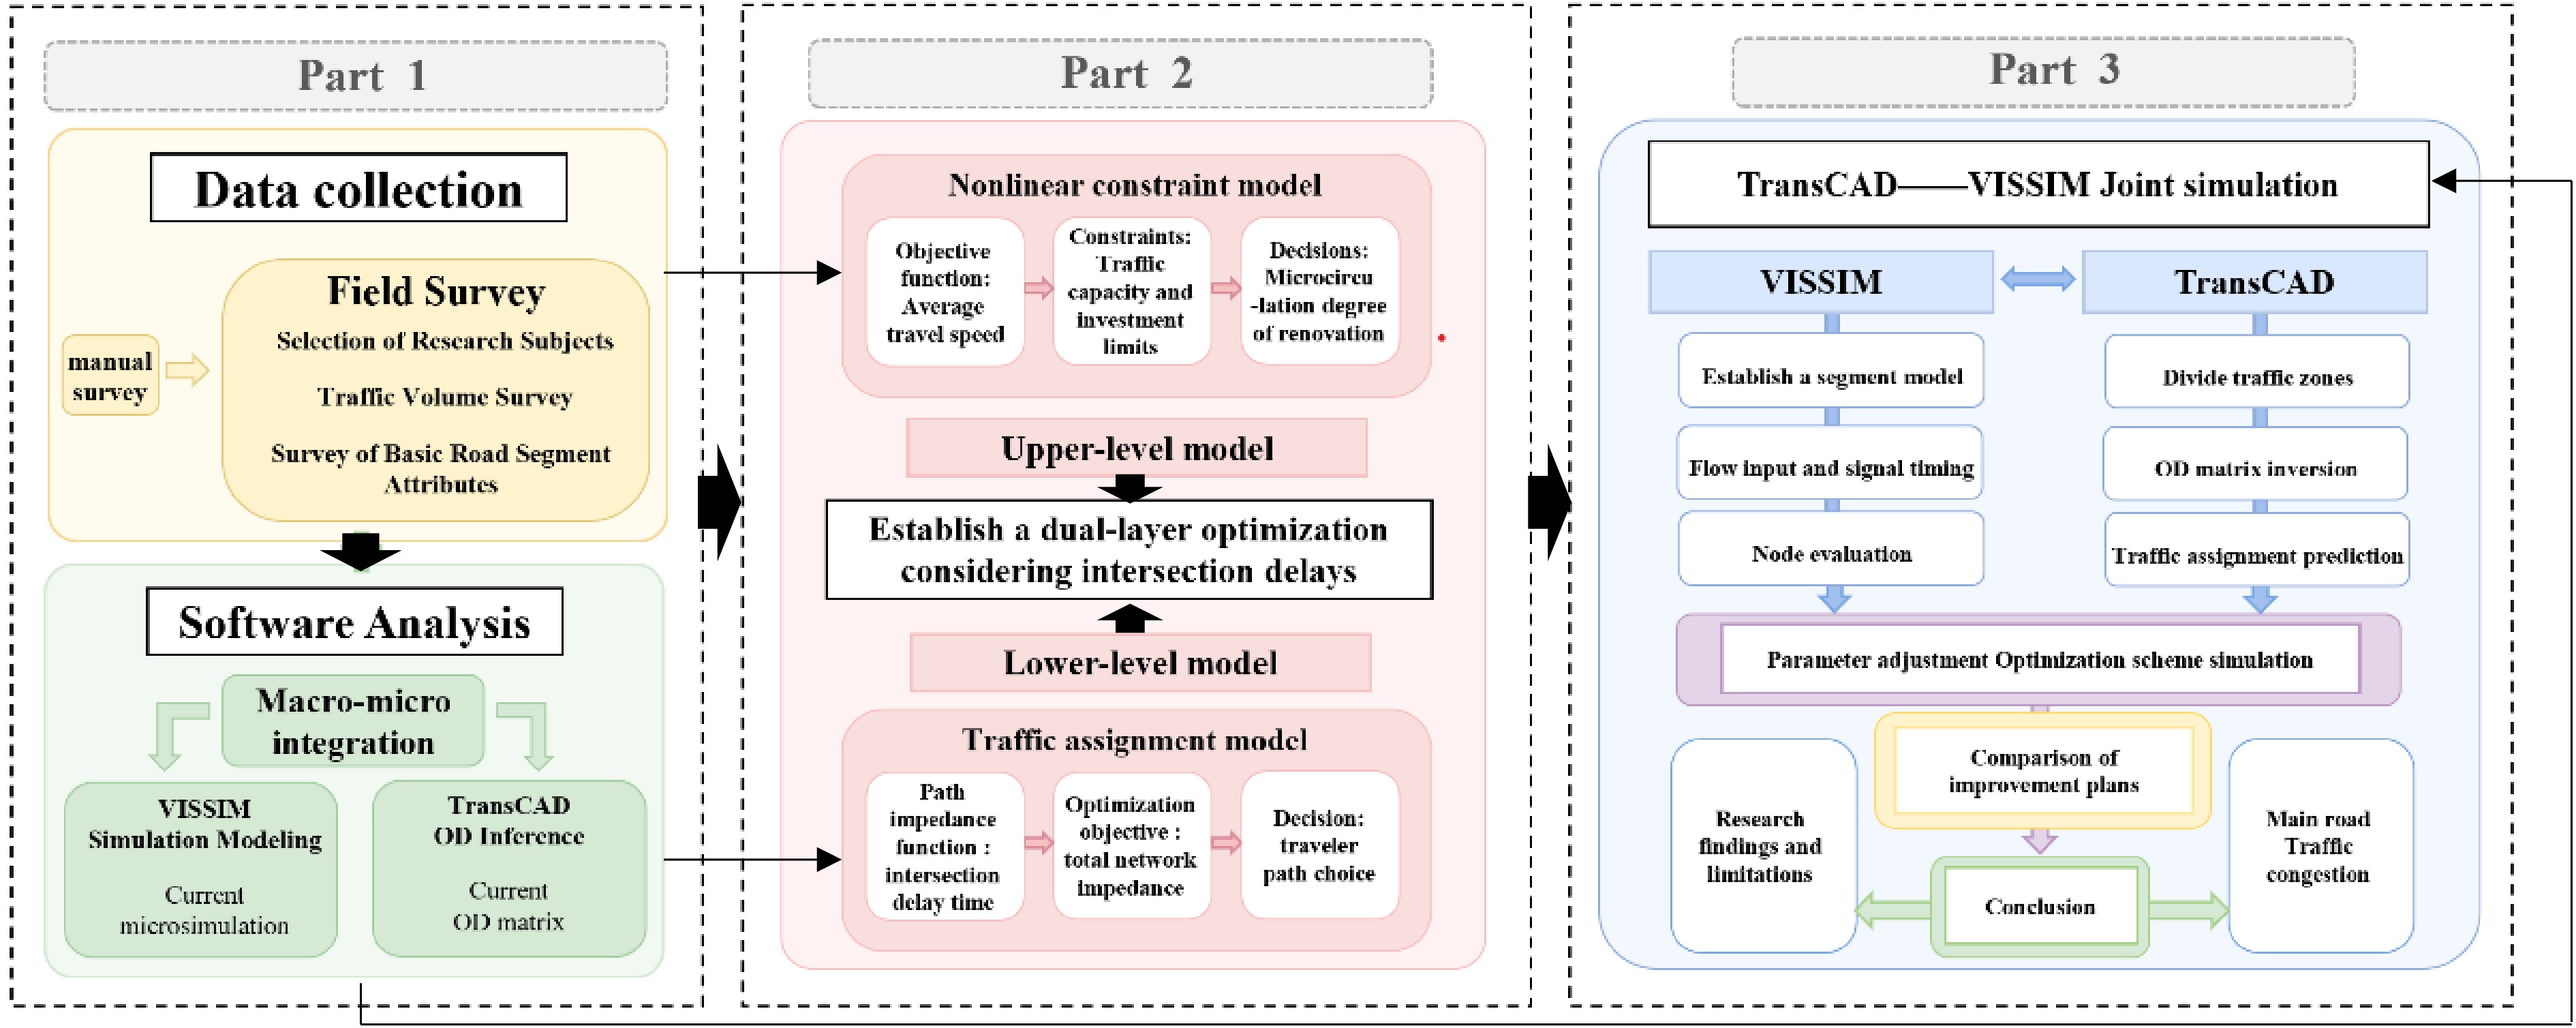
Figure 2.
Methodological framework.
Data collection
-
Traffic volumes and basic characteristics of the road sections were collected on site during the morning and evening peak hours (7:00–8:00 and 17:00–18:00) using the manual counting method. Traffic volume conversion was performed on the traffic volume survey data using the equivalent small car conversion factor to complete the data collection process.
According to the traffic data from the field research, macroscopic analyses of the distribution of flow and congestion for the road network were conducted in TransCAD, followed by selecting the representative road sections for microscopic simulation modeling. The macroscopic analysis of the road network's flow distribution and congestion by TransCAD helped in selecting the representative road sections for microscopic simulation modeling, which was established in VISSIM software. Vehicle flow inputs and signal timing parameters were configured in VISSIM. The evaluations of intersection nodes and congestion of road sections, focusing on the serious congestion of the current road sections, were carried out through fixed-time traffic simulations.
Through the combined analyses of TransCAD prediction and VISSIM simulation, we analyzed the congested intersections and road sections comprehensively from both the macroscopic and microscopic perspectives. Furthermore, the key determinants that affect the congestion of traffic microcirculation systems in areas with old neighborhood were explored. These significant determinants provided an important basis for constructing the bi-level multi-objective optimization model.
Constructing the bi-level multi-objective optimization model
-
A bi-level traffic microcirculation system optimization model considering intersection delay was developed, and the model was constructed using MATLAB programming software and solved using genetic algorithm to propose a road network optimization strategy.
Upper-level model
-
The upper-level model uses the average travel speed of the road network as the objective function. Constrained by traffic capacity and investment amounts, the model establishes a non-linear constraint so that it can compare the objective function values of different renovation schemes. Finally, the optimal scheme can be then selected.
Objective function
-
The objective function of the upper-layer model is set as the average travel speed
$ \bar{V} $ $ \underset{}{\max}\bar{V}=\dfrac{\sum _{b\in B}\left(\dfrac{{l}_{b}}{{t}_{b}}{N}_{b}\right)+\sum _{a\in A}\left(\dfrac{{l}_{a}}{{t}_{a}}{N}_{a}\right)}{{N}_{total}} $ (1) where,
$ \bar{V} $ Constraint conditions
-
① Traffic capacity constraints. The reconstruction degree of each alternative road must meet the requirements of its reconstruction capacity:
$ C \leq {C}_{b} \leq {C}_{max} $ (2) where, Cb refers to the retrofitted capacity of the alternate road b, C is the existing capacity of alternative road b, and Cmax is maximum capacity of the alternative road b.
② Investment limit. When carrying out urban traffic transformation, it is necessary to strictly control the transformation cost, and the total cost of road network transformation must not exceed the preset investment limit,
$ 0 \leq Z \leq {Z}_{max} $ (3) where, Zmax refers to total investment quota of CNY 10,000, and Z means the total cost of renovating the road network renovation, which refers to the cost of transforming the capacity of the alternative road b per unit length from C to Cb, i.e., CNY 10,000.
Lower-level model
-
In the process of traffic allocation, the constructed bi-level programming model usually takes the travel time of vehicles on the road section as the road's impedance, while ignoring the impact of intersection delay on the travel impedance. In fact, the proportion of intersection delay within the driver's travel time is even greater than that of the time of the vehicle on the road section. Thus, the intersection delay has a great impact on the traveler's behavior choice. In light of this, this paper constructs the road resistance function by combining the intersection delay and the travel time on the road section.
Road resistance function
-
① Travel time on the road section. The driving time the vehicle on the road section (R) can be calculated through the Bureau of Public Roads (BPR) function as follows:
$ \mathrm{R}={\mathrm{R}}^{\left(0\right)}\left[1+0.15{\left(\dfrac{\mathrm{N}}{\mathrm{C}}\right)}^{4}\right] $ (4) where, N refers to the traffic volume on the road section to be analyzed, C is the capacity of the road section, and R(0) is the free travel time of the road section, where R(0) = l/v, in which v is the design speed of the analyzed section and l is the length of the analyzed section.
② Intersection delay. Intersection delay is related to many factors such as the intersection's type and geometry, traffic conditions, and the number of traffic accidents. The actual value of intersection delay is not completely consistent with the reference value. Generally, the reference value of intersection delay corresponds to the ideal condition, namely, no accidents or traffic control.
The urban traffic microcirculation system consists of branch roads, and the intersections involved are not generally equipped with signals. Thus, the intersection delays should be calculated in accordance with the intersection types. (1) When the branch road intersects with the main road, a rule where the branch road only allows right-turn crossing is adopted. At this time, the traffic flow on the main road does not cause delay, while the delay of vehicles on the branch road is equal to the sum of reaction delay and the acceleration or deceleration delay. The empirical reference value is 6.5 s, namely, De = 6.5 s. (2) When the branch road intersects with the secondary road or the branch road, the traffic flow on the branch road must wait for a suitable gap to appear before passing on to the secondary road. The delay is calculated as follows:
$ {D}^{e}=\dfrac{3600}{{C}^{e}}+900T\left[\left(\dfrac{N}{{C}^{e}}-1\right)+\sqrt{{\left(\dfrac{N}{{C}^{e}}-1\right)}^{2}+\dfrac{\left(\dfrac{3600}{{C}^{e}}\right)\left(\dfrac{N}{{C}^{e}}\right)}{450T}}\right]+5 $ (5) where, T refers to duration of the analysis period (for example, the analysis period is 15 minutes, T = 0.25) and Ce is the capacity of the entrance road at intersection e.
③ Road resistance function. The travel time of the vehicle on the road is composed of the travel time (R) of the vehicle on the road section and the entrance delay (De) of the corresponding intersection. The road resistance function is constructed as follows:
$ t=R+{D}^{e} $ (6) Objective function
-
The objective function of the lower-level model is as follows:
$ \underset{}{\mathrm{min}}W=\sum _{o\in O}\sum _{d\in D}\sum _{q\in {Q}_{od}}{t}_{od}^{\left(q\right)}\left({N}_{od}^{\left(q\right)}\right)\cdot {N}_{od}^{\left(q\right)} $ (7) where, W refers to total impedance of the network, Qod is the set of all paths connecting the starting point o and the ending point d,
$ {N}_{od}^{\left(q\right)} $ $ {t}_{od}^{\left(q\right)} $ Constraint conditions
-
The flow on any section should be equal to the sum of the flow on the paths using that section:
$ N=\sum _{u\in U}{N}_{od}^{\left(u\right)} $ (8) where, U refers to a set of paths containing the analyzed sections and
$ {N}_{od}^{\left(u\right)} $ In order to ensure that the solution of the model has practical significance, all path flows and section flows must be non-negative:
$ \begin{split} & N\ge0,\ \ N_{od}^{\left(q\right)}\ge0\; \; \end{split} $ (9) Simulation by the genetic algorithm
-
There are many classic algorithms used for solving bi-level planning models, such as the extreme point search method, the Kuhn–Tucker method, and the penalty function method. However, the computational complexity of these algorithms increases exponentially with the number of variables, making them unsuitable for large-scale urban road networks. In recent years, scholars have found that genetic algorithms possess the advantages of inherent parallelism and good optimization capabilities. The genetic algorithms can adaptively adjust the search direction, meeting the requirements of solving a bi-level planning model while significantly reducing the computational complexity. Therefore, this study used genetic algorithms as the solutions to the bi-level planning model. The specific steps are as follows.
Road network digitization: Encode the planned road network using the adjacency matrix method, followed by inputting the generated distance matrix table into MATLAB as a code.
Encoding: The road network consists of 34 road segments. The decision variable for the capacity renovation depth of each road segment can take values of {−3, −2, −1, 0, 1, 2, 3}, corresponding to different degrees of road segment renovation. Use binary encoding for the decision variables.
Fitness function construction: Construct the fitness function based on the objective function of the upper-level model.
Generating the initial population: Decode the current population to the upper-level model's decision variables and combine these decision variables with the upper-level model according to the predefined parameters for different levels of road segments and intersections. Sequentially, assign values to the speed matrix, road segment capacity matrix, and intersection capacity matrix in the model.
Initial impedance calculation: Input the OD traffic volume obtained from TransCAD into the code, and then calculate the initial impedance and construct the initial travel time cost matrix. Lastly, proceed with the iterations of the genetic algorithm sequentially.
As a whole, the variable settings of the bi-level optimization model can be summarized as shown in Table 1.
Table 1. Summarization of variable settings for the bi-level optimization model.
Items Upper-level model Lower-level model Objective function Average travel speed of the road network ($ \bar{V} $) Total impedance of the network (W) Constraint conditions
(control variable)Traffic capacity, investment limit Travel time on the road, intersection delay, the road's resistance Optimization scenarios
(decision variable)Road segment renovation (changing two-way to one-way, reducing two lanes, reducing one lane, the section remains unchanged, adding one lane, adding two lanes, changing one-way to two-way) Mode choice of travelers (walk, bus, bike, car, etc.) Comparison of optimization scenarios
-
In this step, the rationality of the results from the bi-level planning model are validated. At the macroscopic level, the optimization results were re-input into TransCAD to compare the service capacity of the road network before and after renovation. At the microscopic level, the traffic conditions at the intersections were re-simulated in VISSIM to evaluate the performance of the optimized scheme.
-
According to the concept of traffic microcirculation, the study area should be an area surrounded by major or secondary roads and with branch roads within the areas. Moreover, the branch roads can divert the traffic flow from the main roads or secondary roads, thereby contributing to alleviating the traffic congestion.
Considering the traffic conditions, land use characteristics, and the size of the neighborhood, the area around Zhuangwangfu in Nankai District was selected as the traffic microcirculation unit for the study. The area is located in the central part of Nankai District, Tianjin. As shown in Fig. 3, this area is bounded by Changjiang Avenue to the north, Xihu Avenue to the south, Sudi Road (Jinhe River) to the west, and Baidi Road to the east.
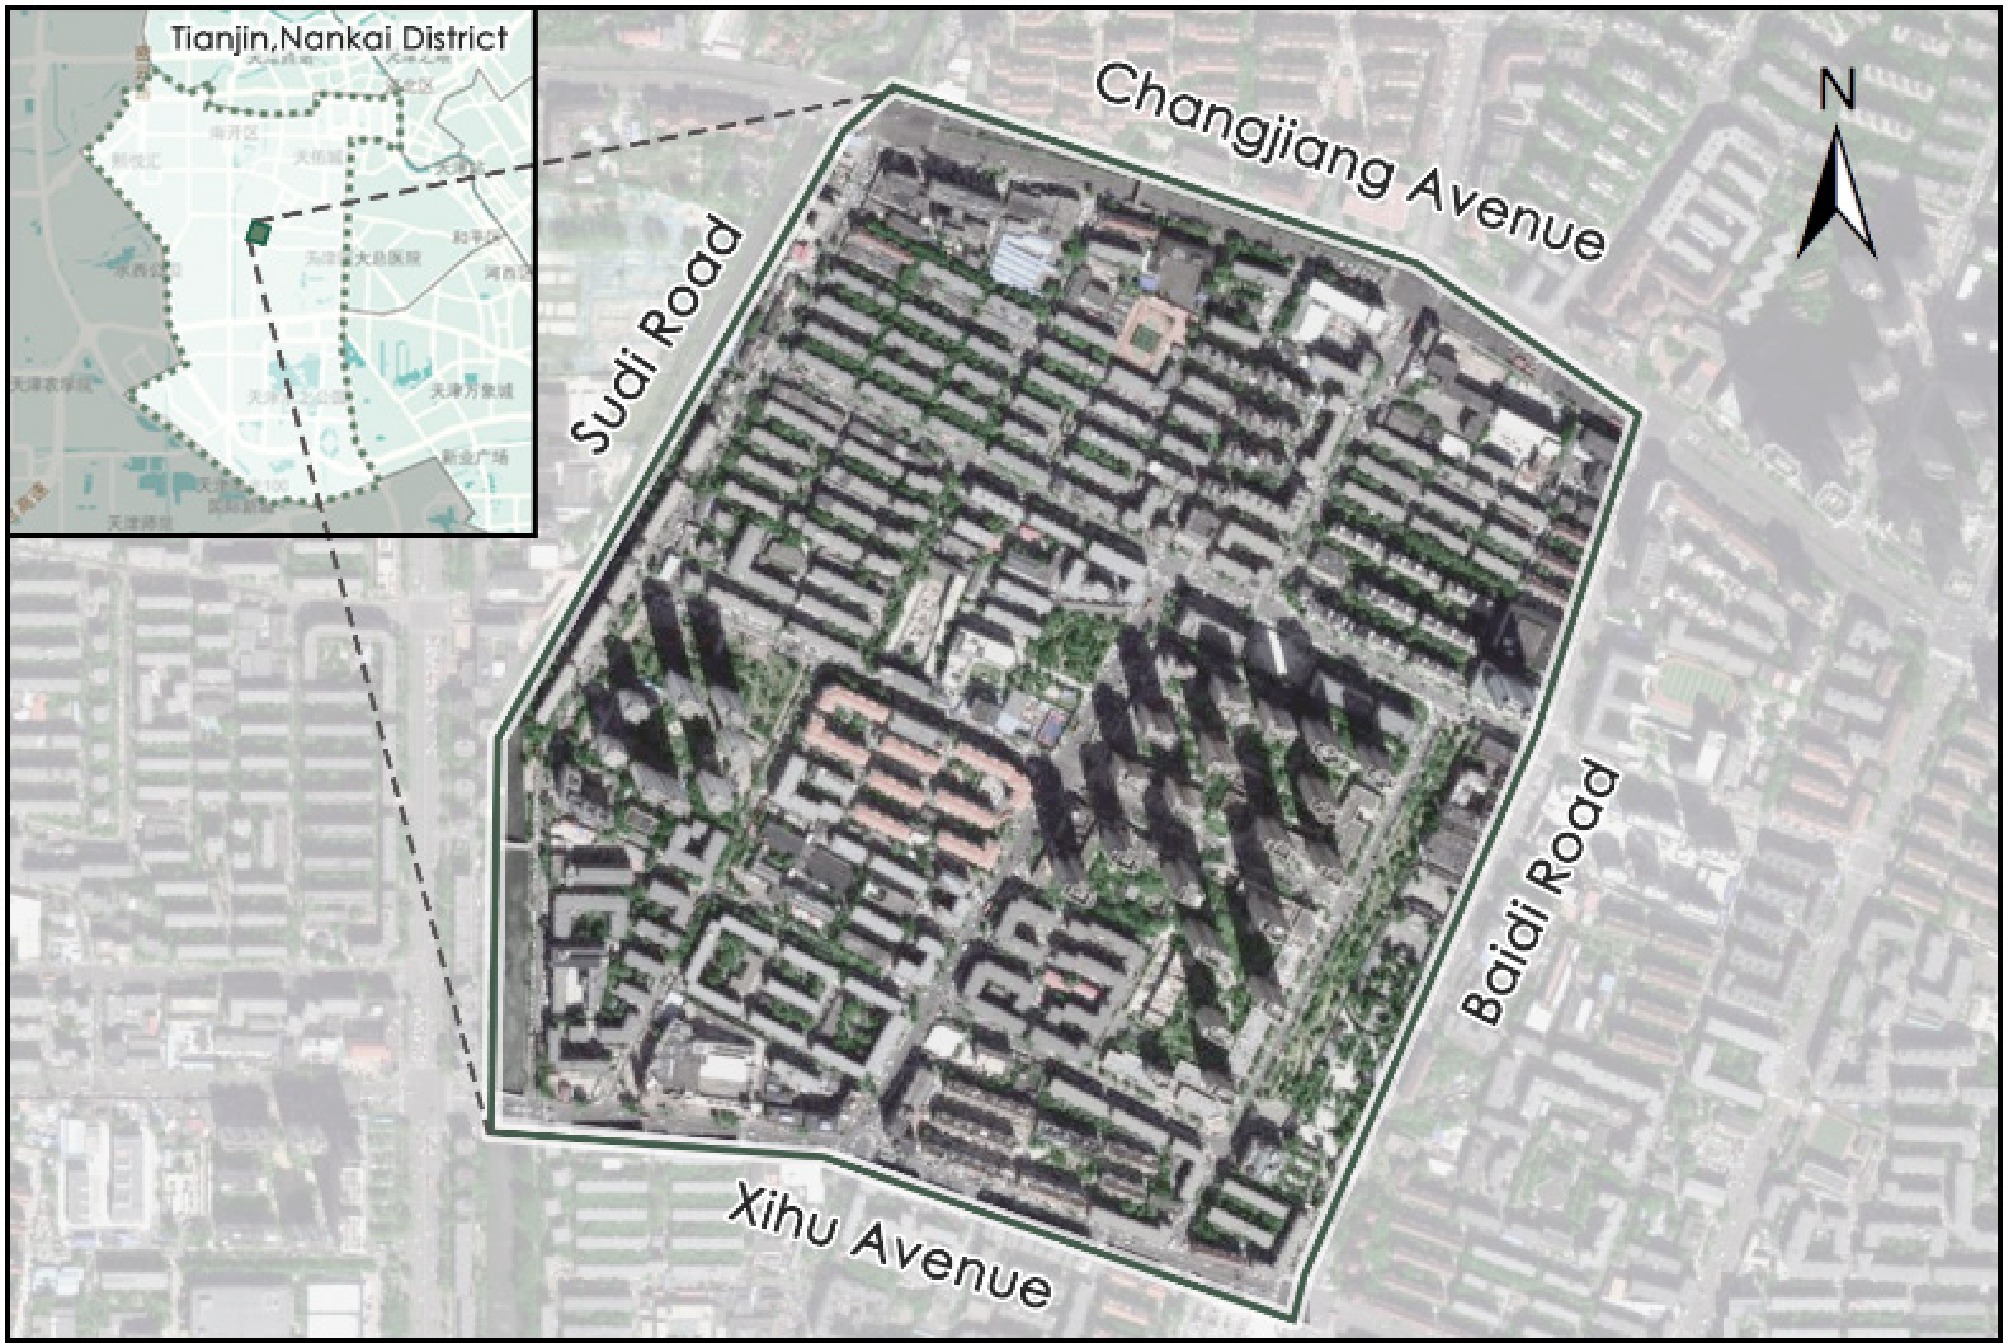
Figure 3.
Location of the study area.
The area has a clear road hierarchy and structure, forming a traffic microcirculation unit enclosed by one main road (Changjiang Avenue) and two secondary roads (Baidi Road, Xihu Avenue). The roads surrounding the area are all two-way lanes, with Changjiang Avenue being the widest with six lanes in both directions. Some roads have non-motorized lanes with adjustable widths. All intersections are grade crossings, most of which are signal-controlled. However, there are issues with the signals' timing, resulting in turning traffic conflicts during the survey. As shown in Fig. 4a, the minor roads are dense, and there is a large stock of usable microcirculation roads in the unit. The most congested roads are Xihu Avenue in the southern part and Lingyin Avenue in the central part. Both of these two secondary roads face significant traffic pressure during peak hours.
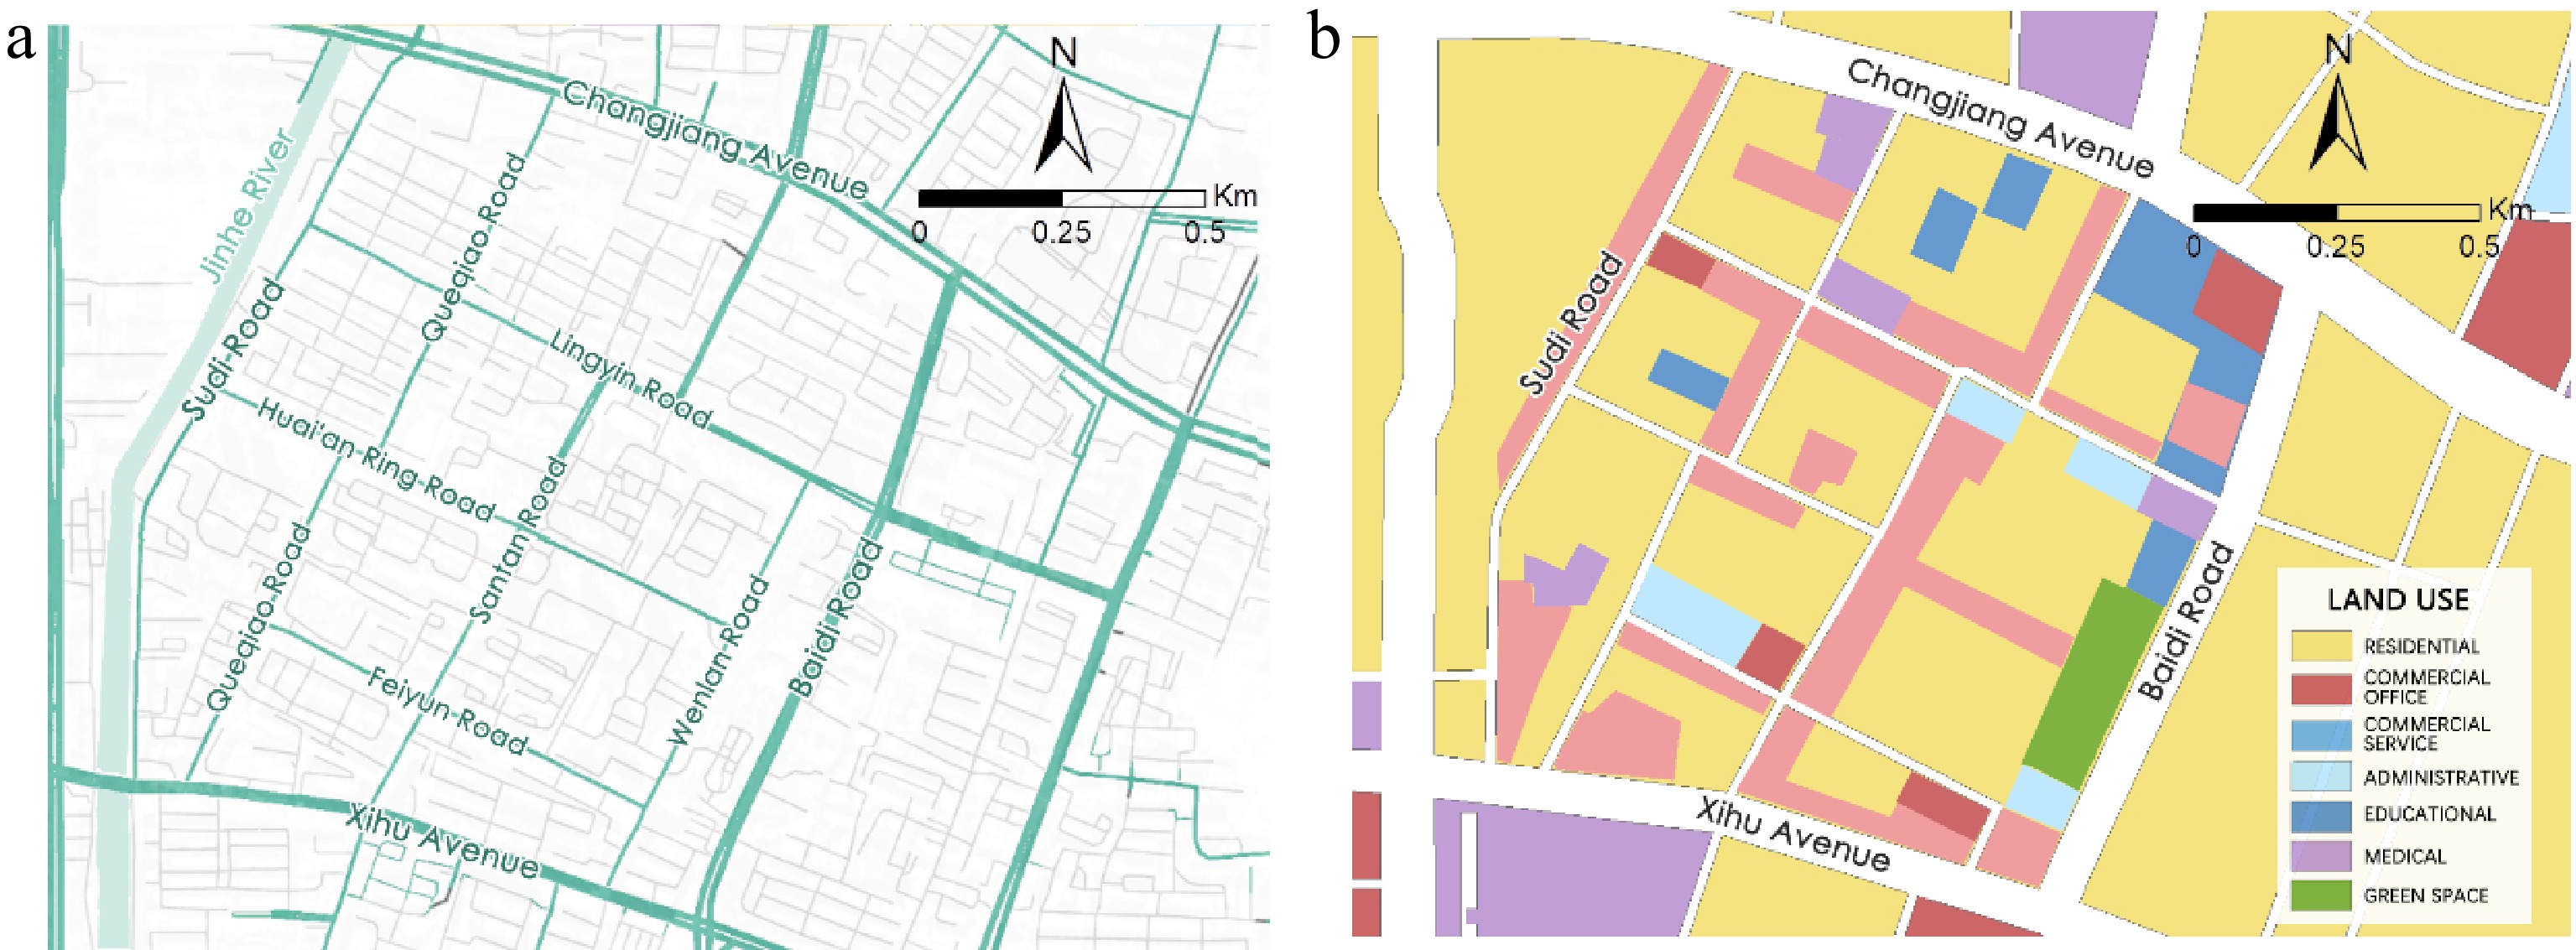
Figure 4.
(a) Road system and (b) land use distribution of the study area.
The land use composition in Zhuangwangfu (Fig. 4b) is mainly residential, with some commercial, office, educational, medical, and green park facilities. Residential land accounts for 54.94%, while commercial service land accounts for 23.90%. Additionally, other land uses such as commercial offices, administrative offices, educational and research, medical and health, and public green spaces account for 3–8%. As a whole, this area is a mixed-use block primarily focused on residential functions with a relatively well-equipped infrastructure.
Traffic issues
-
Traffic surveys are the foundation of urban transportation planning. Through field surveys, we identified several issues (Fig. 5) with the current traffic situation.
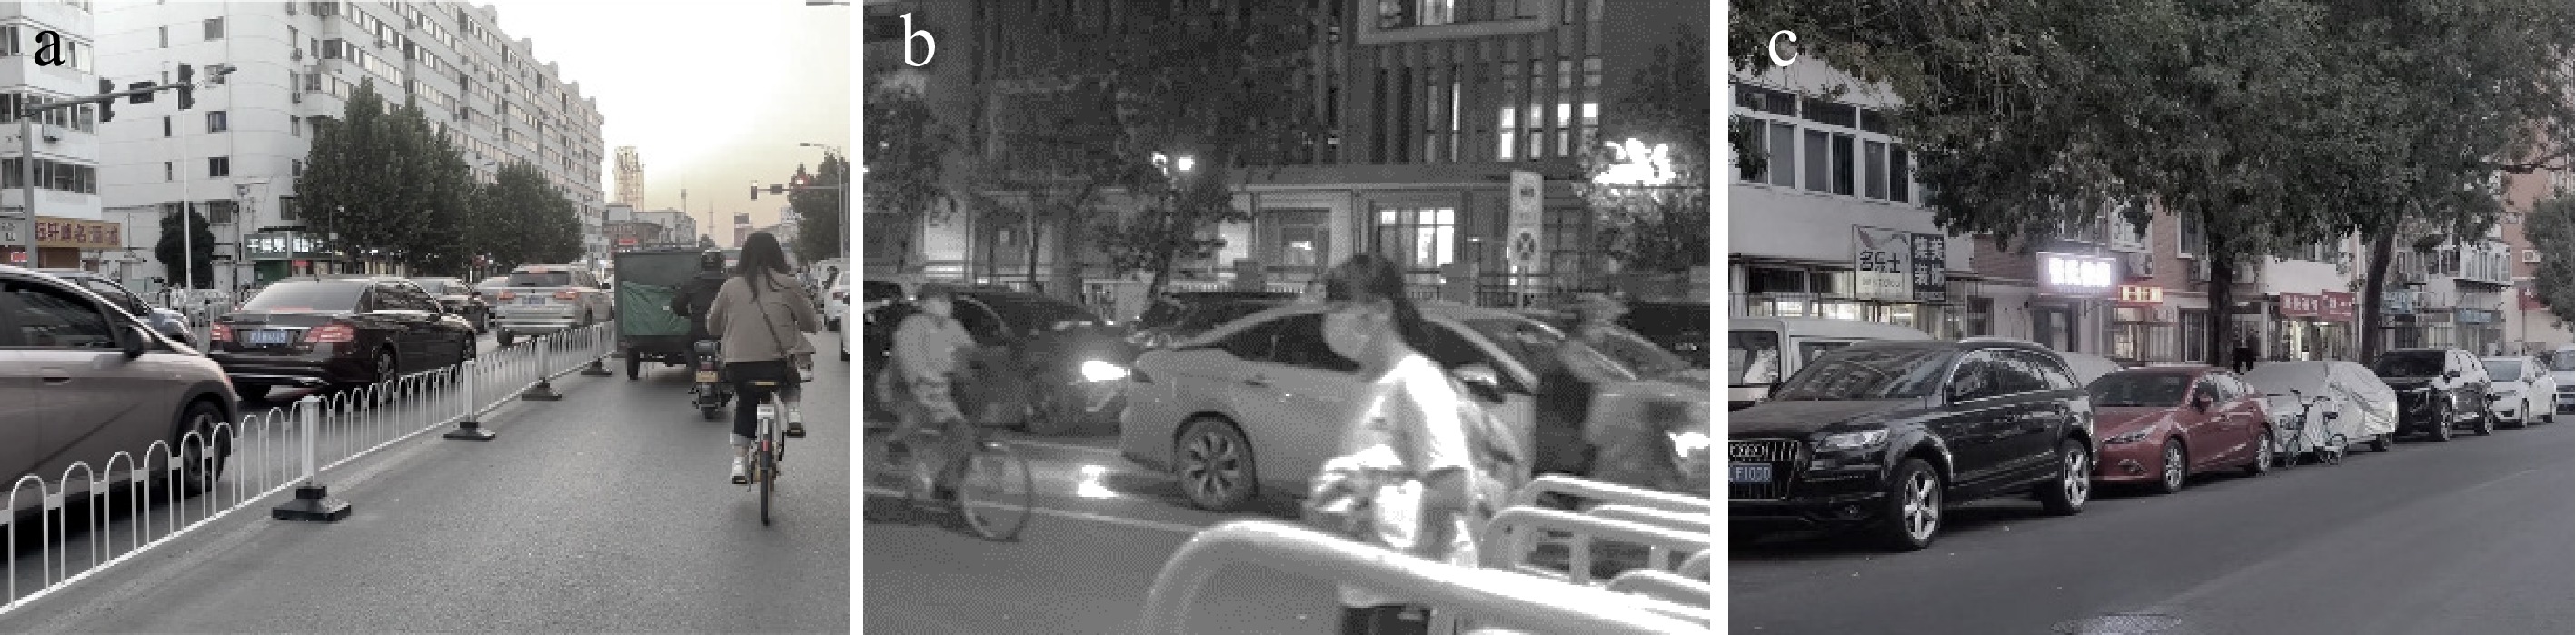
Figure 5.
(a) Congestion during peak hours, (b) traffic safety concerns, and (c) using the road to park.
(1) Severe congestion during peak hours. Some roads collectively combine the functions of transport, daily living, and parking, thereby leading to excessive pressure on the roads, particularly the branch roads. The mixed traffic function also negatively decreases the road capacity of the network.
(2) Low density of microcirculation roads and poor traffic conditions. In this area, the branch roads are insufficient and also underutilized. In light of this, the microcirculation system is poorly constructed. In addition, there are also some safety concerns derived from the insufficient traffic organization.
(3) Extensive illegal street vending by the roadside. Due to the insufficient space along the branch roads, many street vendors occupy the space for their business, particularly during peak hours. Consequently, this significantly reduces the road's capacity and makes it hard for vehicles to travel.
Case analysis
Macroscopic: traffic assignment by TransCAD
-
By modeling and simulating the traffic network of the Zhuangwangfu area, we obtained the volume saturation and service level of each road segment, as shown in Table 2. The service level of each road was evaluated and classified into three grades: A, B, and C. Grade A represents better performance, Grade B indicates average performance, and Grade C denotes poor performance.
Table 2. Volume saturation and service level for each road section.
Road section Direction Saturation Service level Changjiang Avenue (1−4) E to W 0.11 A W to E 0.06 A Baidi Road (4−23) S to N 0.08 A N to S 0.19 A Xihu Avenue (19−23) E to W 0.45−0.75 A−B W to E 0.07−0.81 A−B Sudi Road (1−19) S to N 0.28−0.47−0.63 A−B N to S 0.77−0.71−0.59 B−A Lingyin Road (5−10) E to W 0.03−0.67 A−B W to E 0.49−0.04 B−A Gushan Road (3−8) S to N 0.02 A N to S 0.02 A Santan Road (7−21) S to N 0.98−0.03−0.02 C−A−A N to S 0.02−0.03−1.25 A−A−C Queqiao Road (2−13) S to N 0.95−1.21 C N to S 1.21−1.19 C Queqiao Road (12−20) S to N 0.65 B N to S 0.72 B Huai'an Ring Road (11−15) E to W 0.01−0.75 A−B W to E 0.49−0.01 A Feiyun Road (16−18) E to W 0.01 A W to E 0.01 A Wenlan Road (9−22) S to N 0 / N to S 0 / From the macroscopic analysis of the regional traffic situation, Changjiang Avenue has eight lanes in both directions, and Baidi Road has four to six lanes in both directions, meeting the regional traffic demand. However, the minor roads intersecting with the main roads have poor traffic conditions. According to the volume saturation of the road network (Fig. 6), some segments with low service levels stand out, with the issues being particularly pronounced on Santan Road and Queqiao Road, for which the ratings are C−A−A and C, respectively.
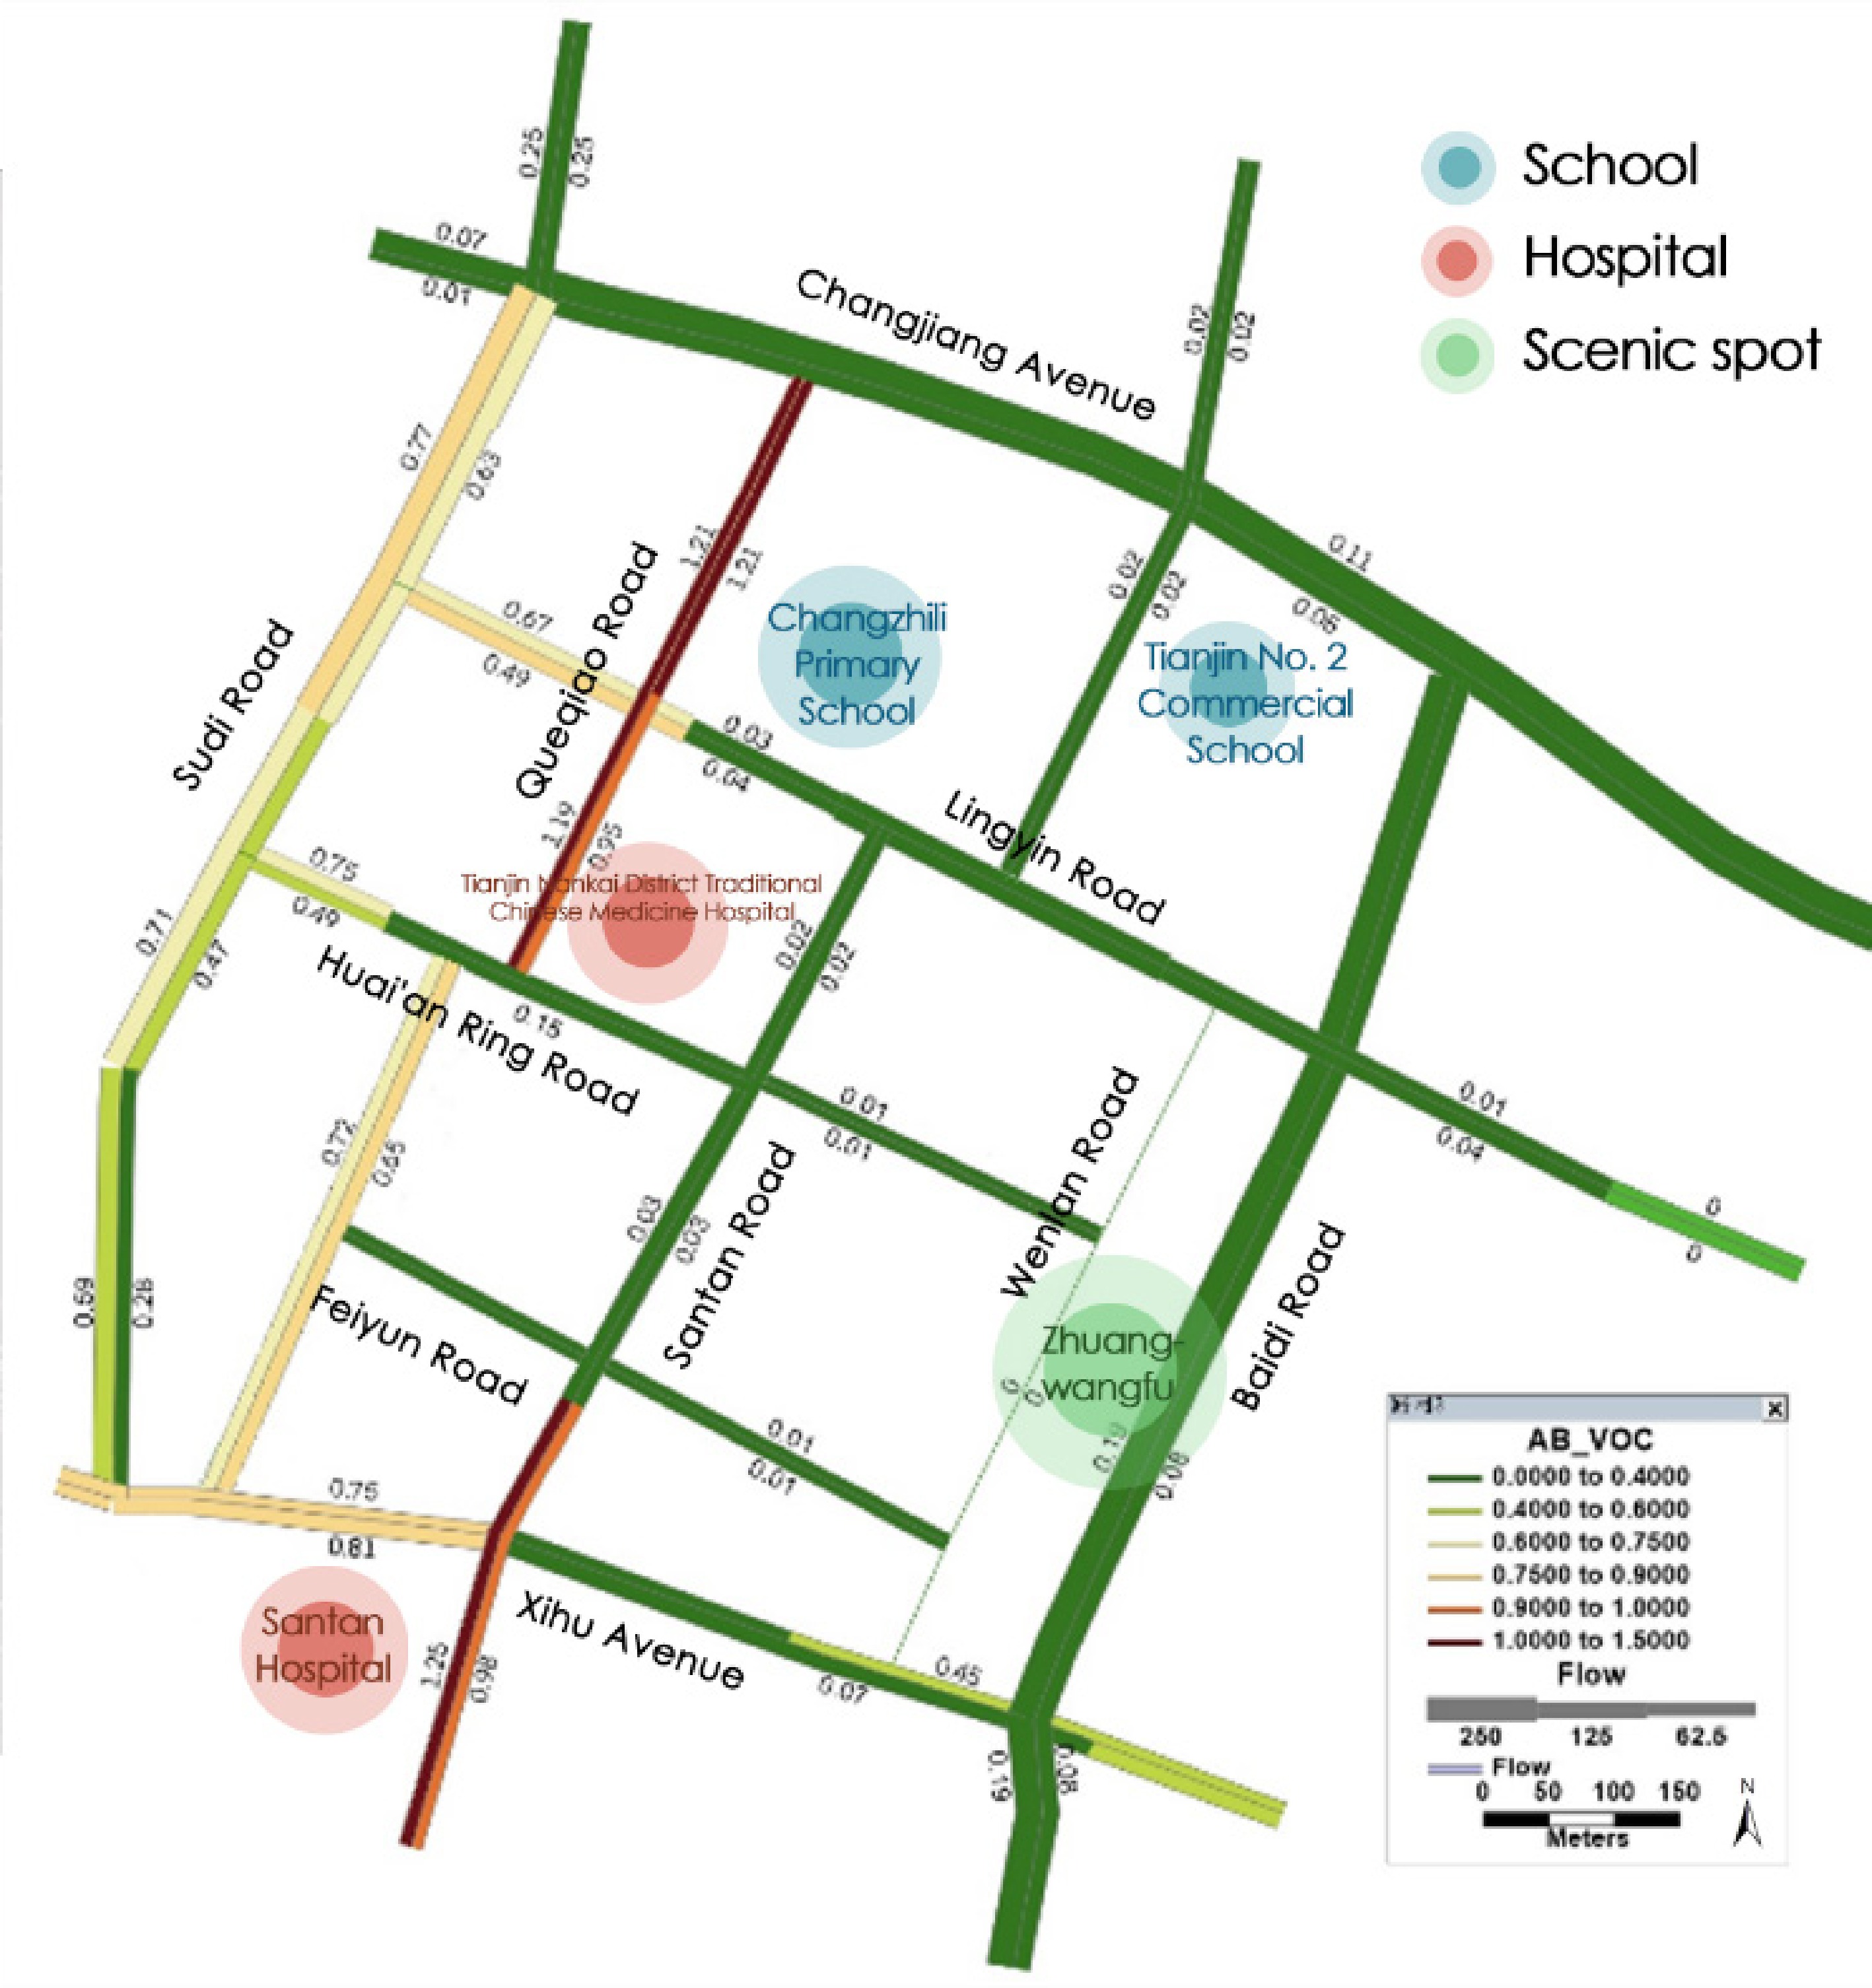
Figure 6.
Traffic service levels assigned by TransCAD.
The causes of congestion on several segments with low service levels are different. Roads such as Sudi Road, Santan Road, and Queqiao Road are likely congested due to high traffic volumes on the main roads but with limited lanes at the intersections, leading to disorganized turning traffic and resulting in congestion. Lingyin Road may be congested because of the nearby school. During peak hours, the traffic of commuting to working usually coincides with school drop-off and pick-up times, thereby negatively impacting ttraffic conditions.
Microscopic: VISSIM simulation
-
According to the road network plan in Tianjin, we identified the roads' grades (i.e., main road, secondary road, and branch road) in the Zhuangwangfu area (Fig. 7a). As whole, there are one main road, five secondary roads, and five branch roads. After identifying the grades of the roads, 23 intersections and T-junctions in total were marked (Fig. 7b).
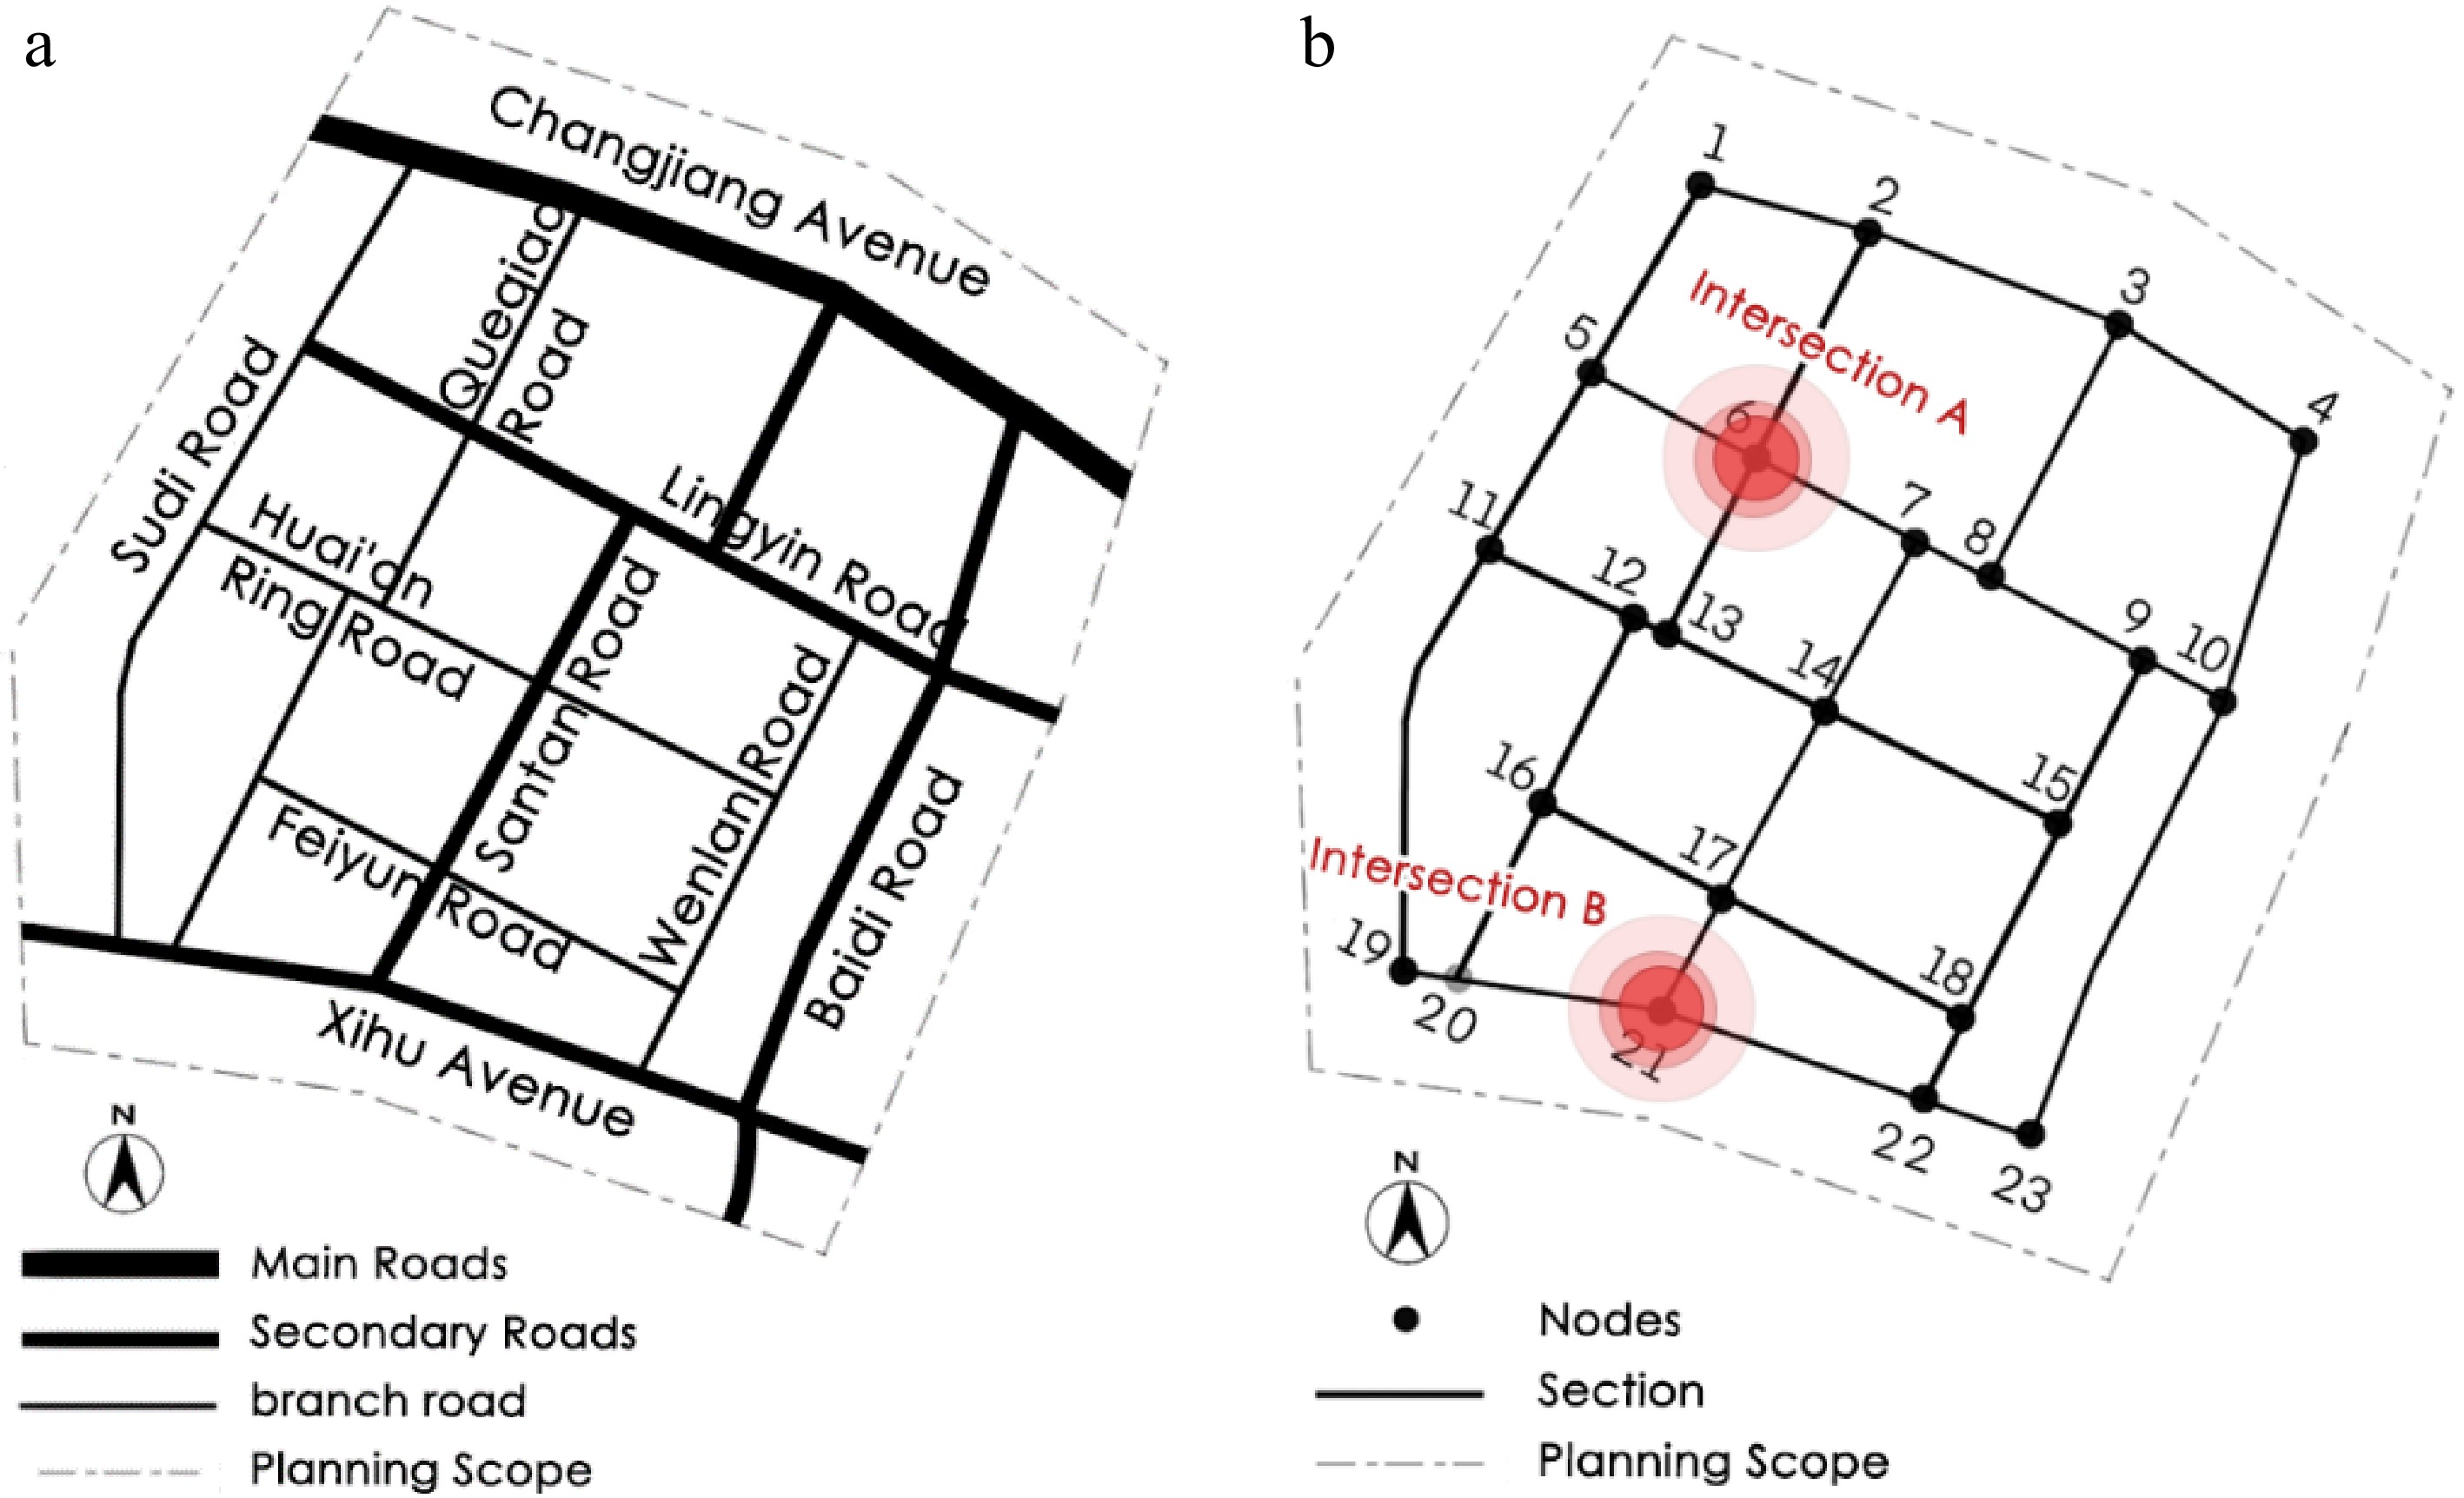
Figure 7.
(a) Road network and (b) network nodes of the study area.
The required data for the VISSIM simulation includes the roads' basic attributes (e.g., width, length, lanes) and traffic volumes. For the roads' attributes, we collected and recorded data through both online resources and on-site surveys. For traffic volumes, we conduct a traffic volume survey in the Zhuangwangfu area using manual counting during the peak hours (7:00−8:00 and 17:00−18:00). By using the conversion coefficient of equivalent private cars, we obtained the converted traffic volume during the two peak hours in this area, as Table 3 shows. The direction from north to south and east to west is defined as the topological direction, while the opposite is referred to as the reverse topological direction.
Table 3. Calculated traffic volumes.
Road Section Traffic volume (pch/h) Topological direction Reverse topological direction Changjiang Avenue
(Sudi Road–Queqiao Road)1,260 1,146 Changjiang Avenue
(Queqiao Road–Gushan Road)1,754 2,252 Changjiang Avenue
(Gushan Road–Baitai Road)1,632 1,084 Baidi Road
(Changjiang Avenue–Lingyin Road)328 652 Baidi Road
(Lingyin Road–Xihu Avenue)834 710 Xihu Avenue
(Baitai Road–Wenlan Road)1,090 980 Xihu Avenue
(Wenlan Road–Santan Road)930 750 Xihu Avenue
(Santan Road–Queqiao Road)1,330 1,290 Xihu Avenue
(Queqiao Road–Sudi Road)1,140 1,210 Sudi Road
(Xihu Avenue–Huai'an Ring Road)300 180 Sudi Road
(Huai'an Ring Road–Lingyin Road)330 120 Sudi Road
(Lingyin Road–Changjiang Avenue)410 320 Lingyin Road
(Sudi Road–Santan Road)350 270 Lingyin Road
(Santan Road–Gushan Road)490 660 Lingyin Road
(Gushan Road–Baitai Road)300 400 Gushan Road
(Changjiang Avenue–Lingyin Road)220 350 Santan Road
(Lingyin Road–Xihu Avenue)570 650 Wenlan Road
(Lingyin Road–Xihu Avenue)100 150 Huai'an Ring Road
(Sudi Road–Wenlan Road)230 110 Feiyun Road
(Queqiao Road–Wenlan Road)230 60 Queqiao Road
(Changjiang Avenue–Huai'an Ring Road)120 70 Queqiao Road
(Huai'an Ring Road–Xihu Avenue)90 60 As Table 3 shows, the traffic volume of each road segment ranges from 60 to 2,250 pch/h (the number of passenger car unit per hour). The segment with the highest traffic volume is Changjiang Road (Queqiao Road to Gushan Road), reaching 1,754 pch/h in the topological direction and 2,252 pch/h in the reverse topological direction. The segment with the lowest traffic volume is Queqiao Road (Huai'an Ring Road to Xihu Road), with only 90 pch/h in the topological direction and 60 pch/h in the reverse topological direction.
Intersections are major causes of congestion. According to the macroscopic analysis of traffic service levels and congestion by TransCAD, two representative intersections were selected for the microscopic simulation modeling in VISSIM. In VISSIM, we built the road segment models and configured the parameters of vehicle flow and signal timing. These two intersections emerged as significantly congested in the previous macroscopic simulation. They represent two distinct types of intersections: an unsignalized side road intersection and a signalized main road intersection.
Intersection A
-
Intersection A is the intersection of Lingyin Road and Queqiao Road. This intersection represents the internal minor road network, and it is prone to congestion due to mixed travel modes and proximity to schools. The intersection lacks signal control, so we incorporated non-motorized vehicles and pedestrians into the traffic measurement to enhance the authenticity of the simulation (Fig. 8).
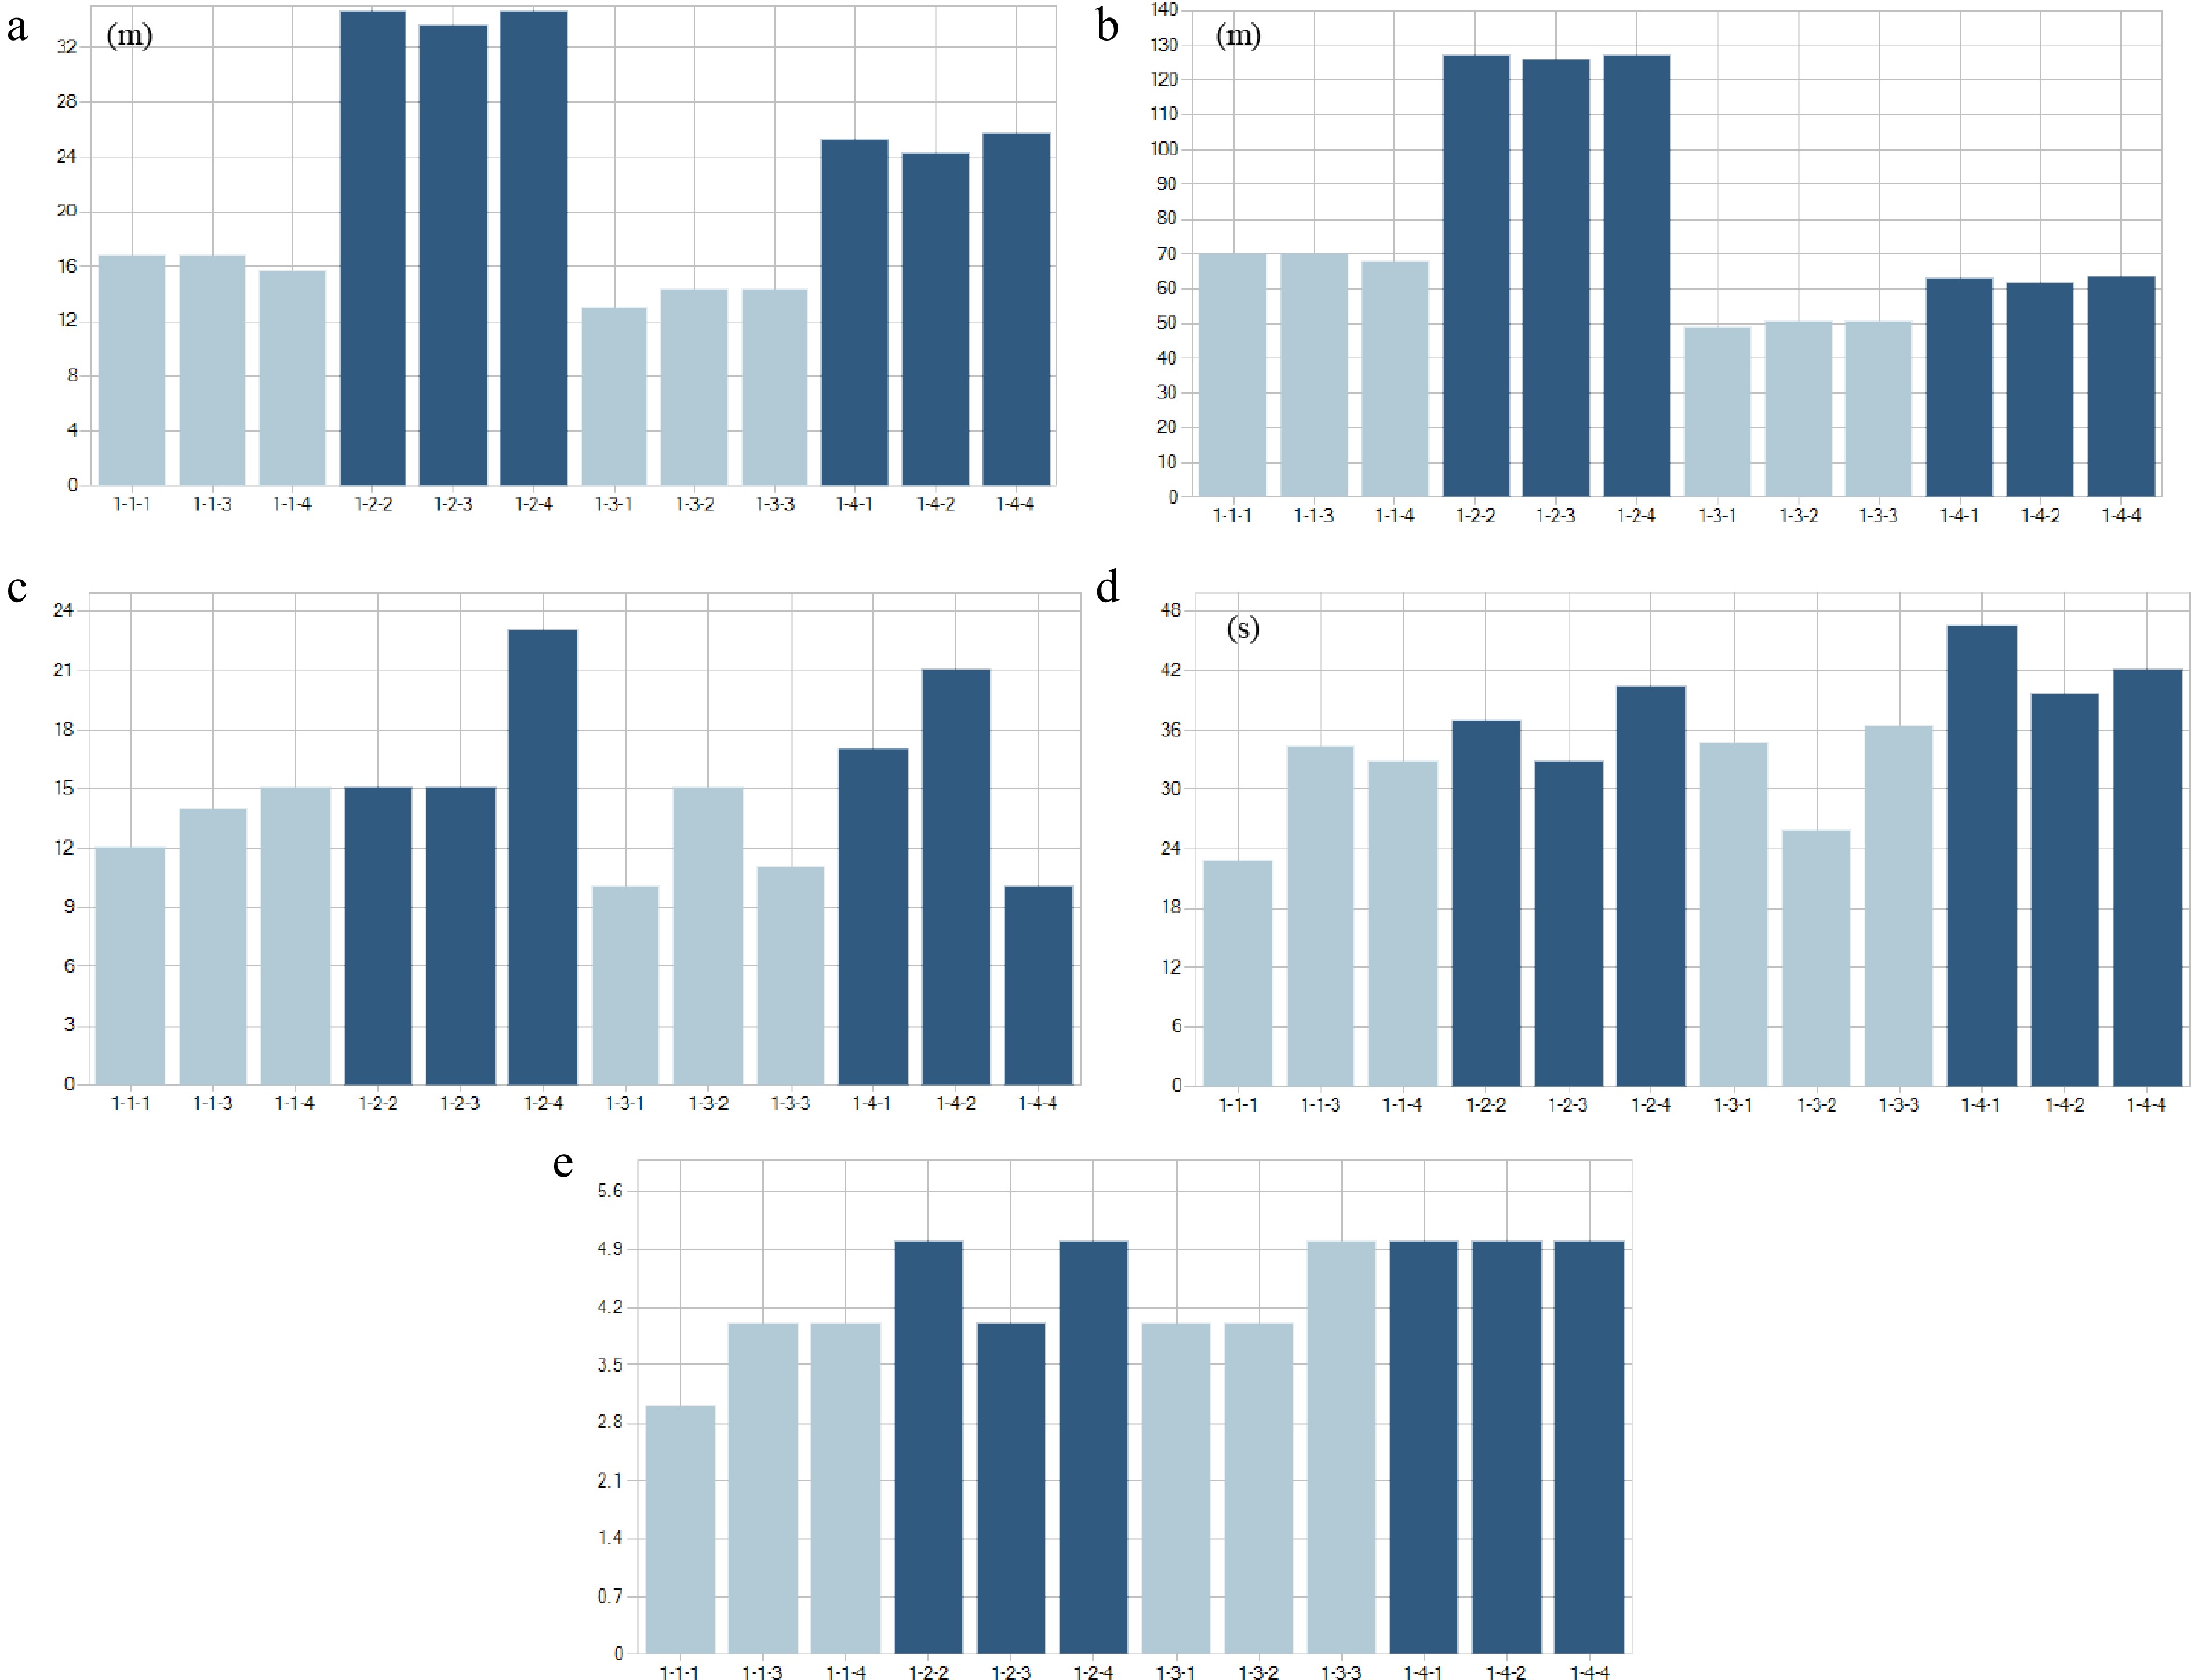
Figure 8.
(a) Vehicle queue length, (b) maximum queue length, (c) number of vehicles, (d) average vehicle delay, and (e) service level of each road segment at Intersection A.
In the simulation, the longest queue was at Lingyin Road (east to west) in all three directions (left turn, right turn, straight). The majority of vehicles passed through Lingyin Road east to west, turning right (23 vehicles), and the minority passed straight through Queqiao Road north to south (10 vehicles). The highest average delay was mainly at Queqiao Road north to south due to mixed vehicle and pedestrian traffic without signal control, leading to slow movement. Overall, the service level was poor, ranging from C to E, with the worst on Queqiao Road north to south.
In the road segment evaluation (Fig. 9), the simulation showed lower vehicle density on Queqiao Road north–south than Lingyin Road east–west. The traffic volume was about 200−400 vehicles per hour. The actual speed was lower than the designed speed, with an average straight lane speed of 17−25 km/h. The highest relative delay was on the four left-turn lanes due to frequent traffic conflicts without signal control.
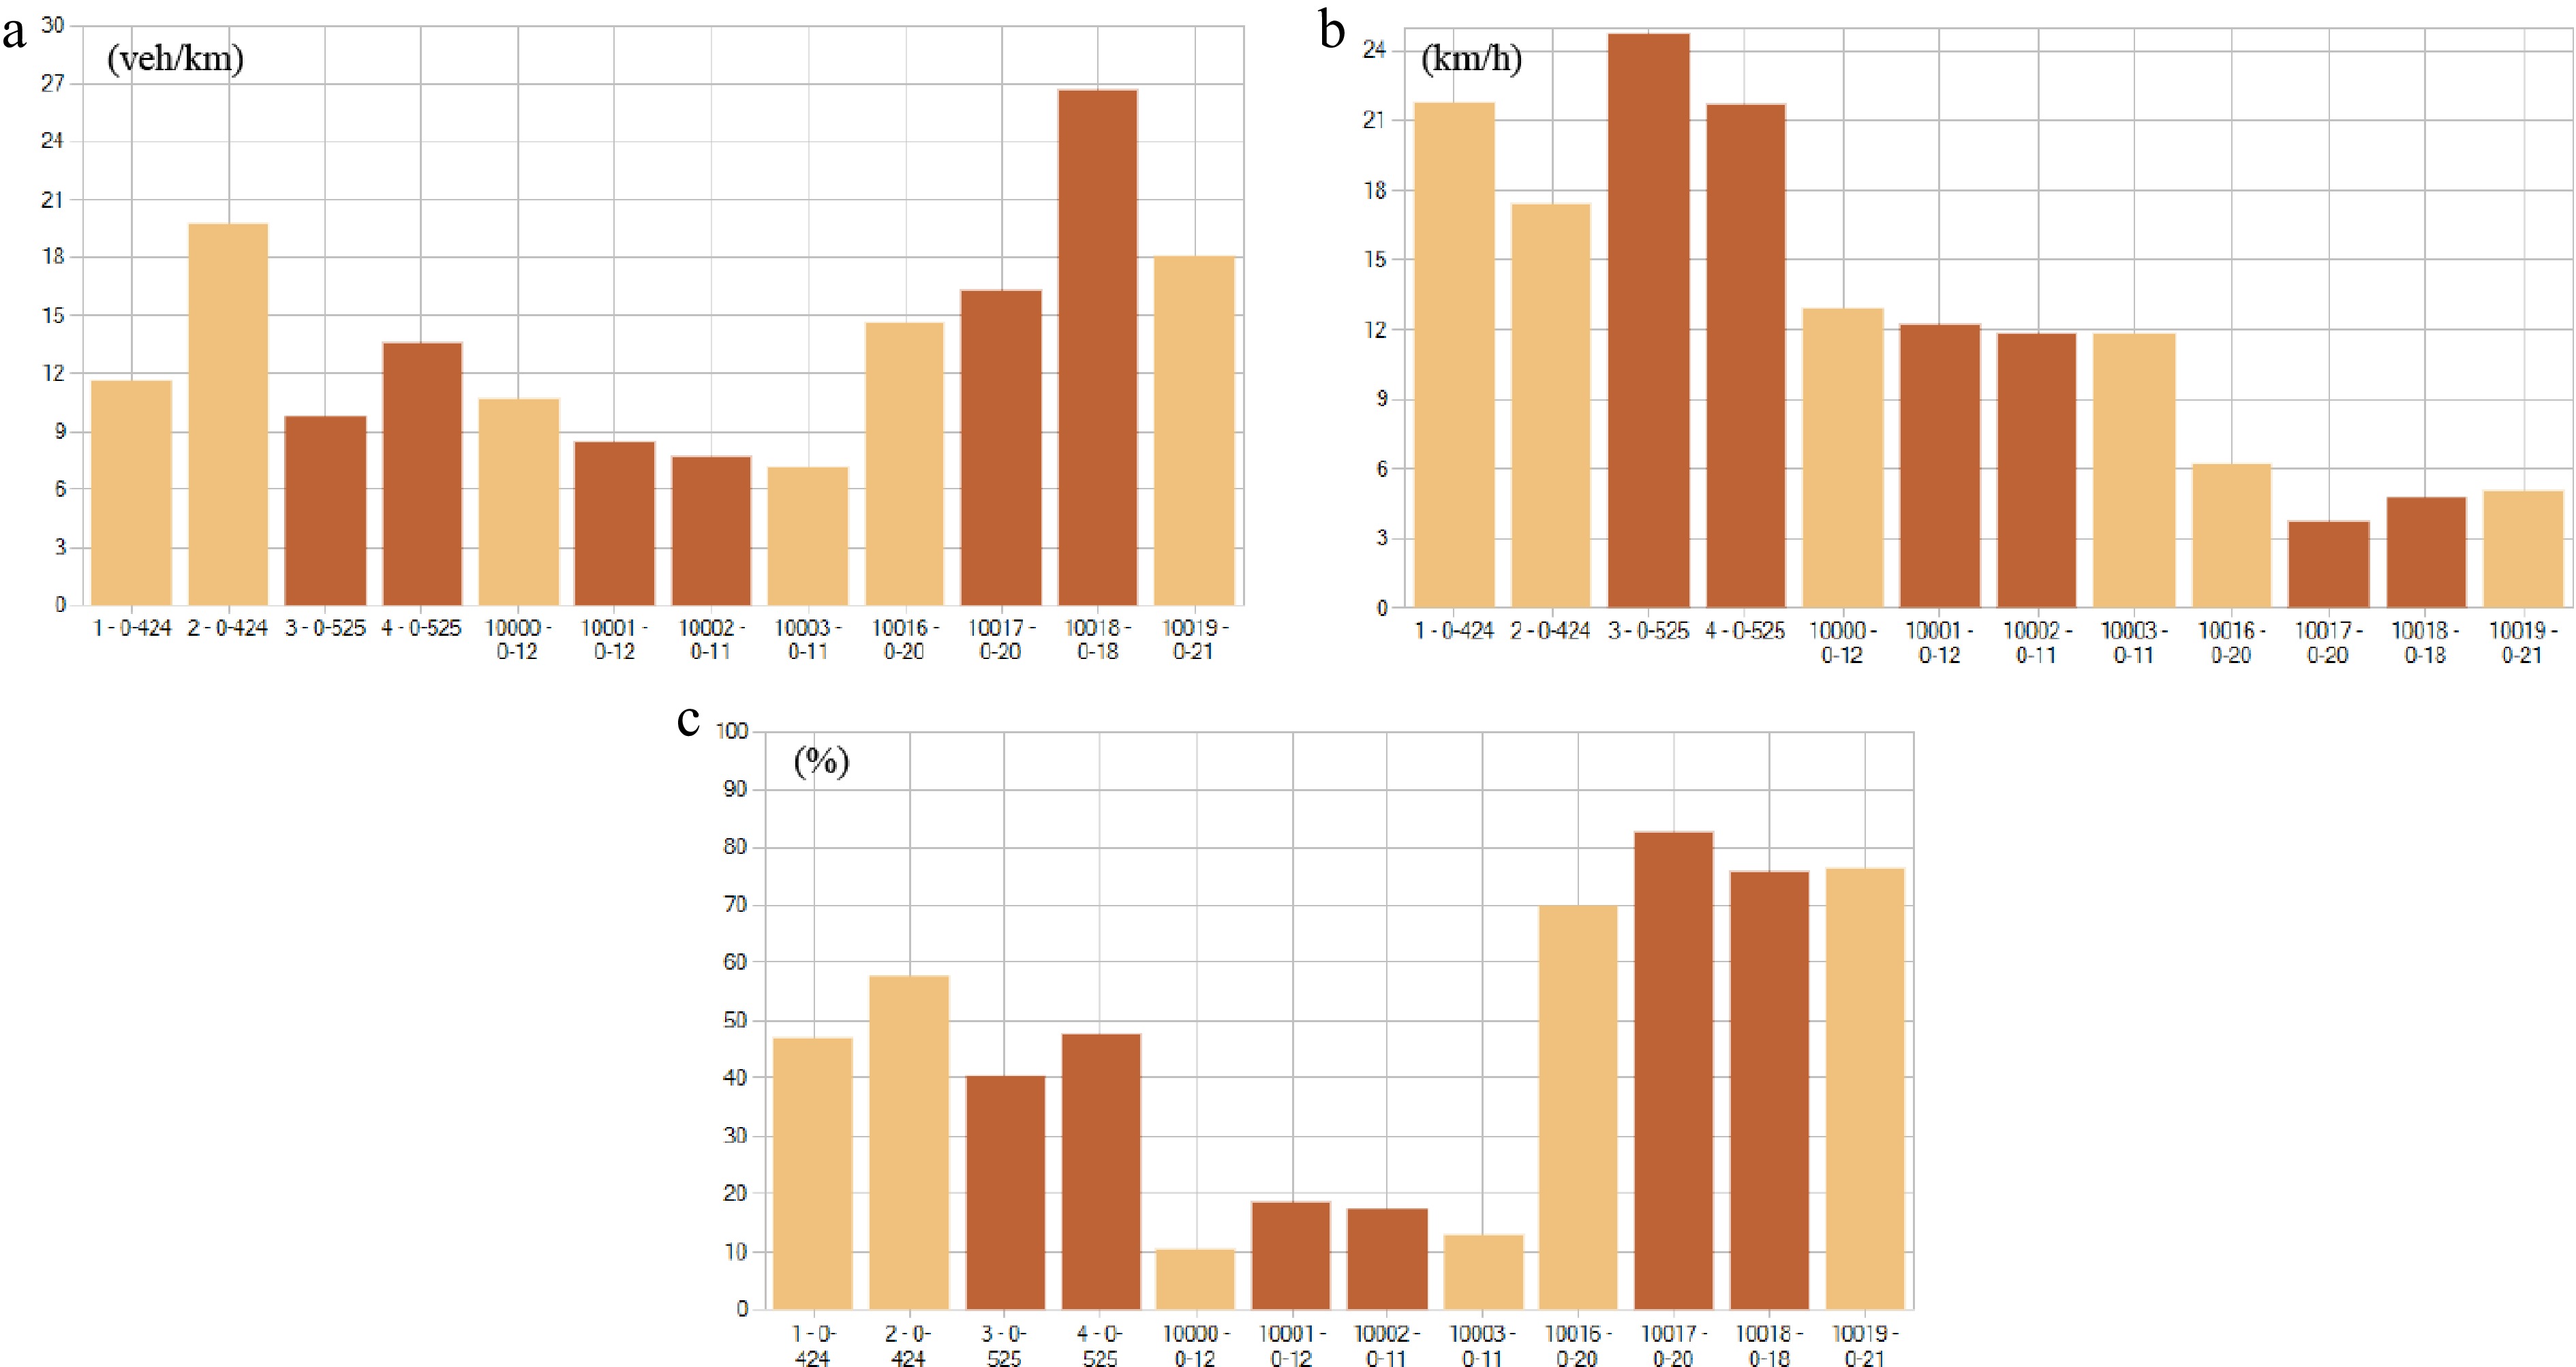
Figure 9.
(a) Vehicle density, (b) speed, and (c) relative delay of road segments at Intersection A.
Intersection B
-
Intersection B is the intersection of Xihu Avenue and Santan Road, representing the main road network with high traffic volumes and signal control. In light of this, this study focused solely on motor vehicles' behavior (Fig. 10).
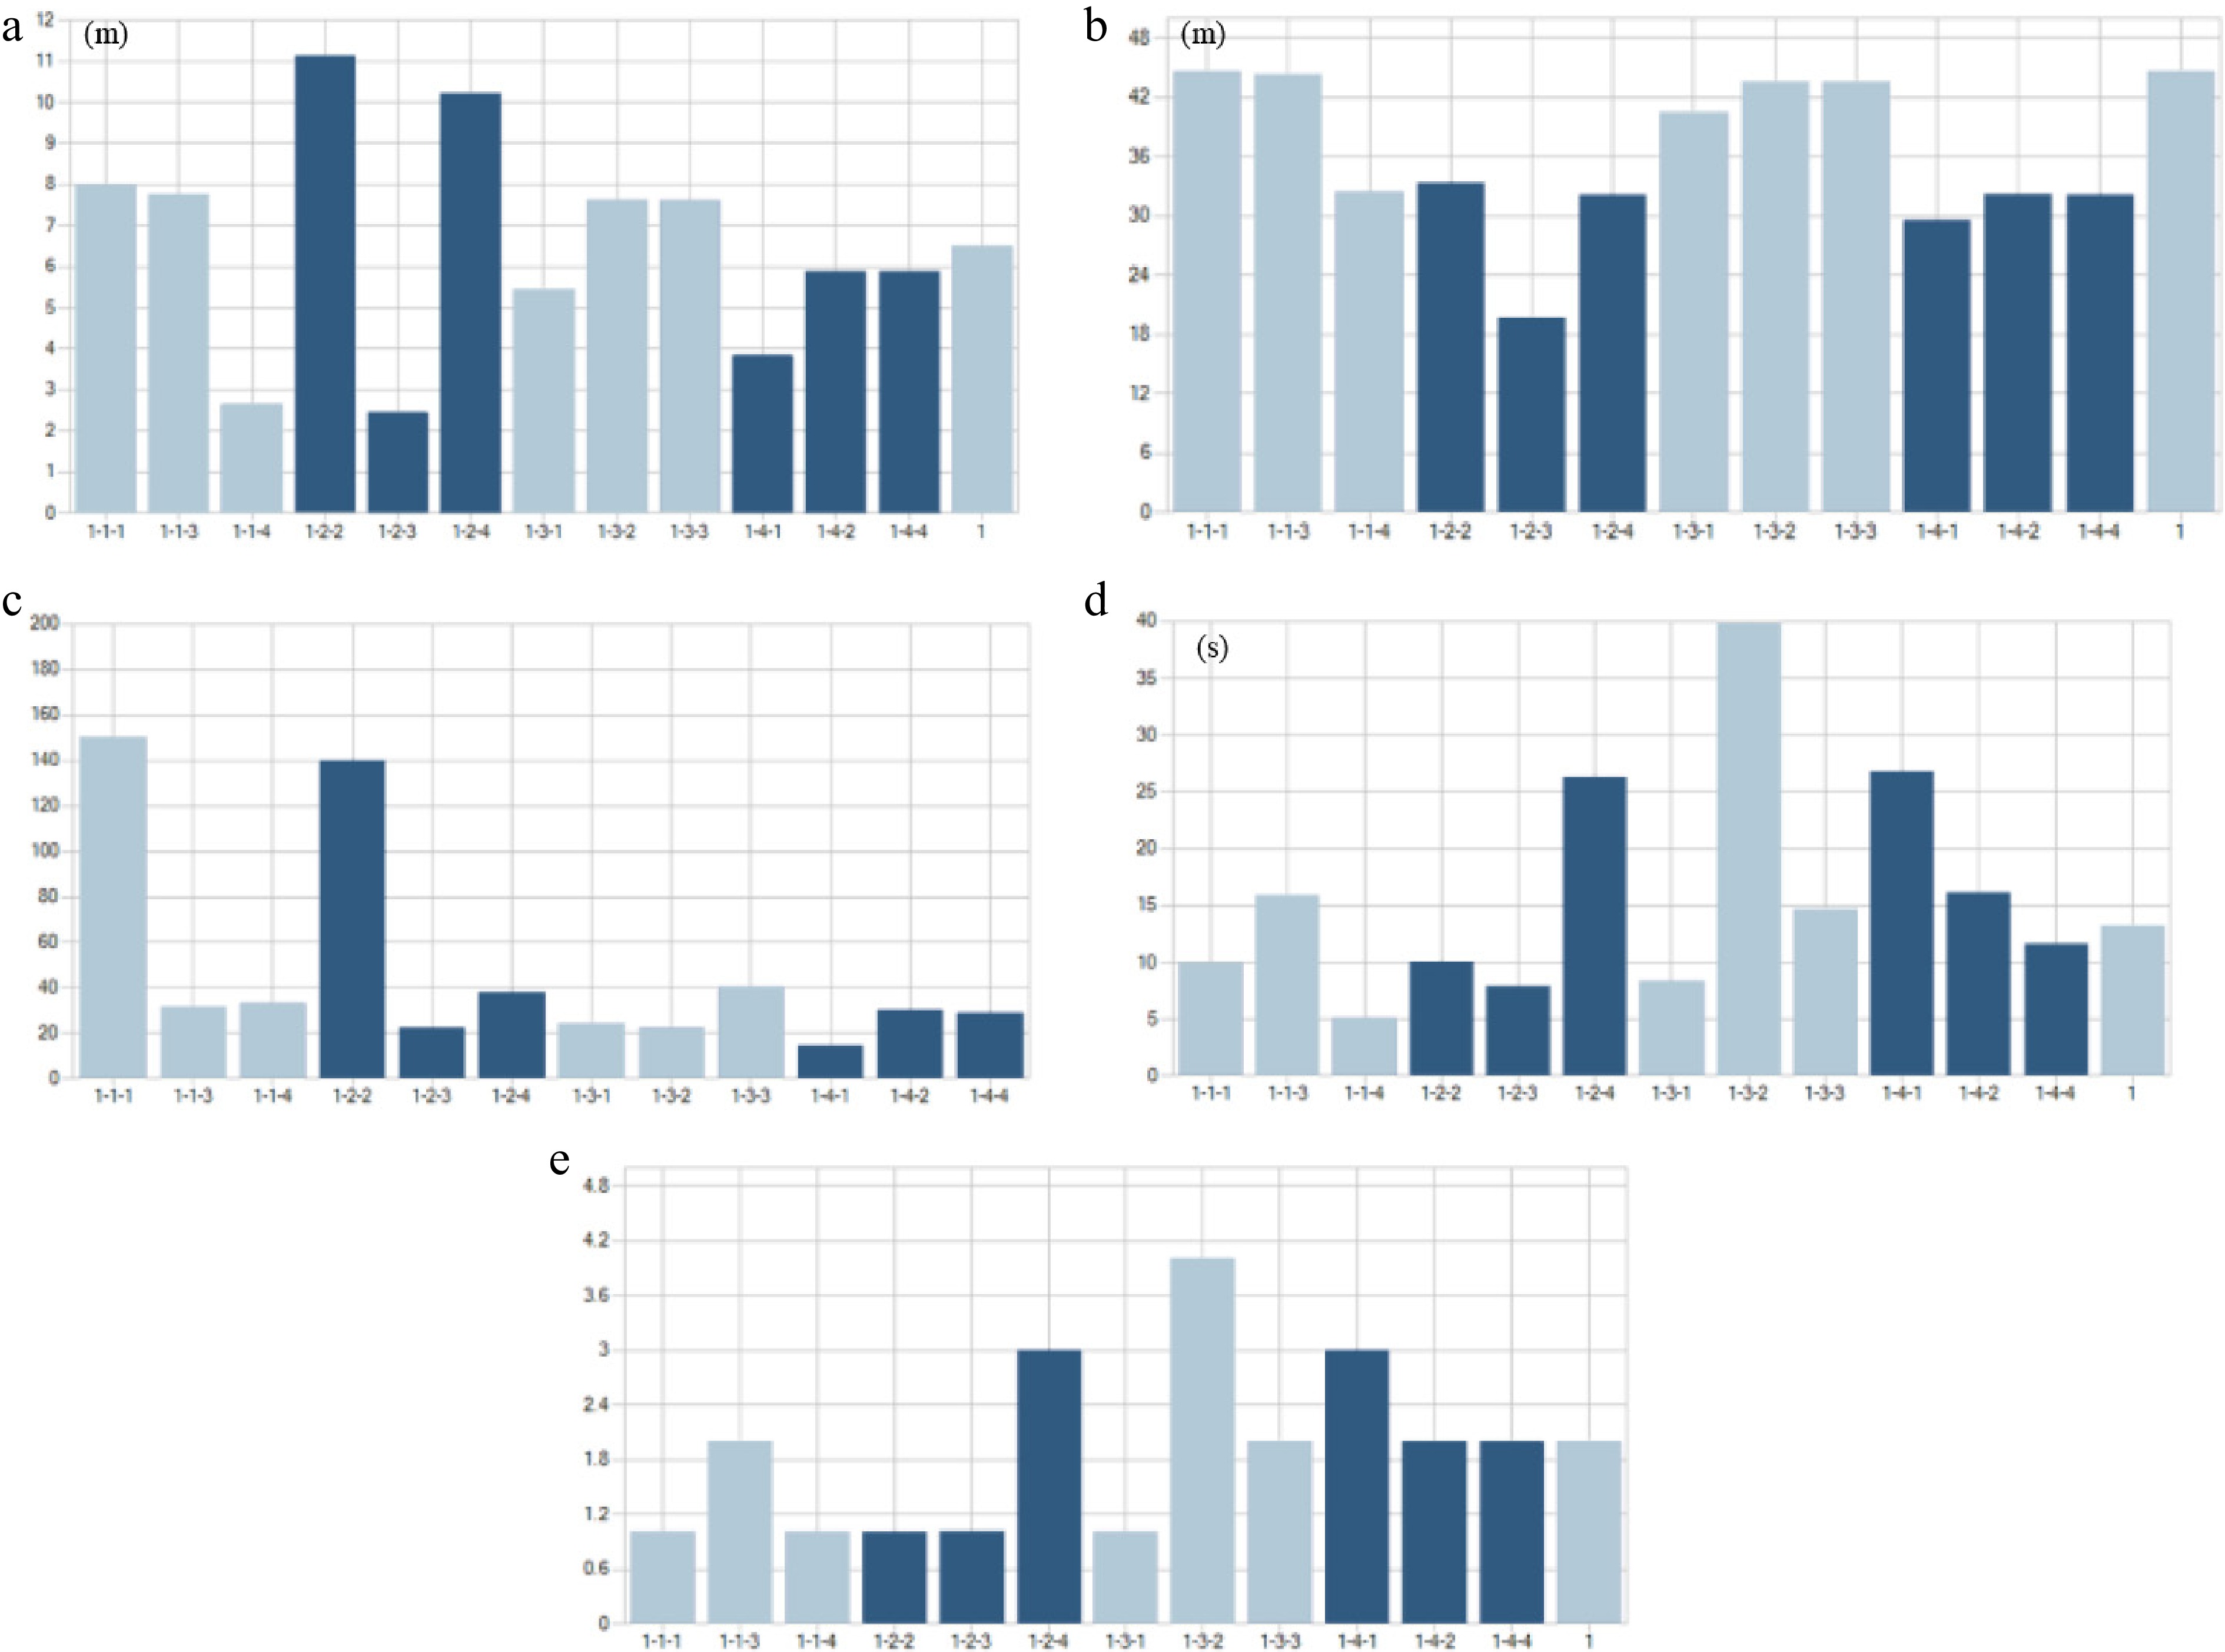
Figure 10.
(a) Vehicle queue length, (b) maximum queue length, (c) number of vehicles, (d) average vehicle delay, and (e) service level of each road segment at Intersection B.
In the simulation, queue lengths were evenly distributed, with higher congestion in the topological direction. The highest vehicle flow was on Xihu Avenue's straight lane (150 vehicles), and the lowest was the left turn on Santan Road north to south (14 vehicles). Due to the high traffic volume on Xihu Avenue, delays were significant when vehicles merged onto the main road. The overall service level ranged from A to B, with the worst on Santan Road north to south turning, and Xihu Avenue was generally better than Santan Road.
In the road segment evaluation (Fig. 11), the 600-s simulation showed significantly higher vehicle density on Xihu Avenue east–west than Santan Road north–south, with higher density on Santan Road's left-turn lanes. The traffic volume on Xihu Avenue was about 1,200 vehicles per hour, and Santan Road had about 500 per hour. The actual speed was close to the designed speed, with an average straight lane speed of 20−30 km/h. The relative delay was generally low.
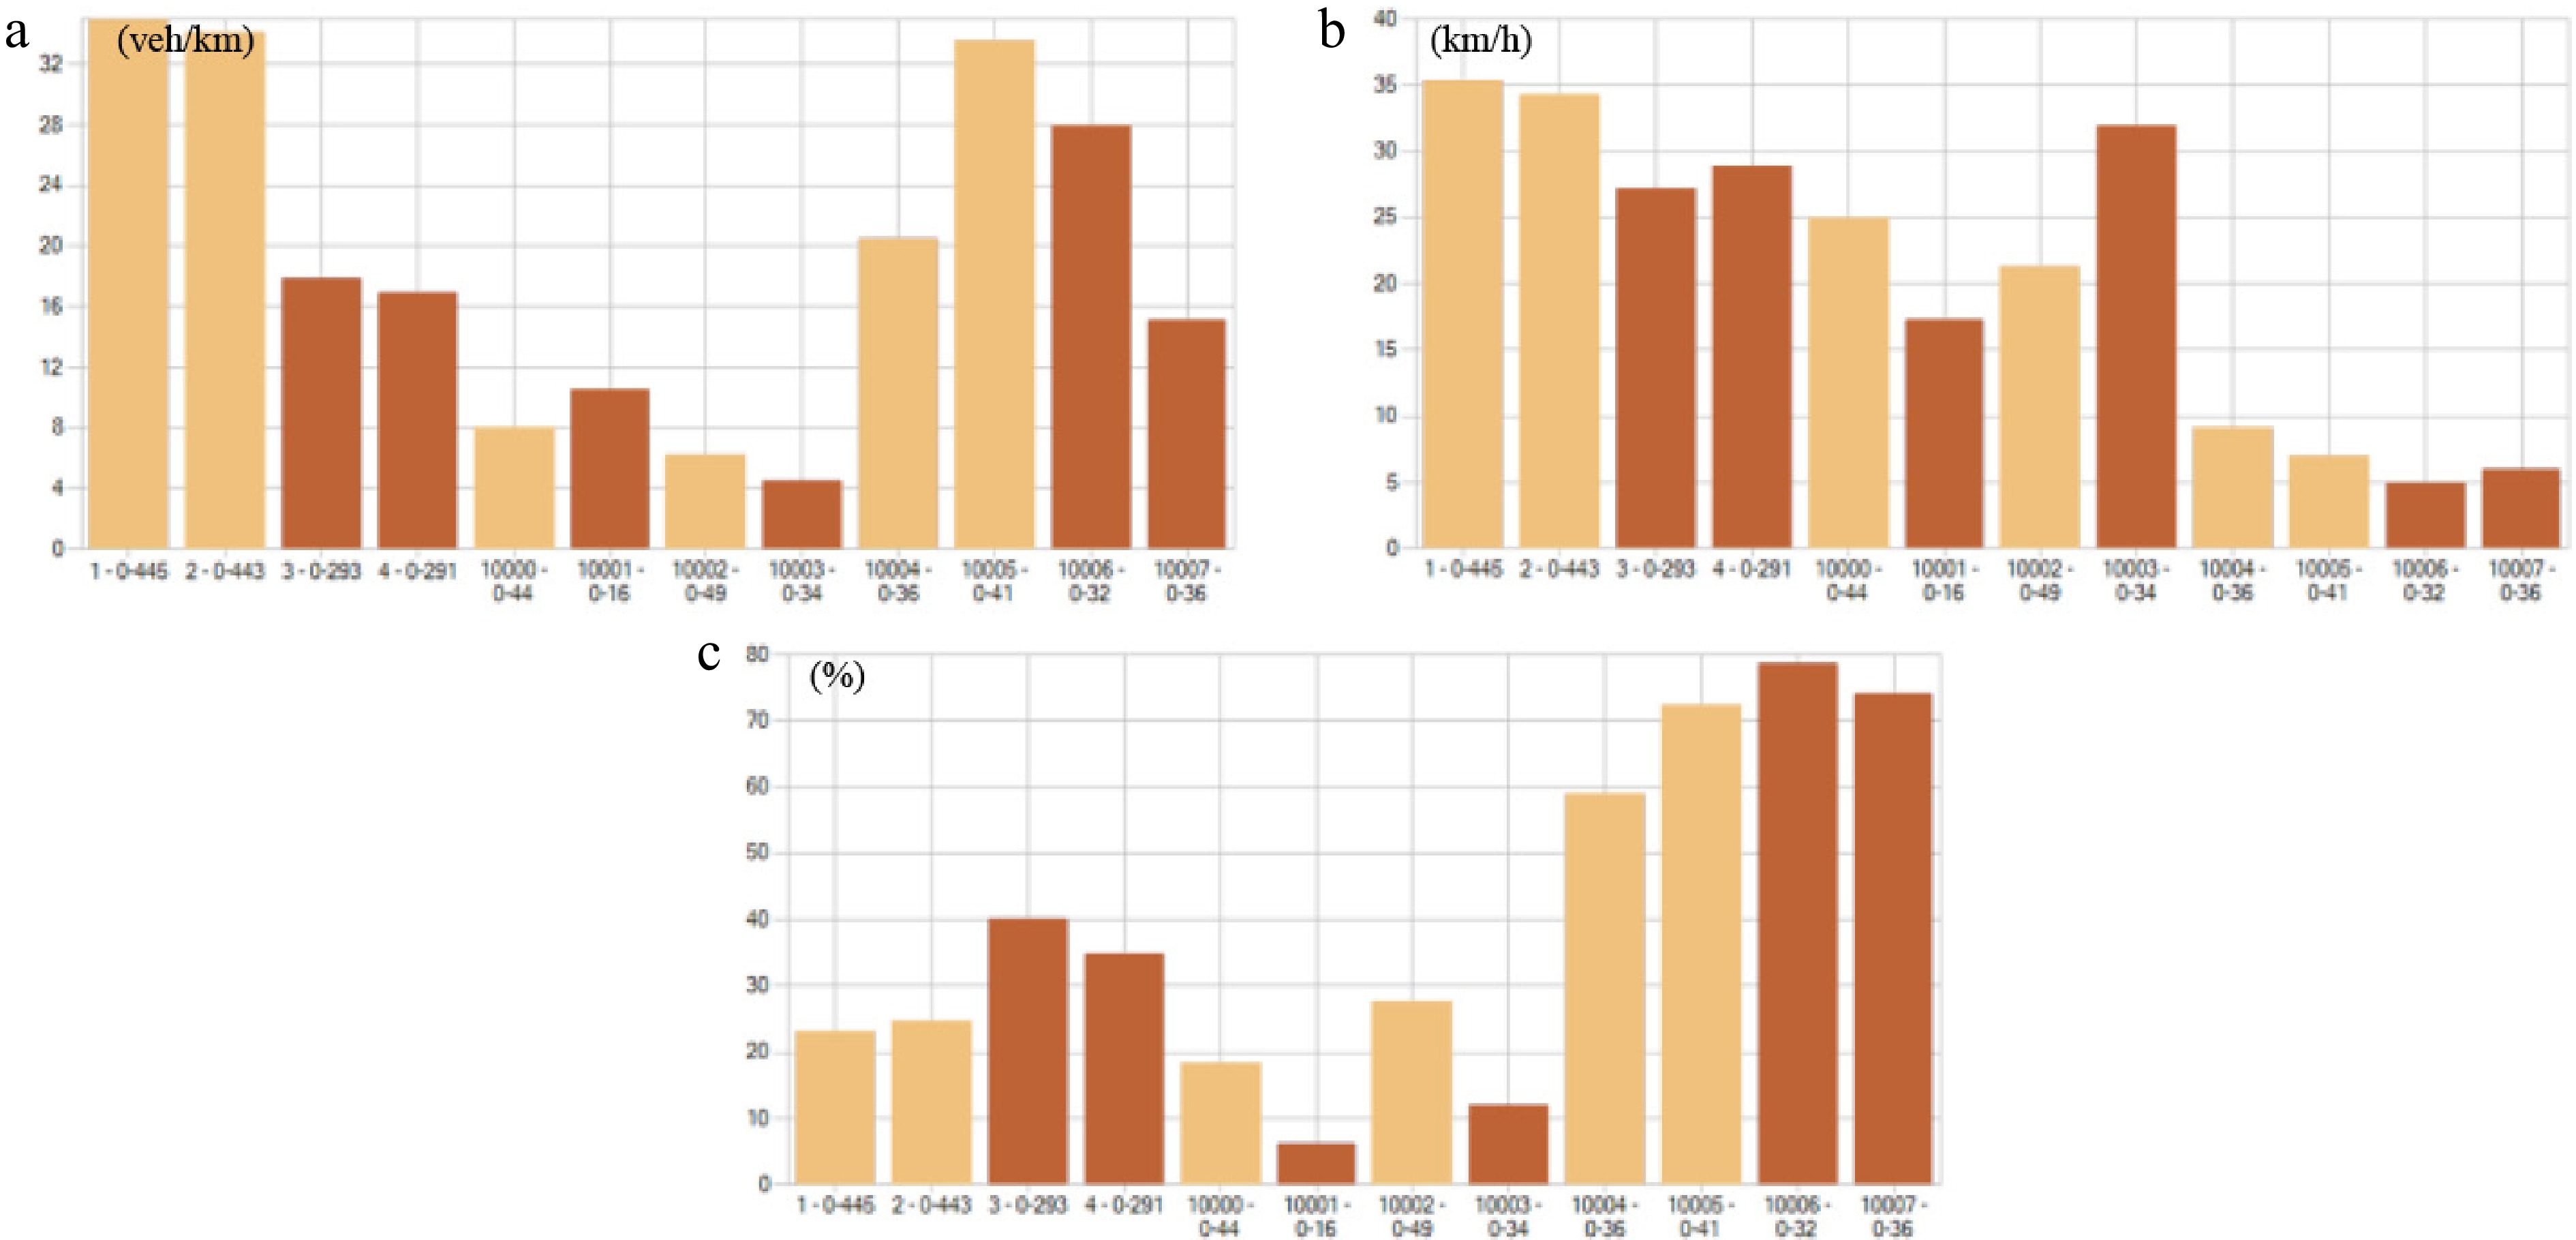
Figure 11.
Vehicle density (a), speed (b), and relative delay (c) of road segments at Intersection B.
Optimization results and simulation-based comparison of the bi-level planning model
-
The genetic algorithm was used to solve the bi-level optimization model. Road sets were encoded in the bi-level planning model. There were 34 sections in the road network, and the decision variables of the capacity transformation depth of each section were {−3, −2, −1, −0, 1, 2, 3}. Corresponding to the transformation degree of different sections, the decision variables were coded by a binary system. The binary system of correspondence between the decision variable and the transformation depth is as shown below (Table 4).
Table 4. Correspondences between decision variable binaries and transformation depth
Decision variable Binary system Capacity transformation depth −3 001 Two-way changing to one-way −2 010 Reducing two lanes −1 011 Reducing one lane 0 100 The section remains unchanged 1 101 Adding a lane 2 110 Adding two lanes 3 111 One-way changing to two-way The iterative curve of the genetic algorithm shows a continuous improvement process (Fig. 12). If we observe the decision variable outputs in the final iteration, some road segments have decision variables of 101 or 001. Thus, the optimal traffic microcirculation improvement plan includes widening Xihu Avenue to eight lanes, widening Changjiang Avenue to fourteen lanes, and converting Queqiao Road and Wenlan Road from two-way to one-way streets, forming a microcirculation system with the existing roads (Baidi Road, Sudi Road, etc.).
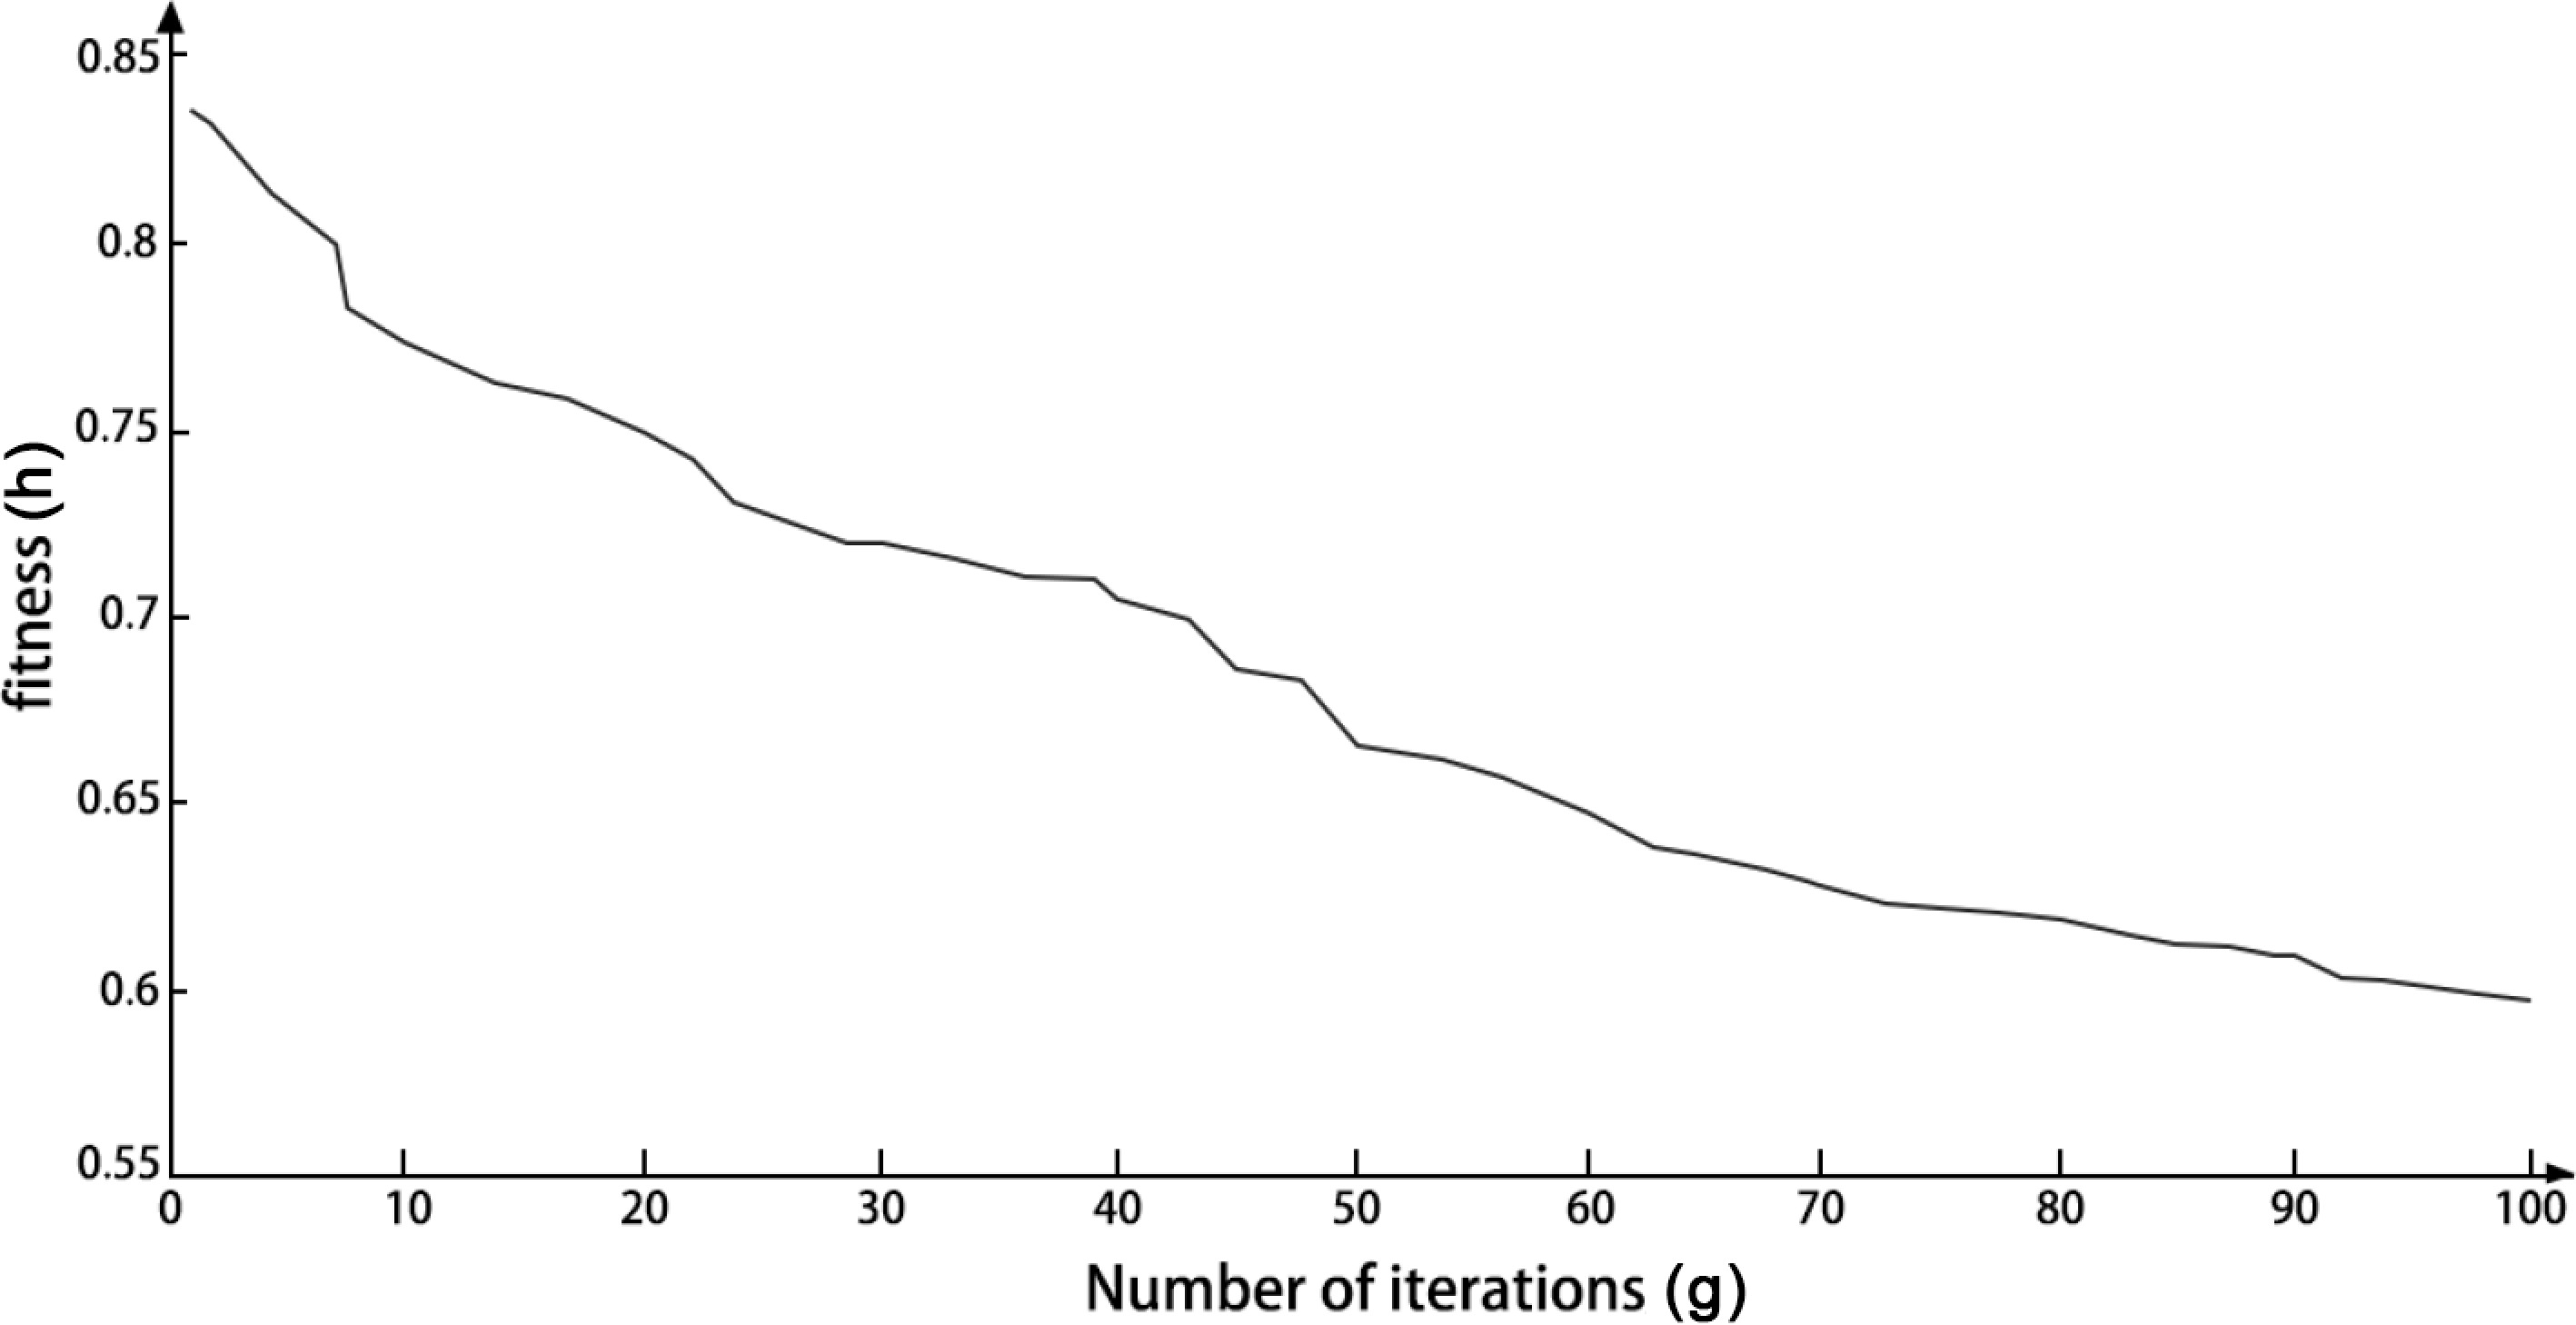
Figure 12.
Iterative curve of the genetic algorithm.
The road network before and after optimizing the traffic microcirculation is shown in Fig. 13.
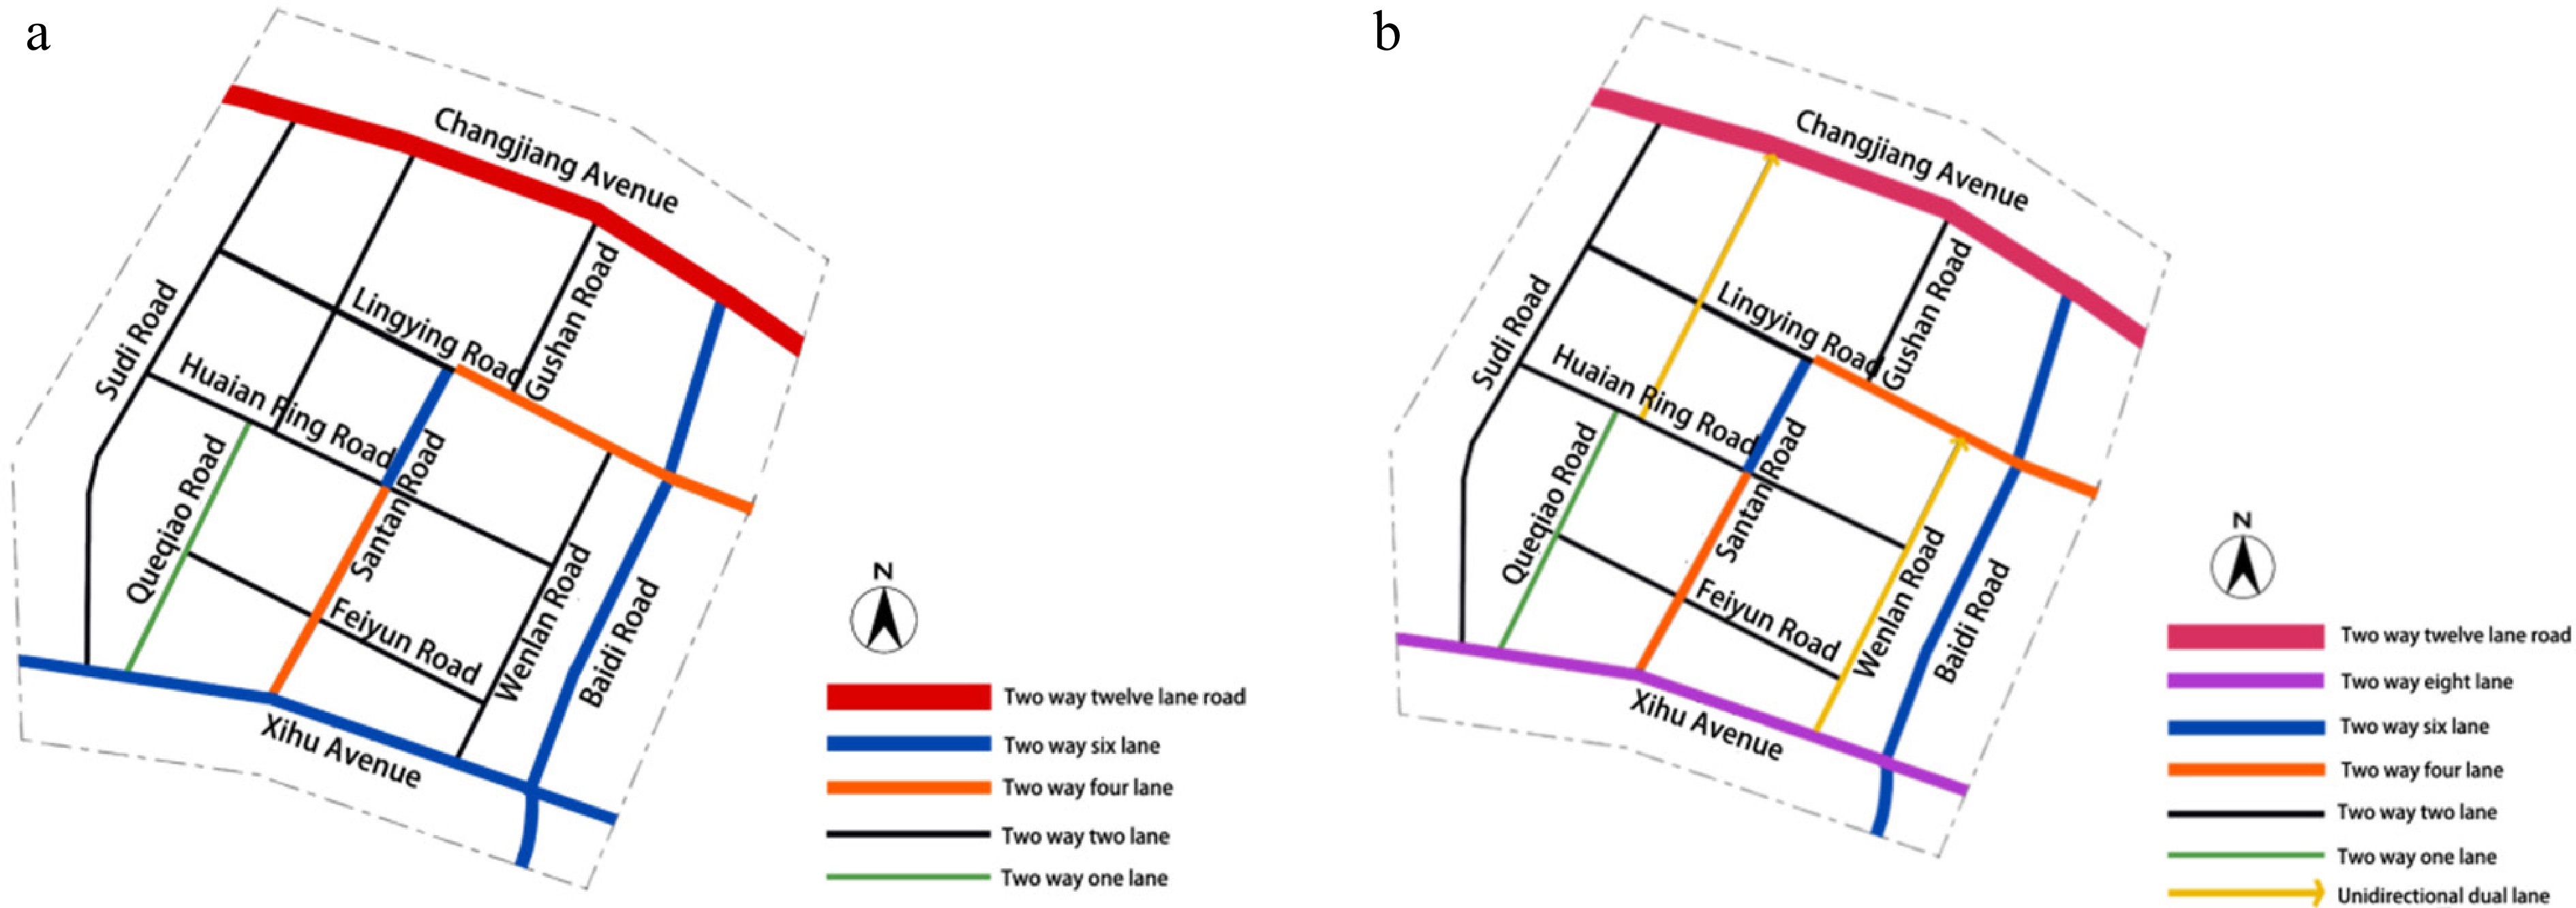
Figure 13.
Road network (a) before optimization and (b) after optimization.
Traffic service levels assigned by TransCAD
-
We input the optimization results from the bi-level planning model into TransCAD again. If we compare the two sets of charts (Fig.14), the service capacity of the road network significantly improved after optimization. In the diagram, the color of the road sections transitions from green to red, indicating increasing levels of congestion. The three road sections with significant issues (Queqiao Road [2−13], Queqiao Road [12−20], and Santan Road [7−21]) have service levels rising up to A.
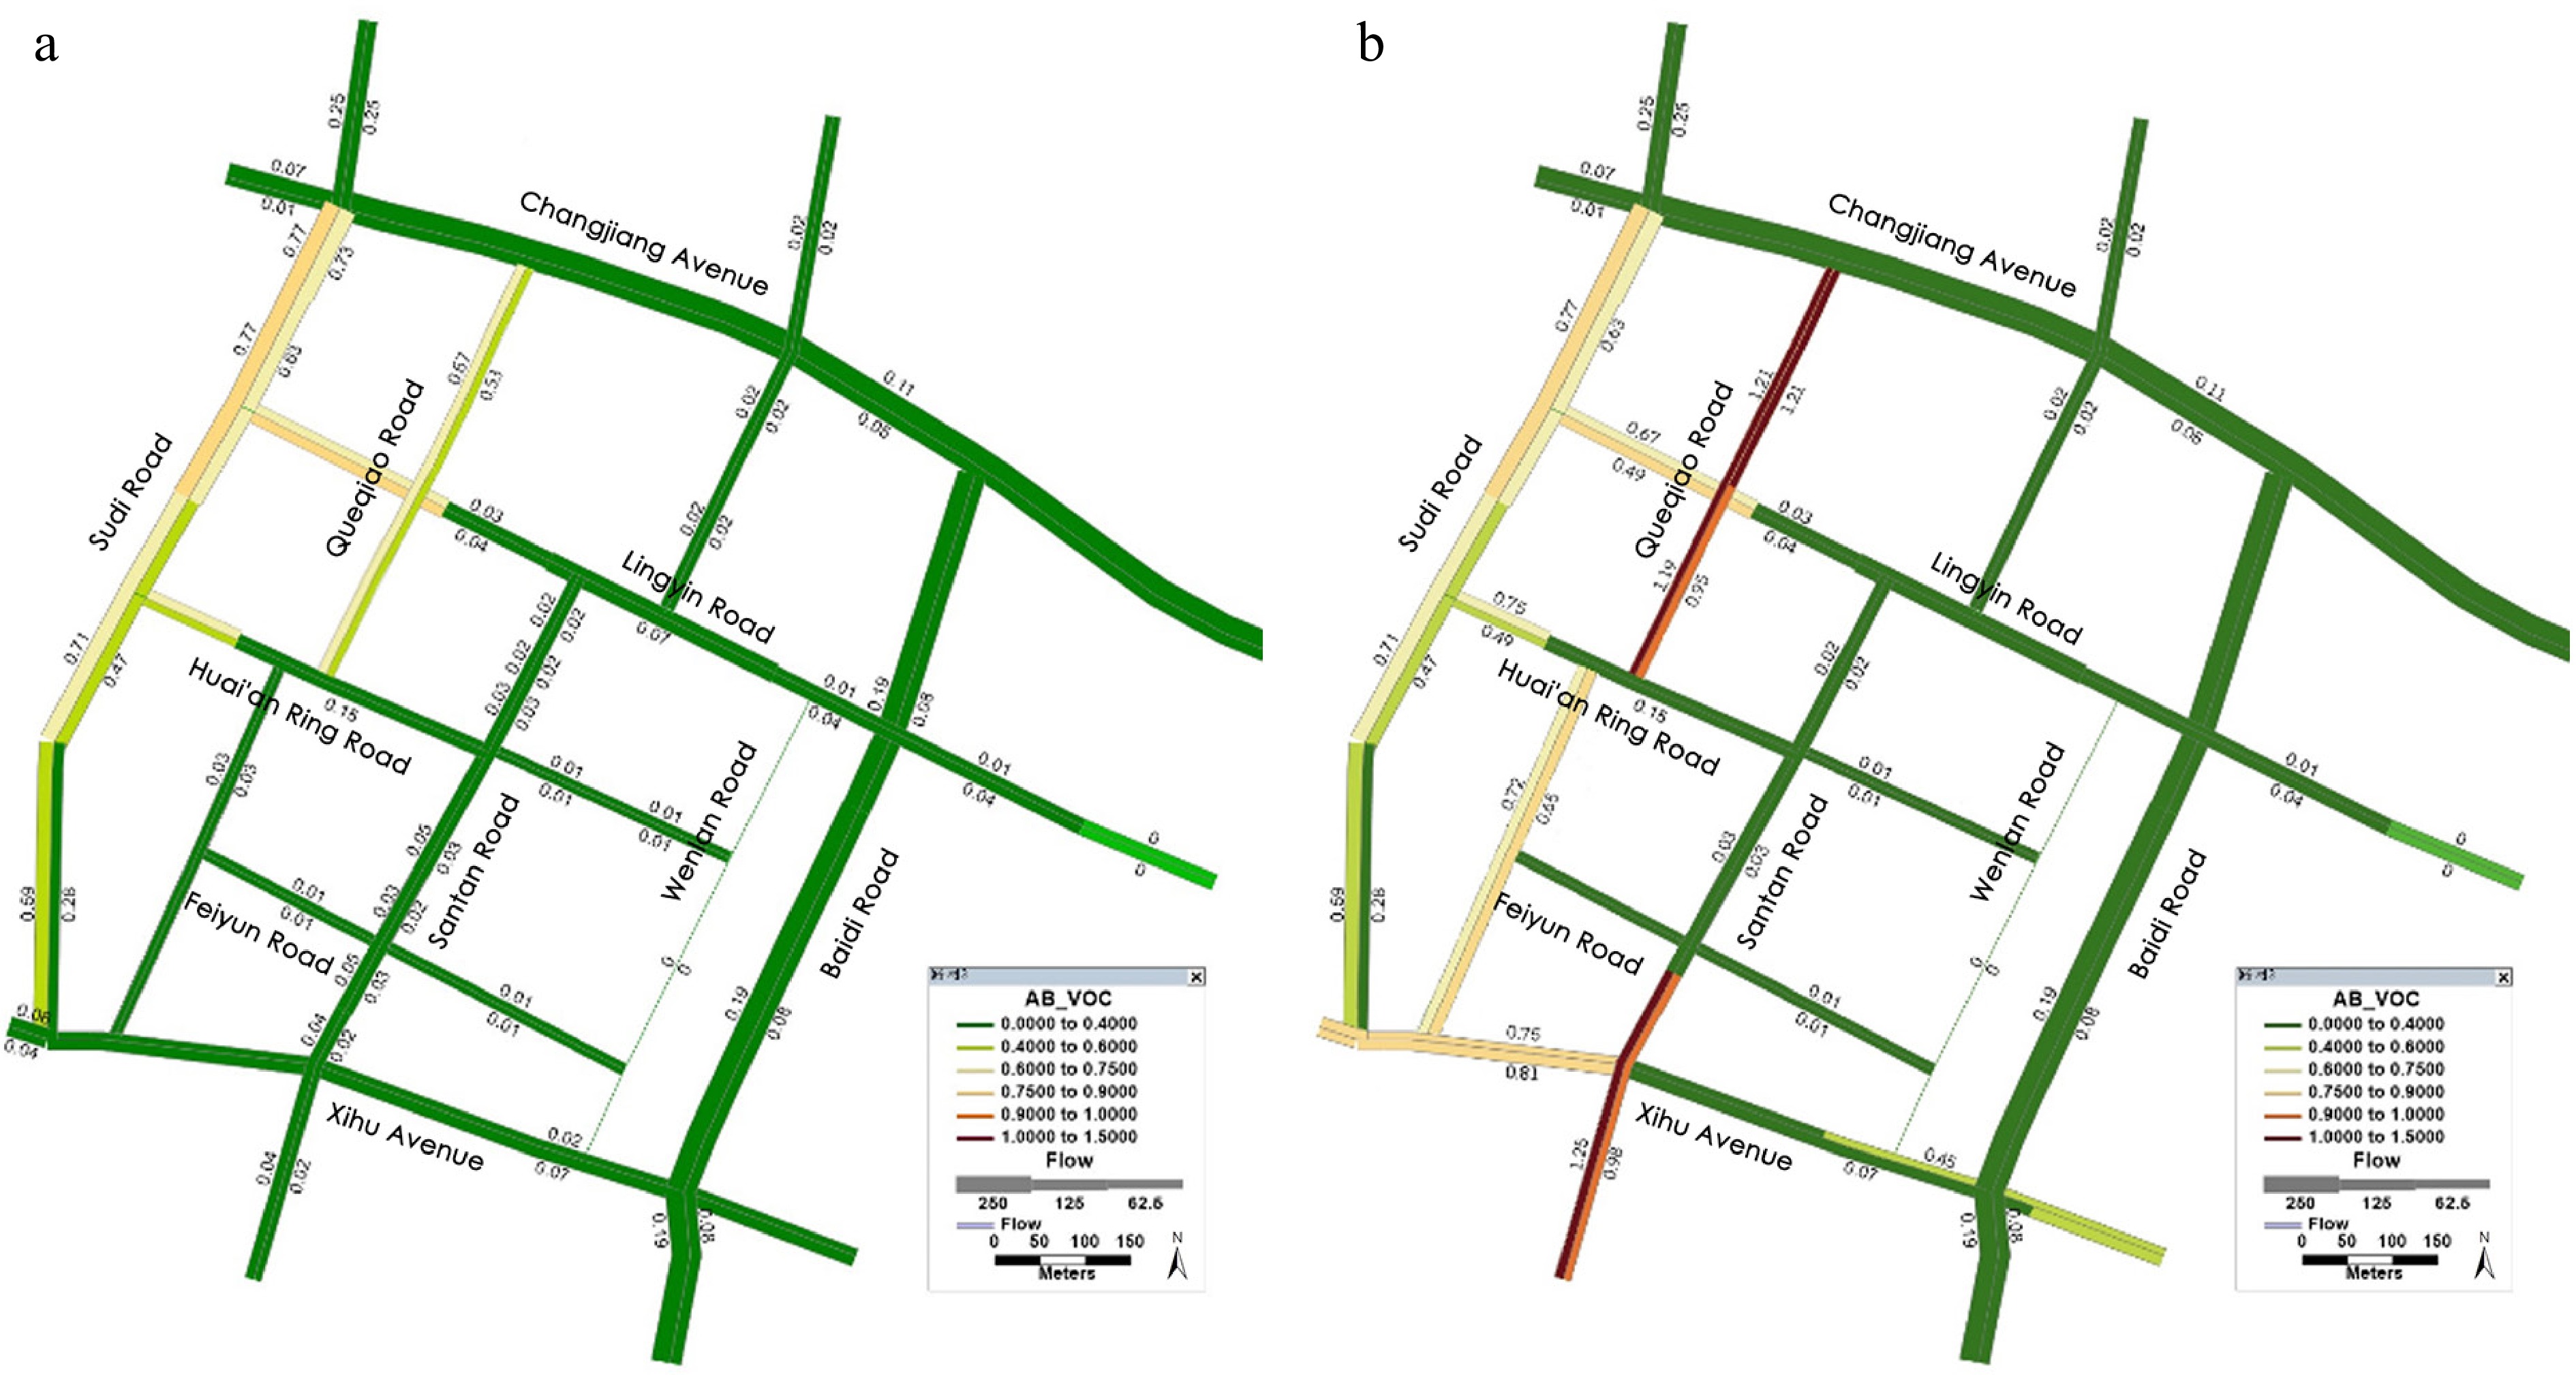
Figure 14.
Traffic service levels assigned by TransCAD (a) before optimization and (b) after optimization.
VISSIM simulation
-
The optimized intersections were re-simulated in VISSIM to test the feasibility of the optimization.
For Intersection A, we converted Queqiao Road from two-way to one-way northbound, then compared the simulation parameters (Fig.15).
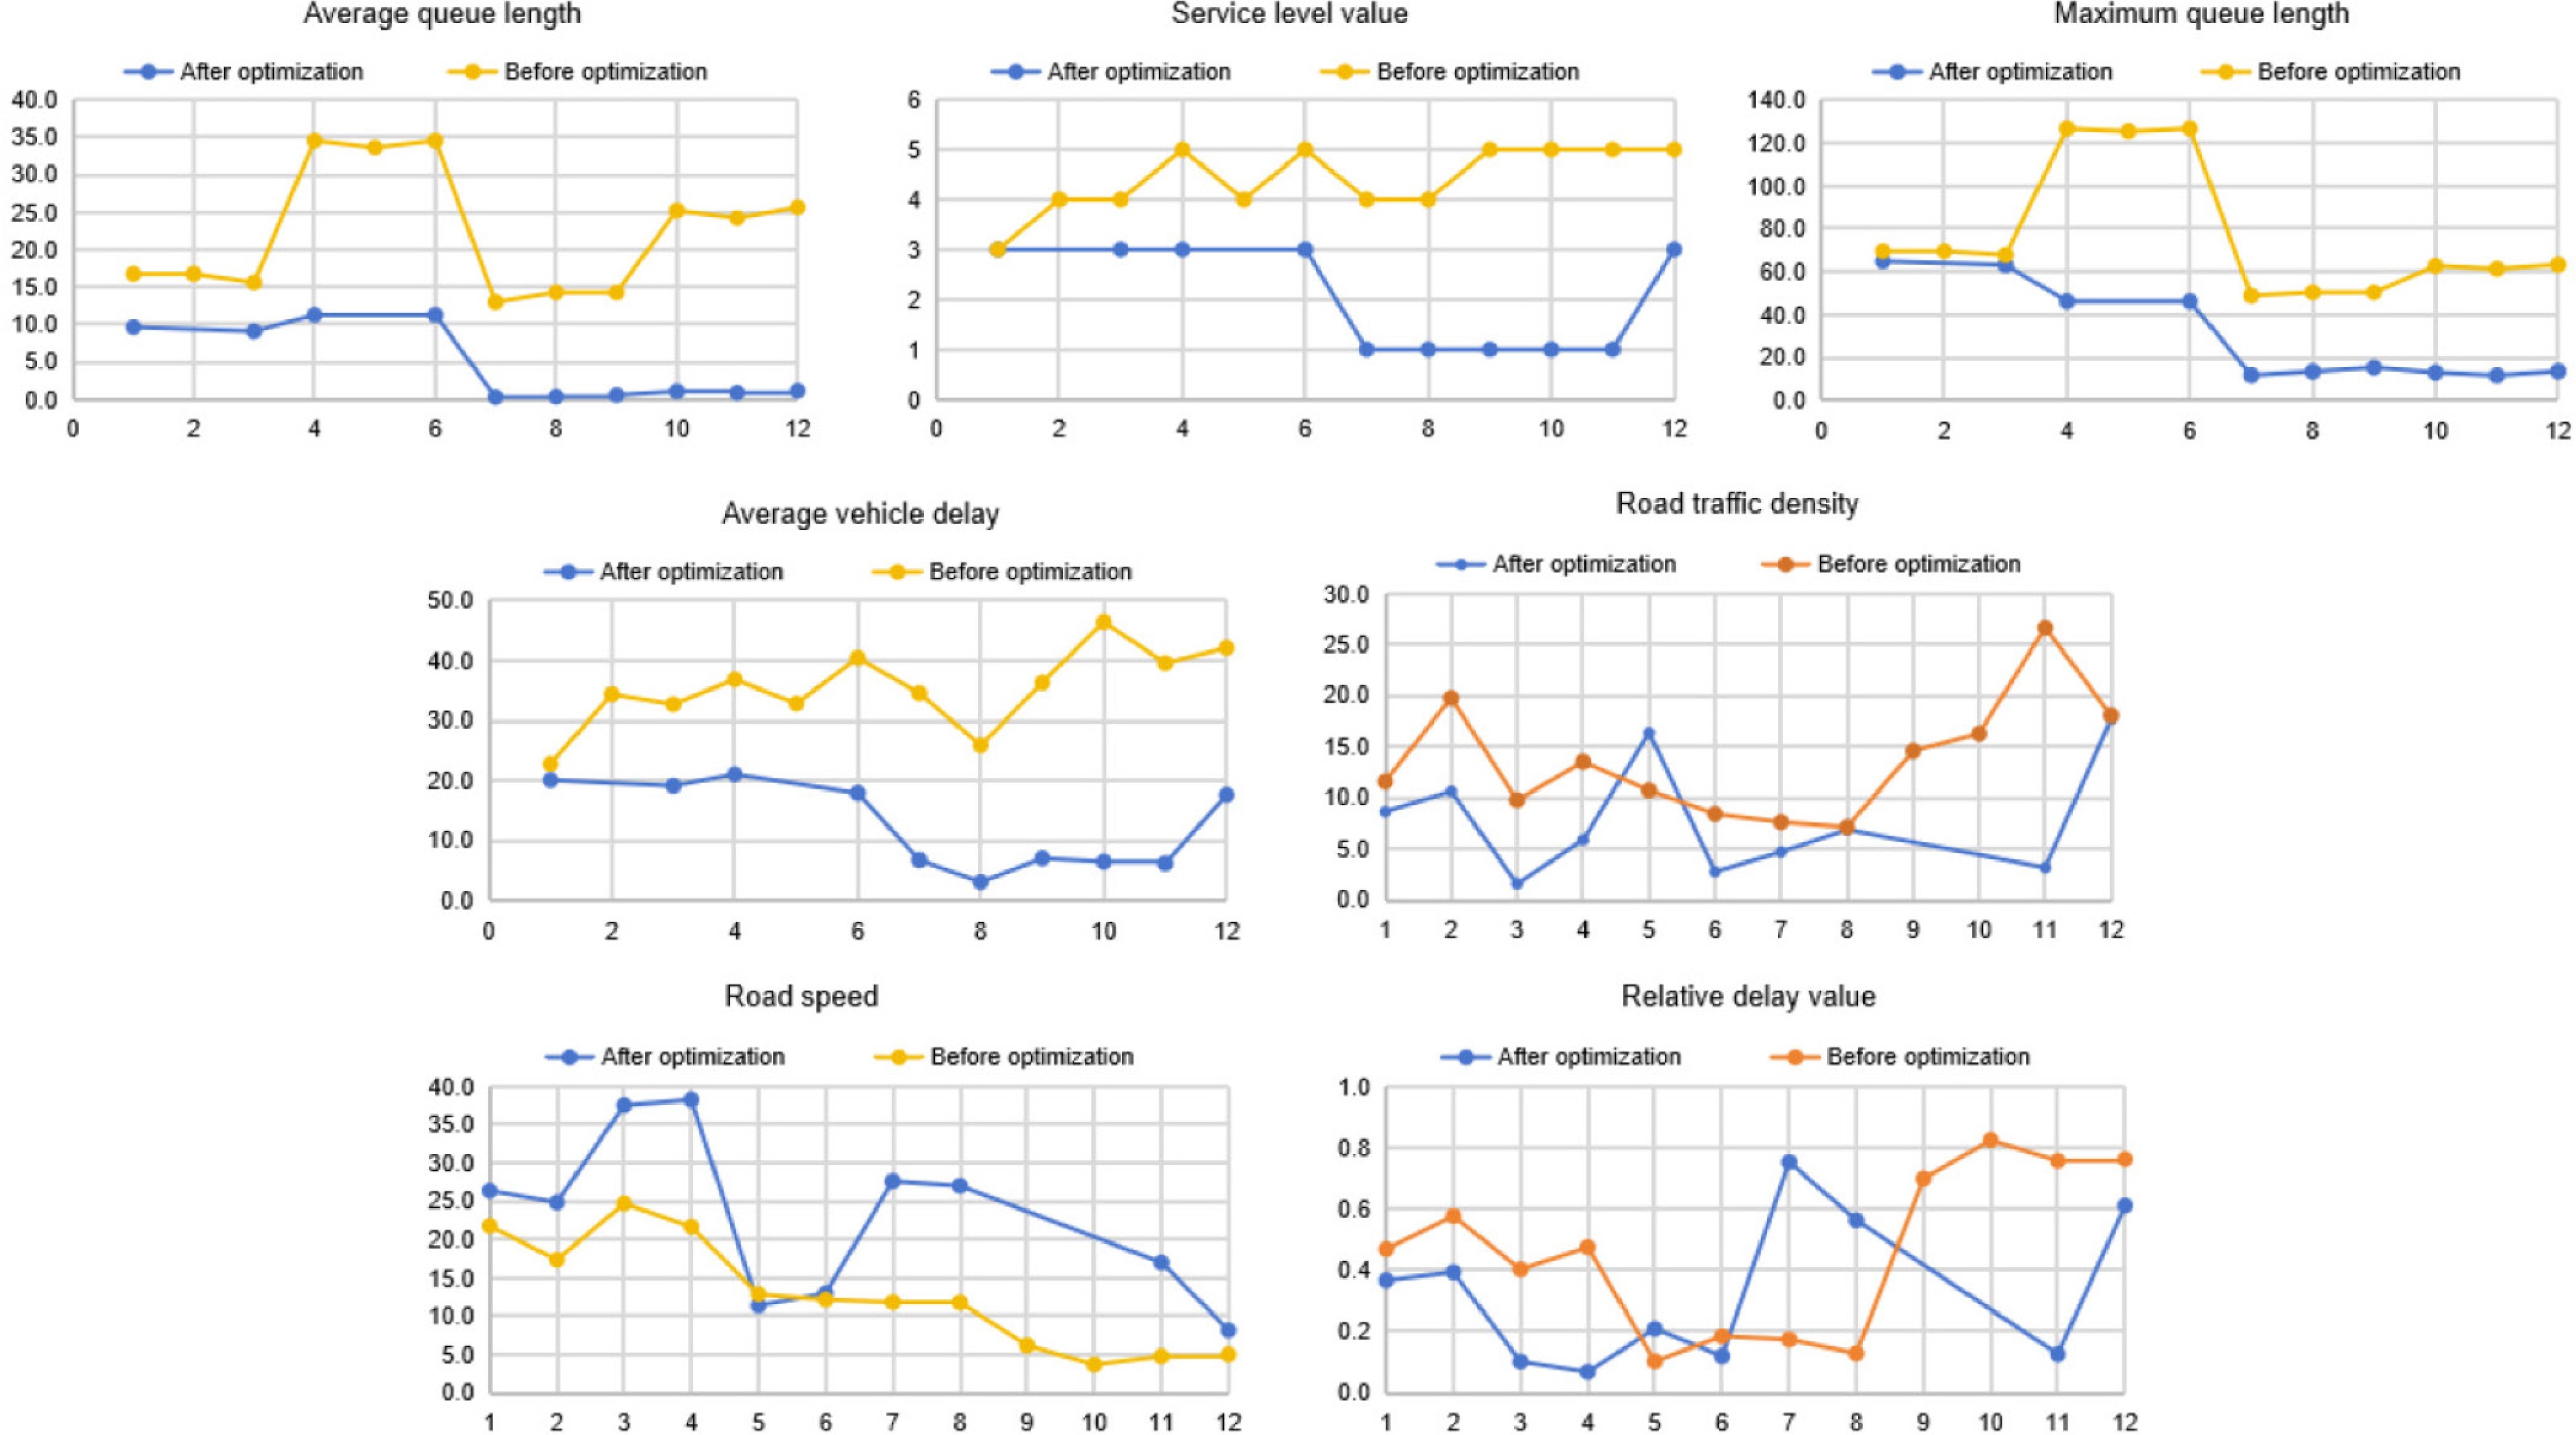
Figure 15.
Comparison of traffic capacity parameters before and after optimization at Intersection A.
After optimization, the queue length significantly decreased, with the largest reduction on Lingyin Road east to west. Overall, the queue length of Queqiao Road decreased more than that of Lingyin Road. Vehicle delays improved after optimization, and the service level increased, changing from mainly C/D/E to mainly A/C.
In the road segment evaluation, the vehicle density decreased on Queqiao Road due to reduced traffic entering the intersection from the one-way conversion. Meanwhile, vehicle speeds improved overall, with the largest increase seen for the straight and turning directions on Queqiao Road. The relative delay values decreased for all except for the right-turn lane on Queqiao Road. These improvements in the road segments' performance indicate that the optimization plan is feasible.
For Intersection B, we added one lane to Xihu Avenue and added a lane to Westlake Avenue, then compared the simulation parameters (Fig.16).
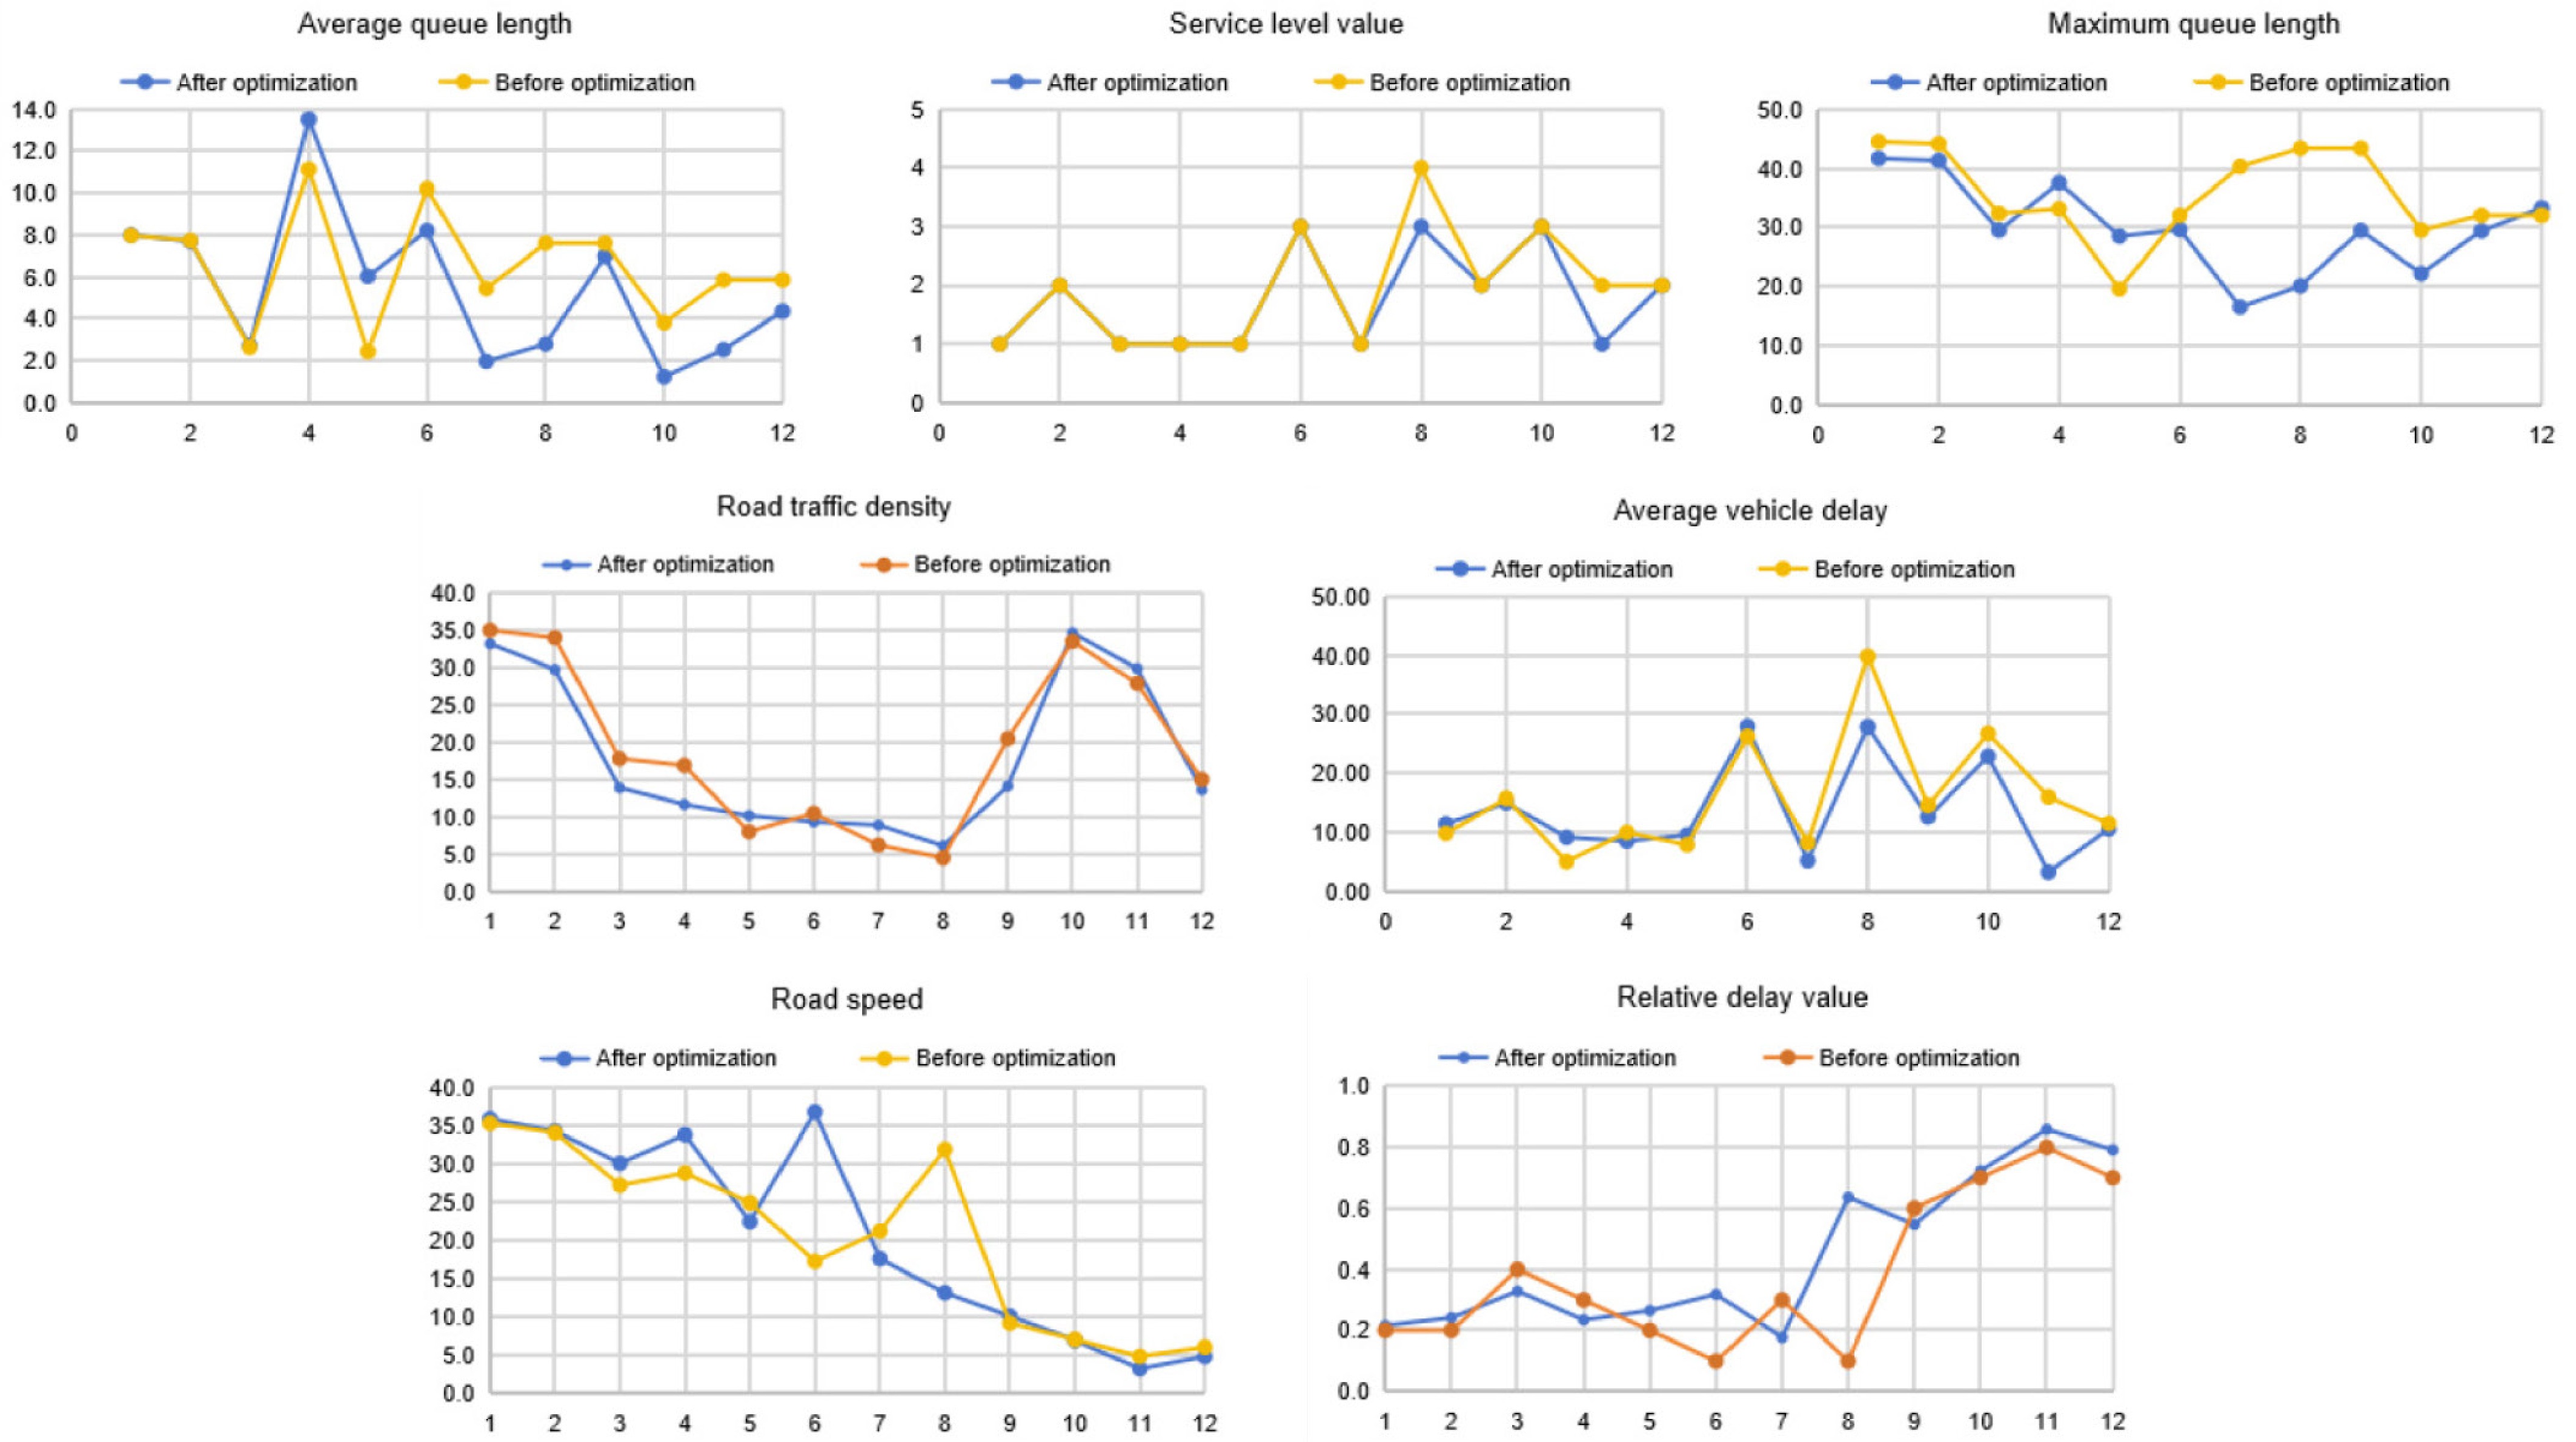
Figure 16.
Comparison of traffic capacity parameters before and after optimization at Intersection B.
After optimization, the maximum queue length on Santan Road north to south increased significantly, indicating that the effectiveness of this optimization is limited. Vehicle delays showed no significant change before and after optimization, and the service level did not improve markedly, except for the left- and right-turn lanes on Santan Road. As a whole, there was no significant improvement in queue lengths, delays, or service levels after optimization.
In the road segment evaluation, the vehicle density, speed, and relative delay showed fluctuations within the margin of error before and after optimization, indicating limited improvement in the road segment's performance from this optimization. Considering the renovation costs, this optimization plan was canceled.
After optimizing the Lingyin Road–Queqiao Road intersection by implementing one-way traffic, queue lengths were significantly reduced, vehicle delays decreased, and service levels improved, indicating a notable enhancement in overall traffic flow and the feasibility of the plan. However, at the Xihu Road–Santan Road intersection, the addition of a lane did not effectively reduce queue lengths or delays, with minimal changes in service levels. Given the lack of significant improvement and cost considerations, this optimization is not recommended.
-
Old neighborhoods, particularly in metropolitan areas, usually face the challenges of traffic issues caused by the poor transport facilities and obstructed traffic microcirculation. Improving the microcirculation's connectivity in the areas with old neighborhoods can improve urban quality, thereby contributing to urban renewal. This paper conducted an optimization of the traffic microcirculation in an old neighborhood from the perspective of scenario simulation. This study employed TransCAD for predicting macroscopic traffic volumes and VISSIM for microscopic simulation of the current situation. A bi-level optimization model of the traffic microcirculation system that considers intersection delays was constructed, followed by using the genetic algorithm to derive optimization strategies. Two conclusions can be drawn from this study.
(1) First, the traffic condition of the branch roads that intersect with the main roads is poor. Due to the high traffic volume of the main roads, there are few lanes on the side roads at the intersection, which makes it difficult to organize the turning vehicles in an orderly manner. Improper signal timing can cause conflicts with the turning traffic, and the congestion is also greatly affected by the nature of the land use.
(2) Second, changing two-way roads into one-way, widening the minor roads, and increasing the branch roads can effectively improve the traffic microcirculation. In the optimization of the road network of the case block, some roads were widened and changed to one-way in both directions, and the number of branch roads was increased. The simulation approaches successfully reduced the degree of saturation of the arterial roads, improved the utilization rate of the branch roads, and balanced the traffic volume between the arterial roads and the branch roads. Consequently, the overall effectiveness of the regional road network increased and the traffic congestion in the old neighborhood was significantly relieved.
In the era of stock planning, there is a greater need for microupgrades and microrenovations. This study has significant practical importance for reducing traffic congestion, especially in old urban areas. By improving the transport environment, it will contribute to promoting the renewal of urban public spaces and increasing the value of the area. For example, widening the minor roads by clearing the roadside barriers helps improve the flow of pedestrians and cyclists, particularly for the elderly, who often prefer walking. In addition, the branch roads in old neighborhoods are usually beset by many ambulatory vendors, often resulting in traffic congestion and making it hard for vehicles to drive through the area[46]. Promoting intervention actions such as prohibiting street vendors from plying their trade by the road during peak hours are necessary to improve the traffic environment. Thus, improving the traffic microcirculation also has the potential to become a tool for social development and urban transformation. This is the essence of urban renewal and is a strong response to the new demands of urban development in the context of high-quality development.
This study can be improved and extended in several ways. First, the bi-level planning model currently constructed in this study only considers intersection delays, and other influencing factors have not been taken into account. In future research, other factors can be added and the algorithm model can be extended. Second, the study did not include signal timing in the study of the elements of traffic microcirculation; however, in real life, it is a highly variable traffic element that can be considered in subsequent studies. Third, innovative crowd movement elements can be added to future research to fully account for pedestrian and vehicle flows and further improve the simulations' accuracy.
The authors would like to express their gratitude for the support provided by the National Natural Science Foundation of China (Grant No. 52308073) and the Natural Science Foundation of Guangdong Province (Grant No. 2025A1515010217).
-
The authors confirm their contributions to the paper as follows: study conception and design: Guo Y; data collection: Ye X, Huang K, and Liu X; analysis and interpretation of the results: Ye X, Huang K, and Liu X; draft manuscript preparation: Ye X, Huang K, and Liu X; manuscript revision: Guo Y. All authors reviewed the results and approved the final version of the manuscript.
-
The datasets generated during and/or analyzed during the current study are available from the corresponding author on reasonable request.
-
The authors declare that they have no conflict of interest.
- Copyright: © 2025 by the author(s). Published by Maximum Academic Press, Fayetteville, GA. This article is an open access article distributed under Creative Commons Attribution License (CC BY 4.0), visit https://creativecommons.org/licenses/by/4.0/.
-
About this article
Cite this article
Guo Y, Ye X, Huang K, Liu X. 2025. Optimizing the traffic microcirculation in old neighborhood based on the bi-level multi-objective model. Digital Transportation and Safety 4(4): 227−241 doi: 10.48130/dts-0025-0022 

Optimizing the traffic microcirculation in old neighborhood based on the bi-level multi-objective model
- Received: 02 January 2025
- Revised: 17 April 2025
- Accepted: 22 May 2025
- Published online: 31 December 2025
Abstract: Urban traffic congestion has become increasingly severe, along with the rapid progress of urbanization and motorization worldwide, particularly in the areas with old neighborhoods. These areas often face issues such as the slow speed of vehicles and difficulties in parking due to the incomplete traffic microcirculation system. This paper focuses on optimizing traffic microcirculation in the areas of old neighborhoods through scenario simulations. The bi-level optimization model for the traffic microcirculation system, which considers intersection delays, was developed and solved by using a genetic algorithm to devise an optimal road network strategy. By taking the case of Zhuangwangfu, an old neighborhood of Tianjin, China, we validated the optimization model. The results indicate that measures such as converting some two-way streets to one-way, widening roads, and increasing the number of minor roads can effectively reduce the saturation of main roads. These efforts can also improve the utilization of minor roads, balance traffic volumes between main and minor roads, and significantly alleviate traffic congestion in old neighborhoods. These results can also provide valuable insights for alleviating traffic congestion through traffic microcirculation, thus improving the urban environment.