


-
During the rapid processes of urbanization and motorization in megacities, safety concerns at signalized urban road intersections have become increasingly prominent. According to the 'Statistical Annual Report on Road Traffic Accidents' issued by China, approximately 600 to 800 accidents occurred annually at signalized urban road intersections from 2013 to 2023, with a portion attributed to pedestrians' red-light running. Such behavior has led to around 200 to 300 fatalities of pedestrians each year at intersections, who are often the most vulnerable group. Despite clear regulations outlined in China's 'Road Traffic Safety Law' regarding how pedestrians should cross intersections, instances of red-light running persist. These behaviors not only disrupt traffic order but also contribute to an increase in traffic accident rates. Moreover, recent studies have shown that human mobility behaviors are not independent but exhibit strong correlations across individuals, and that such correlated behaviors may further propagate across space and time, forming complex group-level movement patterns in transportation systems[1,2]. Therefore, it is essential to analyze the underlying reasons for pedestrians' red-light running behaviors at signalized urban road intersections before proposing an automatic detection framework for early warnings. Potential measures could effectively enhance intersection traffic capacity, and alleviate congestion on urban arterial roads.
Existing research relies on questionnaire surveys[3], video surveys[4], on-site surveys[5−8], or multi-modal fusion surveys[5] to collect data on pedestrians' red-light running behaviors. Potential causes that trigger such behaviors were extensively explored. For example, Chen et al.[5], and Wang et al.[9] found that pedestrians' red-light running behaviors were influenced by demographic factors like age, gender, personal attitudes, individual personality traits, distraction from smartphone use, and urgency to save time. Zhuang et al.[8] also discovered that pedestrians' red-light running behaviors were affected by other companions' engagement in the same behavior. In addition to the above causal factors, Mukherjee & Mitra[3], Diependaele[7], and Guo et al.[10] found that environmental factors also caused pedestrians' red-light running behaviors, such as traffic volume, road intersection design, surveillance deployment conditions, or climatic conditions. Based on the above exploration of potential causal factors, other scholars also developed logistic regression models[3,4,10], or Probit models[9] to measure the extent to which potential causes influence pedestrians' red-light running behaviors. However, few studies have comprehensively integrated these three types of causes to analyze their comprehensive impact on pedestrians' red-light running behaviors.
In addition to quantifying potential causes of pedestrians' red-light running, Khan et al.[11], and Brunetti et al.[12] have explored supervised detection methods for pedestrian targets under normal conditions using image and video data. Enough supervised annotations were provided in this process. Other scholars have focused on more challenging conditions, such as occlusion by crowds[13], severe weather[14], abnormal pedestrian postures[15], poor lighting conditions[16], and uneven density distributions[17], to detect pedestrian targets. Considering that there may also be unlabeled pedestrian targets, other scholars have proposed methods such as cyclic semantic transfer networks[18], online optimization methods[18], and multi-expert learning methods[19−21] to conduct unsupervised detection research on pedestrians, aiming to expand applicable scenarios for pedestrian target detection. However, current research has focused on how to detect pedestrian targets rather than their red-light running behaviors. Although other studies applied supervised learning approaches to detect these behaviors, they often neglected to delve into the interpretable causes.
In this context, this paper proposes a supervised learning framework for pedestrians' red-light running behaviors that is based on interpretable factors. First, a survey dataset containing thousands of pedestrians' intersection-crossing behaviors was collected. Based on this dataset, multiple factors causing red-light running behaviors were extracted and labeled with binary values, before performing a binary logistic regression analysis to quantify how causal factors influence such behaviors. The causal factors was further utilized by five classifiers to explore their performances on automatic detection of pedestrians' red-light running behaviors. The derived optimal classifier would be used to improve the detection accuracy of pedestrians' red-light running behaviors by precisely identifying their underlying causes. Furthermore, it may indirectly assist managers in designing more scientific intersection layouts or formulating more effective measures to reduce pedestrians' red-light running behaviors, and guarantee the order and efficiency of urban signalized intersections. The proposed supervised learning framework can assist traffic planners in optimizing intersection layouts, reducing red-light running by adjusting signal cycles, and adding waiting areas. It also offers a basis for intervention strategies like stricter law enforcement, and public education campaigns.
In the analysis of the causes of pedestrians' red-light running behaviors, existing research has identified multiple causal factors that may contribute to pedestrians' red-light running behaviors. For instance, Zhu et al.[4] conducted multiple surveys using questionnaires or video recordings at various layouts of signalized intersections in Hong Kong. They then extracted numerous factors and quantified their impact on pedestrians' red-light running behaviors using Logit regression, or mixed logit models based on minimum regret theory. These factors encompassed pedestrians' gender, age, personality traits, or the size of waiting companions, intersection layout, and the trade-off between safety and perceived benefits of violating the red light. Mukherjee & Mitra[3] launched questionnaire surveys to compare pedestrians' crossing behaviors at 'safe' and 'unsafe' signalized intersections in Indian cities. They developed a logistic regression model to identify key influencing factors, including road infrastructure, traffic operational characteristics, and pedestrians' attitudes toward red-light running violations. Chen et al.[5] analyzed pedestrians' red-light running behaviors caused by smartphone distractions (such as gaming, calling, texting) at signalized intersections in Taipei City, using both on-site and questionnaire surveys. Fraboni et al.[6] investigated pedestrians' red-light running behaviors at signalized intersections in Bologna, Italy, through on-site surveys, and analyzed the influence of various demographic factors. Diependaele[7] conducted large-scale on-site observations in nine Belgian cities to analyze the prevalence of pedestrians' red-light running behaviors and their relationship with traffic flow, infrastructure characteristics, or situational factors. Zhuang et al.[8] investigated pedestrians' decision-making during the clearance phase at signalized intersections through on-site observations, examining the types of factors that may influence such violation behaviors. Wang et al.[9] applied a Probit model to analyze the relationship between pedestrians' red-light running behaviors and injury severity at signalized intersections in Hong Kong, accounting for unobserved individual-specific heterogeneity. Guo et al.[10] explored heterogeneous characteristics of pedestrians who run red lights at different crossing facilities, and employed a Bayesian network to measure how these characteristics influence pedestrians' red-light running behaviors. In summary, previous studies have extracted a wide range of causal factors from demographic-discipline, self-discipline, external-discipline, and environmental-discipline facets to describe pedestrians' red-light running behaviors. However, few of them have comprehensively integrated causal factors for a quantitative analysis of potential influences on pedestrians' red-light running behaviors. Guo et al.[22] integrated Bayesian networks with fault tree analysis to assess traffic safety risks in airport aircraft activity areas. They identified influencing factors from human, vehicular, road, environmental, and management perspectives, quantified their relationships, and established a risk evaluation model that offers robust support for airport road traffic safety management. Owais & El Sayed[23] enhanced the analysis of red-light running behavior at 20 signalized intersections in Riyadh by integrating Deep Residual Neural Networks (DRNNs) with Variance-Based Sensitivity Analysis (VBSA). This approach improved predictive accuracy and offered interpretable insights for traffic management via VBSA, emphasizing key factors like maximum queue length, green light duration, and cycle time.
In the aspect of automatic detection of pedestrians' red-light running behaviors, in addition to quantifying potential causes of pedestrians' red-light running, previous studies have also delved into supervised learning methods for detecting pedestrian targets under normal conditions using image and video data. For instance, Khan et al.[11] emphasized the importance of providing sufficient supervised annotations in a classification task, which typically involves four stages: preprocessing, feature extraction, training, and testing. Building on these stages, Brunetti et al.[12] developed a deep-learning-based classifier for automatic detection of pedestrian targets under standard conditions. Boukerche et al.[13], on the other hand, focused on crowd occlusion scenarios and proposed an advanced method for detecting pedestrian targets in autonomous driving systems. Li et al.[14] introduced a YOLO-based deep learning approach for pedestrian detection, which proved effective even on foggy days. Pustokhina et al.[15] incorporated abnormal pedestrian postures into their detection task and proposed a deep neural network that successfully classified pedestrian targets. Cao et al.[16] presented a more sophisticated method that considered multi-spectral segmentation and feature fusion for pedestrian detection, achieving impressive performance under poor lighting conditions. Xiao et al.[17] focused on the issue of uneven pedestrian density distribution in practical scenarios, and proposed a supervised learning method tailored to this context. Qie et al.[24] focused on the issue of pedestrian occlusion at unsignalized intersections and proposed the HAERC object detection model. By incorporating pedestrian head features and the ENMS algorithm, this model effectively enhanced the recognition accuracy of occluded pedestrians, thereby extending the sight distance for vehicles at unsignalized intersections, and promoting driving safety.
However, supervised learning of pedestrians heavily relies on extensive annotations, which may not always be available in practice. To address this limitation, some studies have proposed unsupervised detection approaches. For example, Mou et al.[18] developed a gradual optimization algorithm featuring a cyclic semantic transfer network for online detection of pedestrians in specific scenes. Tang et al.[19] designed a multi-expert learning method to fuse pedestrian detectors in an unsupervised setting, thereby enhancing the model's generalization ability on real-world datasets. While these studies have primarily focused on detecting pedestrian targets rather than their red-light running behaviors, other research has applied supervised learning approaches to detect these behaviors but often failed to delve deeply into the underlying interpretable causes.
Previous studies have collected data on pedestrian red-light running behaviors via questionnaire surveys, video surveys, on-site surveys, or multi-modal fusion surveys, and have explored the potential causes triggering such behaviors. Some scholars have also developed Logit or Probit models to measure the extent of influence of these potential causes on pedestrians' red-light running behaviors. However, few studies have comprehensively integrated demographic factors, self-discipline factors, external-discipline factors, and environmental-discipline factors to analyze their combined impact on red-light running behaviors. Moreover, most prior supervised learning studies on red-light running behaviors have not delved into their interpretable causes.
Therefore, it is crucial to first gain a thorough understanding of how potential causal factors, related to demographic characteristics, self-discipline, external regulations, or environmental conditions, contribute to pedestrians' red-light running behaviors at urban signalized intersections. Based on this understanding, supervised learning of such behaviors can be effectively conducted to enable early warning and intervention.
-
Two methods were utilized to investigate the reasons behind pedestrians' red-light running behaviors, namely an objective video survey, and a subjective questionnaire survey.
For the video survey, a series of videos were collected from real-world scenarios, which took into consideration various factors contributing to red-light running. These factors were categorized into four facets: demographic-discipline, self-discipline, external-discipline, and environmental-discipline. Specifically, demographic-discipline mainly concerns the impact of pedestrians' fundamental demographic traits on their red-light running behavior. Self-discipline mirrors the degree to which pedestrians' subjective elements constrain their adherence to traffic rules. External-discipline focuses on the regulatory effect of external individuals or law-enforcement settings on pedestrians' actions. Environmental-discipline highlights the influence of the intersection's surrounding environmental conditions on pedestrian behavior.
• The demographic-discipline facet includes factors like pedestrians' gender, age, education level, occupation, familiarity with regulations.
• The self-discipline facet includes factors like the importance of a trip, familiarity with an intersection, or proximity to a scheduled time.
• The external-discipline facet encompasses factors like the presence of companions, or the leniency of law enforcement.
• The environmental-discipline facet includes factors such as long waiting time, existence of points of interest (POI) nearby an intersection, or low road traffic.
The pedestrians' red-light running data obtained from the video survey was quantified using a feature matrix
$ X\in {\mathbb{R}}^{N\times D} $ $ X=\left[\begin{array}{ccc}{f}_{1}^{1}& \dots & {f}_{1}^{D}\\ \dots & \dots & \dots \\ {f}_{N}^{1}& \dots & {f}_{N}^{D}\end{array}\right] $ $ y $ To validate the consistency of the feature matrix obtained from the video data, a questionnaire survey was also designed by leveraging pedestrians' subjective perceptions toward red-light running causes.
Causal analysis of pedestrians' red-light running behaviors
-
Using the dataset comprising the feature matrix X and its label y, i.e., [X,y], a binary logistic regression analysis is performed to assess the impact of individual factors, together with their combinations, on pedestrians' red-light running behaviors. The mathematical model is denoted by Eq. (1) at a significance level of 0.001. Specifically, P represents the probability of a pedestrian committing a red-light running violation. The logit value of P, denoted as logit(P), is a dependent variable in Eq. (1). Each fi corresponds to a causal factor identified in the previous section, explaining pedestrians' red-light running behaviors, and serves as an independent variable. The coefficient estimate αi interprets the extent to which each factor causes pedestrians' red-light running behaviors. C is a constant intercept term.
$ \left\{\begin{array}{l}\mathrm{l}\mathrm{o}\mathrm{g}\mathrm{i}\mathrm{t}\left(\mathrm{P}\right)\sim C+\sum_{i\in[1,D]}^{ }\alpha_if_i \\ \mathrm{l}\mathrm{o}\mathrm{g}\mathrm{i}\mathrm{t}\left(\mathrm{P}\right)=\mathrm{l}\mathrm{n}\dfrac{P}{1-P}\end{array}\right. $ (1) Supervised learning of pedestrians' red-light running behaviors
-
Five groups of supervised learning experiments using the aforementioned dataset was carried out to evaluate the performance of various classifiers in predicting pedestrians' red-light running behaviors. The chosen classifiers include Naïve Bayes, Decision tree, Random forest, Logistic regression, and Multi-layer perceptron, each offering unique classification strengths. In the supervised learning experiments, the Random forest classifier was configured with 500 trees to balance its capacity to capture complex decision rules against the risk of overfitting. At each tree split, the square root rule for feature selection was employed, randomly choosing the square root of the total number of features to evaluate. This approach enhanced model diversity and generalization. For the multilayer perceptron classifier, a network with three hidden layers containing 64, 32, and 16 neurons, respectively, was designed, respectively, all using ReLU activation functions. To mitigate overfitting, dropout layers with discard rates of 0.5, 0.3, and 0.2 were applied after each hidden layer. During training, stochastic gradient descent (SGD) was used as the optimization algorithm with a learning rate of 0.01. An early stopping mechanism was also implemented, halting training if the validation loss remained unchanged for 10 consecutive epochs.
For each classification experiment, a classifier analyzed the training dataset and produced an inferred function, with control parameters iteratively adjusted and learned through 10-fold cross-validation. Supervised learning performance was evaluated on a testing dataset using three metrics: precision, recall, and AUC (the area under curve ROC, or Receiver Operating Characteristic). Precision and recall are denoted by Eqs (2) and (3), respectively.
$ \mathrm{Precision}=\dfrac{\mathrm{T P}}{\mathrm{T P}+\mathrm{F P}} $ (2) $ \mathrm{Recall}=\dfrac{\mathrm{T P}}{\mathrm{T P}+\mathrm{F N}} $ (3) In the equations provided, true positive (TP) refers to positive instances correctly identified as positive, False Negative (FN) to negative instances correctly identified as negative, and False Positive (FP) to negative instances incorrectly classified as positive.
• Precision measures the accuracy of positive predictions by calculating the proportion of pedestrians correctly identified as generating red-light running behaviors (TP) out of all those predicted to do so (TP + FP).
• Recall assesses the completeness of identifying all actual positive instances by calculating the proportion of pedestrians correctly identified as generating red-light running behaviors (TP) out of all those who actually did so (TP + FN).
• AUC is the area under curve ROC, the latter of which provides a graphical representation of the trade-offs between TP rates and FP rates. The AUC value is a quantitative measure, ranging from 0.5 to 1, to help assess a classifier's ability in distinguishing pedestrians' red-light running behaviors.
Simultaneously, the effectiveness of the feature engineering built for on-line automatic detection of pedestrians' red-light running behaviors was evaluated.
-
For the video survey, a total of 2,000 videos were collected from real-world scenarios, each capturing a single instance of pedestrians crossing an intersection. For the questionnaire survey, 2,000 questionnaires were distributed from April 10, 2023, to May 10, 2023, to validate the consistency of the feature matrix obtained from the video data, by leveraging pedestrians' subjective perceptions toward red-light running causes. After excluding invalid questionnaires that were completed too quickly, or contained inconsistent answers, 92.8% of the questionnaires were deemed valid.
A validity test, together with a reliability test, was conducted on participants' answers obtained from the questionnaires. It was found that the subjective results obtained from the questionnaire survey validate the consistency of the video survey with a significance level of 90%. In other words, there are enough reasons to believe that the feature matrix obtained from the video data is effective to be used to recognize pedestrians' red-light running behaviors.
Next, the demographic attributes of those respondents who answered the questionnaires were analyzed. The results showed that the ages of the respondents ranged from 20 to 50 years. Among them, 47% are females, indicating the male-to-female ratio is close to 1:1. As to education level, the respondents with bachelor's degrees or higher made up 58%, and those with education below a bachelor's degree accounted for 42%. As to occupation, the respondents included 38% students, 27% public officials, 26% workers with different kinds of fields, and 9% from other occupations. As to familiarity with regulations, 53% of the respondents were very familiar, and 42% were familiar with the 'Road Traffic Safety Law of the People's Republic of China', while only 5% being unfamiliar with it. It can be seen that the demographic attributes of the sampled population generally conform to the distribution of the Chinese society's population.
The impact distribution of different causal factors that trigger pedestrians' red-light running behaviors were examined independently, with visualization results illustrated in Fig. 1. In the self-discipline facet, 32% of participants would commit red-light running behaviors when a coming trip is very important. This value would become 31% when a causal factor turns to be familiarity with an intersection. Except for these two factors, proximity to a scheduled time in the facet of self-discipline is the most striking one that triggers pedestrians' red-light running behaviors, with high probabilities of 66%. In the external-discipline facet, the presence of companions, and the leniency of law enforcement possess a likelihood of 29% and 12%, respectively, for triggering jaywalking. In the environmental-discipline facet, low road traffic contributes to the highest probability, i.e., 84%, to cause jaywalking behaviors, while the rest two factors in this facet only account for 27% and 11% for jaywalking behaviors, respectively. To sum up, the proportion of pedestrians' red-light running behaviors induced by either external facets or the environmental facet is relatively lower than that of the self-discipline facet, indicating that the self-discipline facet is the primary aspect triggering jaywalking behaviors. However, the former two facets cannot be ignored, as they also contribute to pedestrians' red-light running behaviors to a certain extent. The above deductions, on the other hand, validate the effectiveness of the built feature engineering to provide a comprehensive supervision of pedestrians' red-light running behaviors by taking into account all three dimensions.
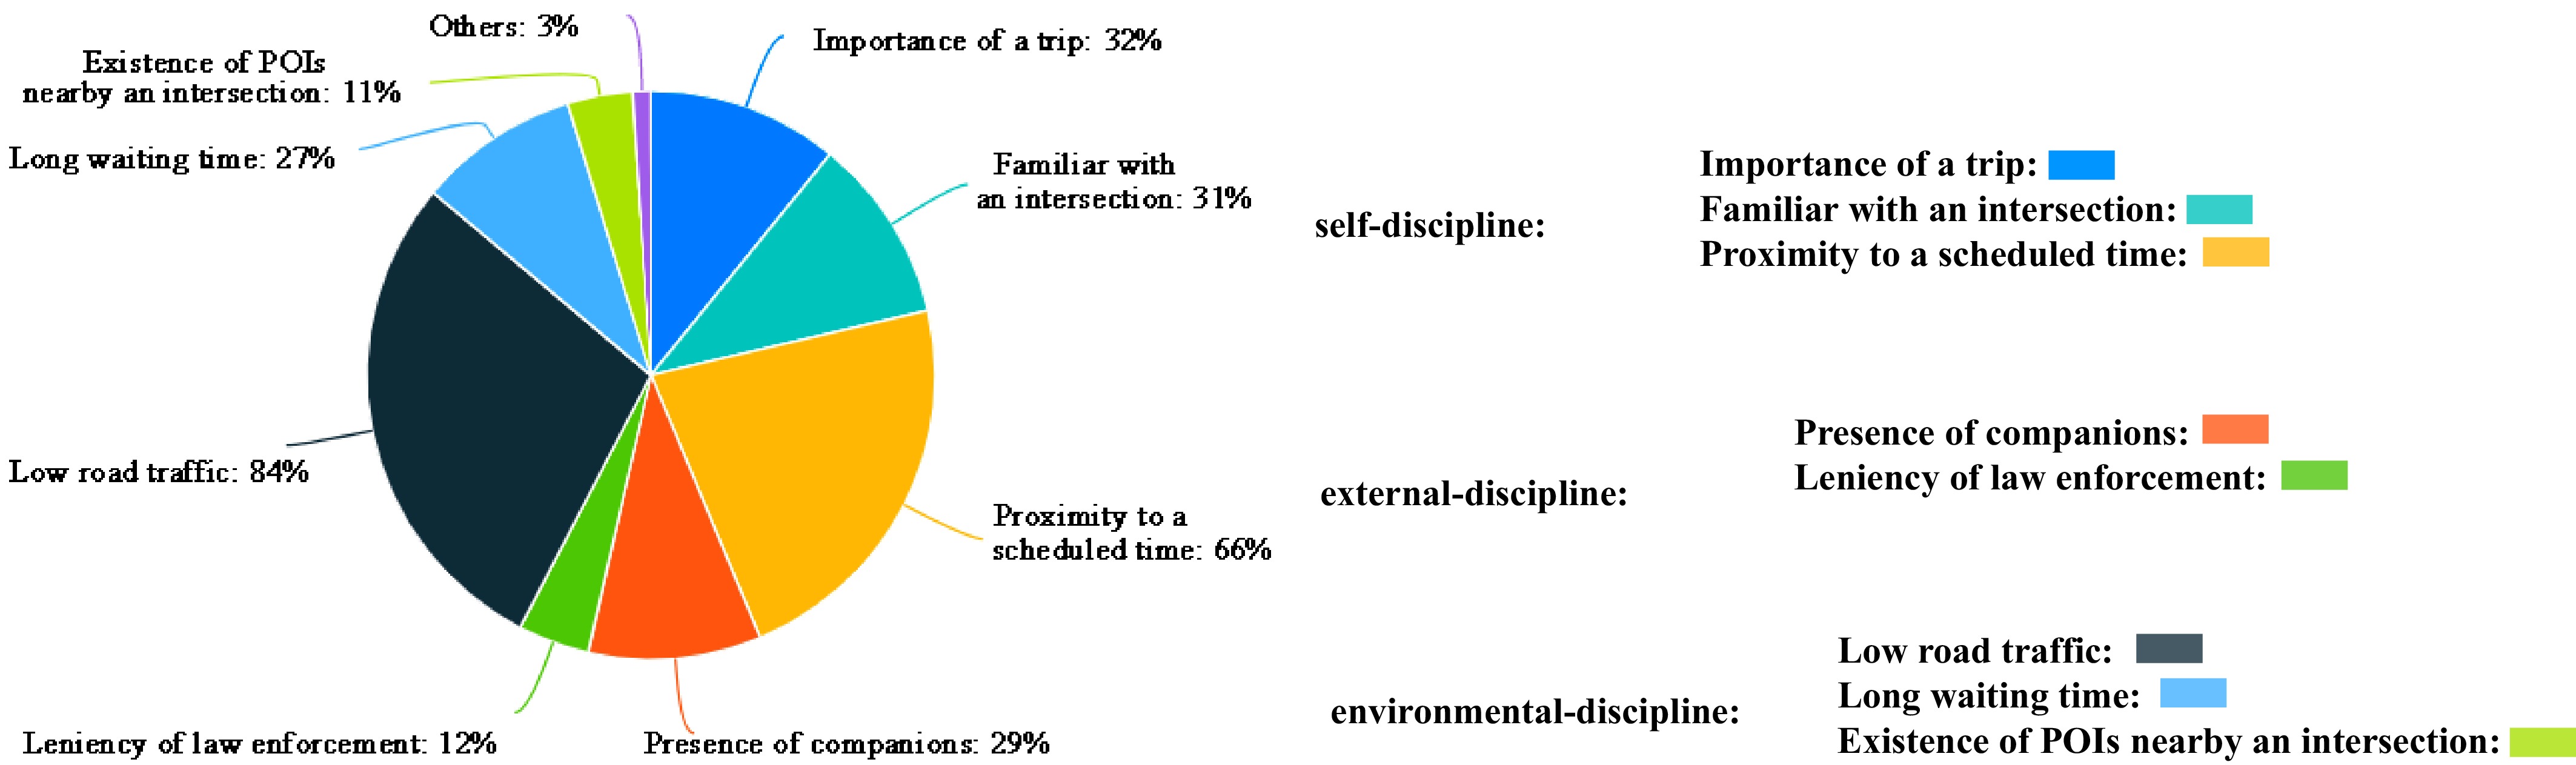
Figure 1.
Questionnaire survey results of the impact distribution of different causal factors that trigger pedestrians' red-light running behaviors.
Causal analysis results of pedestrians' red-light running behaviors
-
Table 1 presents the regression results of the impact distribution of the aforementioned individual factors presented in a previous secion, as well as their combinations, on triggering pedestrians' red-light running behaviors.
Table 1. Results of the binary logistic regression to assess the impact of individual factors, together with their combinations, on pedestrians' red-light running behaviors.
Facet Factors B Standard error Significance Exp (B) Demographic-discipline Gender −0.166 0.067 0.013 0.847 Age −0.211 0.087 0.042 0.847 Education level −0.185 0.089 0.039 0.831 Occupation −0.005 0.024 0.827 0.995 Familiarity with regulations 0.101 0.039 0.009 1.106 Self-discipline Importance of a trip 0.758 0.088 < 0.001 2.135 Familiar with an intersection 0.469 0.078 < 0.001 1.1598 proximity to a scheduled time 0.504 0.073 < 0.001 1.656 External-discipline Presence of a companion 1.173 0.076 < 0.001 3.231 Leniency of law enforcement 0.562 0.084 < 0.001 1.755 Environmental-discipline Long waiting time 0.797 0.072 < 0.001 2.220 Attractive destinations on the opposite side of the intersection 0.152 0.072 0.033 1.164 Low road traffic 0.748 0.074 < 0.001 2.113 Constant −1.258 0.259 < 0.001 0.284 Among these factors, seven causal factors attract our attention with a significance level p lower than 0.001, indicating they would play significant roles in causing pedestrians' red-light running behaviors. These factors include the five factors belonging to the self-discipline and external-discipline facets, together with the two factors belonging to the environmental-discipline facet (i.e., long waiting time and low road traffic). Moreover, the results show that the combination of these factors is likely to induce pedestrians' red-light running behaviors.
Only one factor belonging to the environmental-discipline facet, i.e., attractive destinations on the opposite side of the intersection, doesn't pose a significant influence in causing pedestrians' red-light running behaviors. Neither does the demographic-discipline factors mentioned in a previous section, i.e., gender, age, education level, occupation, or familiarity with regulations. This indicates that regardless of pedestrians' demographic attributes, they may engage in jaywalking at any moment based on the actual conditions at one intersection, which are a combination of factors regarding the self-discipline, external-discipline, and environmental-discipline facets proposed in this paper.
Supervised learning results of pedestrians' red-light running behaviors
-
Based on the extracted feature engineering mentioned in a previous section, the supervised learning performances of the chosen five classifiers are derived, with experimental results presented in Table 2. It exhibits that the values of any evaluation metrics, e.g., precision, recall, or AUC, range between 85% and 96% for the chosen classifiers. This demonstrates that the interpretable causes extracted in this paper can be effectively applied to recognizing pedestrians' red-light running behaviors. Among these classifiers, either Naïve Bayes or Logistic regression leverages its probabilistic nature to estimate the likelihood of a pedestrian engaging in red-light running given the observed features, thus providing insights into interpreting a decision-making process. Considering the probabilistic nature owned by the above two classifiers is certainly not enough for a better classification, multi-layer perceptron develops a complex neural network to further model non-linear relationships between inputs and outputs, with an aim to capture hidden patterns in the feature matrix indicative of red-light running behaviors. Random forest reaches the highest in precision, recall, and AUC, with values being 88.9%, 88.8%, and 95.2%, respectively. This is because the classifier Random forest, which is an ensemble of decision trees, enhances its interpretable and predictive power in capturing complex decision rules directly from the observed features, thus making it suitable for identifying the specific features contributing to red-light running behaviors. Meanwhile, this classifier generates more than one tree and avoids the disadvantage of overfitting.
Table 2. The supervised learning performances of the chosen classifiers based on the extracted feature engineering.
Methods Precision Recall AUC Naïve bayes 87.4% 87.3% 87.4% Logistic regression 87.7% 87.6% 93.2% Multi-layer perceptron 88.3% 88.2% 94.6% Decision tree 88.4% 88.8% 94.9% Random forest 88.9% 88.8% 95.2% -
This paper developed a supervised learning framework for identifying pedestrians' red-light running behaviors. From a wealth of real-world video data and questionnaire data, 13 interpretable causes, encompassing demographic-discipline, self-discipline, external-discipline, and environmental-discipline aspects, were extracted. The relationships between these causes and pedestrians' red-light running behaviors, the latter of which were labeled as binary values (0 or 1), were quantified using binary logistic regression. Leveraging these causes, five sets of supervised learning experiments were conducted to assess the classification performance of pedestrians' red-light running behaviors. The experimental results validated the effectiveness of the extracted interpretable causes in classifying such behaviors. Compared to prior studies, this framework not only emphasizes in-depth exploration and interpretability analysis of behavioral causes but also highlights the accuracy and practicality of predictive models. It offers a more systematic and effective approach to resolving the issue of pedestrian red-light running at urban signalized intersections. The optimal classifier identified in this study may hold great potential for real-time detection of pedestrians' red-light running behaviors in new scenarios, thus providing practical measures to effectively improve traffic capacity, as well as alleviate conflicts at urban signalized intersections.
This research was funded by Beijing Social Science Foundation, Grant No. 24GLC064.
-
The authors confirm contribution to the paper as follows: study conception and design: Zhao X; data collection: Qin Y, Wu M, Shi Z; analysis and interpretation of results: Zhao X, Qin Y; draft manuscript preparation: Zhao X, Li Z, Qin Y. All authors reviewed the results and approved the final version of the manuscript.
-
The datasets generated during the current study are not publicly available due to individual privacy protection, but are available from the corresponding author upon reasonable request.
-
The authors declare that they have no conflict of interest.
- Copyright: © 2025 by the author(s). Published by Maximum Academic Press, Fayetteville, GA. This article is an open access article distributed under Creative Commons Attribution License (CC BY 4.0), visit https://creativecommons.org/licenses/by/4.0/.
-
About this article
Cite this article
Zhao X, Qin Y, Li Z, Wu M, Shi Z. 2025. Supervised learning of pedestrians' red-light running based on interpretable cause analysis. Digital Transportation and Safety 4(4): 275−280 doi: 10.48130/dts-0025-0026 

Supervised learning of pedestrians' red-light running based on interpretable cause analysis
- Received: 02 April 2025
- Revised: 14 August 2025
- Accepted: 01 October 2025
- Published online: 31 December 2025
Abstract: Urban signalized intersections are high-incidence areas for traffic conflicts, particularly due to pedestrians' red-light running behaviors. The persistent occurrence of such behaviors significantly disrupts the order and efficiency of traffic flow intersections. Although previous studies have applied supervised learning approaches to detect these behaviors, they often fail to explore the interpretable causes. To bridge this gap, this paper proposes a supervised learning framework for pedestrians' red-light running behaviors, based on interpretable factors. A wealth of relevant video and questionnaire data from real-world signalized intersections was collected, based on which, potential causes of pedestrians' red-light running behaviors were extracted from four facets comprehensively: demographic-discipline, self-discipline, external-discipline, and environmental-discipline. Each instance was labeled with a binary value of 0 or 1 to indicate whether a pedestrian committed a red-light violation. A binary logistic regression analysis was performed further to assess the impact of individual factors and their combinations on pedestrians' red-light running behaviors. Utilizing these causes, five groups of supervised learning experiments were then performed to evaluate the classification performances of pedestrians' red-light running behaviors. The experimental results reveal two key insights: (1) the combination of most factors from self-discipline, external-discipline, and environmental-discipline facets is likely to induce pedestrians' red-light running behaviors; (2) all chosen classifiers achieved high detection accuracies, ranging from 85% to 96%, by leveraging the aforementioned interpretable causes. The optimal classifier identified in this research may show great potential for online detection of pedestrians' red-light running behaviors in new scenarios, offering a practical solution to enhance traffic safety and efficiency at urban signalized intersections.
-
Key words:
- Intersection safety /
- Red-light running /
- Cause analysis /
- Supervised learning