


-
Highways, as a critical component of modern transportation systems, have significantly promoted interconnectivity between regions and provided a solid foundation for national economic development. However, traffic accidents remain one of the primary public safety challenges worldwide, causing substantial fatalities, injuries, and economic losses annually. According to the World Health Organization (WHO), traffic accidents are the leading cause of death for individuals aged five to 29, accounting for approximately 1.19 million fatalities per year[1]. Additionally, millions of injuries resulting from these accidents impose a heavy burden on society. With the acceleration of urbanization and the increasing number of vehicles, the issue of frequent traffic accidents has become more pronounced, prompting academia and industry to urgently develop efficient technologies for rapid accident detection and response.
Currently, various accident prediction and detection techniques have been developed to improve traffic safety through risk identification. These techniques can be categorized into two types: statistical models and machine learning-based models[2]. Traditional statistical models rely on historical data and mathematical analysis to uncover patterns within the data. However, they exhibit limitations when addressing complex scenarios and large-scale datasets[3]. In contrast, with the rapid development of artificial intelligence (AI) technology[4,5], AI-based models have shown greater potential in traffic accident prediction and detection. These methods extract complex features from large-scale data and achieve high-precision predictions. Nevertheless, AI-based solutions are highly dependent on high-quality data, and the traffic accident data often suffers from insufficient quantity and quality. This issue limits the effectiveness of AI technologies in practical applications. Advanced data cleaning and preprocessing methods can address this challenge by improving data quality and enriching traffic event datasets with additional information.
Despite increasing interest in using deep learning for traffic accident prediction and detection, significant limitations remain. Most existing data augmentation strategies—such as those using Generative Adversarial Networks (GANs)—focus on statistical realism without incorporating real-world physical constraints. These approaches may produce synthetic data that lacks behavioral interpretability or alignment with actual traffic dynamics. Meanwhile, advanced traffic simulation platforms like SUMO have been extensively used for traffic modeling and control evaluation, but their potential as tools for generating physically grounded synthetic data to improve anomaly detection models remains underexplored. Furthermore, very few studies investigate the ability of augmented models to generalize in zero-shot or data-scarce scenarios, particularly across different temporal or spatial domains.
To address the aforementioned challenges, the paper proposes a SUMO (Simulation of Urban Mobility) -based simulation data augmentation method aimed at improving the performance of traffic accident detection and prediction by enhancing data quality and coverage. Specifically, the main contributions of the paper are as follows:
(1) Incorporation of physical constraints: by integrating traffic-related physical information, the paper introduces a physical-informed model that incorporates physical constraints into the data augmentation process, addressing the lack of physical constraints in existing methods. These physical constraints include maximum acceleration, comfortable deceleration, minimum safe distance, acceleration index, and driver reaction time. While these five parameters capture key aspects of vehicle dynamics and are directly supported in SUMO, other influential real-world factors, such as weather conditions or driver behavior variability, were not included due to limited simulator support and the scope of this study. Future work will explore incorporating such factors to further enhance the realism of the augmented data.
(2) Temporal and spatial transfer modeling: using the SUMO software, the study conducts temporal transfer modeling for roads with limited accident data and spatial transfer modeling for roads without accident data, thereby extending the temporal and spatial applicability of the data.
(3) Deep learning-based accident detection: the study utilized three commonly applied neural network models for accident detection and validated the model's detection performance using real-world data and simulation data. Experimental results demonstrate that the model significantly improves detection performance and reliability.
The remainder of this paper is organized as follows: the 'related work' section reviews existing studies on traffic accident detection and prediction, and surveys relevant research on traffic flow data augmentation. The 'methodology' section introduces the SUMO simulation techniques and the accident prediction and detection models, including multilayer perceptron (MLP), convolutional neural network (CNN), and long short-term memory (LSTM). The 'data preparation' section details the data sources, selected roads, and data preprocessing methods. The 'results' section presents the simulation-generated normal traffic flows, temporal and spatial transfer modeling, and experimental results. Finally, the 'discussion and contributions' section summarizes the main contributions of the paper and highlights potential directions for future research.
-
Accident prediction and detection have long been central topics in transportation research. With the rapid advancement of machine learning (ML), AI-based models have gradually become a core area of research, leading to numerous studies that utilize traffic accident data for analysis, prediction, and detection.
Accident prediction
-
Research in accident prediction primarily falls into two categories: statistical analysis models and machine learning-based models. Statistical analysis, such as logistic regression[6−8], log-linear models[9], Bayesian logistic models[10], and Bayesian dynamic logistic regression models[11], provide valuable insights, however, they often struggle to capture the complex nonlinear relationships inherent in traffic flow data, leading to limited performance.
In contrast, ML models demonstrate greater potential due to their ability to handle high-dimensional and nonlinear data. Huang et al.[12] utilized deep learning techniques to predict crash risks, employing data from radar sensors on Interstate 235 in Des Moines, IA. Their model demonstrated notable improvements in detection accuracy. Pourroostaei et al.[13] explored road car accident data patterns and proposed a data preprocessing model, including missing data removal, attribute generalization, and outlier removal, to improve the accuracy of traffic accident prediction using machine learning techniques.
There are likewise many other studies that have investigated accident risk prediction by fusing traffic data and combining statistical and ML methods. For instance, Yu et al.[14] proposed a Deep Spatio-Temporal Graph Convolutional Network (DSTGCN) to predict traffic accidents by effectively learning spatial, temporal, and external data correlations, and achieved superior performance on real-world datasets. Guo et al.[15] incorporated risky driving behavior and traffic flow data to predict traffic accident risks, achieving a prediction accuracy of 84.48%. Zhang et al.[16] developed a bidirectional LSTM model with convolutional layers to analyze roadside detector data and connected vehicle information, reaching a recall of 0.772 and an AUC of 0.857. Yuan et al.[17] combined statistical and ML models to explore the relationship between traffic conflicts and flow features using the HighD dataset, highlighting the significant influence of traffic flow on conflict probability.
Accident detection
-
Early-stage methods for incident detection predominantly relied on comparative algorithms, such as the well-known California algorithm[18], which compares traffic parameters (e.g., speed, occupancy) to predefined thresholds[19]. While effective, these methods depend heavily on fixed detector readings and lack adaptability.
With the development of computational intelligence, Artificial Intelligence algorithms apply AI and ML models to identify the normal and abnormal traffic patterns and then classify the given input data as either incident or normal conditions[20]. For example, Dogru et al.[21] proposed an intelligent traffic accident detection system based on VANETs and machine learning, using vehicle speed and position data for high-accuracy accident detection with the Random Forest algorithm. White et al.[22] proposed a smartphone-based traffic accident detection system that combines accelerometers, acoustic data, and context information to automatically notify emergency services, provide situational awareness, and reduce false positives. Ozbayoglu et al.[23] designed a real-time autonomous detection system using computational intelligence techniques to analyze Istanbul's traffic data, predicting accidents with nearest neighbor models and feed-forward neural networks. Gu et al.[24] explored social media as an alternative data source, mining Twitter for real-time traffic incident detection and classification. Mehrannia et al.[25] applied LSTM networks for freeway accident detection, improving class separability and reducing dimensionality.
Data augmentation
-
The above AI-based solutions for incident detection have highlighted challenges, particularly regarding data quantity and quality. Traditional traffic datasets often lack sufficient volume and exhibit quality issues, limiting their applicability. To address these challenges, data enhancement techniques have emerged as a critical research focus.
Lin et al.[26] introduced a hybrid model using Generative Adversarial Networks (GANs) to expand sample size and balance datasets, complemented by Temporal and Spatially Stacked Autoencoders (TSSAE) for feature extraction. Xie et al.[27] proposed SASYNO-RF-RSKNN, a hybrid method tackling imbalanced datasets using oversampling techniques and ensemble algorithms. Similarly, Jilani et al.[28] utilized GAN-based augmentation to train CNN models, achieving high classification accuracy. Other studies emphasize advanced augmentation strategies. Huang et al.[29] integrated GANs with TSSAE to address sample limitations and detect temporal and spatial traffic patterns. Dabboussi et al.[30] employed GANs to generate realistic traffic speed data, improving prediction for specific scenarios. Benabdallah Benarmas et al.[31] highlighted the role of Deep Generative Models (DGMs) in enhancing traffic speed predictions through synthetic dataset generation.
Summarily, these advancements underscore the significant progress in accident prediction and detection, particularly through the integration of deep learning and data augmentation. However, challenges remain in addressing the dependency on high-quality data and balancing the scalability of models for diverse traffic scenarios are key. Based on these insights, this paper proposes a method that combines SUMO simulation data with real-world data. This method not only increases the diversity of the data but also effectively improves the performance of the model.
-
This study collected and processed 160 accident and non-accident cases, with data sourced from the California Department of Transportation's Performance Measurement System (PeMS) and the California Highway Patrol (CHP). The study focuses on two major highways in California—Interstate 10 East (I10-E) and Interstate 80 East (I80-E)—covering the period from December 1 to June 30 in both 2016 and 2021, thereby capturing traffic conditions before and after the COVID-19 pandemic. The dataset encompasses traffic records from 8,041 mainline detector stations distributed across 5,360 miles of highway. Data from the year 2017 was used for model training, while 2022 data was utilized to evaluate temporal and spatial transferability.
Although PeMS performs automated imputation to address short-term missing data, the dataset remains vulnerable to residual anomalies resulting from intermittent hardware failures and communication disruptions at detector stations. To enhance data integrity and ensure the reliability of downstream modeling, a comprehensive preprocessing framework was implemented. Specifically, data entries were excluded under the following conditions: (1) a complete absence of recorded measurements from a detector station; (2) simultaneous zero values in average speed, flow, and occupancy, indicating likely sensor malfunction; (3) identical readings across multiple detectors, suggesting data duplication or transmission errors; and (4) repeated values at a given detector that exactly matched those recorded at the same timestamp on the previous day or week, indicating placeholder or default imputations.
I10-E
-
I-10E[32] is the eastbound section of Interstate 10 in the United States, spanning multiple states and connecting major cities from Los Angeles, California, to Jacksonville, Florida. With a total length of approximately 2,460 miles (3,960 km), it is the fourth-longest highway in the United States, following I-90, I-80, and I-40. It is also one of the longest and busiest east-west highways in the country. I-10E traverses key economic, cultural, and logistical hubs, playing a crucial role in freight transportation and interstate travel. It connects major regions in the southwestern and southeastern United States, serving as an essential corridor for east-west transportation.
I80-E
-
The I80-E[33] highway is part of the US Interstate Highway System, spanning over 4,600 km and connecting California and New Jersey, which is commonly used in identifying normal traffic flow. This road traverses 11 states, with I80-E being its eastbound segment. It features a wide roadway, typically comprising three to five lanes, with the specific number of lanes varying by state and region. As a vital transportation corridor, I80-E serves a large volume of commuter and freight vehicles, exhibiting significant variations in traffic characteristics across its segments. From urban core areas to suburban and rural regions, this highway provides a wealth of sample data for studying dynamic behaviors under different traffic environments. Moreover, due to its complex traffic conditions, frequent peak flows, and diverse traffic patterns, I80-E is an ideal choice for traffic simulation studies.
Overall, I80-E and I10-E differ significantly in both traffic scale and functional context. I80-E, an urban freeway segment, carries approximately 110,000 vehicles per day, while I10-E, located in a more suburban to rural area, sees around 80,000. These structural and environmental differences introduce a substantial geographic domain shift, making the spatial transfer task more challenging and meaningful.
Data preprocessing techniques
-
To better demonstrate the generalizability of the model, basic information that can typically be extracted by conventional highway detectors is selected as the model input. These inputs usually include fundamental statistical measures such as the average and standard deviation of traffic flow. Specifically, based on previous experience[34−36], data collected by two detectors is used upstream and downstream of the accident point to extract traffic flow parameters within 0 to 15 min after the accident for analysis, as shown in Fig. 1. When an accident occurs, it often causes congestion and sudden deceleration upstream, generating shock waves that propagate backward in space. Monitoring the upstream area allows us to capture early indicators of abnormal traffic conditions, such as a sudden drop in speed or an increase in occupancy. In contrast, the downstream detectors serve as a control reference, where traffic may be unaffected or return to normal faster.
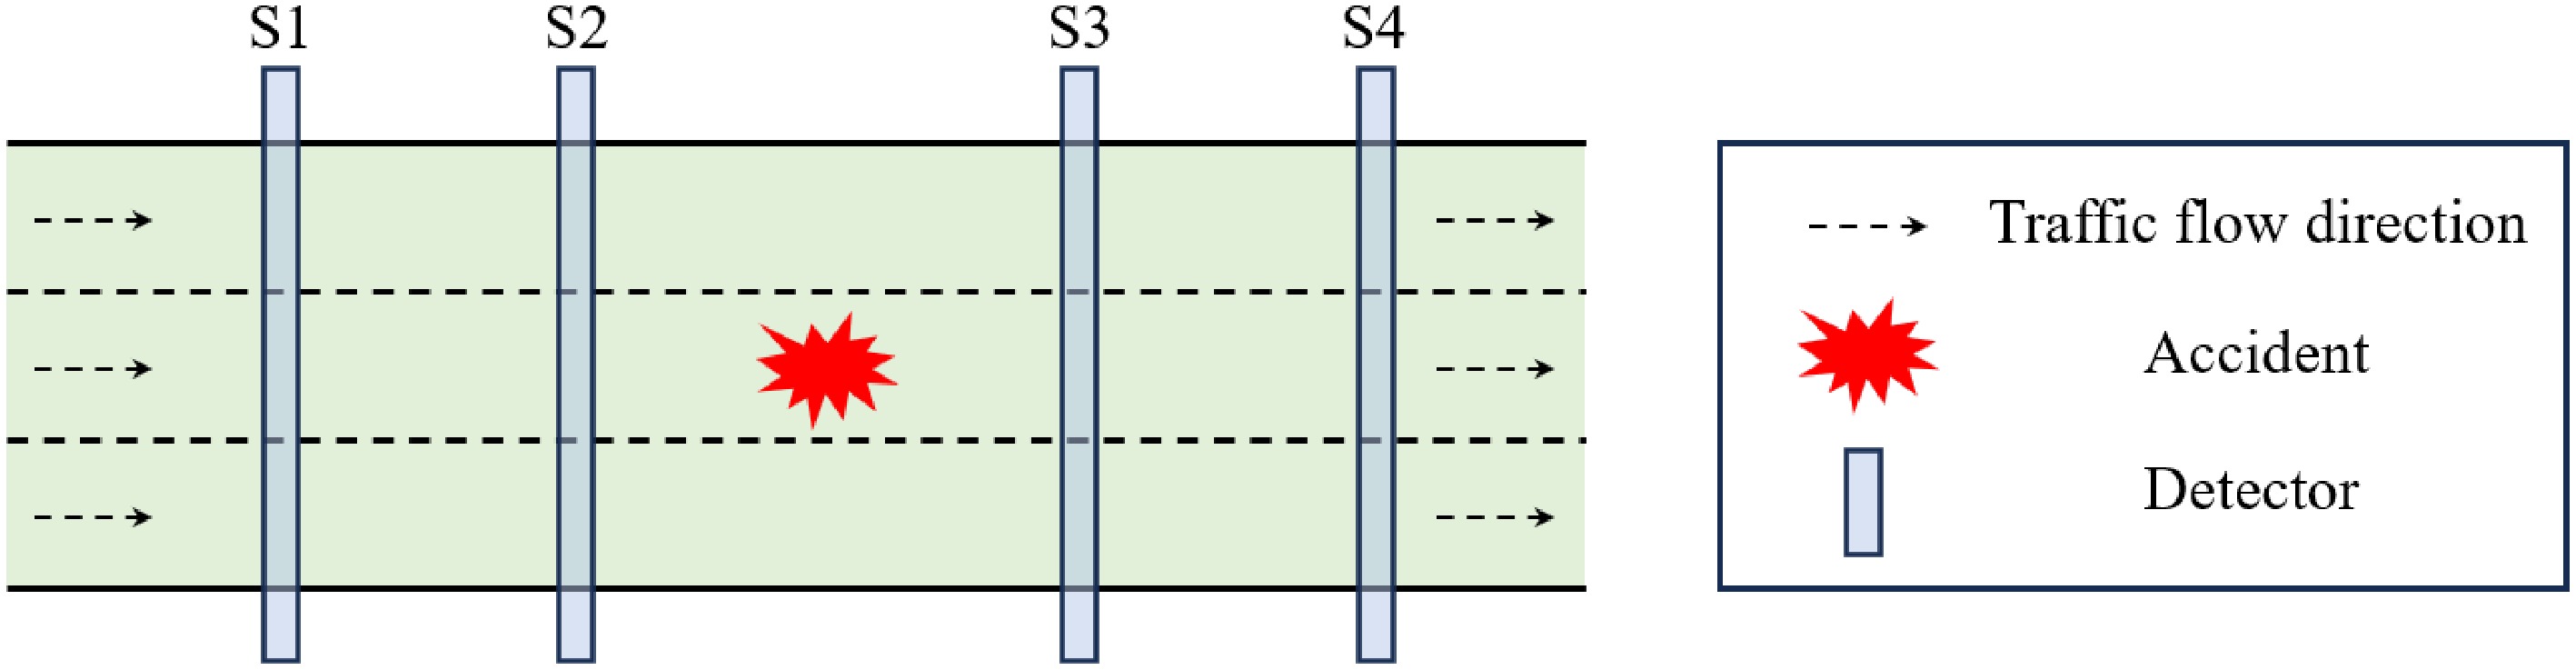
Figure 1.
Accident location and detector selection.
For analysis, the time is divided into three intervals, each with a five-minute gap, labeled as T1, T2, and T3. Specifically, the time from 0 to 5 min before the accident corresponds to T1, 5 to 10 min corresponds to T2, and 10 to 15 min corresponds to T3. Additionally, the detectors are numbered sequentially from upstream to downstream in relation to the accident point, designated as S1, S2, S3 and S4. The selected traffic flow parameters include flow rate, speed, and occupancy, represented by the symbols Q, V, and O, respectively. To provide a more comprehensive description of the data characteristics, the average values and standard deviations of these parameters are further calculated, denoted as Aver and Std, and serve as the initial input variables. In total, 72 variables were constructed to support the model's input and analysis.
-
To enhance the performance of traffic accident detection systems, the SUMO was utilized for data augmentation and advanced deep learning techniques for traffic accident detection. The following section first introduces SUMO, followed by an introduction to the deep learning models used.
Introduction to SUMO
-
SUMO is a microscopic traffic simulation platform designed for modeling multi-modal transportation systems, including vehicles, public transit, pedestrians, and cyclists, developed by the Dresden University of Technology in Germany[37]. Since its inception in 2001, the SUMO software suite has been widely applied in numerous domestic and international research projects. Its primary applications include traffic signal evaluation[38], route selection and re-planning[39], traffic monitoring method assessment[40], vehicle communication simulation[41], and traffic forecasting[42]. As an open-source software, SUMO allows users to customize and extend it according to their needs. It supports multiple traffic modes, such as cars, pedestrians, and public transport, and can be integrated with tools like Python and MATLAB, facilitating data analysis and model training. Its high efficiency enables SUMO to quickly process large volumes of traffic data and simulate complex traffic scenarios, making it particularly suitable for tasks such as traffic anomaly detection and model optimization. Additionally, SUMO possesses powerful data generation and enhancement capabilities, enabling the creation of simulation data with complex traffic patterns and diverse scenarios, which are especially well-suited for training deep learning models. Finally, SUMO simulates based on real-world traffic network data and employs precise vehicle behavior modeling, ensuring that the simulation results closely align with real-world traffic conditions, demonstrating applicability in real-world scenarios. Due to the various advantages of SUMO mentioned above, SUMO was ultimately chosen as the simulation environment in this paper to generate traffic accident augmented data.
Simulation calibration
-
The Intelligent Driver Model (IDM), a microscopic traffic simulation model designed to replicate vehicle dynamics and driver behavior, was calibrated using an exhaustive grid search method. IDM employs precise mathematical formulations to simulate how vehicles adjust their speed and spacing in response to leading vehicles under various traffic conditions, considering factors such as desired speed, current speed, gap distance, and traffic density to determine optimal acceleration or deceleration strategies.
The IDM model assumes that the driver will dynamically adjust the acceleration according to the behavior of the vehicle in front and the current traffic conditions. The acceleration of the vehicle is determined by the following factors: (1) Expected free travel speed: When there is no interference from the vehicle in front, the vehicle tends to travel at a desired speed (such as the speed limit); (2) Safety distance: The vehicle will adjust its speed according to the distance and relative speed to the vehicle in front to avoid a rear-end collision; and (3) Acceleration and deceleration capabilities: The physical properties of the vehicle also constrain driving behavior.
The acceleration formula of the IDM model is as follows:
$ \dot{v}=a\left[1-{\left(\dfrac{v}{{v}_{0}}\right)}^{\delta }-{\left(\dfrac{{s}^{*}\left(v,\Delta v\right)}{s}\right)}^{2}\right] $ (1) where, a represents the maximum acceleration, v represents the current vehicle speed, v0 represents the expected speed, δ represents the acceleration index. Specifically, δ controls how aggressively or smoothly a vehicle approaches its desired speed. A larger value of δ leads to smoother, more gradual acceleration, promoting comfort and stability, while a smaller value results in faster, more abrupt acceleration responses. s represents the distance between the current vehicle and the vehicle in front, and s*(v, Δv) represents the expected distance, which can be expressed as:
$ {s}^{*}\left(v,\Delta v\right)={s}_{0}+max\left(0,vT+\dfrac{v\Delta v}{2\sqrt{ab}}\right) $ (2) where, Δv represents the relative speed, that is, the speed difference between the current vehicle and the vehicle in front; s0 represents the minimum safe distance, b represents the comfortable deceleration. If the current vehicle suddenly decelerates, the vehicle will adjust the current speed with the deceleration of b to avoid a rear-end collision; T represents time headway, which refers to the driver's reaction time.
Parameter calibration is used to determine the IDM parameters. The objective of calibration was to minimize the Root Mean Square Error (RMSE) between simulated traffic flow and real-world detector readings. The calibration process was conducted over a defined search space constrained by physically reasonable ranges for each IDM parameter, including maximum acceleration and comfortable deceleration. The upstream section of the three-lane road section I80-E, which is monitored by four detectors (402241, 402243, 402245, 402246) was selected. The vehicle data from the upstream detectors is used as input, and the difference between the simulated and actual readings from the downstream detectors is used to fine-tune the IDM parameters to ensure that the simulation accurately reflects the observed traffic behavior.
Vehicle inject
-
After adopting the calibrated parameters, let the probability of a vehicle appearing per second be p. Then, the number of vehicles departing on this lane within 5 min, X, follows a binomial distribution:
$ X \sim B\left(300,p\right) $ (3) The mean of this distribution can be expressed as E(X) = 300p, which equals the actual number of vehicles N detected by the detector during the 5 mins. Therefore, the input probability p = N/300.
Accident detection methods
-
MLP is a classic feedforward neural network architecture composed of multiple layers, typically including an input layer, one or more hidden layers, and an output layer. Each neuron in one layer is fully connected to the neurons in the previous layer, processing data through weighted sums, biases, and activation functions to transmit information through the network. The goal of MLP is to accurately model the complex nonlinear relationships between input data and outputs, enabling precise classification or regression tasks.
CNNs are a class of deep learning models primarily used for processing and analyzing grid-like data structures, such as images or time-series data. CNNs excel at automatically learning spatial hierarchies of features, making them particularly effective in tasks like image classification, object detection, and anomaly detection.
LSTM networks are a specialized type of Recurrent Neural Network (RNN) designed to handle and predict long-term dependencies in sequential data. Traditional RNNs often struggle with long sequences due to the vanishing or exploding gradient problem, making it difficult to effectively retain information from distant points in the sequence. LSTM addresses this issue by introducing 'memory cells' and 'gating mechanisms,' which enable the model to manage information flow more effectively.
This paper implements the prediction of normal traffic flow using LSTM to validate the feasibility of using SUMO simulation data, and accident detection of abnormal traffic flow using MLP, CNN, and LSTM, using multiple neural networks with the aim of eliminating chance. These models are chosen for their simplicity, interpretability, and compatibility with small-sample datasets. While more advanced models such as spatiotemporal graph convolutional networks (STGCNs) or graph neural networks (GNNs) can more effectively capture complex spatiotemporal dependencies, they usually require larger-scale graph-structured data and more extensive training samples. Given the small-sample and data-scarce scenarios emphasized in this work, simpler models provide more robust and interpretable benchmarks to evaluate the effectiveness of simulation-based data augmentation. Moreover, the consistent improvements demonstrated in these commonly used models reinforce the practical value of our proposed approach.
-
The experimental workflows comprises two key components:
(1) Normal traffic flow prediction: By comparing the differences in prediction results generated using real-world data alone versus hybrid data (real-world data + SUMO simulation data), the feasibility of SUMO simulation data in model training was validated;
(2) Abnormal traffic flow detection: Three neural network models were first brought to convergence, followed by joint fine-tuning with SUMO simulation data and real-world data, demonstrating the effectiveness of simulation data in enhancing detection performance.
Generation and prediction of normal traffic flow
-
To demonstrate that SUMO simulation can be effectively used for traffic flow simulation, traffic flow simulation was first performed using SUMO, and its effectiveness was validated by comparing the simulation results with real-world data.
Traffic flow data was used as the input for the LSTM model to predict future traffic flow. The input sequence is represented as [qt, qt+1, qt+2, qt+3, qt+4], where qt denotes the traffic flow at time t. A 25 min traffic flow sequence is used as the input, and the model predicts the traffic flow for the next 5 min. This approach enables effective modeling of short-term traffic fluctuations and dynamic changes.
To validate the effectiveness of SUMO simulation data, three training datasets were used, as shown in Fig. 2, where the dataset A included 28 d of real traffic flow data (from December 1, 2016, to December 29, 2016); the dataset B comprised 1 d of real traffic flow data (from December 28, 2016, to December 29, 2016); and the dataset
$ C $ 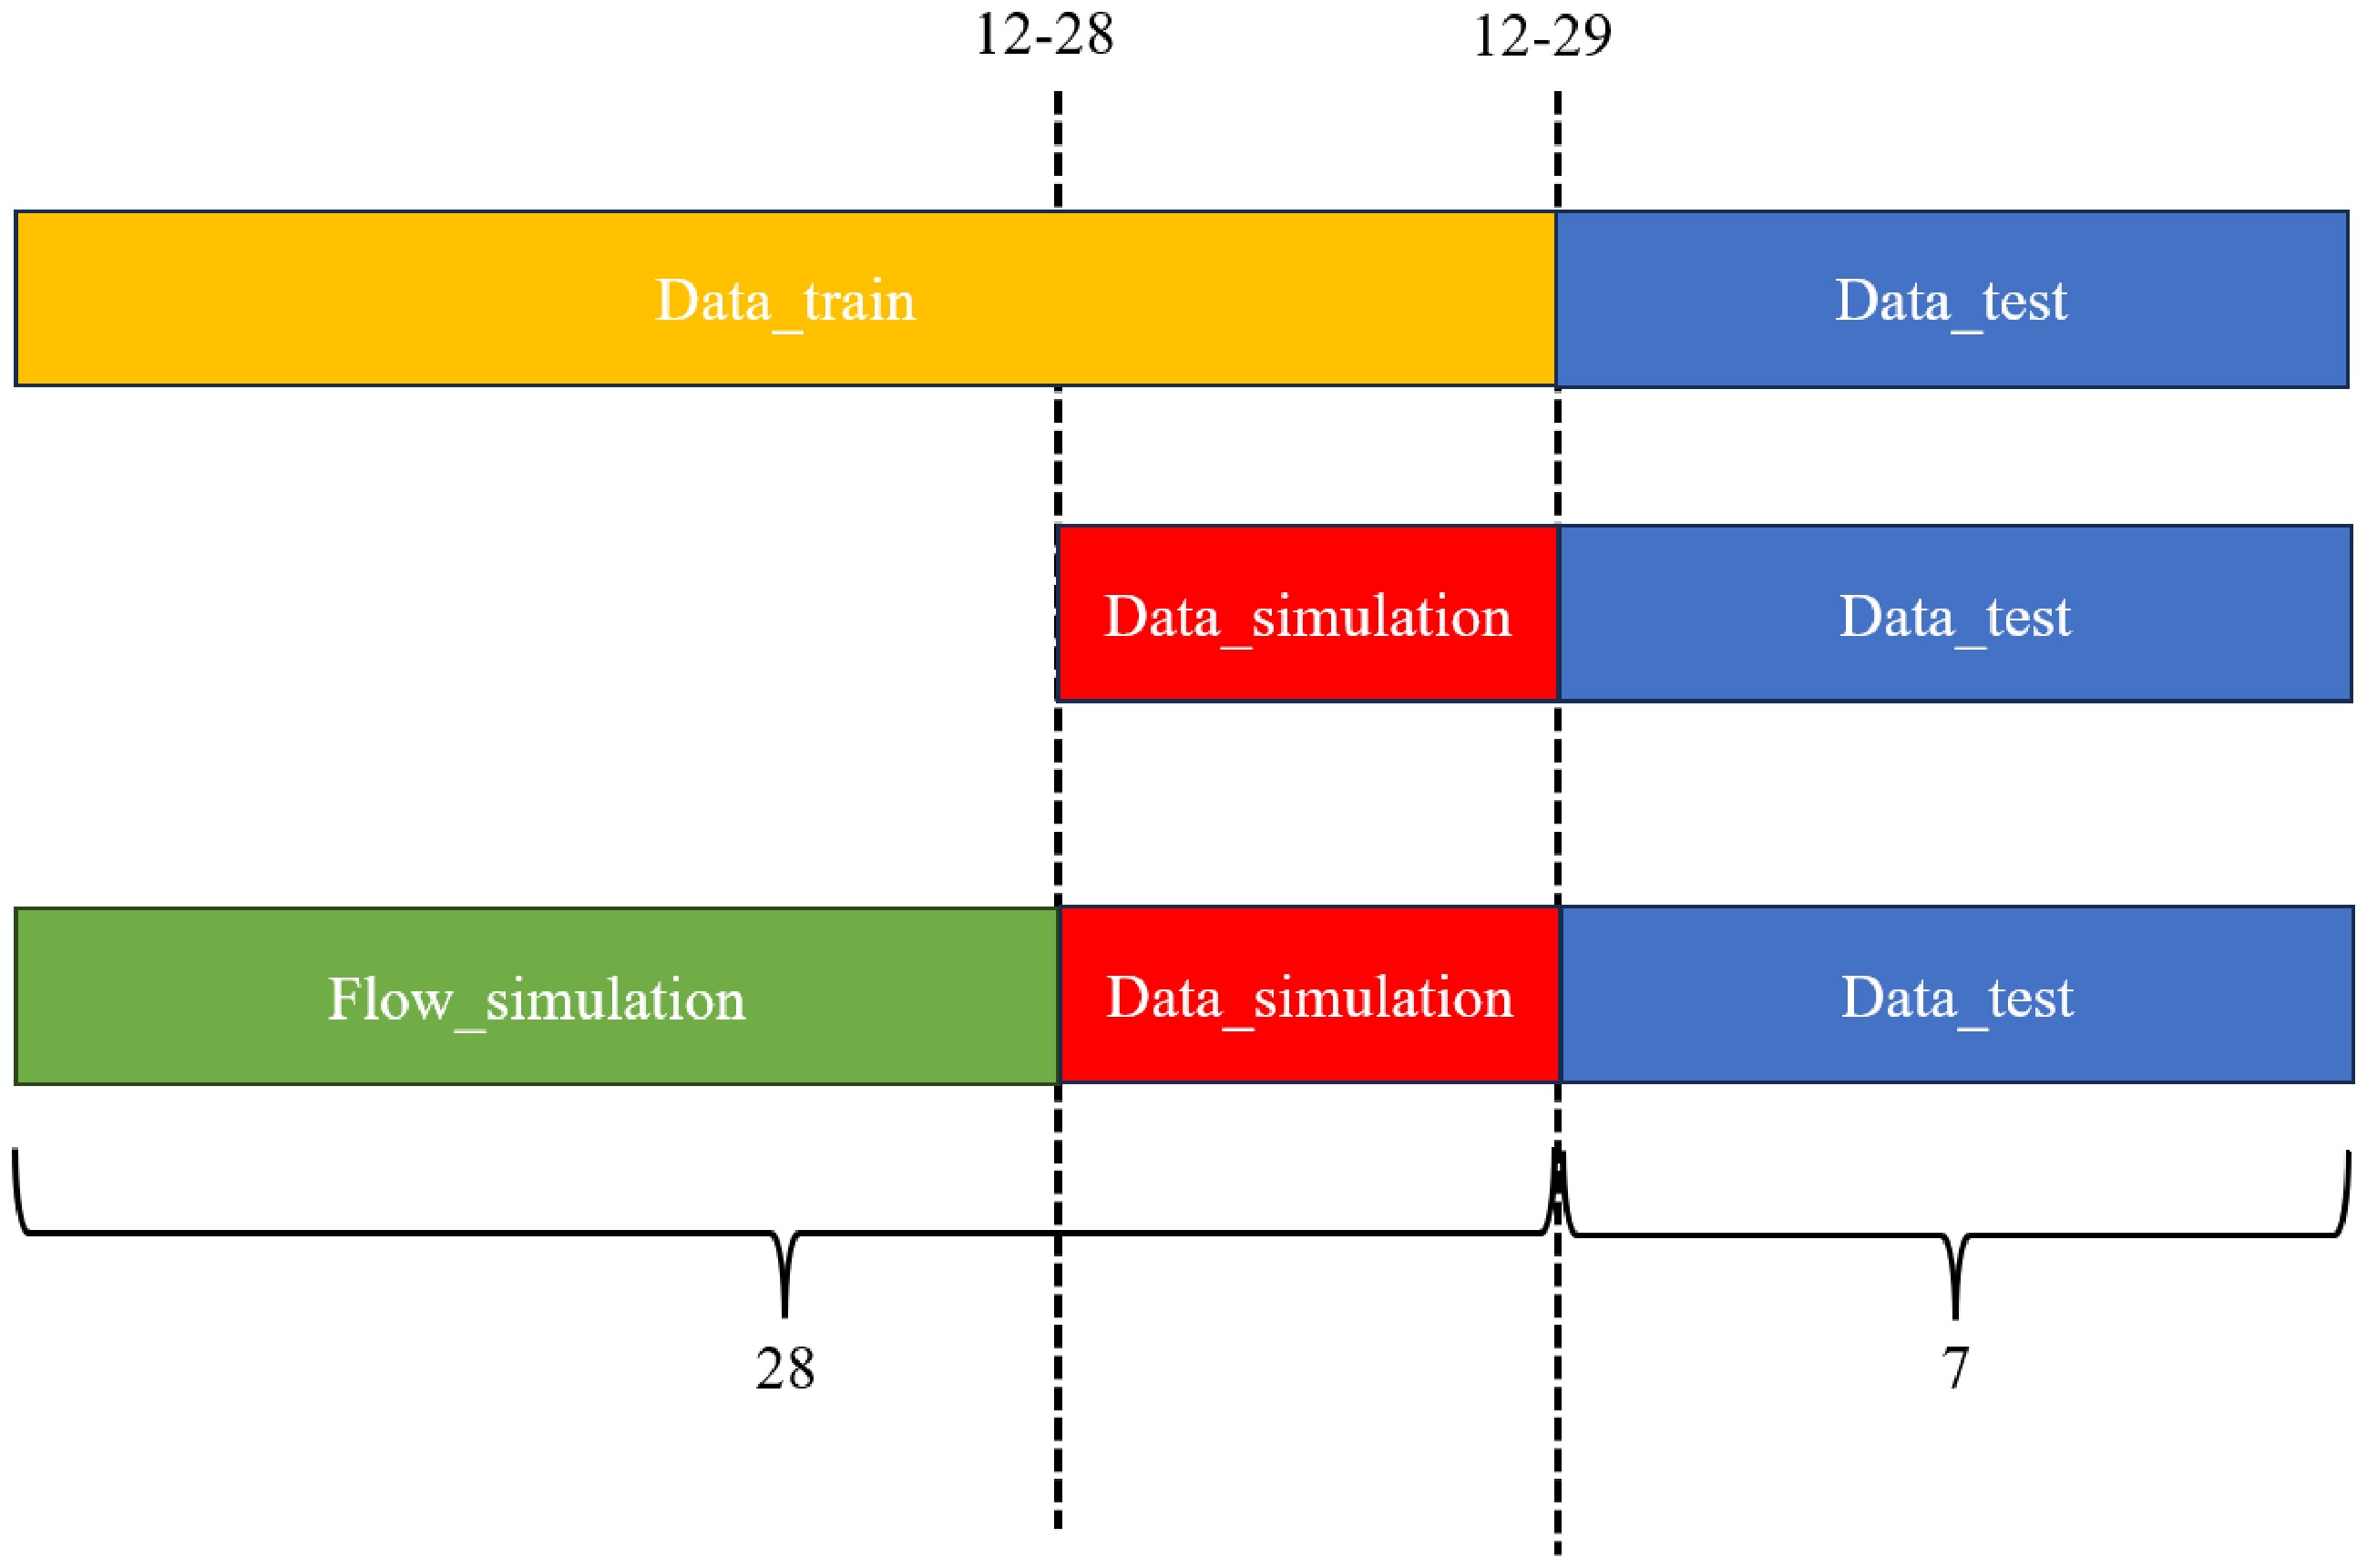
Figure 2.
Mixed dataset strategy for model training.
Accident simulation and transfer experiment
Accident simulation
-
As shown in Fig. 3, the accident simulation is conducted by closing lanes in the simulation. When an accident occurs, the lanes in the fixed areas upstream and downstream of the accident point are closed. Two types of accident simulation are defined: existing accident enhancement and virtual accident enhancement.
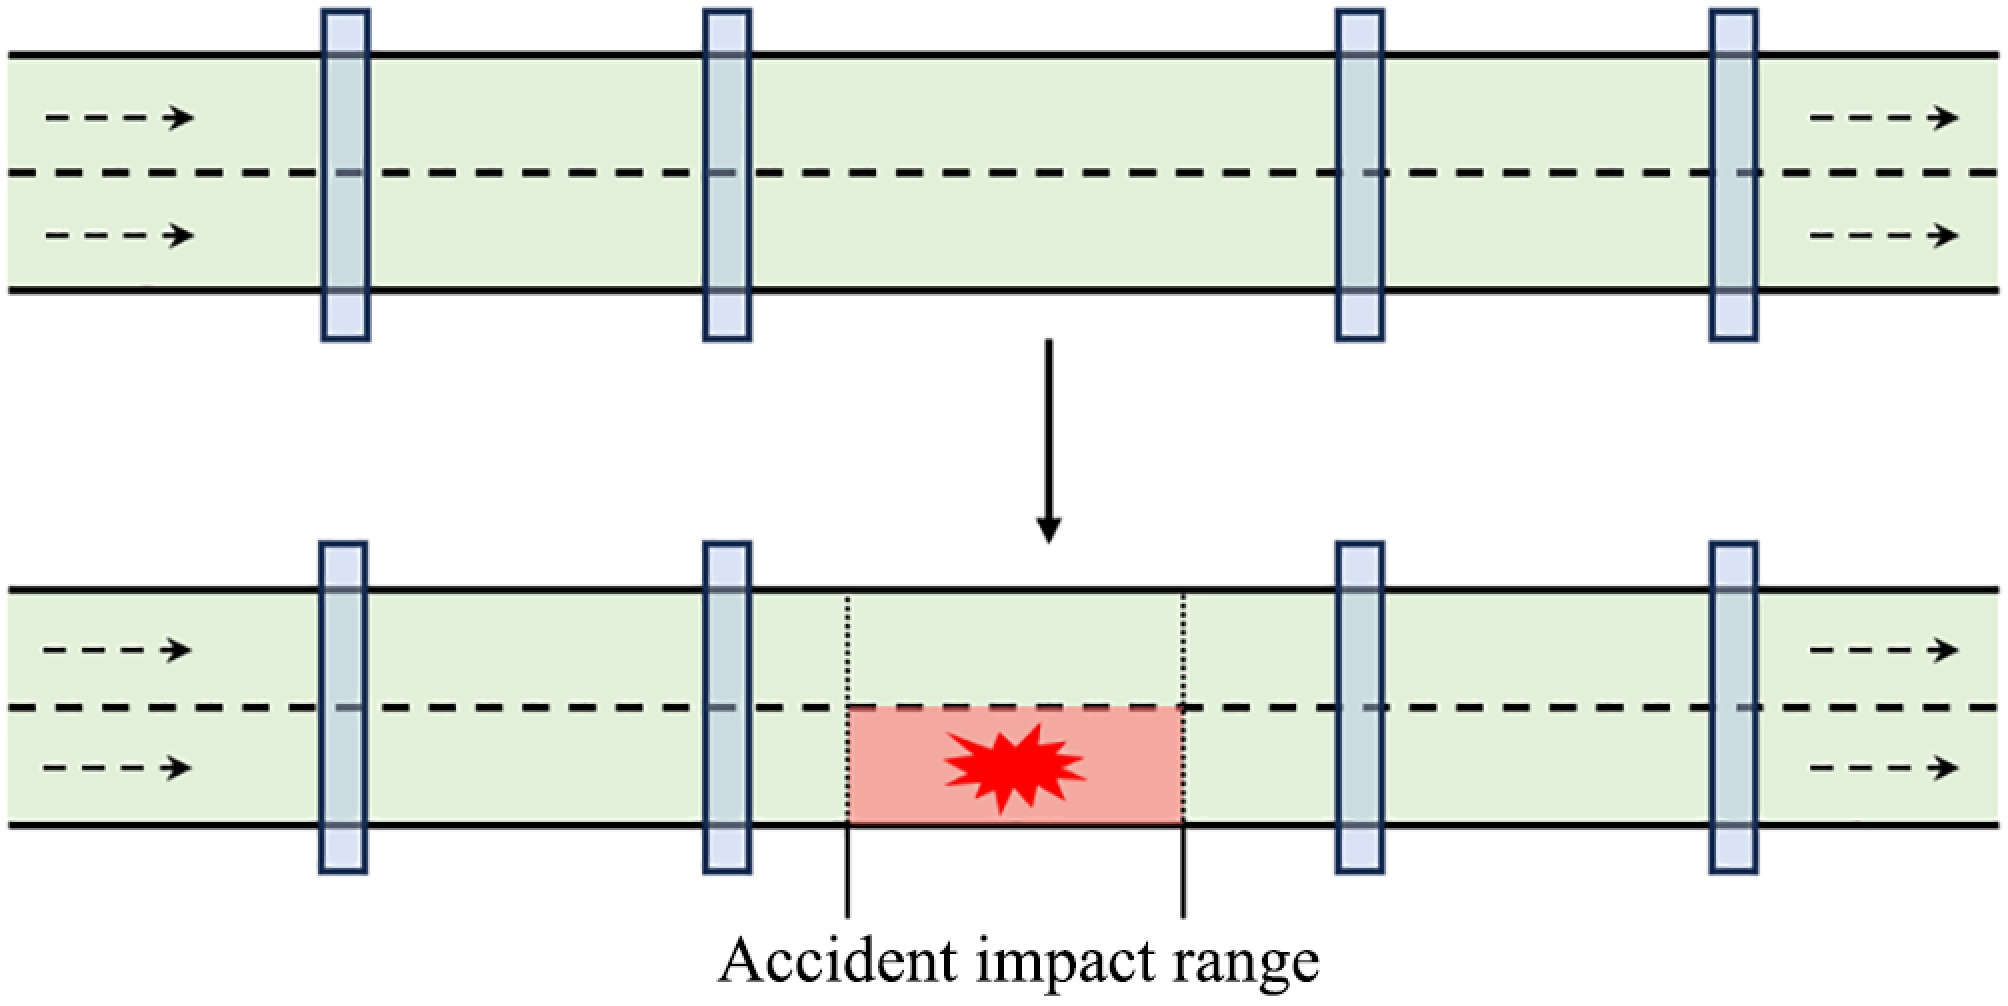
Figure 3.
SUMO accident simulation diagram.
Existing accident enhancement involves altering the impact range and affected lanes based on the existing accidents, used for time transfer experiments. Virtual accident generation involves randomly specifying a non-accident time and creating virtual accidents at random locations and times, used for spatial enhancement in simulation experiments. The simulation process is shown in Fig. 4, and the details will be explained later.
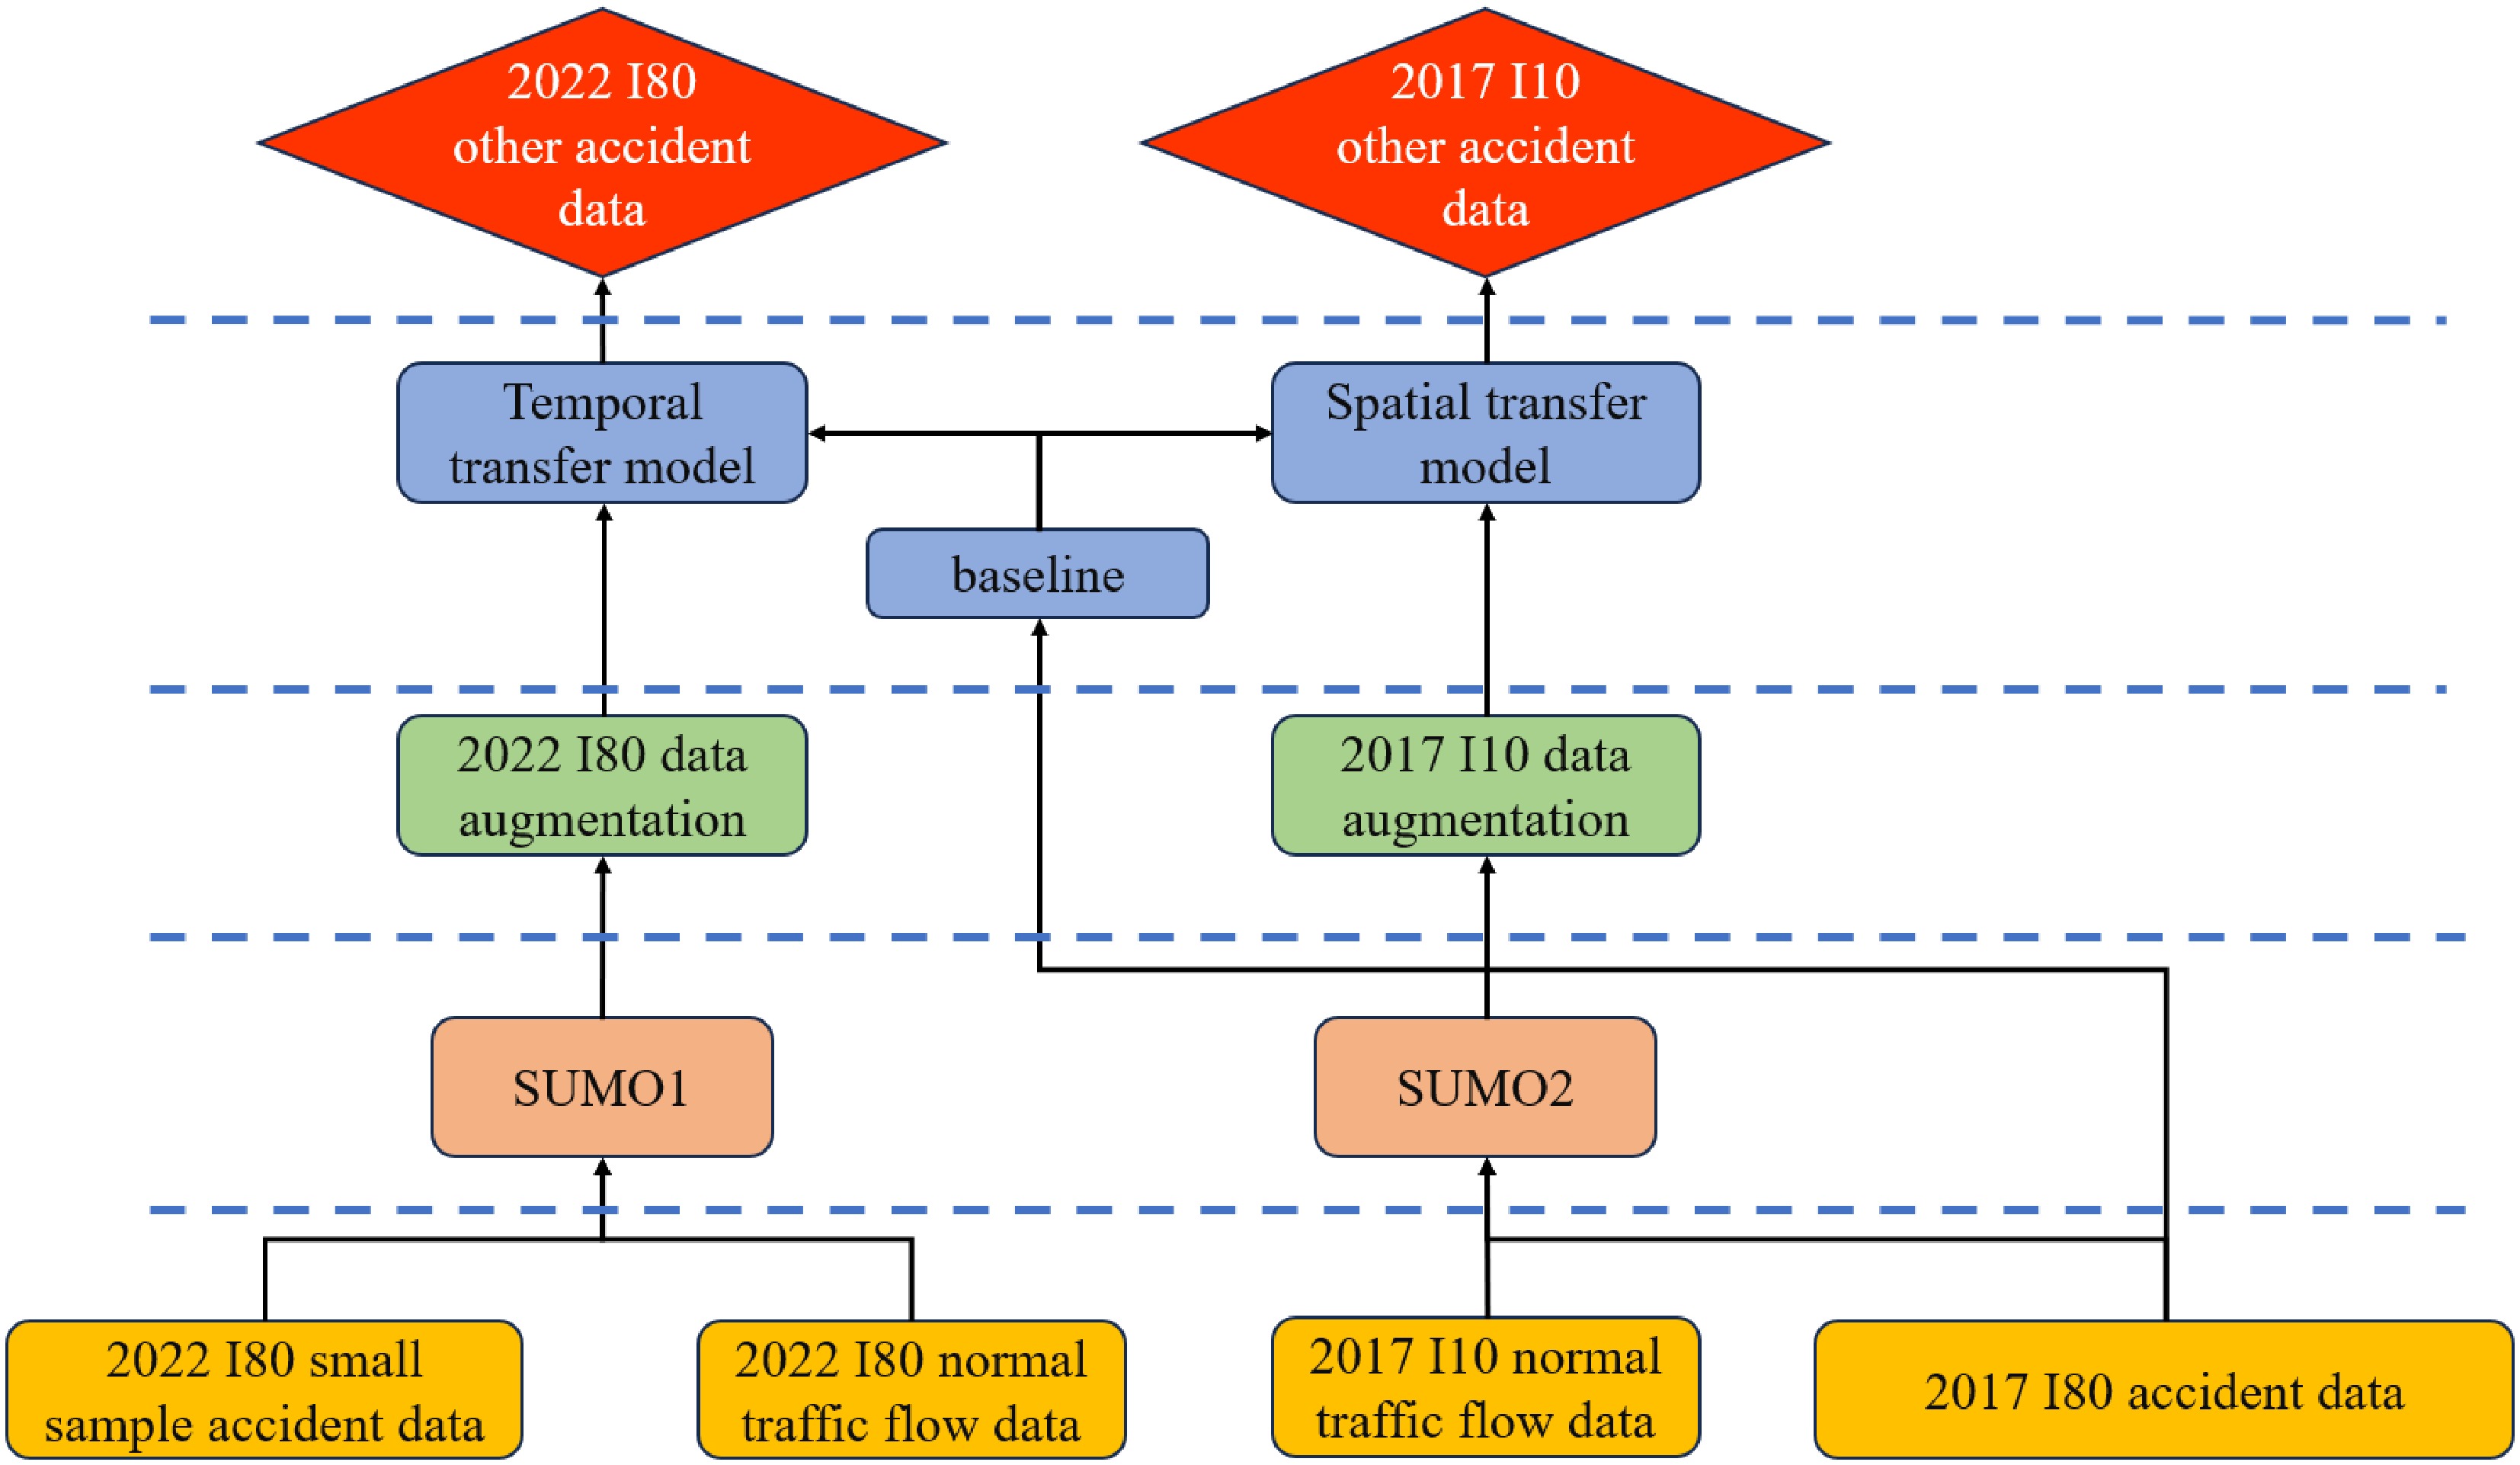
Figure 4.
Temporal and spatial transfer simulation diagram.
To simulate rare accident scenarios and enrich the training dataset, SUMO was used to generate synthetic traffic data based on real-world detector inputs. By calculating the error under different numbers of lanes and impact ranges, the accident scenario was simulated by blocking a single lane. The simulation incorporated five core physical parameters—minimum vehicle gap, maximum acceleration, comfortable deceleration, acceleration exponent, and simulation time step—which govern vehicle behavior and interaction. The resulting traffic patterns exhibit realistic congestion effects, including upstream queuing, abrupt speed drops, and downstream flow disruptions, which are key indicators of anomaly conditions. Subsequently, these simulated data will be spliced with real data for use in subsequent research. The core of this research is to combine real data with simulation data for data augmentation, thereby improving the model's transfer ability in different temporal and spatial contexts, particularly in scenarios with small samples and data scarcity. This approach primarily focuses on two types of transfer: temporal transfer and spatial transfer.
Temporal transfer
-
Temporal transfer refers to the model's ability to transfer knowledge across different time periods (e.g., 2017 vs 2022). To validate the model's performance in temporal transfer scenarios, the study uses real data from the I80-E road in 2017 as the training set and trains a baseline model without data augmentation for the accident detection task. Subsequently, the SUMO simulation software was used to generate augmented simulation data by combining the accident data and normal traffic flow data from the 2022 I80-E road. These simulation data are then used to fine-tune the model to enhance its transfer capability to a new time period.
During the temporal transfer model training process, the Adam optimizer was used with the initial learning rate set to 1e-5. Due to the limited size of the input data, the batch size was set to eight. When the model was trained to a converged state, it was saved. In the subsequent fine-tuning phase, the learning rate was further reduced to 1e-6, and the batch size was adjusted to 16, 32, or 64 depending on the size of the new training set. During the fine-tuning process, the previously saved model was loaded, and training was continued based on it.
In the experiment, 100 real data points were randomly selected from the I80-E road in 2017 (including 20 accident data and 80 non-accident data, with a 1:4 positive-to-negative sample ratio) as the training set, and the model was trained using neural networks to obtain the baseline model. Then, 25 real data points from the I80-E road in 2022 were randomly selected as the first training set, and samples were extracted from the simulated data at ratios of 1:1, 1:9, and 1:19, resulting in three training sets with simulated data volumes of 25, 225, and 475, respectively. These four training sets were then used for model fine-tuning. Finally, the real data from the I80-E road in 2022 was uniformly used as the test set to evaluate the performance of the baseline model and the fine-tuned models.
Spatial transfer
-
Spatial transfer refers to the model's ability to transfer knowledge across different geographical environments or traffic flow characteristics. To validate the model's spatial transfer ability, a test involving transfer between different roads (I80-E and I10-E) was conducted. Initially, accident data from the I80-E road in 2017 and normal traffic flow data from the I10-E road were used to train a baseline model. Subsequently, the SUMO simulation software, combining the accident data from the 2017 I80-E road with the normal traffic flow data from the 110-E road, was used to generate augmented data for the I10-E road, which was then used to fine-tune the model. The specific experimental details will be described in the results section.
For spatial transfer model training, the optimizer used was Adam with a learning rate of 1e-5 and batch size set to eight. The model was saved when training converged, and for fine-tuning, the learning rate was set to 1e-6, the batch size was adjusted to 64 based on the size of the new training set, and the previously saved model was read to perform the training.
In the spatial transfer testing experiment, it was assumed that the I10-E road in 2017 had just begun operation, resulting in a scarcity of normal traffic flow data and a complete lack of accident data. To address this, a baseline model was first constructed by randomly selecting 100 real data samples from the 2017 I80-E road—comprising 20 accident samples and 80 non-accident samples (a case matching ratio of 1:4, which was consistently used thereafter)—and trained neural networks on this set. To generate training data for fine-tuning under spatial transfer conditions, the accident data from the 2017 I80-E road was combined with the limited normal traffic flow data from the 2017 I10-E road, and the SUMO simulation software was used to simulate accidents, applying simulation-based data augmentation to generate enhanced I10-E road samples. From this augmented dataset, 100 samples (20 accident and 80 non-accident) were then extracted to fine-tune the pre-trained baseline model. Finally, real data from the 2017 I10-E road was used as the test set to evaluate the performance of both the baseline and fine-tuned models, thereby assessing the effectiveness of simulation-based augmentation in enhancing spatial transferability.
-
An exhaustive search with a step size of 0.1 was performed across the parameter space constrained by five physical constraints, resulting in the optimal parameter combination that minimizes the error as follows: a = 2.6 m/s2, b = 1 m/s2, s0 = 3 m, δ = 4, T = 0.5 s. Afterwards, real traffic data was used to generate the number of vehicles; using binomial distribution to control whether the vehicle is injected at a certain second to form natural fluctuations; and IDM physical parameters to control the micro-behavior of each vehicle to ensure the physical rationality of the behavior. Using those as input, a seven-day simulation is illustrated in Fig. 5 and conducted to obtain the traffic flow data extracted by the detector during the seven-day simulation.
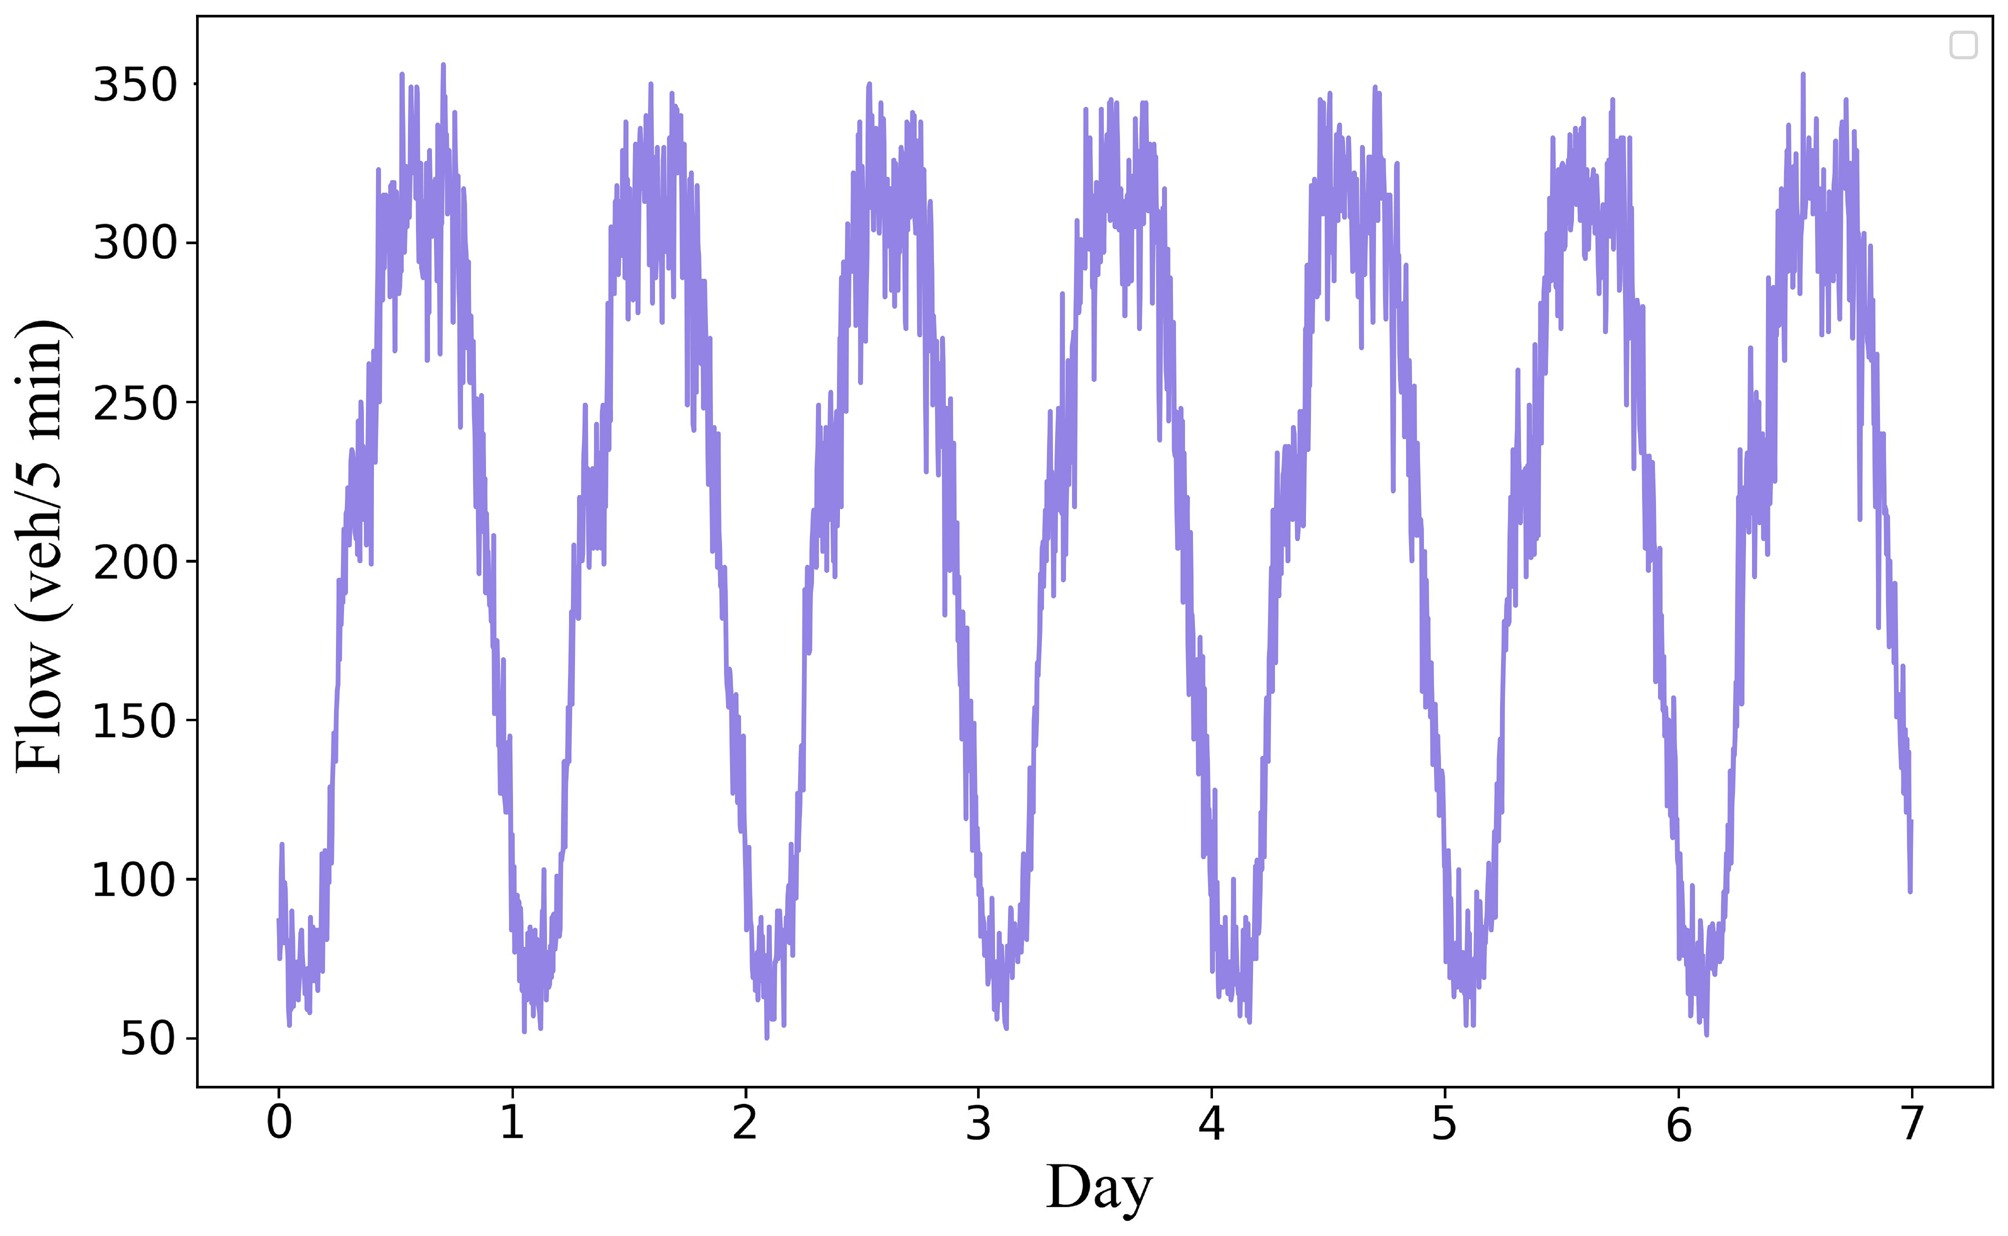
Figure 5.
Seven-day simulation traffic flow variation curve.
Traffic flow prediction
-
Using the three training datasets mentioned in Experimental Workflows for training and predicting the traffic flow data in the next 7 d, the results are shown in Fig. 6. Where the 'Real data (28 d)' curve shows the prediction results for the next 7 d after training the model with dataset A; the 'Real data (1 d)' curve shows the prediction results for the next seven days after training the model with dataset B; and the 'SUMO and real data' curve shows the prediction results for the next 7 d after training the model with dataset C. The 'Ground truth' curve shows the actual observed changes in traffic flow over the 7 d, which is used as a baseline. It was found that analyzing SUMO simulation data in combination with a small amount of real-world data yields predictions that differ very little from predictions based on a large amount of real-world data, compared to using only one day of real data. Additionally, Fig. 7 shows that during non-peak hours, the combined dataset demonstrates particularly significant improvements, with errors approaching the level achieved by training on the complete dataset. This further validates the reliability and utility of the simulated data in relevant analyses.
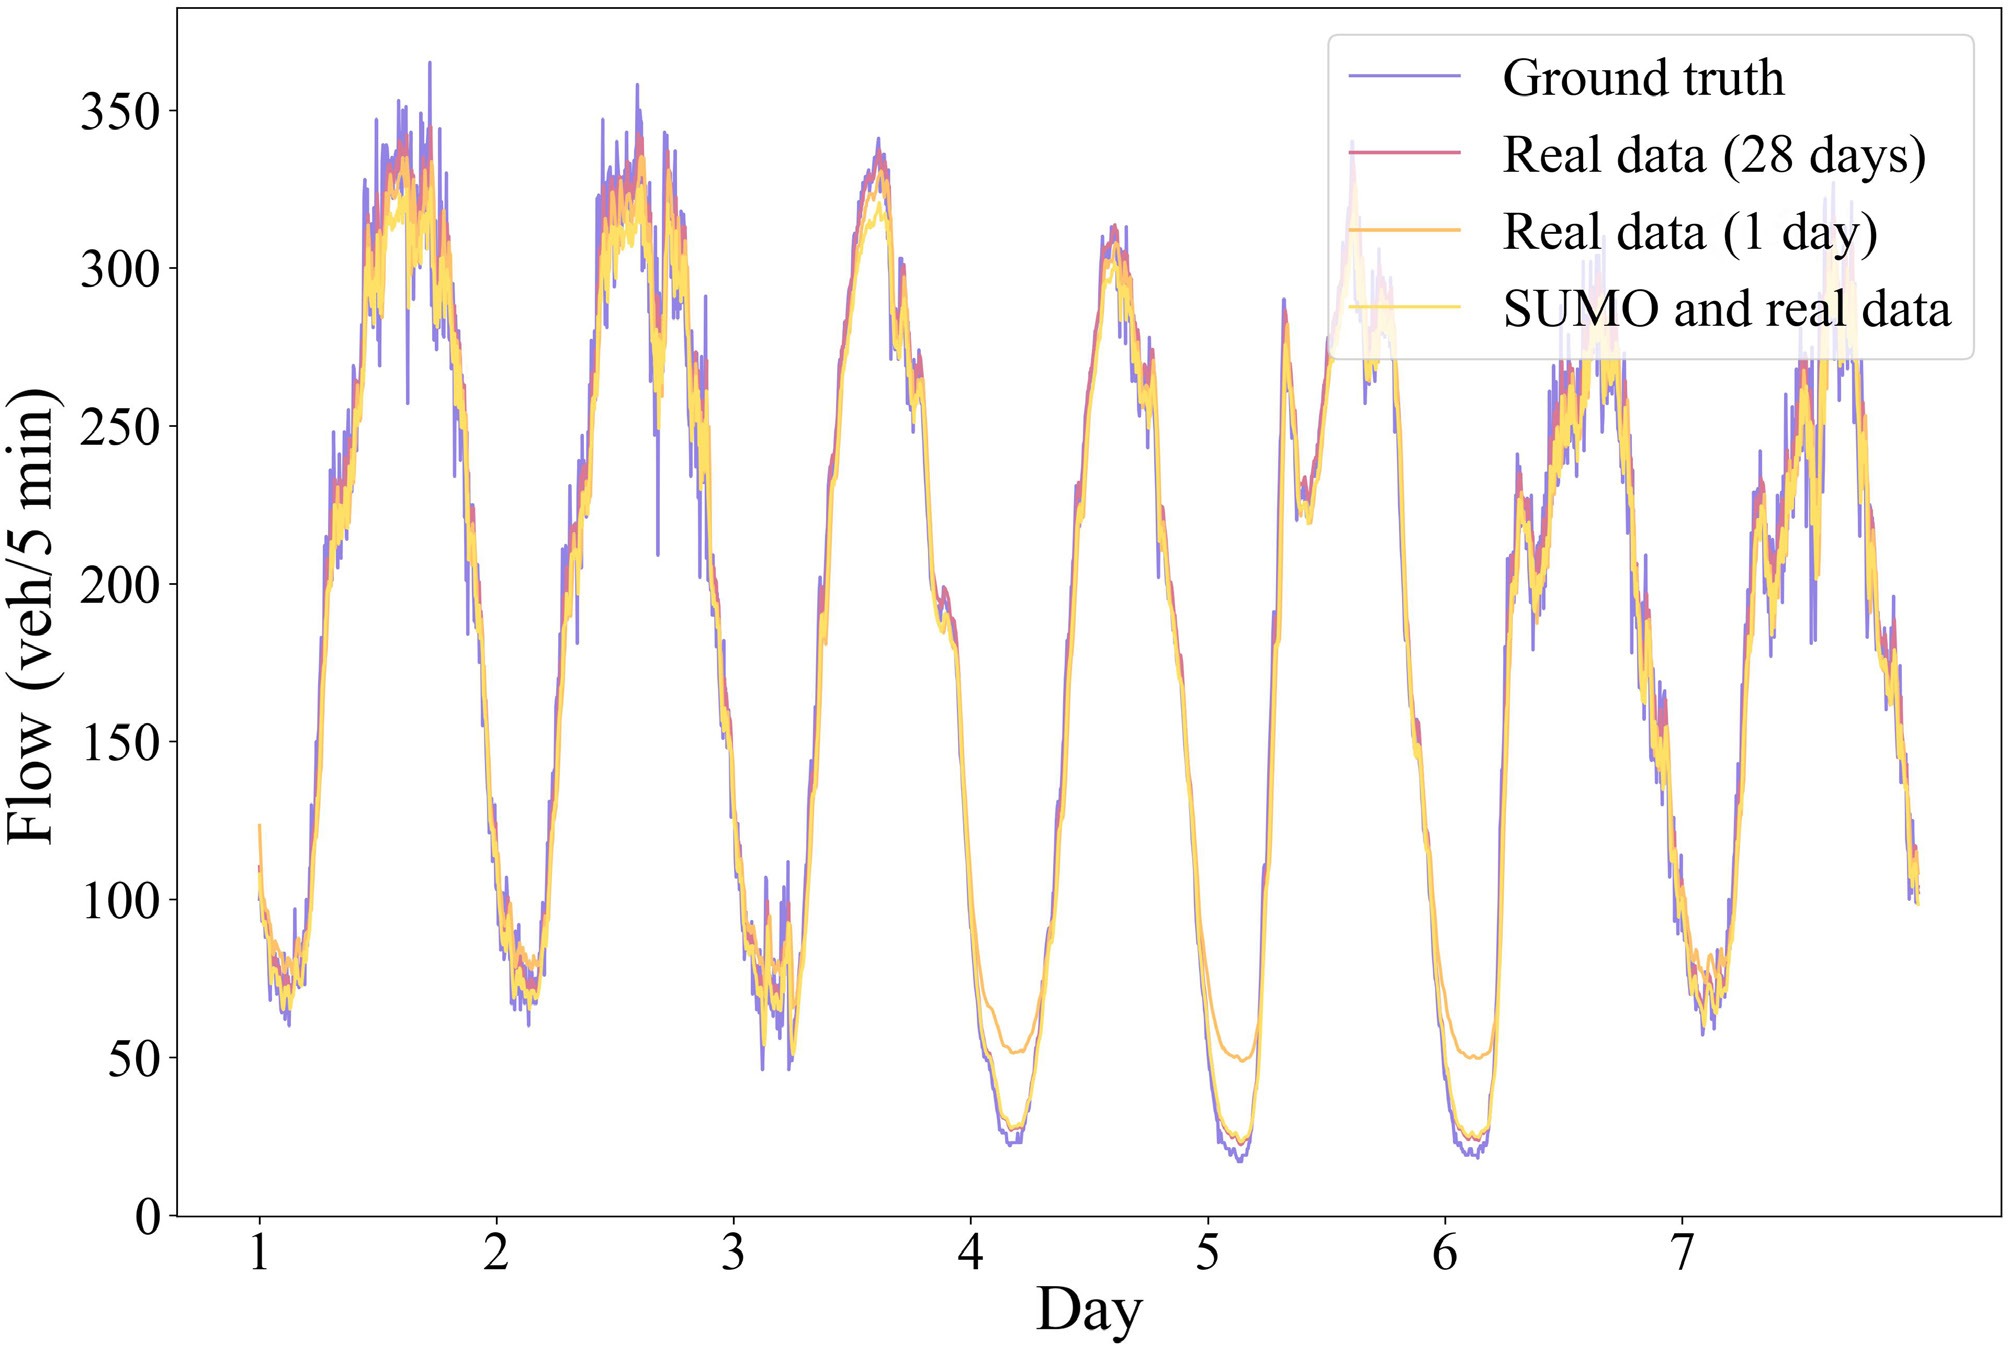
Figure 6.
Comparison of prediction results.
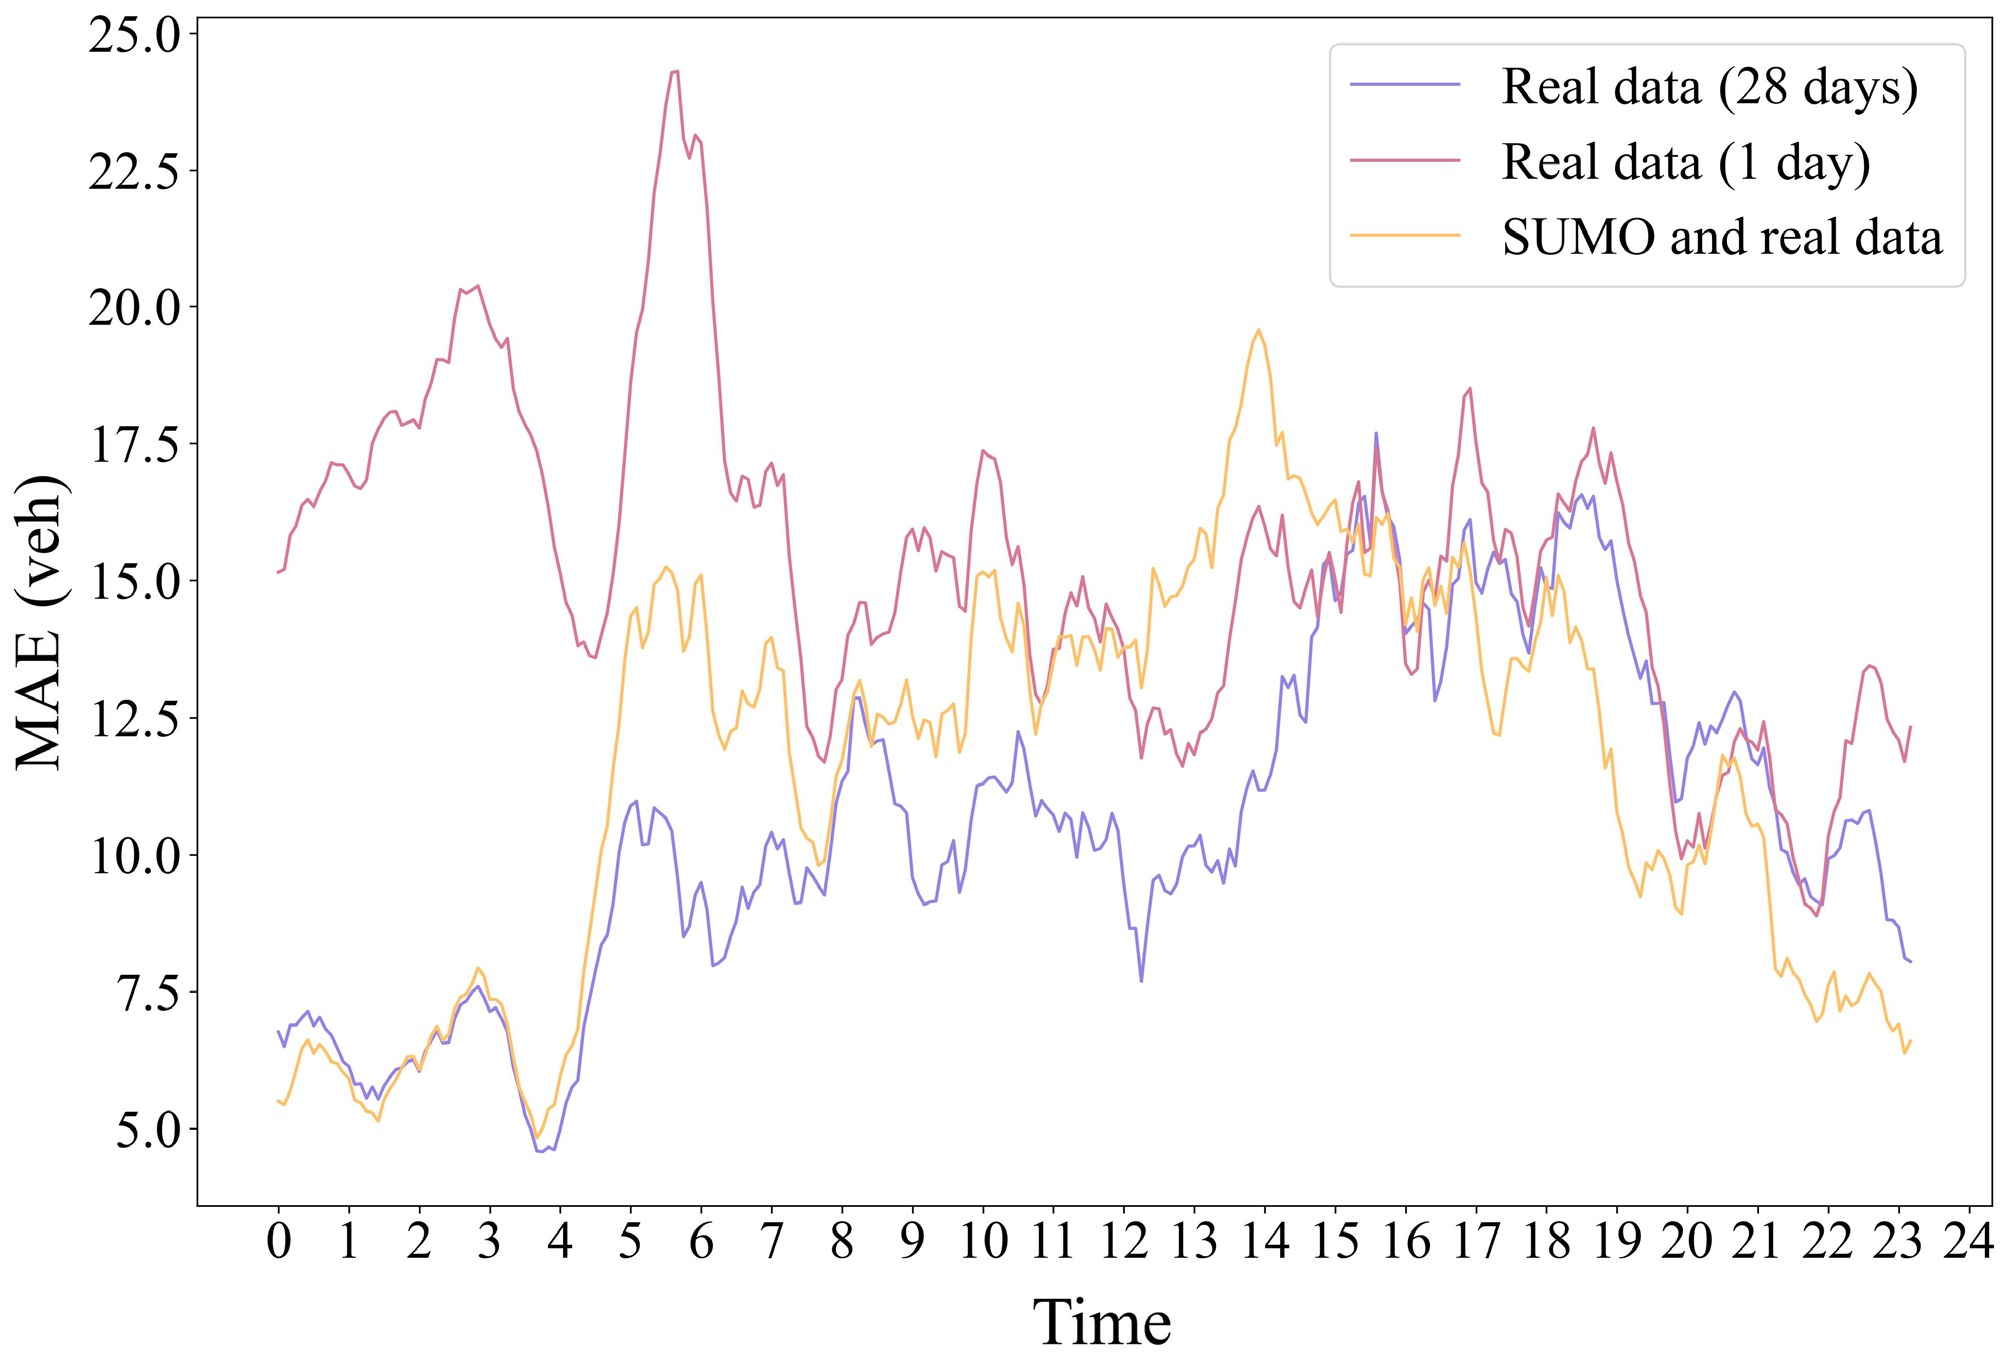
Figure 7.
Twenty four hour traffic flow MAE variation.
Abnormal traffic flow detection
Temporal transfer testing experiment
-
Normal traffic flow data from January 1, 2022, was first selected. The IDM model was calibrated based on the error between the simulation detector data and the real data, yielding the following model parameters: a = 2.3 m/s2, b = 2.6 m/s2, s0 = 5 m, δ = 4, T = 1 s. Next, the SUMO simulation was used to simulate traffic flow after accidents, and by calculating errors under different lane numbers and impact ranges, the simulation settings that best replicated real-world conditions were selected: the impact range was 20 m, and the affected lane number was 1. The accident time and location were randomly selected from five real accidents that occurred on the I80-E road in 2022. Based on the times and locations of these real accidents, combined with the aforementioned settings, simulations were performed using SUMO, resulting in five simulated datasets based on real accident data. The five randomly selected accidents represent approximately 1.85% of the available accident sample for 2017. This significant reduction highlights the challenge of data scarcity and underscores the need to use simulations to supplement data under such constraints.
The experimental results are shown in Fig. 8. The results show that the samples generated through data augmentation not only significantly improved the model's performance but also demonstrated good temporal transferability. Although real data from the I80-E road in 2017 were used during training, the testing was still based on real data from the I80-E road in 2022. The fine-tuned models showed significant improvements in key performance indicators such as accuracy and AUC. Specifically, the MLP, CNN, and LSTM neural network models all exhibited varying degrees of performance improvement after fine-tuning.

Figure 8.
Temporal transfer experiment simulation results. (a) The convergence curves of accuracy and AUC under MLP, CNN, and LSTM neural networks. (b) The comparison of accuracy and AUC curves before and after fine-tuning the model using the 2022 small sample dataset with a 1:1, 1:9, and 1:19 sample ratio as the fine-tuning training set.
For the MLP model, when using the 2022 small sample with a 1:1 sample ratio for training, the model's accuracy was relatively poor. However, when the sample ratio was adjusted to 1:9, the accuracy increased from 69.39% to 73.23%, and further increased to 73.29% when the sample ratio was 1:19. In terms of AUC, all fine-tuning methods showed improvement, with the most significant increase seen at a 1:19 sample ratio, where the AUC rose from 52.02% to 52.96%.
For the CNN model, all fine-tuning strategies outperformed the baseline model, further confirming the performance-boosting effect of data augmentation. Specifically, when using the 2022 small sample, the accuracy improved from 76.55% to 76.81%. As the sample ratio increased, the accuracy continued to improve, reaching 77.19%, 78.36%, and 78.4%. In terms of AUC, the AUC for the 2022 small sample increased from 50.36% to 50.52%, and the AUC for different sample ratios also showed gradual improvements: from 50.36% to 50.76% for a 1:1 ratio, from 50.36% to 50.72% for a 1:9 ratio, and from 50.36% to 50.92% for a 1:19 ratio, showing stable and progressive enhancement.
For the LSTM model, there was also a significant improvement in accuracy. When using the 2022 small sample, accuracy increased from 70.86% to 75.02%. As the sample ratio changed, accuracy reached 74.5% for a 1:1 ratio, 78.27% for a 1:9 ratio, and 79.49% for a 1:19 ratio. AUC also increased from 50.16% to 50.52%. These results further indicate that data augmentation significantly improved the LSTM model's performance in temporal transfer scenarios.
Overall, the experimental results validate the effectiveness of the simulation-based data augmentation training method in temporal transfer scenarios. Especially in small sample situations, data augmentation not only enhances the model's generalization ability but also effectively improves transfer performance across time periods. These findings provide strong empirical support for model optimization using data augmentation techniques, further proving the potential and advantages of simulation data as augmented samples in data-scarce situations. In addition, as the sample proportion increases, the diversity of the data gradually improves, and the performance of the model shows an overall upward trend. This result suggests that in the absence of real data, simulated data helps to improve the generalization ability and performance of the model. Therefore, combining real data with simulation data for data augmentation is an effective strategy to improve model performance and address data scarcity, offering significant guidance for future research and applications.
Spatial transfer testing experiment
-
Data was selected from January 1, 2017, and the IDM model was calibrated based on the error between simulated detector data and real data, obtaining parameters: a = 3 m/s2, b = 2.6 m/s2, s0 = 5 m, δ = 4, T = 0.25 s. Next, SUMO was used to simulate traffic flow after an accident and selected the most realistic simulation settings by calculating the error under different lane counts and influence ranges, obtaining an influence range of 20 and an affected lane number of 0. The time and location of accidents were randomly generated to meet the requirements of the spatial transferability test. The time and location of the accident are determined using a completely randomized approach. Combining the above setup, a simulation dataset is obtained. This simulation setup is consistent with the definition of zero-shot scenarios introduced in the abstract. Since no real accident data exists for the I10-E road, the experiment tests whether models fine-tuned with simulated accident data—originating from different roads—can generalize to such unseen environments.
The experimental results are shown in Fig. 9. From Fig. 9, it is seen that the samples generated were validated through data augmentation not only improving the model's performance but also demonstrating good spatial transferability. Although accident data from the I80-E road and normal traffic flow data from the I10-E road were used for augmentation during training, the testing was still based on real data from the I10-E road. The results show that the fine-tuned model showed significant improvement in key metrics such as accuracy (acc) and AUC value. Specifically, the three neural network models, MLP, CNN, and LSTM, all showed performance improvements after fine-tuning. The accuracy of MLP increased from 75.53% to 76.58%, and AUC increased from 53.62% to 56.74%; CNN's accuracy improved from 75% to 75.79%, and AUC increased from 50.33% to 51.32%; LSTM's accuracy rose from 74.74% to 77.37%, and AUC increased from 52.63% to 53.39%.

Figure 9.
Spatial transfer experiment simulation results. (a) The convergence curves of accuracy and AUC under MLP, CNN, and LSTM neural networks. (b) Comparison of accuracy and AUC convergence curves between the fine-tuned model using SUMO simulation data and the baseline model.
Combining the results of the temporal transfer experiments with the spatial transfer experiments, it can be found that in the temporal transfer experiment, LSTM and CNN perform better because they are able to capture spatial and temporal features, respectively. In the spatial transfer experiment, there is not much difference among the three models because the performance improvement of MLP mainly relies on the increase of data diversity, and more training data than in the temporal transfer experiment leads to the improvement of the performance of the MLP model.
Overall, the experimental results have demonstrated the effectiveness of the data augmentation training method based on simulation in spatial transfer scenarios. Even in the absence of accident samples, the performance after fine-tuning has also been improved, indicating that data augmentation, not only improved the training data for the model but also enhanced the model's transfer learning ability, demonstrating the advantage of generated data over the original data in terms of spatial transferability and performance improvement. Moreover, despite the training and testing data coming from different geographical environments and traffic flow characteristics, the data augmentation method was still able to help the model effectively transfer and improve its performance in the new environment, further validating the method's effectiveness and generalization ability.
To further illustrate the effectiveness of the method, the model performance was compared under different data configurations under the cross-model (MLP, CNN, LSTM) setting. Specifically, the experimental results of the spatial migration experiment and the experimental results of the time migration experiment were selected when the ratio of real data to simulated data was 1:19, a total of six groups of paired data, and paired t-tests were performed on the accuracy and AUC indicators, respectively. The test results show that the p-value of 'accuracy' is 0.0046 and the p-value of AUC is 0.0121, which are significantly lower than the commonly used significance level (α = 0.05), indicating that the proposed method based on simulation data enhancement is statistically significant in improving model performance.
-
The main contribution of this paper is to demonstrate the effectiveness of simulation data augmentation in improving the performance of traffic anomaly detection models. The experimental results provide strong empirical evidence across multiple dimensions:
Time transfer performance: using simulated data generated from 2017 I80-E road data improved model performance when tested on 2022 I80-E road data. After fine-tuning with simulation data, models showed improvements in key metrics such as accuracy and AUC, effectively addressing time-related traffic pattern changes.
Spatial transfer performance: the spatial transfer experiment verified that combining simulated data generated from accident data on the I80-E road with normal traffic flow data on the I10-E road enhanced model performance on the I10-E road, despite differences in geographic environment and traffic flow characteristics between the two roads.
Statistical significance: To further illustrate the effectiveness of the method, model performance was compared under different data configurations across three architectures (MLP, CNN, LSTM). Using experimental results from spatial and time transfer experiments with a 1:19 ratio of real to simulated data, the test results show that the p-value of 'accuracy' is 0.0046 and the p-value of AUC is 0.0121, which are significantly lower than the commonly used significance level (α = 0.05), confirming the statistical significance of the simulation data augmentation approach.
Cross-architecture benefits: all three evaluated models—MLP, CNN, and LSTM—showed varying degrees of improvement after using augmented data, demonstrating that different deep learning architectures benefit from data augmentation, though to different extents.
Limitation
-
This study acknowledges that other critical factors—such as adverse weather conditions, road surface quality, lighting, and variability in driver behavior—can significantly influence accident occurrence and traffic dynamics. These were not included in the current simulation due to limitations in SUMO's built-in capabilities and our study's focus on evaluating the core feasibility of physically constrained data augmentation.
Future directions
-
Future research should focus on incorporating the aforementioned factors by extending SUMO through external modules or coupling it with more sophisticated behavior models to construct more comprehensive simulation environments that better reflect real-world driving conditions, diversity, and uncertainty.
Additional research directions include exploring the integration of other simulation tools, such as the CityFlow platform based on the SUMO framework with built-in self-driving decision models, and the AIMSUN system, which natively supports hybrid micro-meso-macro modeling with real-time data interfaces. The simulation setup for accident scenarios can be further optimized by introducing more physical constraints, using neural networks to construct more accurate following models, and employing reinforcement learning for parameter selection. Mixed traffic flow environments containing self-driving vehicles could be constructed, incorporating more complex neural network architectures to improve model performance. Expanding the dataset to cover a wider range of accident scenarios and traffic conditions could further strengthen this method's applicability in various traffic management tasks.
Conclusions
-
This paper provides strong empirical support for simulation data augmentation as an optimization method for traffic anomaly detection models, particularly when real-world data is scarce or difficult to obtain. Using SUMO simulation software to generate accident scenarios and augment real data has proven statistically significant and effective in improving model robustness and transferability, especially in small sample scenarios.
This research is financially supported by the Zhejiang Provincial Natural Science Foundation of China (Grant Nos LDT23F01011F01, LZ23E080002), 'Pioneer' and 'Leading Goose' R&D Program of Zhejiang (Grant Nos 2023C01038, 2023C03155), and National Natural Science Foundation of China (Grant No. 72171210).
-
The authors confirm contributions to the paper as follows: study conception and design: Yang H, Liao C; data collection: Liao C; analysis and interpretation of results: Yang H, Chen C; draft manuscript preparation: Yang H, Dong Z, Chen C. All authors reviewed the results and approved the final version of the manuscript.
-
The data that support the findings of this study are available in the Caltrans Performance Measurement System repository. These data were derived from the following resources available in the public domain: https://pems.dot.ca.gov.
-
The authors declare that they have no conflict of interest.
- Copyright: © 2025 by the author(s). Published by Maximum Academic Press, Fayetteville, GA. This article is an open access article distributed under Creative Commons Attribution License (CC BY 4.0), visit https://creativecommons.org/licenses/by/4.0/.
-
About this article
Cite this article
Yang H, Liao C, Dong Z, Chen C, Mo D, et al. 2025. SUMO-enhanced traffic anomaly detection: enhancing spatiotemporal transferability through simulation-based data augmentation. Digital Transportation and Safety 4(4): 264−274 doi: 10.48130/dts-0025-0025 

SUMO-enhanced traffic anomaly detection: enhancing spatiotemporal transferability through simulation-based data augmentation
- Received: 02 January 2025
- Revised: 29 July 2025
- Accepted: 22 September 2025
- Published online: 31 December 2025
Abstract: Traffic anomaly detection is crucial for road safety and traffic efficiency, but the scarcity of accident data poses challenges for model training. Although current research has utilized deep neural networks for data augmentation in small-sample scenarios, it has largely overlooked real-world physical constraints and lacks exploration into zero-shot scenarios, areas that still require further development. The paper proposes a SUMO-based simulation-driven data augmentation approach that enhances detection performance under limited real-world data conditions. Synthetic accident data are generated under five physical constraints and integrated with real traffic data to augment the training set. This study evaluates the method using three deep learning models (MLP, CNN, and LSTM) on PeMS datasets from two California highways (I80-E and I10-E). Experimental results demonstrate that the simulation-augmented training significantly improves model performance. In the spatial transfer experiment, the MLP model's accuracy improved from 75.53% to 76.58%, and AUC increased from 53.62% to 56.74%. These findings indicate that this approach effectively enhances both temporal and spatial transferability for traffic anomaly detection in small-sample scenarios.