


-
The airport surface serves as a vital area where aeroplanes receive services and operations, involving a variety of aircraft and supporting service vehicles. Over the three years before the COVID-19 pandemic, the number of takeoff and landing sorties of civil aviation airports in China has been increasing, leading to a busier airport surface and an elevated risk of operational conflicts among various entities on the airport grounds[1]. Disturbingly, statistics from the Flight Safety Foundation (FSF) indicate that there were 24 incidents of aircraft colliding with ground vehicles worldwide between 2017 and 2021[2]. Such accidents often result in severe consequences, including casualties and property damage, significantly impacting the airport's operational order and plans. Moreover, the International Air Transport Association[3] has reported that by 2035, the cost of losses due to various ground damage could reach USD $10 billion. Therefore, ensuring the safety of aircraft on the airport surface is of paramount importance, necessitating effective measures and robust conflict detection methods to prevent accidents and maintain the smooth operation of airports.
Addressing these challenges requires the development of advanced and accurate methods to detect conflicts between aircraft and vehicles on the airport surface, ultimately enhancing the safety and efficiency of airport operations. At the airport scene, aircraft and ground support vehicles operate in the same areas. Ground support vehicles provide a variety of services to aircraft, such as power supply, cleaning and cargo handling, to assist in the aircraft's periodic operation process. In the current research on airport ground safety management, significant efforts have been made in the initial allocation of aircraft taxi routes[4] and the adjustment based on predicted taxi trajectories[5]. Although good macro-control is the foundation to ensure the safety of airport ground operations, the fixed pre-planning schemes are not enough to deal with sudden, random risk events. While macro-control instructions ensure that vehicles give way to aircraft, the risk of conflict between aircraft and ground vehicles is not eliminated due to accidental or erroneous actions of air traffic control officers, airplane pilots and ground vehicle drivers[6]. In addition, in traditional traffic safety studies, the heterogeneity of different traffic modes is rarely considered[7−9]. In the conflict detection of the airport surface, the safety features of the interaction between aircraft and various types of vehicles are often ignored, including dynamic characteristics, complicated operating rules and safety margin requirements. Therefore, some risk assessment models developed on the basis of historical data ignore the impact of the interaction between vehicles and aircraft on the collision risk[10], resulting in a deviation from the actual situation and insufficient accuracy of risk assessment. Therefore, it is meaningful to develop a more refined conflict detection method by considering the operational characteristics of the vehicle-aircraft transport mode combination, which can not only improve the safety level of the airport, but also improve operational efficiency by reducing unnecessary redundancy.
To address the issue of neglecting micro-level conflicts between vehicles and aircraft in traditional airport surface research, this paper proposes a dedicated detection method targeting this specific type of conflict. Inspired by the research on robot obstacle avoidance, the velocity obstacle (VO) is adopted as the basis for the vehicle-aircraft conflict detection strategy and improved to suit the characteristics of the conflict scenarios. By considering the differences in the required safety distances in various directions, the contour range of the operating entities in the velocity obstacles method is reduced, effectively decreasing excessive spatial constraints in the lateral direction of the aircraft and improving the accuracy of conflict detection. The significance of this approach lies in simultaneously improving overall operational efficiency while ensuring the safe taxiing of aircraft and vehicles.
-
The operation of the airport is primarily controlled and managed by the control tower. In the past, controllers relied on visual observation to assess the scene and issue appropriate movement instructions to aircraft. However, with the increasing complexity of the airport surface layout and the growing number of operating entities, it has become challenging for controllers to comprehensively perceive the operational situation of the surface and adopt a globally optimal control strategy through visual observation alone. To address this issue, electronic aids such as the Advanced Surface Movement Guidance and Control System (A-SMGCS) have been introduced to airports to enhance the perception of the operational situation and gradually automate the management of operating entities[11].
To ensure the safe operation of airport activities and enhance the effectiveness of auxiliary facilities, researchers have explored various measures to reduce the risk of conflicts. One approach involves the allocation of taxi paths, aiming to eliminate conflicts by setting a reasonable initial plan. This type of research abstracts the layout of taxiways at airports into directed graphs composed of nodes and edges. A path allocation model is then constructed, with efficiency indicators such as taxi time or taxi distance as optimization objectives, and constraints such as allowing only one aircraft to occupy an edge and maintaining specific time and distance intervals between the arrival of two aircraft at nodes. Heuristic algorithms, including genetic algorithm[12], simulated annealing algorithm[13], A* algorithm[14], artificial bee colony algorithm[15], particle swarm optimization and ant colony optimization[16], are employed to obtain the optimal solution for the model.
Another approach involves taxi trajectory prediction as an auxiliary perception method for airport operations, effectively addressing the high uncertainty of taxi trajectories in the absence of efficient sharing mechanisms between control tower controllers, pilots, and ground operators[17]. This provides information support for real-time adjustment of taxi path allocation schemes. Researchers introduce different factors into models and choose appropriate machine learning methods to predict taxi trajectories. These methods include a multiple regression model considering the correlation between airport traffic volume and taxi time[18], a spatial-temporal graph convolutional neural network model representing motion characteristics of objects using graphs[17], a taxi conflict risk calculation method based on Gaussian spatial-temporal regression[5], and the selection of historical data with the highest scene similarity based on cluster analysis as the basis for predicting taxi time[19].
In general, the aforementioned research focuses on the overall operation of the airport and helps manage the airport's operational status from a macro perspective. However, these methods lack the ability to accurately address the interaction between the time-varying, stochastic, and dynamic relationships between the two operating entities at the micro level. As a result, they cannot autonomously detect local conflicts that may arise temporarily or provide timely instructions to change the movement status and resolve conflicts. Nevertheless, there are extensive studies on local dynamic obstacle avoidance in the fields of road vehicles, navigation, and robotics. These methods include real-time planning and obstacle avoidance path methods for robots based on artificial potential field theory[20], safety field theory and corresponding driving collision warning algorithms that consider the mutual relationship between humans, vehicles, and roads[21−23], as well as real-time assessment methods of collision risk for ships based on velocity obstacle theory[24].
Velocity Obstacle (VO) is a real-time detection and avoidance method for dynamic obstacles based on differential geometry. Its simplicity and ease of use have led to widespread theoretical and practical applications, and researchers continue to improve its effectiveness. Some researchers consider the uncertainty in motion processes and sensor data errors, introducing probability distributions into the model. For example, Gaussian distribution is not only used to describe the range of obstacle positions[25] and the velocity variations affected by multiple factors[26], but also used to assume the data noise distribution in the chance constrained programming used to limit the range of speed choices in VO and encourage collision avoidance[27]. Efforts have also been made to enhance the computational efficiency of collision-free velocity search. The locking sweeping method was introduced to provide an initial yaw angle for VO to avoid redundant searching[28]. Likewise, the collision risks were evaluated by detecting the collision process between ship pairs, avoiding the issue of ignoring the fluctuation process of motion variables and repeated detection[29]. In addition, improvements have been made to the models of velocity obstacles. For example, the Reciprocal Velocity Obstacle (RVO) was proposed, which achieves safe and non-oscillatory motion by averaging the current velocities of the agents and the new velocities outside the collision cone[30]. The model was further improved by introducing the theory of Optimal Reciprocal Collision Avoidance (ORCA), which optimizes velocity by considering maximum velocity and preferred velocity and uses linear programming to solve the problem, effectively achieving collision avoidance in multi-agent scenarios[31].
This paper investigates the conflict detection method that is tailored to the unique characteristics of vehicle-aircraft collision scenarios. As mentioned earlier, the main drawbacks of current airport surface safety management are twofold: firstly, the lack of autonomous collision detection and avoidance capabilities between operating entities based on specific spatiotemporal relationships; secondly, the lack of methods that consider the heterogeneity between vehicles and aircraft. Given that current aviation operations aim for multi-objective improvement[32], the proposed method should not only adapt to the specific characteristics of conflicts between vehicles and aircraft, provide methodology support for the operation entities to avoid conflict autonomously and precisely, but also consider enhancing operational efficiency while maintaining safety.
-
On the airport surface, the possibility of conflict between aircraft and vehicles still remains in multiple areas. In addition to ground handling vehicles close to aircraft on the apron, vehicles such as snow removal equipment and tugs are also allowed to enter taxiways and other areas[10], resulting in the time-space intersection points between aircraft and vehicles on the trajectory not being completely eliminated. Although air traffic control is committed to preventing aircraft from colliding with obstacles such as vehicles on the ground[10], the risk of collision between aircraft and vehicles still exists due to incorrect operations by air traffic controllers, pilots and vehicle drivers[6].
In the field of vehicle safety, conflicts are often determined by calculating the distance between two vehicles, collision time, or using surrogate safety measures that take into account additional factors[33,34]. However, these indicators and methods are not directly applicable for determining conflicts between vehicles and aircraft due to the distinct characteristics of vehicle-aircraft conflicts, which differ significantly from typical vehicle conflicts on roads:
● Different from vehicles, the irregular shape of aircrafts lead to different numerical results when using different reference points for distance measurement, as shown in Fig. 1. Additionally, some airport standards focus on the design of areas such as vehicle holding positions[35], while lacking detailed and widely accepted standards for measuring distances between vehicles and aircraft. This results in the inability to accurately measure safe distances and assess conflict risk.
Figure 1.
Differences in distance measurement between different scenes.
● Compared to road scenarios where conflicts are resolved by the vehicles whose drivers observe unsafe conditions and adjust their driving behaviors, on the airside, considering that aircrafts have higher right-of-way and vehicles must give way to them[36], it can be considered that in vehicle-aircraft conflicts, vehicles should also take measures to prioritize conflict avoidance.
● In road traffic, the area around the vehicle is not clearly defined as off-limits. However, according to the relevant management regulations for apron operations, vehicles are not allowed to drive within a certain distance in front of, behind, or on both sides of an aircraft during taxiing[37]. Similar regulations also apply during aircraft flights. To avoid flight conflicts, aircraft should maintain a certain distance between each other. Therefore, the method of establishing a circular plane as a safety protection zone centered around the aircraft is used to analyze collision risks[38]. By examining whether the protection zones of the two entities overlap, the potential for conflicts can be determined.
Given the limitations of traditional conflict detection methods in responding to the characteristics of vehicle-aircraft conflicts, this paper proposes a detection method for vehicle-aircraft conflict scenarios that combines the idea of constructing a protection zone for aircraft with the velocity obstacle method and further improvements (Fig. 2).
Figure 2.
Schematic diagram of a safety protection zone.
Improved velocity obstacle method
Reduce space constraints
-
The velocity obstacle method is used in motion planning for obstacle avoidance in dynamic environments. This method defines a set of velocities for the moving entity that will result in collision with obstacles and avoids these velocities by selecting velocities outside of this set[39]. For independent moving objects A and B with circular contours as shown in Fig. 3a, their positions are denoted as pA and pB, and velocity vectors as
$ \overrightarrow{{v}_{A}} $ $ \overrightarrow{{v}_{B}} $ 
Figure 3.
Schematic diagram of two moving entities in a scene and velocity obstacle model.
${B}'=A \oplus B=\left\{a+b|a\in A,b\in B\right\}$ (1) where,
$ \oplus $ $ \overrightarrow{v} $ $ \lambda \left({p}_{O},v\right)=\left\{{p}_{O}+\overrightarrow{v}*t|t\ge 0\right\} $ (2) The collision cone based on the velocity obstacle VOA|B can be represented in a set form as Eq. (3):
$ {VO}_{A|B}=\left\{\overrightarrow{{v}_{AB}}|\lambda \left({p}_{A},\overrightarrow{{v}_{A}}-\overrightarrow{{v}_{B}}\right)\cap A \oplus B\ne \varnothing \right\} $ (3) The range represented by it is shown by the shaded area in Fig. 3b. When
$ \overrightarrow{{v}_{AB}}\in $ $ \overrightarrow{{v}_{AB}} $ The velocity obstacle method provides a simple and effective implementation strategy for dynamic collision avoidance in motion processes. However, whether it is the protective zone mentioned before[38] or the aircraft conflict resolution algorithm based on geometric models developed by Durand & Barnier[40], both involve drawing a circular area with the aircraft as the center and using the VO method to determine if a conflict will occur. However, when VO is used on airport surfaces, the commonly used circular contour may not be completely suitable for aircraft sizes and safety distance requirements, as there is a certain discrepancy between the circular contour and the actual size range. Whether it is the unequal lengths of the fuselage and wingspan or the differences in required safety distances in different directions as specified in safety regulations[37], constructing the protective zone of an aircraft requires a greater length along the direction of the fuselage compared to its vertical direction.
Therefore, this paper considers the differences in length requirements for aircraft in two main directions, with the fuselage direction as the long axis and the wing direction perpendicular to the fuselage as the short axis, constructing an elliptical protective zone and applying it to the velocity obstacle method. Similarly, considering the size characteristics and safety distance requirements of vehicles in both transverse and longitudinal directions, the contour range of vehicles is also simplified as an ellipse. In this paper, ellipse A and B represent the vehicle and aircraft, respectively, where ai and bi represent the long and short semiaxes of ellipse i, as shown in Fig. 4.
Figure 4.
Schematic diagram of elliptical protective zones for aircraft and vehicle.
It is necessary to mention that in the study conducted by Berg et al.[31], the problem of oscillatory motion caused by the velocity obstacle method was analyzed. This flaw occurs because in VO, when two agents detect a conflict, they simultaneously adjust their motion states to avoid the conflict, resulting in no conflict occurring in the next moment. As a result, they revert to their old velocities, which guide them more directly towards their destinations. Consequently, in the next cycle, they readjust their motion states due to the conflicts caused by the old velocities. Therefore, when using VO for collision avoidance, the moving agents oscillate between two velocities. However, this issue does not occur in the method described in this paper. As explained previously, considering the priority of aircraft traffic, in this paper, conflict resolution is achieved by having only the vehicles unilaterally change their motion states, eliminating the problem of oscillations caused by excessive adjustments.
Error analysis for simplified calculations
-
Since the Minkowski sum is a summation over sets of points, the relative position of the center points of two regions does not affect the summation result. However, in the case of elliptical regions, the different orientations of the major axes of two ellipses can lead to different mapping results under Minkowski sum calculation, thereby affecting the boundary range of the collision cone. To further explain the degree of impact, first consider two special scenarios: when the major axes of the two ellipses are parallel and perpendicular, as shown in Fig. 5, the relationship between ellipse A and ellipses B1 and B2 respectively. The major and minor semi-axes of the mapped elliptical regions
$ {B}'_{1} $ $ {B}'_{2} $ 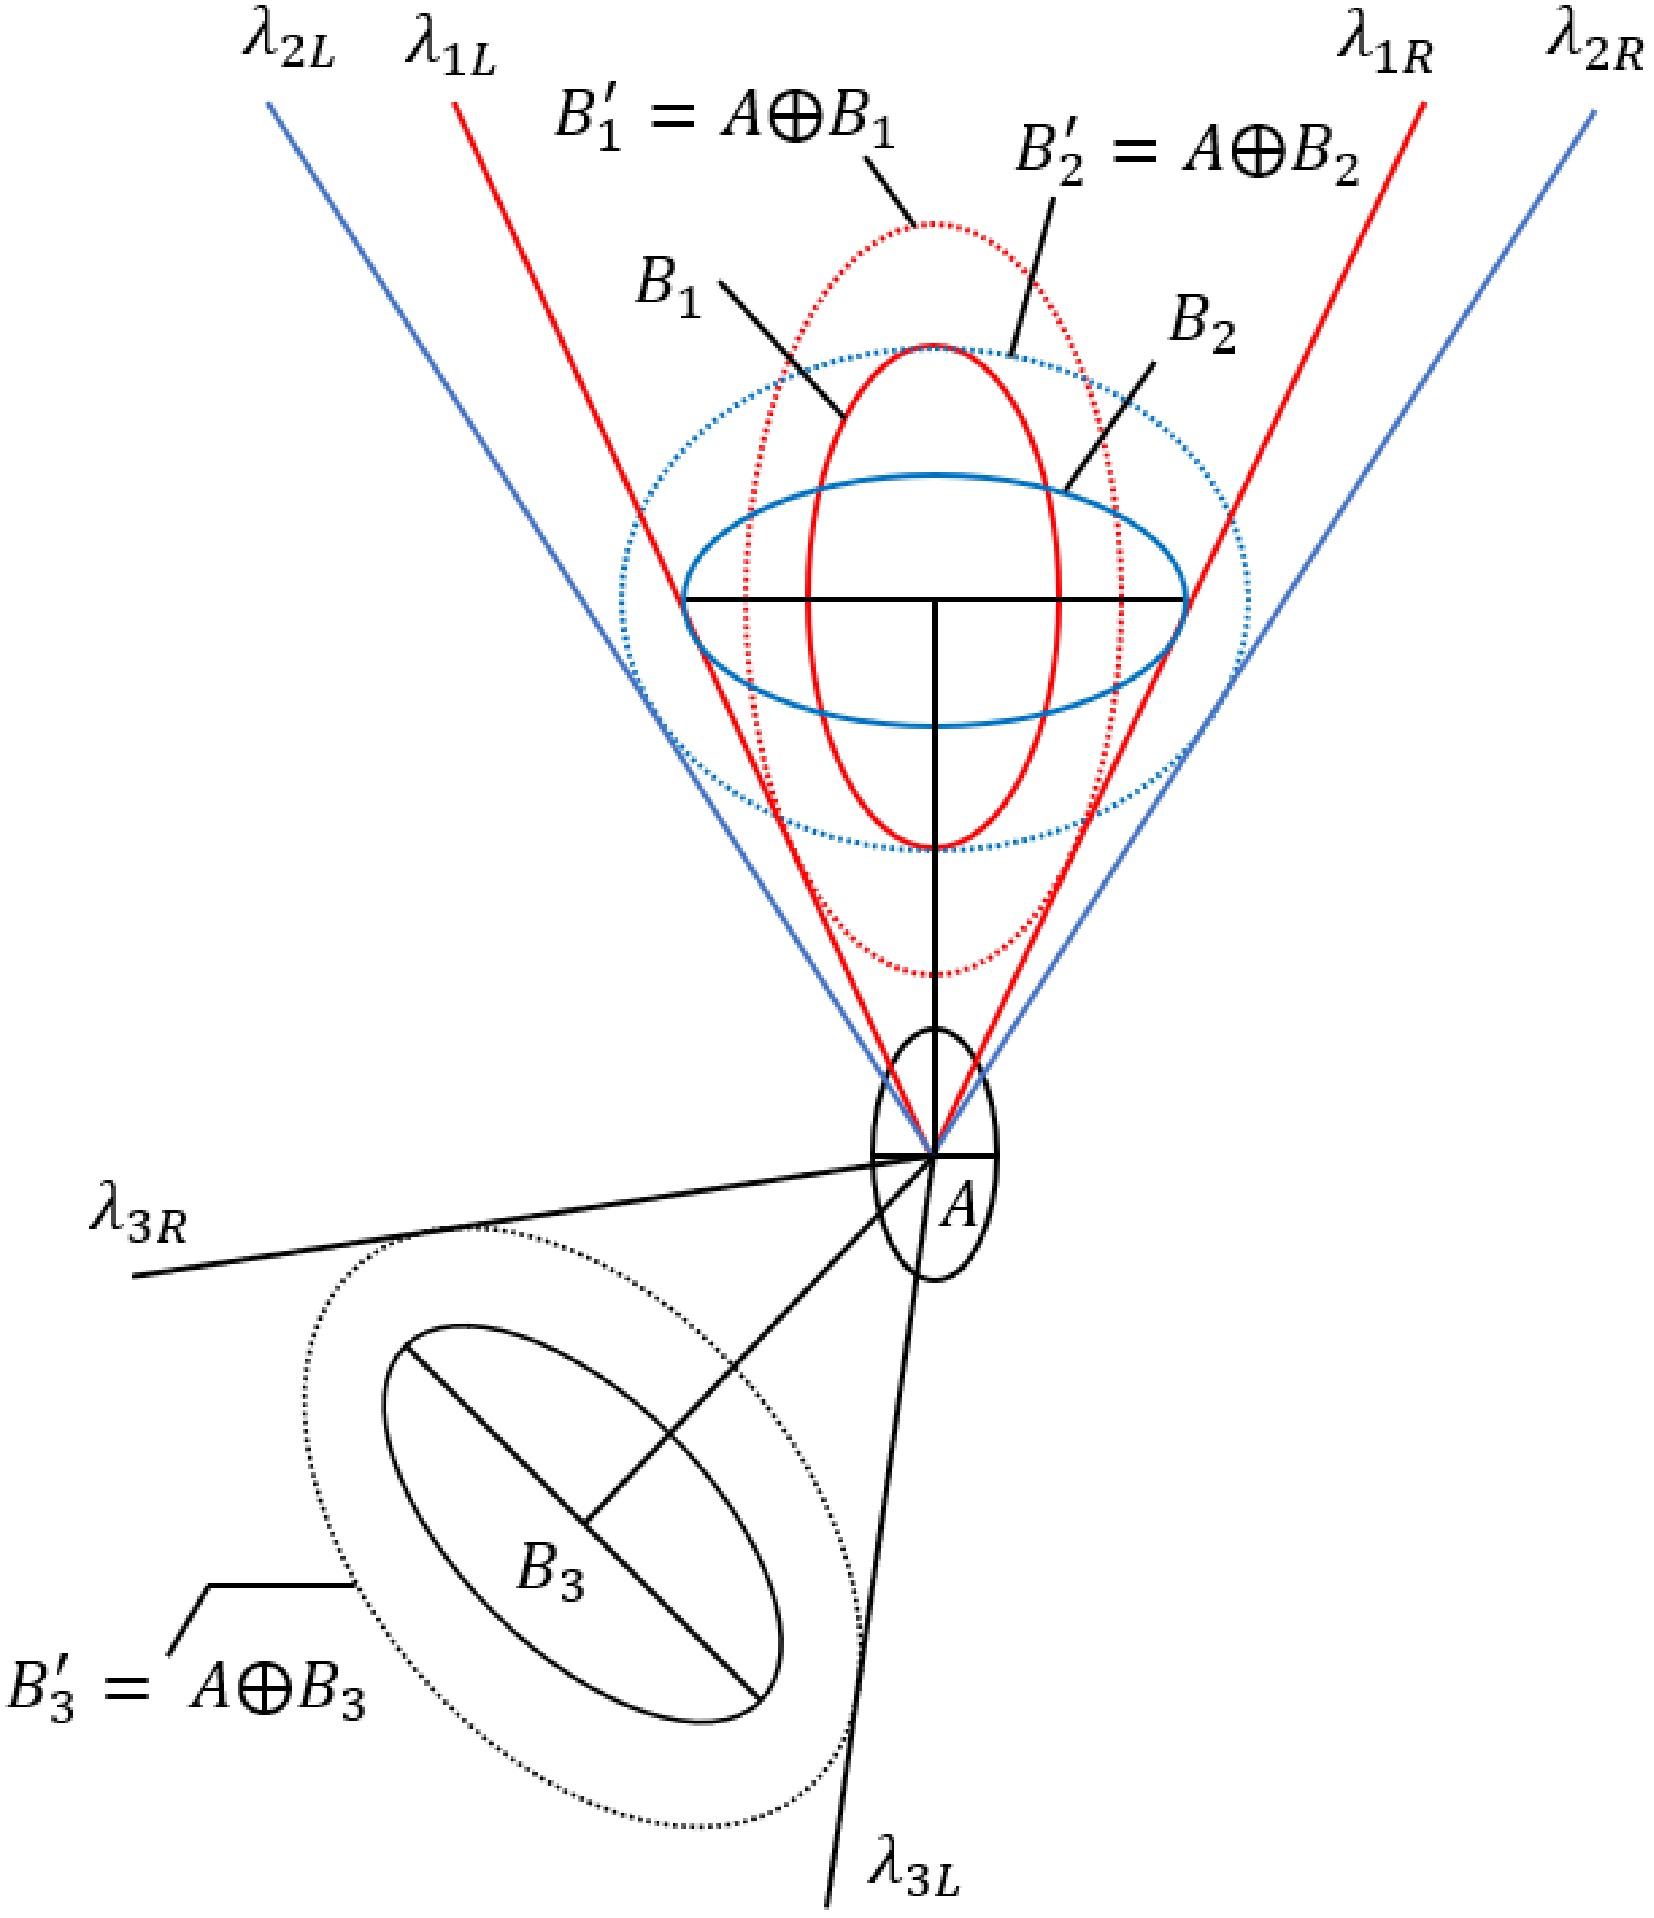
Figure 5.
Schematic diagram of the influence of the ellipse's major axis direction on the mapping result.
$ {a}_{{B}'_{1}}={a}_{{B}_{1}}+{a}_{A},{b}_{{B}'_{1}}={b}_{{B}_{1}}+{b}_{A} $ (4) ${a}_{{B}'_{2}}={a}_{{B}_{2}}+{b}_{A},{b}_{{B}'_{2}}={b}_{{B}_{2}}+{a}_{A}$ (5) Furthermore, for an ellipse B3 with an arbitrary angle with respect to the major axis of ellipse A, the range of the major and minor semi-axes of the corresponding mapped region
$ {B}'_{3} $ $ \begin{array}{c}\left\{\begin{array}{l} {a}_{{B}_{3}}+{b}_{A}\le {a}_{{B}'_{3}}\le {a}_{{B}_{3}}+{a}_{A}\\ {b}_{{B}_{3}}+{b}_{A}\le {b}_{{B}'_{3}}\le {b}_{{B}_{3}}+{a}_{A}\end{array}\right.\end{array} $ (6) Taking into account that the lengths of the axes of the ellipse vary with different orientations, it is relatively difficult to accurately calculate the lengths of the mapped regions in various directions and determine the mapping ranges. Therefore, considering safety as a priority, the upper limit of the value range is used as the approximate lengths of the major and minor semi-axes of the mapped regions in each scenario, that is:
$ \left\{\begin{array}{l} {a}_{{B}'}={a}_{B}+{a}_{A}\\ {b}_{{B}'}={b}_{B}+{a}_{A}\end{array}\right.$ (7) Therefore, the error range for the approximation calculation of the major and minor semi-axes is:
$ \begin{array}{c}\left\{\begin{array}{l} {\varepsilon }_{1} \lt \dfrac{{a}_{A}-{b}_{A}}{{a}_{B}+{b}_{A}}\times 100{\text{%}}\\ {\varepsilon }_{2} \lt \dfrac{{a}_{A}-{b}_{A}}{{b}_{B}+{b}_{A}}\times 100{\text{%}}\end{array}\right.\end{array} $ (8) As there is a significant difference in size between ellipses
$ A $ $ B $ $ a_A=4\ m,\; \ \ \ \ b_A=1.5\ m $ (9) $ a_B=18.5+100=118.5\ m,\; \ \ \ \ \ \ b_B=17+50=67\ m $ (10) Therefore, the approximate calculation error ranges
$ {\varepsilon }_{1} $ $ {\varepsilon }_{2} $ $ {\varepsilon }_{1} \lt \dfrac{{a}_{A}-{b}_{A}}{{a}_{B}+{b}_{A}}\times 100{\text{%}}=\dfrac{4-1.5}{118.5+1.5}\times 100{\text{%}}=2.1{\text{%}} $ (11) $ {\varepsilon }_{2} \lt \dfrac{{a}_{A}-{b}_{A}}{{b}_{B}+{b}_{A}}\times 100{\text{%}}=\dfrac{4-1.5}{67+1.5}\times 100{\text{%}}=3.6{\text{%}} $ (12) When considering larger aircraft, the values of aB and bB will increase, resulting in further reduction of relative error. Therefore, considering that the overall error will not exceed 5%, it is acceptable to increase the error slightly in order to significantly reduce computational complexity.
Calculation of collision cone boundaries
-
In the process of solving for the collision cone boundaries, the main focus is on analyzing the relative spatiotemporal relationship between the vehicle and the aircraft. Therefore, referring to the aircraft as the reference frame helps to simplify the calculations. Considering that the original position data of the vehicle and the aircraft are measured with the airport surface as the reference, a coordinate transformation is performed initially for the convenience of subsequent calculations. Taking the center point of the aircraft as the origin and the heading of the aircraft as the positive direction of the y-axis, a new coordinate system is established by rotating clockwise relative to the initial coordinate system by an angle of
$ \theta $ 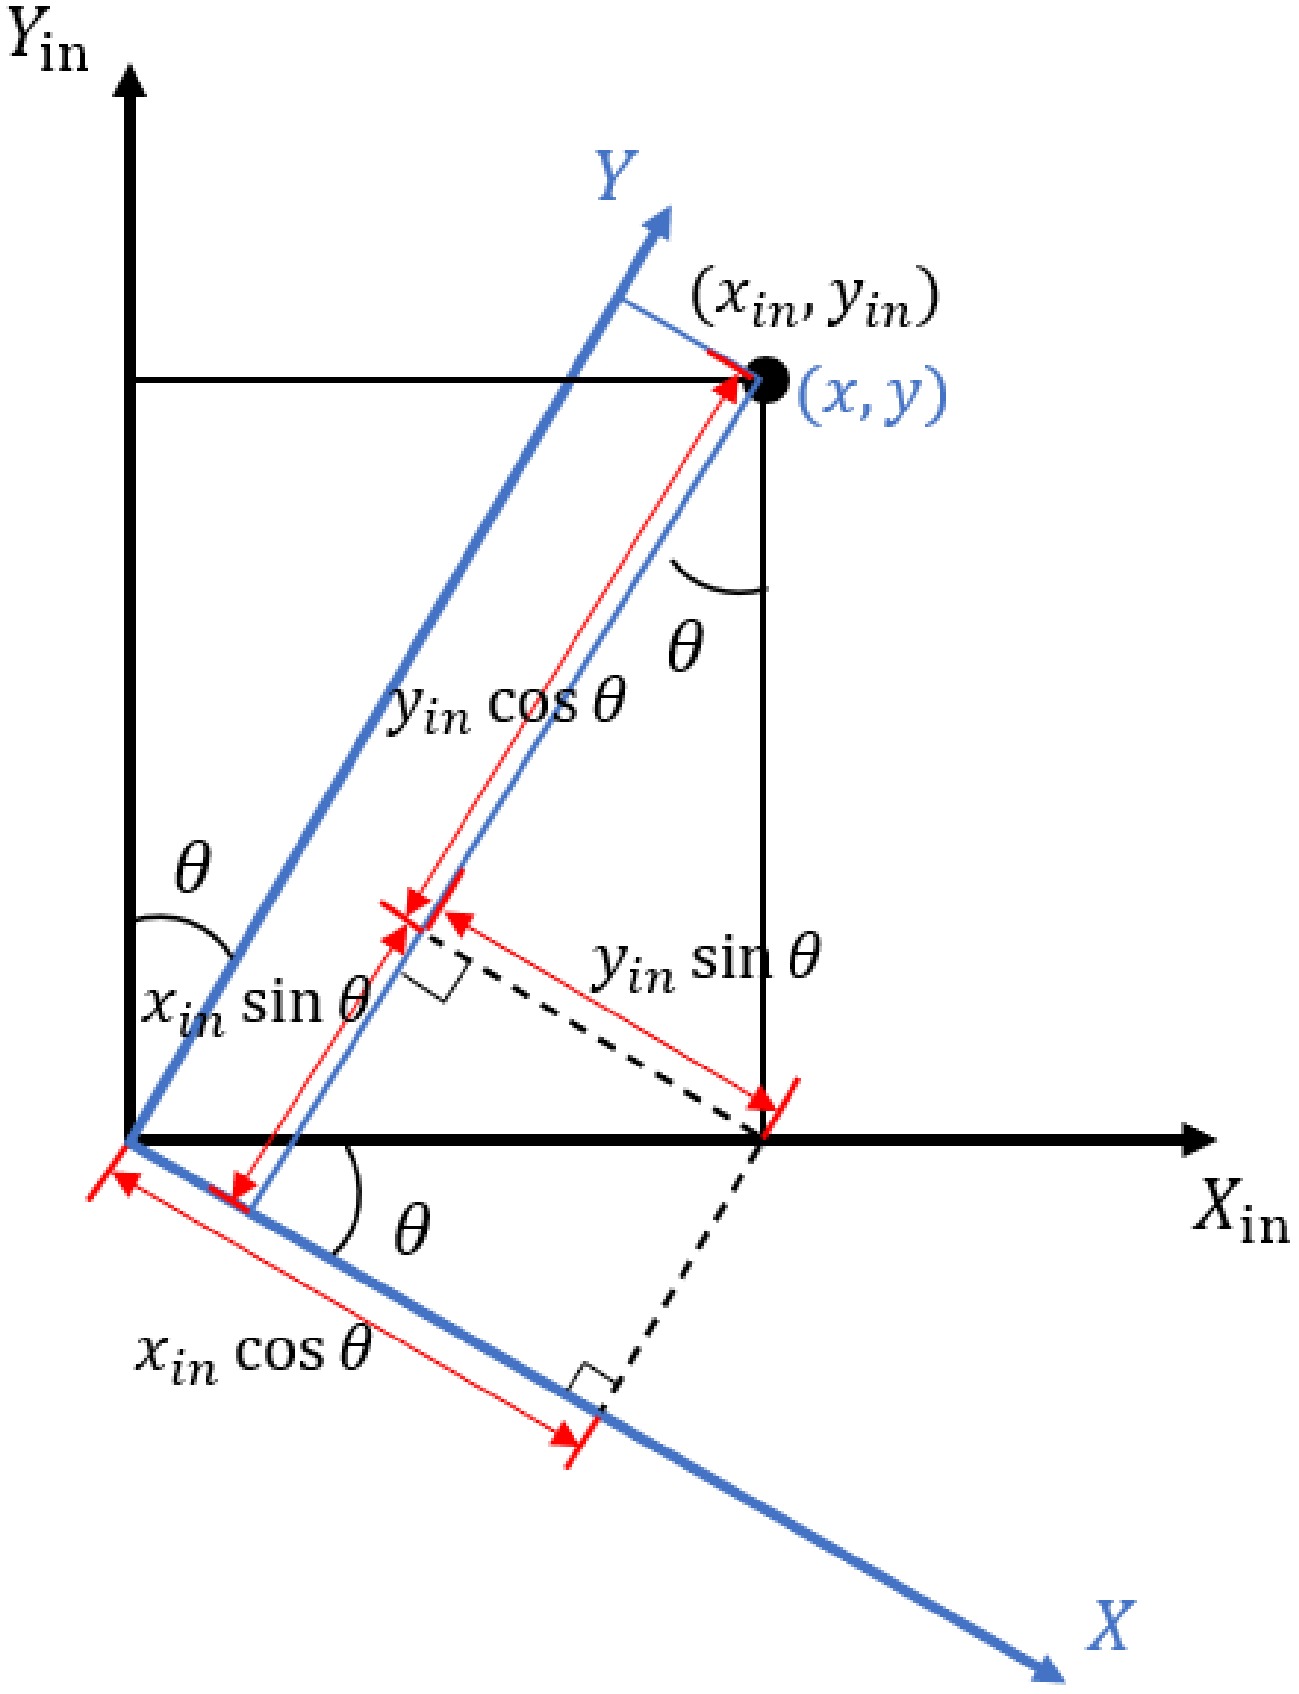
Figure 6.
Illustration of coordinate system transformation.
$ \begin{array}{c}\left[\begin{array}{c}x\\ y\end{array}\right]=\left[\begin{array}{cc}\mathrm{cos}\theta & -\mathrm{sin}\theta \\ \mathrm{sin}\theta & \mathrm{cos}\theta \end{array}\right]\times \left[\begin{array}{c}{x}_{in}\\ {y}_{in}\end{array}\right]\end{array} $ (13) Through the coordinate transformation, the coordinates of the aircraft in the new coordinate system are (0,0), and the coordinates of point A(xA, yA)represent the position of the aircraft relative to the aircraft. The velocity vector of the aircraft is (vBx, vBy), and the velocity vector of the vehicle is (vAx, vAy). To solve the collision cone boundary range, in the new coordinate system, the standard equation of the mapped ellipse B' with long and short semi-axes aB' and bB' in a general scenario can be expressed as:
$ \dfrac{{x}^{2}}{{\left({b}_{{B}'}\right)}^{2}}+\dfrac{{y}^{2}}{{\left({a}_{{B}'}\right)}^{2}}=1 $ (14) The equation of the tangent line passing through a point (bB'cosγ, aB'sinγ) on the ellipsoid is:
$ \dfrac{\mathrm{cos}\gamma }{{b}_{{B}'}}x+\dfrac{\mathrm{sin}\gamma }{{a}_{{B}'}}y=1 $ (15) The equation of the tangent line at point A to ellipse B' is obtained by substituting the vehicle coordinates (xA, yA), with γ representing the unknown variable that defines the tangent point:
$ \dfrac{\mathrm{cos}\gamma }{{b}_{{B}'}}{x}_{A}+\dfrac{\mathrm{sin}\gamma }{{a}_{{B}'}}{y}_{A}=1 $ (16) Assuming γ = 2α and substituting into trigonometric formulas, we can transform the equation of the tangent line into a standard quadratic equation form with tanα as the unknown variable:
${a}_{{B}'}\left({x}_{A}+{b}_{{B}'}\right){\left(\mathrm{tan}\alpha \right)}^{2}-2{y}_{A}{b}_{{B}'}\mathrm{tan}\alpha +{a}_{{B}'}\left({b}_{{B}'}-{x}_{A}\right)=0 $ (17) Solving the equation, we get:
$ \mathrm{tan}{\alpha }_{1}=\dfrac{{y}_{A}{b}_{{B}'}+\sqrt{{\left({x}_{A}{a}_{{B}'}\right)}^{2}+{\left({{y}_{A}b}_{{B}'}\right)}^{2}-{\left({{a}_{{B}'}b}_{{B}'}\right)}^{2}}}{{a}_{{B}'}\left({x}_{A}+{b}_{{B}'}\right)} $ (18) $ \mathrm{tan}{\alpha }_{2}=\dfrac{{y}_{A}{b}_{{B}'}-\sqrt{{\left({x}_{A}{a}_{{B}'}\right)}^{2}+{\left({{y}_{A}b}_{{B}'}\right)}^{2}-{\left({{a}_{{B}'}b}_{{B}'}\right)}^{2}}}{{a}_{{B}'}\left({x}_{A}+{b}_{{B}'}\right)} $ (19) Furthermore, by taking the derivative of the ellipse equation and substituting the coordinates of the tangent points, the slopes of the two tangent lines, represented by tanα, can be obtained:
$ {k}_{1}=-\dfrac{{a}_{{B}'}\left[1-{\left({\mathrm{tan}\alpha }_{1}\right)}^{2}\right]}{2{b}_{{B}'}{\mathrm{tan}\alpha }_{1}},{k}_{2}=-\dfrac{{a}_{{B}'}\left[1-{\left({\mathrm{tan}\alpha }_{2}\right)}^{2}\right]}{2{b}_{{B}'}{\mathrm{tan}\alpha }_{2}} $ (20) The specific process of slope derivation is shown in Supplementary Data 1.
To determine the angle range represented by the collision cone in the coordinate system, it is necessary to calculate the angle ω of the tangent vector pointing from point A towards the direction of ellipse B', which is defined as the counterclockwise angle between the vector in the positive x-axis direction at point A and the tangent vector. The angle ω has a value range of (0°, 360°), as shown in Fig. 7.
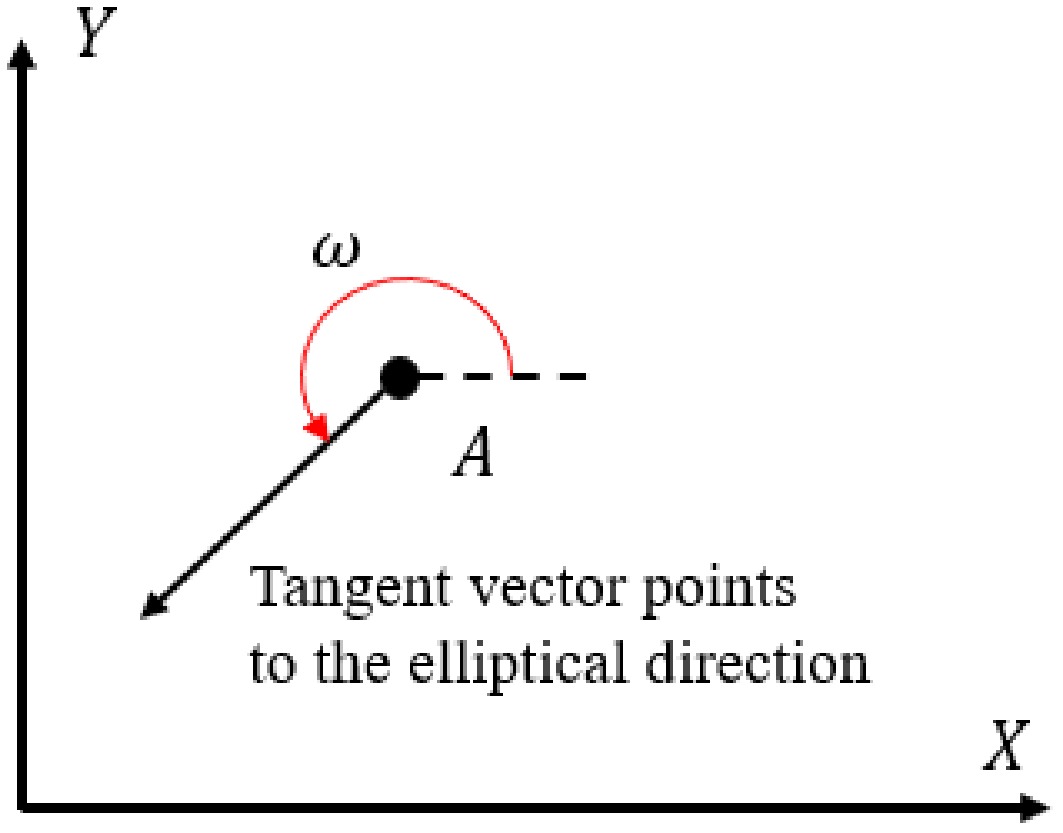
Figure 7.
Illustration of the meaning of tangent angle.
Due to the fact that a line includes two opposite directions, the tangent angle ω of a tangent line with a tangent point (xtan, ytan) and a slope k is calculated as: ω = arctank. This calculation results in two possible values, so it is necessary to consider the relative position of the tangent point and point A to determine the angle. When the range of arctank is (0°, 180°), we define:
$ \omega =\left\{\begin{array}{ll} \mathrm{arctan}\,k &if\;\;{y}_{tan}-{y}_{A}\ge 0\\ \mathrm{arctan}\,k+180^{\circ}& if\;\;{y}_{tan}-{y}_{A} \lt 0\end{array}\right. $ (21) The corresponding values of ω1 and ω2 can be calculated based on k1 and k2. Furthermore, to differentiate between the boundaries of collision cones, the angle φ1 on the right side is defined as the smaller angle, while the angle φ2 on the left side is defined as the larger angle. To eliminate the effect of trigonometric function periodicity on angle value, let:
$ {\sigma }_{1}=\mathrm{min}\left({\omega }_{1},{\omega }_{2}\right),\;{\sigma }_{2}=\mathrm{max}\left({\omega }_{1},{\omega }_{2}\right) $ (22) The angle values for the boundaries on both sides of the collision cone can be obtained as follows:
$\left\{\begin{array}{ll} {{\varphi }_{1}={\sigma }_{2}-360^{\circ},\;\varphi }_{2}={\sigma }_{1}&if\;\;{\sigma }_{2}-{\sigma }_{1} \gt 180^{\circ}\\ {{\varphi }_{1}={\sigma }_{1},\;\varphi }_{2}={\sigma }_{2}&if\;\;{\sigma }_{2}-{\sigma }_{1}\le 180^{\circ}\end{array}\right. $ (23) Similarly, when the range of
$ \mathrm{arctan}\dfrac{\Delta y}{\Delta x} $ $ \overrightarrow{{v}_{AB}} $ $ {\delta }_{AB}=\left\{\begin{array}{ll} \mathrm{arctan}\dfrac{{v}_{Ay}-{v}_{By}}{{v}_{Ax}-{v}_{Bx}}&if\;\;{v}_{Ay}-{v}_{By}\ge 0\\ \mathrm{arctan}\dfrac{{v}_{Ay}-{v}_{By}}{{v}_{Ax}-{v}_{Bx}}+180^{\circ}&if\;\;{v}_{Ay}-{v}_{By} \lt 0\end{array}\right. $ (24) Additionally, there is:
${\delta }_{AB}={\delta }_{AB}-360^{\circ}\;\;if\;\;{\sigma }_{2}-{\sigma }_{1} \gt 180^{\circ}\;\;and\;\;{\delta }_{AB} \gt 180^{\circ}$ (25) Therefore, the improved velocity obstacle model is shown in Fig. 8, and its collision cone is defined as:
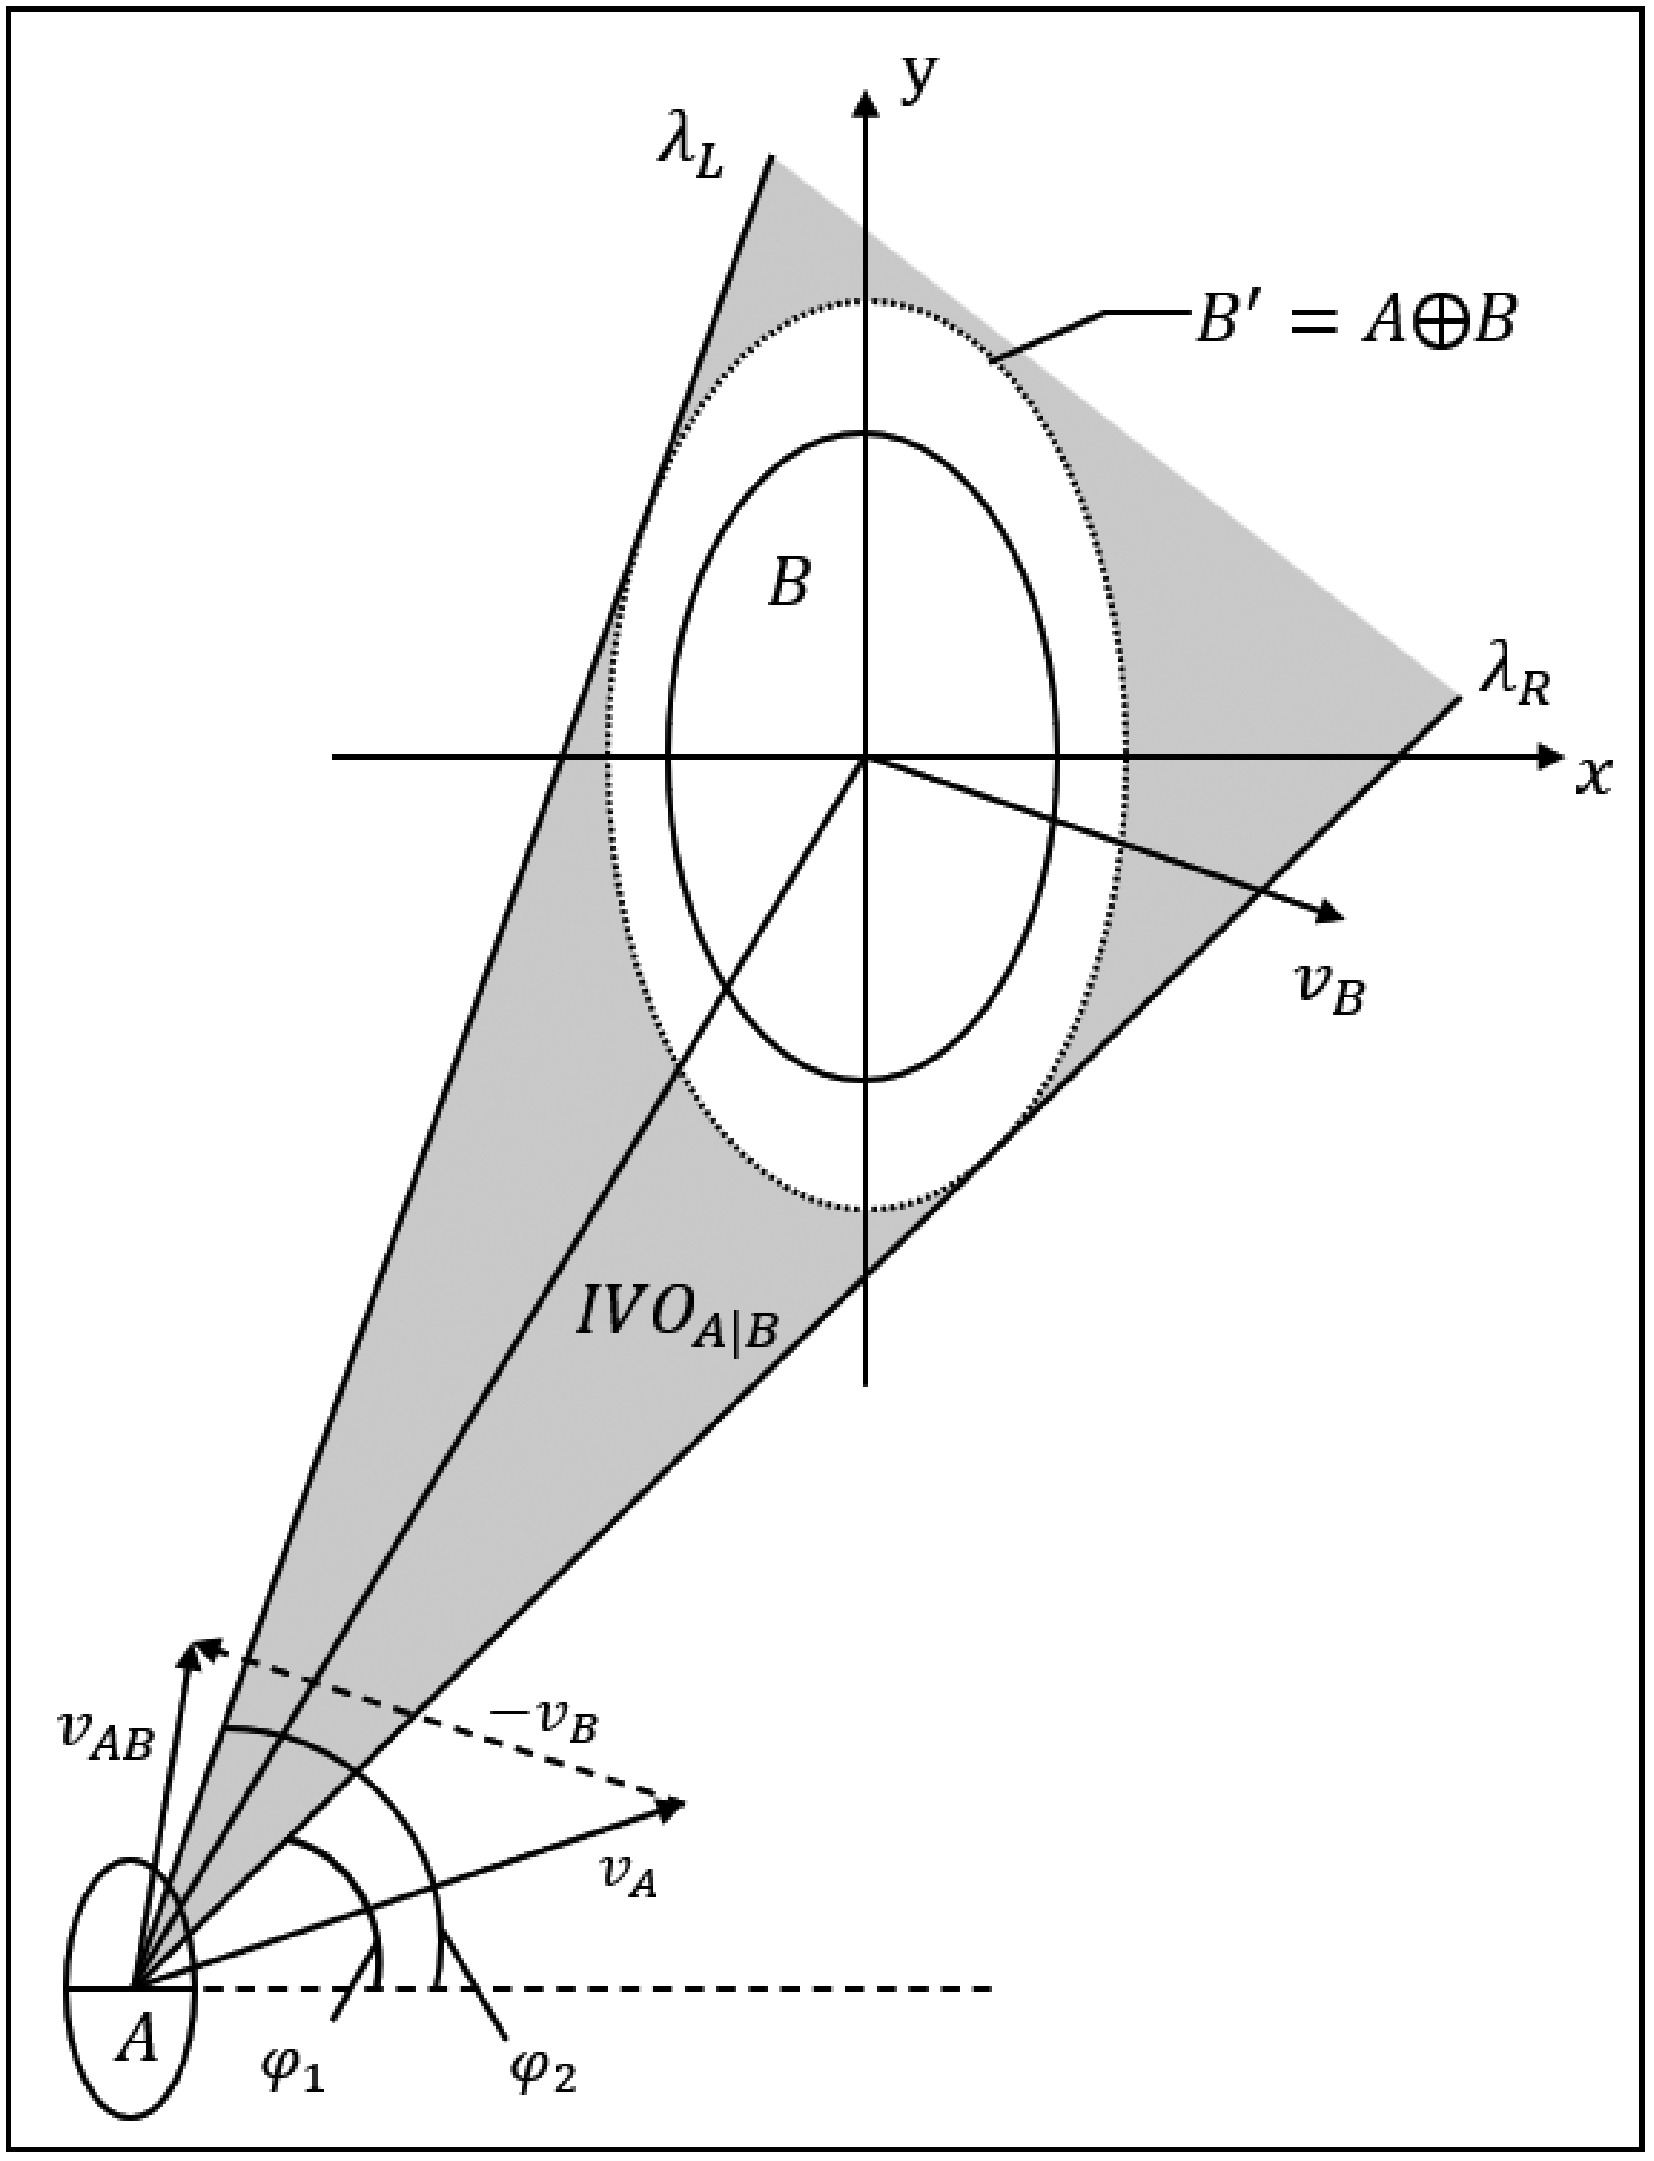
Figure 8.
Schematic diagram of the boundary of the improved velocity obstacle model's collision cone.
${IVO}_{A|B}=\left\{\overrightarrow{{v}_{AB}}|{\varphi }_{1}\le {\delta }_{AB}\le {\varphi }_{2}\right\} $ (26) Velocity update strategy
-
Collision-free operation is a dynamic motion process in which the moving entity needs to adjust its motion state based on continuously changing spatiotemporal relationships to complete the avoidance process. In order to achieve this process, this paper combines the dynamic window approach (DWA) with the improved velocity obstacle method to support the velocity update process of the vehicle in vehicle-aircraft conflict scenarios. DWA is a widely used local path planning method. Its core idea is to optimize the velocity selection of a moving entity at a given time by considering multiple objectives, including the kinematic constraints of the moving entity, obstacles in the environment, and the task destination. In a specific implementation, DWA first constructs a finite velocity space, whose boundaries are determined by the maximum velocity, acceleration, and other factors of the moving entity. The algorithm then trims the velocity space by eliminating velocities that may cause collisions, and finally uses the objective function to evaluate the remaining feasible velocities to select the optimal velocity, balancing efficiency, safety, and other goals.
In this paper, DWA is a necessary method for implementing the conflict resolution process based on the improved velocity obstacle method. Although the IVO method can analyze the relative position and velocity relationship between the vehicle and the aircraft, and exclude the velocity space that may lead to collisions, it cannot directly provide a definitive safe operational strategy. Therefore, DWA is introduced into the trimmed feasible velocity set. By optimizing the objective function, a specific conflict resolution operation plan is derived, improving operational efficiency while ensuring safety.
The process of combining DWA with IVO, as shown in Fig. 9, can be divided into three stages. First, the complete velocity space is constructed based on the vehicle's kinematic constraints, covering all possible velocity choices at the current moment. Second, based on the collision cone region identified by IVO, the velocity vectors in the velocity space that could lead to collisions between the vehicle and the aircraft are removed, forming a pruned safe velocity space. Finally, through the DWA method, multi-objective functions are constructed, and the remaining velocity vectors in the feasible velocity set are evaluated to search for the optimal velocity that meets the requirements, which will be used as the vehicle's velocity at the next moment.
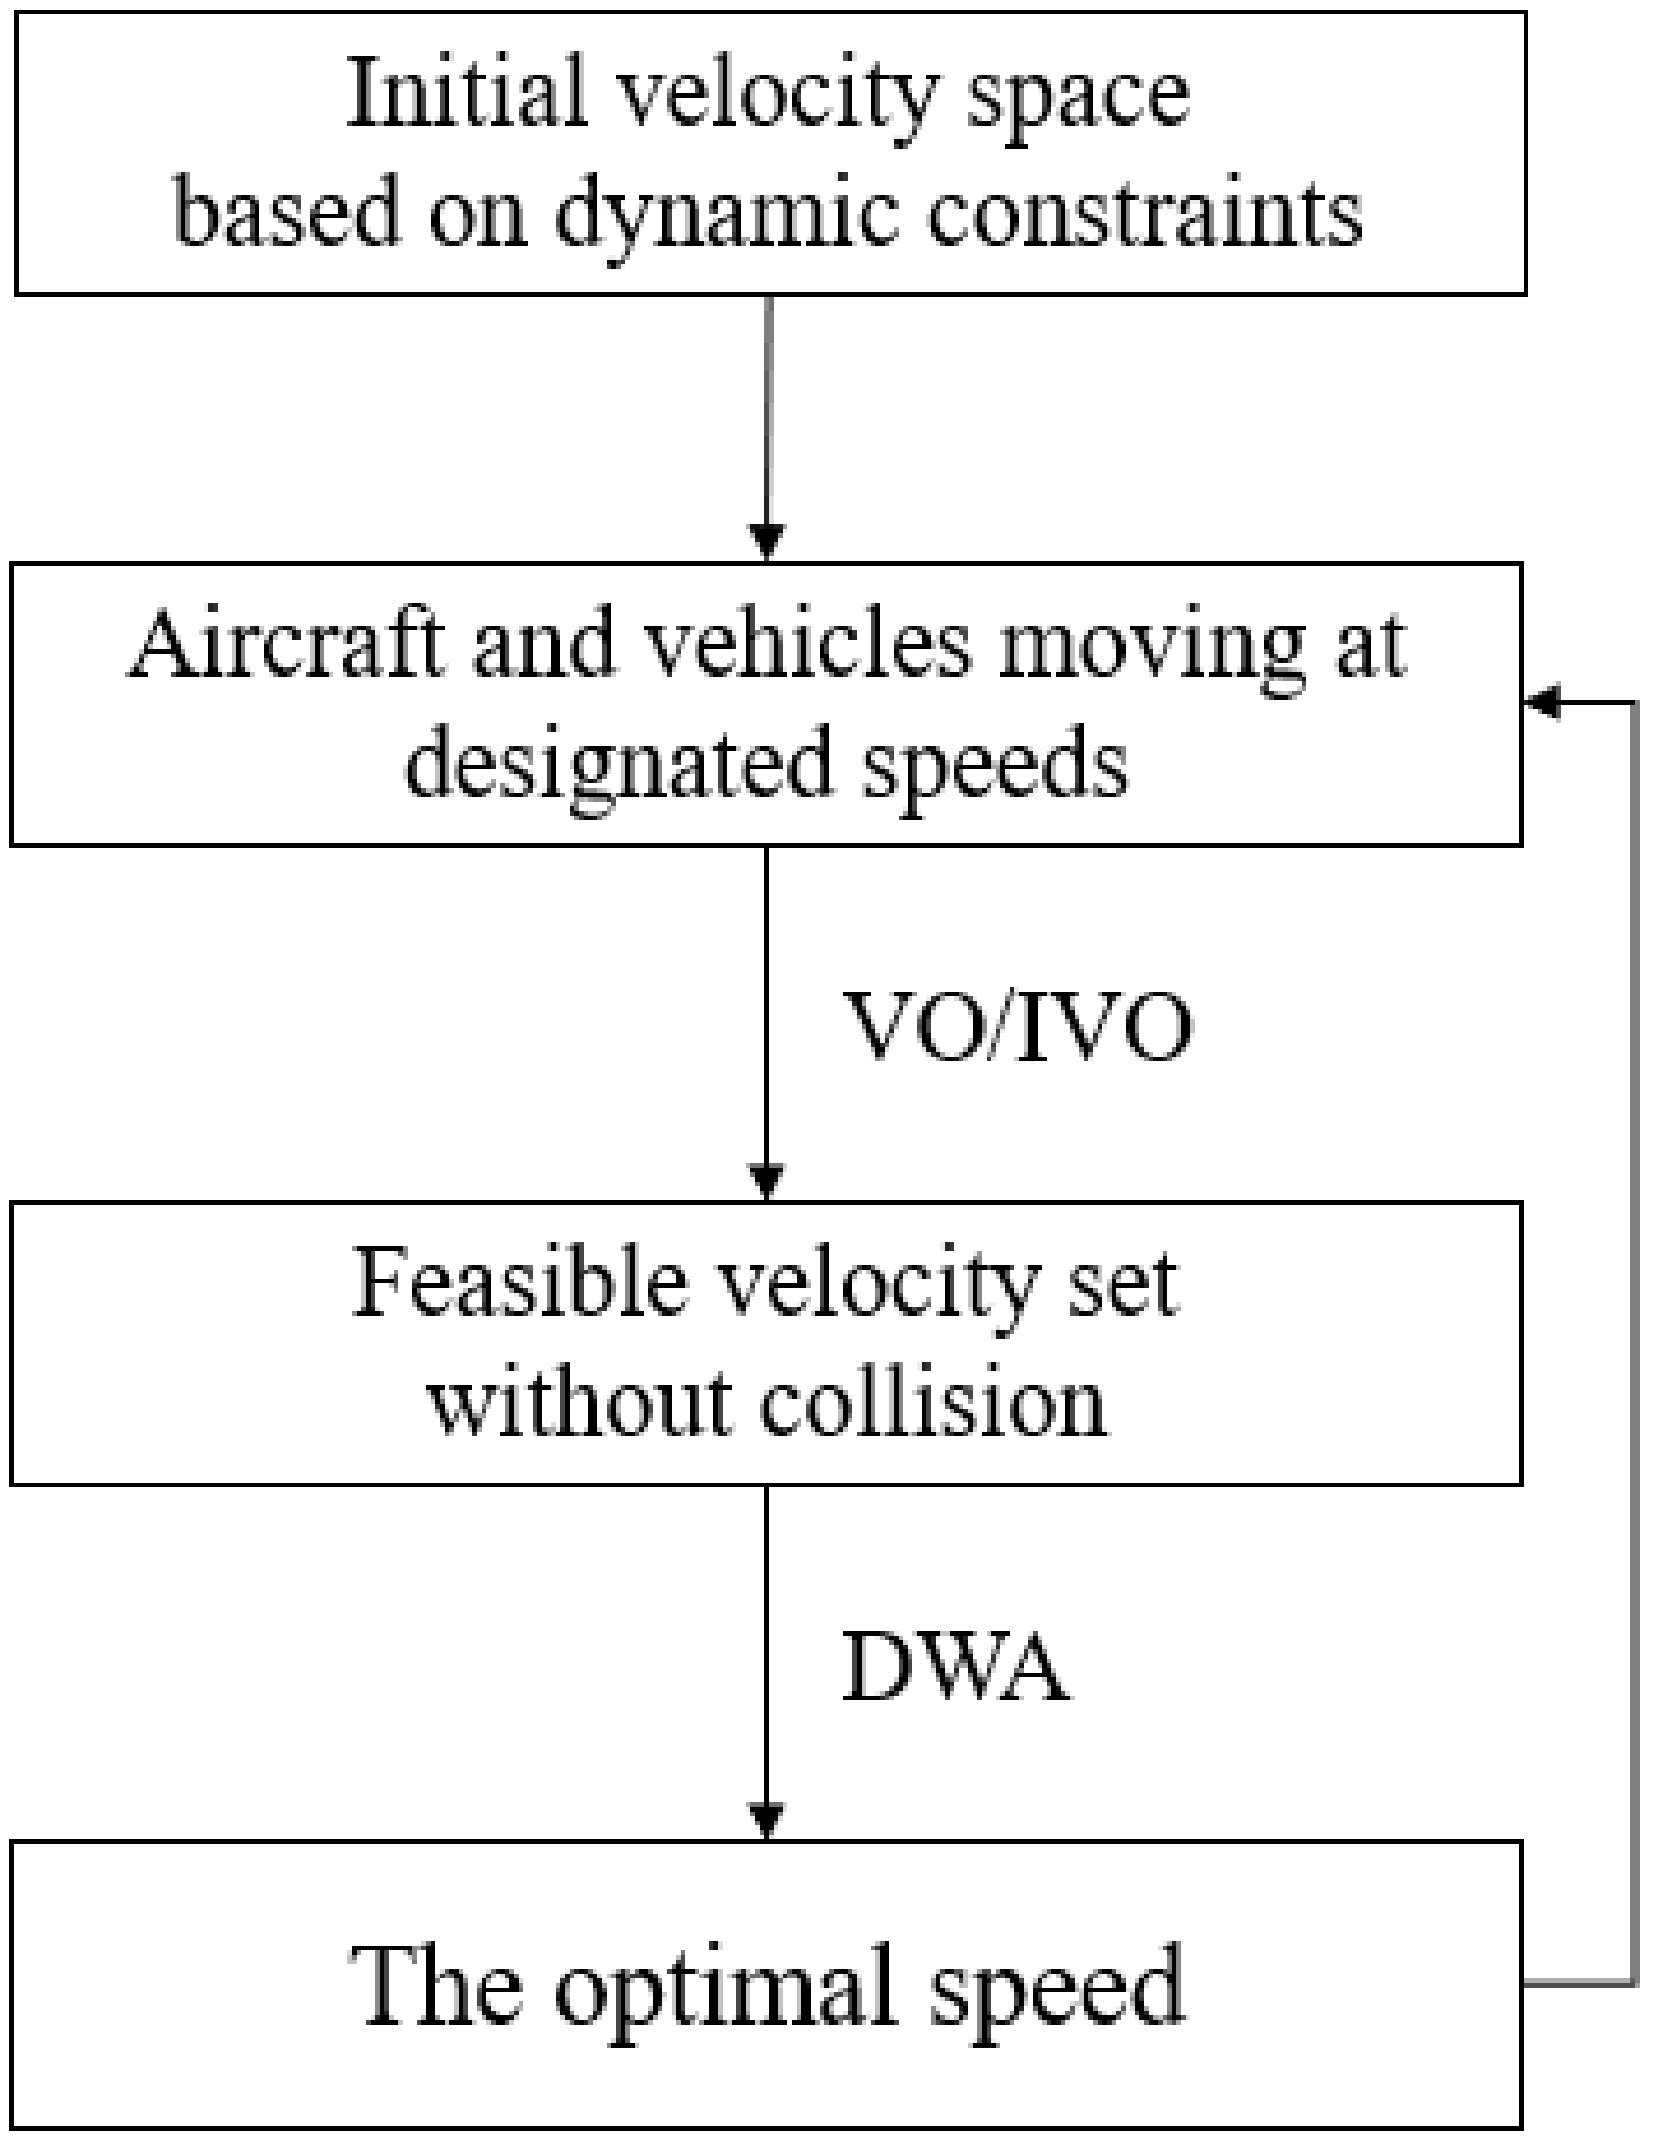
Figure 9.
Velocity update process diagram.
In traditional DWA, the objective function mainly considers three aspects: heading fh, clearance fc, and velocity fv[41]. More specifically, considering the requirements of this paper's scenario, the explanations of these three indicators are as follows:
The heading factor fh ensures that the moving entity reduces its deviation from the destination during the movement, which is equivalent to shortening the travel distance. fh is related to the deviation angle
$ \Delta \vartheta $ $ \Delta \vartheta $ 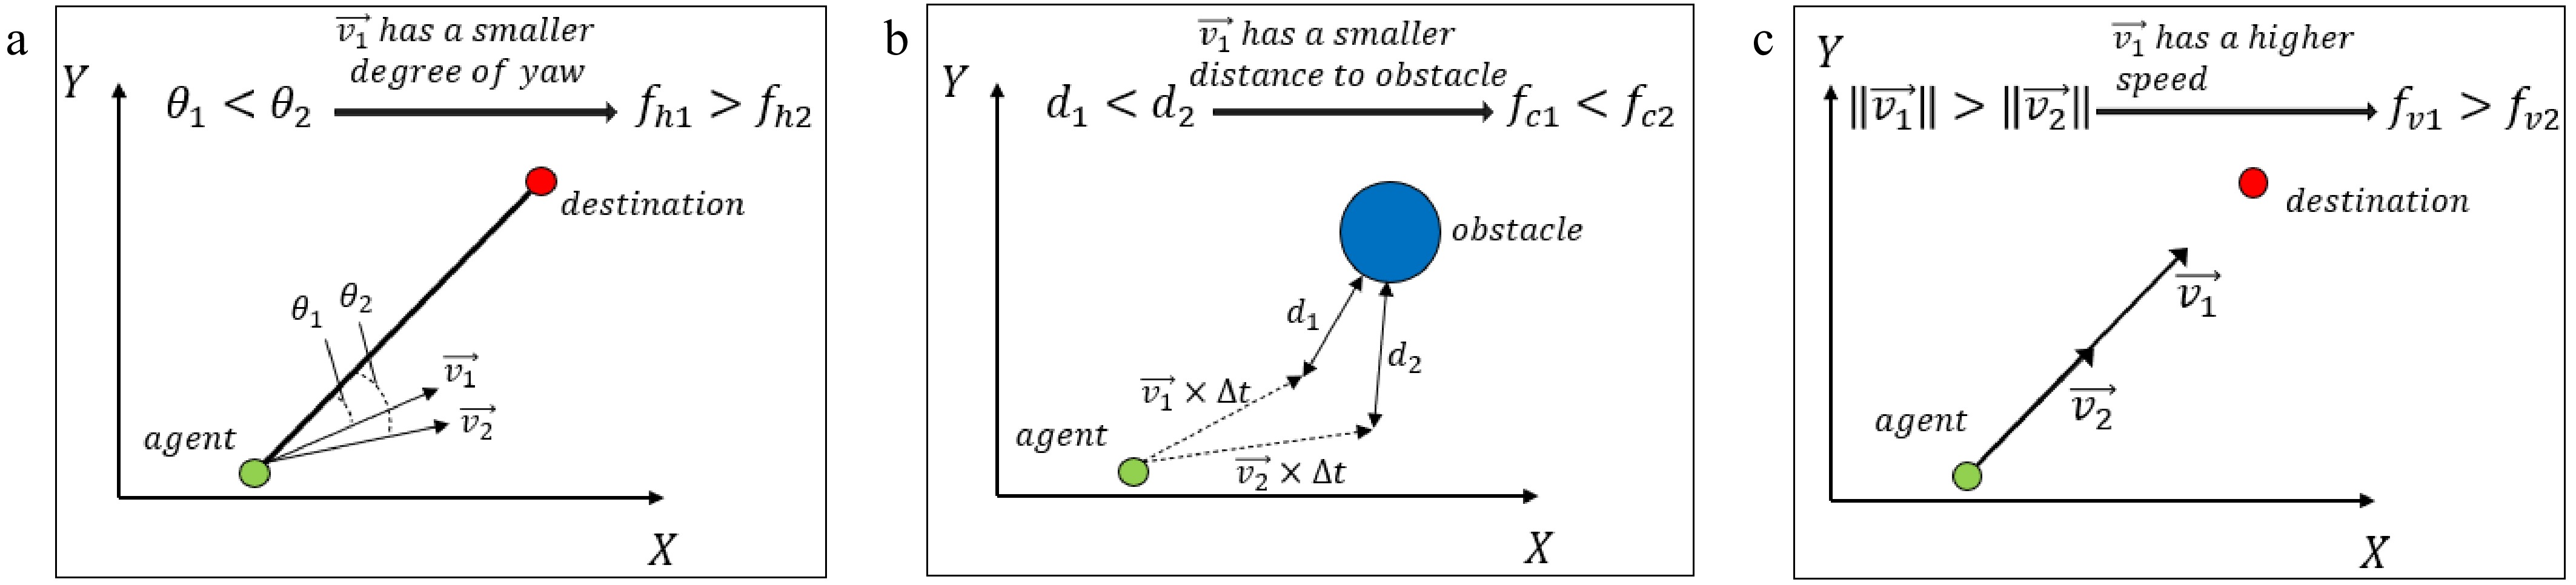
Figure 10.
Explanation of parameters in the dynamic window approach.
$ {f}_{h}=180^{\circ}-\Delta \vartheta $ (27) In this case, considering that the maximum deviation in the direction of motion is 180°, representing the opposite direction, 180° is used as the reference. In the ideal situation, when the direction of the moving entity is perfectly aligned with the target, the deviation angle
$ \Delta \vartheta $ The clearance factor considers the safety of the movement and aims to maintain a certain distance between the moving entity and obstacles. Its meaning is shown in Fig. 10b. When the moving entity moves from its current position p1(x1, y1) with a specific velocity
$ \overrightarrow{v} $ $ \Delta t $ $ {f}_{c}=d=\sqrt{{\left[{x}_{2}-\left({x}_{1}+{v}_{x}\times \Delta t\right)\right]}^{2}+{\left[{y}_{2}-\left({y}_{1}+{v}_{y}\times \Delta t\right)\right]}^{2}} $ (28) The velocity factor considers the magnitude of the driving speed and distinguishes the differences of velocities with the same direction in the velocity space, providing a basis for velocity selection and support for fast movement. A larger velocity implies less time required to travel the same distance. Its meaning is shown in Fig. 10c, where a larger velocity results in a larger value of fv. fv is represented by the magnitude of the velocity vector
$ \overrightarrow{v} $ $ {f}_{v}=\|\overrightarrow{v}\|$ (29) In practical calculations, due to the different numerical scales of angles, distances, and velocities, it is necessary to normalize them first:
$ {{x}_{i}}^{norm}=\frac{{x}_{i}}{\sum {x}_{i}} $ (30) Its meaning is that for a sample
$ \overrightarrow{{v}_{i}} $ $ {{x}_{i}}^{norm} $ $ \sum $ Furthermore, corresponding weight coefficients kh, kc, kv are set for the three considered factors, and the weight coefficients can be adjusted relative to each other according to the emphasis on the objective. The objective function of DWA can be expressed as follows:
$C\left(v\right)={k}_{h}{f}_{h}+{k}_{c}{f}_{c}+{k}_{v}{f}_{v} $ (31) -
Conflicts between vehicles and aircraft in airport ground operations are complex and diverse. To comprehensively validate the applicability and effectiveness of the improved velocity obstacle method (IVO), this paper designs five typical scenarios, including scenarios from vehicle conflicts with a single aircraft to multiple aircraft. By gradually increasing the complexity of the scenarios, this approach highlights the characteristics of different types of conflicts while also validating the method's applicability and robustness.
In current research on airport surface safety operations, taxiing conflicts between aircraft are typically categorized into rear-end conflicts, head-to-head conflicts, and cross conflicts[5,42,43]. These classifications are primarily based on differences in the relative positions and motion directions of operating entities, which lead to varying levels of collision risk and distinct conflict resolution strategies. Although aircraft and ground vehicles are heterogeneous operating entities, they share certain similarities in terms of conflict characteristics: on one hand, their conflict mechanisms exhibit certain geometric similarities, as the urgency of a conflict and the corresponding resolution strategy vary depending on the vehicle's relative position and moving direction with corresponding aircraft. On the other hand, in shared areas such as aprons, both typically operate at low speeds. Therefore, to validate the effectiveness of the proposed method through simulation, we draw on the traditional classification framework of conflicts between aircraft and design three types of vehicle–aircraft conflict scenarios involving a single aircraft: stationary aircraft with a vehicle bypassing, head-to-head conflict, and cross conflict. The vehicle bypassing a stationary aircraft simulates situations where vehicles need to bypass aircraft parked at the gate or waiting on taxiways. Head-on and cross conflicts reflect scenarios where vehicles, due to incorrect instructions or improper observation, enter the aircraft's taxiing path from different relative positions, creating conflict points. Additionally, follow-on conflicts are not considered, as due to the priority of aircraft operations, vehicles tend to slow down and follow behind rather than overtake the aircraft, making IVO conflict resolution inapplicable in these cases.
Considering that conflicts between a single aircraft and a vehicle are the most basic interaction scenarios in airport surface operations, but actual environments can be more complex, this paper also designs conflict scenarios involving multiple aircraft. Since airports often have multiple aircraft parked on the ground, scenarios involving bypassing multiple stationary aircraft validate the vehicle's conflict resolution capability in dense spaces, while combining head-on and cross conflicts tests the ability of IVO to resolve different types of conflicts simultaneously between multiple entities, reflecting the situation where vehicles simultaneously avoid aircraft on the taxiway at different positions and with different taxiing directions. These scenarios are shown in Fig. 11.
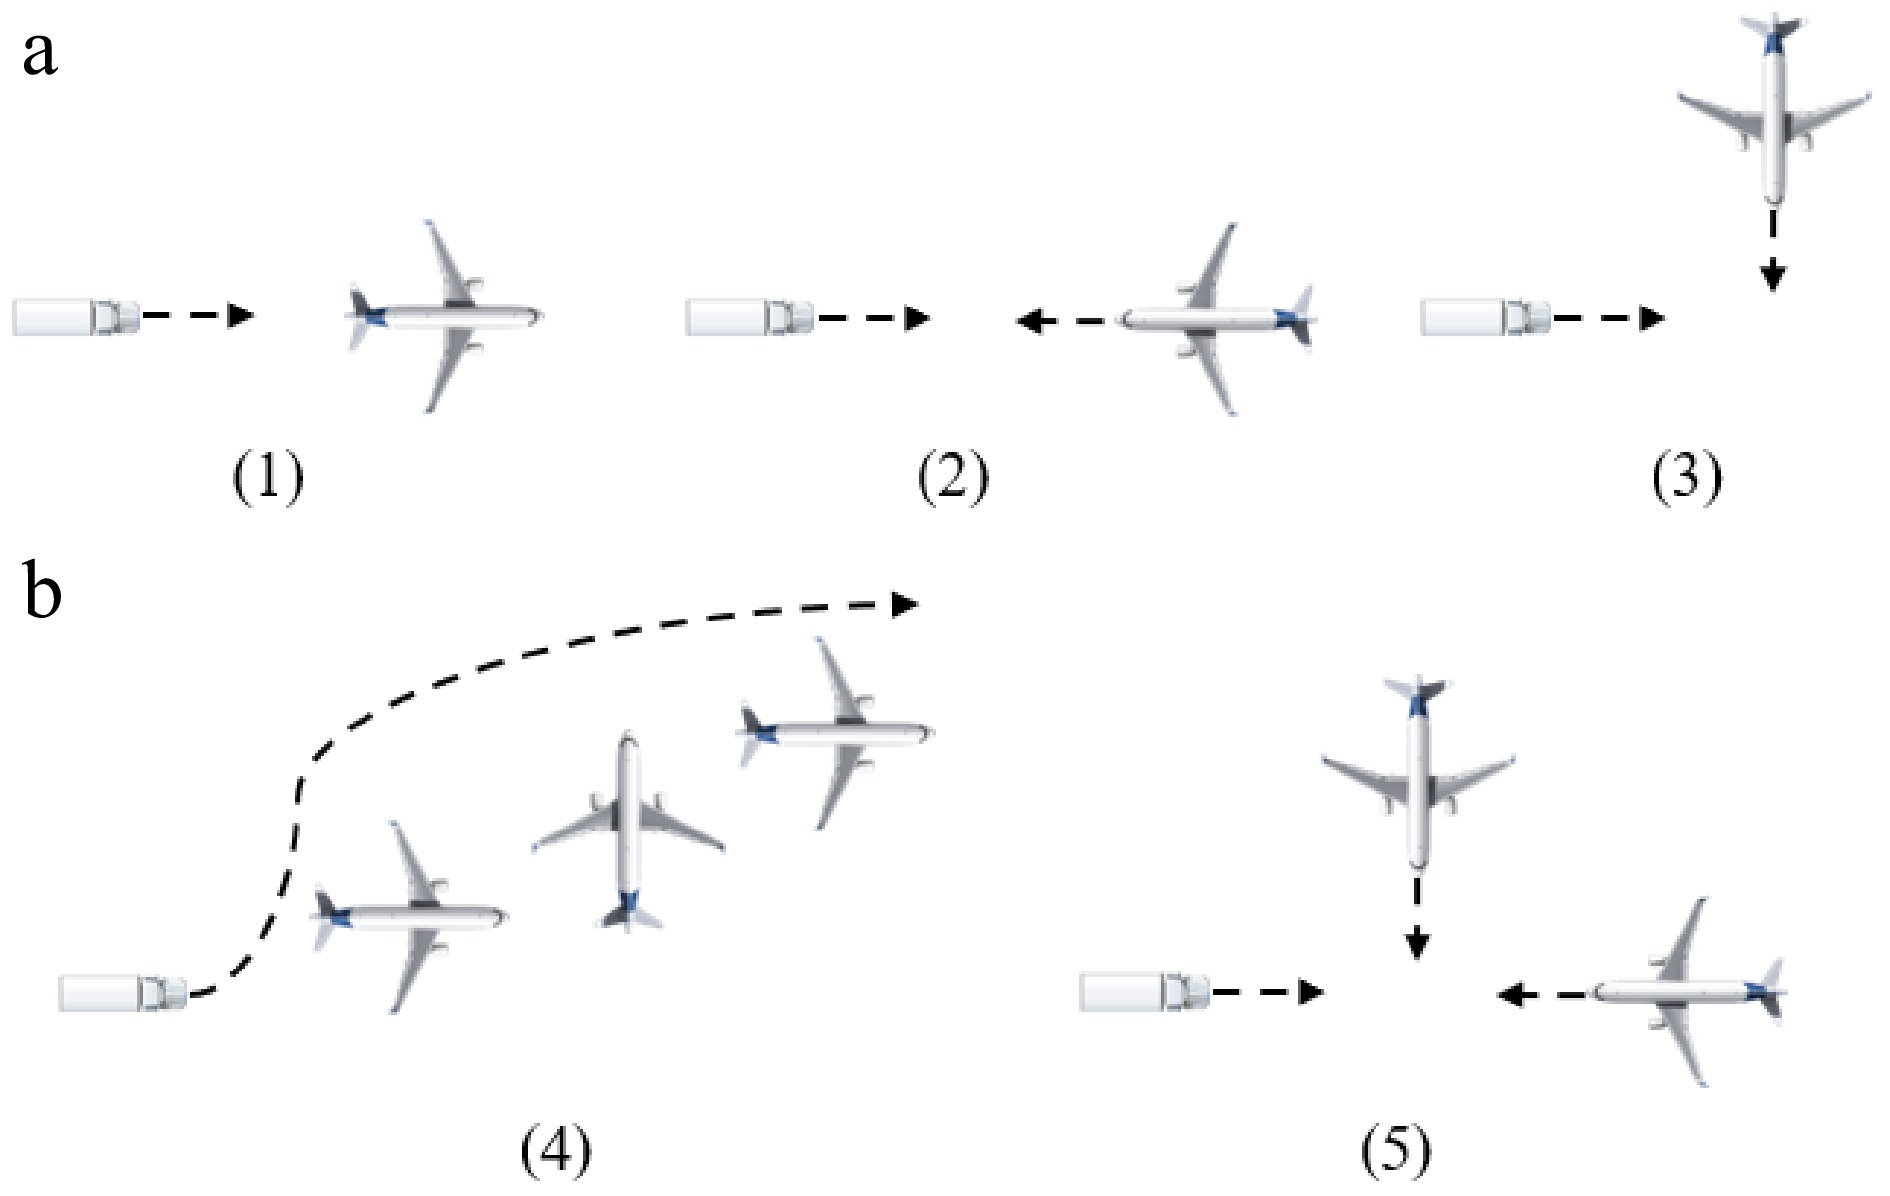
Figure 11.
Illustration of simulated scenario. (a) Conflict involving a single aircraft. (b) Conflict involving multiple aircraft.
The IVO model and its motion parameters are shown in Table 1. The initial states of conflict scenarios involving a single aircraft and multi-aircraft are respectively shown in Tables 2 & 3. The size of the vehicle and aircraft protection zones in the IVO model was calculated in the following section. The initial positions, target positions, and headings in the different conflict scenarios are determined based on the relative positions and motion states of the aircraft and vehicle in each scenario. Reasonable distances are set to illustrate the differences in moving characteristics between normal operation and conflict states, thereby reflecting the effect of IVO in resolving conflict. Additionally, according to relevant civil aviation regulations, the vehicle speed must not exceed 50 km/h, and the aircraft taxiing speed in special circumstances must not exceed 15 km/h[44,45]. Therefore, the vehicle speed range is conservatively set from 0 to 8.5 m/s and the aircraft's normal speed range expanded from 0 to 7 m/s, with values randomly selected within these ranges as the initial state in the experiments to verify the robustness of the method. The simulation results of the improved velocity obstacle method and the traditional method for the conflict scenarios are shown in Figs 12−16, respectively.
Table 1. Basic parameters of operating entities.
Parameter Value Unit Ellipse B representing the aircraft protection zone The major axis 120 m The minor axis 70 m Ellipse A representing the range of the vehicle's profile The major axis 4.5 m The minor axis 2.0 m Range of aircraft taxiing speeds (0, 7) m/s Range of vehicle driving speeds (0,8.5) m/s Iteration step 1.5 s Table 2. Initial state of conflict involving a single aircraft.
Type of conflict scenarios Type of operating entities Initial position (m) Target position (m) Initial speed (m/s) Heading DWA coefficients kh, kc, kv Aircraft stationary with vehicle bypassing Vehicle (10, 10) (530, 530) 7.0 45° 200, 1, 20 Aircraft (250, 250) − 0 45° − Head-on conflict Vehicle (50, 50) (550, 550) 7.0 45° 200, 1, 20 Aircraft (300, 300) − 4.0 −135° − Cross conflict Vehicle (60, 60) (550, 550) 6.0 45° 200, 1, 20 Aircraft (100, 400) − 4.2 −45° − Table 3. Initial state of conflict involving multiple aircraft.
Type of conflict scenarios Type of operating entities Initial position (m) Target position (m) Initial speed (m/s) Heading DWA coefficients kh, kc, kv Multiple aircraft stationary with vehicle bypassing Vehicle (10, 200) (1070, 800) 7.0 45° 200, 1, 20 Aircraft (190, 300) − 0 0° − Aircraft (560, 430) − 0 90° − Aircraft (850, 650) − 0 0° − Combination of head-on and cross conflicts Vehicle (10, 10) (775, 775) 7.0 45° 200, 1, 20 Aircraft (660, 660) − 2.8 −135° − Aircraft (100, 300) − 3.3 −45° − 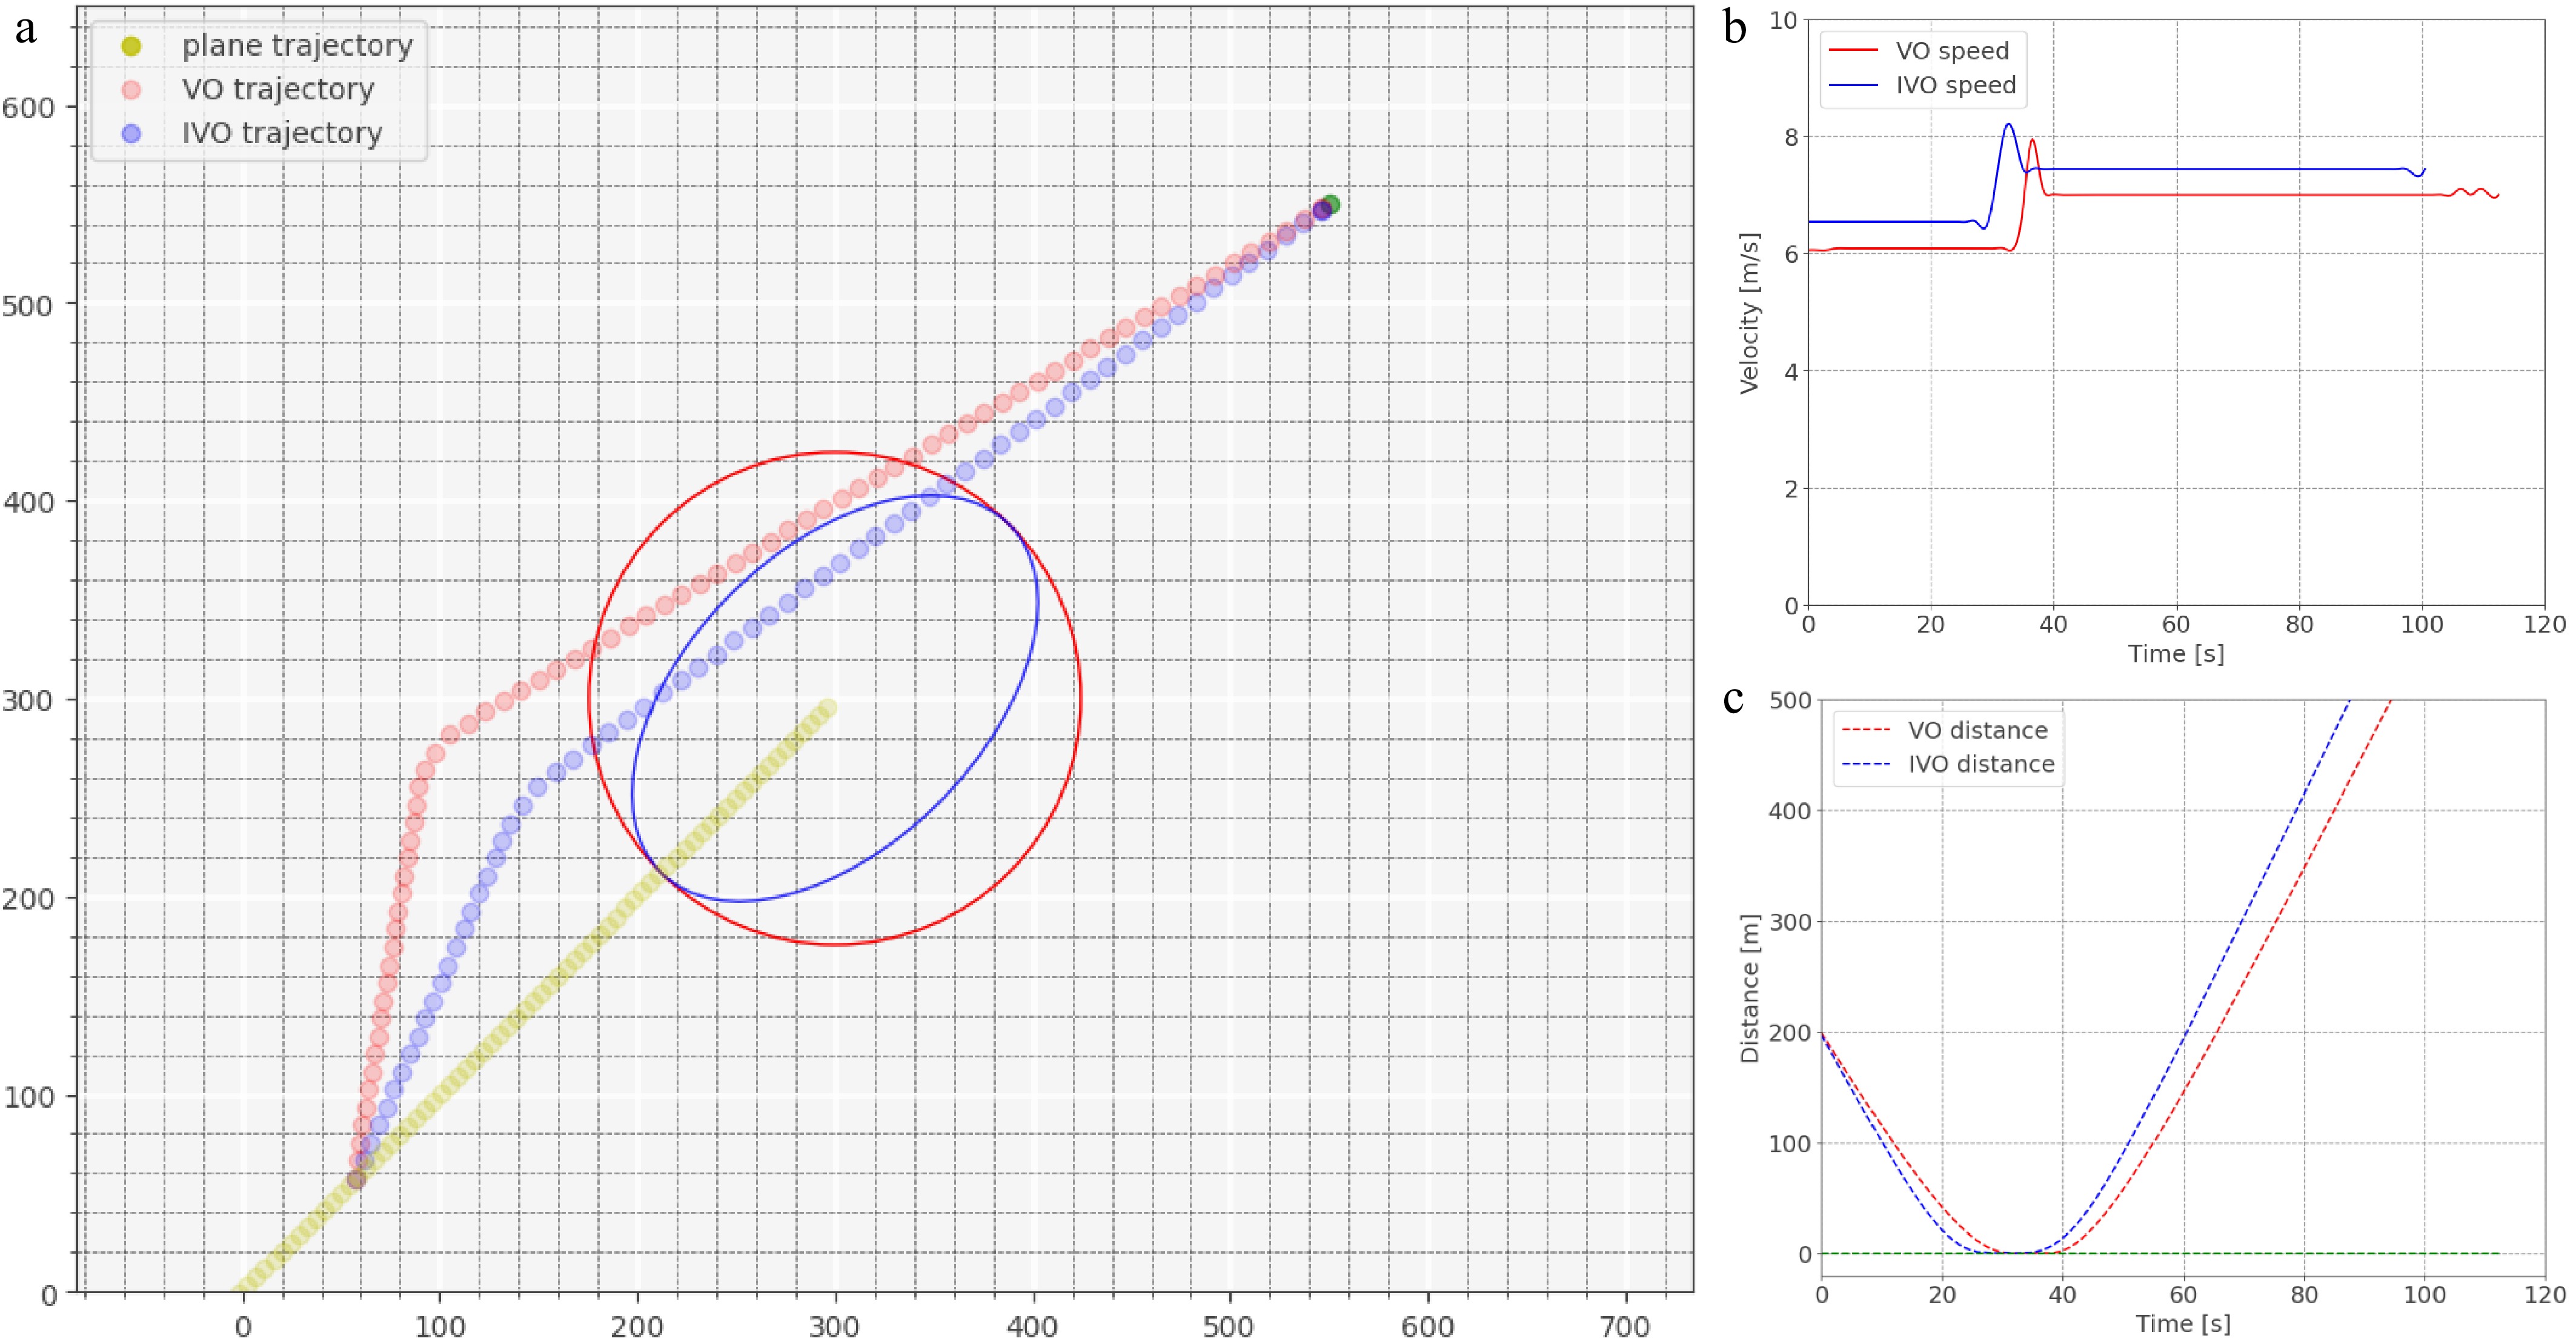
Figure 13.
Scene of head-on conflict. (a) Trajectory of vehicle avoids conflict. (b) Speed curve. (c) Distance of the vehicle to the boundary of the protected zone.
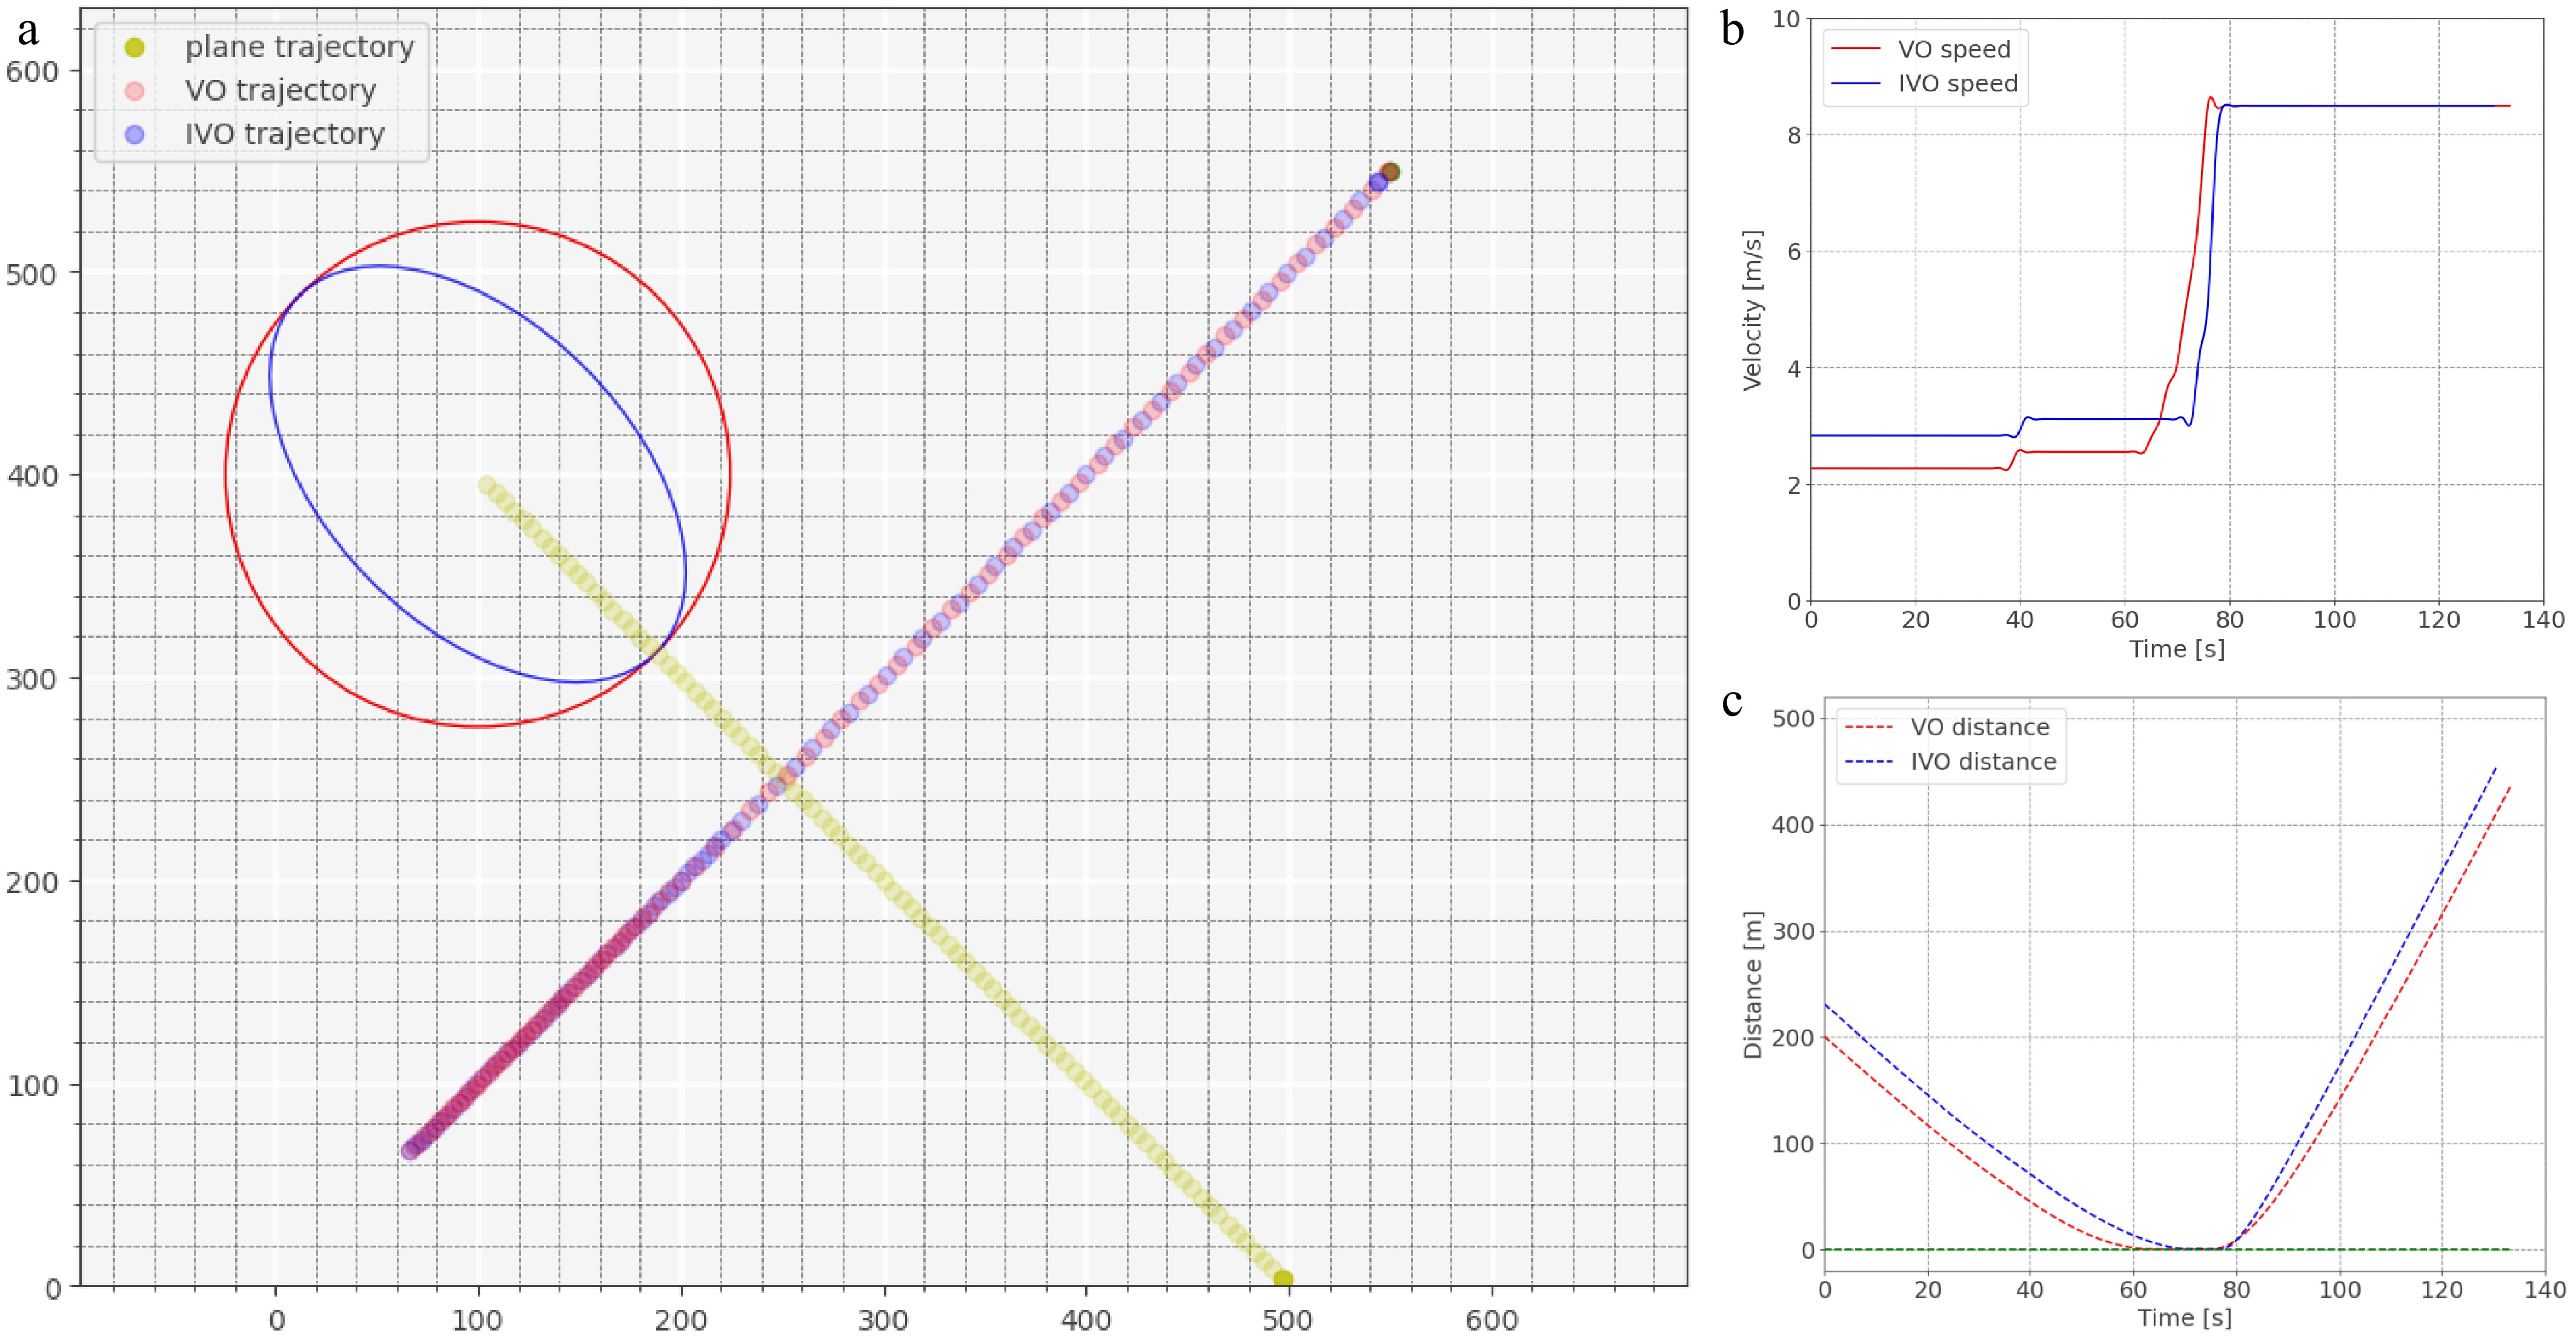
Figure 14.
Scene of cross conflict. (a) Trajectory of vehicle avoids conflict. (b) Speed curve. (c) Distance of the vehicle to the boundary of the protected zone.
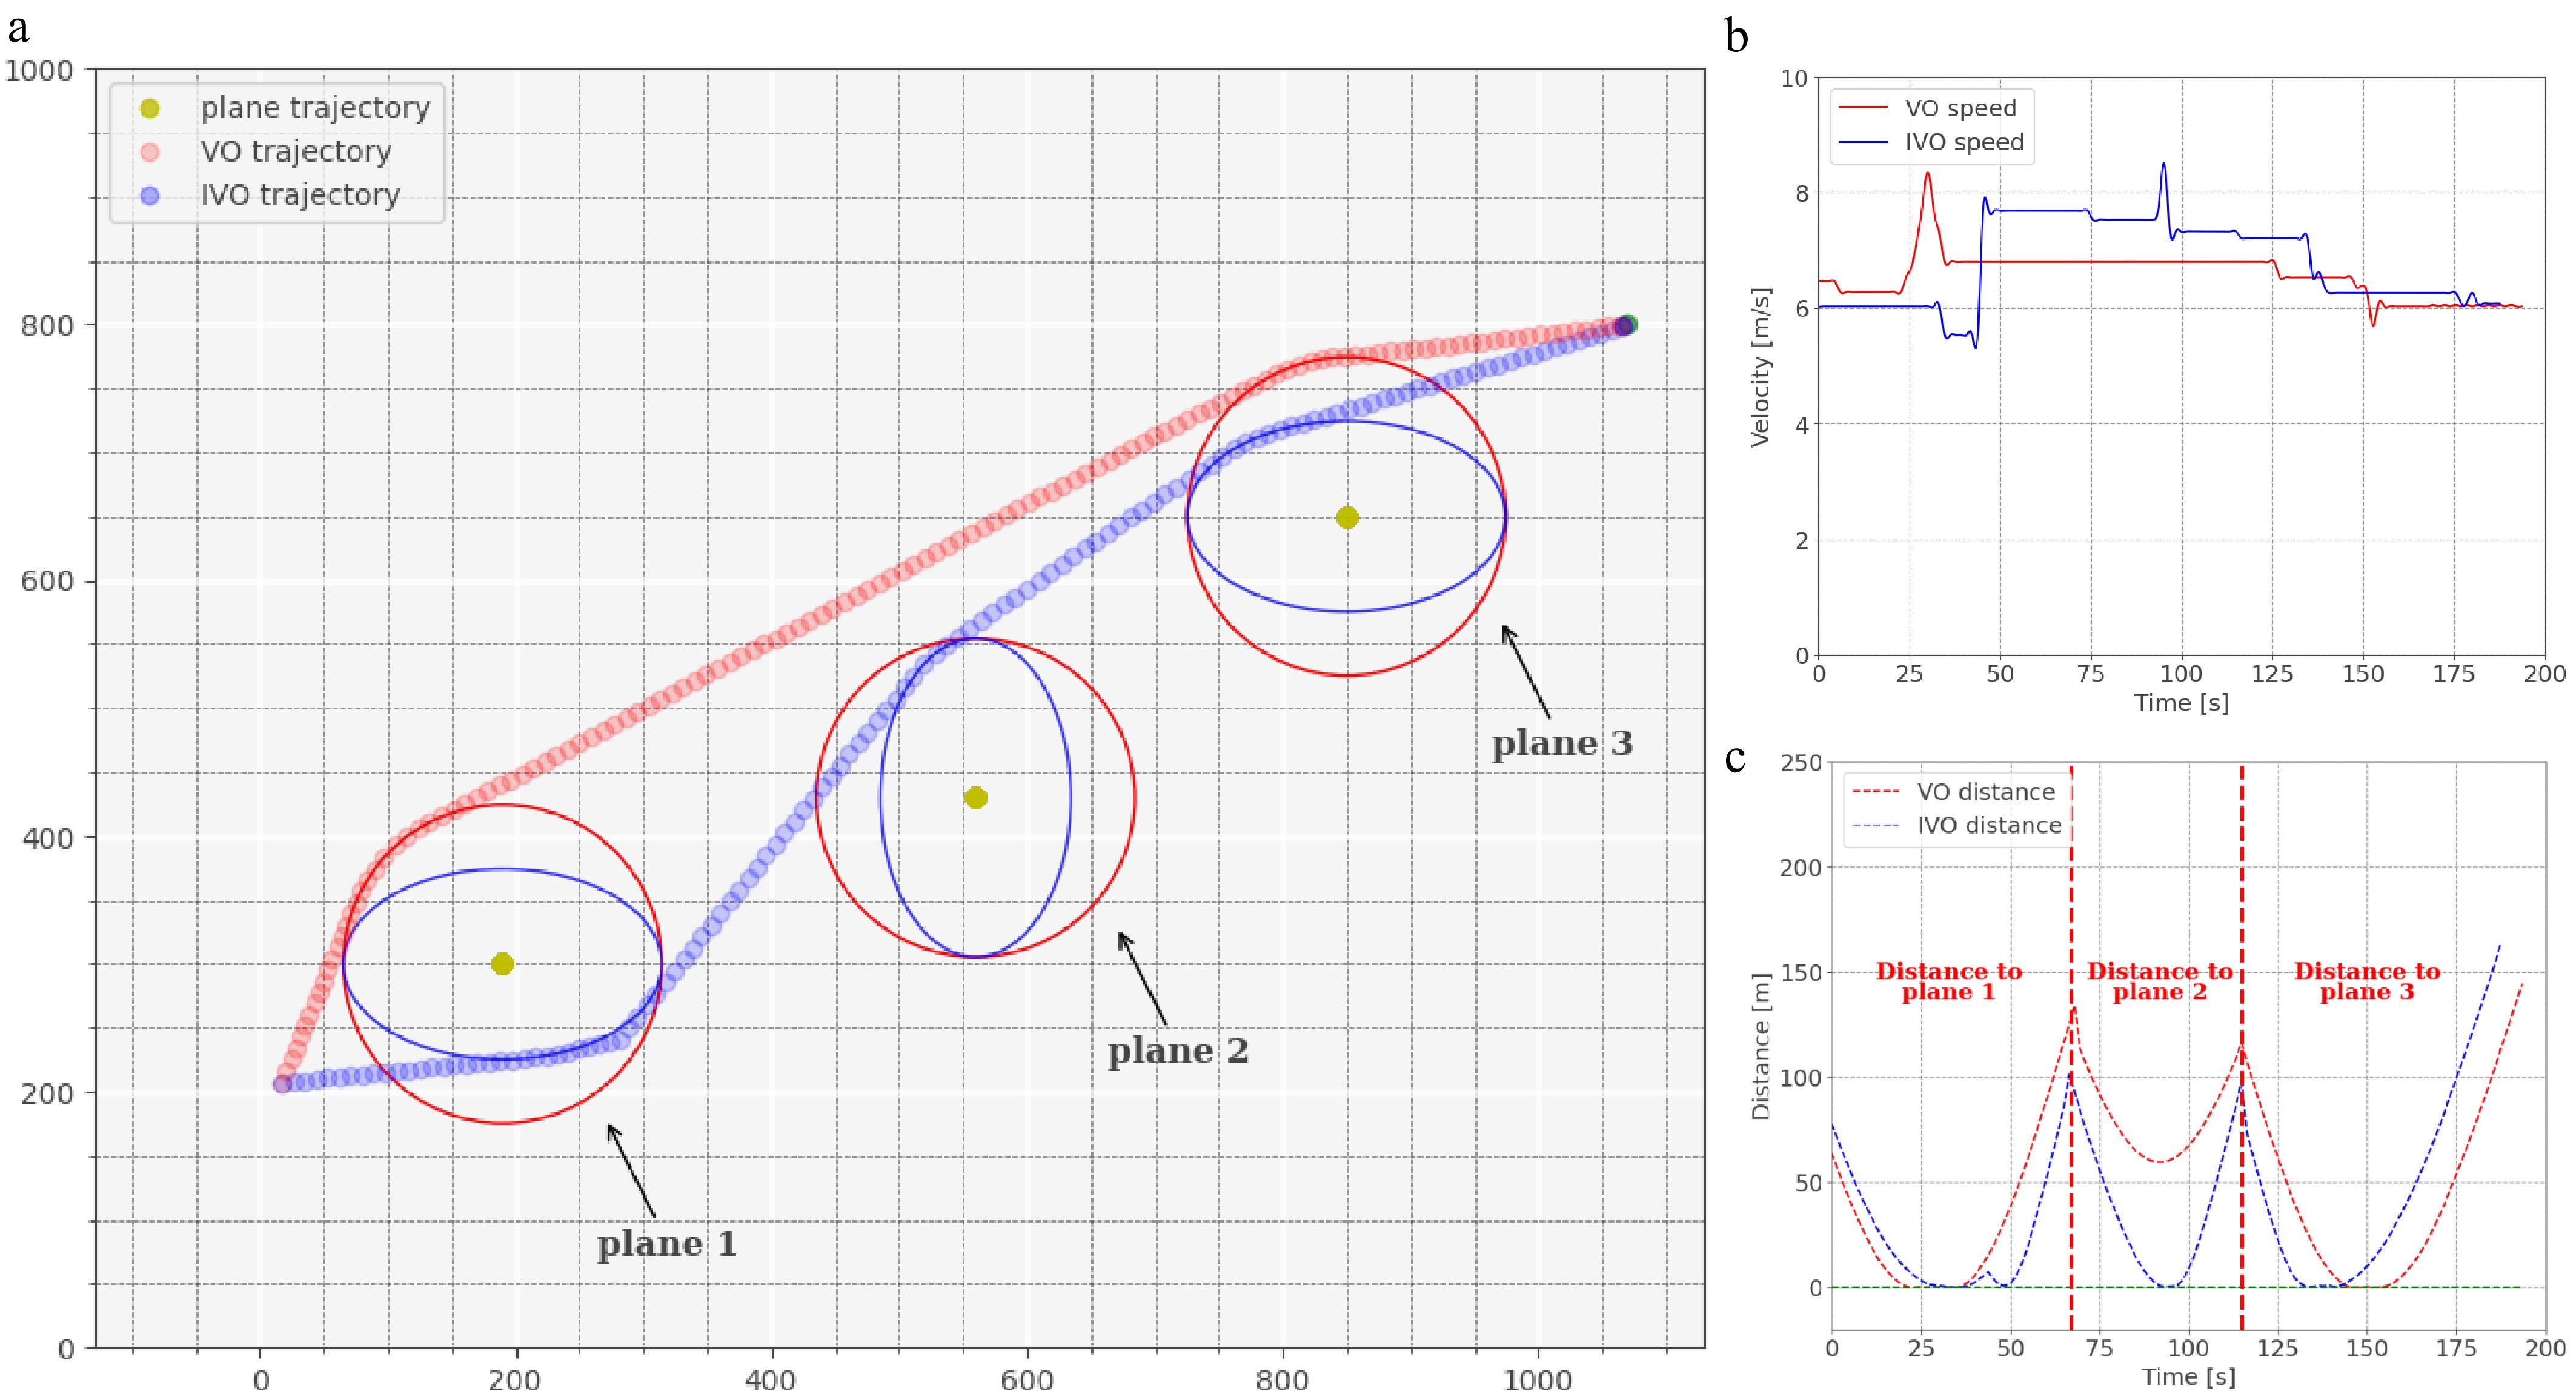
Figure 15.
Scene of multiple aircraft stationary with vehicle bypassing. (a) Trajectory of vehicle avoids conflict. (b) Speed curve. (c) Distance of the vehicle to the boundary of the protected zone.
In the simulation results, red represents the results of the vehicle's operation using the traditional velocity obstacle method, while blue represents the results of vehicle using the improved velocity obstacle method described in this paper. Figures 12−14 depict the simulation results of conflicts involving a single aircraft. The vehicle trajectories from three scenarios in Figs 12a,13a, and 14a illustrate the vehicles' ability to detect and resolve the conflicts by altering their motion status. The distance curves depicted in Figs 12c, 13c, and 14c show that vehicles remain outside the protection zone defined by the aircraft, aligning with our research's safety goal of conflict avoidance. Additionally, from Figs 12a and 13a, it can be seen that in conflict scenarios, vehicles based on IVO have smaller trajectory deviation, which is consistent with the improvement of reducing lateral constraints achieved by the new method. This indicates that the improved method not only reduces the impact of conflicts on path changes but also reduces the length of the travel route. In the case of the cross conflict shown in Fig. 14a, both methods adopt a deceleration strategy to avoid collisions, allowing vehicles to continue their straight path after the aircraft's passage. However, a closer inspection of the speed curves in Figs 12b, 13b, & 14b reveals that vehicles using the improved method typically operate at higher speeds with lower fluctuations. This is attributed to the reduction in lateral constraints, expanding the feasible velocity set and increasing the distance between the vehicle and the aircraft protection zone boundary at certain positions. Consequently, within the DWA algorithm, the impact of the clearance factor is smaller, permitting vehicles to operate in higher speeds. Moreover, from the endpoint of the speed curves, it is evident that vehicles using the improved method terminate their trajectories earlier, indicating these vehicles can reach their destination in a shorter time frame.
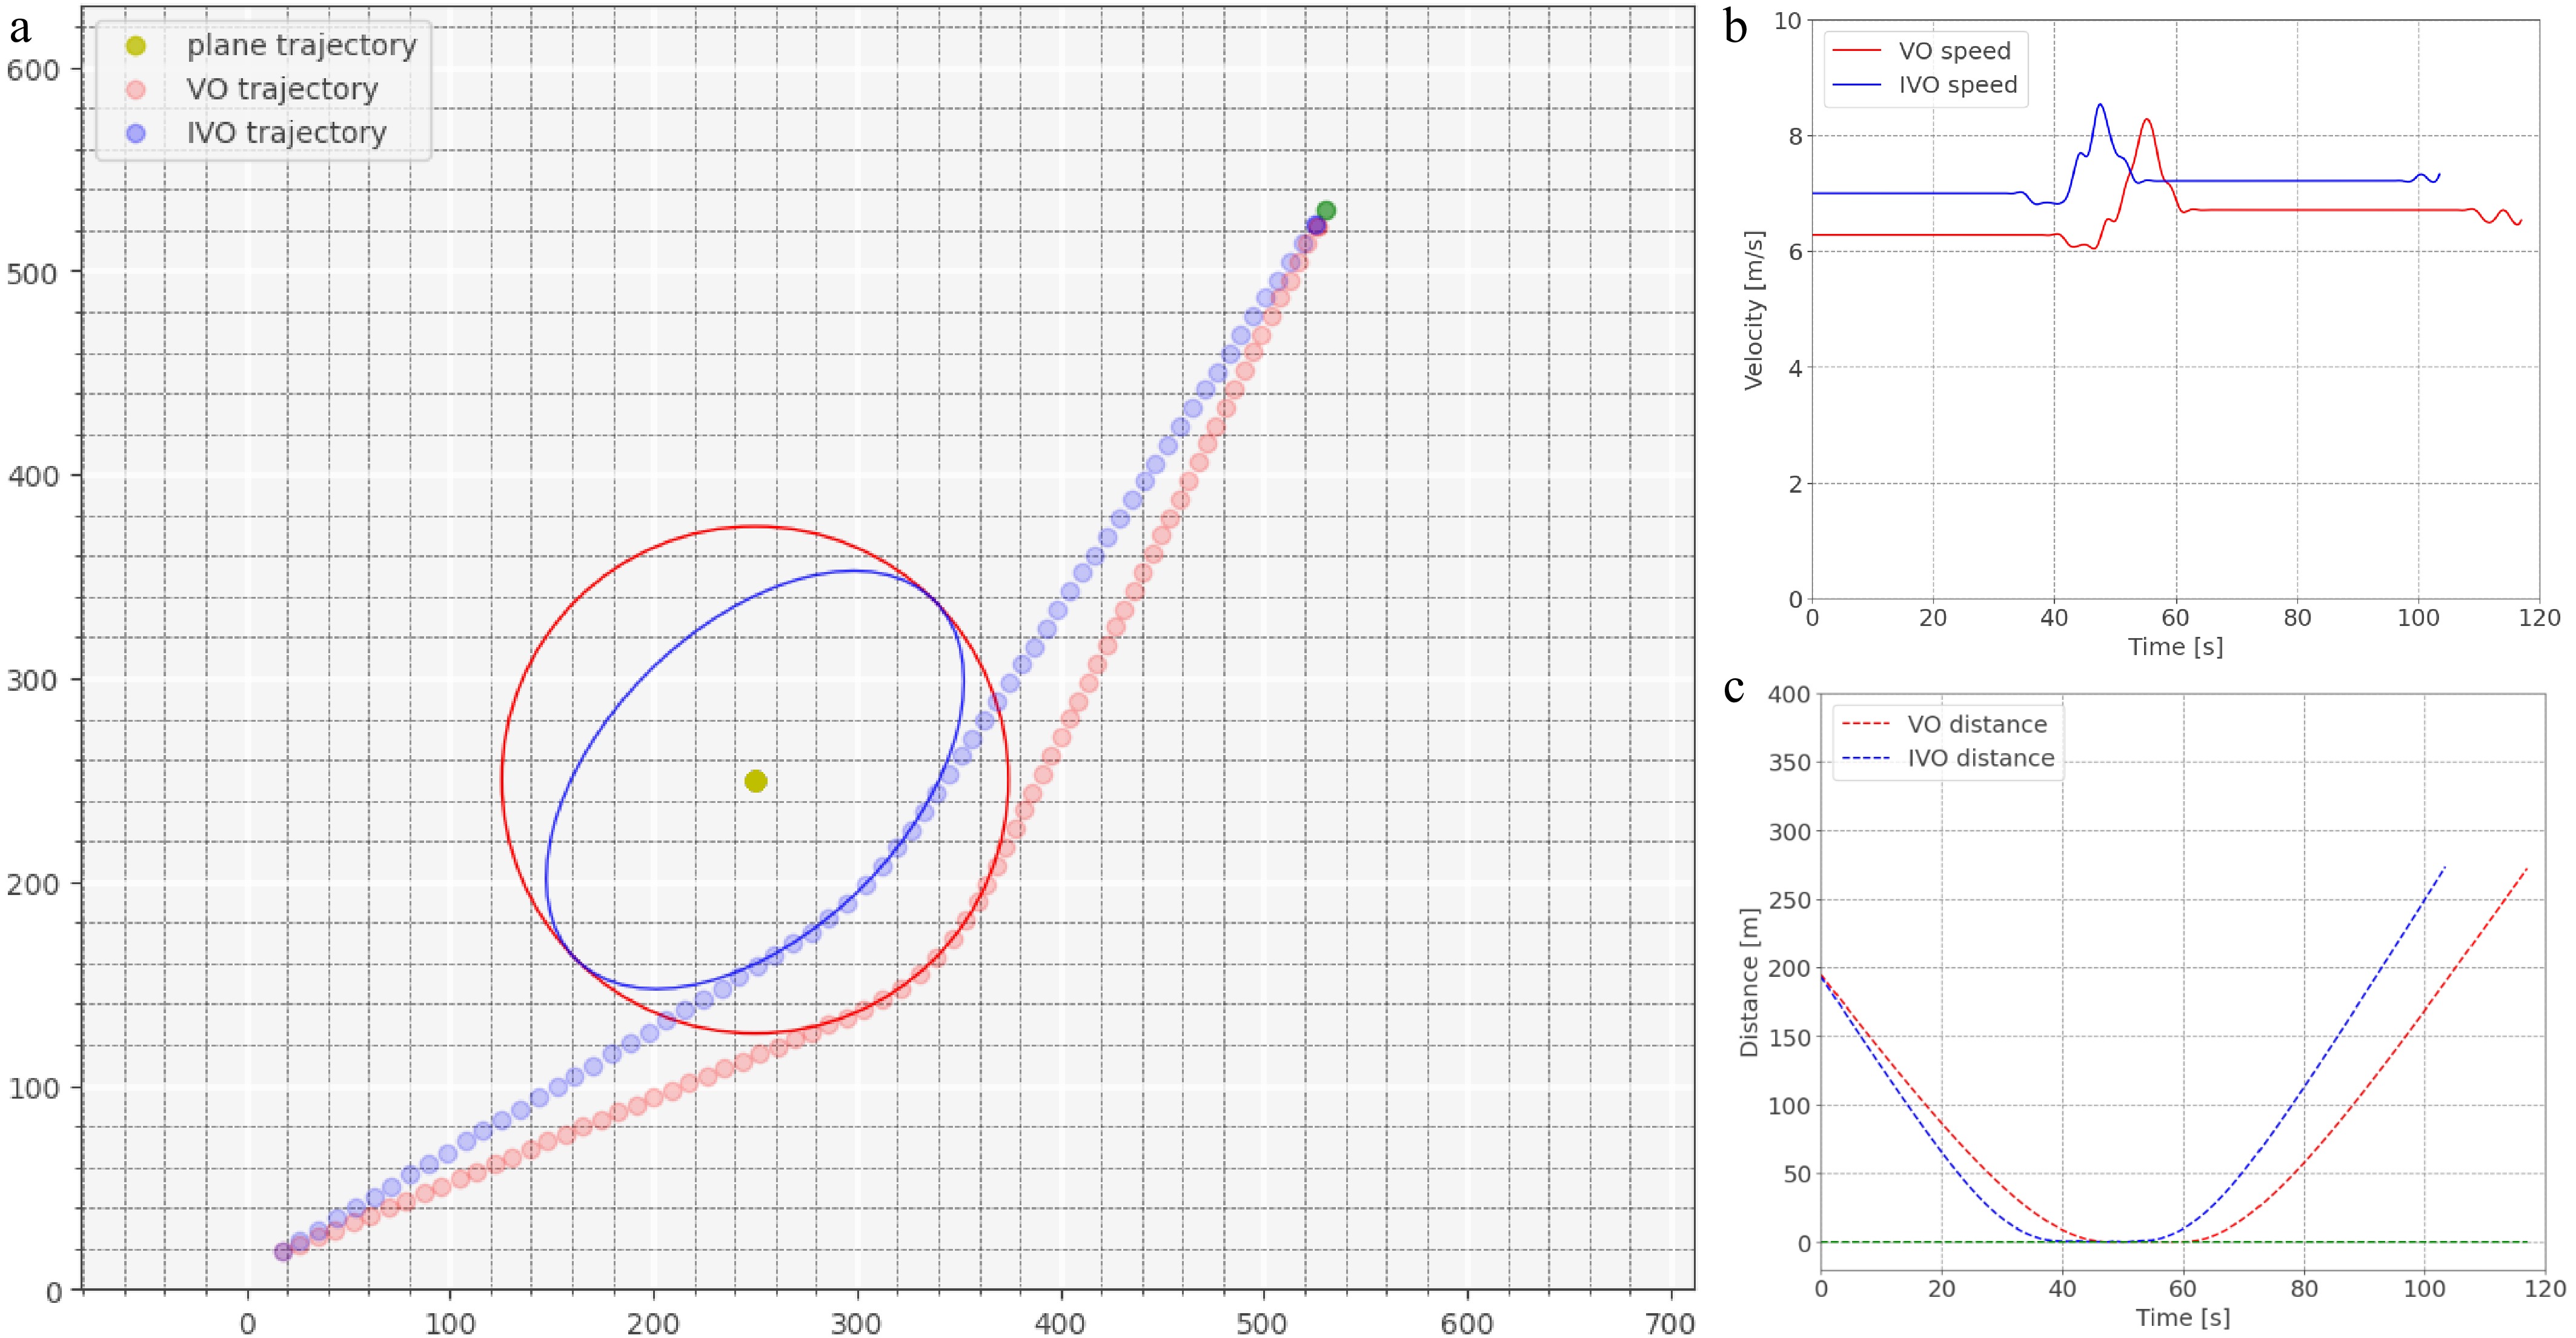
Figure 12.
Scene of aircraft stationary with vehicle bypassing. (a) Trajectory of vehicle avoids conflict. (b) Speed curve. (c) Distance of the vehicle to the boundary of the protected zone.
To further validate the viability and effectiveness of the proposed method in complex airport scenarios, we designed and simulated conflict scenarios involving multiple aircraft, presented in Figs 15 & 16. The trajectories in Figs 15a & 16a demonstrate that both velocity obstacle methods can simultaneously detect multiple potential conflicts and plan routes to prevent these conflicts. Furthermore, vehicles utilizing the IVO method exhibit smaller trajectory deviations and move with shorter overall distances. Additionally, Fig. 15a indicates that the vehicle using the improved method has more route options due to reduced over-constraints in the protection area, leading to an expanded feasible speed range. In situations with higher heading coefficients in the DWA, vehicles prioritize movement towards their destination, resulting in vehicles using the IVO choosing new routes when feasible. Speed curves in Figs 15b & 16b in multi-aircraft scenarios indicate that vehicles using the improved method can also achieve higher speeds and reach their destination faster. Distance curves in Figs 15c & 16c record the distances between vehicles and the nearest aircraft in conflict scenarios. The curves remain greater than 0, indicating that the conflict event of intrusion into the protection area will not occur.
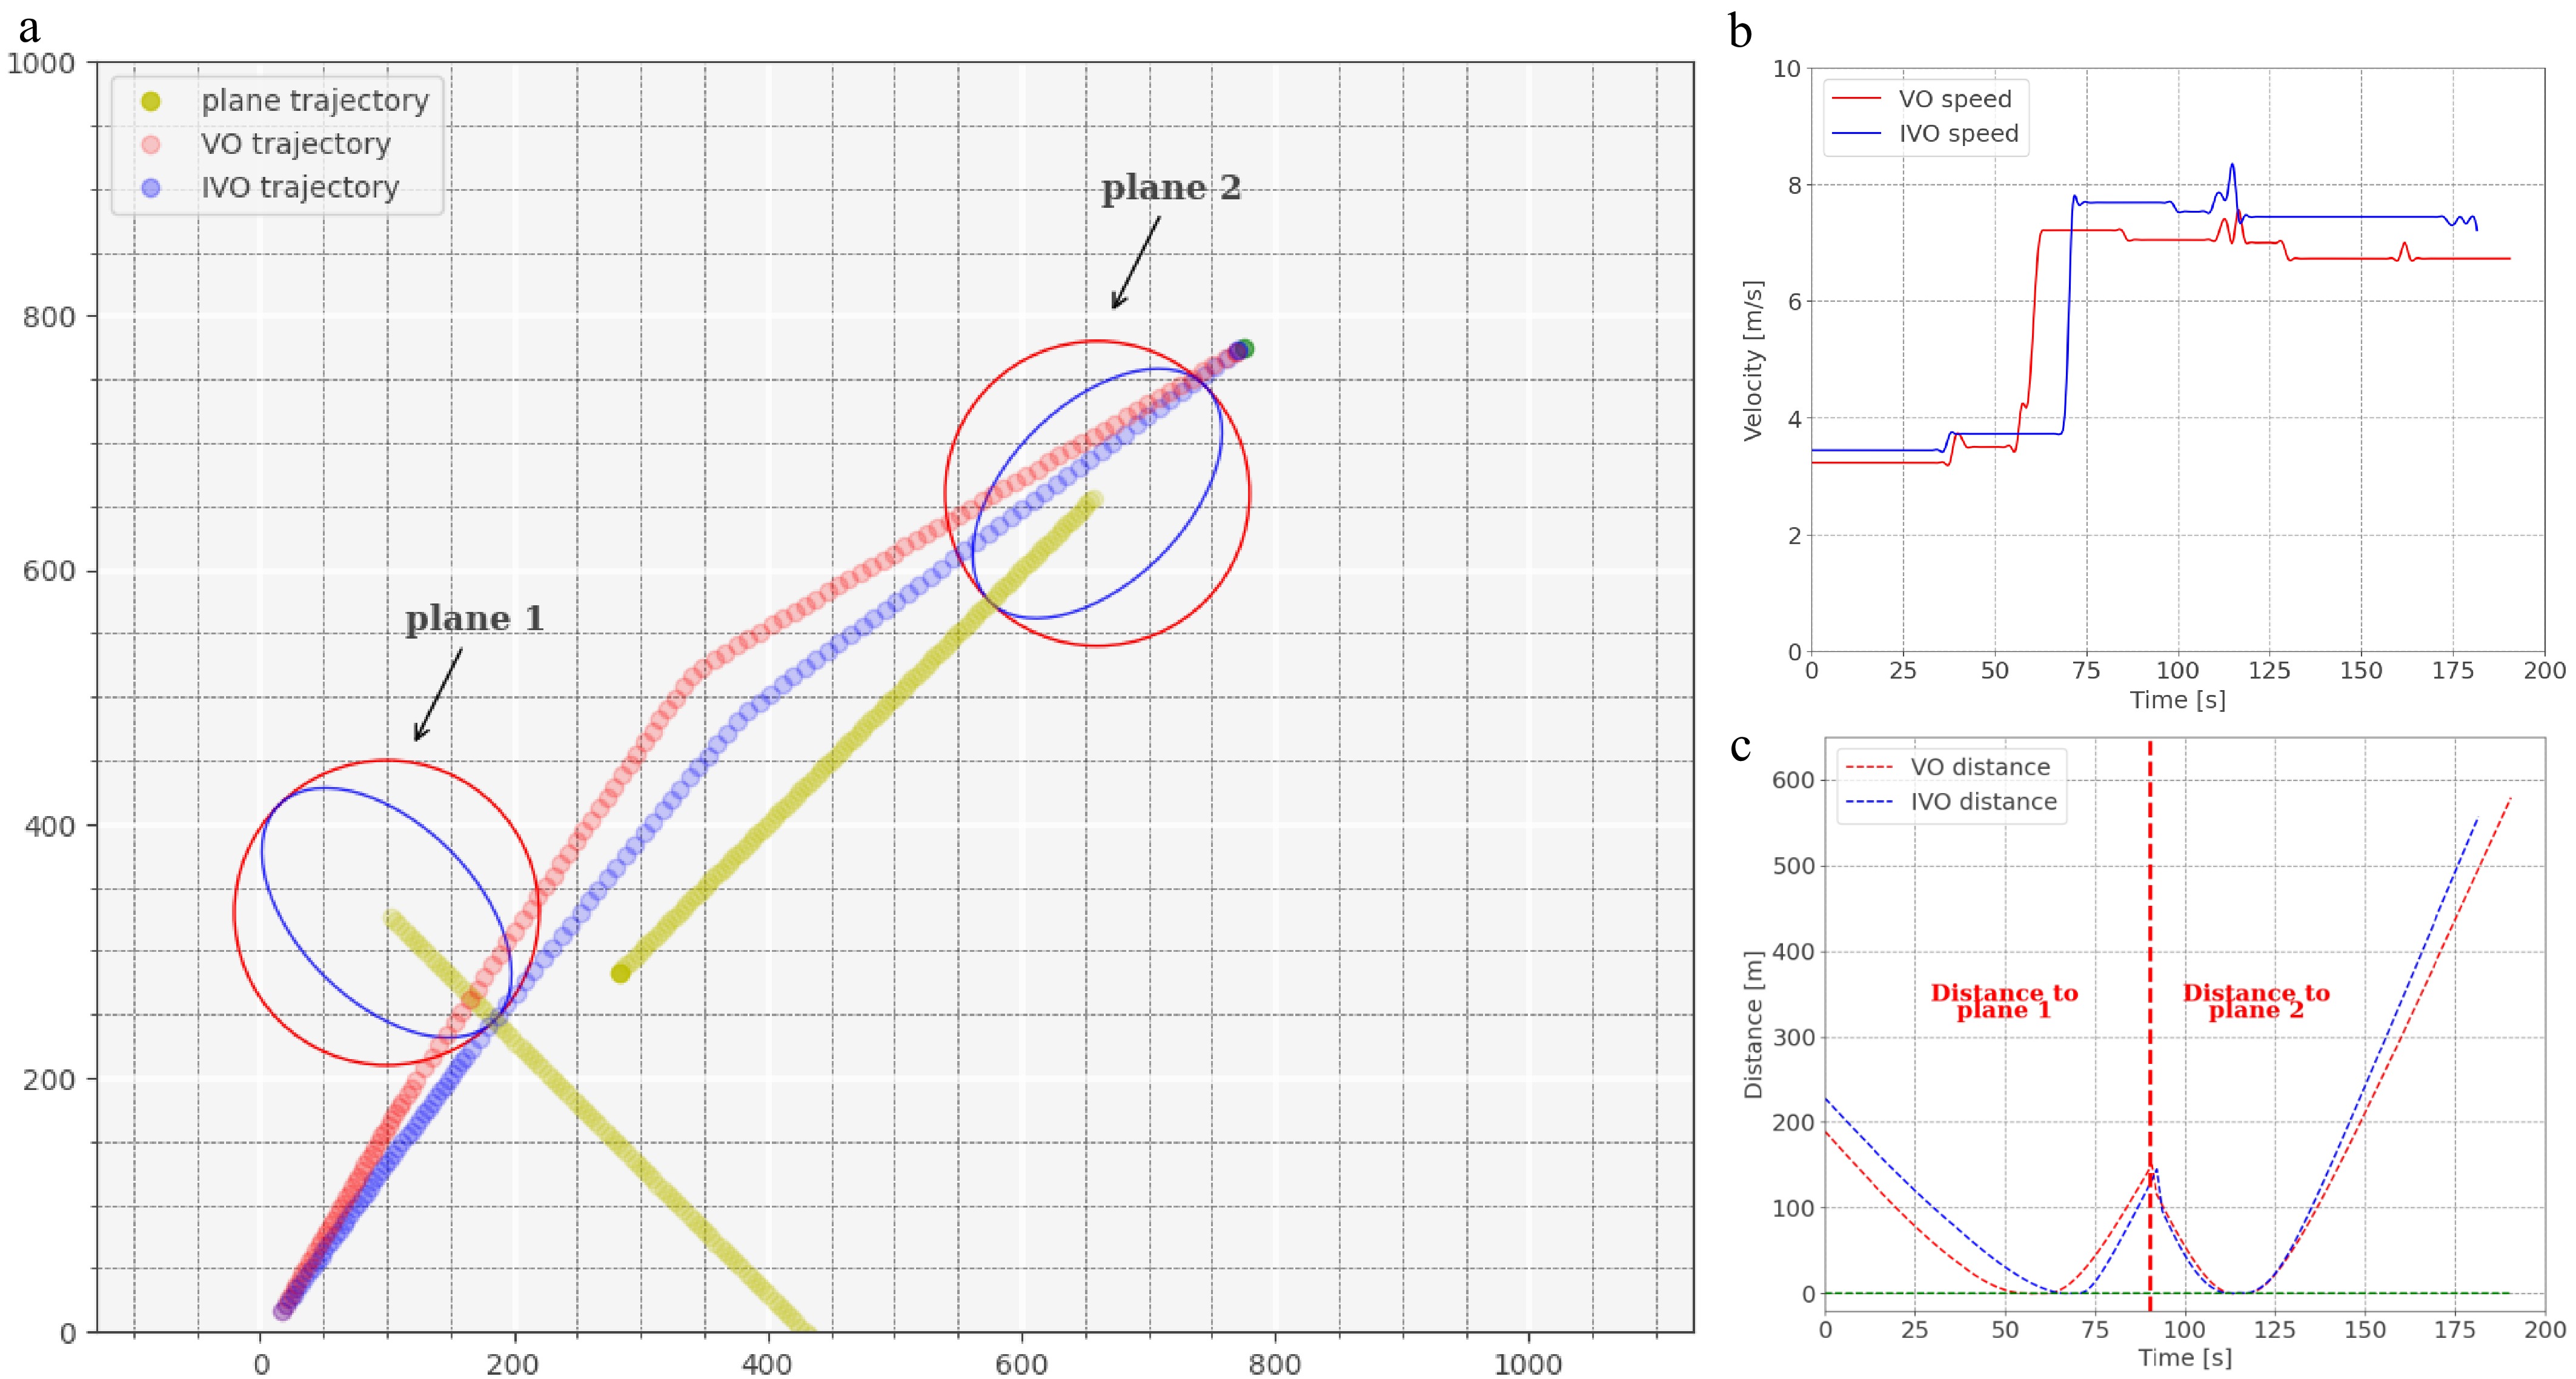
Figure 16.
Scene of combination of head-on and cross conflicts. (a) Trajectory of vehicle avoids conflict. (b) Speed curve. (c) Distance of the vehicle to the boundary of the protected zone.
Furthermore, observing the velocity curves in Figs 12−16, it can be noticed that the vehicle's speed occasionally exceeds its initial velocity during operation, which differs from a typical deceleration-based collision avoidance strategy in traffic conflicts. This phenomenon results from the velocity assignment strategy and the experimental parameter settings. Specifically, in our experiments, vehicle acceleration primarily occurs when the vehicle changes heading or has resolved conflict. Since this research aims to reduce the impact of conflicts on normal operations through more precise safety assessment, thereby enhancing operational efficiency while ensuring safety, we initially assigned relatively large coefficients to the velocity parameter in DWA. The increase in vehicle speed occurs because the algorithm has selected velocity vectors outside the collision cone range of IVO, and when further determining velocity values based on DWA, the algorithm determines that certain velocity values would allow the vehicle to operate without conflict, it supports higher operational speeds. Therefore, the speed increase does not represent active acceleration as the vehicle approaches the aircraft. It occurs during phases where conflicts have been identified and effectively avoided. This represents a reasonable acceleration based on the pre-configured optimization objective function of the DWA model, which more clearly validates the effectiveness of our proposed method in improving operational efficiency while ensuring safety.
Combining these results shows that the various conflict scenarios designed in the simulation validate the effectiveness of the improved method in detecting and resolving conflicts. IVO not only provides a novel approach to precise conflict detection but also contributes to shortening travel routes, reducing travel time, and enhancing operational efficiency.
-
To address conflict detection and resolution between vehicles and aircraft, this paper proposes an improved velocity obstacle (IVO) method, which establishes elliptical protection zone based on the traditional velocity obstacle model to accommodate aircraft safety distance requirements in different directions. A tangent-based approach for calculating collision cone ranges is derived, enabling conflict identification based on the relative spatiotemporal positions and movement relationships between vehicles and aircraft. Additionally, proposing a velocity update strategy based on the dynamic window approach to support vehicles in autonomously completing the entire process from conflict detection to resolution. Based on this, numerical simulations using five typical conflict scenarios demonstrate that the proposed method accurately responds to conflict detection requirements, and improving operational efficiency while ensuring safety. By reducing the distance of trajectory adjustments required for collision avoidance and enabling vehicles to operate at higher speeds, the method reduces the time required for moving to destinations.
Through the reduction of lateral redundant constraints in the protection zone and narrowing the actual boundary range of operating entities, this method provides vehicles with a broader feasible velocity space during conflict resolution, thereby reducing interference with operational states and trajectories during the resolution process. Furthermore, the combination of IVO and DWA enables a complete process from conflict detection to resolution, enhancing the autonomous response capability of surface operating entities in small-scale emergent conflict events and filling the gap in microscopic traffic management by control units. This improvement is particularly useful in increasingly congested airport surfaces, where optimized protection zone construction increases available driving areas for vehicles, and flexible coefficient selection in the dynamic window approach enables the method to respond to different requirements. Enhancing operational safety through more precise conflict detection methods alleviates operational constraints imposed by conflicts, contributing to improved airport operational efficiency.
However, the limitations of this study must be acknowledged. First, the dynamic characteristics of vehicles and aircraft during operations are not fully considered, relying on simplified kinematic modeling that may deviate from the actual situation. Second, practical constraints such as road boundaries are not considered when selecting conflict resolution velocities. Third, the classification of vehicle-aircraft conflict scenarios in the experimental design references conflict scenario classifications between aircraft without further consider the characteristics in vehicle-aircraft conflicts. Finally, this research does not include comparisons with other conflict detection methods. To address these limitations, future research will improve the proposed approach from a methodological perspective and explore its applications in other fields. This will enable more comprehensive consideration of the dynamic characteristics of vehicles and aircraft, conflict scenario features, practical constraints, and comparation with other conflict detection methods. By addressing these aspects, the improved method can further enhance its applicability and effectiveness in practical applications.
This research was funded by the National Key R&D Program of China (Grant No. 2021YFB1600500), the National Natural Science Foundation of China (Grant No. U2333204) and the Fundamental Research Funds for the Central Universities (Grant No. 2242024RCB0047).
-
The authors confirm contribution to the paper as follows: study conception and design: Zhou F, Shi X; data collection: Zhou F, Bao J; analysis and interpretation of results, draft manuscript preparation: Zhou F; manuscript revision: Shi X, Bao J, Zhang J, Ye Z. All authors reviewed the results and approved the final version of the manuscript.
-
Data sharing is not applicable to this article as no datasets were generated or analyzed during the current study.
-
The authors declare that they have no conflict of interest.
- Supplementary Data 1 Boundary solution of improved velocity obstacle method.
- Copyright: © 2025 by the author(s). Published by Maximum Academic Press, Fayetteville, GA. This article is an open access article distributed under Creative Commons Attribution License (CC BY 4.0), visit https://creativecommons.org/licenses/by/4.0/.
-
About this article
Cite this article
Zhou F, Shi X, Bao J, Zhang J, Ye Z. 2025. Vehicle-aircraft conflict detection on the airport surface: an improved velocity obstacle method. Digital Transportation and Safety 4(4): 251−263 doi: 10.48130/dts-0025-0024 

Vehicle-aircraft conflict detection on the airport surface: an improved velocity obstacle method
- Received: 25 December 2024
- Revised: 26 April 2025
- Accepted: 04 June 2025
- Published online: 31 December 2025
Abstract: Airport surface operations involve a complex interplay between various vehicles and aircraft, making conflict detection a critical aspect of ensuring safety and efficiency. Traditional conflict detection methods have limitations in accurately distinguishing between the contours of vehicles and aircraft and addressing varying safety distance requirements for aircraft in different orientations. In this paper, an improved velocity obstacle (IVO) method specifically tailored for vehicle-aircraft conflict detection is proposed. By leveraging the Minkowski sum and the mapped region of aircraft and vehicles, it is verified that the error in simplifying the calculation of the mapped region under different relative poses of aircraft and vehicles is within acceptable limits. Furthermore, formulas were derived to calculate the boundary angles of the collision cone, enabling improved vehicle-aircraft conflict judgment. The effectiveness of the improved method is validated through numerical simulations involving five typical scenarios. This method showcases promising potential for enhancing safety and efficiency in airport surface operations.