


-
Against the backdrop of the continuous expansion of global transportation networks and the surge in freight demand, asphalt pavement, as the primary structural form of high-grade highways, is facing increasingly severe challenges regarding durability. Among these challenges, rutting, one of the most typical early-stage distresses in asphalt pavement, exhibits significant characteristics of nonlinearity, accumulation, and spatiotemporal variability in its evolutionary process due to the coupled effects of long-term repeated wheel loading, cyclic alternations of environmental temperature and humidity, and the inherent deterioration of materials[1−4]. The occurrence of rutting not only leads to a decline in pavement smoothness and driving comfort but also causes local stress concentration in the wheel path, exacerbates fatigue damage to the pavement structure, and even induces safety hazards such as vehicle skidding and prolonged braking distances[5].
In recent years, academia and engineering circles have conducted extensive research on rutting prediction models, forming two core technical approaches: mechanical models and data-driven models. Mechanical models are based on material constitutive relationships and structural mechanical responses, describing the deformation behavior of asphalt mixtures under complex loads through the construction of a viscoelastic-plastic theoretical framework[6,7]. For example, the Burgers model or the generalized Maxwell model is used to characterize the viscoelastic properties of asphalt mixtures, and the interlayer interaction is considered to establish the physical mechanism of rutting accumulation[8]. However, such models are limited by the assumption of a homogeneous medium and the constraints of laboratory test parameters, making it difficult to accurately simulate the long-term mechanical responses of the multiphase heterogeneous system of actual pavements.
With the development of sensing technology and big data analysis, data-driven models, relying on their adaptive learning ability for complex nonlinear relationships, have gradually become a research hotspot in rutting prediction. Early traditional machine learning methods, such as random forests and support vector machines (SVM), have achieved certain results in rutting prediction for specific road sections by integrating traffic loads, environmental factors, and pavement parameters[9−13]. For instance, a rutting model based on random forests can identify key factors affecting rutting (such as the number of axle load applications and the duration of high temperatures) through importance ranking, with prediction accuracy improved by 10%−15% compared to regression analysis[14]. Nevertheless, these methods rely on manual feature engineering, making it difficult to capture the long-term temporal dependencies in rutting evolution (such as the lag effect of seasonal temperature fluctuations on deformation accumulation). Additionally, they are sensitive to changes in data distribution and have limited generalization capabilities[15].
In recent years, the advent of deep learning technology has opened up a novel avenue for rutting prediction. Deep learning models (e.g., LSTM and Transformer) have substantially enhanced the modeling accuracy of complex time-series data by virtue of their end-to-end feature learning and nonlinear mapping capabilities[16,17]. For instance, the LSTM-BPNN hybrid model integrates short-term fluctuations and long-term trends through an attention mechanism, achieving a 15% improvement in prediction accuracy relative to conventional models[18]. Nevertheless, existing deep learning models still suffer from limitations such as inadequate multi-source data integration capacity, generalization performance that is contingent upon the coverage of training data, and a lack of in-depth integration with the physical mechanisms underlying rutting.
To address these issues, this study proposes a DSAN model, which aims to realize high-precision prediction and mechanistic interpretation of rutting depth via multi-scale feature fusion and focusing on key information. The model innovatively adopts a parallel dual-branch architecture: the TCN-LSTM branch leverages the local feature extraction capability of TCN and the long-term time-series modeling advantage of LSTM to capture both short-term fluctuations and long-term trends in rutting evolution; the LSTM-MHA branch incorporates a Multi-Head Attention (MHA) mechanism to weighted focus on critical time-series nodes (e.g., load peaks, abrupt temperature changes), thereby enhancing the model's sensitivity to influencing factors.
To validate the effectiveness and generalization ability of the proposed model, this research utilizes long-term observational data from the RIOHTrack full-scale circular test track facility of the Research Institute of Highway, Ministry of Transport. The dataset encompasses a cumulative 80 million ESALs and covers typical pavement structures with varying asphalt layer thicknesses (12–52 cm) involving four major base types (semi-rigid base, flexible base, composite base, etc.). By comparing the prediction performance of DSAN with that of mainstream deep learning models, including LSTM, TCN-LSTM, and LSTM-Attn, this study elucidates the mechanism by which variations in asphalt layer thickness affect rutting development rates, providing a theoretical foundation and technical support for rutting prevention and control in pavements of different structural types.
-
This study conducted long-term accelerated loading tests based on the RIOHTrack full-scale pavement test loop, with data collection covering the complete period from 2017 to 2023, forming a long-time-series observation dataset involving 80 million equivalent standard axle load applications. Guided by the principle of full gradient coverage of AC layer thickness, eight typical structures (designated as STR1, STR6, STR7, STR11, STR13, STR16, STR18, and STR19) were selected from the test loop. These structures feature AC layer thicknesses spanning the critical range of 12–52 cm and cover four types, including semi-rigid base, thick asphalt structure, and full-depth asphalt structure. The specific correspondences between structure designations, AC layer thicknesses, and types are presented in Table 1.
Table 1. Table of typical structural parameters.
Structure No. AC layer thickness (cm) Base course type STR1 12 Thin asphalt semi-rigid structure STR6 16 Ordinary semi-rigid structure STR7 18 Ordinary semi-rigid structure STR13 24 24~28 cm thick asphalt structure STR11 28 24~28 cm thick asphalt structure STR16 36 36 cm thick asphalt structure STR19 48 Full-depth asphalt structure STR18 52 Full-depth asphalt structure The thickness of the asphalt concrete (AC) layer plays a pivotal and critical role in determining the rutting resistance of asphalt pavements[19,20]. In-depth research has indicated that thinner AC layers[21], for example, those with a thickness of 12 cm, are extremely sensitive to temperature variations. The concentrated interlayer shear stress in these thinner layers makes them highly prone to early-stage rutting. When the temperature rises, the asphalt in the thin layer softens more easily, and the shear stress caused by vehicle loads can quickly lead to deformation.
On the contrary, thicker AC layers, such as those with a thickness of 48 cm, possess a stronger load diffusion capacity. They can spread the load over a larger area, reducing the stress concentration at a single point. However, under long-term heavy loading, even these thick layers may undergo structural fatigue deformation. The repeated application of heavy loads gradually weakens the internal structure of the asphalt layer, leading to fatigue cracks and rutting over time.
To more intuitively illustrate the composition and characteristics of these eight typical structures, this study presents a longitudinal cross-sectional view of the typical structures (Fig. 1). This figure meticulously details the material composition of each structural layer. For the asphalt mixture in the AC layer, different types have different performance characteristics, such as penetration grade and viscosity. In the base course, the proportion of cement-stabilized macadam affects its strength and stability. The corresponding thicknesses of each layer, including the base course and subbase beneath the AC layer, are also clearly shown. This visual representation clearly demonstrates the synergistic relationship between 'AC layer thickness and base course type' in different design schemes. It provides a visual support for engineers and researchers to understand how structural design impacts the rutting evolution of asphalt pavements.
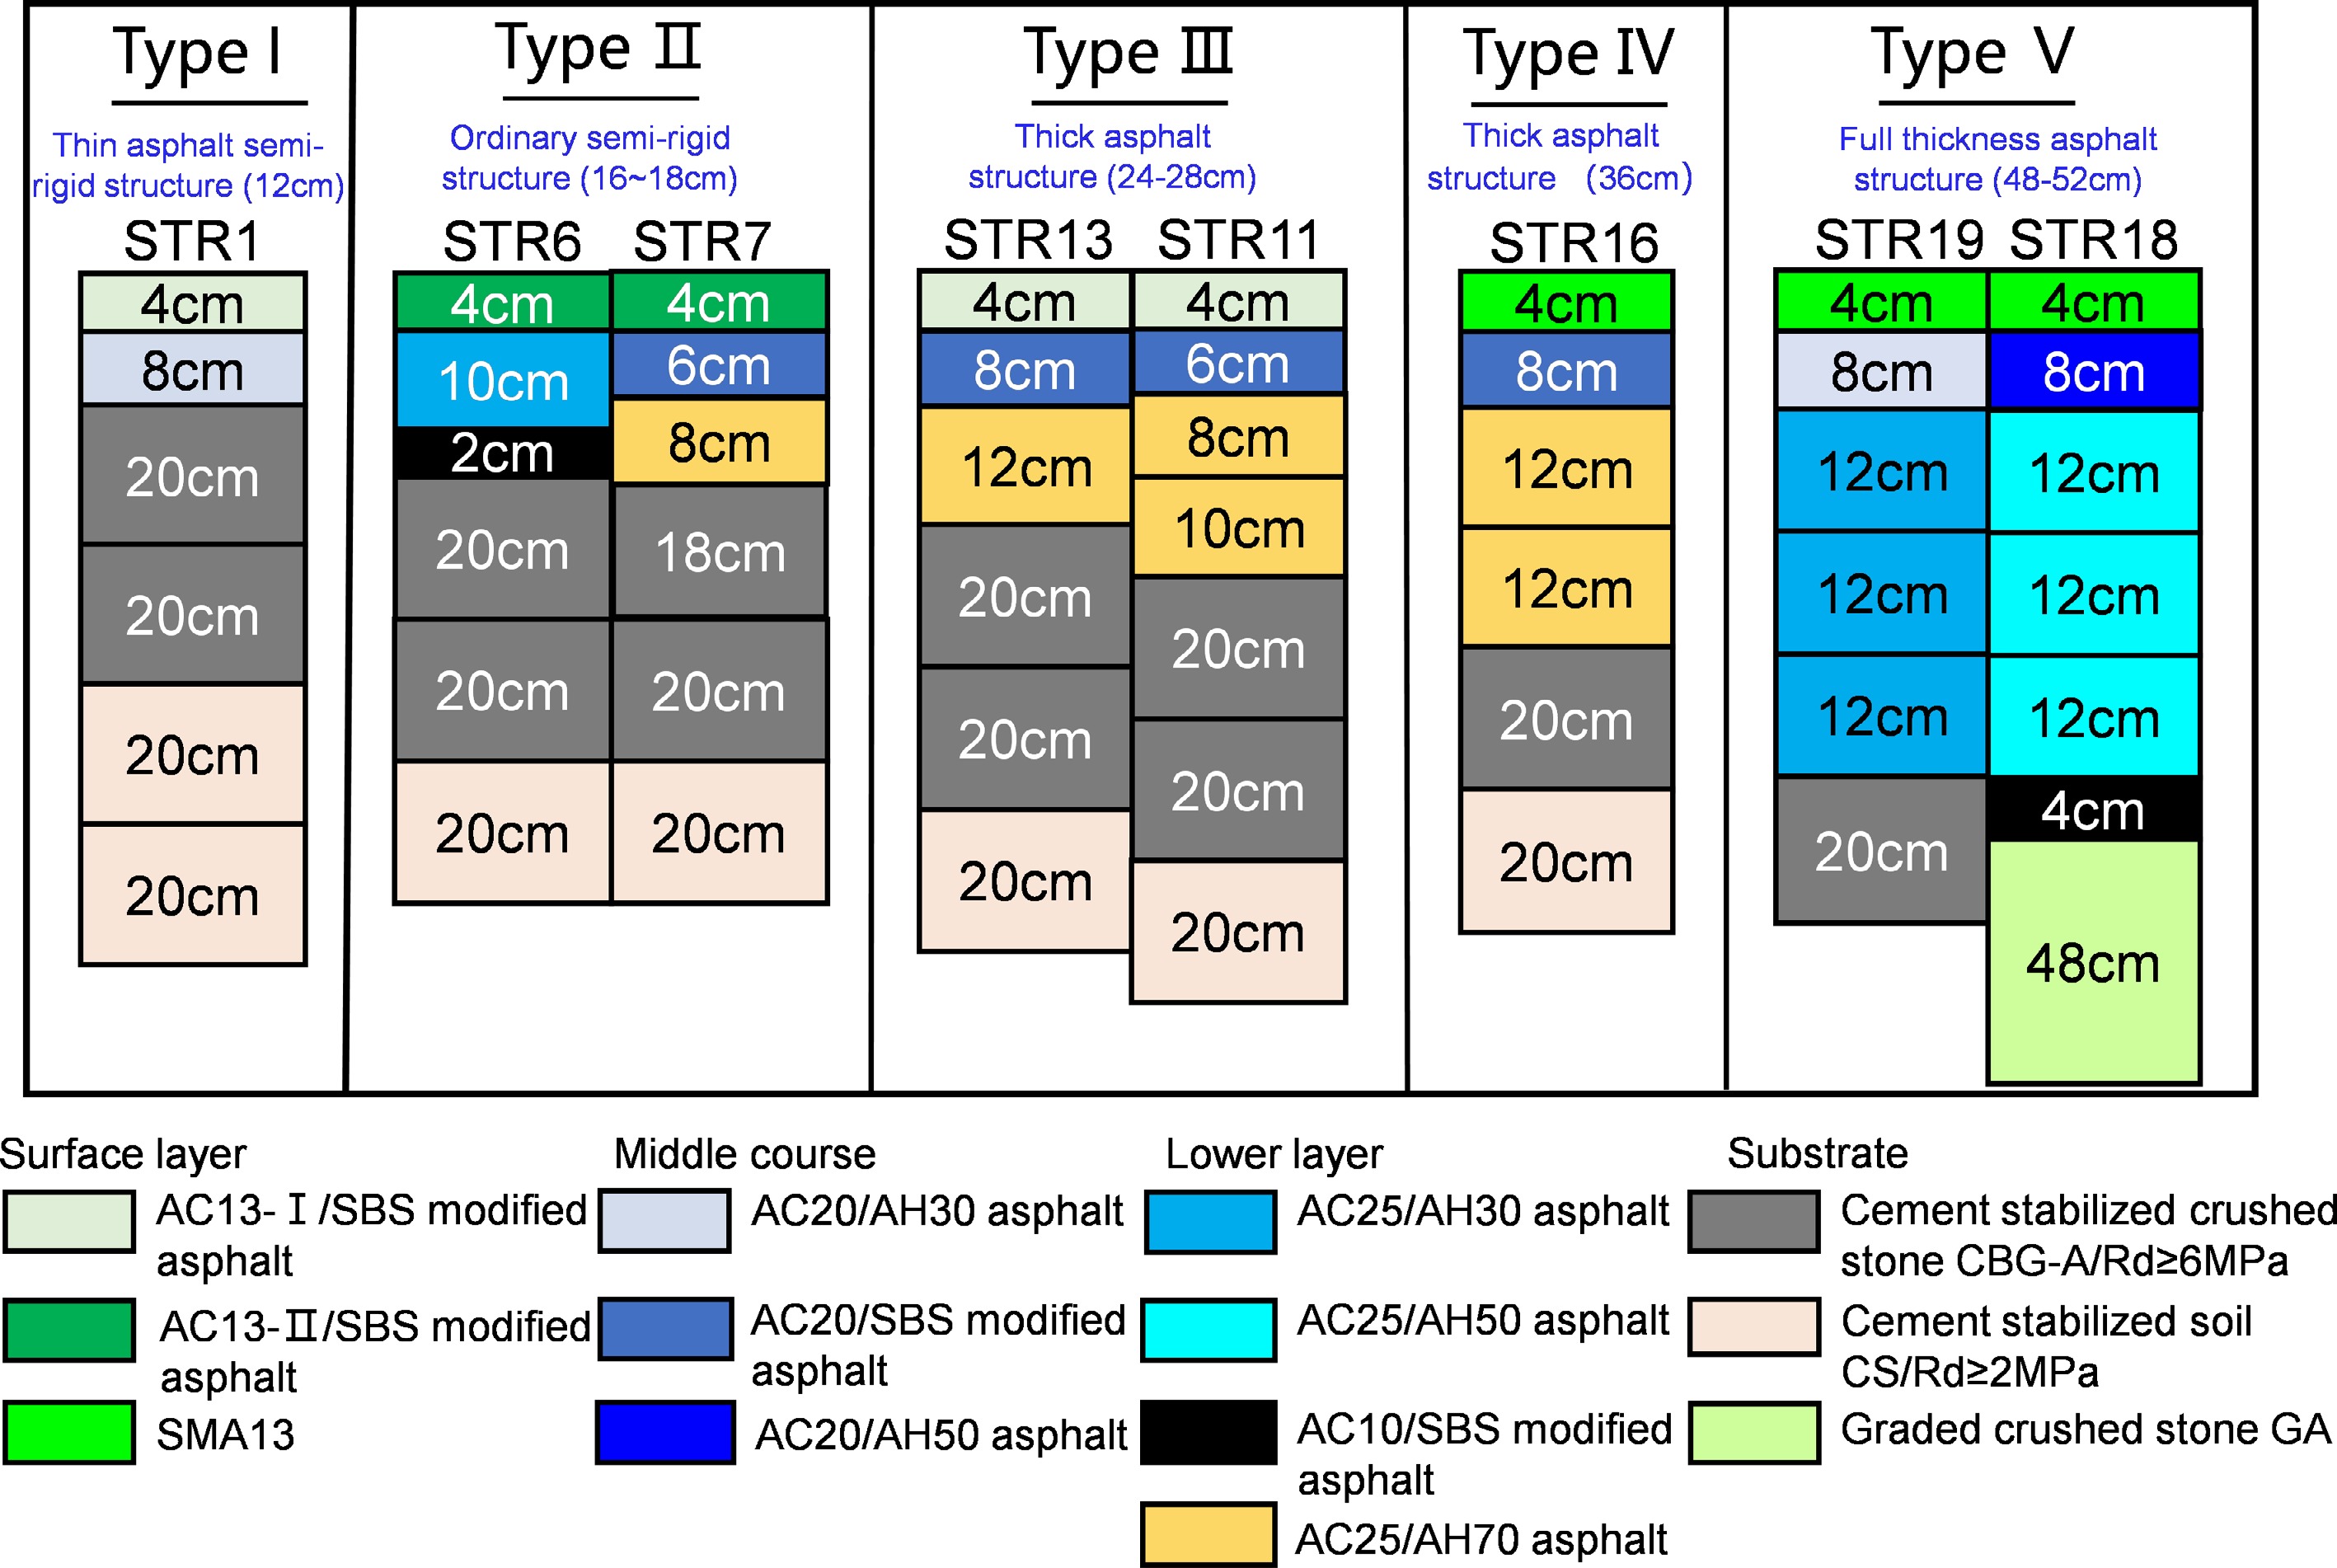
Figure 1.
Longitudinal section of typical structure.
The selected structures, namely STR1 (total AC layer thickness of 12 cm, thin asphalt-semi-rigid structure), STR6 and STR7 (16–18 cm total AC layer thickness, ordinary semi-rigid structures), STR13 and STR11 (24–28 cm total AC layer thickness, thick asphalt structures), STR16 (36 cm total AC layer thickness, thick asphalt structure), and STR19 and STR18 (48–52 cm total AC layer thickness, full-thickness asphalt structures), cover a broad range of AC layer thicknesses. Moreover, they include various types, such as semi-rigid base courses. This selection method allows for a comprehensive investigation of rutting characteristics under different thickness conditions. By analyzing the rutting evolution mechanism under the synergistic effect of base course type and AC layer thickness, the research findings can provide extensive engineering guidance.
These structures are uniformly distributed on the RIOHTrack test loop. During the test, environmental interference and loading conditions are strictly controlled. The long-term observation data are complete and consistent, without significant missing values or anomalies. This reliable data foundation is crucial for accurately revealing the laws of rutting development. As a result, the research conclusions can directly support design and maintenance decisions for asphalt pavements of different thicknesses in engineering practice.
-
The DSAN proposed in this study adopts a parallel dual-branch architecture, enabling multi-scale temporal feature analysis and key information focusing through differentiated processing pathways. As illustrated in Fig. 2, the model consists of two functionally distinct branches working in synergy.
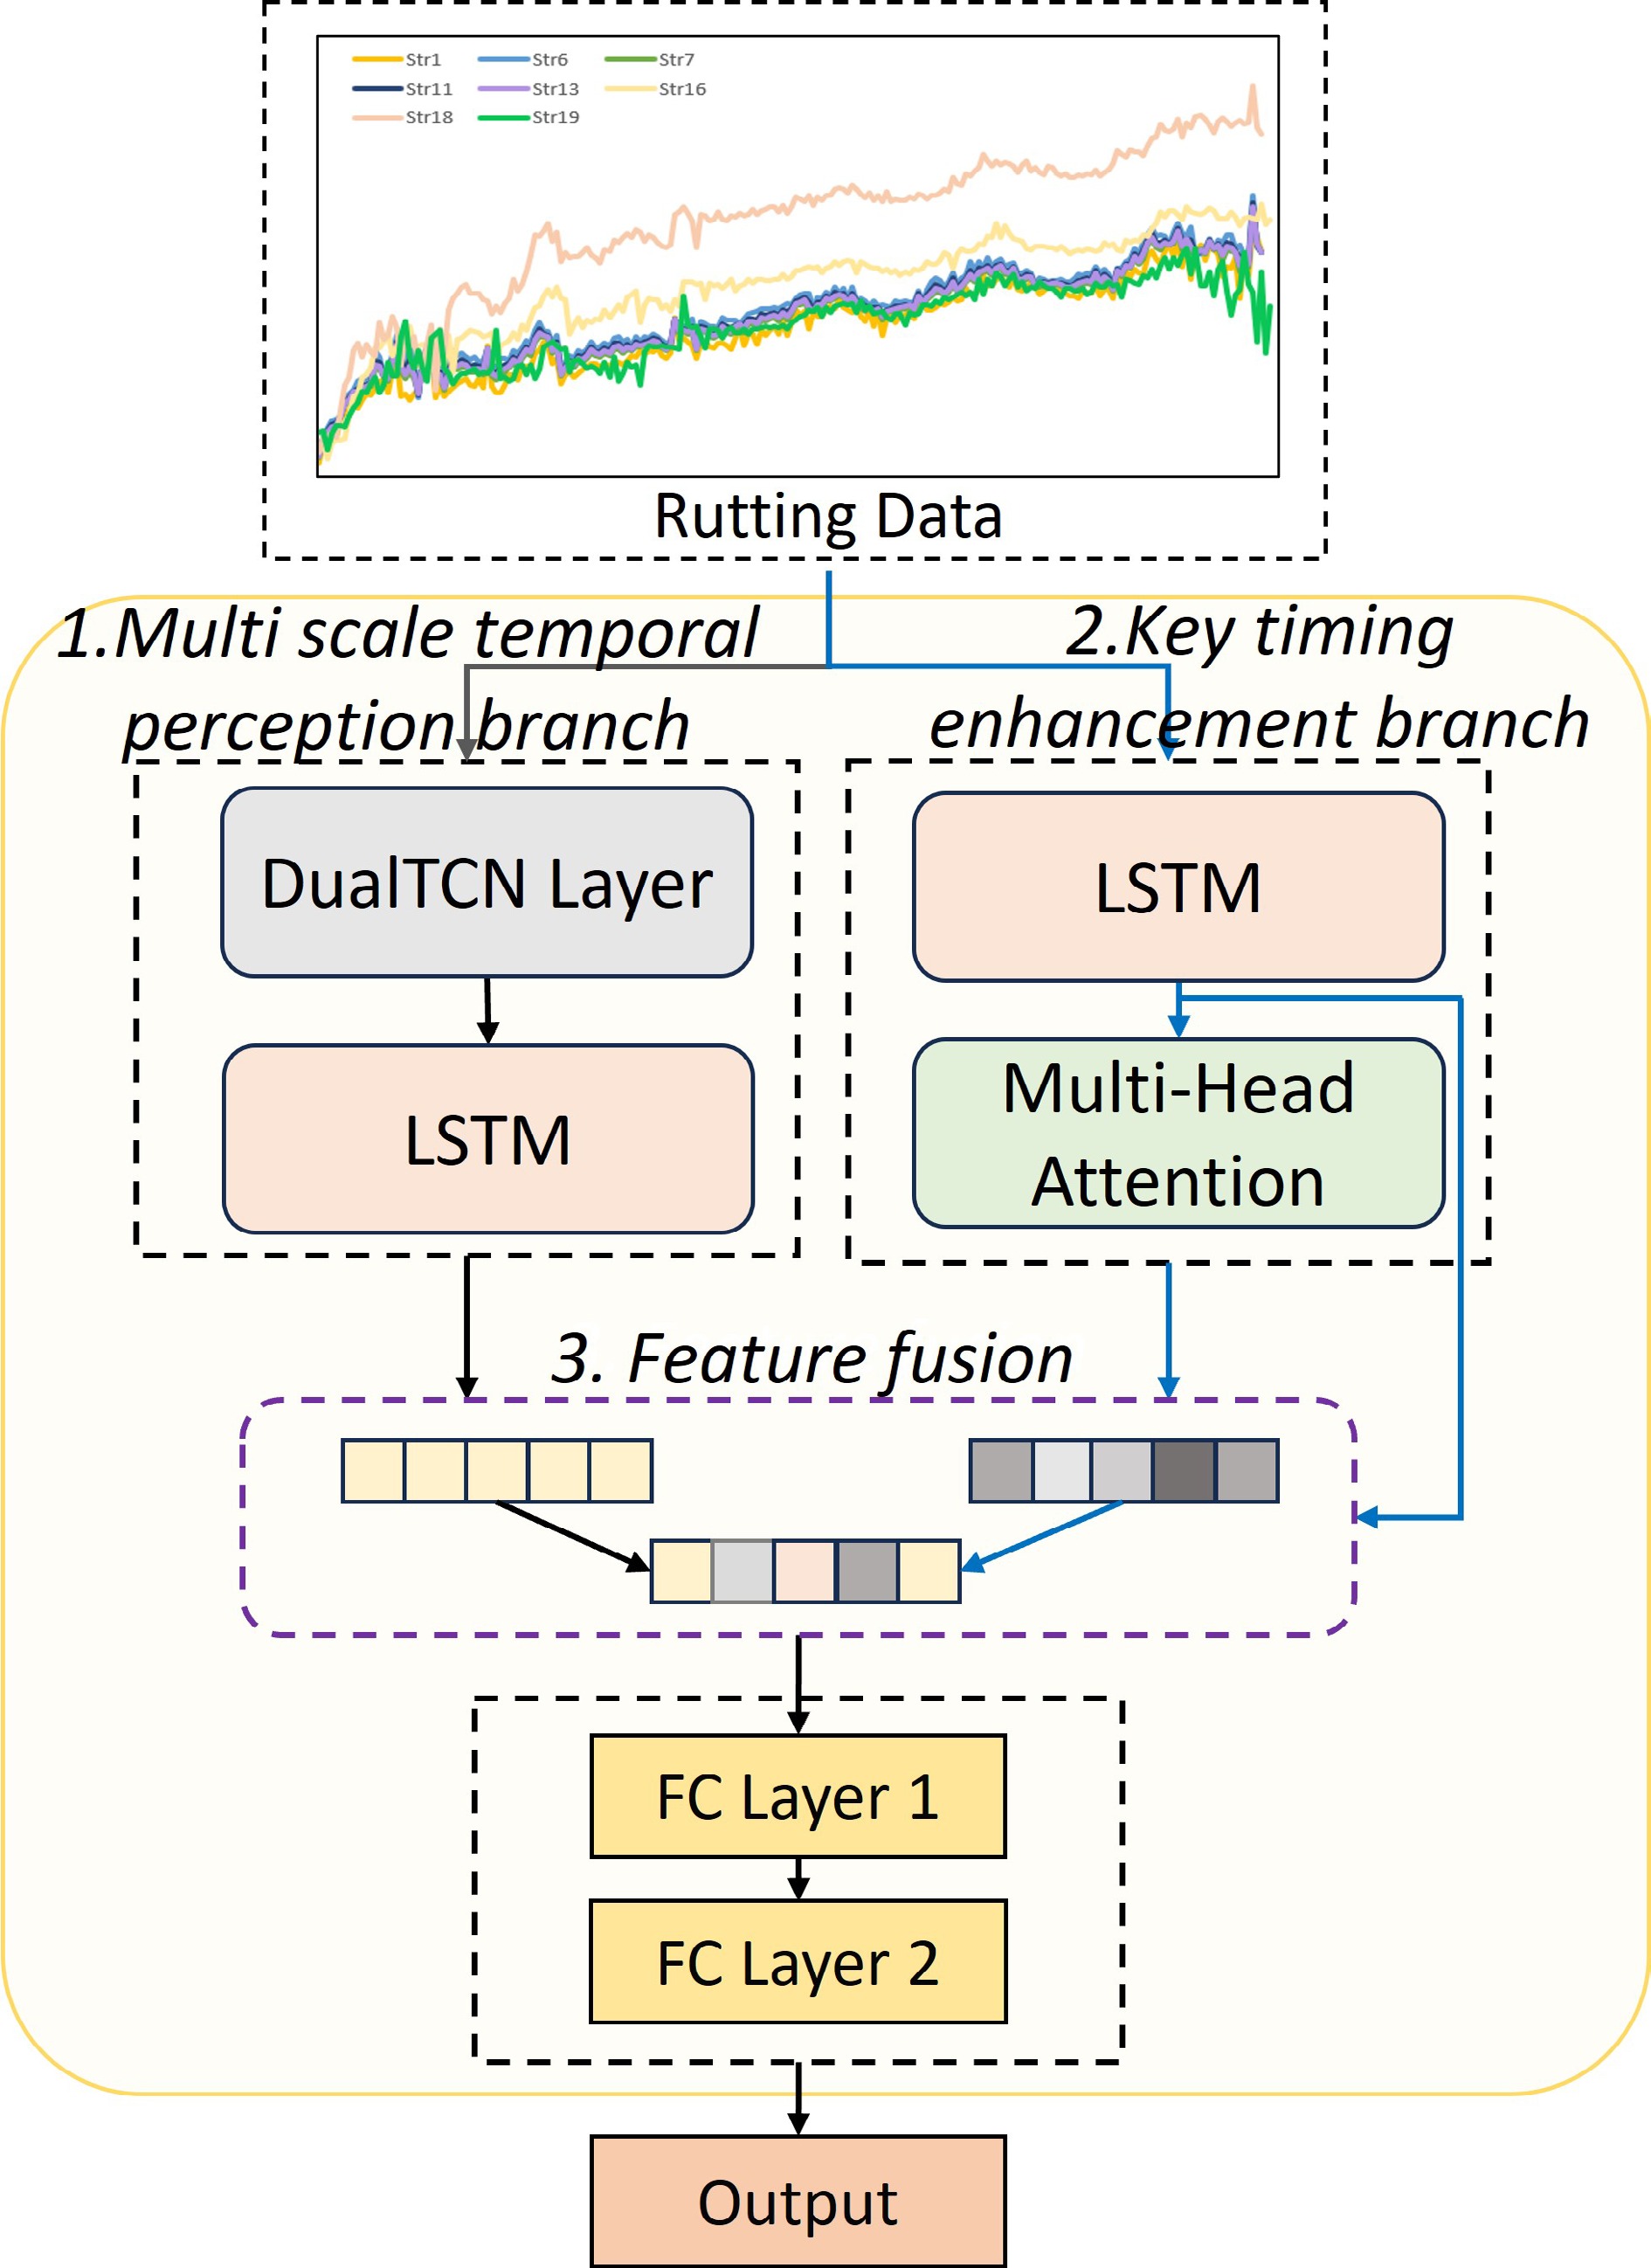
Figure 2.
DSAN model overall architecture diagram.
The left multi-scale time series sensing branch integrates Dual Temporal Convolutional Networks (DualTCN) with LSTM: the DualTCN module, via its hierarchical dilated convolutions, extracts fine-grained local fluctuation features (e.g., short-term temperature spikes and load pulses), while the LSTM component captures long-term evolutionary trends.
The right key time series enhancement branch first employs LSTM to encode global sequence dependencies, then introduces a multi-head attention mechanism to dynamically calibrate weight coefficients of critical time steps, thereby amplifying the model's sensitivity to impactful variables.
Following feature concatenation of the outputs from both branches, a fully connected layer with dropout regularization performs dimensionality reduction and nonlinear mapping to generate the final rutting depth prediction, ensuring robust generalization across diverse pavement conditions.
Design of parallel dual-branch architecture
Multiscale temporal-aware branching
-
This branch realizes the multi-scale feature analysis of the rutting depth sequence through the combination of time-series convolution and sequence modeling. Through a one-dimensional convolution operation of a two-layer TCN, the receptive field is expanded layer by layer on the time axis to capture the real-time rutting deformation increment and short-term local fluctuation characteristics in the rutting depth sequence. Its parallel computing characteristics can avoid the gradient disappearance problem of traditional RNNs and improve the efficiency of long sequence training. The subsequent LSTM layer further encodes the temporal features of DualTCN output, extracts the long-term trend of rutting evolution, and forms a feature representation containing multi-scale temporal information.
The definition of TCN is as shown in Eq. (1), which is formed by stacking multiple temporal blocks.
$ {\text{TCN}}\left(x\right)=\prod\nolimits_{i=1}^N{\text{Temporal block}}_i\text{}\left(x\right) $ (1) In this context, is the number of layers and the expansion coefficient of each layer dilationi = 2i. The structure of the temporal block is shown in Fig. 3. One-dimensional expansion convolution is performed through a two-layer sequential convolution network. The first layer uses a convolution core with a core size of 3 and an expansion rate of 1 to capture local fluctuations in nearly 3 time steps. The second layer expands the receptive field to 7 time steps through a convolution core with a core size of 3 and an expansion rate of 2, which can extract the characteristics of cross-month short-term trends. The parallel computing feature avoids the gradient disappearance problem of traditional RNN and improves the efficiency of long sequence training. The subsequent LSTM layer further encodes the timing characteristics of TCN output.
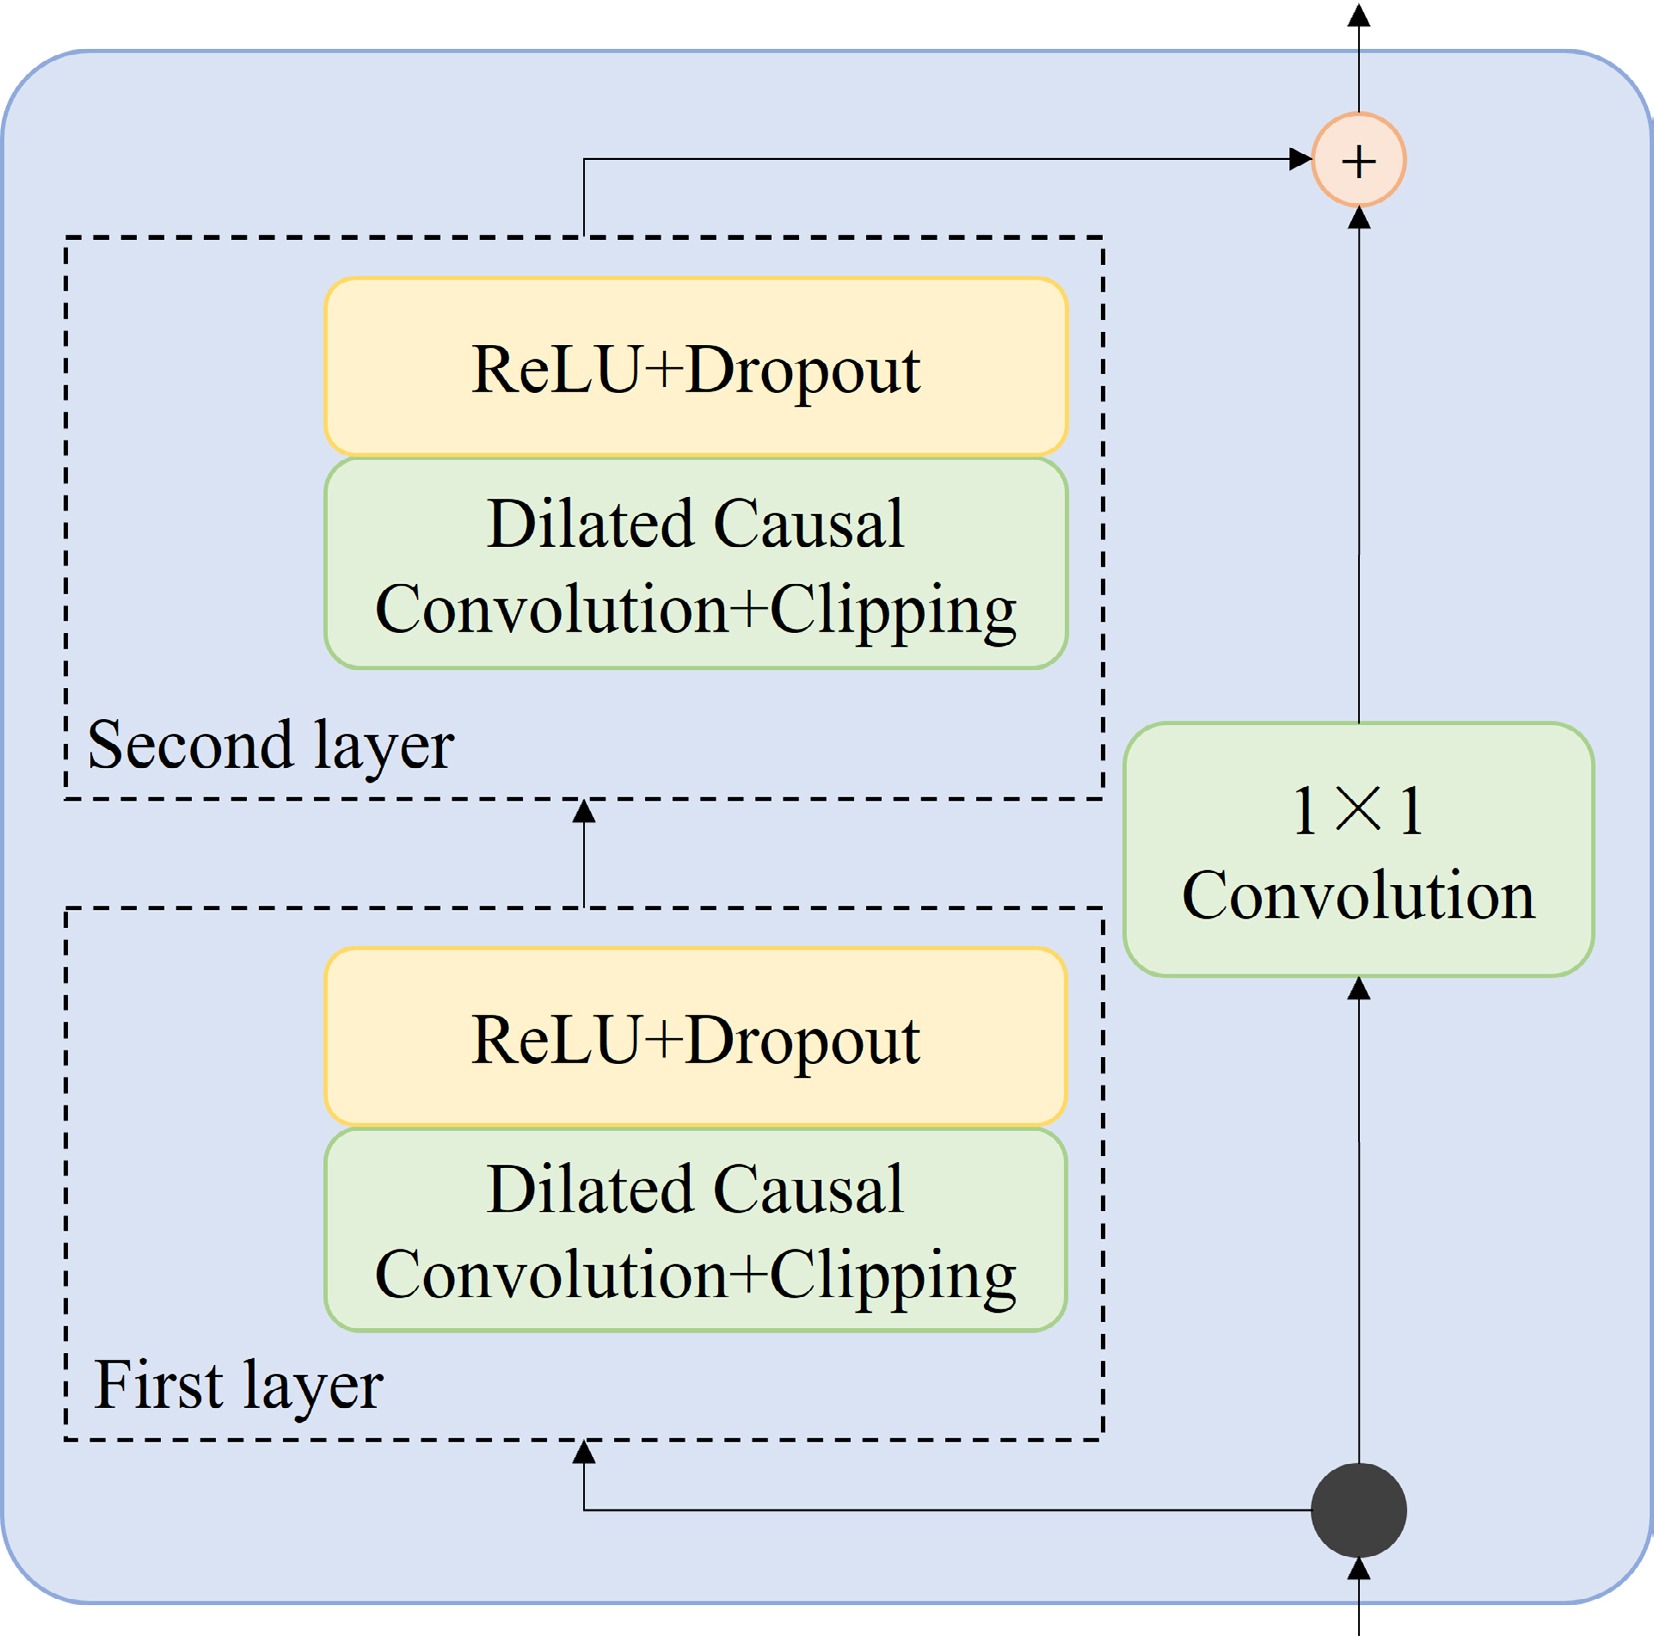
Figure 3.
DualTCN temporal block structure.
Key timing enhancement branch
-
This branch enhances the feature capture of the key time steps of rutting evolution through the sequence coding and multi-head attention mechanism. After extracting the global dependency of the sequence through the LSTM layer, the multi head attention mechanism is introduced to dynamically calibrate the weight of the time steps of the hidden state, so that the model can adaptively focus on the key time points such as load mutation, temperature and Humidity Cycle Peak, and strengthen the feature capture ability of the rutting accelerated evolution stage.
Firstly, the global dependence of the input time series is extracted independently through the LSTM layer, and the hidden states of each time step are output; then the multi head attention mechanism is introduced, which is defined as Eq. (2):
$ Q,K,V={W}_{q}\text{}X,{W}_{k}\text{}X,{W}_{v}\text{}X $ (2) In this context,
$ X\in {\mathbb{R}}^{B\times N\times C} $ $ {W}_{q}\text{},{W}_{k}\text{},{W}_{v\text{}}\in {\mathbb{R}}^{C\times C} $ Next, the feature dimension C is divided into H heads (C = H × dh), and each head independently calculates attention using Eq. (3):
$ \text{Attention}\left(Q,K,V\right)=\text{Softmax}\left(\dfrac{QK^{\ast}}{\sqrt{d_h}}\right)V $ (3) In this context, dh is the dimension of each head,
$ \sqrt{{d}_{h}} $ The multi-head attention mechanism can dynamically calculate the time step weight, and adaptively focus on the key time sequence points such as load mutation and high temperature peak; finally, normalize and stabilize the feature distribution layer by layer to strengthen the feature capture of the rutting acceleration stage.
Feature fusion and prediction head
-
The final prediction of the two output features is achieved by cross-branch splicing and nonlinear mapping.
(1) Feature stitching: the multi-scale time series perception feature vector of the TCN-LSTM branch, the key time series enhancement feature vector of the LSTM-MHA branch, and the original time series hidden state feature vector are stitched in the feature dimension to form a comprehensive feature vector that integrates multi-scale time series information and key time sequence weighted features.
(2) Fully connected prediction head: complete nonlinear mapping through a two-layer fully connected network. Specifically, FC Layer 1 is structured as [256, 128] (mapping the comprehensive feature vector to 128 dimensions), and a dropout strategy (dropout rate set to 0.3) is added after FC Layer 1 to suppress overfitting by randomly deactivating part of the neurons during training. FC Layer 2 is structured as [128, 1], further mapping the 128-dimensional features to the final output dimension, as shown in Eq. (4), and outputting the rutting depth prediction value
$ {\hat{y}}_{RD} $ $ {\hat{y}}_{RD}=F{C}_{2}\left(ReLU\left(F{C}_{1}\left(Fea{t}_{Concat}\right)\right)\right) $ (4) The architecture realizes the multi-level learning of local details, global trends, and key incentives in the rutting evolution process through the dual branch feature complementation and dynamic weight calibration mechanism, and provides a reasonable framework for high-precision prediction under complex load conditions.
-
In order to train the DSAN model, the hardware environment is composed of the 12th-generation Intel® Core™ I5-12500 CPU. The development environment uses a Windows 11 64-bit system and has an integrated development environment, Anaconda 2.3.2, and Jupyter 6.0.1. The programming language used is Python 3.6, and some machine learning libraries use Tensorflow 2.1.0 Framework. In addition, Keras 2.2.4 under Tensorflow 2.1.0 is used as a deep neural network framework.
In this study, the entire rutting dataset is divided into a training set and a test set to ensure the generalization ability of the model. Specifically, 220 samples are selected as the test set to simulate the model's performance on unseen data; the remaining samples are used as the training set. During the splitting process, the data distribution of the training set and test set is kept consistent with the original dataset to avoid overfitting caused by uneven data distribution.
Key hyperparameters of the DSAN model are determined through multiple pre-experiments to balance model performance and training efficiency. Specific hyperparameter values are summarized in Table 2. In terms of computational performance, the model has a total of 201,854 parameters and occupies 0.77 MB of memory. The training time is 1,124,705 ms, and the inference time per sample is 60 ms.
Table 2. Hyperparameters for model training.
Parameter name Value Look_back 12 Hidden_dim 128 Layers of TCN 2 Layers of LSTM 1 Heads of MSA 8 Learning_rate 0.001 Evaluating indicator
-
For regression prediction tasks, the determination coefficient R2, mean absolute error MAE, root mean square error RMSE, and determination coefficient are often used as indicators to evaluate the results. The RD prediction of the target rutting depth in this study belongs to the regression problem, so R2, MAE, and RMSE are selected as the basis for judging the quality of the model. The calculation of evaluation indexes of each prediction model is shown in Eqs (5)–(7).
$ {R}^{2}=1-\dfrac{\displaystyle\sum\limits_{i=1}^{n}{({{y}_{i}}-{{y}_{ip}})}^{2}}{\displaystyle\sum\limits_{i=1}^{n}{({{y}_{i}}-\overline{y})}^{2}} $ (5) $ MAE=\dfrac{1}{n}\sum\limits_{i=1}^{n}\left| {y}_{ip}-{y}_{i}\right| $ (6) $ {\textit{RMSE}}=\sqrt{\dfrac{1}{n}\sum\limits_{i=1}^{n}{({{y}_{i}}-{{y}_{ip}})}^{2}} $ (7) where, yi and yip are the real value and predicted value of rutting respectively; n represents the total number of samples.
Analysis of experimental results
-
To intuitively display the prediction effect, error analysis is carried out on the typical samples of the test set, as shown in Fig. 4.
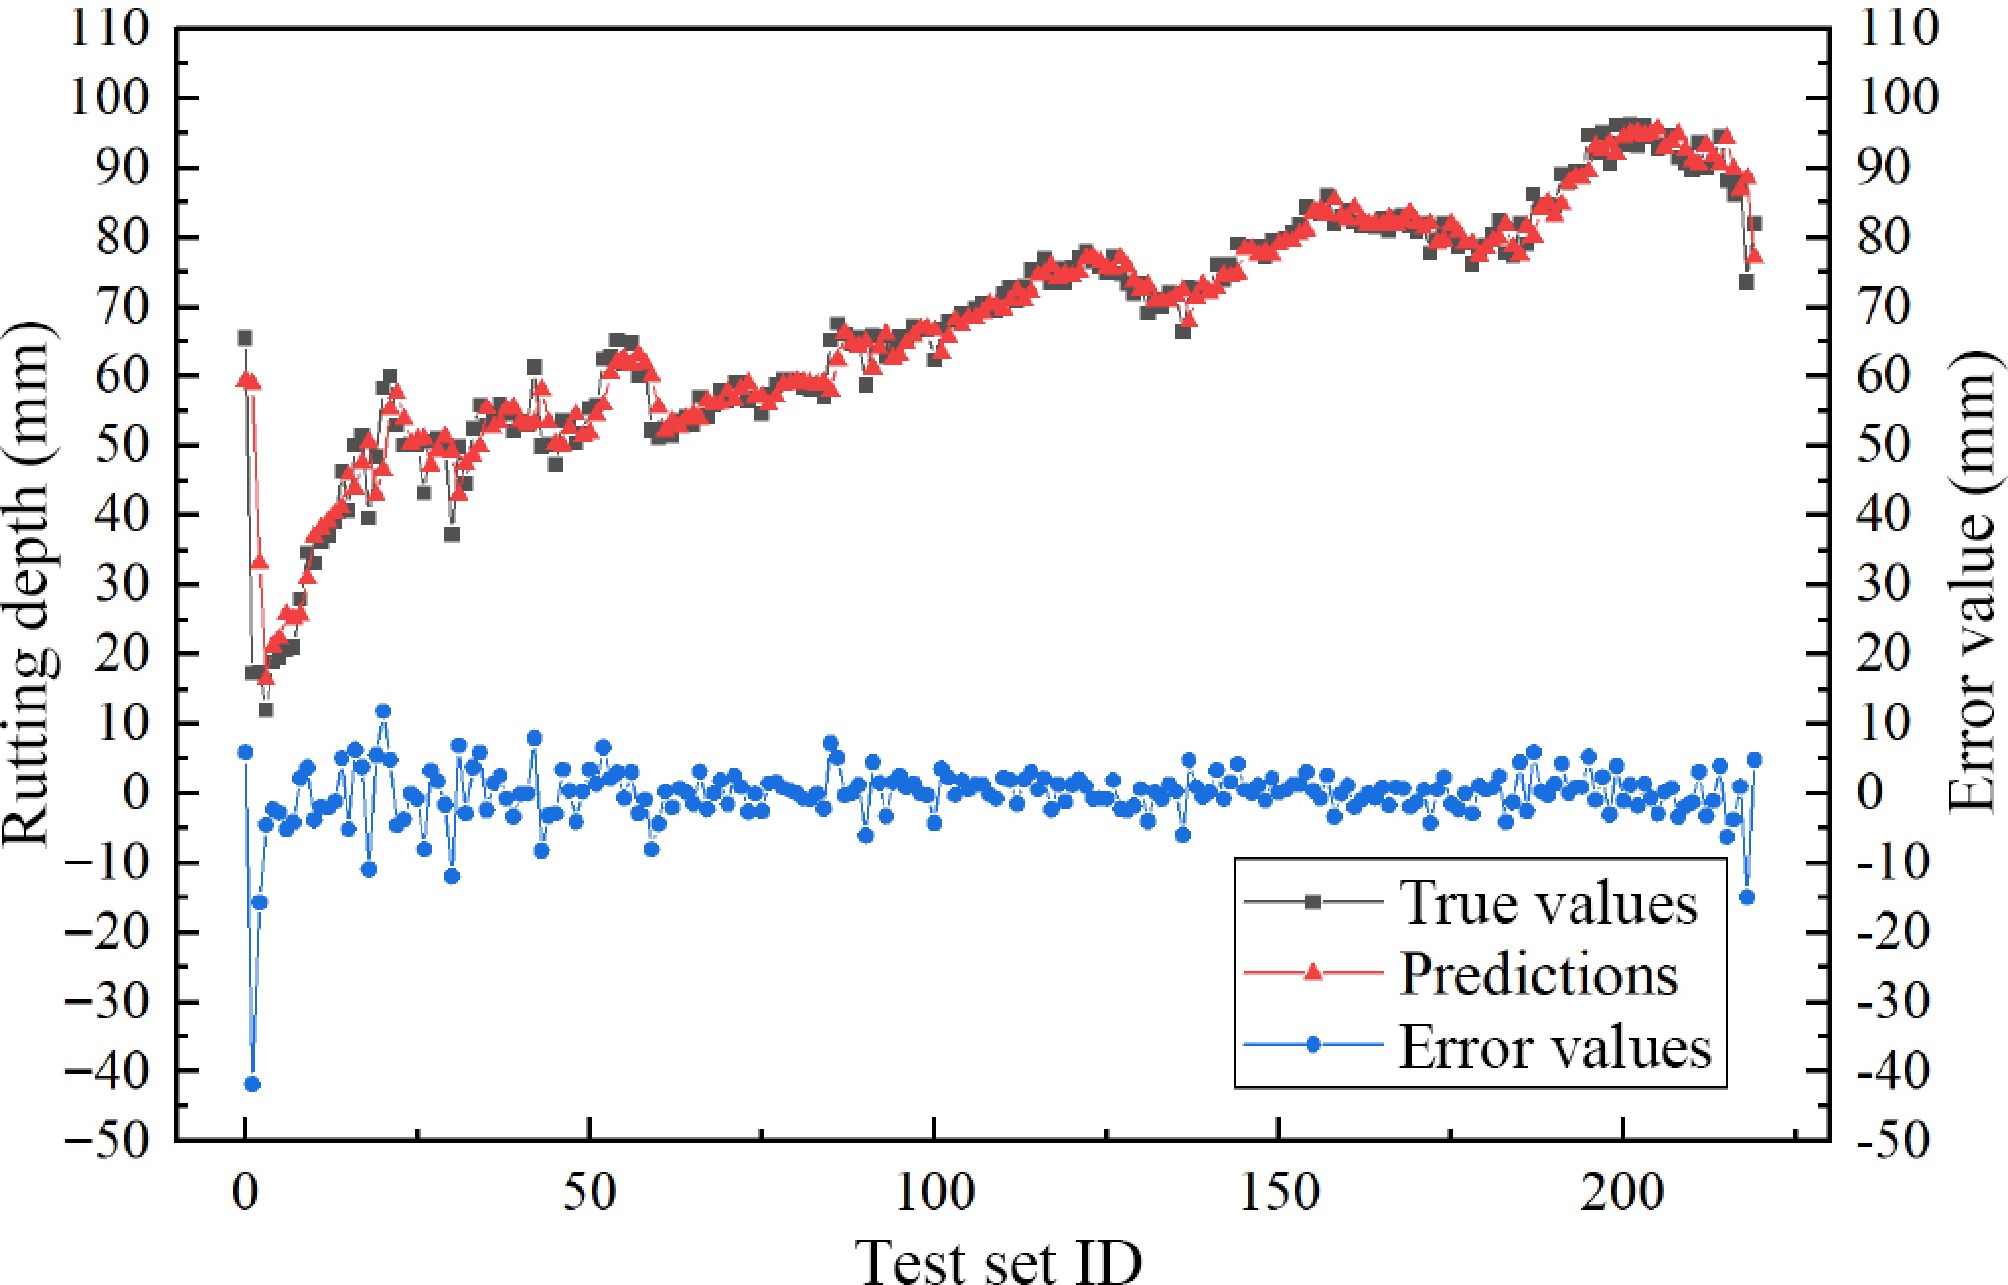
Figure 4.
Comparison of observed and predicted values.
It can be seen from Fig. 4 that the predicted value is highly consistent with the observed value, and the scattered points are closely around the 1:1 trend line without significant deviation or outliers, indicating that the model accurately captures the load deformation relationship, and the prediction is stable in different layer thicknesses and load scenarios. The error distribution is uniform and controllable, the positive and negative errors are balanced, and the amplitude is within the acceptable range of the project. The dual-branch architecture effectively suppresses the extreme error through hierarchical modeling and avoids the scene adaptability deviation of the traditional model.
To further verify the superiority of the proposed DSAN model in asphalt pavement rutting prediction, this paper selects three typical models: single LSTM, TCN-LSTM combination model, and single branch LSTM-HA for comparative experiments. All models were trained using the same rutting dataset for parameter tuning and training. R2, MAE, and RMSE were used as performance evaluation indicators to conduct regression prediction on a unified test set. Combined with Fig. 5 (scatter plot of rutting depth prediction and actual values for each model) and Table 3 (comparison table of model performance indicators), a comparative analysis of multidimensional indicators and visualization results was completed.
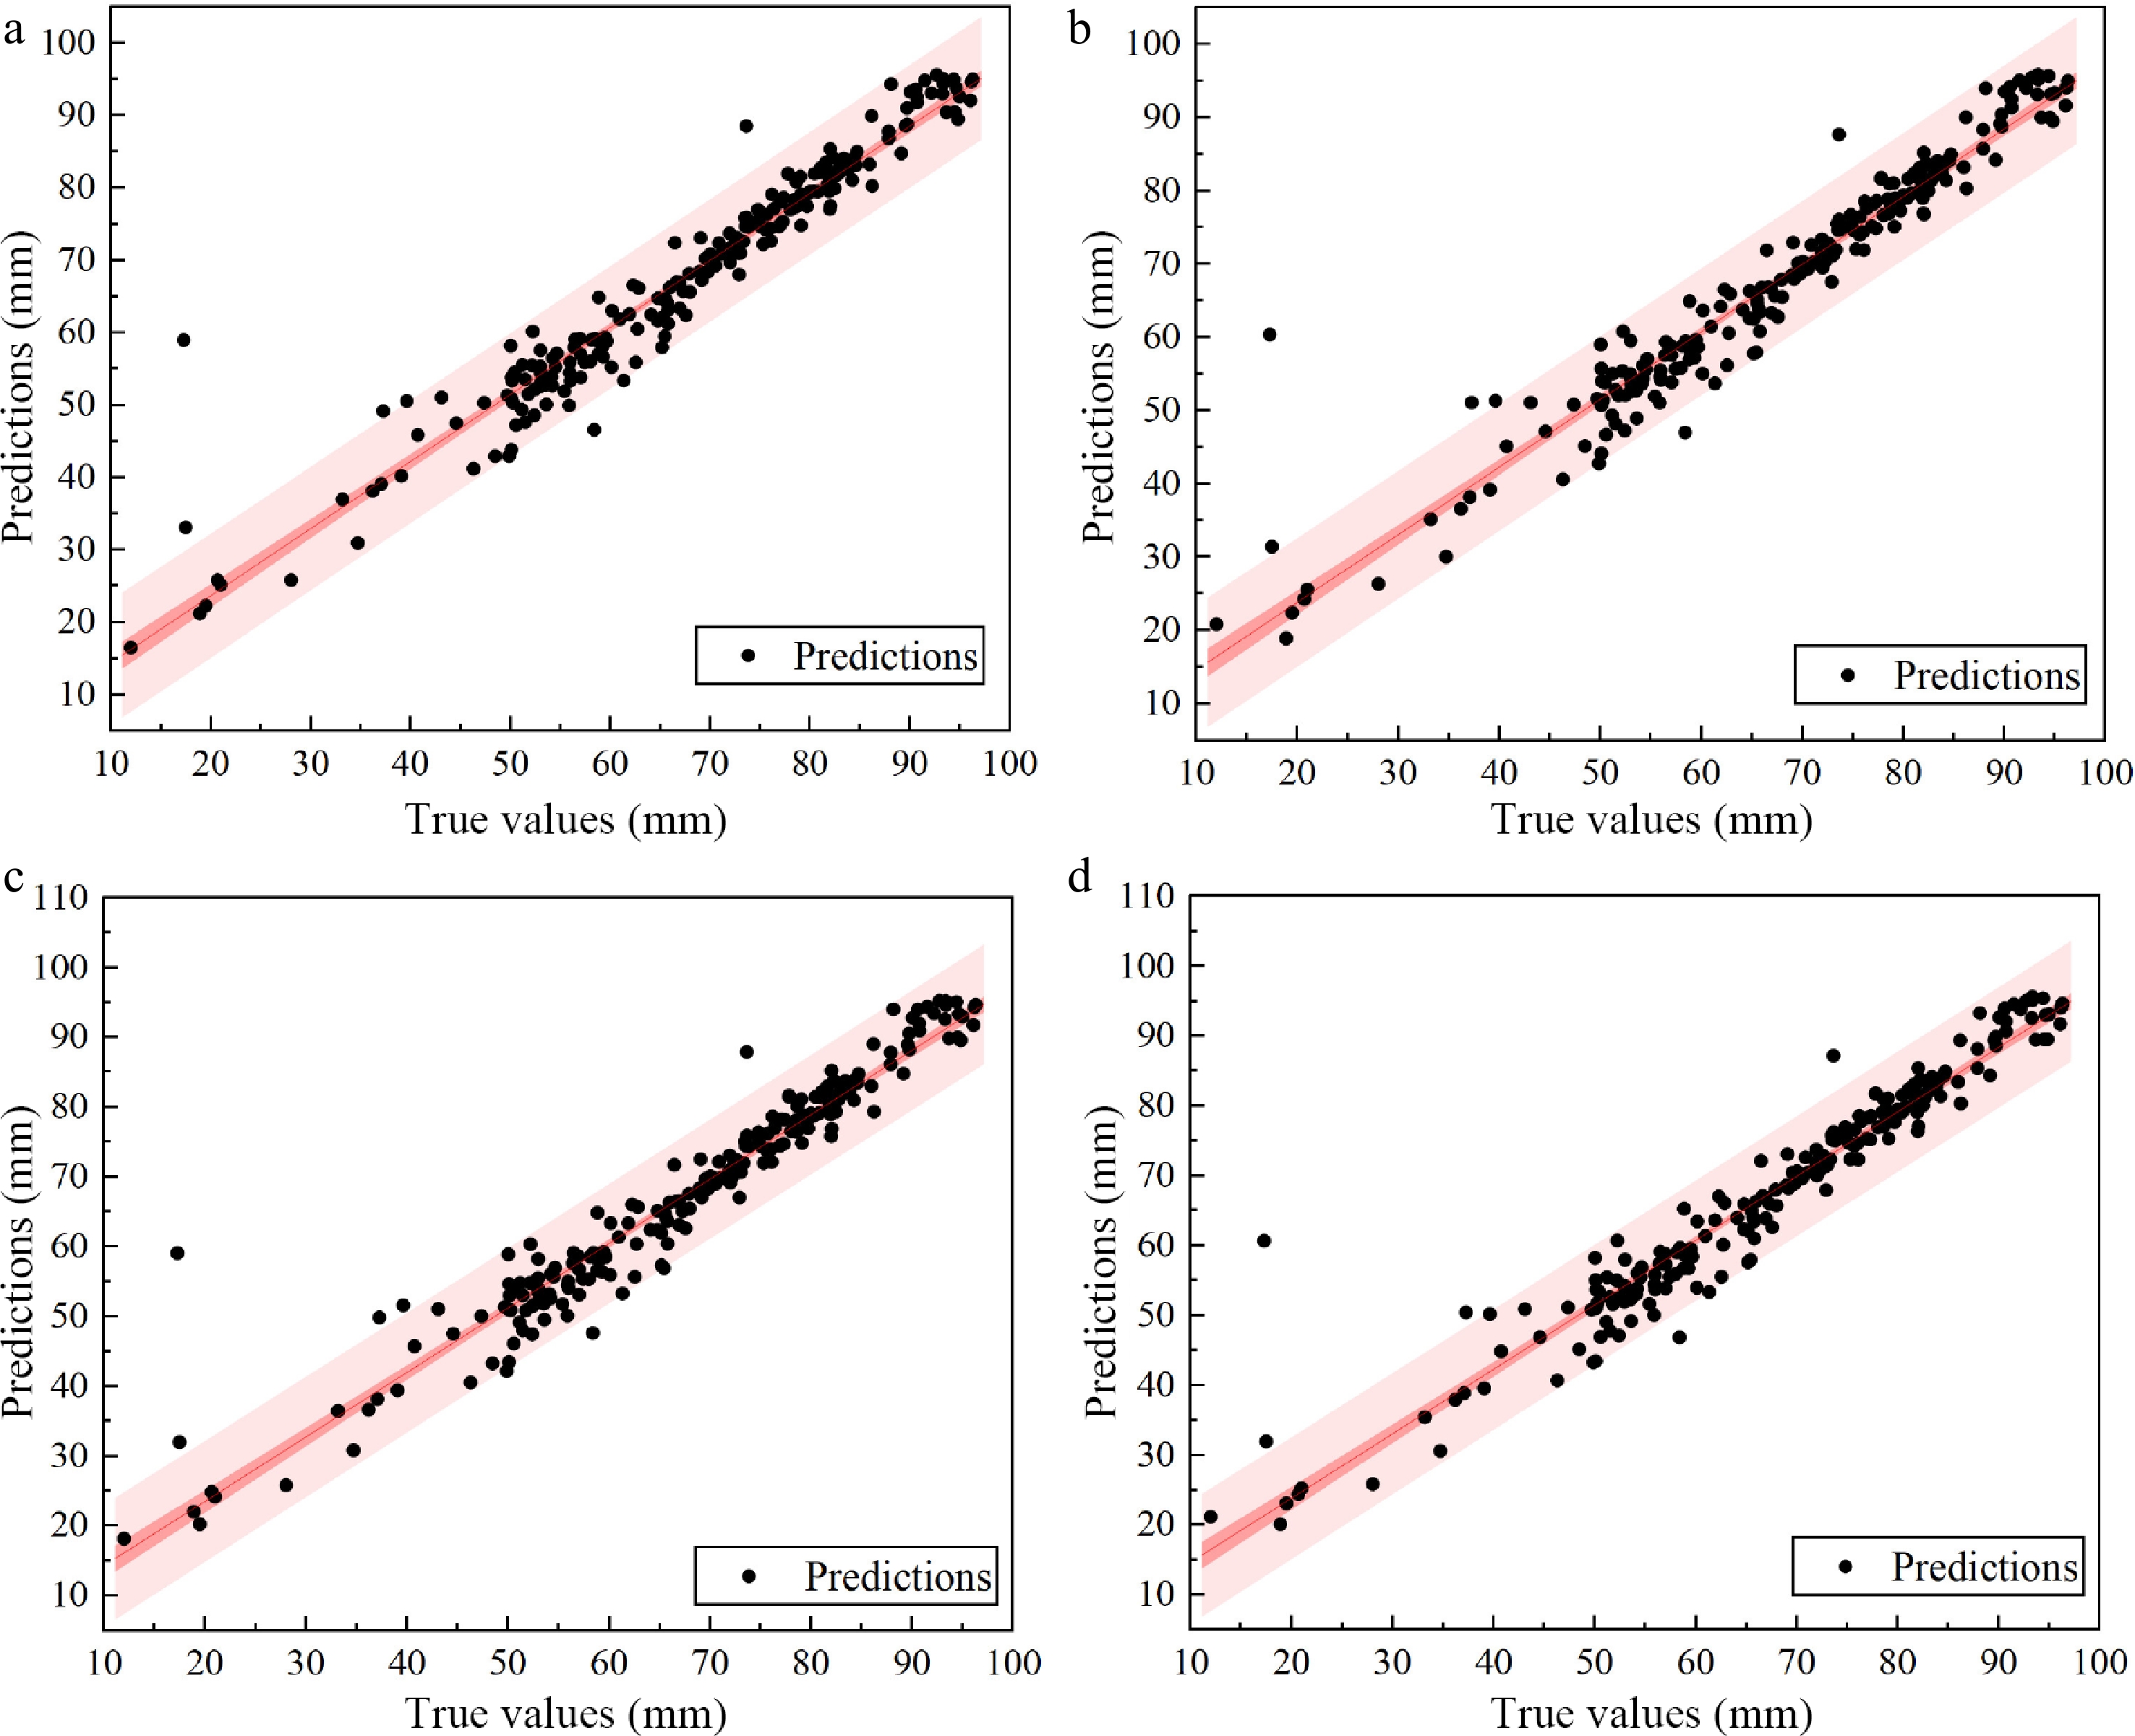
Figure 5.
Effect of scatter diagram of each model. (a) DSAN. (b) LSTM. (c) LSTM-Attn. (d) TCN_LSTM.
Table 3. Comparison of the prediction performance of various models.
Model RMSE MAE R2 LSTM 4.581 2.696 0.93 TCN_LSTM 4.527 2.728 0.932 LSTM_Attn 4.562 2.665 0.931 DSAN 4.272 2.452 0.943 From the test results, it can be seen that Fig. 5 visually presents the distribution characteristics of prediction bias for each model, while Table 2 quantifies the accuracy differences of different models through RMSE, MAE, and R2. From the quantitative results in Table 3, the DSAN model performs the best among all indicators, with an RMSE of 4.272, which is 0.309, 0.255, and 0.290 lower than single LSTM, TCN-LSTM, and LSTM-HA, respectively; MAE also has a certain degree of reduction compared to the other three types of models, and the reduction is most significant compared to TCN-LSTM; the R2 reaches 0.943, demonstrating its stronger explanatory power for the evolution of ruts. This set of data clearly confirms the advantages of the dual branch collaboration mechanism in integrating multi-scale features and suppressing prediction errors, while the performance of a single model or single branch structure is limited to varying degrees because it is difficult to take into account the coupling relationship between short-term fluctuations and long-term trends.
In addition, Fig. 5, as the visual presentation of the results in Table 3, further intuitively reflects the prediction performance of each model—especially highlighting the effectiveness of the DSAN model's dual-branch architecture in cross-layer thickness prediction. From the scatter distribution in Fig. 5, it can be clearly seen that the predicted values of DSAN are more closely aligned with the actual rutting depth, and the overall prediction deviation is more concentrated; in contrast, the single models (such as LSTM, TCN-LSTM) and single-branch model (LSTM-MHA) show more scattered deviation points in some thickness scenarios. This visual difference not only verifies the advantage of DSAN in suppressing prediction errors but also intuitively confirms that its dual-branch design can avoid the blind spots of single models in capturing feature information of specific thickness scales, thereby maintaining stable prediction performance across different layer thickness structures.
Ablation experiment
-
To comprehensively verify the effectiveness of DSAN's core components, dual-branch collaboration mechanism, and adaptive performance across pavements with varying AC layer thicknesses (thin/medium/thick), this study designs a systematic ablation experiment covering multiple model variants as shown in Table 4. Seven models are tested, including TCN-only, LSTM-only, LSTM + MHA-only, DualTCN-only, DSAN (without TCN), DSAN (without MSA), and the complete DSAN. All experiments adopt consistent training/test set division, hyperparameters, and evaluation metrics (RMSE, MAE, R2) to ensure strict comparability of results.
Table 4. Ablation study of proposed models.
Thickness grouping Model Evaluation metric RMSE MAE R2 Thin layer structure group DSAN 5.3 3.32 0.913 TCN-only 5.721 3.632 0.898 LSTM-only 5.573 3.541 0.903 LSTM + MHA-only 5.424 3.44 0.908 DualTCN-only 5.514 3.53 0.904 DSAN (without TCN) 5.628 3.579 0.902 DSAN (without MSA) 5.649 3.588 0.9 Middle structure group DSAN 5.514 3.706 0.959 TCN-only 6.626 4.612 0.942 LSTM-only 5.991 4.17 0.951 LSTM + MHA-only 5.629 3.917 0.956 DualTCN-only 6.165 4.29 0.947 DSAN (without TCN) 5.728 3.986 0.955 DSAN (without MSA) 5.93 4.126 0.952 Thick layer structure group DSAN 5.808 3.819 0.958 TCN-only 6.482 4.131 0.947 LSTM-only 6.29 4.01 0.951 LSTM + MHA-only 5.905 3.763 0.956 DualTCN-only 6.391 4.073 0.95 DSAN (without TCN) 5.905 3.763 0.955 DSAN (without MSA) 6.288 4.013 0.951 Table 4 demonstrates that the complete DSAN model outperforms all its variants consistently across thin, middle, and thick asphalt layer groups. It delivers the lowest RMSE and MAE alongside the highest R2, with all metrics consistently exceeding 0.9. This result confirms the irreplaceable synergistic effect of DSAN's dual-branch structure, integrating TCN-based local feature extraction and MHA-based key timing calibration.
The contribution of individual components varies substantially with asphalt layer thickness, a pattern that aligns with the distinct rutting evolution mechanisms of different thickness structures. For thin layer groups where rutting is dominated by rapid temperature-induced deformation, variants lacking TCN functionality exhibit the most pronounced performance degradation, highlighting TCN's critical role in capturing short-term local temporal features essential for modeling temperature-sensitive deformation. In middle-layer groups where rutting is governed by coupled temperature sensitivity and load accumulation, single-component variants experience substantial performance deterioration. Both DSAN without TCN and DSAN without MHA demonstrate inferior performance compared to the complete model, verifying the necessity of TCN-MHA synergy for balancing short-term deformation and long-term evolution. For thick-layer groups where rutting is driven by long-term fatigue accumulation, DSAN without MHA degrades more notably than DSAN without TCN, reflecting MHA's key role in calibrating timing nodes associated with fatigue triggering. Notably, all single-component variants cannot match DSAN's adaptability across different thicknesses, confirming that only the dual-branch integration of TCN and MHA can adapt to the diverse rutting mechanisms of varying asphalt layer structures.
Structure analysis of different structure experiments
-
This section conducts experimental analysis from four dimensions to comprehensively verify the performance of the DSAN model in asphalt pavements with different AC layer thicknesses. These dimensions include thickness-grouped prediction performance comparison, quantitative analysis of thickness-dependent rutting evolution laws, per-structure error distribution and thickness-related variation, and cross-structure/cross-thickness generalization capability (via a leave-one-structure-out, or LOSO, test). The analysis verifies the model's generalization ability to thickness differences, predictive reliability across distinct structures, and ability to capture thickness-dependent rutting patterns. All tests are based on a unified test set encompassing eight typical pavement structures with AC layer thicknesses ranging from 12 to 52 cm.
Comparison of thickness grouping prediction performance
-
The test set is divided into three groups according to the thickness of AC layer: thin layer structure group (12−18 cm, STR1/STR6/STR7), middle layer structure group (24−28 cm, STR11/STR13), thick layer structure group (36−52 cm, STR16/STR18/STR19). By comparing the performance differences between DSAN and the benchmark model LSTM (Table 5), the adaptability of the model to different thickness structures is explored.
Table 5. Comparison of model performance under different thickness groups.
Thickness grouping Model Evaluation metric Relative improvement (%) RMSE MAE R2 RMSE MAE R2 Thin layer structure group DSAN 5.3 3.32 0.913 4.9% 6.2% 1% LSTM 5.573 3.541 0.903 Middle structure group DSAN 5.514 3.706 0.959 8.0% 11.1% 0.8% LSTM 5.991 4.17 0.951 Thick layer structure group DSAN 5.808 3.819 0.958 7.7% 4.8% 0.7% LSTM 6.29 4.01 0.951 It can be seen from the results in Table 5 that respectively, in terms of thickness sensitivity, the LSTM model has a larger prediction deviation for ruts, indicating that the traditional model has a lower prediction accuracy for ruts on roads with different thickness structures. In contrast, the DSAN model has the most significant error reduction in the middle structure group, the relative improvement rates of RMSE and MAE reach 8.0% and 11.1%, respectively. The middle layer pavement has both the response sensitivity of the thin layer and the load-bearing stability of the thick layer, and the module can align the feature distribution of different subdomains in a targeted manner, thereby minimizing the prediction deviation caused by complex feature coupling. The accuracy of the model to capture the deformation resistance balance ability of the medium-thickness structure is verified in terms of model adaptability. The MAE of the DSAN model in the thick layer group is 3.819, which is slightly higher than that of the thin layer group of 3.32, but it still achieves a 4.8% relative improvement compared with LSTM. More importantly, the prediction error of the fatigue cumulative effect of the thick layer structure is significantly lower than that of LSTM, highlighting its modeling ability for the low initial deformation and high long-term cumulative characteristics of the thick layer.
Quantitative analysis of thickness rutting evolution law
-
The relationship between the rutting depth growth rate (Δrd/million esals) and the thickness of different AC layers over time is fitted (Fig. 6), and the influence of thickness is refined through the absolute value distribution of rutting depth change (Fig. 7).
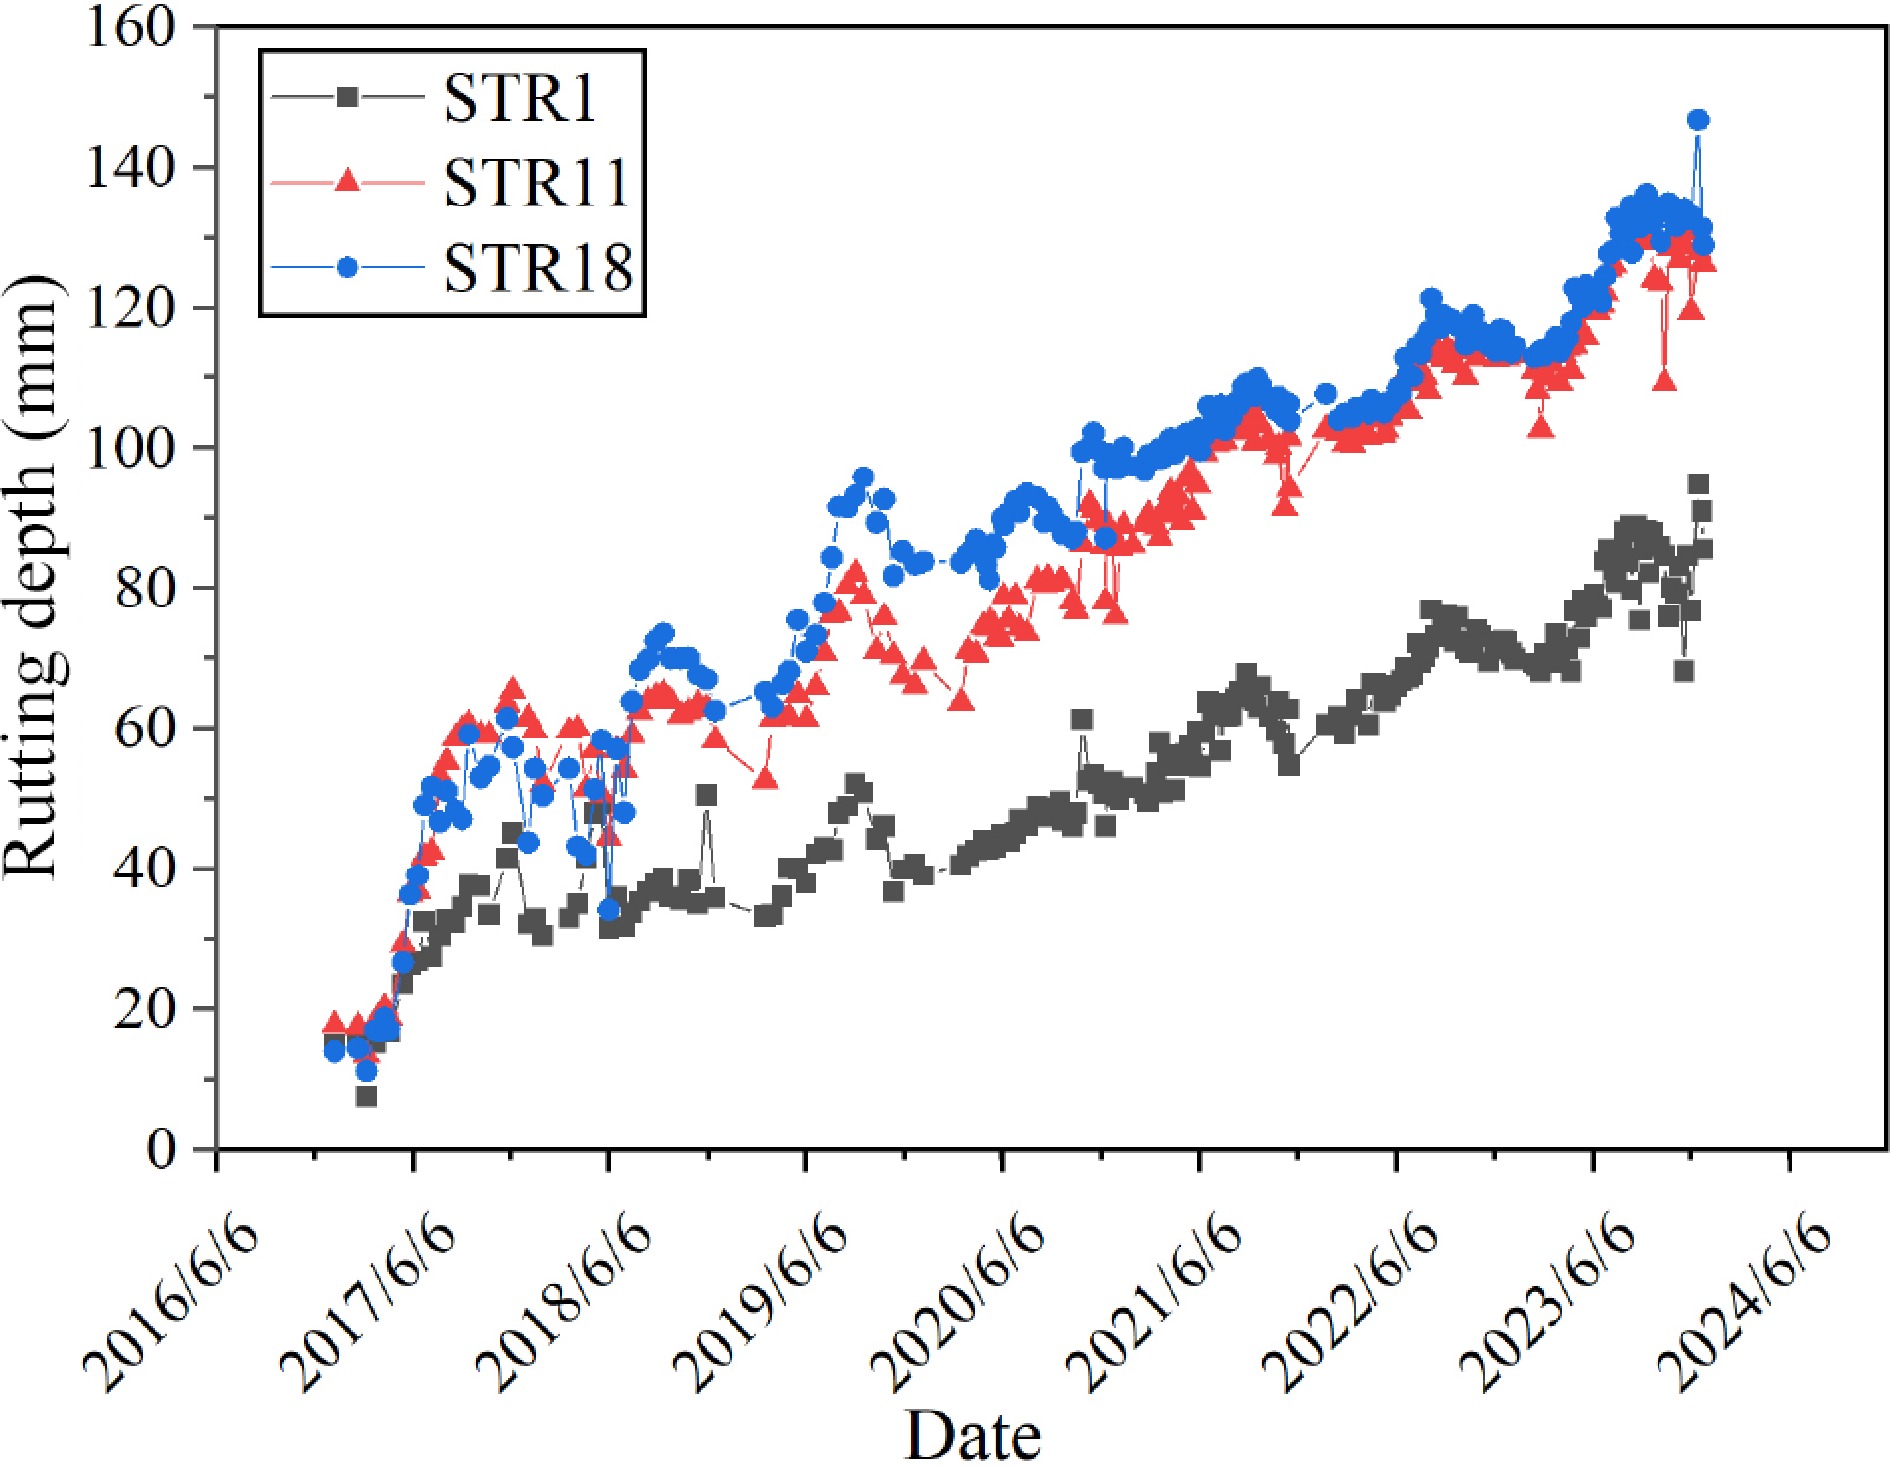
Figure 6.
Comparison of the rutting depth of asphalt structures with different thicknesses over time.
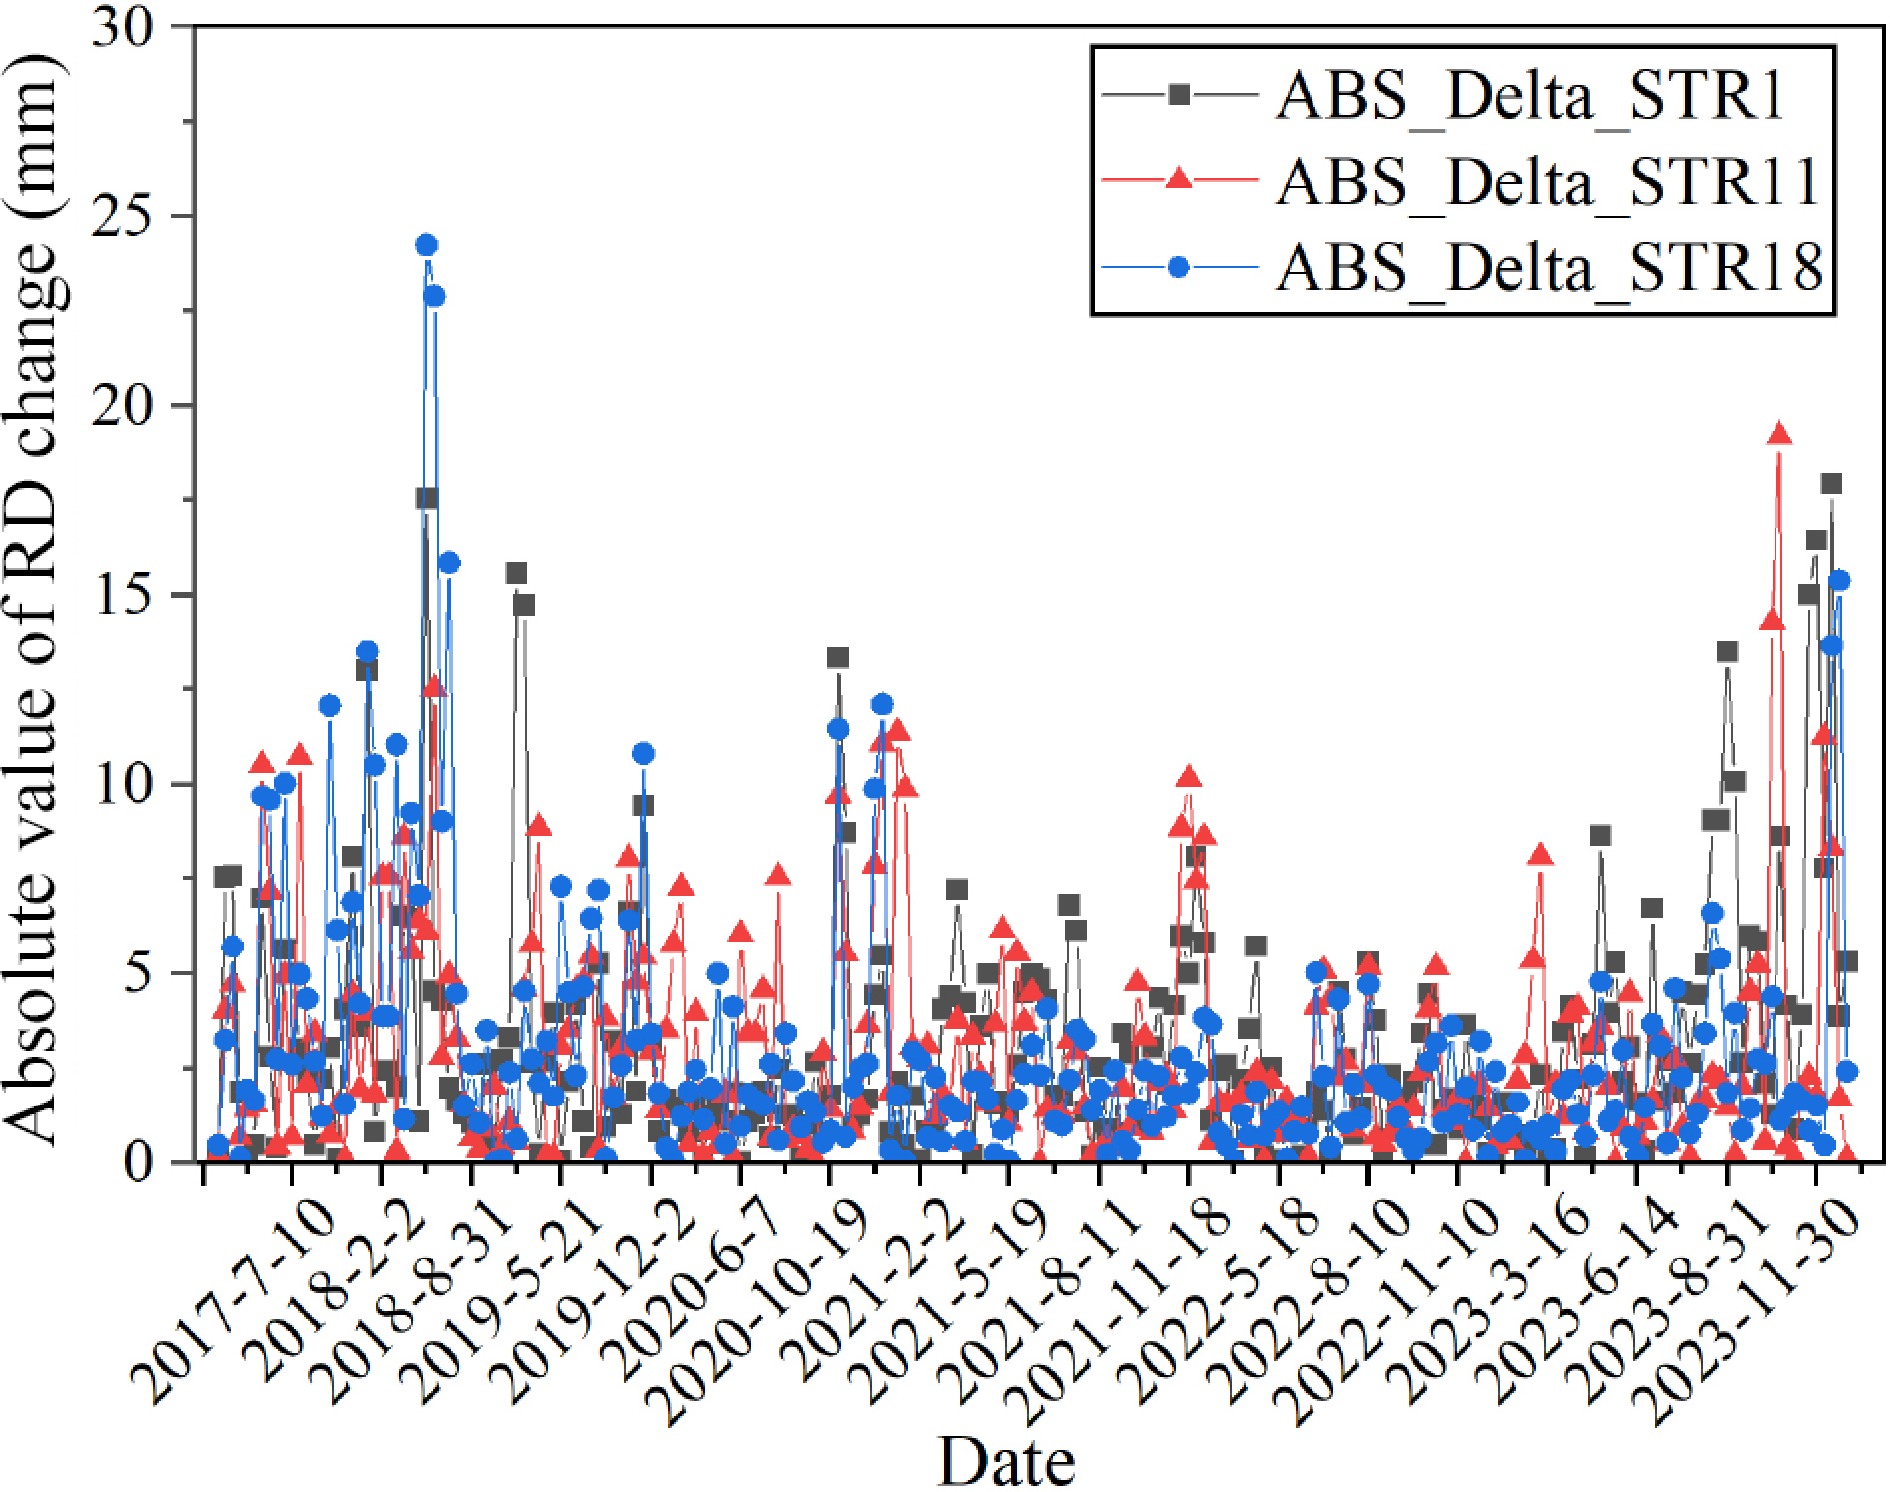
Figure 7.
Absolute value distribution of rutting depth variation of asphalt structures with different thicknesses.
Figure 6 clearly shows the dynamic evolution difference of rutting depth with time for different thickness structures (STR1, STR11, STR18). This difference is not a simple slow growth of thick layers, but a phased feature.
Initial stage (three to four years before service): the rutting growth of thick layer structure is gentle, and the growth of thin layer structure is rapid, reflecting the advantage of thick layer relying on stiffness reserve to significantly inhibit the initial deformation; in the middle stage (four to six years of service): the growth slope of thin layer structure decreases, because the early deformation of the material reaches short-term saturation; the growth slope of thick layer structure increases, and the long-term fatigue cumulative effect appears; the middle-level structure maintained stable linear growth, showing transitional characteristics; in the later stage (more than six years of service): the slope of the thick layer structure continues to maintain a high level, and the rutting depth gradually exceeds part of the medium-term structure, reflecting the irreversibility of fatigue damage; the growth of thin layer structure is constrained by initial deformation saturation, and the slope fluctuates slightly.
Quantitatively, this periodic feature confirms that the increase in AC layer thickness is negatively correlated with the rutting growth rate. Taking the specific structure as an example, the rutting growth of thin layer structure is more significant, and the growth of thick layer structure is slower, indicating that the inhibition effect of thickness on rutting is time-dependent.
In Fig. 7, the fluctuation amplitude of the absolute value of rutting depth variation (ABS delta) of the thick-layer structure is smaller than that of the thin-layer and middle-layer as a whole. Especially after the mid-term service, the thick ABS delta is concentrated in the low range, indicating that its rutting development is less affected by external interference, and its long-term deformation stability is better. When the thickness reaches 36 cm, this stability feature is particularly obvious, indicating that there is an optimal thickness threshold for asphalt structure. When the threshold is exceeded, the inhibition efficiency of thickness on rutting decreases marginally, but the stability improvement effect is still significant.
In summary, the DSAN model improves the adaptability of the rutting evolution law under different asphalt layer thicknesses through double-branch coordination mechanism. For the different thickness structures represented by STR1, STR11, and STR18, the error reduction in each group is consistent with the actual rutting development characteristics, which can accurately model the deformation process; the negative correlation between thickness and rutting is revealed, that is, increasing thickness inhibits rutting growth; the attention mechanism dynamically focuses on the layer thickness sensitivity factor, providing mechanism guidance for pavement structure design.
The performance advantage of the DSAN model comes from the fusion of dual-branch features and the key timing weighting mechanism. The TCN-LSTM branch is used to strengthen the short-term local characteristic analysis of structures with different thicknesses, and the LSTM-MHA branch is used to correct the key incentive response lag caused by thickness differences, which effectively solves the adaptability problem of traditional methods in the scenario of complex loads and multi-layer thick structures coupling.
Per-structure error distribution and thickness-dependent variation
-
To further characterize the predictive reliability of DSAN across distinct pavement structures, Fig. 8 presents the prediction error distributions of DSAN for the eight target structures (STR1 to STR19). In this figure, different color schemes correspond to the three asphalt layer thickness groups (thin, middle, and thick); solid black segments represent the interquartile range (IQR, spanning the 25th to 75th percentiles) of prediction errors, and white dots denote the median error values for each structure.
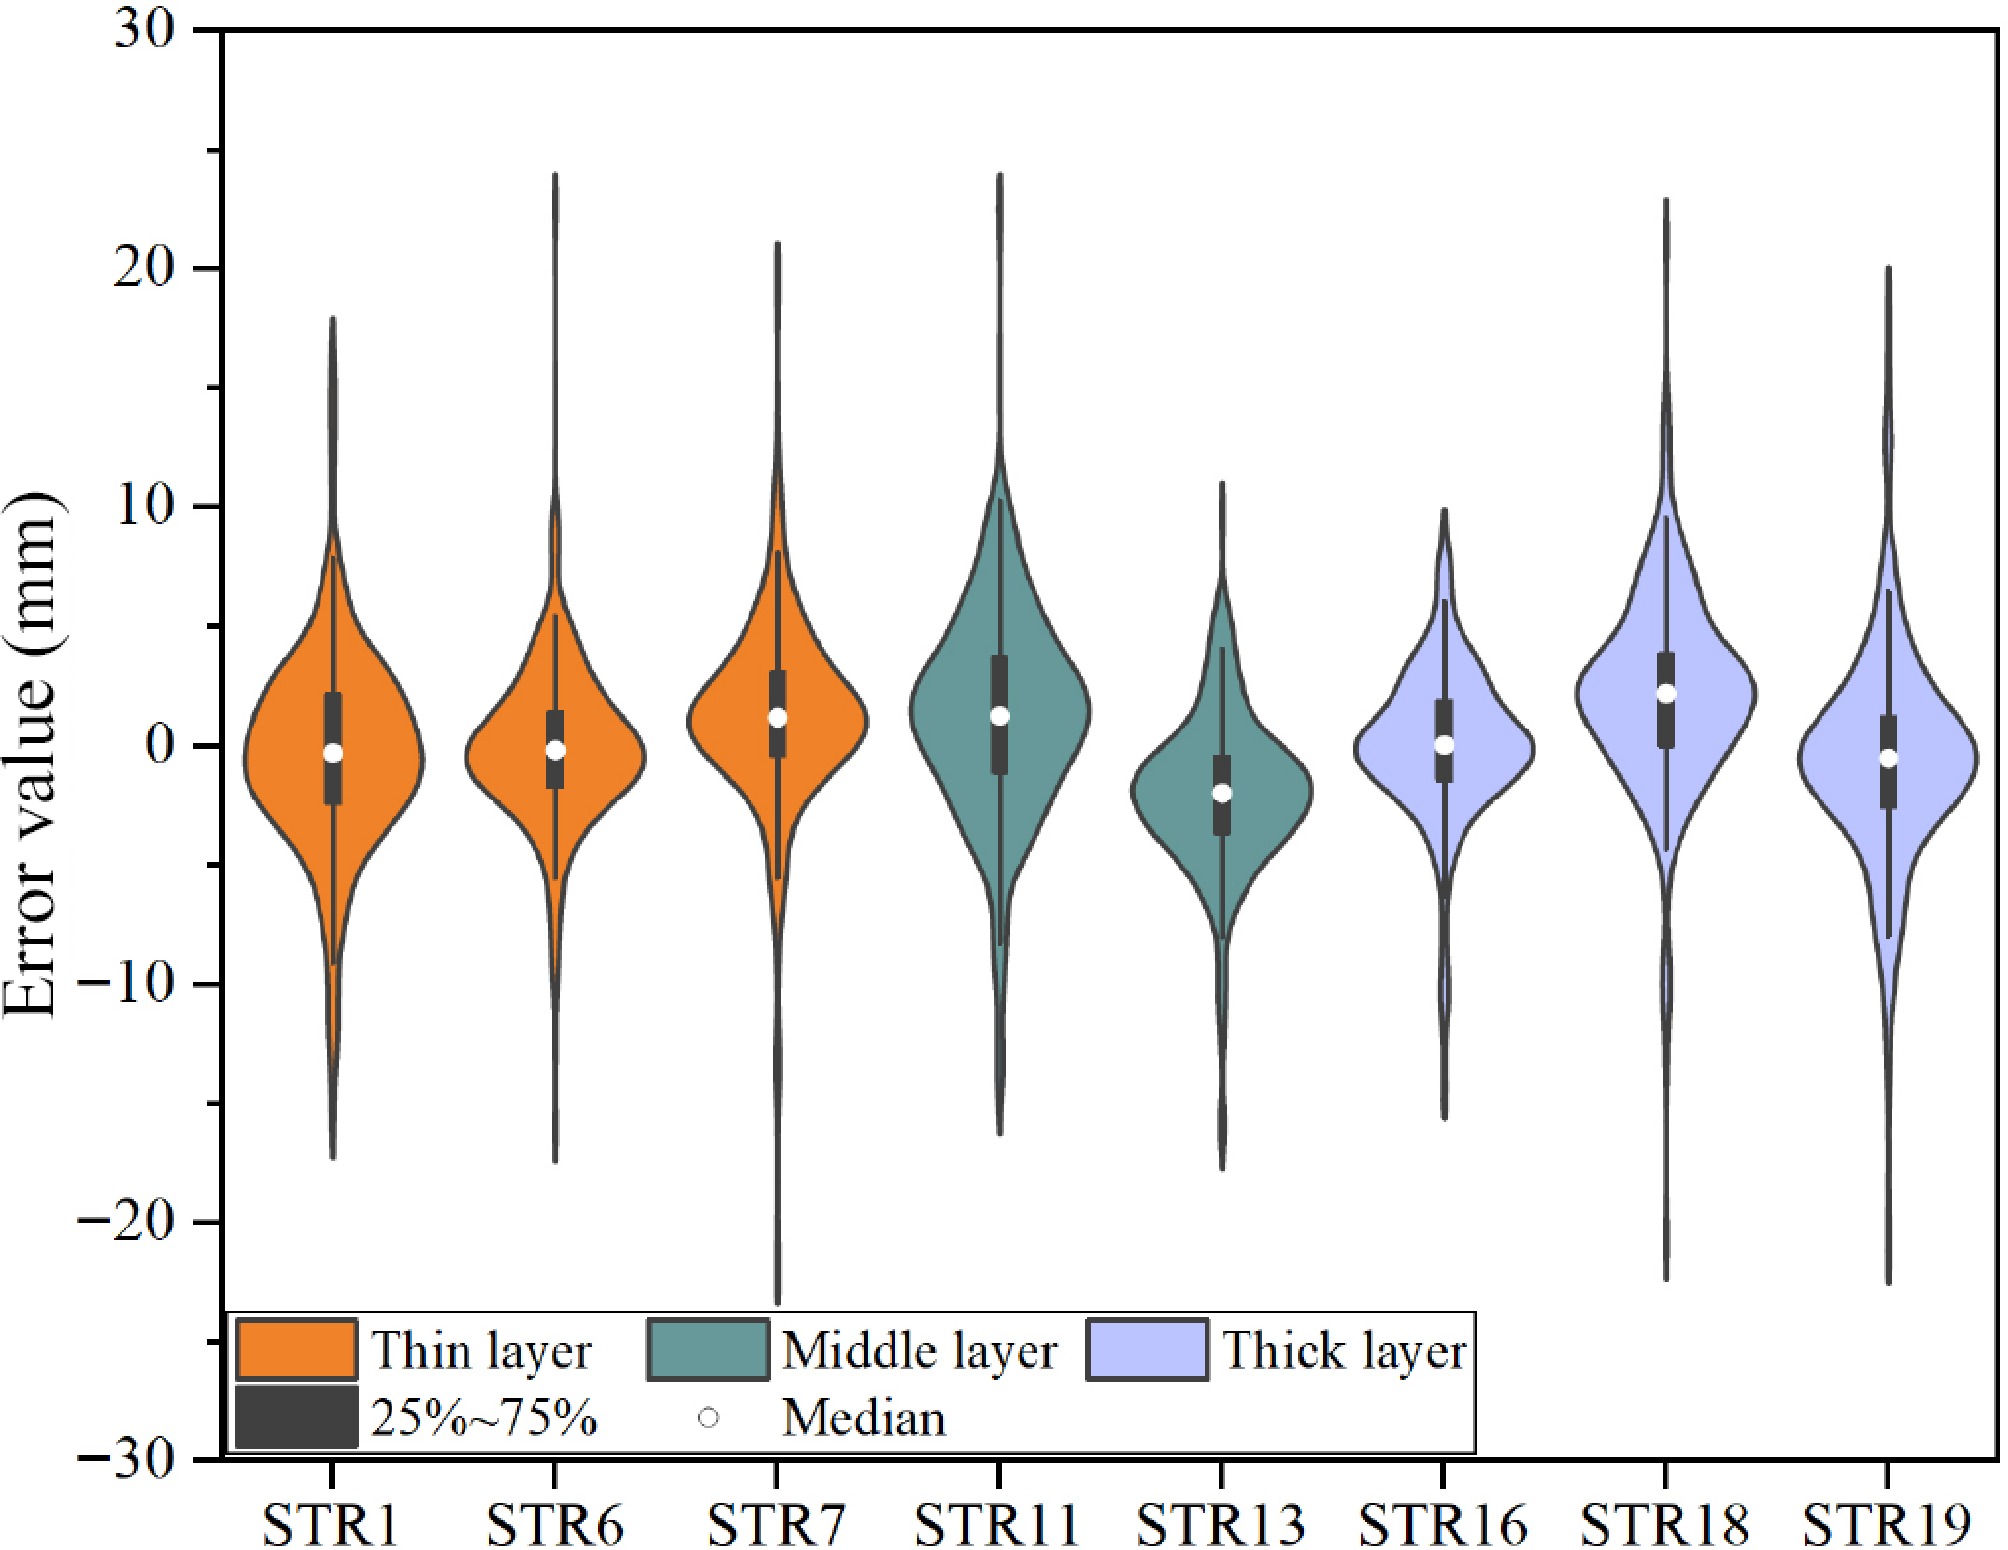
Figure 8.
Distribution characteristics of errors in microstructure and thickness.
Figure 8 shows that error distributions of all pavement structures are generally concentrated, with median errors clustering relatively closely around 0—reflecting DSAN's overall low-bias predictive performance.
For thin-layer structures (STR1, STR6, and STR7, colored in orange), the IQR of errors is generally less than 5 mm. Among them, STR1 and STR6 exhibit minimal extensions in individual sample errors (narrow 'whisker' ranges), while STR7 has slightly longer error extensions than the other two thin-layer structures. However, this expansion remains moderate, with only a negligible number of samples deviating from the main cluster. This deviation is insignificant and does not affect the overall stability of thin-layer predictions.
For middle-layer structures (STR11 and STR13, colored in teal), the IQR of errors is slightly wider than that of thin-layer structures, yet median errors still stay near 0 with no obvious skewness. STR13 shows narrow error extensions similar to STR1/STR6 in the thin-layer group, while STR11 has marginally longer extensions than STR13. Both structures maintain minor individual sample deviations overall, indicating DSAN's balanced predictive performance for middle-layer pavements.
For thick-layer structures (STR16, STR18, and STR19, colored in purple), the IQR is comparable to that of middle-layer structures, and median errors deviate only marginally from 0. The key difference is that the thick-layer group—particularly STR18 and STR19—exhibits notably longer and more prominent error extensions compared to both the thin and middle-layer groups. A greater number of individual samples show deviations from the main cluster, which aligns with the more complex rutting mechanism of thick-layer pavements involving the coupling of long-term load fatigue.
When evaluating error variation with asphalt layer thickness, no significant broadening of overall error dispersion is observed as thickness increases. The only distinction lies in the extent of error extensions: the thin-layer group (dominated by STR1/STR6) is the most concentrated, the middle-layer group maintains balanced concentration, and the thick-layer group shows the most prominent extension. Importantly, even with longer extensions, the majority of samples across all groups still cluster around the median, and the deviations do not compromise the overall predictive reliability. These results confirm that DSAN maintains robust predictive consistency across pavements with different asphalt layer thicknesses, validating its adaptability to the diverse deformation characteristics of thin, middle, and thick asphalt layers. This aligns with the core objective of this study: enhancing rutting prediction accuracy for pavements with varying asphalt layer thicknesses.
Cross-structure/cross-thickness generalization capability (LOSO Test)
-
To confirm that DSAN can adapt to unseen pavement structures with distinct AC layer thicknesses, a leave-one-structure-out (LOSO) test was conducted. The results are shown in Table 6. For each of the 8 target structures, the structure was held out as an independent test set, and the remaining 7 structures were used as the training set. This setup simulates the practical scenario of applying DSAN to new pavement configurations, with performance quantified by RMSE, MAE, and R2.
Table 6. Leave-one-structure-out (LOSO) tests of proposed models.
Structure number Evaluation metric RMSE MAE R2 STR1 5.3 3.32 0.913 STR6 4.599 2.657 0.933 STR7 5.118 3.127 0.966 STR13 4.993 3.239 0.917 STR11 5.514 3.706 0.959 STR16 4.549 2.527 0.949 STR19 4.976 3.299 0.9 STR18 5.808 3.819 0.958 As shown in Table 6, across all held-out structures with AC layer thicknesses spanning 12–52 cm, DSAN maintains high R2 values (≥0.90) and low error metrics (RMSE ≤ 5.81, MAE ≤ 3.82). For thin-layer structures, the R2 reaches 0.913, confirming robust performance on unseen thin-layer pavements. For middle- and full-thickness structures, R2 values exceed 0.93, indicating effective adaptation to complex rutting mechanisms in thick layers.
These results demonstrate that DSAN possesses strong cross-structure and cross-thickness generalization capability, as it does not overfit to specific structures and can reliably predict rutting for new pavement configurations with varied AC layer thicknesses. This aligns with the study's objective of developing a widely applicable rutting prediction model.
-
In this study, the DSAN model is proposed to solve the problem that the traditional model is difficult to adapt to the coupling of thickness difference and multi-scale deformation in asphalt pavement rutting prediction. The model accurately captures the rutting evolution law of asphalt structures with different thicknesses through the collaborative design of a differential feature analysis path and dynamic attention mechanism. Compared to traditional LSTM models, it performs the best in predicting ruts on mid-level structured road surfaces, with relative improvement rates of 8.0% and 11.1% for RMSE and MAE, respectively.
The multi-structure scenario verification results show that the DSAN model uses the TCN-LSTM branch to strengthen the short-term deformation response of the thin-layer structure, achieving a relative improvement of 4.9% in RMSE for this group; also, the LSTM-MHA branch corrected the long-term fatigue hysteresis effect of the thick-layer structure. This resulted in a relative improvement of 7.7% in the RMSE of the thick layer group. The complementary effect of the dual branch architecture significantly improves the rutting prediction accuracy and generalization ability of the model in thin-layer, middle-layer, and thick-layer structures.
This study provides high-precision rutting evolution prediction technical support for the optimization design of new pavement thickness. However, the data coverage, such as extreme thickness structure and complex load coupling conditions, as well as climate adaptability, such as the co-evolution mechanism of high temperature permanent deformation and low temperature cracking, still need to be further expanded and verified. The follow-up research will first focus on the model adaptation optimization for extreme climate and extreme thickness scenarios, then gradually expand to the multi-dimensional coupling scenario of thickness, environment, and load, deepen the model application, and further provide technical support for the accurate design and long-life operation of asphalt pavement in more complex service environments.
This work was supported by the Key Research and Development Plan of Shaanxi Province (Grant No. 2022JBGS3-08), and the Fundamental Research Funds for the Central Universities, CHD (Grant No. 300102404102).
-
The authors confirm contributions to the paper as follows: study conception and design, methodology, validation: Hao J, Weng Y; software: Xing Z; formal analysis: Xing Z, Li L; investigation: Hao J, Weng Y, Xing Z; data curation: Li L, Weng Y; resources: Weng Y; visualization: Pei L; draft manuscript preparation: Hao J, Li L; writing – review and editing: Xing Z, Pei L, Li L; supervision: Hao J; project administration: Xing Z, Pei L, Li L; funding acquisition: Pei L. All authors reviewed the results and approved the final version of the manuscript.
-
The raw data used in this study (e.g., road materials, traffic records) are confidential under legal agreements with government partners and cannot be shared publicly. Processed data or summaries are available upon request from the authors, subject to approval by the data providers.
-
The authors declare that they have no conflict of interest.
- Copyright: © 2026 by the author(s). Published by Maximum Academic Press, Fayetteville, GA. This article is an open access article distributed under Creative Commons Attribution License (CC BY 4.0), visit https://creativecommons.org/licenses/by/4.0/.
-
About this article
Cite this article
Hao J, Weng Y, Li L, Xing Z, Pei L. 2026. Rutting depth prediction model for asphalt pavements based on a dual branch spatiotemporal attention network. Digital Transportation and Safety 5(1): 32−41 doi: 10.48130/dts-0026-0003 

Rutting depth prediction model for asphalt pavements based on a dual branch spatiotemporal attention network
- Received: 12 August 2025
- Revised: 30 November 2025
- Accepted: 08 February 2026
- Published online: 31 March 2026
Abstract: Existing asphalt pavement rutting prediction models suffer from large long-term prediction errors due to their reliance on laboratory parameters and simplified assumptions. To address this issue, a dual-branch spatio-temporal attention network model (DSAN) is proposed. The model is constructed by fusing temporal convolutional networks (TCN), long short-term memory networks (LSTM), and multi-head attention mechanisms to form parallel feature extraction branches for hierarchical spatio-temporal modeling. Validation is conducted based on full-scale pavement loop test results of eight typical asphalt pavement structures (AC layer thickness: 12–52 cm) under 80 million equivalent standard axle loads (ESALs) accumulated during 2017–2023. Results show that the DSAN model significantly outperforms comparative models in prediction accuracy, breaking through the generalization bottleneck of traditional models for different layer thickness structures. This study provides an efficient solution for long-term performance prediction of asphalt pavements.
-
Key words:
- Asphalt pavement /
- Multiple branches /
- Spatiotemporal attention /
- Rutting prediction /
- Rutting depth