












-
With the continuous growth of motorization, recurrent congestion has become a persistent operational challenge on urban and suburban freeways, especially at bottlenecks where time-varying demand repeatedly exceeds limited infrastructure supply during peak periods. Active traffic management (ATM) has therefore been widely deployed to improve freeway operations through real-time control measures[1,2]. Within the ATM toolbox, ramp metering (RM) regulates upstream demand by controlling ramp inflows[3−5], whereas variable speed limits (VSL) aim to smooth speed variations and stabilize traffic flow[6−8]. In contrast, hard shoulder running (HSR), temporarily converting the hard shoulder into a travel lane under eligible conditions, offers a rapid, cost-efficient, and engineering-feasible way to release latent capacity without major reconstruction[9].
HSR has been implemented in practice in Germany, the United Kingdom, and the United States, where empirical evidence and operational reports suggest noticeable capacity gains and reduced peak-hour delays when shoulder activation is properly timed and managed[10]. Simulation-based studies further indicate that HSR can improve throughput and reduce emissions under appropriately designed operating strategies[11]. Nevertheless, HSR should not be regarded as a mere capacity augmentation measure. Improper activation/deactivation may destabilize traffic evolution and intensify merging and lane-changing turbulence near shoulder opening/closing zones, increasing lateral conflict risk and degrading operational stability[12]. Hence, the practical value of HSR depends on an activation–deactivation framework that jointly considers efficiency near saturation, safety and stability, and feasibility under real-world sensing and implementation constraints[13].
To this end, research has been moving beyond passive, single-threshold schemes toward proactive and closed-loop control paradigms. Chen[14] proposed an integrated proactive control to mitigate bottlenecks associated with merging maneuvers of exiting flows toward the hard shoulder. Carlson et al.[15] developed feedback-based dynamic HSR lane control grounded in macroscopic traffic flow theory. In mixed traffic environments, Silgu et al.[16] showed that combined control involving cooperative adaptive cruise control and human-driven vehicles can delay bottleneck onset and reduce collision risk. Ma et al.[17] investigated dynamic hard shoulder running for incident management, emphasizing timely and localized activation to minimize disruptions. Additionally, Yao et al.[18] proposed a hidden Markov model-based strategy for dynamic HSR in hybrid networks, demonstrating improved efficiency through predictive state transitions. Recent studies in related traffic-operation scenarios have further enriched the methodological background of dynamic traffic control. For example, Feng et al.[19] proposed a coordinated platoon–signal control method for signalized intersections in mixed traffic, demonstrating that incorporating the backward-looking effect can improve overall operational efficiency. Gao et al.[20] developed a vehicle-following dynamics model for curved-road environments, highlighting the influence of cross-slope angle on traffic-flow evolution across straight, transition, and circular segments. These studies collectively indicate that recent traffic-management research is increasingly emphasizing dynamic, predictive, and context-sensitive control. Despite this progress, building an end-to-end proactive HSR control system that is video-driven and robust in realistic freeway environments remains challenging.
One key challenge concerns traffic state perception, namely, the transformation of roadside surveillance video into control-oriented data streams for real-time HSR decision support. Recent advances in computer vision enable video-based vehicle detection and multi-object tracking for estimating traffic variables such as speed, flow, and density[21−23]. However, perspective distortion inherent to roadside views still limits accurate transformation from pixel trajectories to physical trajectories and thus degrades the fidelity of high-resolution measurements[24]. Without effective correction and calibration, extracted parameters may be noisy or biased, undermining downstream modules such as congestion prediction and threshold identification[25]. This issue is particularly critical near phase-transition regimes, where proactive HSR decisions are highly sensitive to state reliability and small errors may trigger premature or delayed interventions[26].
A second bottleneck concerns decision timing and stability. Although prediction has been introduced into traffic management, many HSR strategies still rely on a single occupancy/density trigger, which often intervenes only after congestion shockwaves form and may miss the free-flow-to-congestion transition window where timely action is most effective. Recent progress in short-term forecasting—ranging from time-series models to deep learning predictors—has improved the capability to anticipate traffic evolution under nonlinear volatility[27−29]. Nonetheless, random fluctuations around critical regimes can induce command 'chattering,' i.e., frequent activation/deactivation switching over short horizons, reducing effectiveness and potentially aggravating turbulence and safety risk near the shoulder transition zone. Therefore, an effective proactive HSR strategy should employ: (1) a robust multi-variable state representation beyond a single trigger; (2) predictive foresight to identify the breakdown/transition window before irreversible degradation occurs; and (3) a stabilizing mechanism (e.g., hysteresis with safety margins) to suppress oscillations around critical thresholds[30,31].
To address these limitations, this study proposes a data-driven closed-loop framework for proactive HSR activation and deactivation, integrating video-based perception, a composite congestion-state representation, short-term prediction, and phase-transition-aware threshold control. Specifically, a control-oriented vision pipeline combining detection/tracking, inverse perspective mapping, and scale calibration is developed to extract full-sample trajectories and produce reliable macroscopic variables. Based on these measurements, a bounded Traffic Congestion Index (TCI) is constructed by fusing flow, density, and speed, with indicator weights determined via an entropy-weight method to enhance robustness against nonlinear fluctuations. An ARIMA model is then employed to forecast short-term traffic states to provide early warning for decision-making. Finally, activation/deactivation thresholds are derived by referencing the critical density at maximum capacity, and a hysteresis mechanism with a safety margin is introduced to suppress chattering near critical regimes. Empirical validation using surveillance video data from a freeway bottleneck in Nanjing (China) demonstrates that the proposed framework can identify an effective intervention window before congestion onset, enabling timely HSR operation to improve section performance under recurrent bottlenecks.
The contributions of this study are summarized as follows:
(1) Control-grade video perception for freeway operations. We develop an integrated vision pipeline combining detection/tracking with inverse perspective mapping and scale calibration to correct perspective distortion, enabling reliable extraction of full-sample trajectories and macroscopic traffic variables for real-time control.
(2) Composite congestion state with data-adaptive weighting. We formulate a bounded TCI by fusing flow, density, and speed, and use an entropy-weight method to determine indicator weights from time-series dispersion, improving robustness to nonlinear fluctuations and reducing the ambiguity of single-variable triggers.
(3) Proactive phase-transition-aware activation with stable hysteresis control. We couple ARIMA-based short-term prediction with phase-transition-based thresholding and a safety-margin hysteresis mechanism to enable timely activation/deactivation while suppressing chattering near critical regimes.
The remainder of this paper is organized as follows: the study site and data preprocessing section describes the study area and the video-based traffic parameter extraction procedure. The TCI construction and prediction section introduces the Traffic Congestion Index (TCI) and the short-term prediction model. The HSR control section presents the phase-transition-based threshold identification method and the hysteresis-driven activation–deactivation control model. The empirical evaluation section reports the results and discusses practical implications and limitations. Finally, the conclusions section summarizes the main findings and future research directions.
-
The Donglushan section of the Chang-Shen Freeway in Nanjing (China) is selected as the study site, which spans approximately 5 km. The main line is configured with two travel lanes and one emergency lane. Additionally, four fixed roadside video surveillance units are deployed along the route, covering the complete spatial range from the upstream free-flow area to the downstream bottleneck area. The surveillance equipment is deployed with a high-angle overhead view to continuously capture vehicle operation footage, thereby providing a raw data basis for vehicle detection, trajectory extraction, and the calculation of traffic flow parameters. The video data collected during peak hours are selected as the research sample to characterize the entire process of the traffic flow transition from a free-flow state to a congested state.
First, regarding data processing, vehicle detection and Multi-Object Tracking are performed based on the surveillance videos to extract pixel-level vehicle trajectory data. Next, through perspective transformation and scale calibration, the pixel trajectories are mapped to the actual road space to calculate vehicle travel speeds and aggregate them into traffic flow parameters. Finally, outlier identification and preprocessing are conducted on the obtained traffic flow parameter sequences to acquire continuous, stable, and physically consistent traffic data, thereby providing reliable inputs for the subsequent model formulation.
Video-based vehicle detection and trajectory data extraction
-
To address the issues that real-world road surveillance videos are susceptible to illumination variations, environmental noise, and perspective distortion caused by camera angles. Weighted grayscale conversion and Gaussian filtering are adopted to pre-process the raw video frames, which effectively suppresses high-frequency noise interference while retaining vehicle texture features, thereby reducing dimensional redundancy in subsequent calculations. The grayscale value Gray can be expressed as:
$ {G}_{ray}(x,y)=0.299\times R(x,y)+0.587\times G(x,y)+0.114\times B(x,y) $ (1) where, R(x,y), G(x,y) and B(x,y) represent the component values of the pixel in the red, green, and blue channels, respectively. The weighting coefficients are determined based on the variations in human eye sensitivity to different colors, ensuring the optimization of visual features in the converted grayscale images. The image processed by video grayscale conversion is shown in Fig. 1.
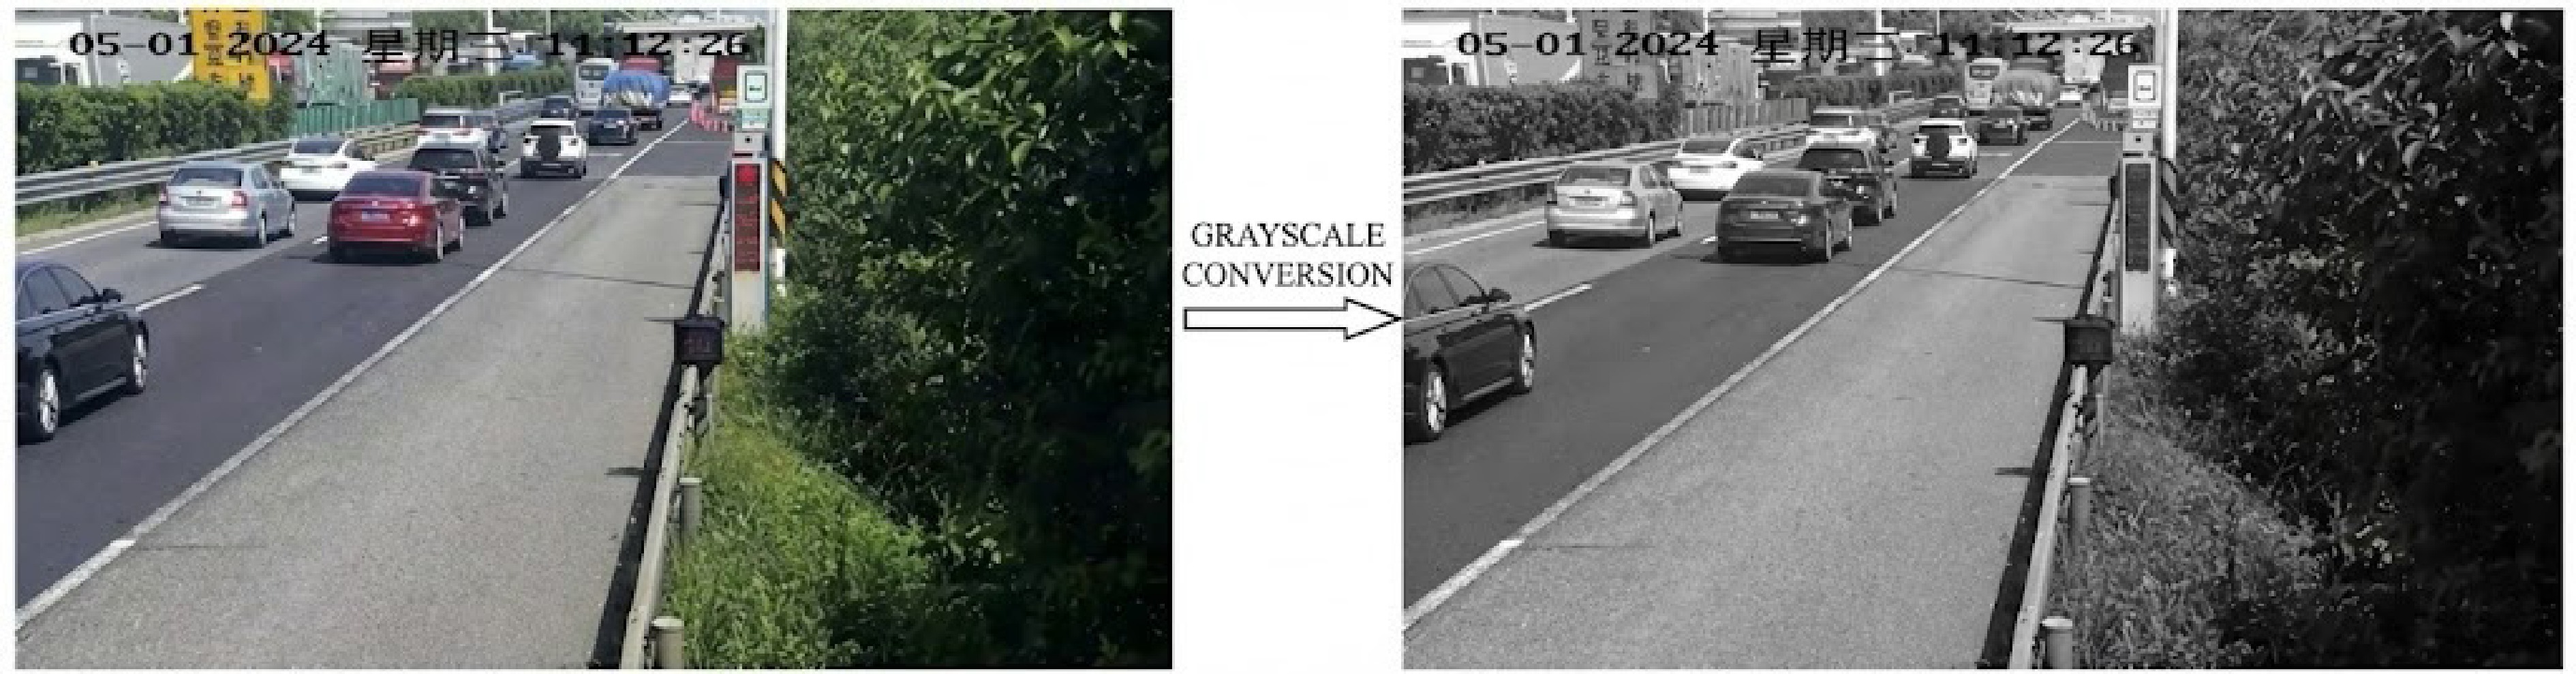
Figure 1.
Video grayscale processing.
In order to eliminate high-frequency noise points in the converted grayscale images, potentially caused by thermal noise from camera sensors or environmental factors, while retaining vehicle edge features, Gaussian filtering is adopted to perform smoothing processing on the images. Gaussian filtering employs a convolution kernel generated by the Gaussian function to perform weighted averaging on the image. The two-dimensional Gaussian function can be expressed as:
$ G(x,y)=\dfrac{1}{2\pi {\delta }^{2}}{e}^{\tfrac{{x}^{2}+{y}^{2}}{2{\delta }^{2}}} $ (2) where, (x,y) represents the pixel coordinates, and δ is the standard deviation, which is used to control the degree of smoothing. The smoothed image is generated by convolving the Gaussian kernel with each pixel and its neighborhood to compute the weighted average. The denoised pixel value I' (x,y) is presented as follows:
$ I^{'}(x,y)=\sum\limits_{m=-k}^k\sum\limits_{n=-k}^kG(m,n)\times I(x+m,y+n) $ (3) where, I(x,y) represents the raw grayscale image, and k denotes the size of the filtering kernel. Following the Gaussian denoising process, random noise points in the image are effectively suppressed. Consequently, the connectivity and edge clarity of vehicle targets are significantly improved, thereby facilitating feature extraction in subsequent networks.
Following image processing, the YOLOv8 deep learning model[32] is adopted to detect vehicle targets within the video frames. Based on multi-scale feature fusion and an anchor-free detection mechanism, the model is capable of simultaneously accommodating the detection demands of distant small targets and nearby large targets under complex traffic scenarios, making it suitable for long-distance surveillance conditions on freeways. The detection results are output in the form of vehicle bounding boxes and class confidence scores. In the object tracking stage, these results are input into the DeepSORT tracking framework. Specifically, Kalman filtering is employed to predict vehicle motion states, while the Hungarian algorithm is utilized to complete inter-frame object association. To mitigate the adverse impacts of complex scenarios on tracking continuity, an appearance-based similarity metric is introduced. Through a cascade matching strategy, the stability of vehicle re-identification is enhanced, thereby obtaining continuous and reliable vehicle trajectory data. Furthermore, virtual detection lines are established within the video frames. The system performs real-time monitoring of the center points of vehicle bounding boxes. When the center point vector traverses the detection line, the counting logic is triggered to realize lane-based cumulative traffic flow q(t) statistics. The recognition process is illustrated in Fig. 2.
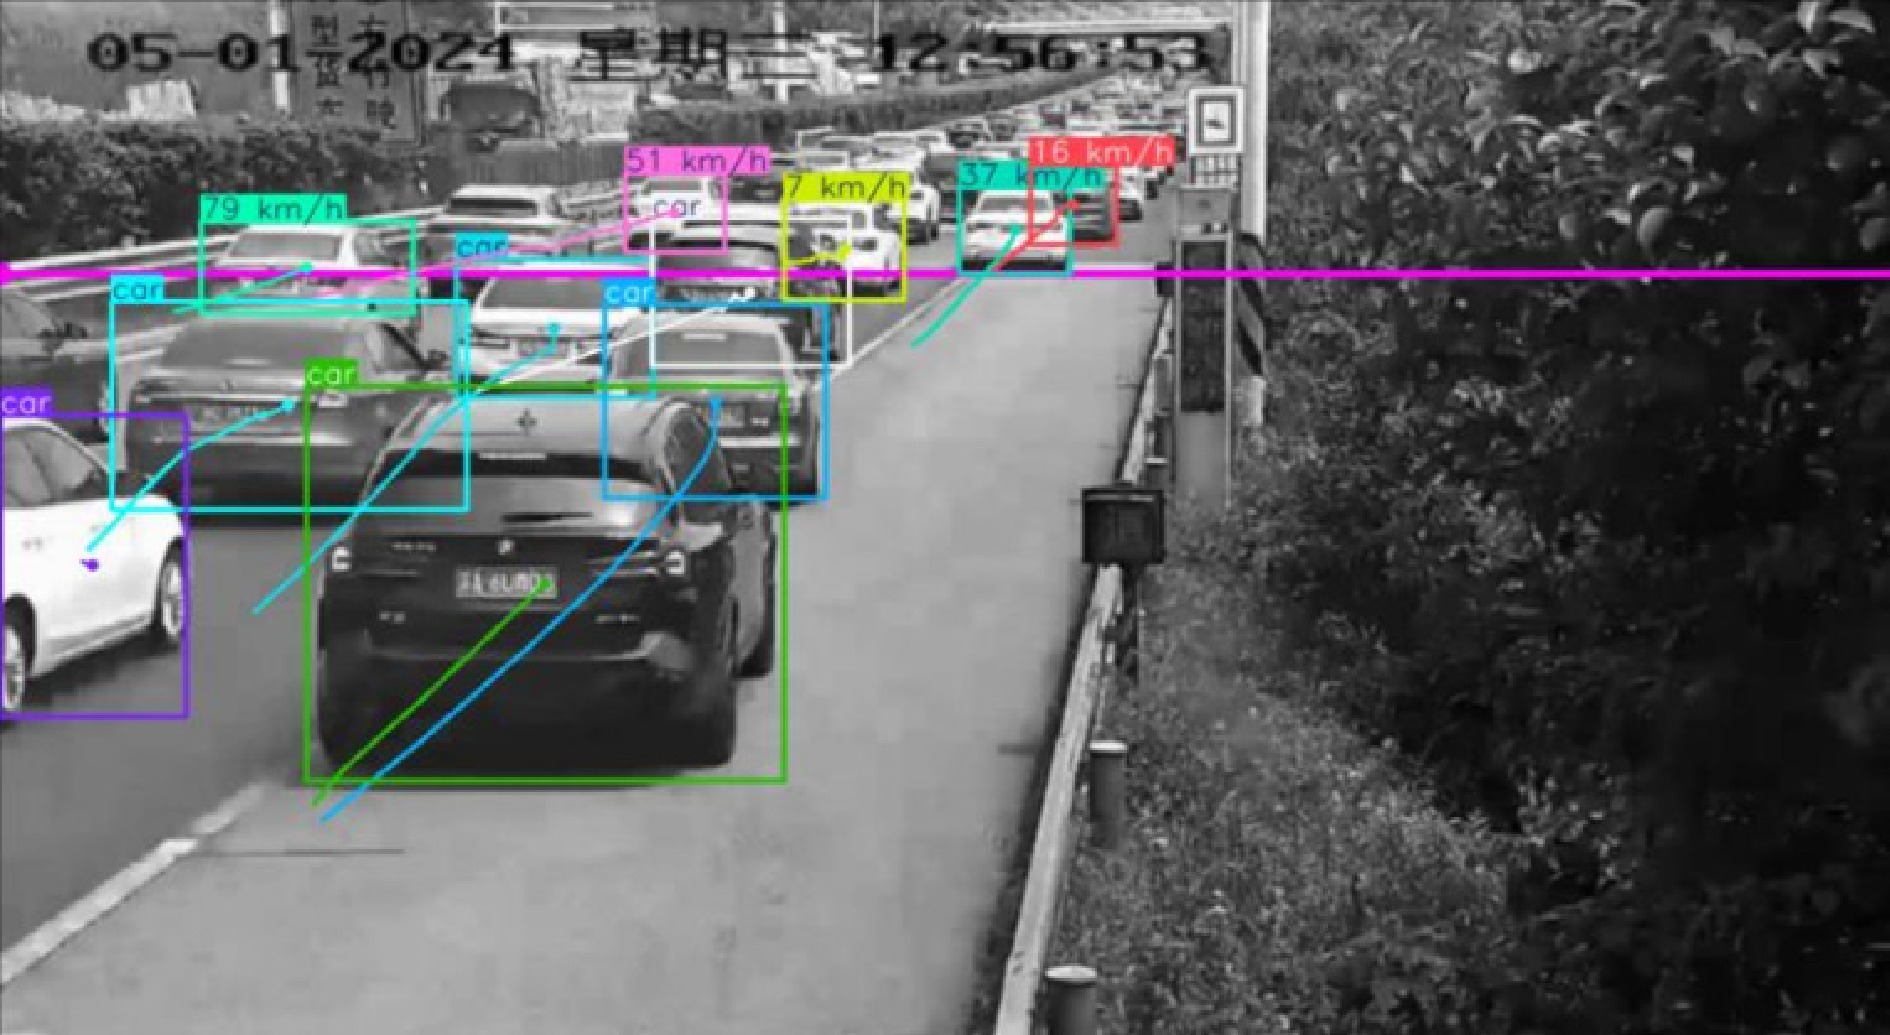
Figure 2.
Vehicle dynamics identification process.
Considering the differences in vehicle target scale, short-term occlusion, and real-time processing requirements in freeway surveillance scenarios, the input image size, confidence threshold, matching distance, and track maintenance parameters were uniformly configured in this study. The specific parameter settings are listed in Table 1.
Table 1. The YOLOv8 and DeepSORT parameter settings.
Module Parameter Value Module Parameter Value YOLOv8 Input image size 640 × 640 DeepSORT Minimum detection confidence 0.3 YOLOv8 Confidence threshold 0.3 DeepSORT Maximum cosine distance 0.2 YOLOv8 IoU threshold 0.5 DeepSORT Maximum IoU matching distance 0.7 YOLOv8 Maximum number of detections 100 DeepSORT Maximum age 30 YOLOv8 Detection classes Car, bus, truck DeepSORT Feature gallery size 100 Given that the high-angle overhead view of roadside surveillance often leads to perspective distortion, which significantly compromises the accuracy of vehicle speed calculation, perspective transformation technology[33] is adopted to rectify the video. By selecting four feature points parallel to the lane lines to solve the matrix, the mapping relationship between the image coordinate system and the physical coordinate system is established. Consequently, the original tilted view is projected into a top-down view. The perspective transformation formula can be expressed as follows:
$ \left[\begin{array}{c} {x}^{\prime}\\ {y}^{\prime}\\ {z}^{\prime} \end{array}\right]=\left[\begin{matrix} {a}_{11} & {a}_{12} & {a}_{13}\\ {a}_{21} & {a}_{22} & {a}_{23}\\ {a}_{31} & {a}_{32} & {a}_{33} \end{matrix} \right]\left[\begin{array}{c} x\\ y\\ z \end{array}\right] $ (4) where, (x,y,z) represents the homogeneous coordinates of the original image, and (x',y',z') denotes the transformed coordinates. In practical implementation, z = 1, and the transformed coordinates are shown as follows:
$ \begin{aligned}{x}^{\prime}&=\dfrac{{a}_{11}x+{a}_{12}y+{a}_{13}}{{a}_{31}x+{a}_{32}y+{a}_{33}}\\ {y}^{\prime}&=\dfrac{{a}_{21}x+{a}_{22}y+{a}_{23}}{{a}_{31}x+{a}_{32}y+{a}_{33}} \end{aligned} $ (5) By employing matrix transformation, the vehicle pixel coordinates are projected onto the top-down view plane, thereby eliminating the perspective effect of 'near-big and far-small'. The schematic diagram of the transformation is shown in Fig. 3.
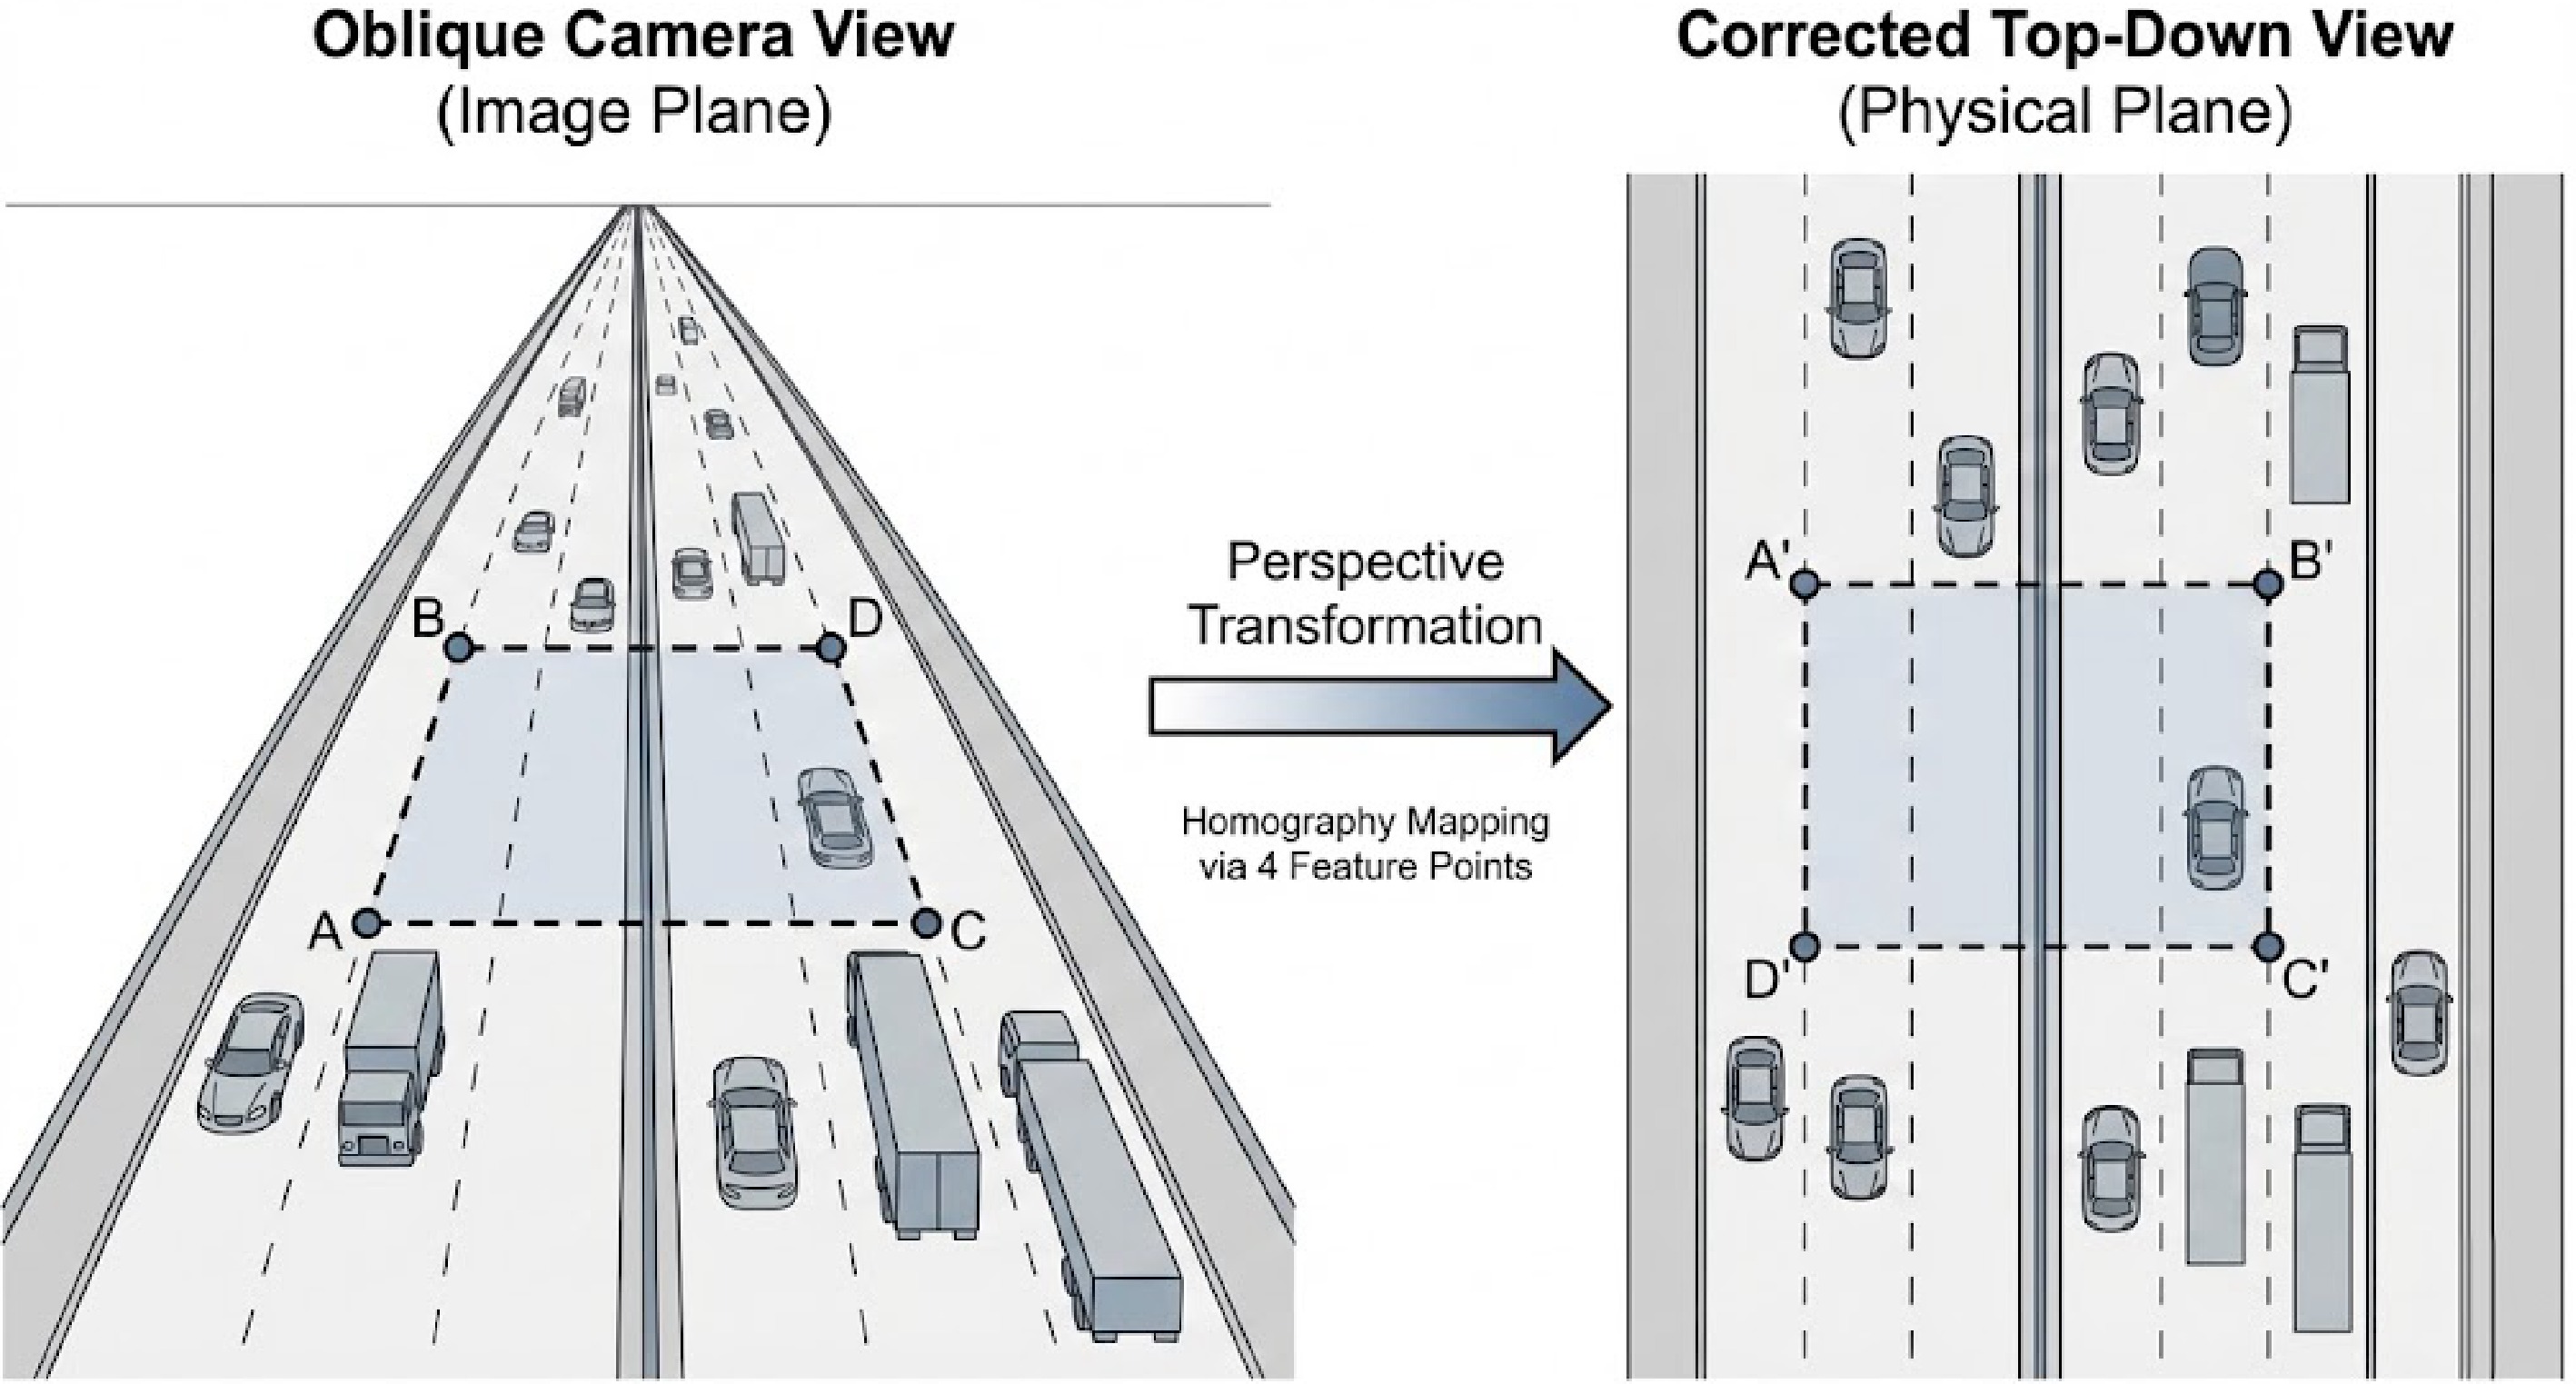
Figure 3.
Diagram of perspective transformation.
The standard freeway lane width of 3.5 m is utilized as the benchmark reference length Dr. The pixel scale factor is calculated s = Dr/Dp. Subsequently, the actual travel speed of the vehicle v is computed by combining the pixel displacement of the vehicle tracking Δdp trajectory within a unit time Δt,
$ v=\dfrac{\Delta d_p\times s}{\Delta t} $ (6) Traffic flow data processing
-
Since outliers caused by environmental noise in the raw data cannot directly characterize the road operation state, they are unsuitable to serve as direct inputs for the control model. Accordingly, data cleaning and parameter aggregation are conducted on the raw data to rectify the temporal dimension and eliminate outliers. Considering macroscopic traffic flow theory, microscopic trajectories are aggregated into three macroscopic traffic flow parameters, and their spatiotemporal evolution patterns are analyzed. This process lays a credible data foundation for the subsequent formulation of the traffic congestion index.
Given that the accelerated video processing leads to a proportional deviation from the actual physical duration, a sampling interval of 30 s is set to restore accurate traffic flow characteristics. Specifically, the continuous time series is discretized into statistical cycles to ensure the physical significance of the traffic flow parameter calculation.
Given the strong fluctuations in short-term freeway traffic flow data and their susceptibility to environmental noise, recognition errors, and instantaneous disturbances, the original time series may contain outliers and local missing values. The boxplot method, which is based on the interquartile range, does not require any prior assumption about the data distribution and is robust to outlying observations; therefore, it was adopted for outlier detection in this study. For the local missing values generated after outlier removal, the mean of valid data from adjacent time windows was used for imputation, considering their short duration and limited impact range, so as to maintain the continuity of the time series. The boxplot method[34] is adopted for outlier detection. The Interquartile Range is utilized to measure the dispersion of the data. Let Q3 and Q1 denote the upper and lower quartiles, respectively; IQR = Q3 − Q1. Consequently, the threshold interval for determining outliers is defined as follows:
$ \left[Q_1-1.5\times IQR,Q_3+1.5\times IQR\right] $ (7) Any traffic flow or speed data points falling outside this interval are identified as outliers and eliminated. The outlier detection results for traffic flow and average speed are shown in Fig. 4. Following the elimination of outliers, missing values may emerge within the time series. To maintain data continuity, the mean imputation method is adopted to fill these missing values. Specifically, the arithmetic mean of valid data from adjacent time windows preceding and succeeding the missing point is utilized as the estimated value for that instant, thereby obtaining a smooth and complete time series of traffic flow parameters.
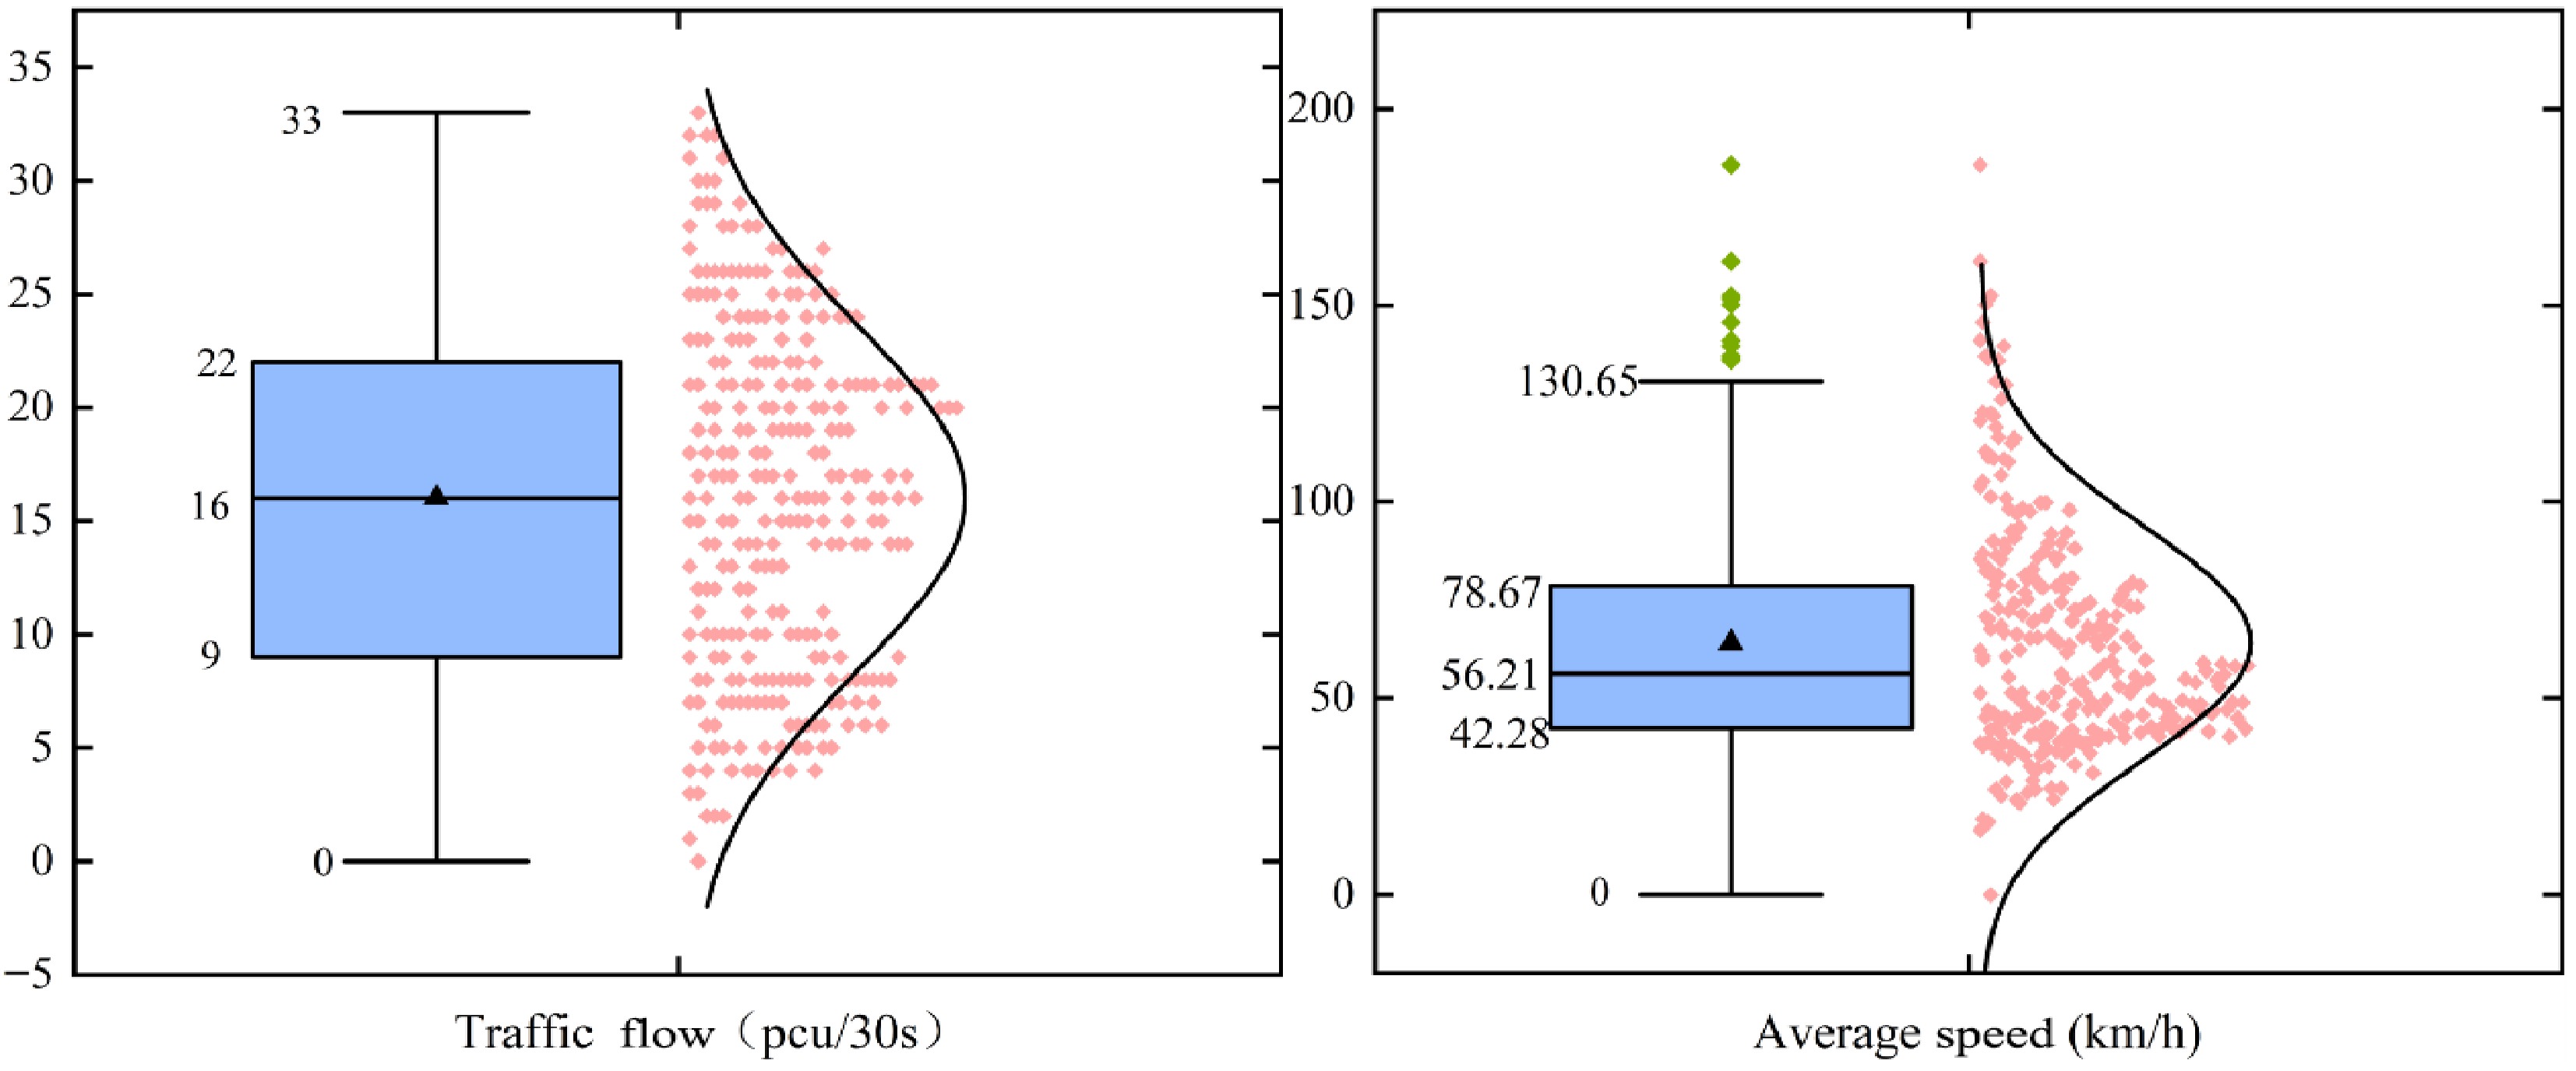
Figure 4.
Traffic flow and vehicle speed outlier detection.
Traffic flow parameter calculation
-
Based on the cleaned full-sample vehicle data, the aggregate calculation of key parameters is conducted by incorporating macroscopic traffic flow theory. For any given statistical cycle t, the traffic flow is defined as the number of equivalent vehicles passing through the observation cross-section within the 30 s statistical interval; the average speed is represented by the arithmetic mean of the instantaneous speeds of all vehicles passing within the given interval. Traffic density is defined as k(t) = q(t)/v(t). The traffic flow parameters, including traffic flow, average speed, and traffic density, are acquired for the Nanjing-Changshen Expressway section within each time period. Subsequently, the calculation results are plotted as time series diagrams, thereby facilitating the analysis of the temporal evolution patterns of these three parameters. The time series of traffic flow, average speed, and traffic density are shown in Fig. 5.
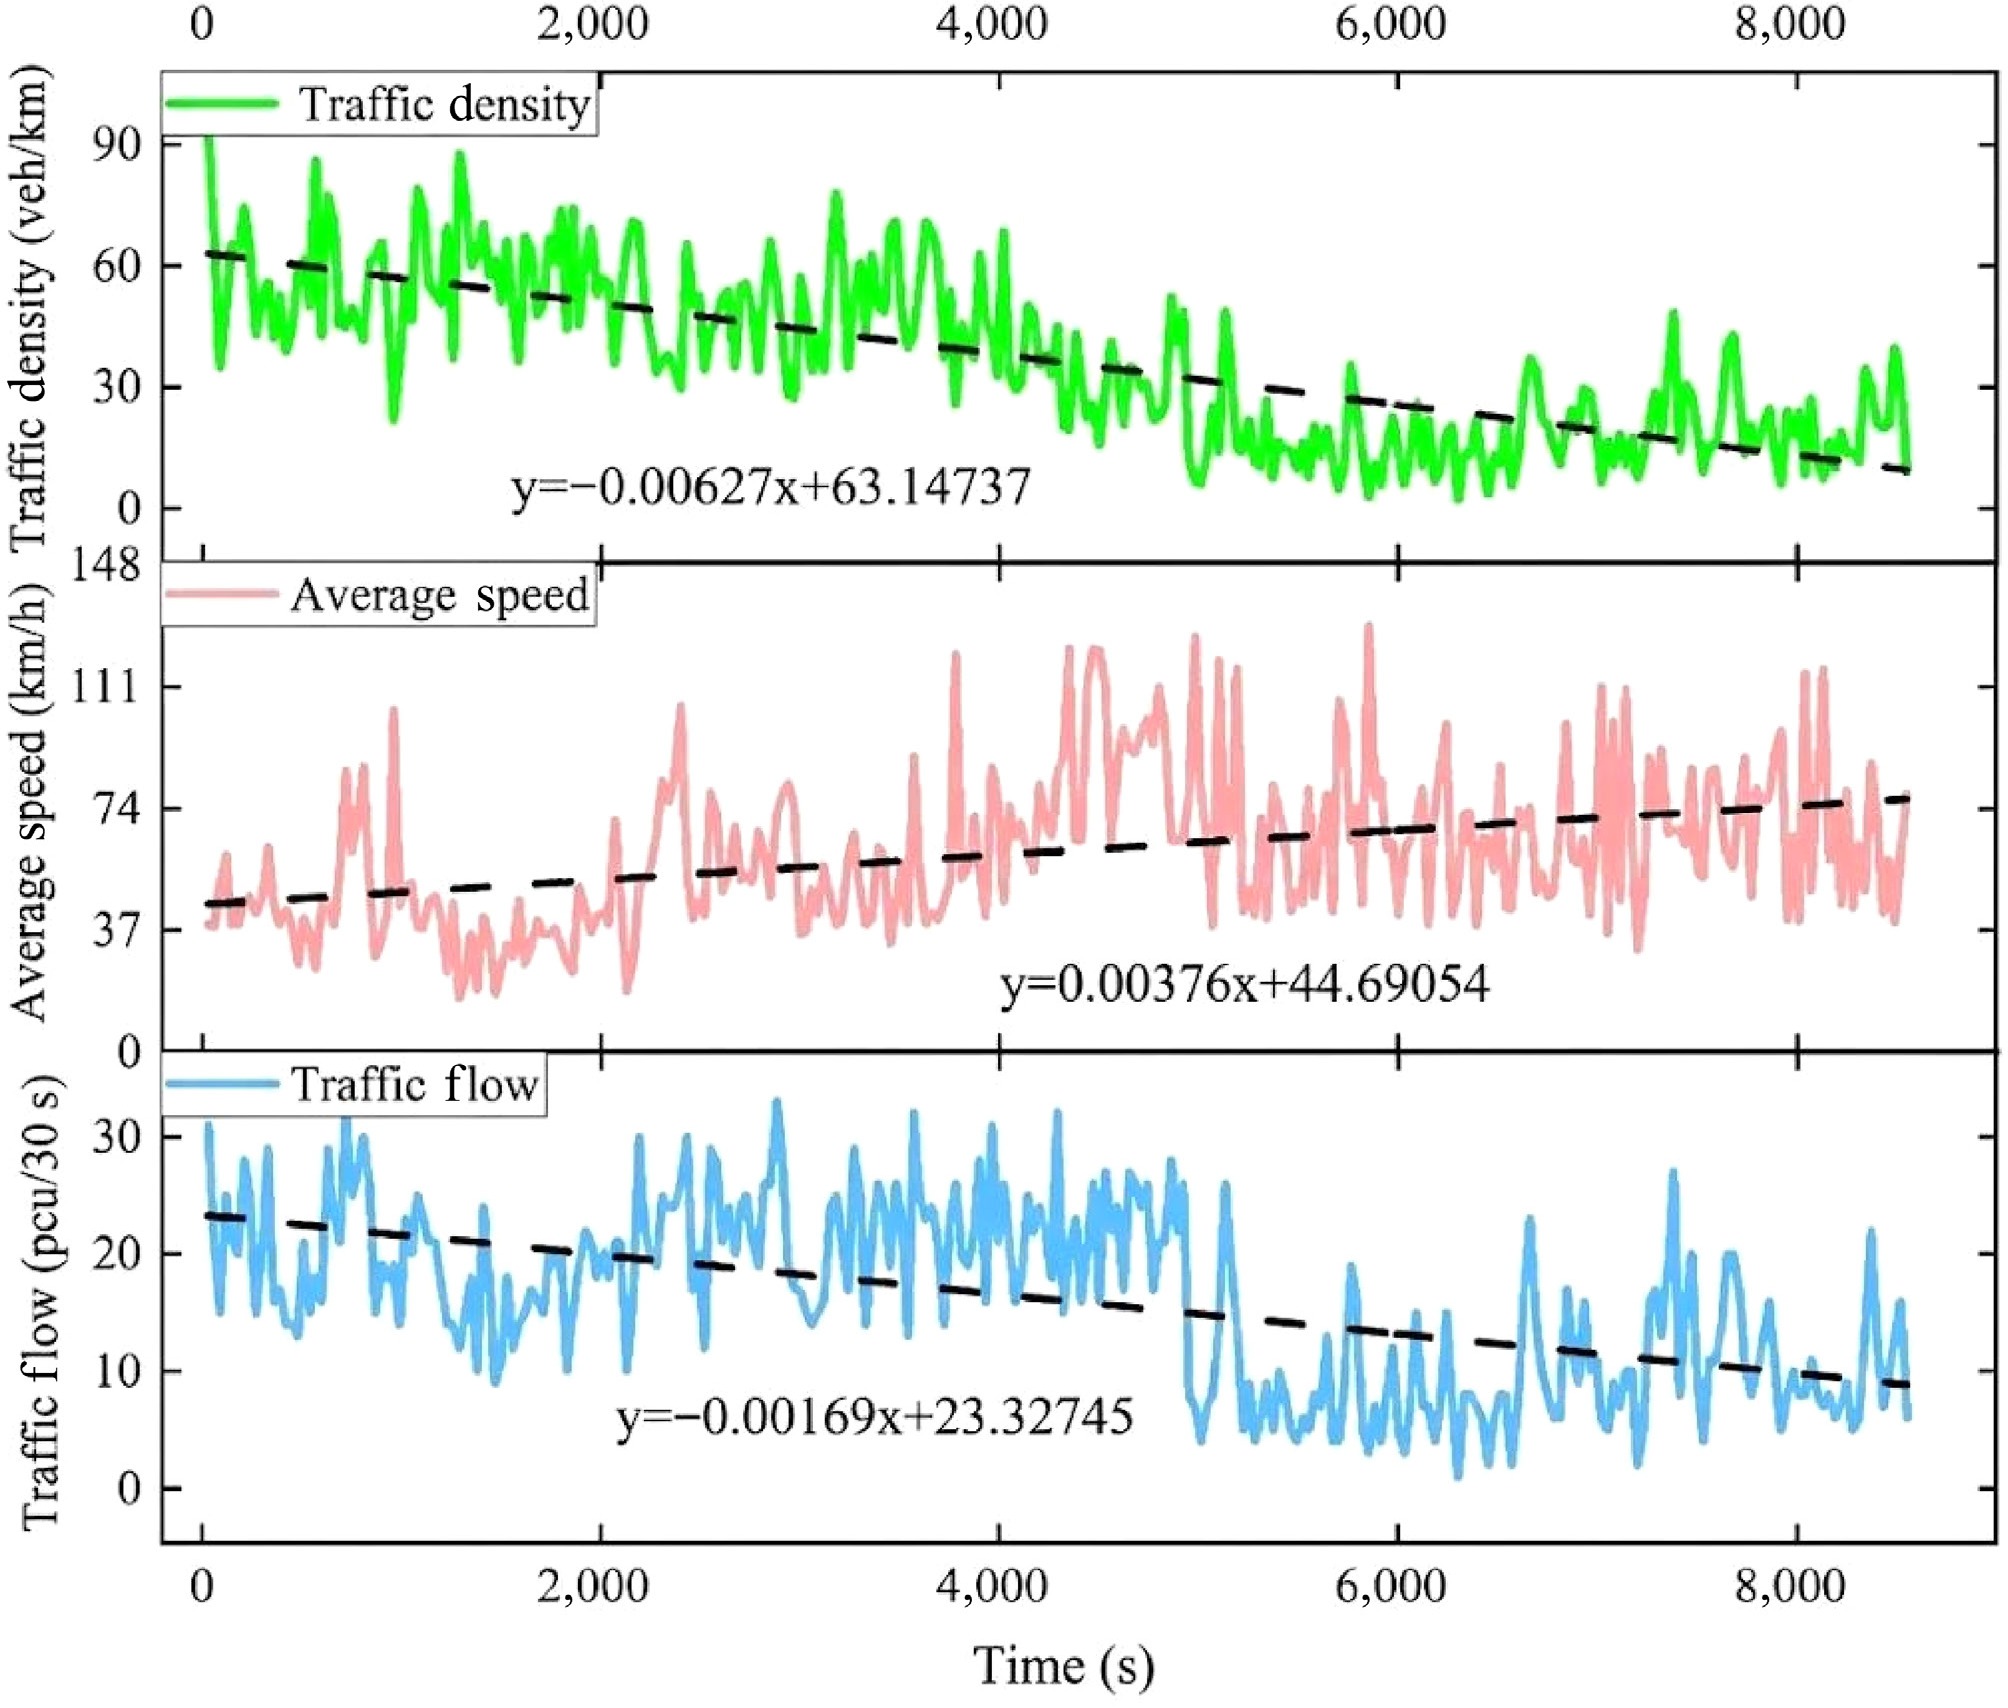
Figure 5.
Traffic flow, average vehicle speed, and density time series chart.
As shown in Fig. 5, through the time-series analysis of the calculation results at the observation point, it is observed that the traffic flow parameters exhibit significant phased evolution patterns. During the initial phase of the morning, peak 0–5,000 s, traffic flow rapidly reaches a saturated state. Concurrently, traffic density rises significantly, resulting in a sharp decline in average speed. At this stage, traffic flow exhibits a positive correlation with density, whereas it displays a significant negative correlation with speed. As time progresses beyond 5,000 s, the upstream arrival volume decreases. Consequently, traffic flow begins to decline, accompanied by a reduction in traffic density. With the weakening of mutual interference between vehicles, the average speed exhibits a fluctuating upward trend, indicating that the traffic flow gradually transitions from the forced flow state to the free flow state. The data from the observation point indicate that actual traffic flow parameters exhibit significant non-linearity and volatility. Consequently, it is challenging to accurately identify the congestion state by relying solely on a single parameter.
Active emergency lane activation model
-
Leveraging continuous and reliable traffic flow measurements, this study constructs a proactive emergency lane activation model composed of traffic state representation, short-term traffic state prediction, and phase transition threshold identification. The traffic congestion index is employed as the system state variable, while short-term prediction results are used to forecast traffic evolution. Activation and deactivation thresholds are derived based on traffic flow phase transition theory, enabling pre-activation decisions and advanced mitigation of incipient congestion.
Traffic congestion index formulation
-
A single traffic flow metric fails to capture the low-speed and high-density characteristics associated with congestion. Conversely, a single speed metric is susceptible to interference from discrete vehicles under free-flow conditions. To this end, a Traffic Congestion Index[35] is formulated by integrating the three elements of traffic flow, density, and speed, thereby enabling a comprehensive quantification of the traffic congestion level. The Traffic Congestion Index ranges from 0 to 1, where a value closer to 1 indicates a higher severity of traffic congestion. The calculation formula is shown as follows:
$ TCI=\omega_1\times\dfrac{Q(t)}{Q_{\max}}+\omega_2\times\dfrac{K(t)}{K_{jam}}+\omega_3\times\dfrac{V_{free}-V(t)}{V_{free}} $ (8) where, Q(t) denotes the traffic flow at time t, and Qmax represents the maximum traffic capacity of the road; K(t) denotes the traffic density at time t, and Kjam represents the maximum jam density; t is the average speed at time t, and Vfree denotes the free-flow speed; and ω1, ω2, ω3 represents the weight of each evaluation metric, and
$ \sum\limits_{i=1}^{3}{\omega }_{i}=1 $ Step 1: The raw data matrix is constructed A = (atj)m×n, and Min − Max normalization is performed to obtain the standardized matrix R = (rtj)m×n;
Step 2: Calculate the information entropy Ej for the j indicator:
$ {E}_{j}=\dfrac{\displaystyle\sum \limits_{t=1}^{m}{p}_{tj}ln{p}_{tj}}{lnm} $ (9) $ {p}_{tj}=\dfrac{{r}_{tj}}{\displaystyle\sum \limits_{t=1}^{m}{r}_{tj}} $ (10) Step 3: The weights ωj are calculated based on the coefficient of difference of the information entropy:
$ {\omega }_{j}=1-{E}_{j}/\sum \limits_{k=1}^{n}(1-{E}_{k}). $ (11) Based on the results of the traffic data from the Nanjing-Changshen Expressway section, the weights for traffic flow, traffic density, and average speed are ultimately determined as 0.3, 0.4, and 0.3, respectively.
Short-term traffic flow prediction
-
To enable proactive management of the emergency lane, it is necessary to anticipate future traffic states in advance. Given the pronounced temporal dependence and nonstationarity of traffic flow data, the autoregressive integrated moving average (ARIMA) model is adopted for short-term prediction. The ARIMA model combines the autoregressive AR structure, the differencing process I, and the moving average MA structure to effectively perform short-term forecasting of multiple traffic-related time series, including traffic flow and speed.
The autoregressive AR model predicts the current value as a linear combination of its past observations, which can be expressed as follows:
$ y_t=u+\varepsilon_t+\sum\limits_{i=1}^p\gamma_i\times y_{t-i} $ (12) where, yt denotes the current value, μ is a constant term, p represents the model order, and εt denotes the error term.
The differencing process is employed to transform a nonstationary time series into a stationary one, thereby eliminating the effects of trends or periodic components. The differencing operation is presented as follows:
$ Y_{t}^{\prime}= Y_{t}- Y_{t-1} $ (13) where, Yt denotes the observation at time t, Yt−1 represents the observation at time t−1, and
$ Y_{t}^{'} $ The moving average MA model adjusts the predicted value by incorporating the prediction errors from previous time steps, which can be expressed as follows:
$ {Y}_{t}=u+{\varepsilon }_{t}+\sum \limits_{i=1}^{q}{\theta }_{i}{\varepsilon }_{t-i} $ (14) where, μ denotes the mean of the time series, ε represents the random error term, q is the model order, and Yt denotes the observation at time t.
Phase transition-based threshold identification
-
Building on macroscopic traffic flow theory, this study leverages short-term traffic flow predictions generated by the ARIMA model[37] to enable proactive emergency lane management and determines control thresholds with clear physical meaning through an analysis of traffic flow phase transition mechanisms. As traffic flow dynamically evolves, it undergoes a characteristic phase transition from free-flow conditions to congested conditions. Within the flow–density fundamental diagram, the corresponding critical point is defined by the critical density associated with the maximum roadway capacity. Considering that random fluctuations of traffic flow in the vicinity of the critical value may easily trigger frequent oscillations of control commands, a hysteresis control mechanism[38] from control theory is introduced. By incorporating a safety margin coefficient, dynamic activation and deactivation thresholds TCIthr based on predicted data are determined as follows:
$ TC{I}_{thr}=\eta TCI $ (15) Emergency lane activation–deactivation control model
-
On the basis of the defined dynamic thresholds, a hysteresis-based emergency lane activation–deactivation control model is formulated. Different from traditional single-threshold triggering schemes, the proposed model determines state transitions by jointly considering the ARIMA-based prediction of the congestion index at the next time step and the current emergency lane control state S. Accordingly, a binary decision variable D is defined to characterize the emergency lane activation–deactivation decision, expressed as follows:
$ D=\begin{cases} 1, & if\;TC{I}_{i} \gt TC{I}_{thr}\\ 0, & if\;TC{I}_{i} \lt TC{I}_{thr}\\ S, & if\;TCI\leq TC{I}_{i}\leq TC{I}_{thr} \end{cases} $ (16) where, D = 1 represents emergency lane activation, D = 0 represents no activation, and TCIi denotes the traffic congestion index at time step i, TCIthr represents the predicted congestion index threshold, and TCI denotes the fallback congestion index used to trigger emergency lane deactivation. S denotes the current control state, indicating that the traffic congestion index lies within the hysteresis interval [TCI,TCIthr].
-
Accurate short-term traffic flow prediction constitutes a fundamental prerequisite for proactive emergency lane activation. Using the road segment between Observation Points 3 and 4 as a case study, the ARIMA model is applied to forecast future traffic flow and average speed, followed by an evaluation of its prediction performance.
The prediction results presented in Fig. 6 indicate that the traffic flow parameters at Observation Point 3 fluctuate considerably within the prediction window. Within the time interval of 0–200 s, traffic conditions remain uncongested, and the average speed is sustained in the range of 70–80 km/h. Subsequently, a pronounced increase in traffic flow is observed, accompanied by a decline in traffic efficiency. At t = 360 s, the traffic flow attains its peak of 35 pcu/30 s, with the corresponding average speed decreasing to 46 km/h, which implies a substantial reduction in roadway level of service. With the reduction in traffic flow, the average speed increases and stabilizes at around 80km/h over the interval of 420–600 s.
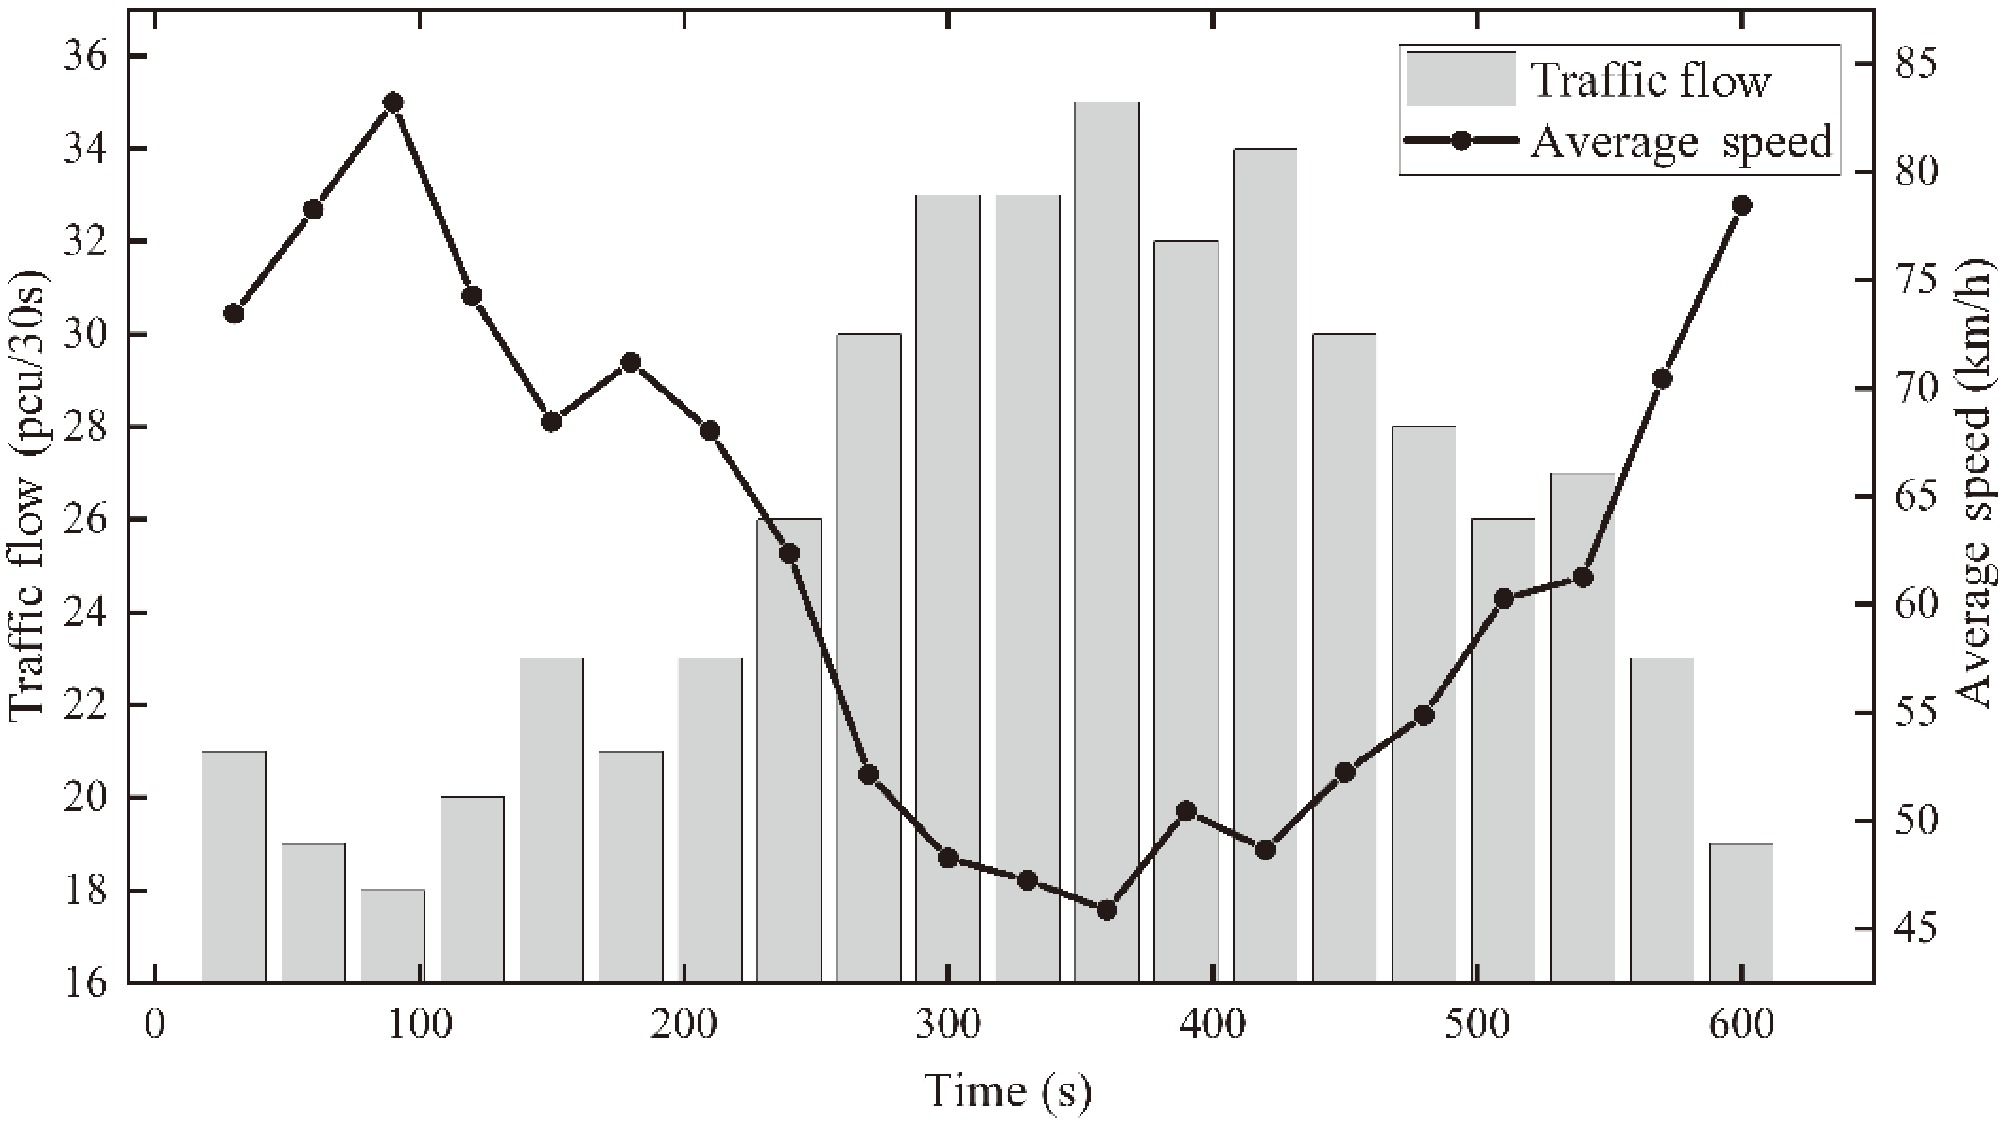
Figure 6.
Traffic volume and average Vehicle speed forecast results.
For a quantitative assessment of prediction accuracy, the sample data are split into training and testing sets at a ratio of 8:2. Prediction performance is evaluated using mean absolute error (MAE), mean squared error (MSE), mean absolute percentage error (MAPE), and the coefficient of determination (R2)[39] The corresponding results are reported in Table 2.
Table 2. Traffic flow prediction model evaluation metric results.
Predicted data MAE MSE MAPE R2 Traffic flow 0.4214 0.4638 2.11% 0.968 Average speed 1.2341 1.6332 1.37% 0.973 It can be observed from Table 2 that the coefficients of determination (R2) for traffic flow and average speed predictions are both above 0.96, indicating a high goodness of fit and a strong ability to characterize the temporal dynamics of traffic flow. Both the MAE and MSE of traffic flow prediction are maintained at relatively low levels, and the prediction errors for average speed remain within acceptable bounds. In addition, the relative errors are consistently below 3%. Figure 7 presents a comparison between the temporal evolution of the observed and predicted traffic flow and average speed, showing a close agreement between the predicted results and the actual measurements.
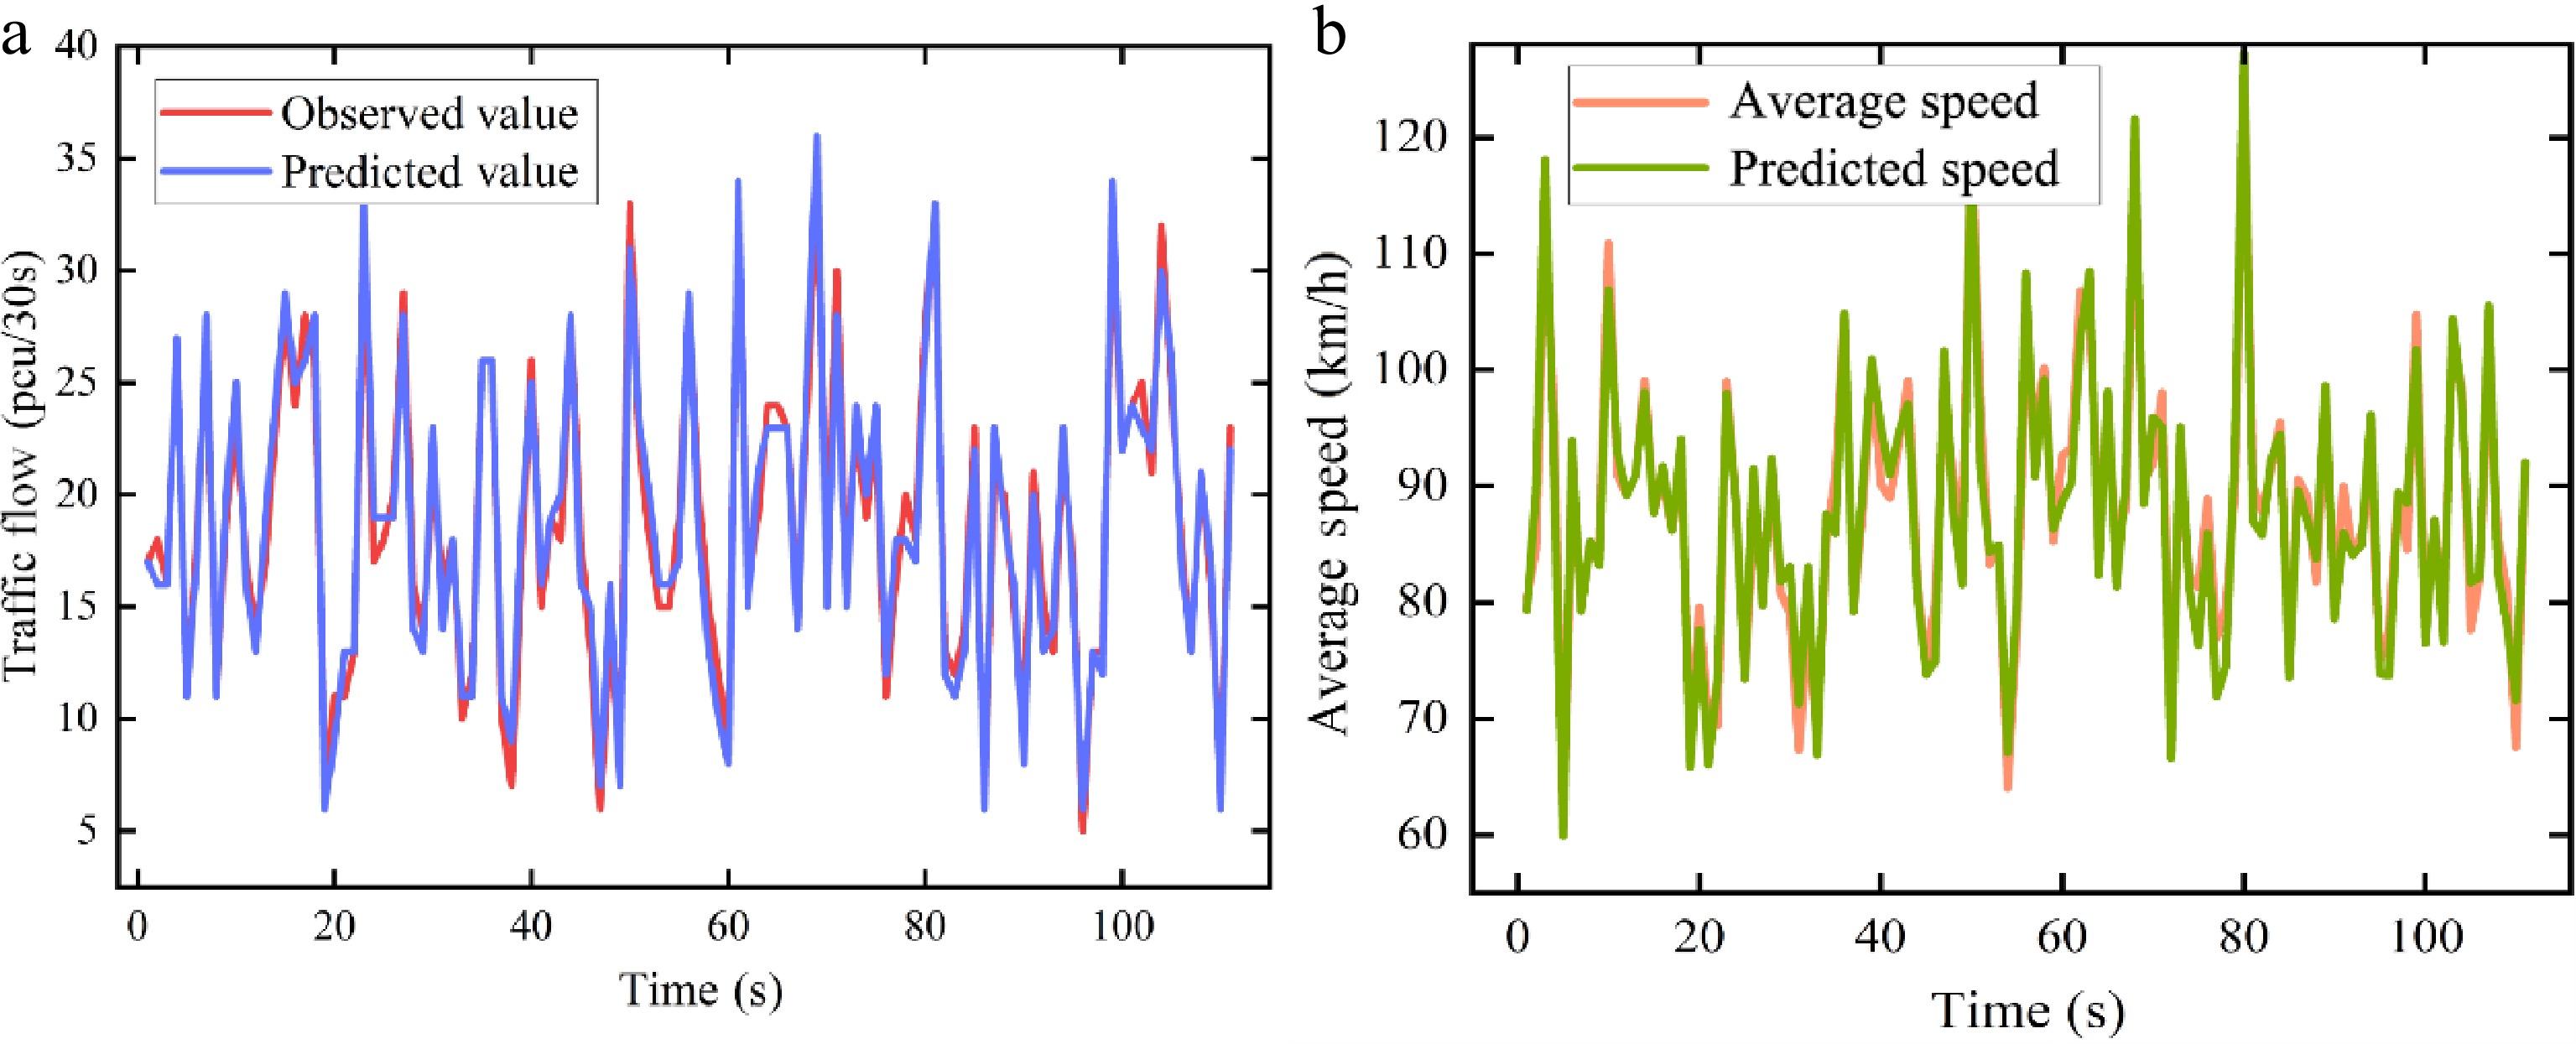
Figure 7.
Comparison of the time-varying characteristics of predicted and actual traffic flow.
Based on the time-series comparison between the predicted and observed values in Fig. 7, scatter plots of the predicted and observed values for traffic flow and average speed are further presented in Fig. 8 to validate the predictive performance of the model from the perspective of the overall fitting relationship.
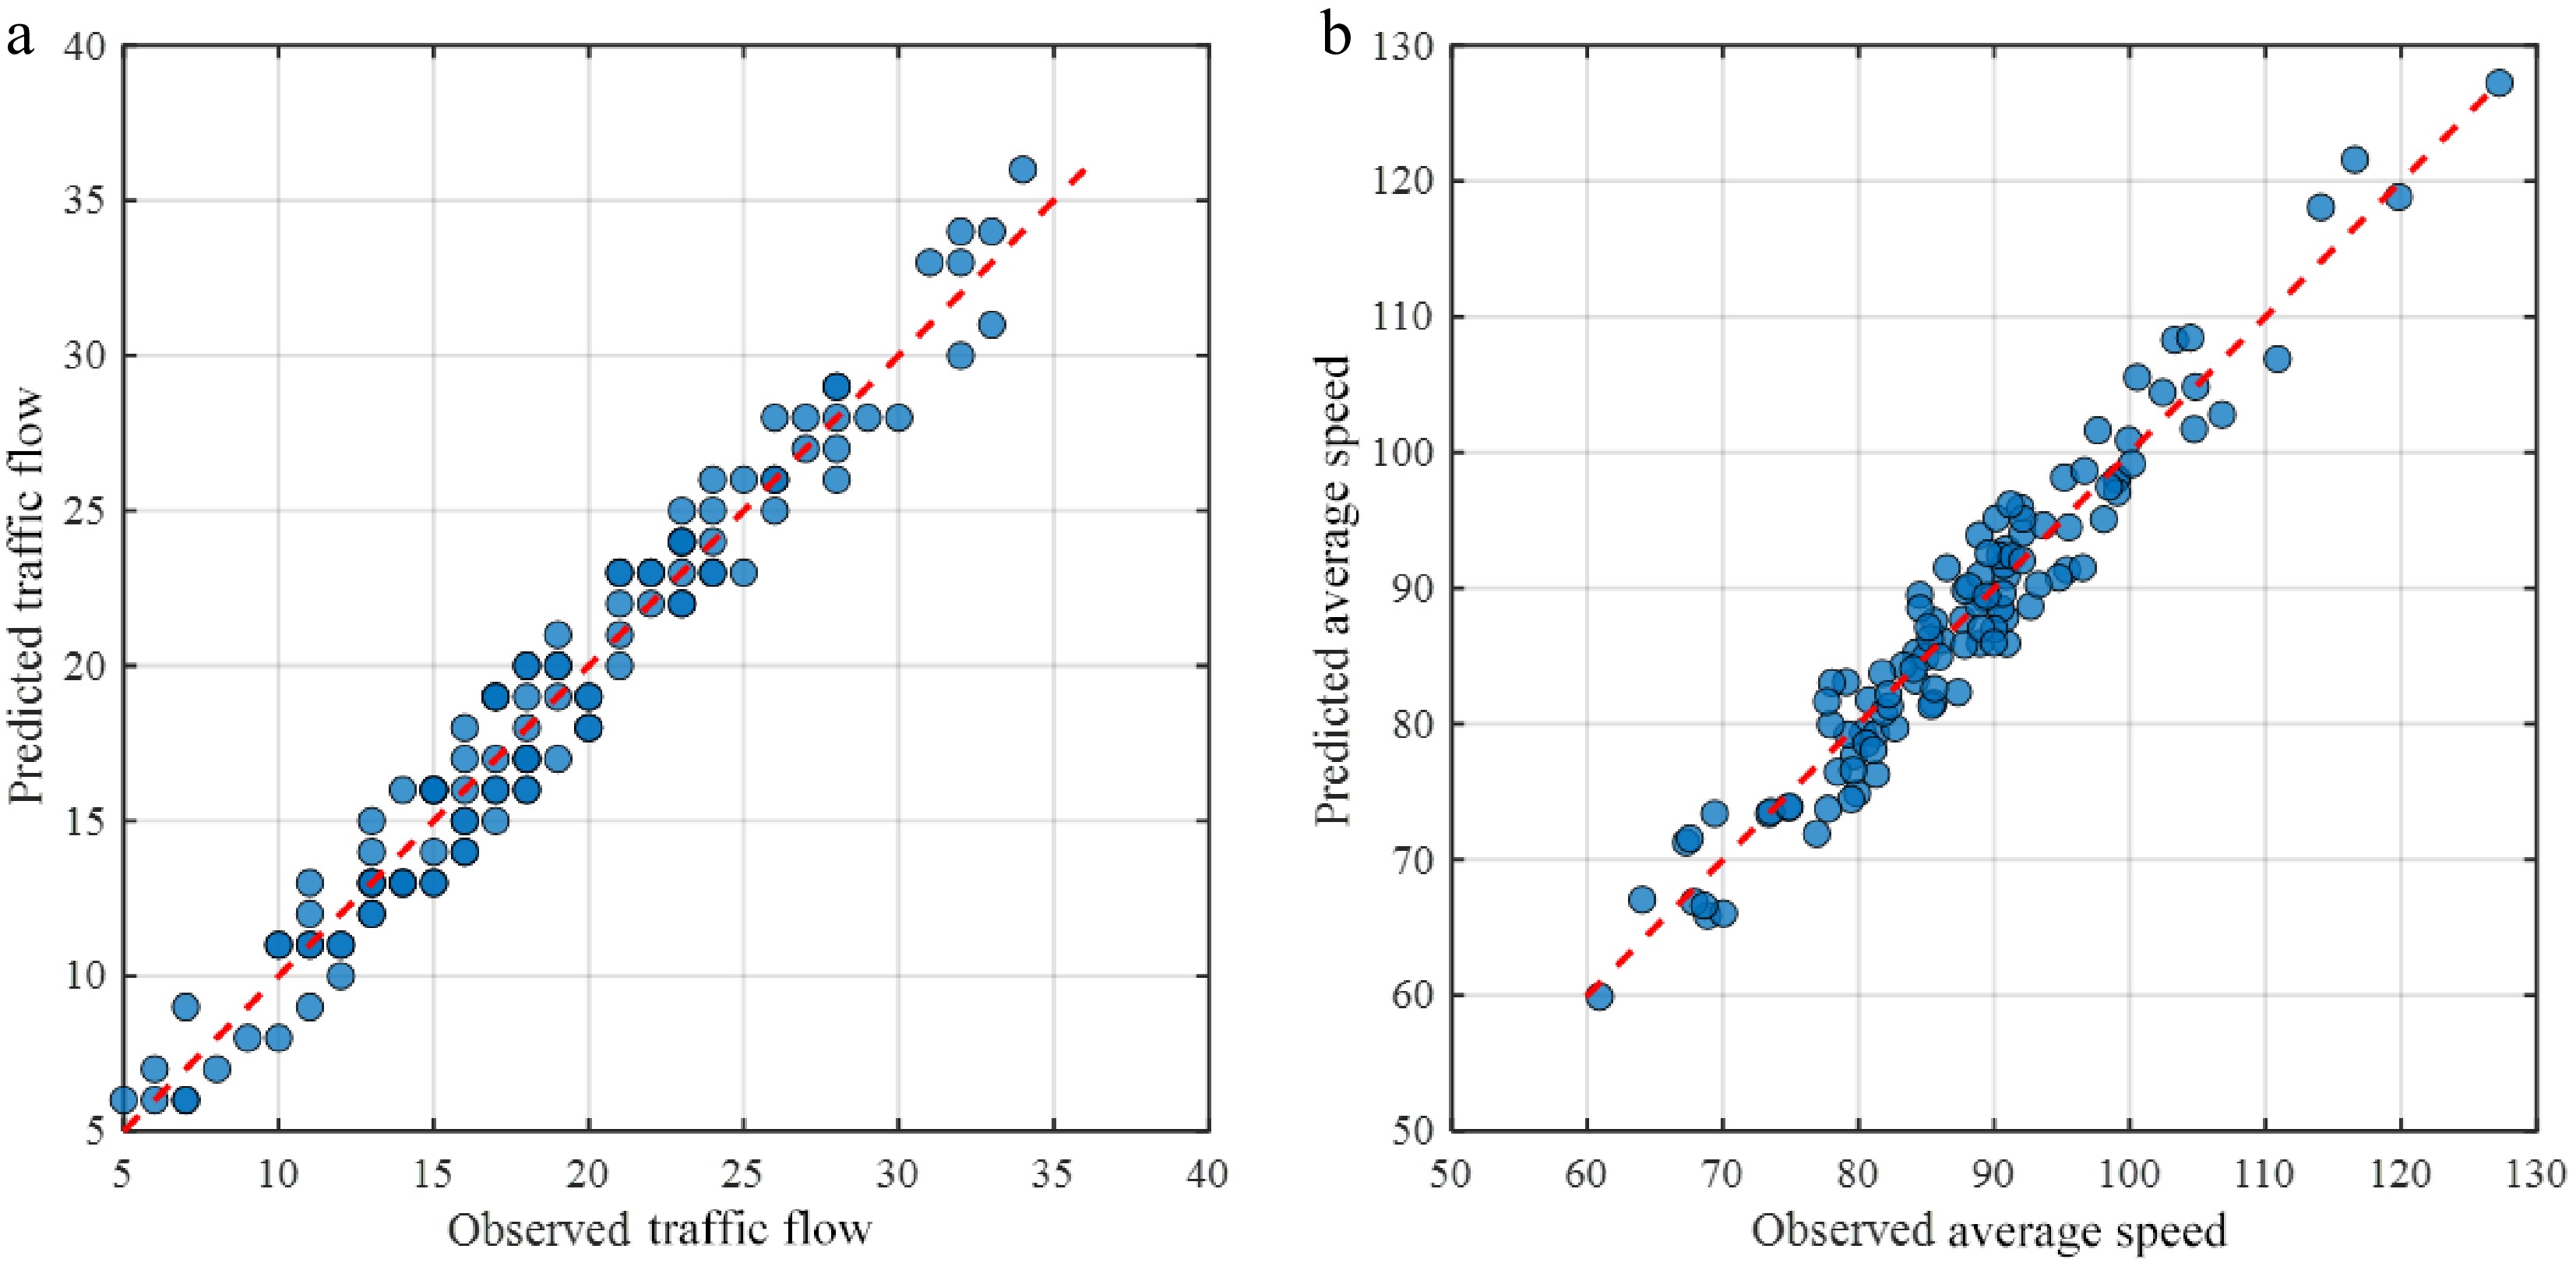
Figure 8.
Observed vs predicted scatter plots for traffic flow and average speed.
As shown in Fig. 8, the scatter points of the predicted and observed values for traffic flow and average speed are generally distributed around the y = x reference line, indicating that the model can effectively capture the short-term variation characteristics of traffic parameters on the study corridor. In comparison, the scatter distribution for average speed is slightly more dispersed, suggesting that speed prediction is more susceptible to local disturbances and short-term random fluctuations, and is therefore relatively more difficult. Overall, Fig. 8 further verifies the reliability of the ARIMA model for traffic flow and average speed prediction from the perspective of the overall fitting relationship, and provides support for subsequent traffic state identification and proactive activation/deactivation decisions for the emergency lane.
Using predicted traffic states as inputs, this study develops density-based congestion thresholds to support proactive congestion warning. Combining the analysis at Observation Point 3, the critical density corresponding to capacity saturation is determined to be k = 79.37 veh/km. This value is adopted as the density congestion threshold for computing the predicted congestion index. When the index exceeds the predefined threshold, the control system initiates the corresponding decision-making process. The future evolution trend of traffic density predicted by the forecasting model is illustrated in Fig. 9.
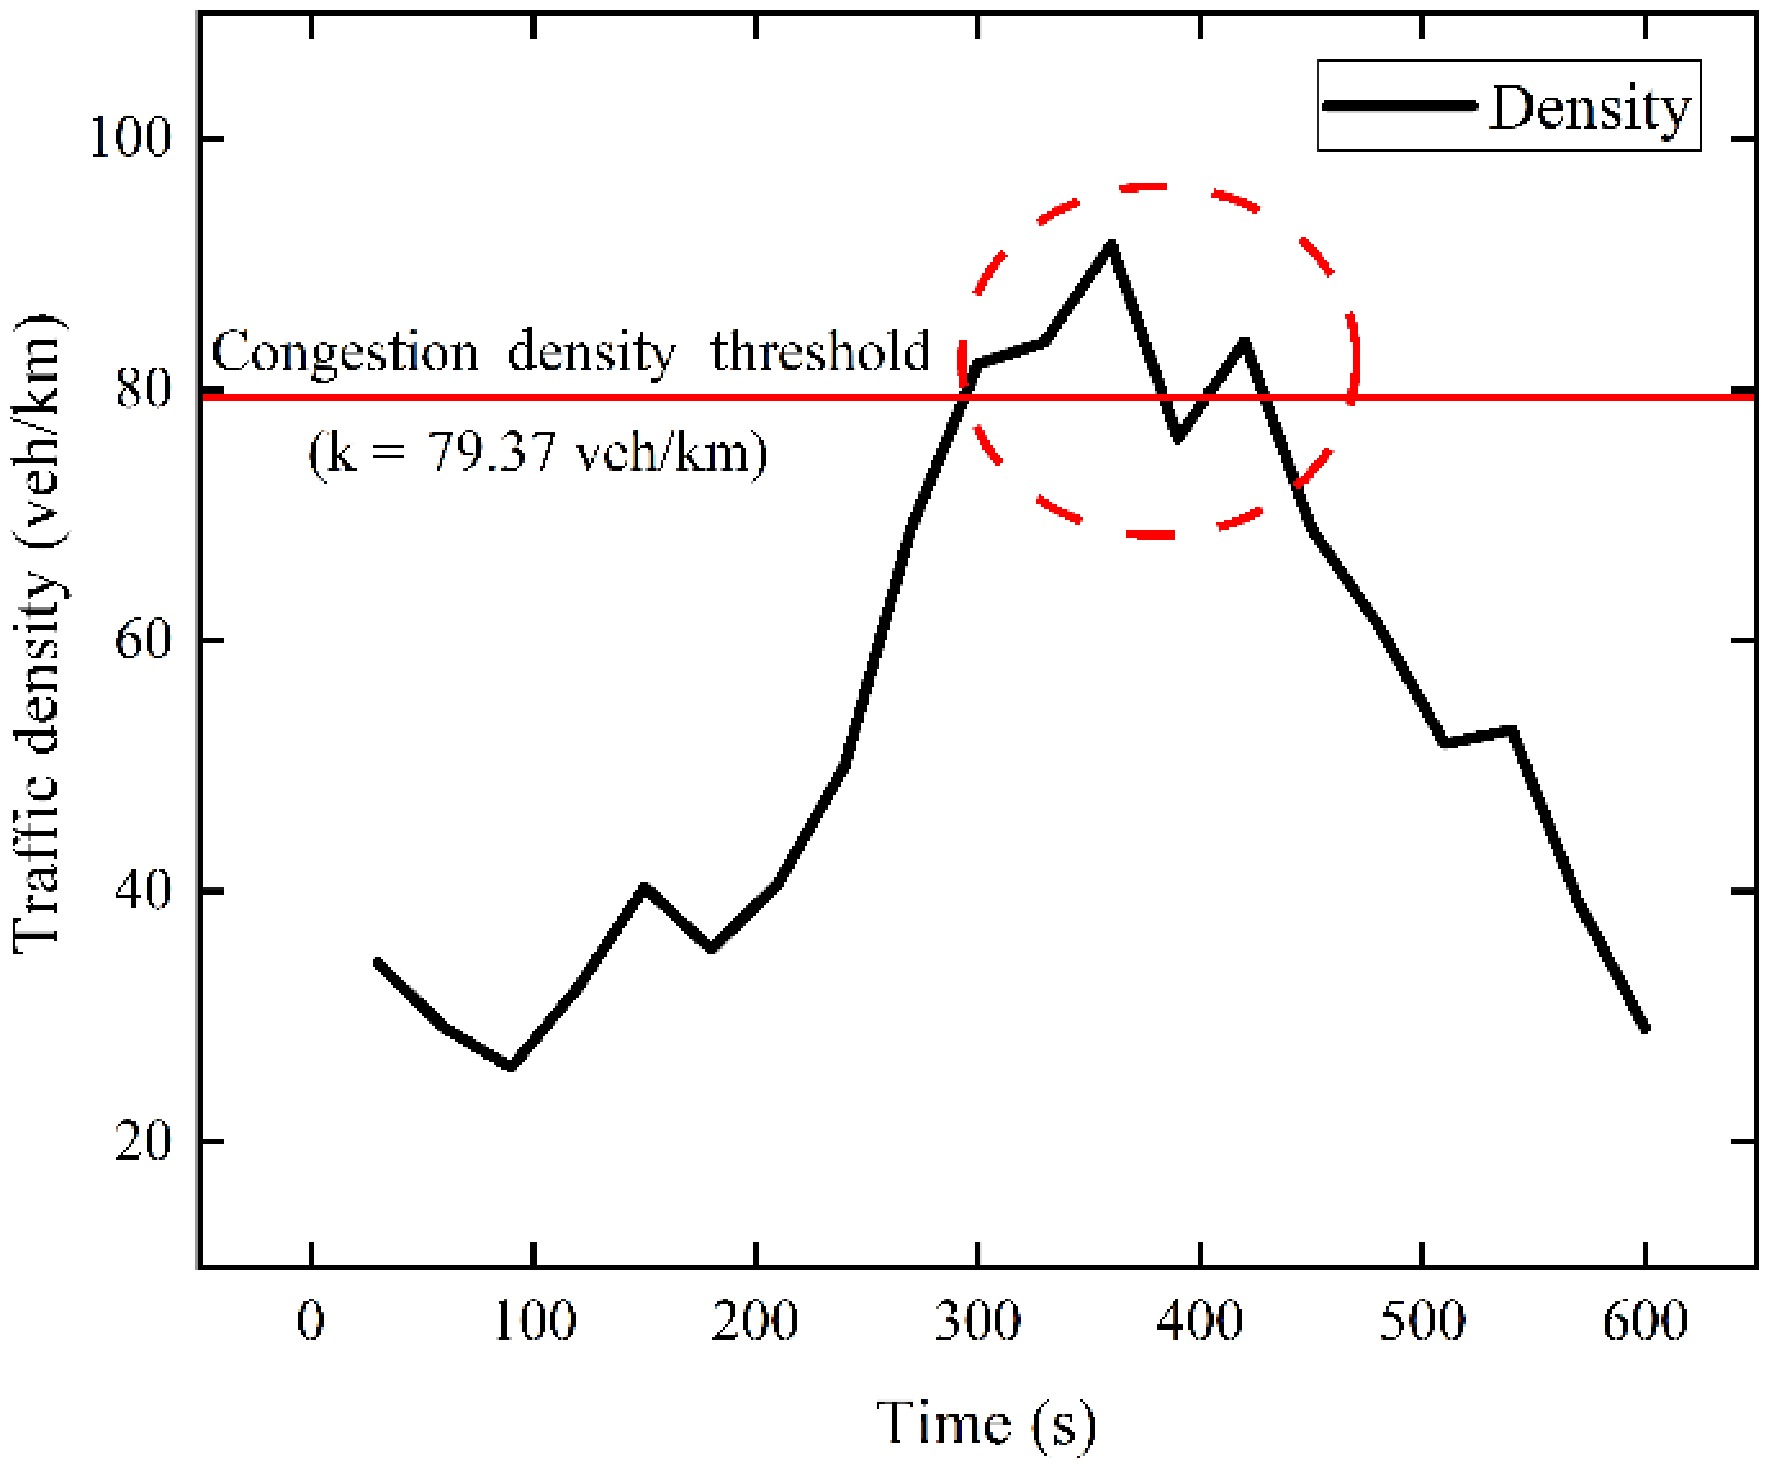
Figure 9.
Traffic density trend prediction chart.
The prediction results in Fig. 9 indicate that, within the time interval of 0−300 s, traffic density at the roadway section rises sharply toward the critical density under peak-hour conditions, mainly due to increased demand and reduced headways. Within the time window of 300–430 s, the predicted traffic density remains above the congestion density threshold. Based on this observation, a sustained congestion period of approximately 2 min is anticipated to occur on the segment between Observation Points 3 and 4 after a lead time of about 10 min. When the peak density exceeds 90 veh/km, an irreversible phase transition is expected to occur at the bottleneck segment if no external control intervention is implemented. After 430 s, the traffic density gradually decreases, and the congestion dissipates within a short period. Based on congestion prediction, the risk of a congestion episode occurring approximately 2 min later can be identified with a lead time of about 200 s, thereby providing a sufficient intervention window for proactive traffic control.
Threshold identification results
-
To identify the critical condition governing the transition of traffic flow from a stable regime to a congested regime, the flow–density data obtained from four roadside video observation points are subjected to a fitting analysis. The fitting results for each observation point are illustrated in Fig. 10.
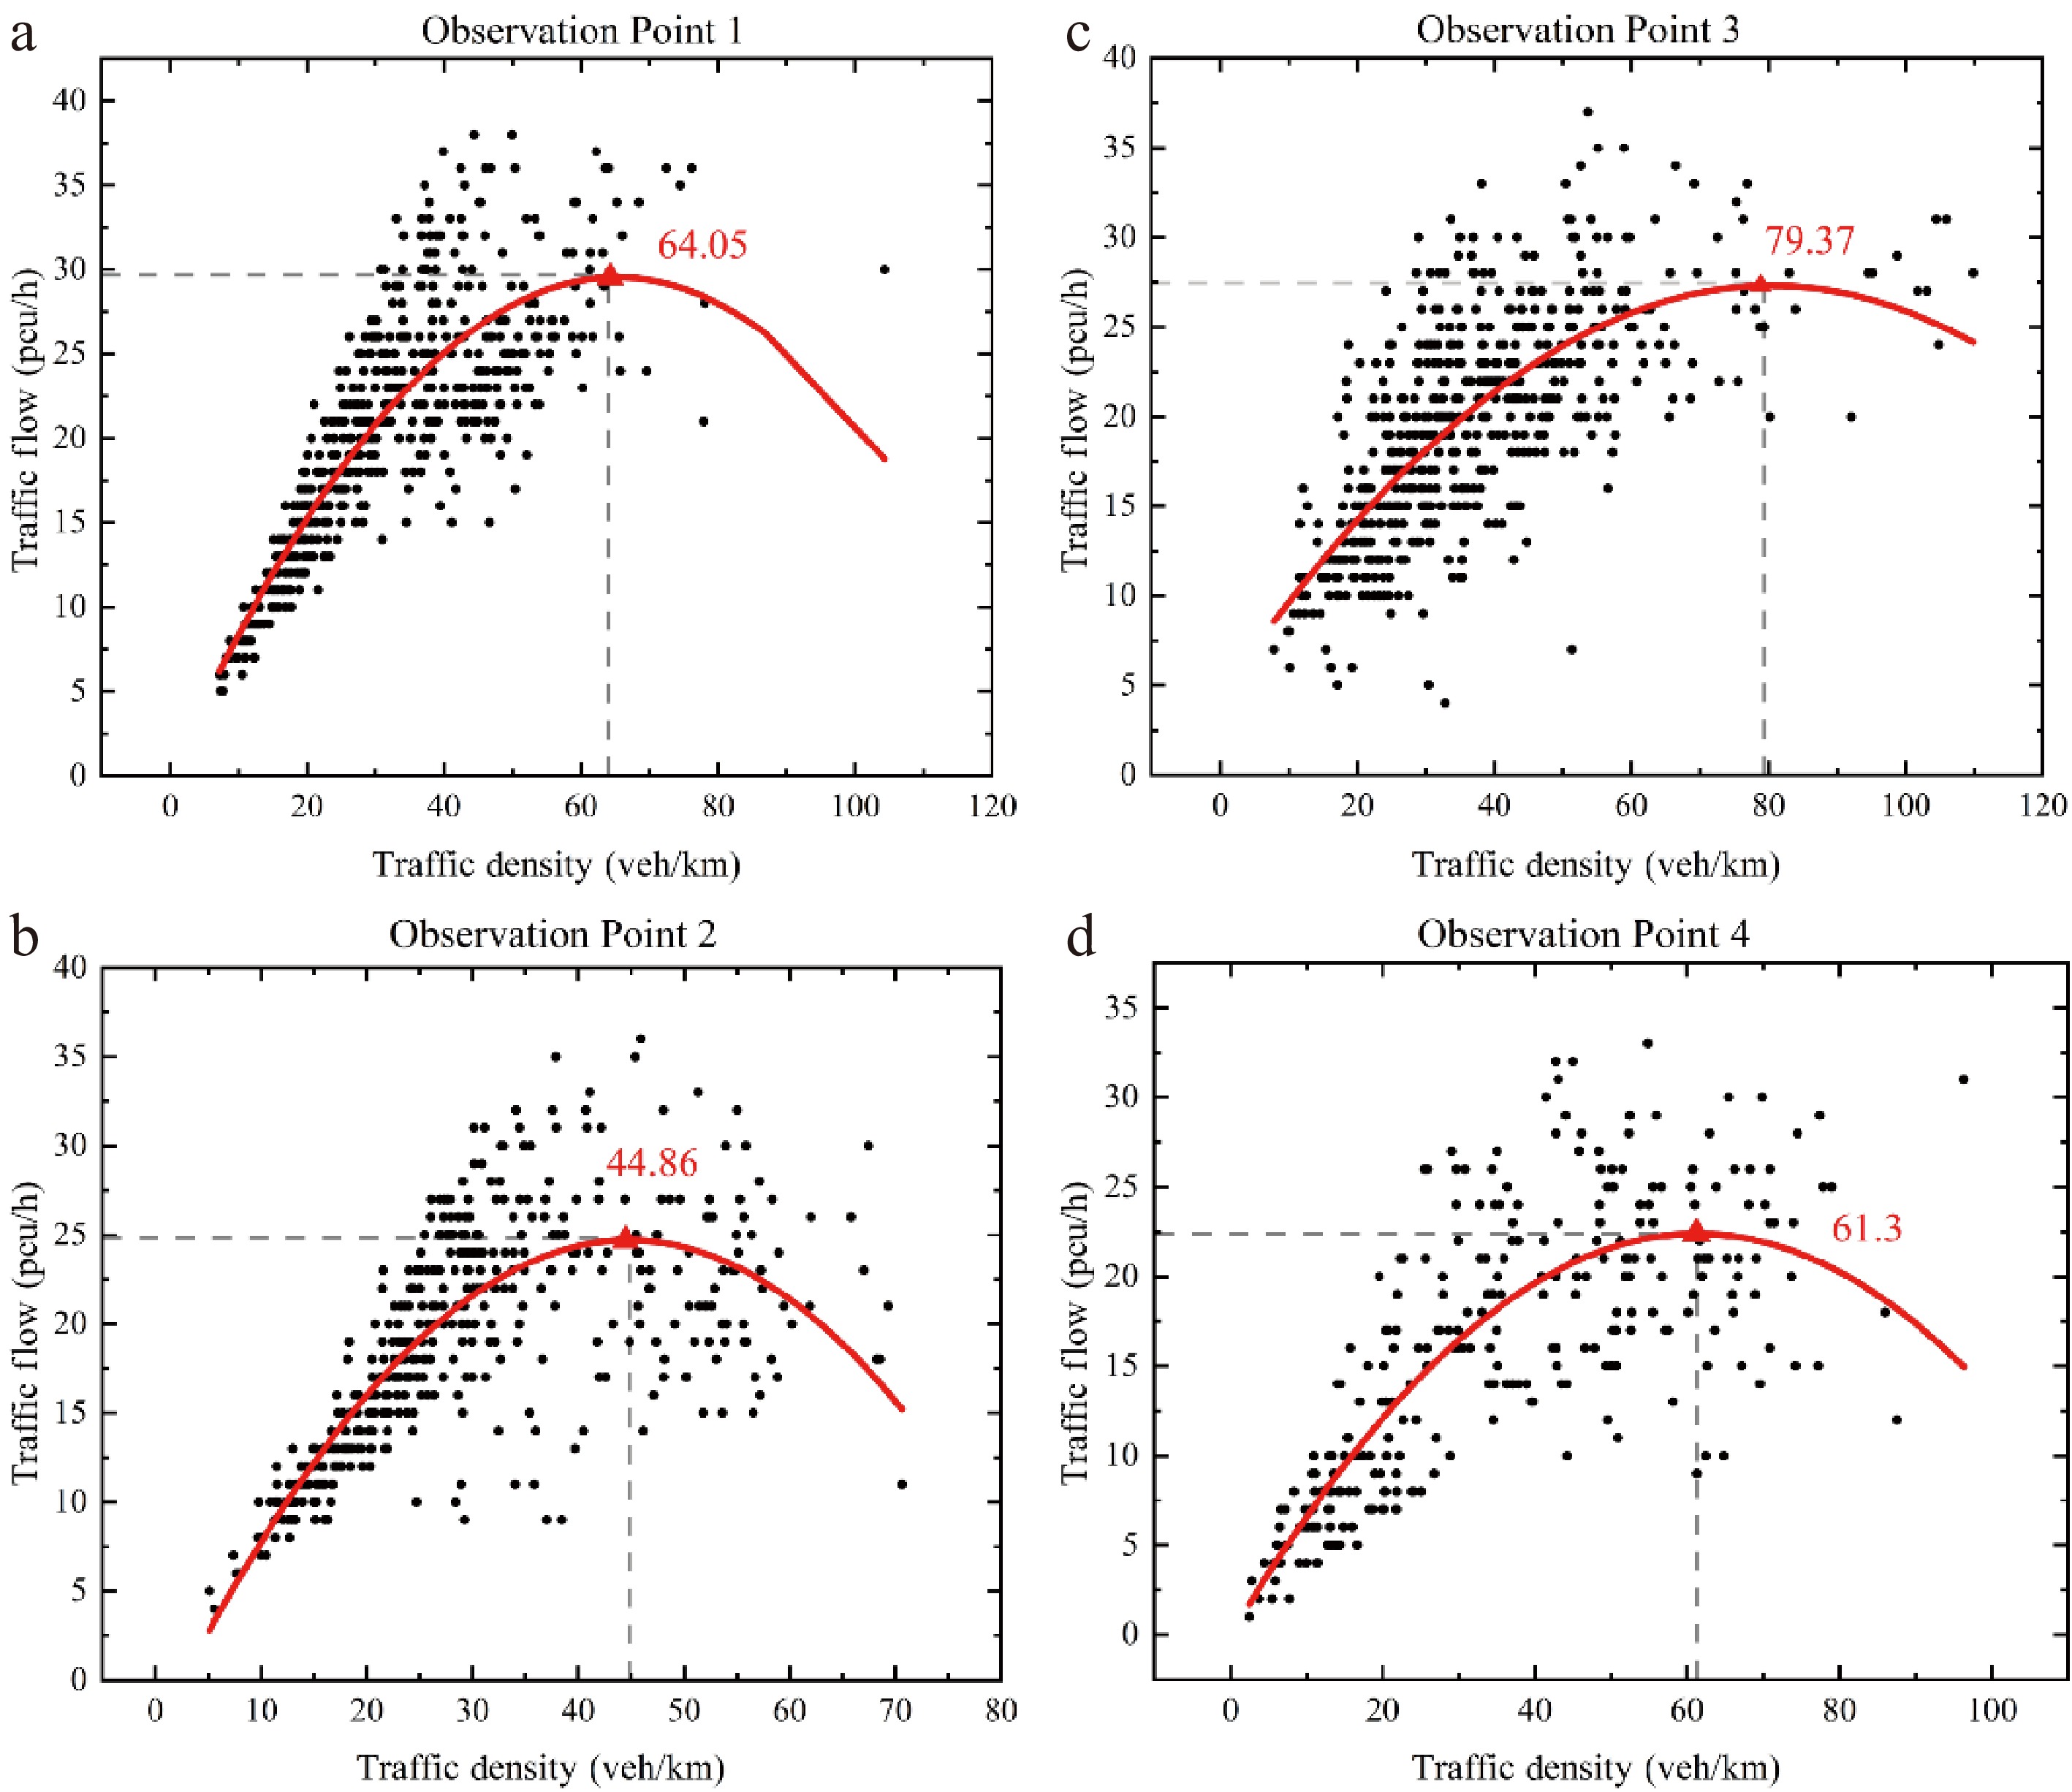
Figure 10.
Flow-density relationship diagram for each observation point. (a) Observation Point 1. (b) Observation Point 2. (c) Observation Point 3. (d) Observation Point 4.
As illustrated by the flow–density relationships at the different observation points shown in Fig. 10a–d, the comparison reveals that differences in roadway alignment, ramp merging effects from upstream and downstream, and roadside environmental conditions lead to significant spatial heterogeneity in traffic flow characteristics among observation points. The critical density at Observation Point 3 (Fig. 10c) reaches the highest value of km = 79.37 veh/km, reflecting its stronger capacity to absorb traffic demand. Conversely, Observation Point 4 (Fig. 10b) presents the lowest critical density km = 44.86 veh/km, primarily due to the combined effects of roadway alignment and downstream bottleneck constraints, which accelerate capacity saturation. The critical densities observed at Observation Point 1 (Fig. 10a), km = 64.05 veh/km, and Observation Point 2 (Fig. 10d), km = 61.3 veh/km are comparatively moderate. Therefore, the critical density at each observation point is selected as the reference value km for calculating the traffic congestion index TCI. With a safety margin coefficient of η = 1.5, the resulting congestion warning thresholds are
$ TCI_{thr}^{1} $ $ TCI_{thr}^{2} $ $ TCI_{thr}^{3} $ $ TCI_{thr}^{4} $ The study corridor exhibits clear differences in roadway geometry, ramp-weaving conditions, and downstream bottleneck constraints, which contribute to the spatial heterogeneity of traffic flow characteristics. Observation Point 3, with more favorable geometric conditions and less merging interference, shows stronger disturbance tolerance and a relatively high critical density. In contrast, Observation Point 4 is more constrained by downstream bottlenecks and local weaving conditions, making traffic flow more vulnerable to disturbances and resulting in the lowest critical density among the four points. Observation Points 1 and 2 show transitional characteristics between these two extremes. These findings indicate that HSR activation thresholds should be calibrated in a site-specific rather than uniform manner. For sections with limited traffic-carrying capacity, more sensitive warning thresholds and earlier upstream activation are recommended, whereas for sections with stronger capacity, a higher density tolerance and slightly delayed activation may be more appropriate. Therefore, incorporating spatial heterogeneity into threshold setting is essential for improving corridor-level operational efficiency and enhancing the applicability of the control strategy.
Effectiveness of emergency lane activation
-
After completing threshold identification and traffic state prediction, the effectiveness of the proposed proactive emergency lane activation strategy is further assessed. The proposed emergency lane activation model is implemented on the study corridor, and its performance is compared with traffic operations under a no-control scenario. Based on congestion warning detection, two congestion intervals are observed at Observation Points 1–3, whereas only one congestion interval is detected at Observation Point 4. The changes in the traffic congestion index at the four observation points before and after emergency lane activation are presented in Fig. 11.
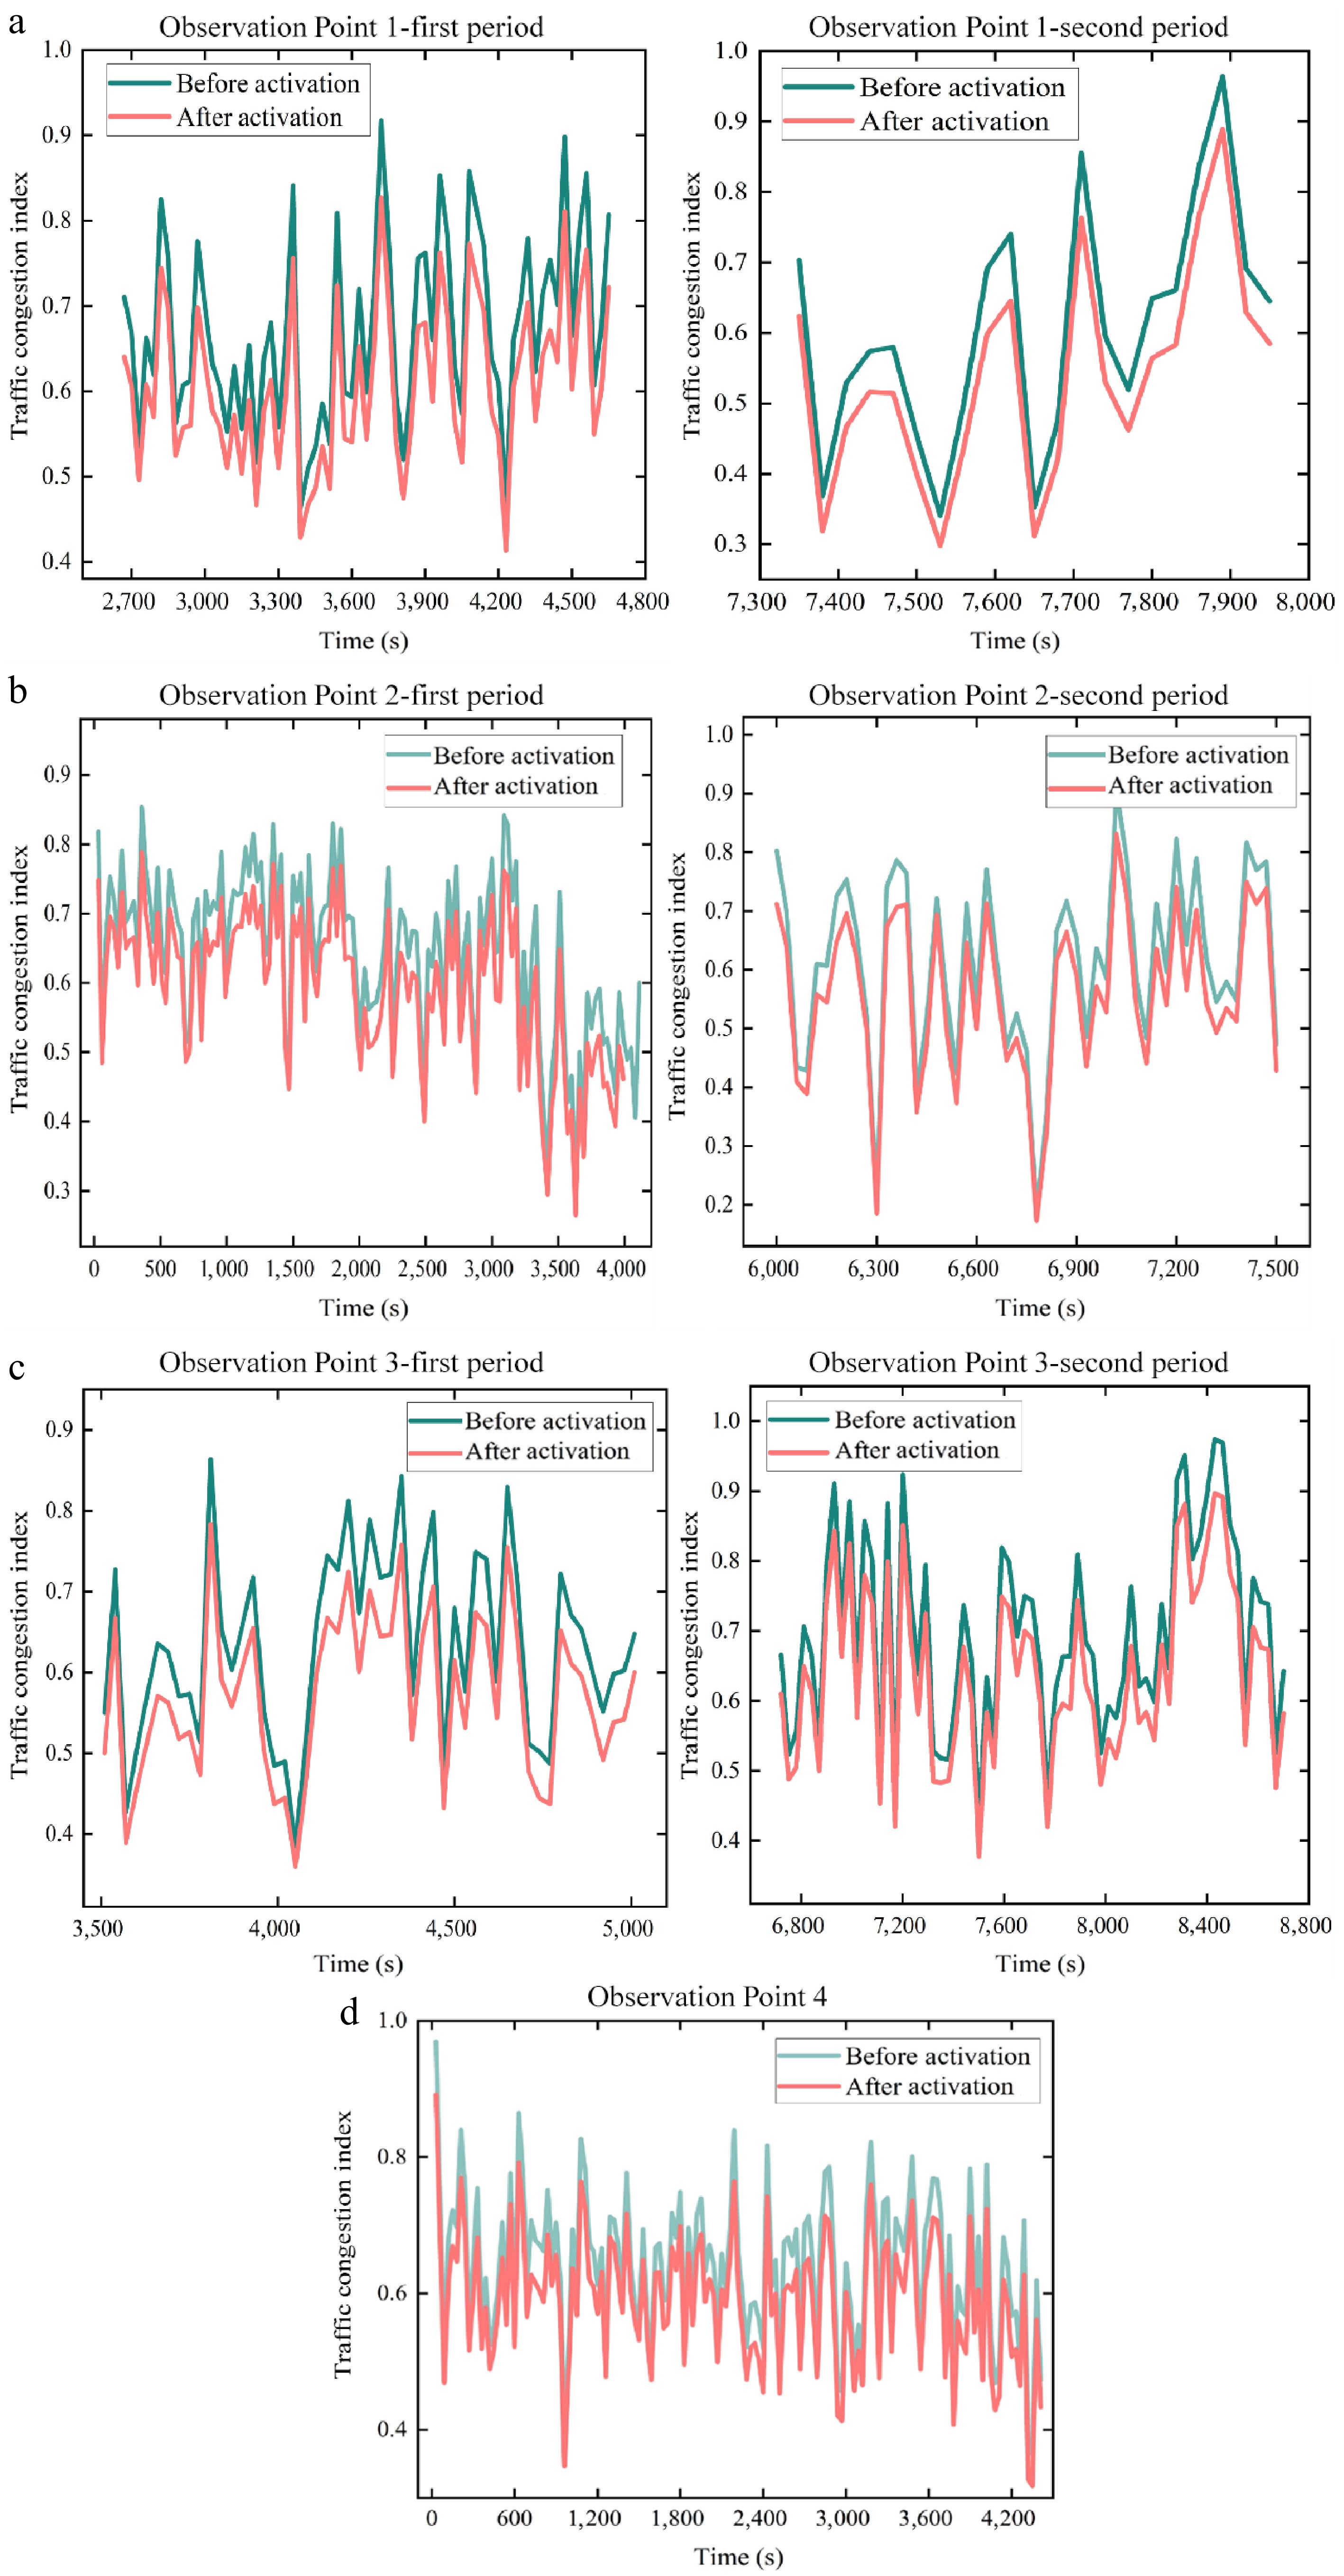
Figure 11.
Comparison of the traffic congestion index before and after the activation of emergency lanes at each observation point. (a) Observation Point 1. (b) Observation Point 2. (c) Observation Point 3. (d) Observation Point 4.
The comparison of traffic states during different congestion periods at the observation points in Fig. 11 demonstrates the pronounced optimization benefits of the proposed proactive control strategy. Regarding the congestion index[40], traffic conditions without control are characterized by pronounced high-level fluctuations across all observation points, with peak indices at Observation Points 2 and 4 repeatedly exceeding 0.9, reflecting an oversaturated regime. Following control implementation, congestion peaks are substantially reduced, and the mean congestion index declines overall. As shown in Table 3, the average congestion index decreases by 10.44%, 11.23%, 9.56%, and 8.22% at Observation Points 1–4, respectively. From the perspectives of response timeliness and traffic capacity, the congestion dissipation turning point is significantly advanced under the control strategy. Specifically, congestion duration at Observation Point 3 is shortened by approximately 15 min, the average congestion duration across the corridor is reduced by 13 min, and sectional capacity improves by around 20%. These results demonstrate that the proposed strategy, by combining proactive warning with appropriately timed emergency lane activation, enhances traffic supply near critical operating states and effectively blocks the upstream propagation of congestion waves.
Table 3. Average congestion index reduction at observation points after proactive HSR activation.
Observation point Average congestion index reduction Observation Point 1 10.44% Observation Point 2 11.23% Observation Point 3 9.56% Observation Point 4 8.22% Overall, the proposed proactive emergency lane control strategy, grounded in the integration of visual sensing and traffic flow phase transition mechanisms, exhibits significant potential for alleviating recurrent freeway congestion. The empirical evaluation shows that timely identification of phase transition windows and advanced intervention lead to an approximately 20% improvement in sectional capacity and a 13 min reduction in congestion duration. Nevertheless, considering the physical constraints of optical sensing under adverse weather and low-light environments, and the possibility that localized control strategies may trigger congestion spillovers downstream, future work will investigate the fusion of multi-source perception data to improve system robustness. Moreover, network-level cooperative control frameworks will be explored to achieve coordinated optimization and enhance the overall efficiency and resilience of the traffic system.
-
The core advantage of the proposed proactive control strategy stems from the tight coupling between microscopic visual sensing and traffic flow phase transition theory. Rather than depending on a single traffic variable, the proposed composite congestion index leverages inverse perspective mapping and multi-object tracking to correct video distortions and recover complete vehicle trajectory data, thereby allowing accurate detection of the critical density at which traffic flow transitions from stable to congested states. By incorporating an ARIMA-based short-term forecasting mechanism, the proposed decision framework gains predictive foresight, enabling the identification of emerging congestion trends before irreversible degradation in traffic flow occurs. Early intervention through appropriately timed emergency lane activation expands bottleneck capacity and suppresses the propagation of traffic shockwaves, thereby delaying congestion onset and promoting faster congestion dissipation.
Relative to conventional passive control strategies relying on fixed empirical thresholds, the proposed dynamic decision framework exhibits clear performance advantages. The identification of heterogeneous critical densities across roadway sections enables the formulation of dynamic, geometry-aware thresholds, effectively addressing the failure of static threshold schemes under spatially heterogeneous traffic conditions. In addition, the introduction of hysteresis control and a safety margin alleviates control command chattering arising from random flow fluctuations around critical thresholds. By maintaining control stability, this mechanism effectively avoids lateral collision risks associated with frequent lane-changing maneuvers, while safeguarding traffic efficiency and operational safety.
It is worth further noting that the role of the hysteresis control mechanism is not limited to suppressing control command oscillations near the threshold, but also to providing a necessary buffer between response sensitivity and control stability. When traffic conditions fluctuate briefly around the critical threshold due to random disturbances, a single-threshold triggering strategy may cause frequent switching of HSR activation and deactivation, leading to discontinuous control logic and reduced stability of management commands. By contrast, the introduction of a hysteresis interval and a safety margin can effectively filter out unnecessary responses caused by transient fluctuations, so that control state transitions occur only when traffic conditions deviate persistently from the threshold. This improves the continuity and robustness of system decision-making. From a safety perspective, frequent opening and closing of the HSR may induce repeated lane-changing and merging maneuvers, increase driver decision-making burden, and intensify the risk of lateral conflicts in shoulder transition areas. By reducing repeated short-term switching, hysteresis control provides drivers with more stable expectations and a smoother traffic organization environment, thereby helping reduce lateral collision risk and local traffic disturbances while also avoiding ineffective activation and improving the practical efficiency of the control strategy.
Despite the promising experimental results, the real-world applicability of the proposed data-driven proactive control model is constrained by several practical factors. Specifically, the dependence on optical sensing makes the system vulnerable to performance degradation in adverse weather conditions and low-light scenarios, potentially affecting detection accuracy and robustness. Regarding control strategy formulation, the present locally optimal scheme focuses on single-section control and fails to explicitly consider the downstream spillover effects caused by increased merging demand following emergency lane activation. This limitation may lead to unintended congestion propagation or relocation. Beyond the above control-related limitations, the short-term prediction model that supports proactive decision-making also has some potential limitations.
Although the ARIMA model performed well in this study and effectively supported short-term traffic state prediction, it is inherently a linear time-series model and still has limitations in capturing complex nonlinear relationships, sudden disturbances, and traffic state evolution under multi-factor coupling. When traffic conditions are influenced by external disturbances such as weather changes, traffic incidents, or fluctuations in driving behavior, their prediction accuracy and ability to characterize abrupt changes may decrease. Therefore, ARIMA remains a reasonable and efficient tool for short-term prediction in the current research context, particularly for freeway proactive management scenarios that require high real-time performance and computational efficiency. However, in more complex traffic environments, future work may consider introducing Long Short-Term Memory (LSTM) networks or Gated Recurrent Units (GRU) to better characterize the nonlinear temporal dependencies of traffic flow[41]. Spatiotemporal Graph Convolutional Networks (STGCN) may also be incorporated to account for spatial spillover effects between upstream and downstream roadway segments[42]. In real-world freeway applications, a careful trade-off is still needed between the higher data and computational demands of deep learning models and the low-latency, real-time advantages of ARIMA.
Taken together, these limitations indicate that further improvements are needed not only in spatial control coordination but also in traffic state perception and short-term prediction under complex operating conditions. Future studies should explore the fusion of multi-source heterogeneous data to improve perception robustness under diverse operating conditions. Meanwhile, more advanced forecasting models may be introduced to better capture nonlinear temporal dependencies and spatial spillover effects in traffic flow. In addition, future research should move beyond localized control toward network-wide coordinated frameworks that enable regional collaboration through joint mainline–ramp regulation, thereby enhancing overall traffic system efficiency and resilience.
-
This study investigated proactive and dynamic opening and closing control of the freeway emergency lane at recurrent bottleneck segments using empirical surveillance video data collected on the Nanjing–Changshen Expressway. A closed-loop framework was established that links video-based traffic perception, congestion state identification, and stable activation and deactivation decisions for operational deployment.
First, a control grade perception pipeline was developed to extract vehicle trajectories and macroscopic variables from roadside video, providing reliable real-time inputs for traffic management. The proposed vision-based detection and tracking procedure supports continuous monitoring under realistic field conditions and forms the data foundation for dynamic lane operation.
Second, a composite congestion index was constructed to characterize bottleneck operating regimes more robustly than single variable triggers. Short-term forecasting of key variables was integrated to provide an intervention window for proactive decision making, and the prediction performance achieved mean absolute percentage errors of 2.11% for traffic flow and 1.37% for average speed, with coefficients of determination of 0. 968 and 0.973, respectively.
Third, the decision logic incorporated phase transition awareness and a hysteresis mechanism to improve operational stability near critical regimes. Empirical evaluations indicate that proactive emergency lane operation can mitigate supply-demand imbalance at bottlenecks, suppress the upstream propagation of congestion, and promote faster congestion dissipation compared with purely passive activation rules.
Several limitations warrant further research. Future work should validate the framework across multiple sites and geometric configurations, extend the model to incident-induced and weather-affected conditions, and explicitly incorporate compliance, safety constraints, and coordinated control with upstream measures such as variable speed limits and ramp metering to strengthen transferability and real-world implementability.
-
The authors confirm contributions to the paper as follows: study conception and design: Wu W; methodology, validation: Ma C, Liu Y; data curation, formal analysis, investigation, writing – original draft: Jin C, Shu Q; visualization: Ma C; software: Liu Y; writing – review & editing: Wu W, Liu Y, Jia H; supervision, project administration: Wu W. All authors reviewed the results and approved the final version of the manuscript.
-
The datasets generated during and analyzed in the current study are available from the corresponding author on reasonable request.
-
This research was supported by the Natural Science Foundation of Chongqing, China (Grant No. CSTB2025NSCQ-JQX0007), the Science and Technology Research Program of Chongqing Municipal Education Commission (Grant No. KJZD-M202500702), the National Natural Science Foundation of China (Grant Nos 72571121 and 52502423), and the Basic Research Program of the Gansu Provincial Science and Technology Plan (Grant No. 25JRRA221).
-
The authors declare that they have no conflict of interest.
- Copyright: © 2026 by the author(s). Published by Maximum Academic Press, Fayetteville, GA. This article is an open access article distributed under Creative Commons Attribution License (CC BY 4.0), visit https://creativecommons.org/licenses/by/4.0/.
-
About this article
Cite this article
Jin C, Wu W, Shu Q, Ma C, Liu Y, et al. 2026. Proactive activation and deactivation of freeway hard shoulder running using video-based traffic perception. Digital Transportation and Safety 5(2): 123−135 doi: 10.48130/dts-0026-0010 

Proactive activation and deactivation of freeway hard shoulder running using video-based traffic perception
- Received: 22 January 2026
- Revised: 27 March 2026
- Accepted: 27 April 2026
- Published online: 29 June 2026
Abstract: Recurrent freeway congestion at bottlenecks is often aggravated by delayed and passive emergency-lane operation, while roadside surveillance videos remain underutilized for control-grade decision making. This paper proposes a video-driven, closed-loop strategy for proactive hard-shoulder running (HSR) activation and deactivation. First, an integrated perception pipeline combining vehicle detection, multi-object tracking, inverse perspective mapping, and scale calibration is developed to mitigate perspective distortion and extract full-sample trajectories, enabling reliable estimation of macroscopic variables (flow, speed, and density). Second, a bounded Traffic Congestion Index (TCI) is constructed by fusing flow, density, and speed, where indicator weights are adaptively determined using an entropy-weight method to enhance robustness under nonlinear fluctuations. Third, short-term traffic states are forecast using an ARIMA model to provide early warning, and phase-transition-aware thresholds are derived by referencing the critical density at capacity. A hysteresis mechanism with a safety margin is further introduced to suppress command chattering near critical regimes. A case study on the Donglushan segment of the Nanjing–Changshen Expressway demonstrates that the proposed framework can identify an effective intervention window about 200 s before congestion onset. With proactive HSR operation, effective sectional capacity increases by approximately 20%, the average TCI at bottleneck segments decreases by 9.86%, and congestion duration is shortened by about 13 min, indicating improved operational efficiency and traffic self-recovery resilience.