










-
Autonomous vehicles are widely regarded as a key technology for improving traffic safety and alleviating congestion[1]. As a result, they have garnered strategic support from governments worldwide and have been implemented in pilot applications by several enterprises. However, the deployment of autonomous vehicles in practical operations requires rigorous validation of their safety performance to eliminate potential risks. Prior to large-scale adoption, it is therefore essential to conduct comprehensive and systematic safety testing to ensure that these vehicles meet safety standards acceptable to the public[2]. Current testing methodologies primarily include real-world road testing, simulation testing, and closed-course testing[3,4]. Among these approaches, the design and construction of reasonable and representative test scenarios serve as the foundation for effective safety testing and evaluation of autonomous vehicles.
The complexity and diversity of real-world driving environments present significant challenges for constructing realistic and reliable test scenarios. Current approaches to scenario construction primarily rely on real-world data collection, simulation environment generation, and public dataset aggregation[5]. These scenarios are generated using rule-based methods, statistical techniques, and machine learning algorithms. For example, PEGASUS[6] established a comprehensive scenario database through field tests, naturalistic driving studies, and traffic accident data, leveraging this database to validate autonomous driving systems. Similarly, Distefano & Leonardi[7] employed descriptive statistics on naturalistic driving data to generate test scenarios that closely resemble real-world driving conditions. Although these methods, which integrate extensive naturalistic driving data, accident records, and expert opinions, effectively address scenario diversity, they often fail to capture critical yet low-probability scenarios[8]. Additionally, the generated scenarios tend to lack specificity and representativeness, making it difficult to fully meet the unique demands of autonomous vehicle safety evaluation. Consequently, there is an urgent need to develop more targeted approaches for constructing representative test scenarios. Such methods should focus on analyzing the impact of scenario elements on vehicle behavior and optimizing strategies for scenario generation to ensure comprehensive and effective safety assessments.
In the field of scenario element extraction and analysis, Wang & Zhao[9] utilized non-parametric Bayesian learning to automatically extract scenario primitives. Zhang & Wang[10] segmented vehicle scenario sequences into interpretable primitives and performed unsupervised clustering, providing a comprehensive characterization of specific test scenario elements. Similarly, Xia et al.[11,12] and Gao et al.[13,14] applied the analytic hierarchy process to evaluate the importance of scenario elements, identifying critical components for scenario construction. Roesener et al.[15] extracted traffic scenario features from real-world driving data, classified scenarios, and segmented them into temporal sequences. Rahman et al.[16] developed evaluation metrics combining safety and traffic efficiency using parameter assignment methods to analyze the influence of scenario elements on vehicle behavior. Junietz et al.[17] identified key scenario elements impacting autonomous driving safety evaluation by considering factors influencing driving task difficulty. While these studies have advanced the understanding of scenario element extraction and analysis, several challenges remain. The representation of scenario diversity is often inadequate, and the precision of automated identification of critical scenarios is limited. Moreover, the analysis of vehicle behavior under the influence of multiple interacting factors remains insufficiently detailed. There is also a lack of thorough exploration into how to interpret and design the composition of elements associated with specific test performance metrics, highlighting the need for further research in these areas.
In test scenario generation, three primary methods are widely used: random sampling, parameter combination, and deep neural networks[18]. Random sampling typically involves extracting probabilistic models from real-world scenario data and generating scenario parameters using techniques such as Monte Carlo simulation[19]. However, the complexity of data analysis and model construction in the preliminary stages often limits this method to generating simple test scenarios that account for single-vehicle behaviors. To address these limitations, Zhao et al.[20] and Ge et al.[21] applied importance sampling and dynamic random sampling, respectively, to increase the proportion of high-risk test scenarios. Similarly, Feng et al.[22] and Xu et al.[23] enhanced the probability of generating critical test scenarios by defining scenario criticality parameters. Despite these advancements, random sampling based on real-world data is inherently constrained by the dataset, making it challenging to generate scenarios that are not represented in the original data.
In contrast, combinatorial testing systematically explores parameter combinations, overcoming random sampling's dependence on real-world data and achieving more comprehensive coverage of critical scenarios. This approach enhances the diversity and completeness of generated test scenarios[24] and has gained significant traction in recent years. Zhu et al.[25] and Duan et al.[26] introduced greedy-based and complexity-based combinatorial testing methods, respectively, to improve coverage, testing efficiency, and the complexity of test scenarios. Furthermore, Hu et al.[27] proposed a combinatorial testing approach integrated with Bayesian networks to generate test scenarios with full parameter space coverage. However, this method is limited to static or quasi-static scenarios. For logical scenarios with large parameter spaces and numerous discrete parameter values across dimensions, combinatorial testing struggles to achieve optimal testing efficiency. Deep neural network-based methods address these challenges by learning latent features from real-world data, enabling the rapid reconstruction of numerous realistic test scenarios. Jia et al.[28] and Feng et al.[29] employed conditional generative adversarial imitation learning and dense reinforcement learning, respectively, to generate test scenarios that consider surrounding vehicle behaviors, thereby improving the coverage of critical scenarios. However, due to the limited variety of surrounding vehicle motion parameters, these methods often fail to comprehensively represent the full spectrum of scenario characteristics. Therefore, while ensuring the quantity of generated test scenarios, it is crucial to strike a balance between the criticality and coverage of the scenarios to establish a more robust and effective evaluation framework.
In summary, constructing a targeted and high-quality typical test scenario library is crucial for autonomous driving safety testing. However, current research often relies on single-dimensional scenario screening metrics and lacks optimized methods that balance both the efficiency and quality of scenario generation. To address these challenges, this paper proposes a method for constructing typical test scenarios for autonomous driving safety evaluation. Based on an exploration of the coupling mechanisms between safety evaluation requirements and test scenario elements, the proposed method comprehensively considers scenario criticality and test case coverage, ensuring that safety evaluation objectives are met while preserving the relevance and effectiveness of the generated scenarios.
-
The test scenario construction method proposed in this paper is depicted in Fig. 1. First, the test scenario elements are categorized into dynamic and static elements. By exploring the coupling mechanisms between autonomous driving safety features and scenario elements, key dynamic elements are selected. For static elements, an exhaustive search method is employed to identify relevant features. Next, a variable-intensity combinatorial testing strategy is used to recombine the selected dynamic and static elements, creating a multidimensional functional scenario set for autonomous driving safety testing. Finally, k-prototypes clustering is applied to generate representative and targeted typical test cases for virtual testing and evaluation of autonomous driving safety.
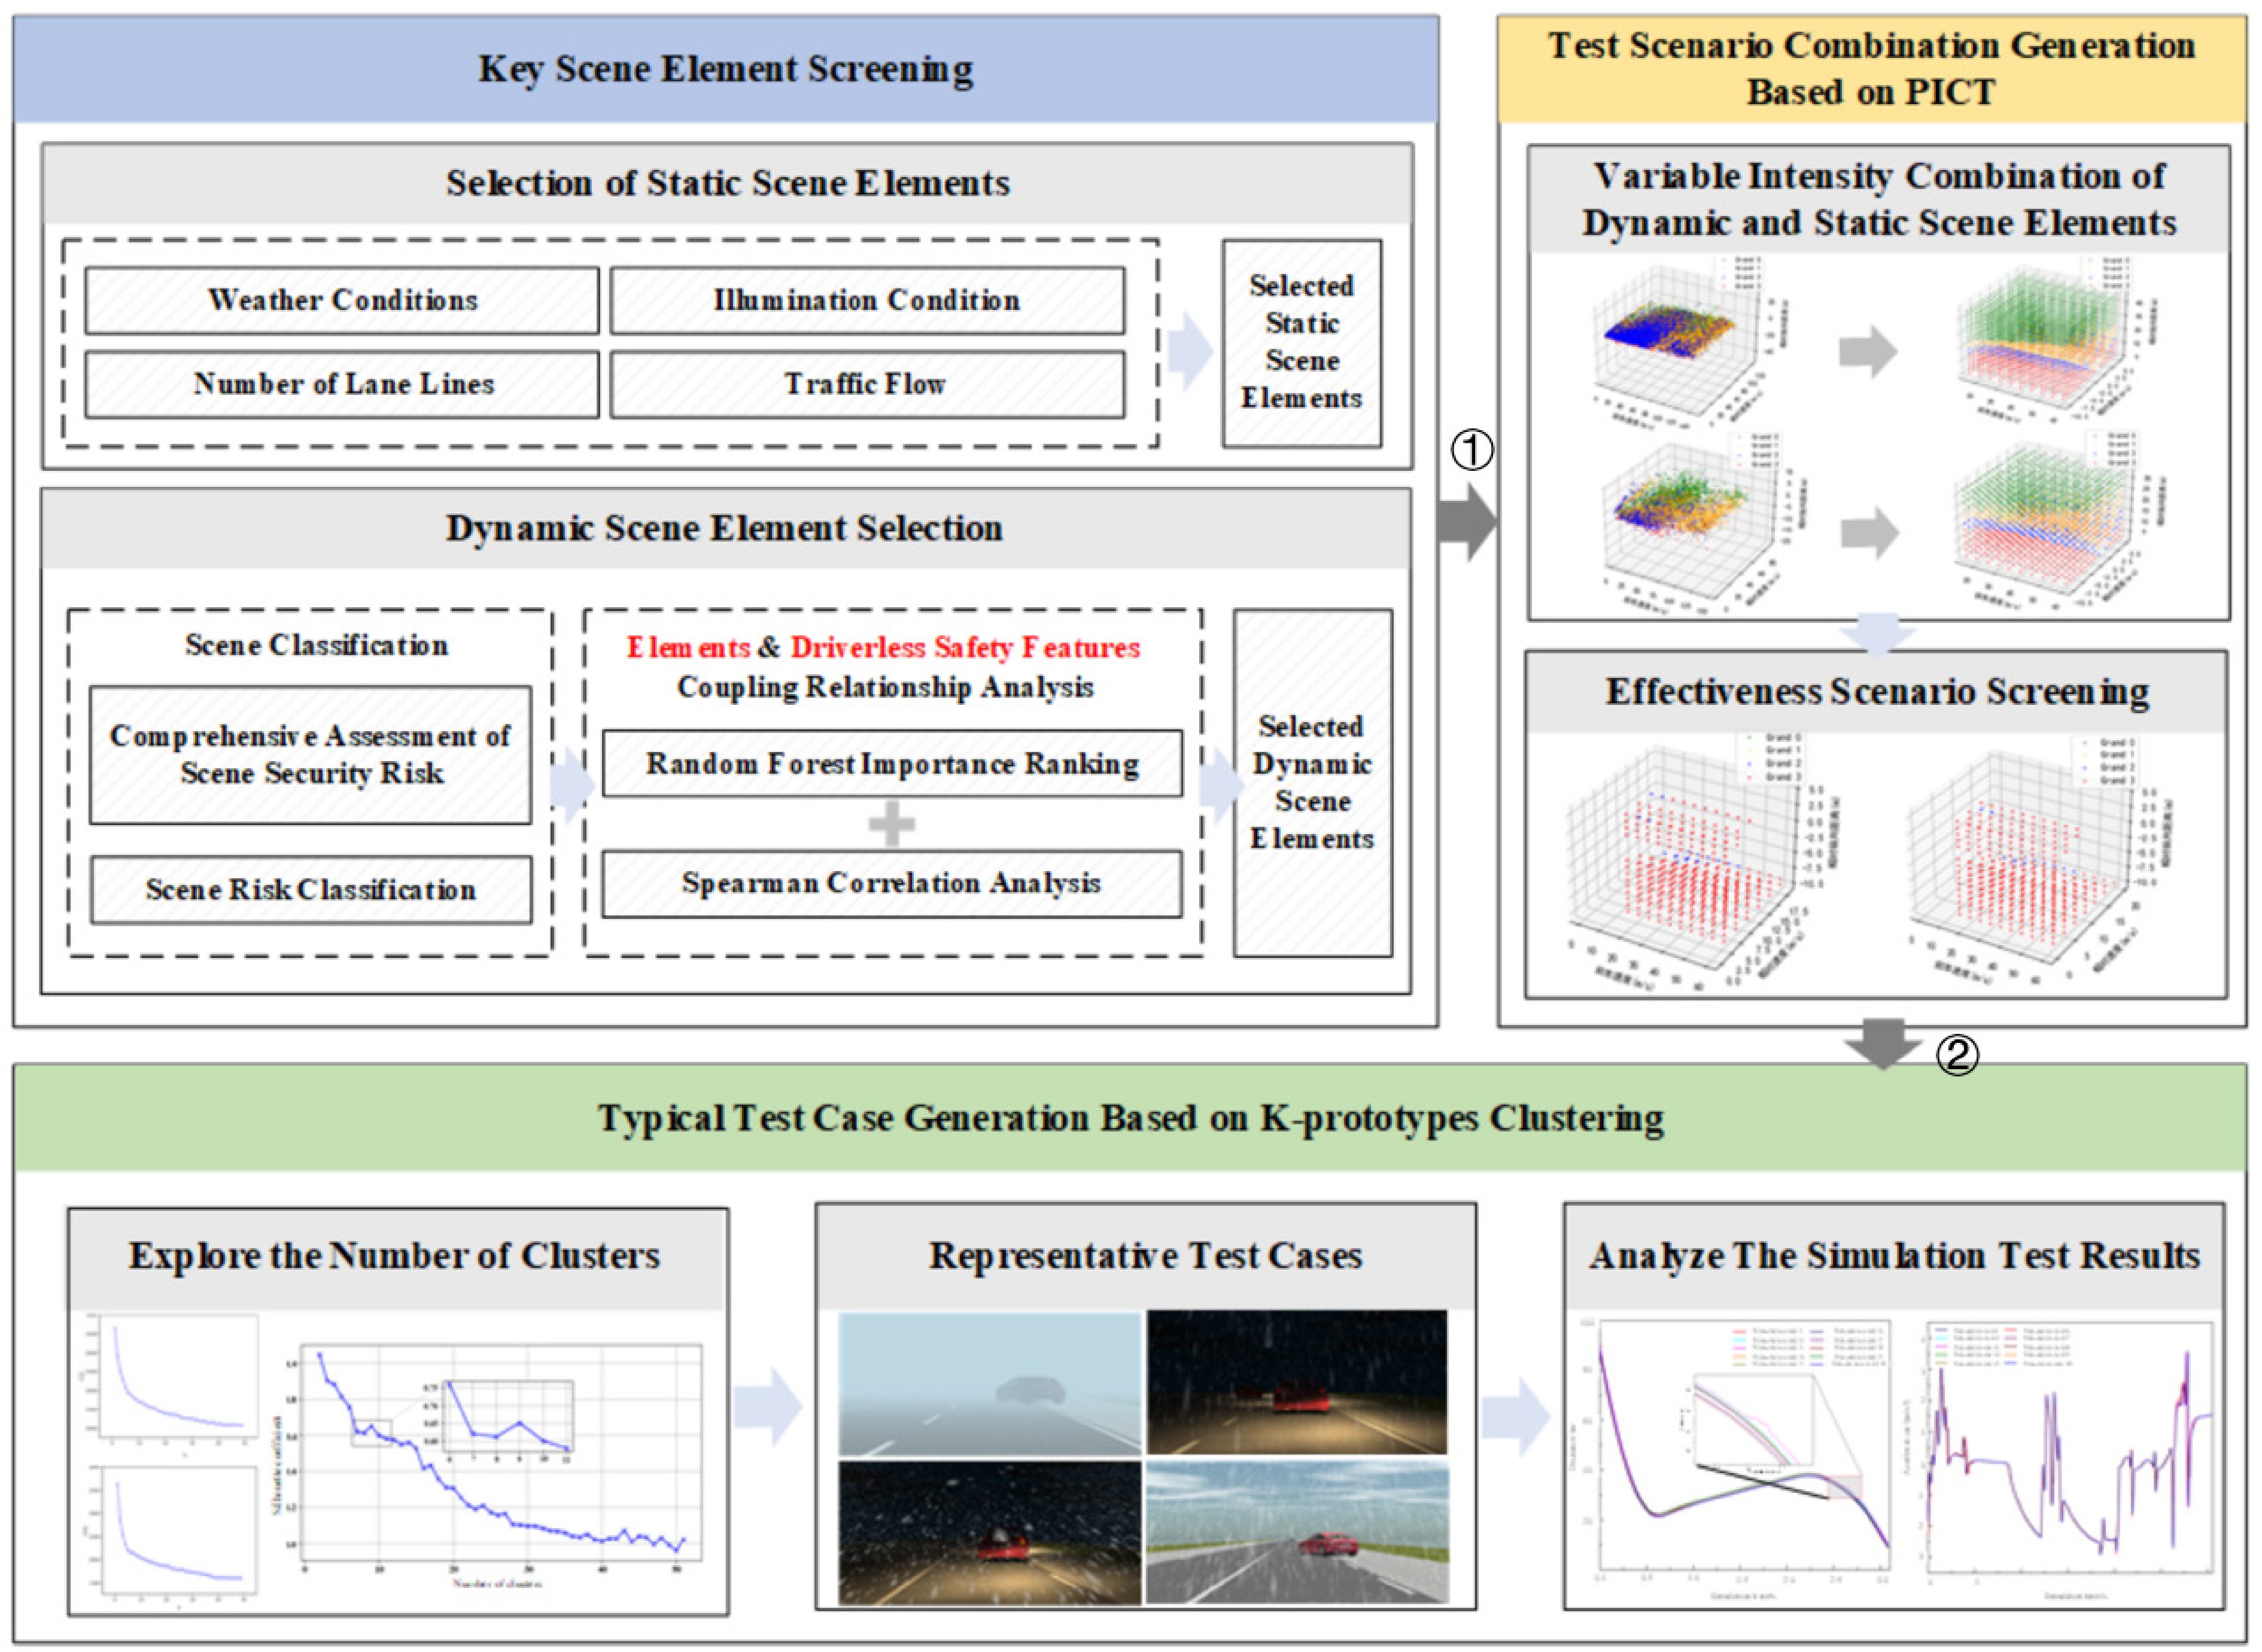
Figure 1.
Schematic of the test scenario construction process. ① selected dynamic and static scene parameters; ② filtered test scenarios.
Key scenario element selection
Decomposition of test scenario elements
-
We decompose the autonomous driving test scenario elements into dynamic and static components across multiple dimensions. The dynamic components include vehicle dynamics information, while the static components encompass traffic and natural environment factors. The specific decomposition is illustrated in Fig. 2. Vehicle dynamics information elements describe the interaction between the vehicle under test and surrounding traffic participants, representing the dynamic driving context. These elements are crucial to the overall test scenario. Traffic and natural environment factors simulate real-world driving conditions comprehensively, enabling the evaluation of the autonomous driving system's safety performance in complex and variable environments.
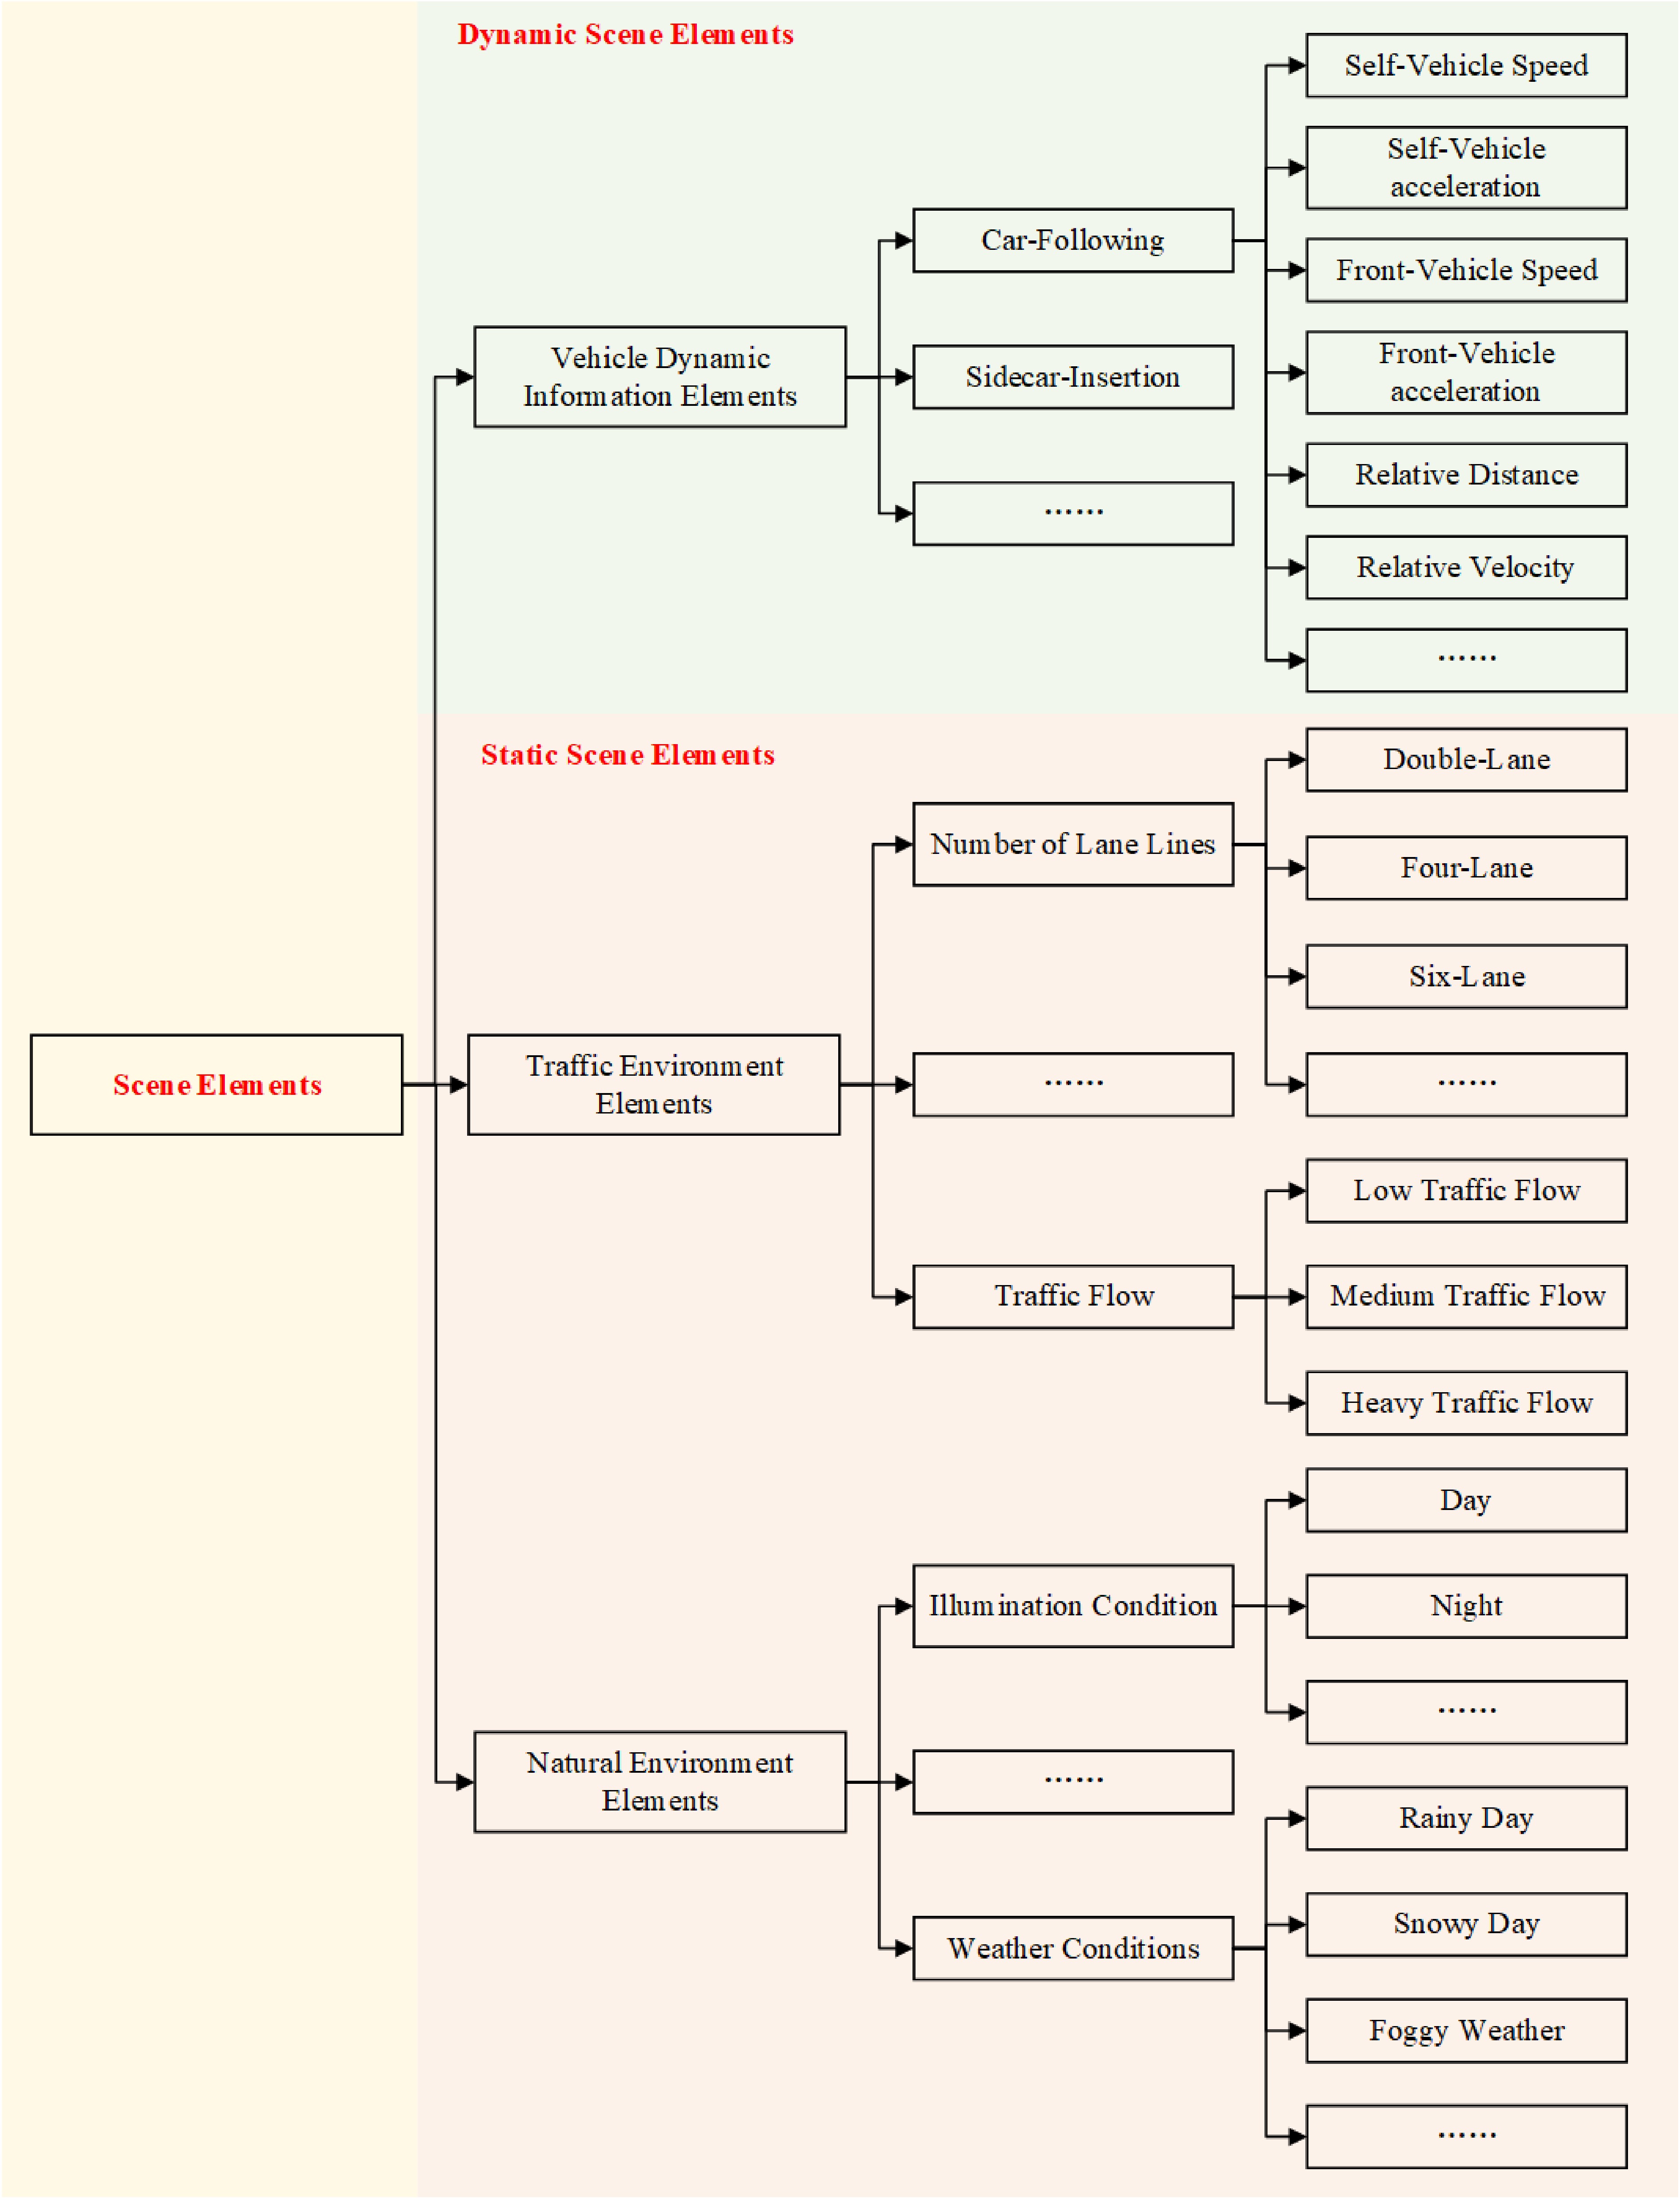
Figure 2.
Multidimensional decomposition of scenario elements.
Selection of static scenario elements
-
Static scenario elements are environmental factors that remain unchanged over time, typically including road geometry, traffic signs and signals, fixed obstacles, sidewalks, and green belts. To ensure the feasibility of constructing simulation test scenarios, this study selects weather conditions, lighting conditions, lane count, and traffic flow as key static elements for the subsequent test scenario generation. The specific value ranges for each static parameter are determined using an exhaustive approach, listing all possible conditions, as detailed in Table 1.
Table 1. Parameter set for static scenario elements.
Static scenario elements Parameter value Natural environment elements Weather
conditionsRainy Small, medium, large Snowy Small, medium, large Foggy Small, medium, large Clear day − Illumination condition Day, night Traffic environment elements Number of lane lines 2, 3, 4 Traffic flow Low, medium, high Selection of dynamic scenario elements
Classification of test scenario hazard levels
-
The core of the proposed method for constructing typical test scenarios for autonomous driving safety lies in the selection of key dynamic scenario elements. By identifying these critical elements, we can pinpoint the dynamic factors that have a significant impact on the safety of autonomous driving. These elements are then combined with other scenario factors to generate typical test scenarios that facilitate safety evaluations for autonomous systems.
To ensure that the generated scenarios meet the safety testing requirements for autonomous driving, we use Time-to-Collision (TTC) and Time Headway (THW) as the primary evaluation metrics. Building upon the research by Zhu et al.[30], Softmax is applied to compute the weights of these indicators, which are then used to derive the Safety Impact Coefficient (SIC), a measure of the degree to which a scenario influences autonomous driving safety.
$ \begin{gathered}SIC={\textit{Soft}}\max ({R}_{TTC},{R}_{THW})\left[\begin{array}{c} {R}_{TTC}\\ {R}_{THW} \end{array}\right]=\\ \left[\dfrac{{e}^{{{R}_{TTC}}}}{{e}^{{{R}_{TTC}}}+{e}^{{{R}_{THW}}}},\dfrac{{e}^{{{R}_{THW}}}}{{e}^{{{R}_{TTC}}}+{e}^{{{R}_{THW}}}}\right]\left[\begin{array}{c} {R}_{TTC}\\ {R}_{THW} \end{array}\right]\end{gathered} $ (1) Based on the calculated SIC, the Cumulative Distribution Function (CDF) and Probability Density Function (PDF) are constructed to categorize the scene data. The specific methods for calculating the CDF and PDF are outlined as follows:
$ F(x)=P({X}_{SIC}\leq x) $ (2) $ f(x)={\lim }_{\Delta x\rightarrow 0}\dfrac{P(x\leq {X}_{SIC} \lt x+\Delta x)}{\Delta x} $ (3) In the equation, F(x) and f(x) represent the CDF and PDF, respectively. P(XSIC ≤ x) denotes the probability that the random variable SIC is less than or equal to x; P(x ≤ XSIC < x + Δx) represents the probability that the random variable SIC falls within the interval [x, x + Δx]; and Δx is a very small increment.
Since both TTC and THW are time-based evaluation metrics, smaller values indicate higher risk levels for vehicles in a given scenario. Meanwhile, the Softmax function used in the metric construction only serves to assign weights and does not alter the original data distribution; therefore, a smaller SIC indicates a greater impact on vehicle safety, corresponding to a higher safety impact level of the scenario. On this basis, according to the PDF and CDF of the SIC, a percentile-based classification method is adopted, where 15%, 50%, and 85% of the cumulative distribution are selected as threshold nodes to categorize the safety impact levels of different scenarios. This approach avoids the subjectivity associated with manually defined fixed thresholds while enabling adaptive stratification based on the inherent data distribution.
Furthermore, from a traffic safety perspective, lower TTC and THW values typically correspond to situations where drivers have limited reaction time or require urgent intervention, which are associated with higher potential collision risks; therefore, lower percentile regions (e.g., below 15%) can effectively highlight high-risk scenarios, while the median and higher percentile ranges are used to distinguish medium- and low-risk scenarios, thereby achieving a rational classification of different risk levels.
Key dynamic scene element selection using random forest and Spearman's rank correlation
-
Random Forest (RF) achieves regression or classification tasks by constructing multiple decision trees and averaging or voting on their outcomes. During this process, RF also provides the importance score for each variable (Variable Importance Measure, VIM)[31], which is valuable for feature selection and dimensionality reduction.
As RF uses bootstrapping (sampling with replacement) to build decision trees, some samples may not be selected. Statistically, each sample has approximately a 30% chance of being excluded, and these unselected data points are referred to as out-of-bag (OOB) data. The OOB data can be used as a validation set for model performance evaluation and parameter tuning. Furthermore, they help calculate the VIM for each variable, facilitating effective feature selection. The specific calculation method is as follows:
$ VI{M}_{j}=\dfrac{1}{k}\sum \limits_{t=1}^{k}({M}_{ptj}-{M}_{tj}) $ (4) In the equation, VIMj represents the importance of the jth variable, k denotes the number of decision trees in the RF, and Mtj and Mptj correspond to the classification accuracy of the out-of-bag data for the jth variable before and after interference in decision tree t, respectively.
Based on the Mean Decrease Accuracy (MDA) variable selection method provided by the RF, the impact of each dynamic element on the safety impact level classification of the scene is quantified, allowing for the ranking of the importance of dynamic features[32,33]. The MDA calculation equation for each input variable in the RF is as follows:
$ MDA({X}_{j})=\dfrac{1}{N}\sum \limits_{t=1}^{N}(Accurac{y}_{t}-Accurac{y}_{t}[{X}_{j}]) $ (5) In the equation, N denotes the number of decision trees in the RF; Accuracyt represents the accuracy of the tth decision tree; and Accuracyt(Xj) is the accuracy of the tth decision tree after the variables have been shuffled.
The RF outputs the influence of various scene elements on the classification of scene risk levels, with the degree of influence being proportional to the impact of these elements on the safety of autonomous driving systems. To further explore the coupling relationship between scene elements and autonomous driving safety, and to avoid redundant selection of key elements, this study employs the Spearman correlation analysis method. The Spearman correlation coefficient quantifies the strength of the relationship between scene elements and the SIC, with larger coefficients indicating a stronger correlation and a more significant contribution to improving the quality of test scenarios. Moreover, a strong correlation between scene elements suggests that their impacts are similar, serving as a useful reference for avoiding redundancy in selecting key elements. By combining the importance rankings from the RF with the results of Spearman correlation analysis, the study identifies critical dynamic scene elements, which are then utilized for subsequent test scenario generation through the Pairwise Independent Combinatorial Testing (PICT) method.
Test scenario combination generation based on PICT
-
Pairwise Testing (PT) is a method used to create test cases by combining different input parameters. It can be directly implemented using Microsoft's PICT toolbox. The modeling process includes the following steps:
(1) Identify variable elements.
(2) Define the sample set for each variable element.
(3) Add constraints to minimize the number of invalid scenarios.
(4) Establish filtering criteria to eliminate invalid or redundant scenarios.
(5) Generate the test scenarios.
PICT generates parameter combinations in pairs by default to ensure all possible parameter interactions are covered. However, testing scenarios with pairwise combinations can only detect approximately 70% of system defects, while three-way parameter combinations can uncover up to 90% of defects. Beyond three-way combinations, the effectiveness in identifying system defects shows minimal improvement[34]. Considering the balance between test coverage and efficiency, a variable-strength PICT combination testing method is employed. Under this approach, three-way combinations are used for the selected key dynamic scenario parameters, while pairwise combinations are applied to the remaining parameters. This method ensures the generation of test scenarios that align with the requirements for autonomous driving safety evaluation. The detailed generation process is depicted in Fig. 3.
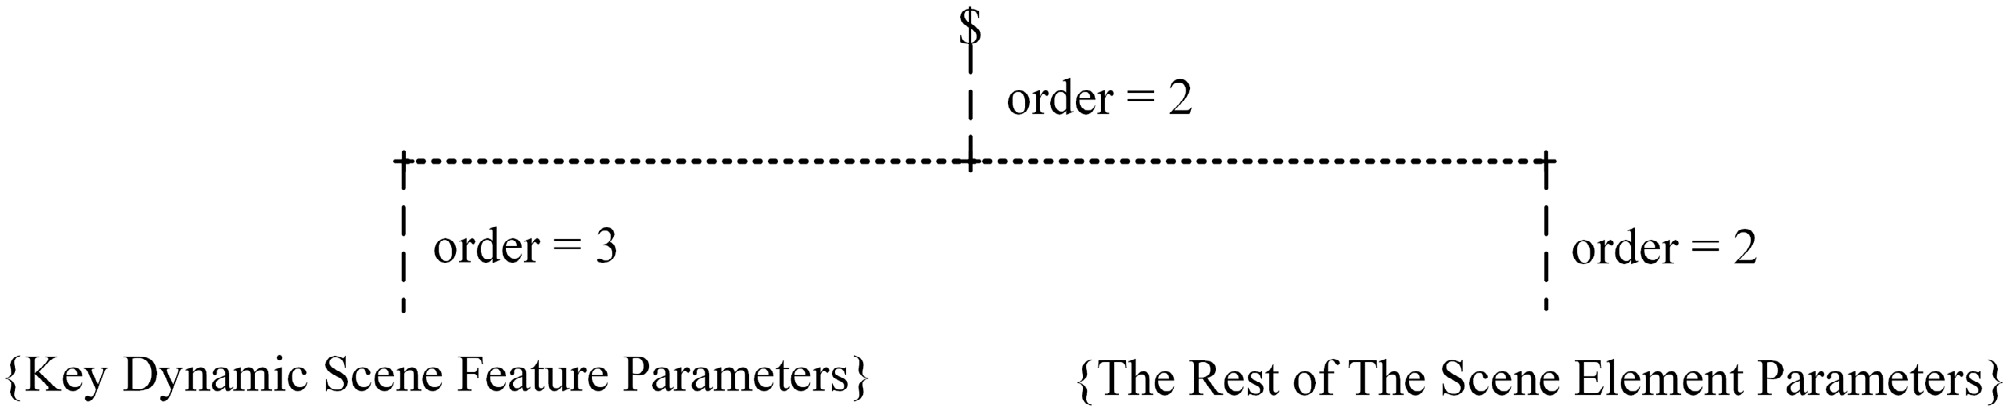
Figure 3.
Workflow of the variable-strength PICT combination testing method.
To ensure the validity and coverage of the generated test scenarios, we continue to use TTC and THW as metrics to assess the safety and efficiency of autonomous driving systems. These metrics serve as the criteria for filtering scenarios generated by the PICT combination method, helping to avoid redundancy and irrational test scenarios that could skew the results. The specific filtering criteria for the scenarios are shown in Table 2.
Table 2. Scenario filtering criteria.
Screening index Screening condition TTC TTC < 2 s THW 20 m/s < Vx < 40 m/s THW < 0.01 × Vx + 0.1 Vx ≥ 40 m/s THW ≤ 0.5 s Generation of representative test cases based on k-prototypes clustering
-
To obtain representative test cases for autonomous driving safety evaluation, further clustering analysis of the selected test scenarios is necessary. The key dynamic scene elements in the chosen scene parameters are numerical attributes, while the remaining scene elements are categorical attributes. Since this dataset contains both numerical and categorical attributes, a single clustering method is insufficient. Therefore, we apply the k-prototypes algorithm, which combines the k-means and k-modes algorithms. This method computes the distances between numerical and categorical attributes separately and then combines them with a weighted sum to calculate the final sample distance. This approach effectively clusters mixed data types[35]. The equation for calculating the sample distance is as follows:
$ d(x,c)=\sum \limits_{j\in numeric}{({{x}_{j}}-{{c}_{j}})}^{2}+\gamma \sum \limits_{j\in categorical}\delta ({x}_{j},{c}_{j}) $ (6) In the equation, xj and cj denote the values of the data points x and centroids c in the jth dimension, respectively. δ(xj, cj) represents the distance metric for categorical attributes, where the distance is 0 when xj and cj are the same, and 1 when they differ. δ is the weight that balances the distances between numerical and categorical attributes.
Before performing clustering, the mixed data undergoes preprocessing to ensure consistency in data format and range. Categorical attributes are converted into numerical values using label encoding, while numerical attributes are standardized using MinMaxScaler to scale them within a specified range. This prevents features with larger original value ranges from disproportionately influencing the analysis. The MinMaxScaler standardizes the numerical data through a linear transformation, scaling it within the range (0, 1). The specific equation is as follows:
$ {X}_{scaled}=\dfrac{X-{X}_{\min }}{{X}_{\max }-{X}_{\min }} $ (7) In the equation, X represents the original data value, Xmin is the minimum value of the data, Xmax is the maximum value of the data, and Xscaled denotes the standardized data value.
To determine the optimal number of clusters, we first apply the elbow method to identify a suitable range for the cluster count. Then, we use the silhouette coefficient method to finalize the optimal number of clusters, ensuring the resulting typical test scenarios align with the safety evaluation criteria for autonomous driving. Finally, based on the typical test scenarios obtained from clustering, we utilize simulation software to construct the test scenarios and establish the foundational safety test scenarios for autonomous driving.
-
We validate the proposed method using the SPMD dataset, which is a collaborative effort between the U.S. Department of Transportation and the University of Michigan[36,37]. This dataset includes data collected from roadside equipment, in-vehicle devices, and basic safety information, and is widely used for research on intelligent connected vehicles and intelligent transportation systems. Figure 4 illustrates the test area where the data was collected for the SPMD project. After filtering and extracting the relevant data, we identified 18,579 following vehicle scenarios and 5,818 adjacent vehicle insertion scenarios, which were used as the foundation for constructing the test scenarios.
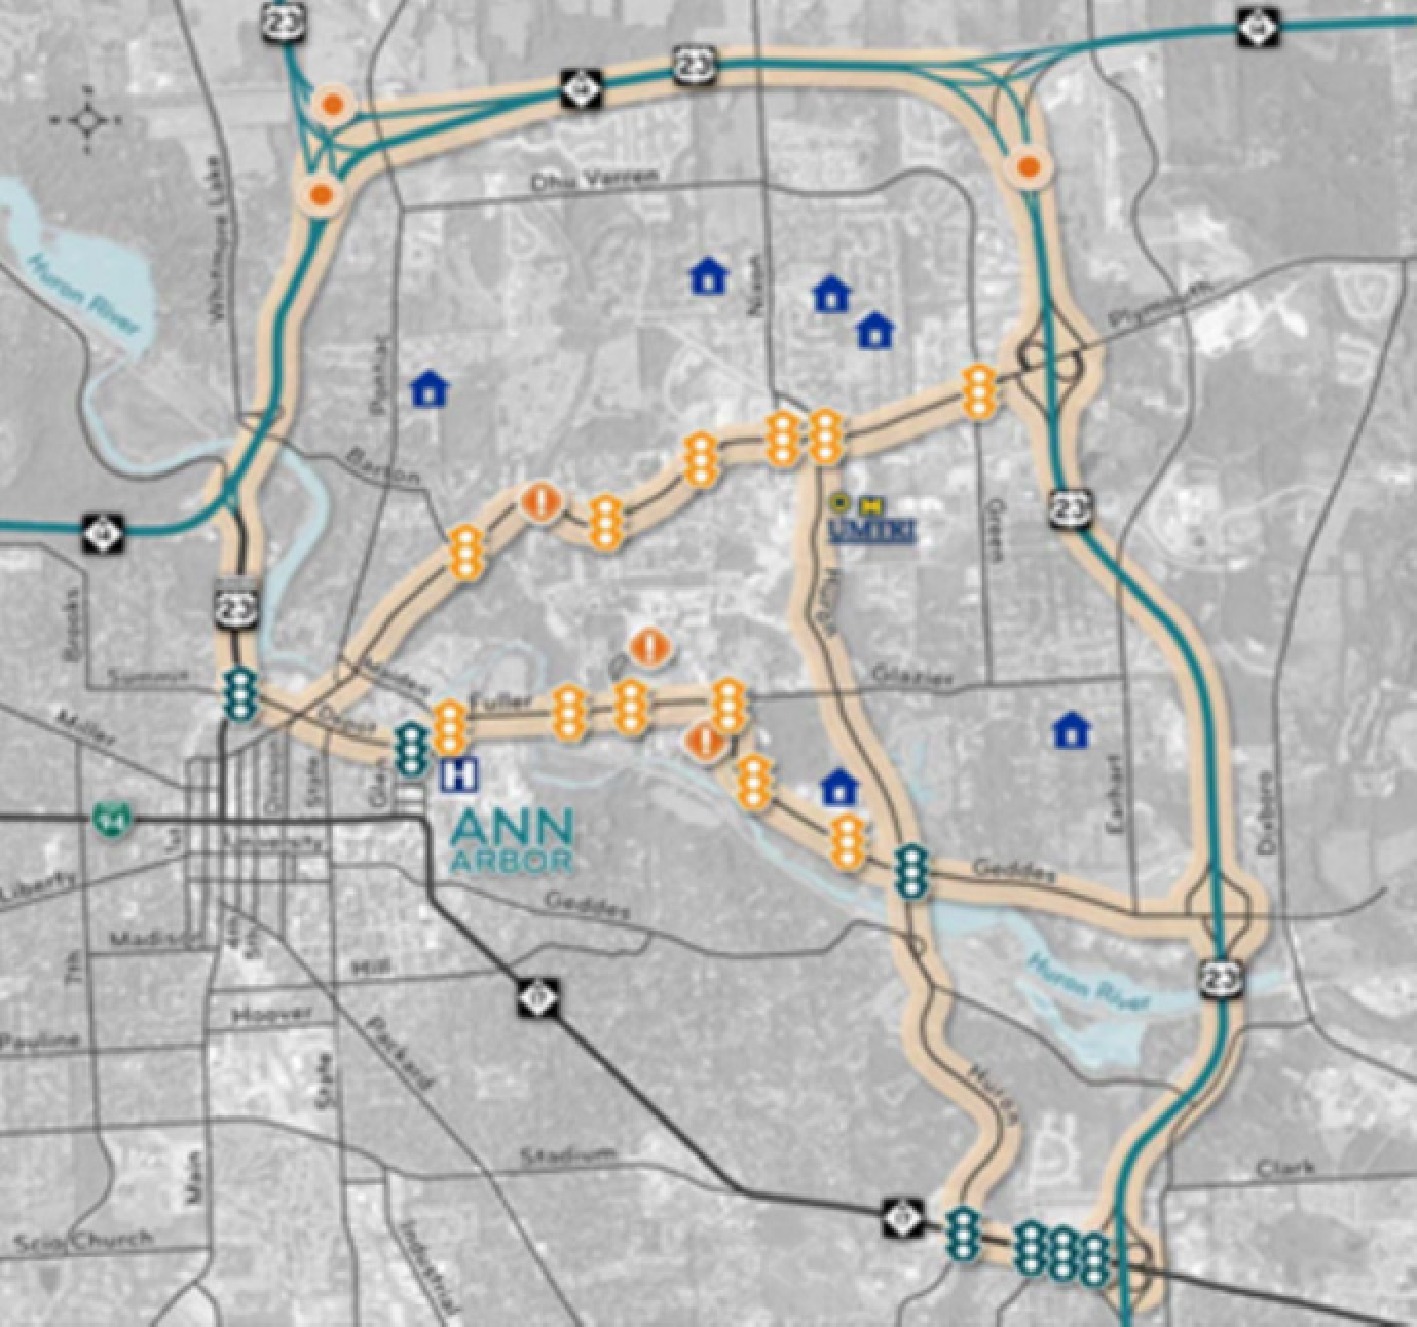
Figure 4.
Data collection area for the SPMD.
Key dynamic scene feature selection
Risk level classification of test scenarios
-
The SIC for the extracted car-following and cut-in scenarios is calculated using Eq. (1). Based on these SIC values, the PDF and CDF for each scenario type are established using Eqs (2) and (3), as illustrated in Fig. 5.
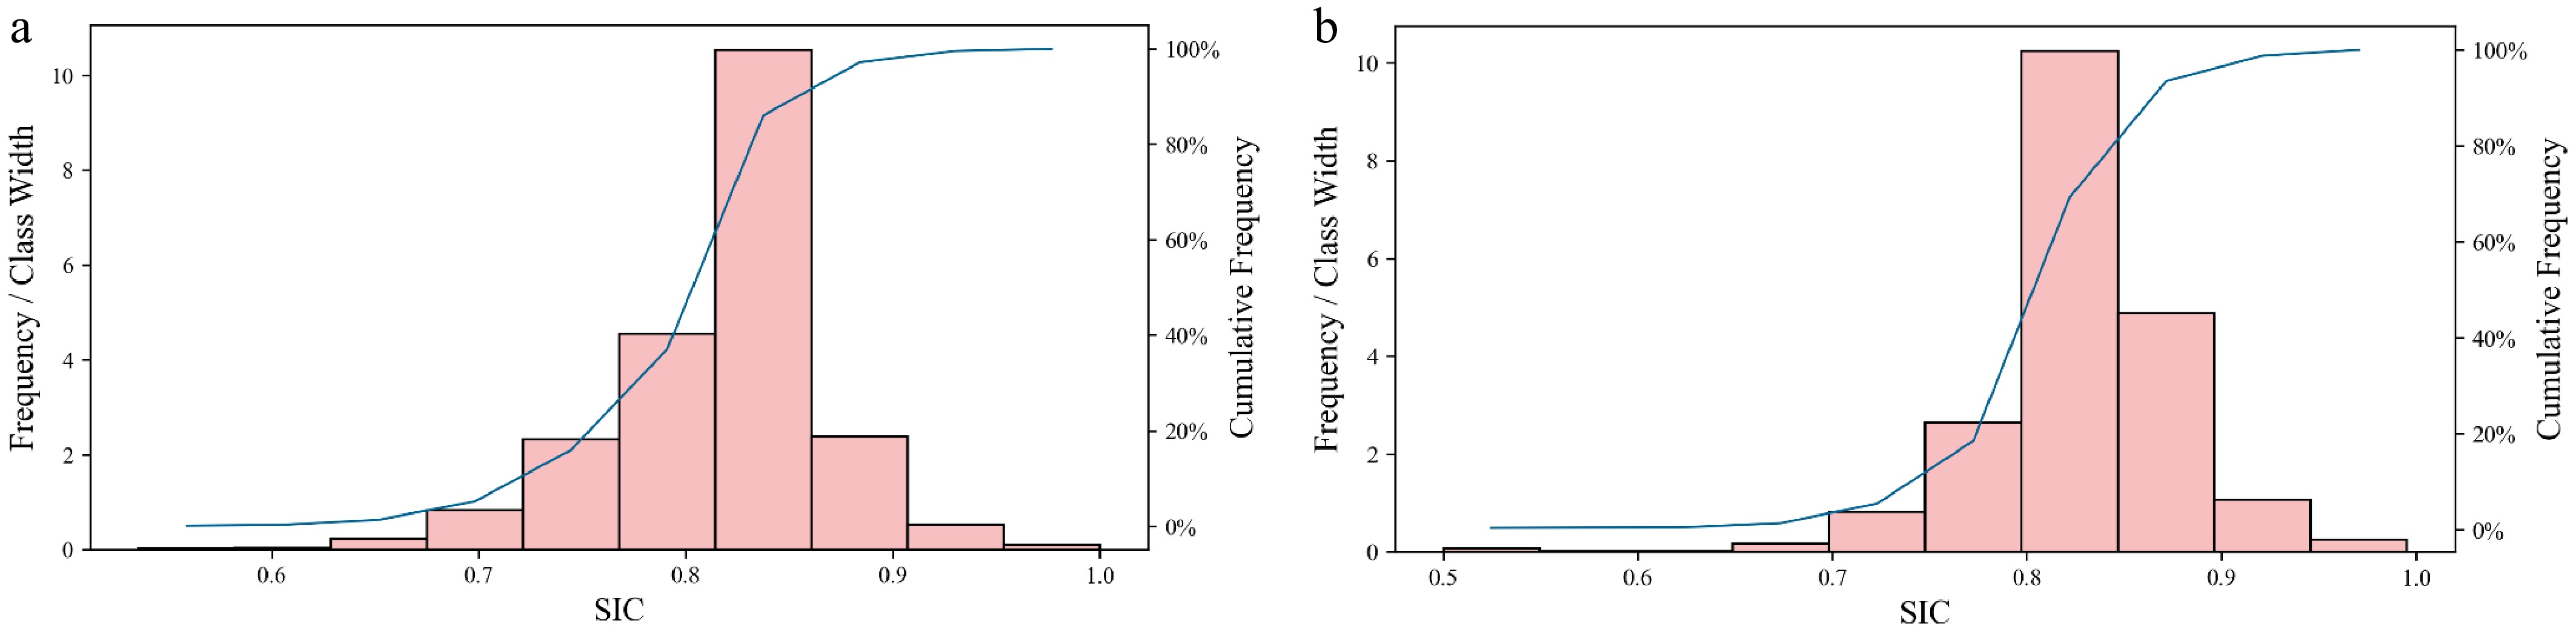
Figure 5.
PDF and CDF of SIC for extracted scenarios. (a) Car-following scenario. (b) Cut-in scenario.
Based on Fig. 5, the scene risk level classification for both types of scenarios is performed by setting grading nodes at the 15%, 50%, and 85% scene proportion marks. The specific classification results are presented in Tables 3 and 4.
Table 3. Car-following scenario risk level classification.
SIC range Safety impact level Number of scenarios SIC ≤ 0.7539 Grand 3 2,214 0.7539 < SIC ≤ 0.8025 Grand 2 3,233 0.8025 < SIC ≤ 0.8395 Grand 1 7,923 SIC > 0.8395 Grand 0 5,209 Table 4. Cut-in scenario risk level classification.
SIC range Safety impact level Number of scenarios SIC ≤ 0.7600 Grand 3 428 0.7600 < SIC ≤ 0.8004 Grand 2 724 0.8004 < SIC ≤ 0.8488 Grand 1 2,986 SIC > 0.8488 Grand 0 1,680 Selection of key dynamic scene elements
-
Based on the analysis of the operational processes in both rear-end and cut-in scenarios, we selected the following dynamic scene parameters as fundamental elements: ego-vehicle speed, ego-vehicle longitudinal acceleration, lead vehicle speed, lead vehicle longitudinal acceleration, relative distance between the two vehicles, and relative speed. Additionally, to fully capture the lateral relationship between the two vehicles in the scene, we included the lateral relative distance and the ego-vehicle yaw rate. In total, eight fundamental dynamic parameters were chosen for identifying the key dynamic scene elements. For the selection of critical moments in these scenarios, the initial moment of the rear-end scenario was considered the key moment, while in the cut-in scenario, the key moment was defined as the instant when the lead vehicle cuts into the lateral lane of the ego vehicle.
The selected key dynamic scene parameters at critical moments, along with the scene's safety impact coefficient and danger level, were used as input for the RF feature importance ranking model. The data for both scene types were split into training and test sets in a 4:1 ratio, and RF models were constructed for each scene type. The optimal number of decision tree splits and feature variables for the RF model were determined based on the OOB error, as shown in Fig. 6.
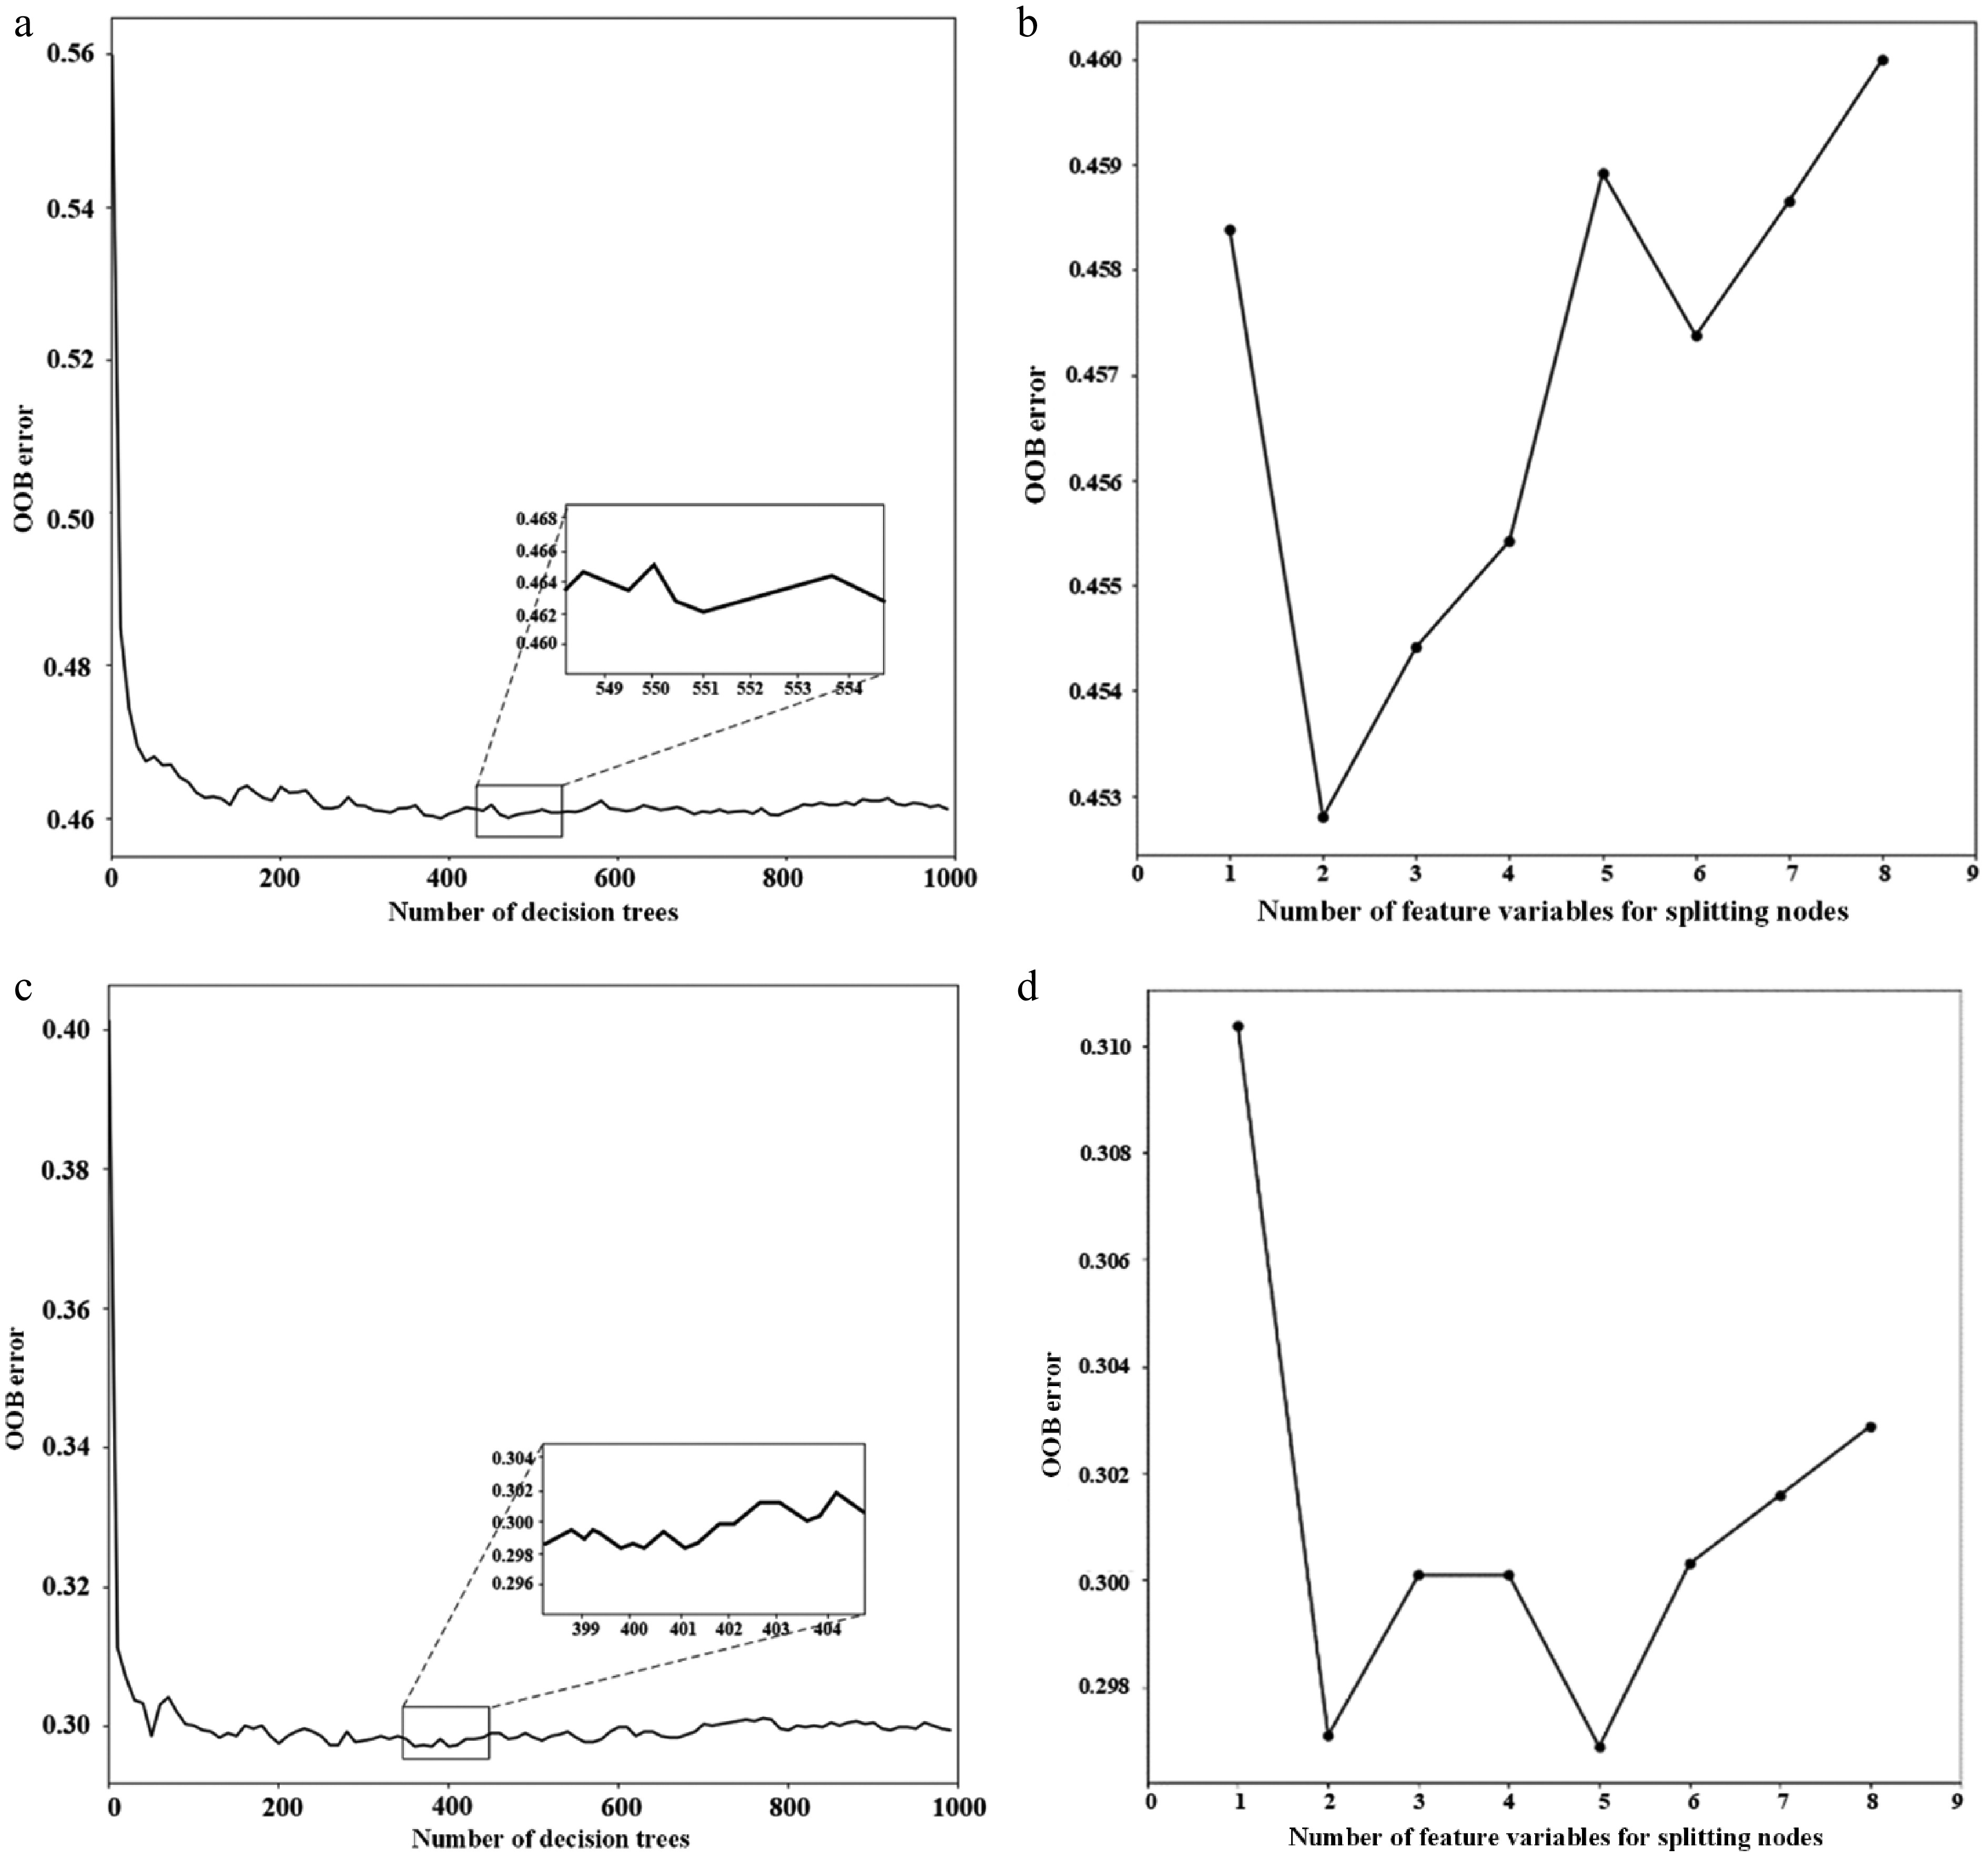
Figure 6.
Random forest parameter training process. (a) The number of decision trees for the car-following scenario. (b) The number of feature variables for the car-following scenario. (c) The number of decision trees for the cut-in car scenario. (d) The number of feature variables for the cut-in car scenario.
As shown in Fig. 6a, for the rear-end scenario's RF model, the OOB error decreases as the number of decision trees increases. The lowest OOB error occurs with 551 trees, after which it stabilizes. Therefore, the optimal number of decision trees for the model is set to 551. In Fig. 6b, it can be observed that the lowest OOB error occurs when the number of feature variables per split is two. Hence, the optimal number of feature variables at each split node is set to two. Similarly, as shown in Fig. 6c and d, for the cut-in scenario's RF model, the optimal number of decision trees is 401, and the optimal number of feature variables at each split node is five.
Based on Eq. (5), the MDA of each feature variable in the scene is calculated to determine the importance ranking of the features. The final ranking results are shown in Fig. 7. As seen in Fig. 7a, the key feature variables in the car-following scenario are ranked as follows: relative longitudinal distance, relative speed, leading vehicle speed, ego vehicle speed, leading vehicle acceleration, ego vehicle acceleration, ego vehicle yaw rate, and relative lateral distance. In Fig. 7b, the key feature variables in the cut-in car scenario are ranked as: relative longitudinal distance, relative speed, leading vehicle speed, ego vehicle speed, relative lateral distance, ego vehicle acceleration, ego vehicle yaw rate, and leading vehicle acceleration.
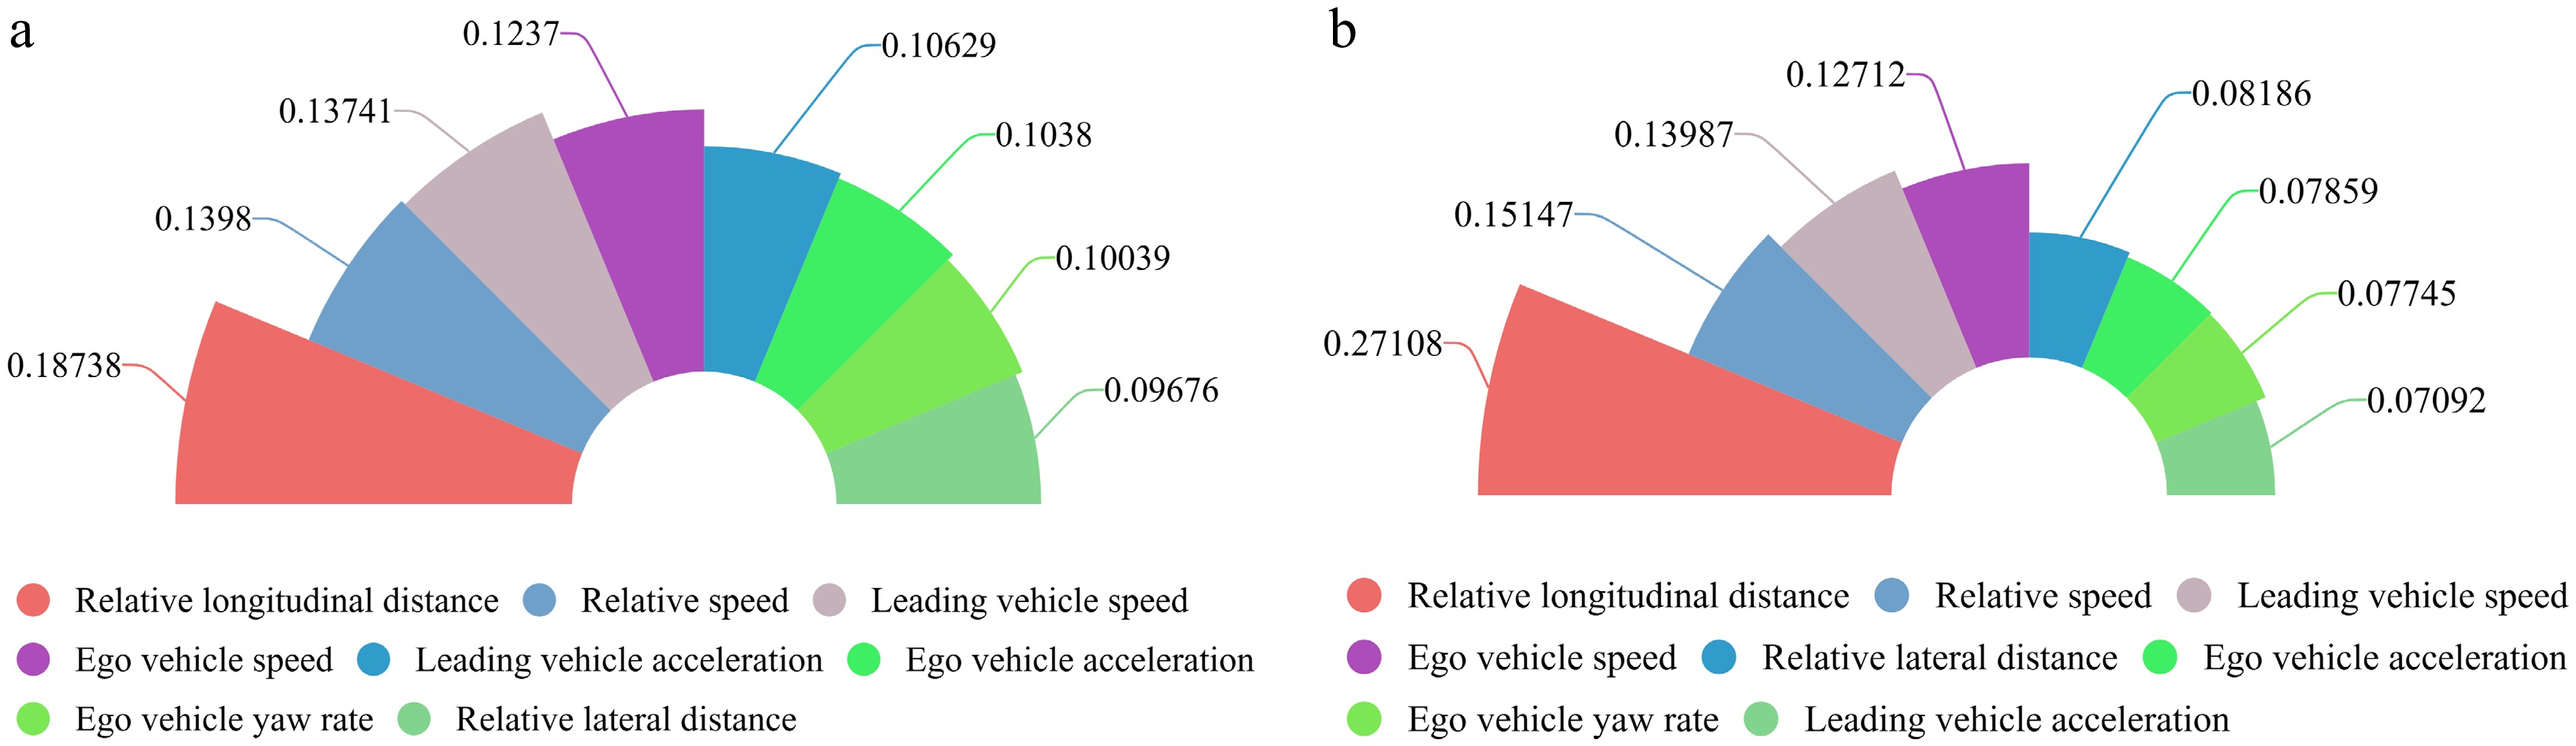
Figure 7.
Ranking of feature importance in RF. (a) Car-following scenario. (b) Cut-in scenario.
A comparison of the two figures reveals that the feature importance rankings are very similar for both scenarios. In both cases, relative longitudinal distance and relative speed consistently emerge as the most important features. However, relative lateral distance is a critical feature in the cut-in car scenario, while its importance is ranked lower in the car-following scenario.
Spearman correlation analysis was performed to explore the relationships between various scene elements, as well as between scene elements and the safety impact coefficient of the scene. The correlation results are presented in Fig. 8. It is evident that in both the car-following and cut-in car scenarios, there is a strong correlation between the leading vehicle speed and the ego vehicle speed, as well as between the leading vehicle longitudinal acceleration and the ego vehicle longitudinal acceleration. These findings are consistent with the actual dynamics of vehicle behavior and further validate the effectiveness and realism of the extracted scenarios.
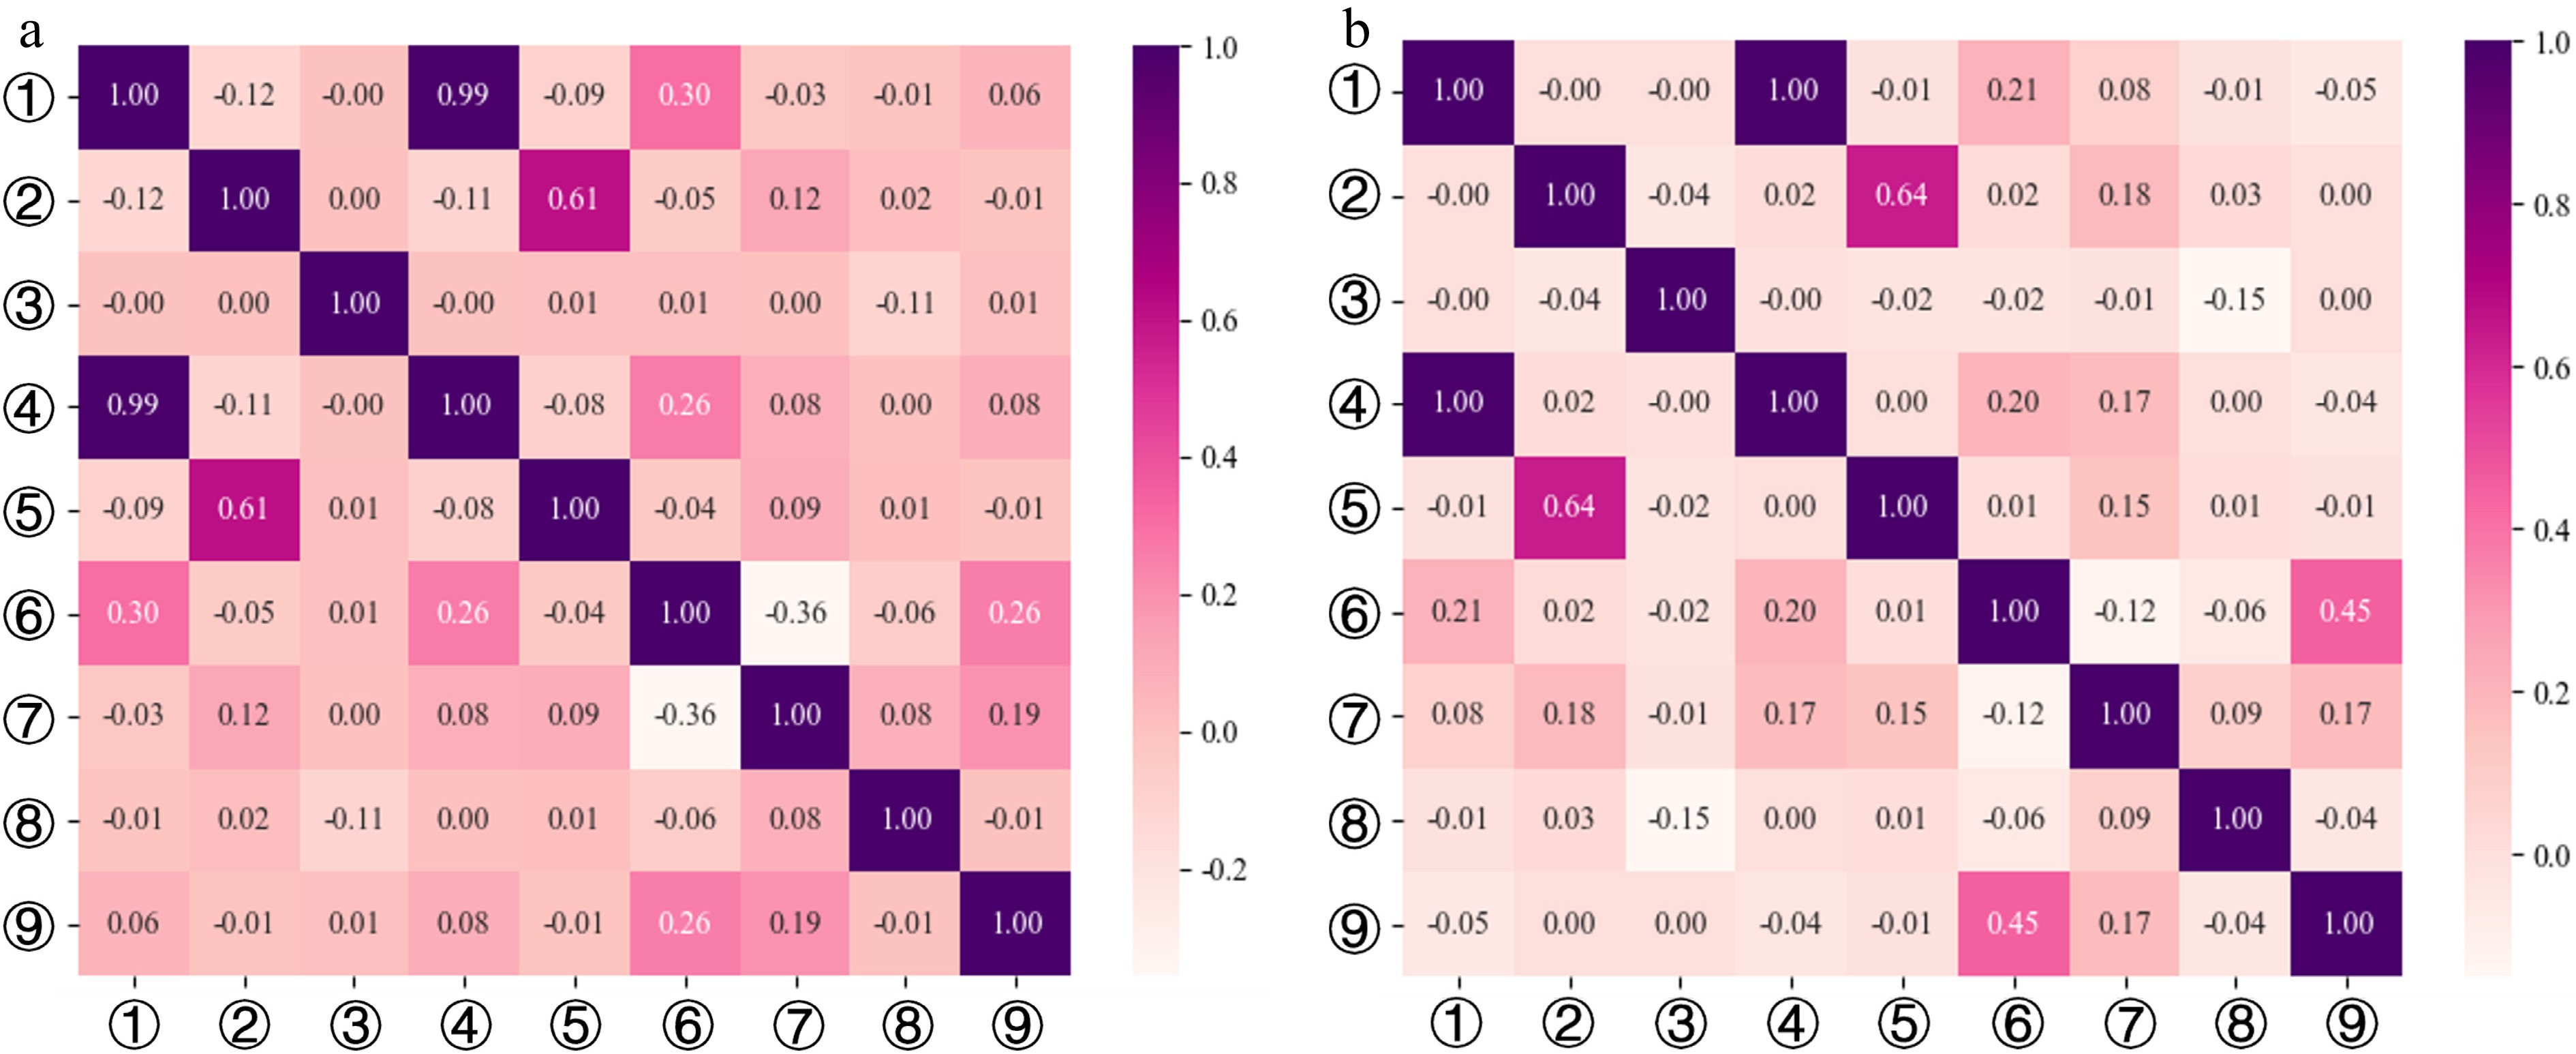
Figure 8.
Spearman correlation analysis results. (a) Car-following scenario. (b) Cut-in scenario. The meanings of the numbers in the figure are as follows: ① ego vehicle speed, ② ego vehicle acceleration, ③ ego vehicle yaw rate, ④ leading vehicle speed, ⑤ leading vehicle acceleration, ⑥ relative longitudinal distance, ⑦ relative speed, ⑧ relative lateral distance, and ⑨ SIC.
Through the analysis of the relationship between scene elements and scene safety impact coefficients, we found that, in the car-following scenario, the top four scene elements most strongly correlated with the scene safety impact coefficient are: relative longitudinal distance (0.26), relative velocity (0.19), leading vehicle speed (0.08), and ego-vehicle speed (0.06). These elements all show a positive correlation with the scene safety impact coefficient, which is consistent with the random forest importance ranking results. In the cut-in car scenario, relative longitudinal distance and relative velocity remain the two most strongly positively correlated elements, with correlations of 0.45 and 0.17, respectively. In contrast, ego-vehicle speed, leading vehicle speed, and relative lateral distance show negative correlations with the safety impact coefficient, with the correlation strength between leading vehicle speed and relative lateral distance being equal. While these results slightly differ from the random forest ranking, the overall trend remains consistent.
It is also important to note that the correlations between these scene elements and the scene safety impact coefficient are not significant, as the correlation coefficients do not exceed 0.5 or −0.5. This further validates the rationality of the proposed scene safety impact coefficient and rules out the possibility of over-strong correlations affecting the importance ranking of scene elements.
In summary, based on the results from both random forest and correlation analysis, the top four scene elements with the highest importance rankings in both scenarios—relative longitudinal distance, relative velocity, leading vehicle speed, and ego-vehicle speed—are selected as key scene elements. Given the strong correlation between leading vehicle speed and ego-vehicle speed, and to avoid redundancy, ego-vehicle speed is excluded from the final selection. Therefore, relative longitudinal distance, relative velocity, and leading vehicle speed are determined to be the key scene elements.
Test scenario combination generation
-
Based on the analysis of the components of multi-dimensional test scenarios, we have identified the scene parameters for generating combined test inputs. The static parameters include weather conditions, lighting conditions, number of lanes, and traffic flow. The dynamic parameters, which comprehensively describe the scene, consist of relative longitudinal distance, relative lateral distance, relative velocity, leading vehicle speed, and leading vehicle acceleration.
For the specific value ranges of these parameters, the static parameters have been exhaustively enumerated to account for all possible conditions. The dynamic parameters, however, have been discretized through statistical analysis of the probability distribution of sample scenarios with a safety impact level of Grand 3. This analysis allowed us to determine appropriate step sizes for discretization. Additionally, to further clarify the value ranges of the dynamic parameters, normal distribution fitting was performed. The resulting parameter probability distributions are shown in Figs 9 and 10, with the detailed normal fitting results provided in Tables 5 and 6.
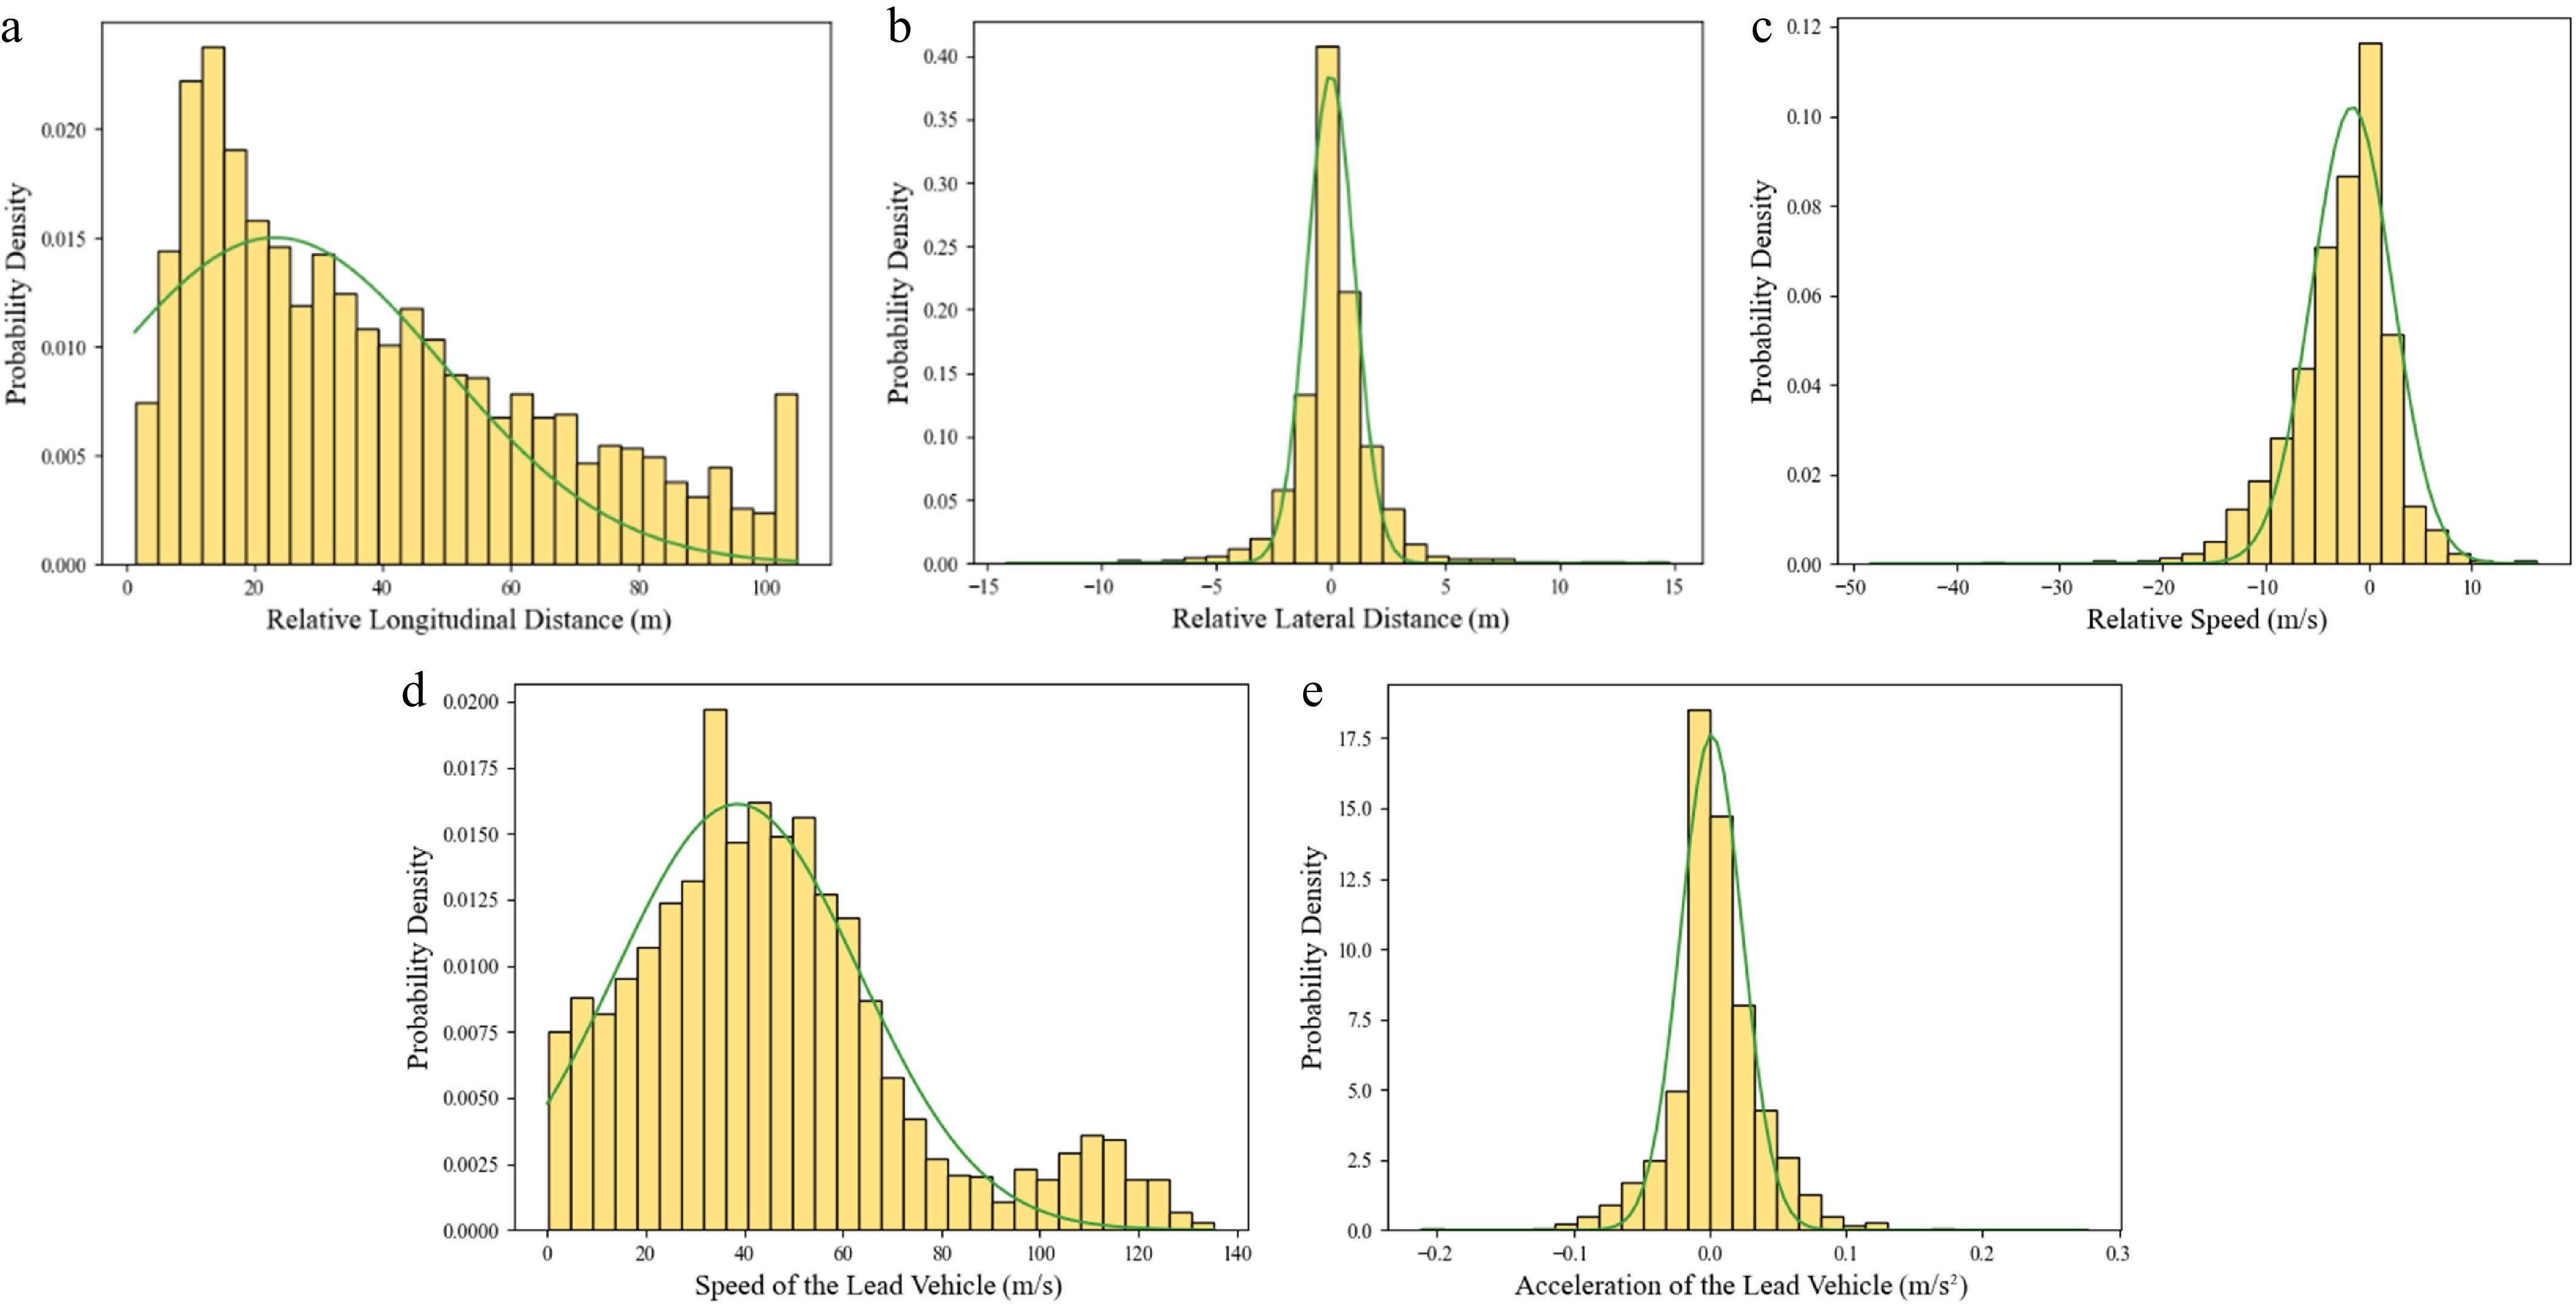
Figure 9.
Probability distribution of basic dynamic parameters for Grand 3 car-following scenario samples. (a) Relative longitudinal distance. (b) Relative lateral distance. (c) Relative speed. (d) Leading vehicle speed. (e) Leading vehicle acceleration.
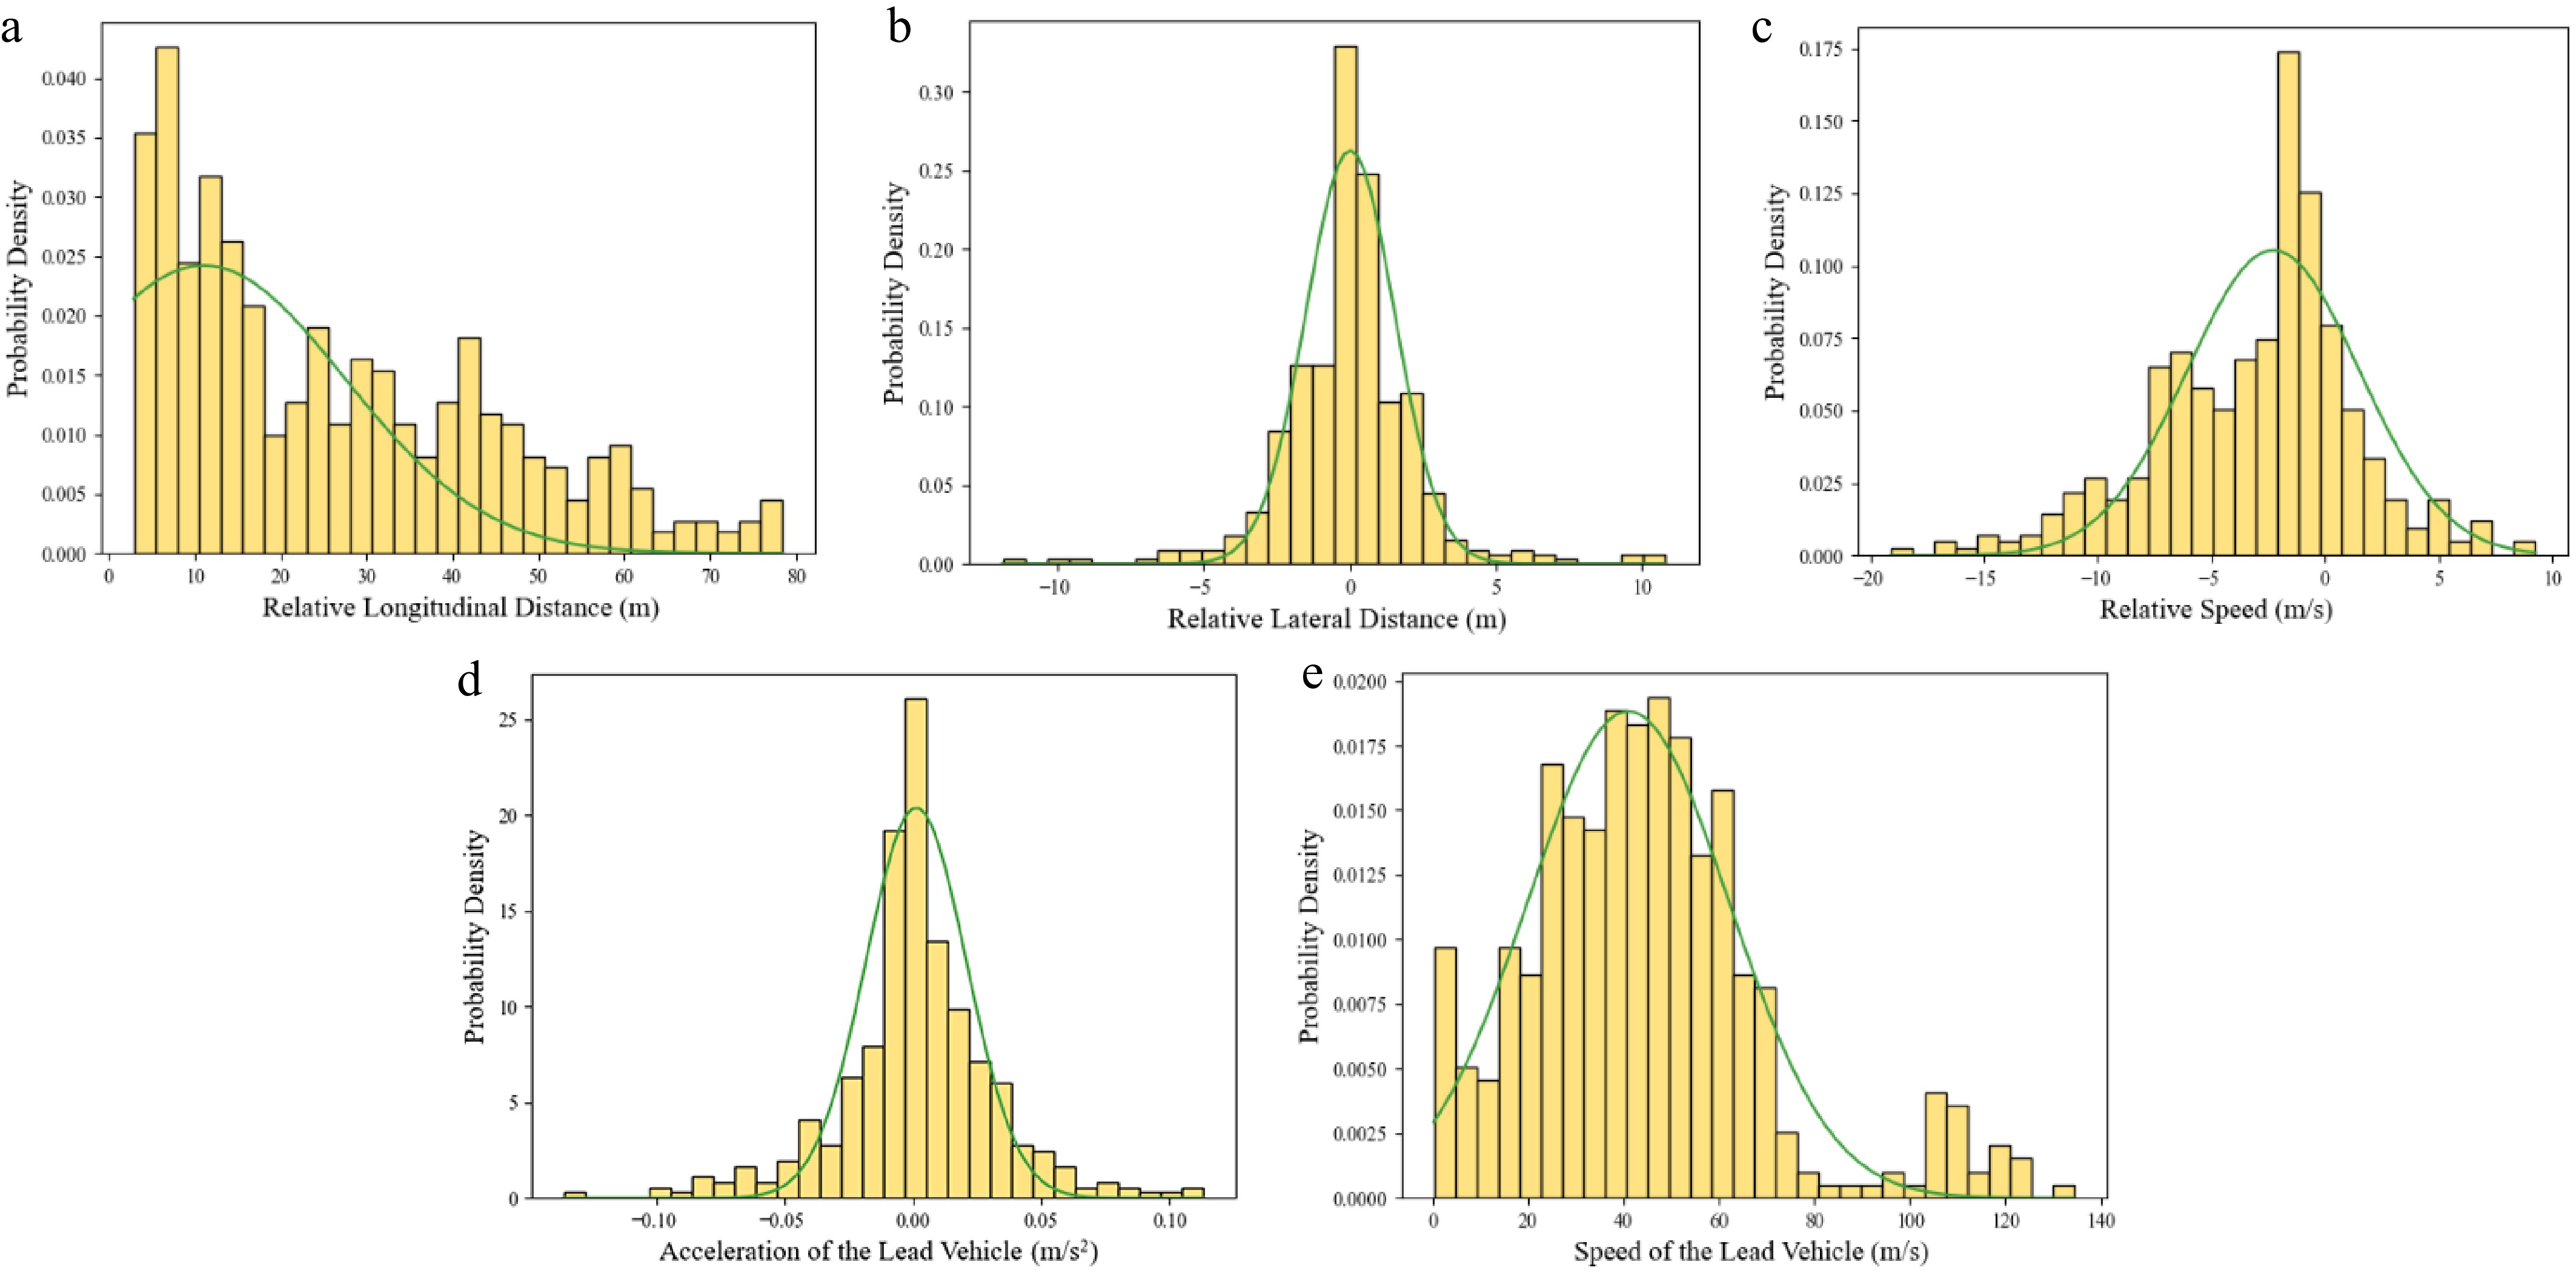
Figure 10.
Probability distribution of basic dynamic parameters for Grand 3 cut-in scenario samples. (a) Relative longitudinal distance. (b) Relative lateral distance. (c) Relative speed. (d) Leading vehicle speed. (e) Leading vehicle acceleration.
Table 5. Normal distribution fit of key parameters for car-following scenarios.
Fitting parameter Mean ($ \mu $) Standard deviation ($ \sigma $) Relative longitudinal distance 23.48 26.58 Relative lateral distance 0.03 1.03 Relative speed −2.74 5.03 Leading vehicle speed 38.59 24.75 Leading vehicle acceleration 0.0011 0.0225 Table 6. Normal distribution fit of key parameters for cut-in scenarios.
Fitting parameter Mean ($ \mu $) Standard deviation ($ \sigma $) Relative longitudinal distance 11.03 16.47 Relative lateral distance 1.52 0.02 Relative speed −2.27 3.79 Leading vehicle speed 40.98 21.18 Leading vehicle acceleration 0.0012 0.0196 Based on the analysis of the probability distributions of dynamic parameters for the two types of scenarios, the parameter value ranges for the selected vehicle dynamic information elements are determined, as shown in Table 7. These, combined with the static scenario element parameter values outlined in Table 1, constitute the PICT input parameter set. To simplify the modeling of the test scenarios, it is assumed that the leading vehicle always maintains a constant speed, meaning the acceleration of the leading vehicle is 0.
Table 7. Vehicle dynamic information elements set.
Scenario elements Parameter value Car-following Cut-in Relative longitudinal distance (1.5, 46.5) 1.5 m discrete (3, 33) 3 m discrete Relative lateral distance 0 (1, 3) 0.5 m/s discrete Relative speed (−10, 5) 1 m/s discrete (−10, 5) 1 m/s discrete Leading vehicle speed (15, 60) 5 m/s discrete (15, 60) 5 m/s discrete Leading vehicle acceleration 0 0 The determined parameter sample set was input into the PICT combinatorial testing tool, with constraints applied to generate the test scene combinations. For easier comparison and analysis, scatter plots illustrating the distribution of the original extracted scenes, PICT-generated test scenes, and filtered test scenes are presented in Figs 11 and 12, with different colors used to denote scenes of varying safety impact levels. The original car-following scenes numbered 18,578, and following the combinatorial generation, the number of test scenes reached 10,240, with 2,328 test scenes retained after filtering. For the original cut-in car scenes, 5,827 scenes were present, with 8,800 test scenes generated post-combination, and 2,510 test scenes retained after filtering. Comparing the scene distribution plots, it is clear that, compared to the original scene distribution, the combinatorially generated test scenes are more tightly clustered within specific value ranges for the dynamic scene elements. The number of scenes and their coverage have significantly increased, and the proportion of Grand 3 test scenes, indicative of higher safety impact levels, has also risen, highlighting the effectiveness of using PICT to generate test scenes for combinatorial testing.
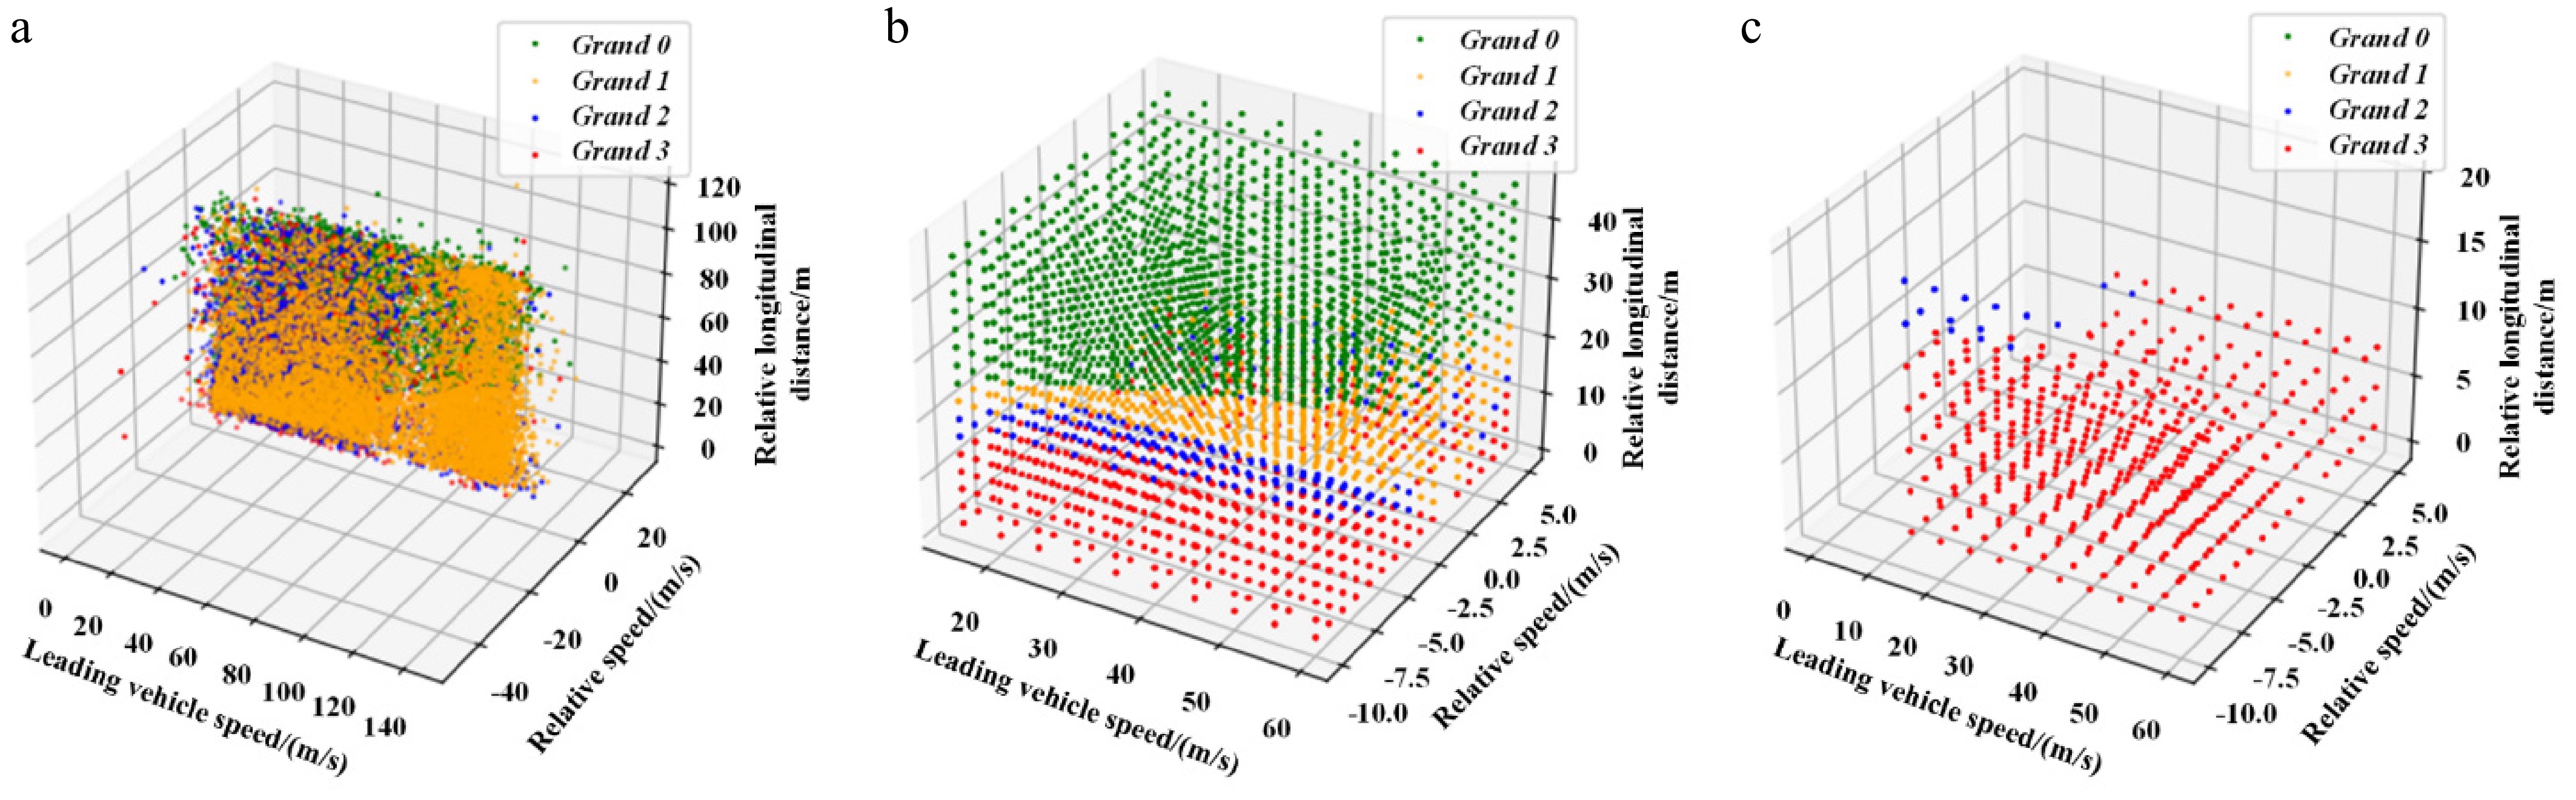
Figure 11.
Generation of car-following scenarios. (a) Original scenario. (b) PICT combined generated test scenario. (c) Filtered scenario.
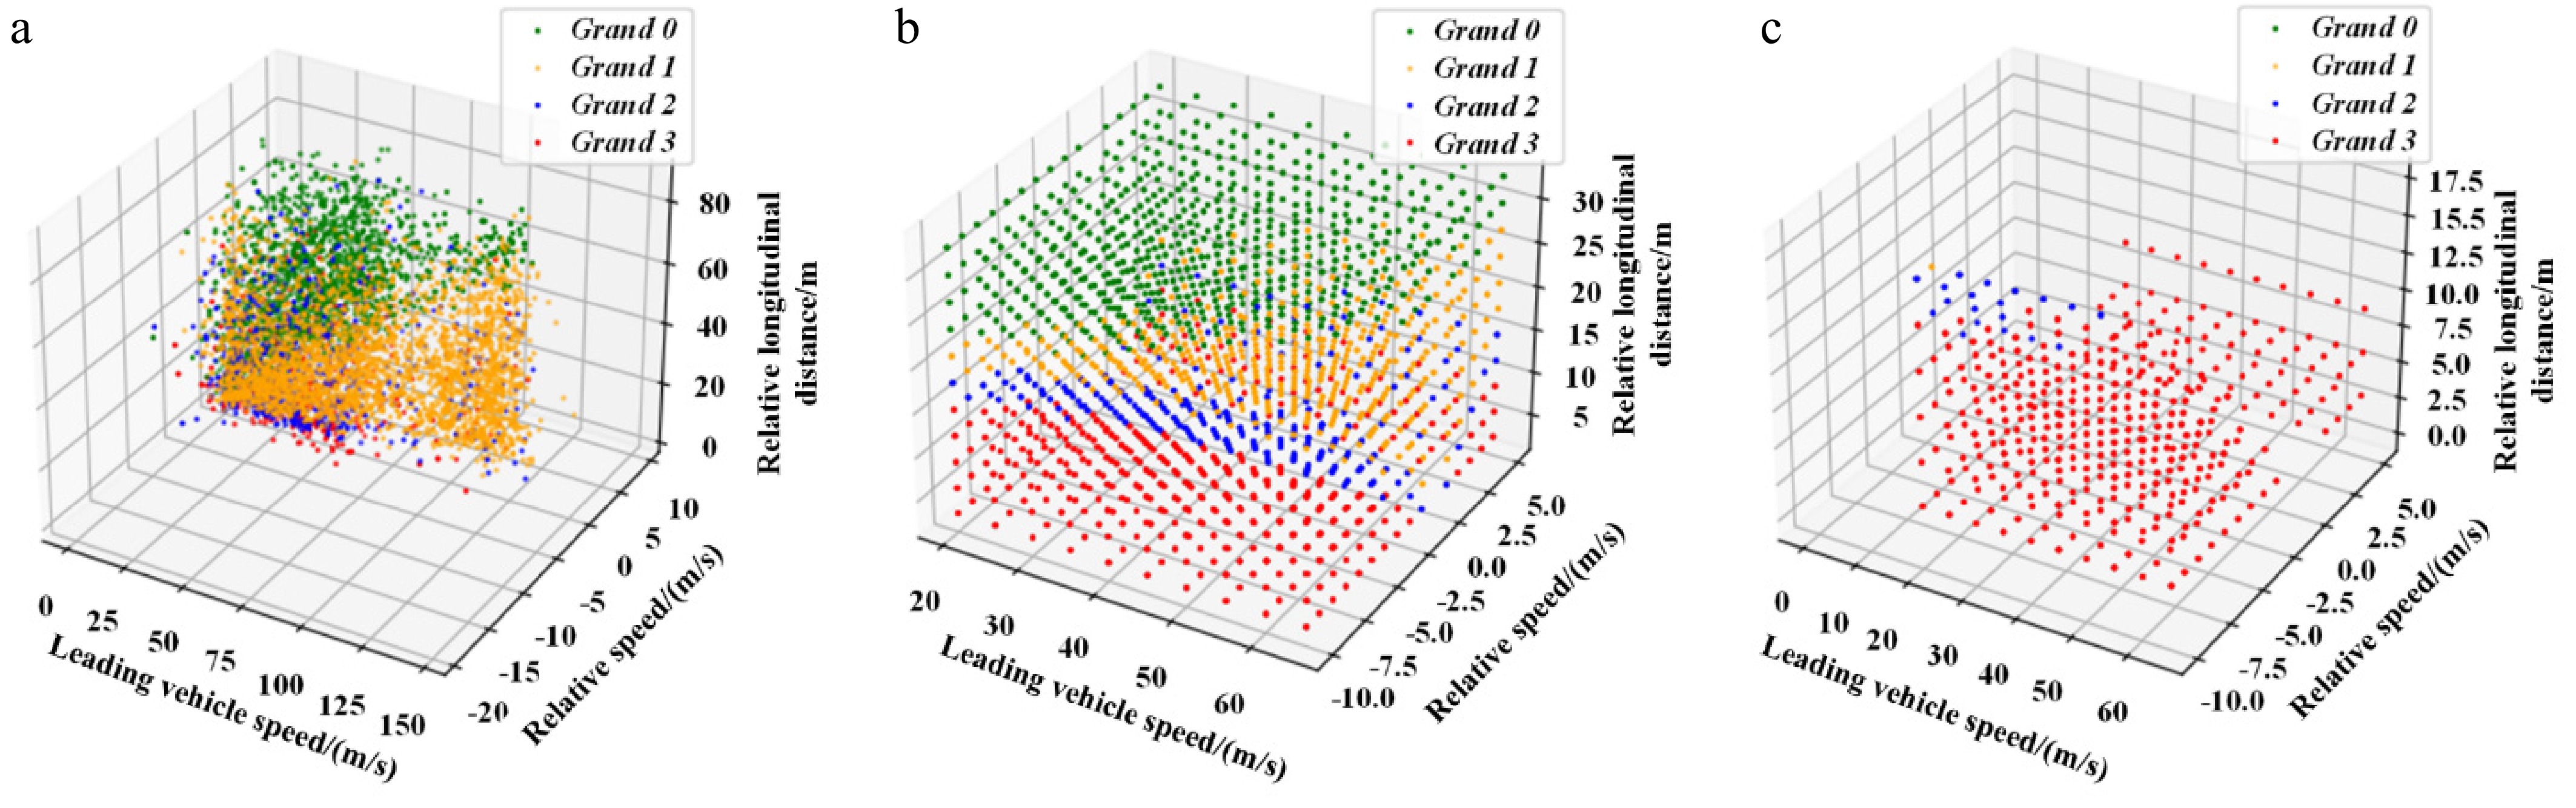
Figure 12.
Generation of cut-in scenarios. (a) Original scenario. (b) PICT combined generated test scenario. (c) Filtered scenario.
Generation of typical test cases
-
The k-prototypes method was employed to cluster the filtered scenes for both categories. The elbow plot in Fig. 13 provides a rough indication of the optimal clustering range, although the exact number of clusters is not precisely determined. Specifically, the optimal number of clusters for the car-following scenario ranges from 6 to 11, while for the cut-in car scenario, it ranges from 5 to 9. Further analysis using the silhouette coefficient, shown in Fig. 14, indicates that the silhouette coefficient achieves a local peak when the car-following scenario is clustered into nine groups and the cut-in car scenario into six groups. Therefore, the final number of clusters for the car-following and cut-in car scenarios was set to 9 and 6, respectively.
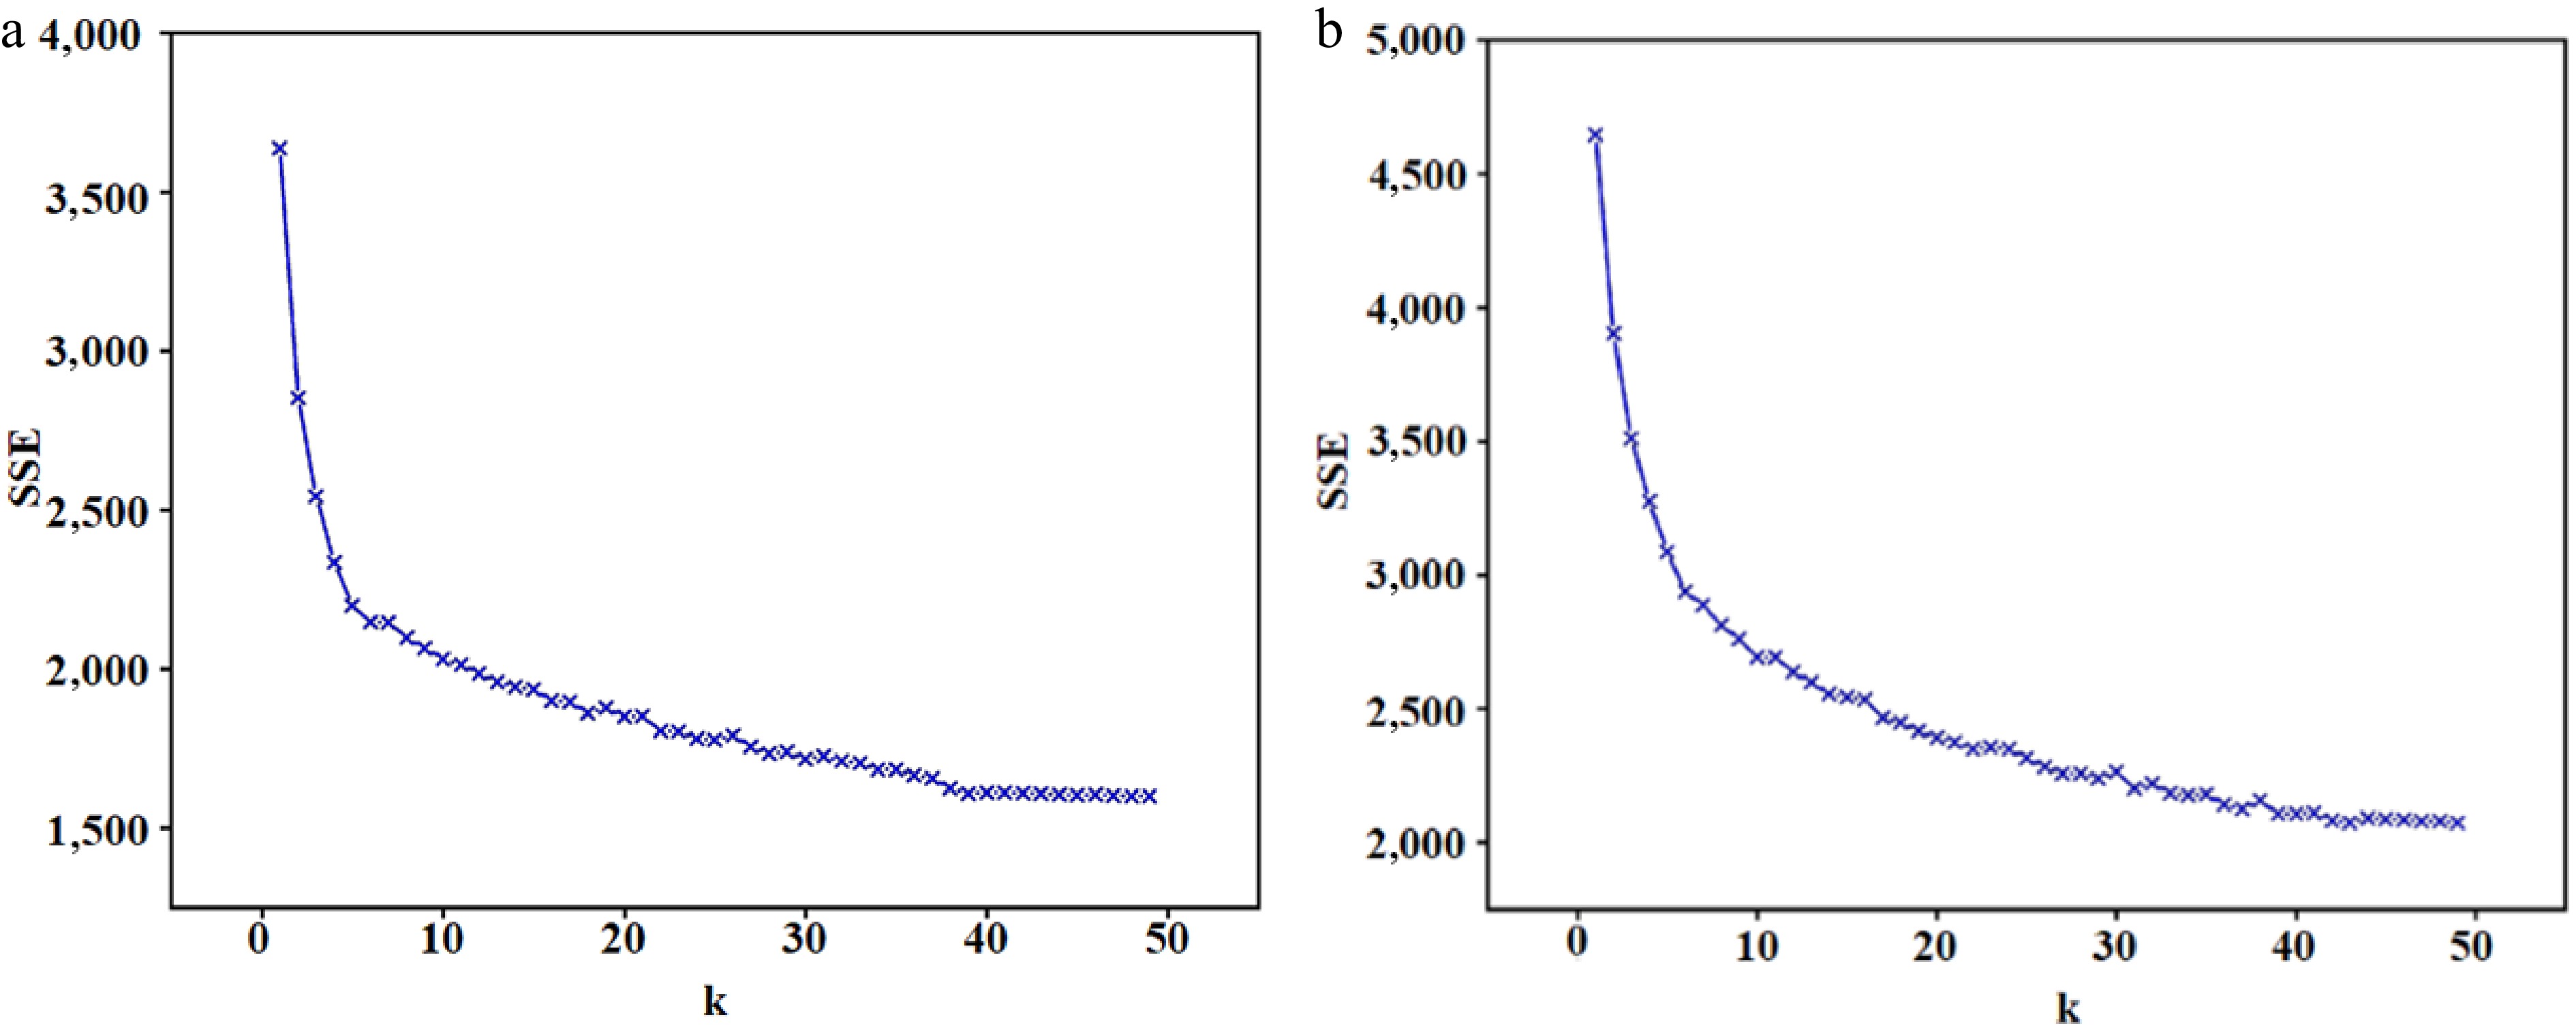
Figure 13.
Elbow plot of clustering. (a) Car-following scenario. (b) Cut-in scenario.
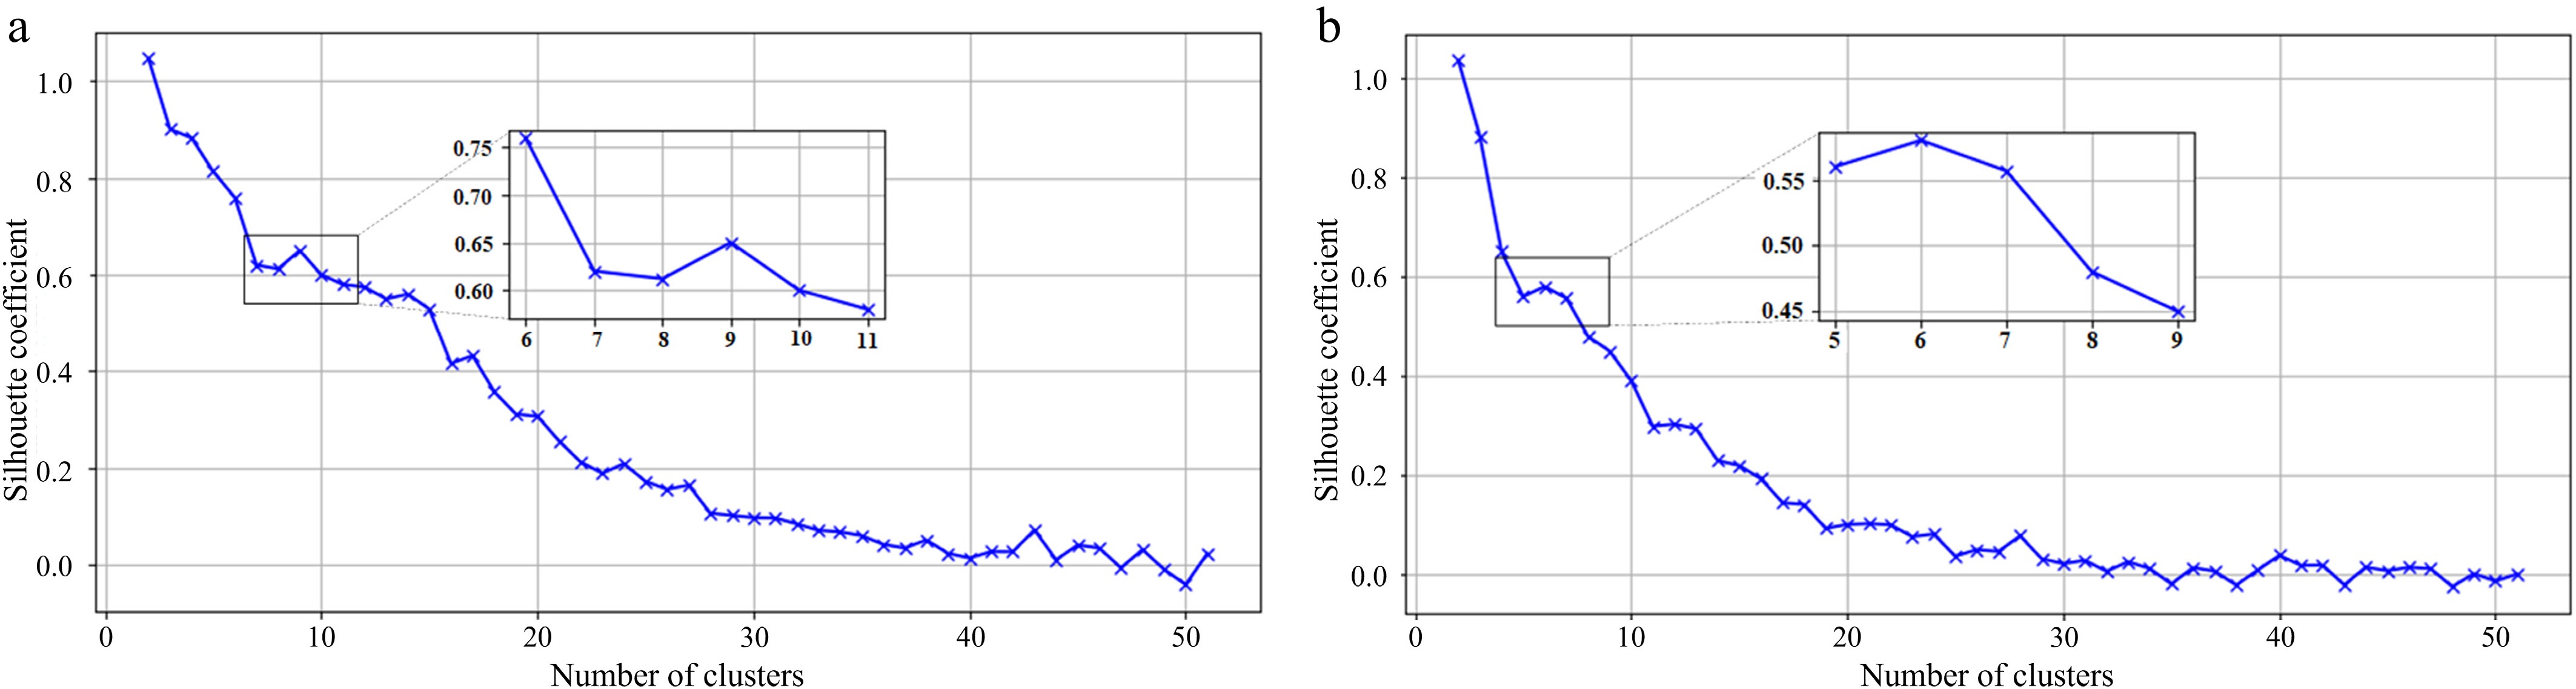
Figure 14.
Silhouette coefficient plot for clustering. (a) Car-following scenario. (b) Cut-in scenario.
Following the clustering process, 15 representative key test cases were generated, with the specific parameters provided in Table 8.
Table 8. Fifteen types of typical test scenarios.
Scenario
typeScenario WC IC NL TF LD
(m)LAD
(m)RS
(m/s)LS
(m/s)LA
(m/s2)Car-following 1 CD N 6 H 19.5 0 0 30 0 2 R-M D 4 L 4.5 0 3 15 0 3 CD N 4 M 34.5 0 0 25 0 4 S-S D 6 M 10.5 0 −6 50 0 5 CD N 2 L 7.5 0 −9 35 0 6 R-S D 2 H 13.5 0 −10 55 0 7 S-M N 6 L 22.5 0 0 55 0 8 R-M N 4 H 4.5 0 −4 40 0 9 F-S D 6 H 1.5 0 −8 30 0 Cut-in 1 S-L N 2 L 18 1.5 0 22 0 2 CD D 6 M 6 2.5 0 60 0 3 R-M N 4 M 15 1 −10 60 0 4 S-S N 6 H 24 2.5 −8 17 0 5 R-L D 2 H 12 3 −10 40 0 6 F-L D 4 L 33 2 0 20 0 WC, weather conditions; IC, illumination condition; NL, number of lane lines; TF, traffic flow; LD, relative longitudinal distance; LAD, relative lateral distance; RS, relative speed; LS, leading vehicle speed; LA, leading vehicle acceleration. In WC, CD represents clear day. If shown in the form 'a-b', a represents weather (R, S, F, for rainy, snowy, foggy, respectively), and b represents severity (S, M, L, for small, medium, large, respectively). In IC, D and N represent day and night, respectively. In TF, L, M, and H represent low, medium, and high, respectively. Analysis of simulation results for test cases
-
Using the 15 typical scenarios derived from the clustering analysis, simulation test scenes were constructed in SCANeR software. To validate the effectiveness of these test scenes, the NORMAL-class black-box autonomous driving algorithm in SCANeR was used as the test subject. The simulation experiments were conducted within the constructed scenarios, and the results were recorded. The 15 typical simulation test scenarios are shown in Fig. 15.
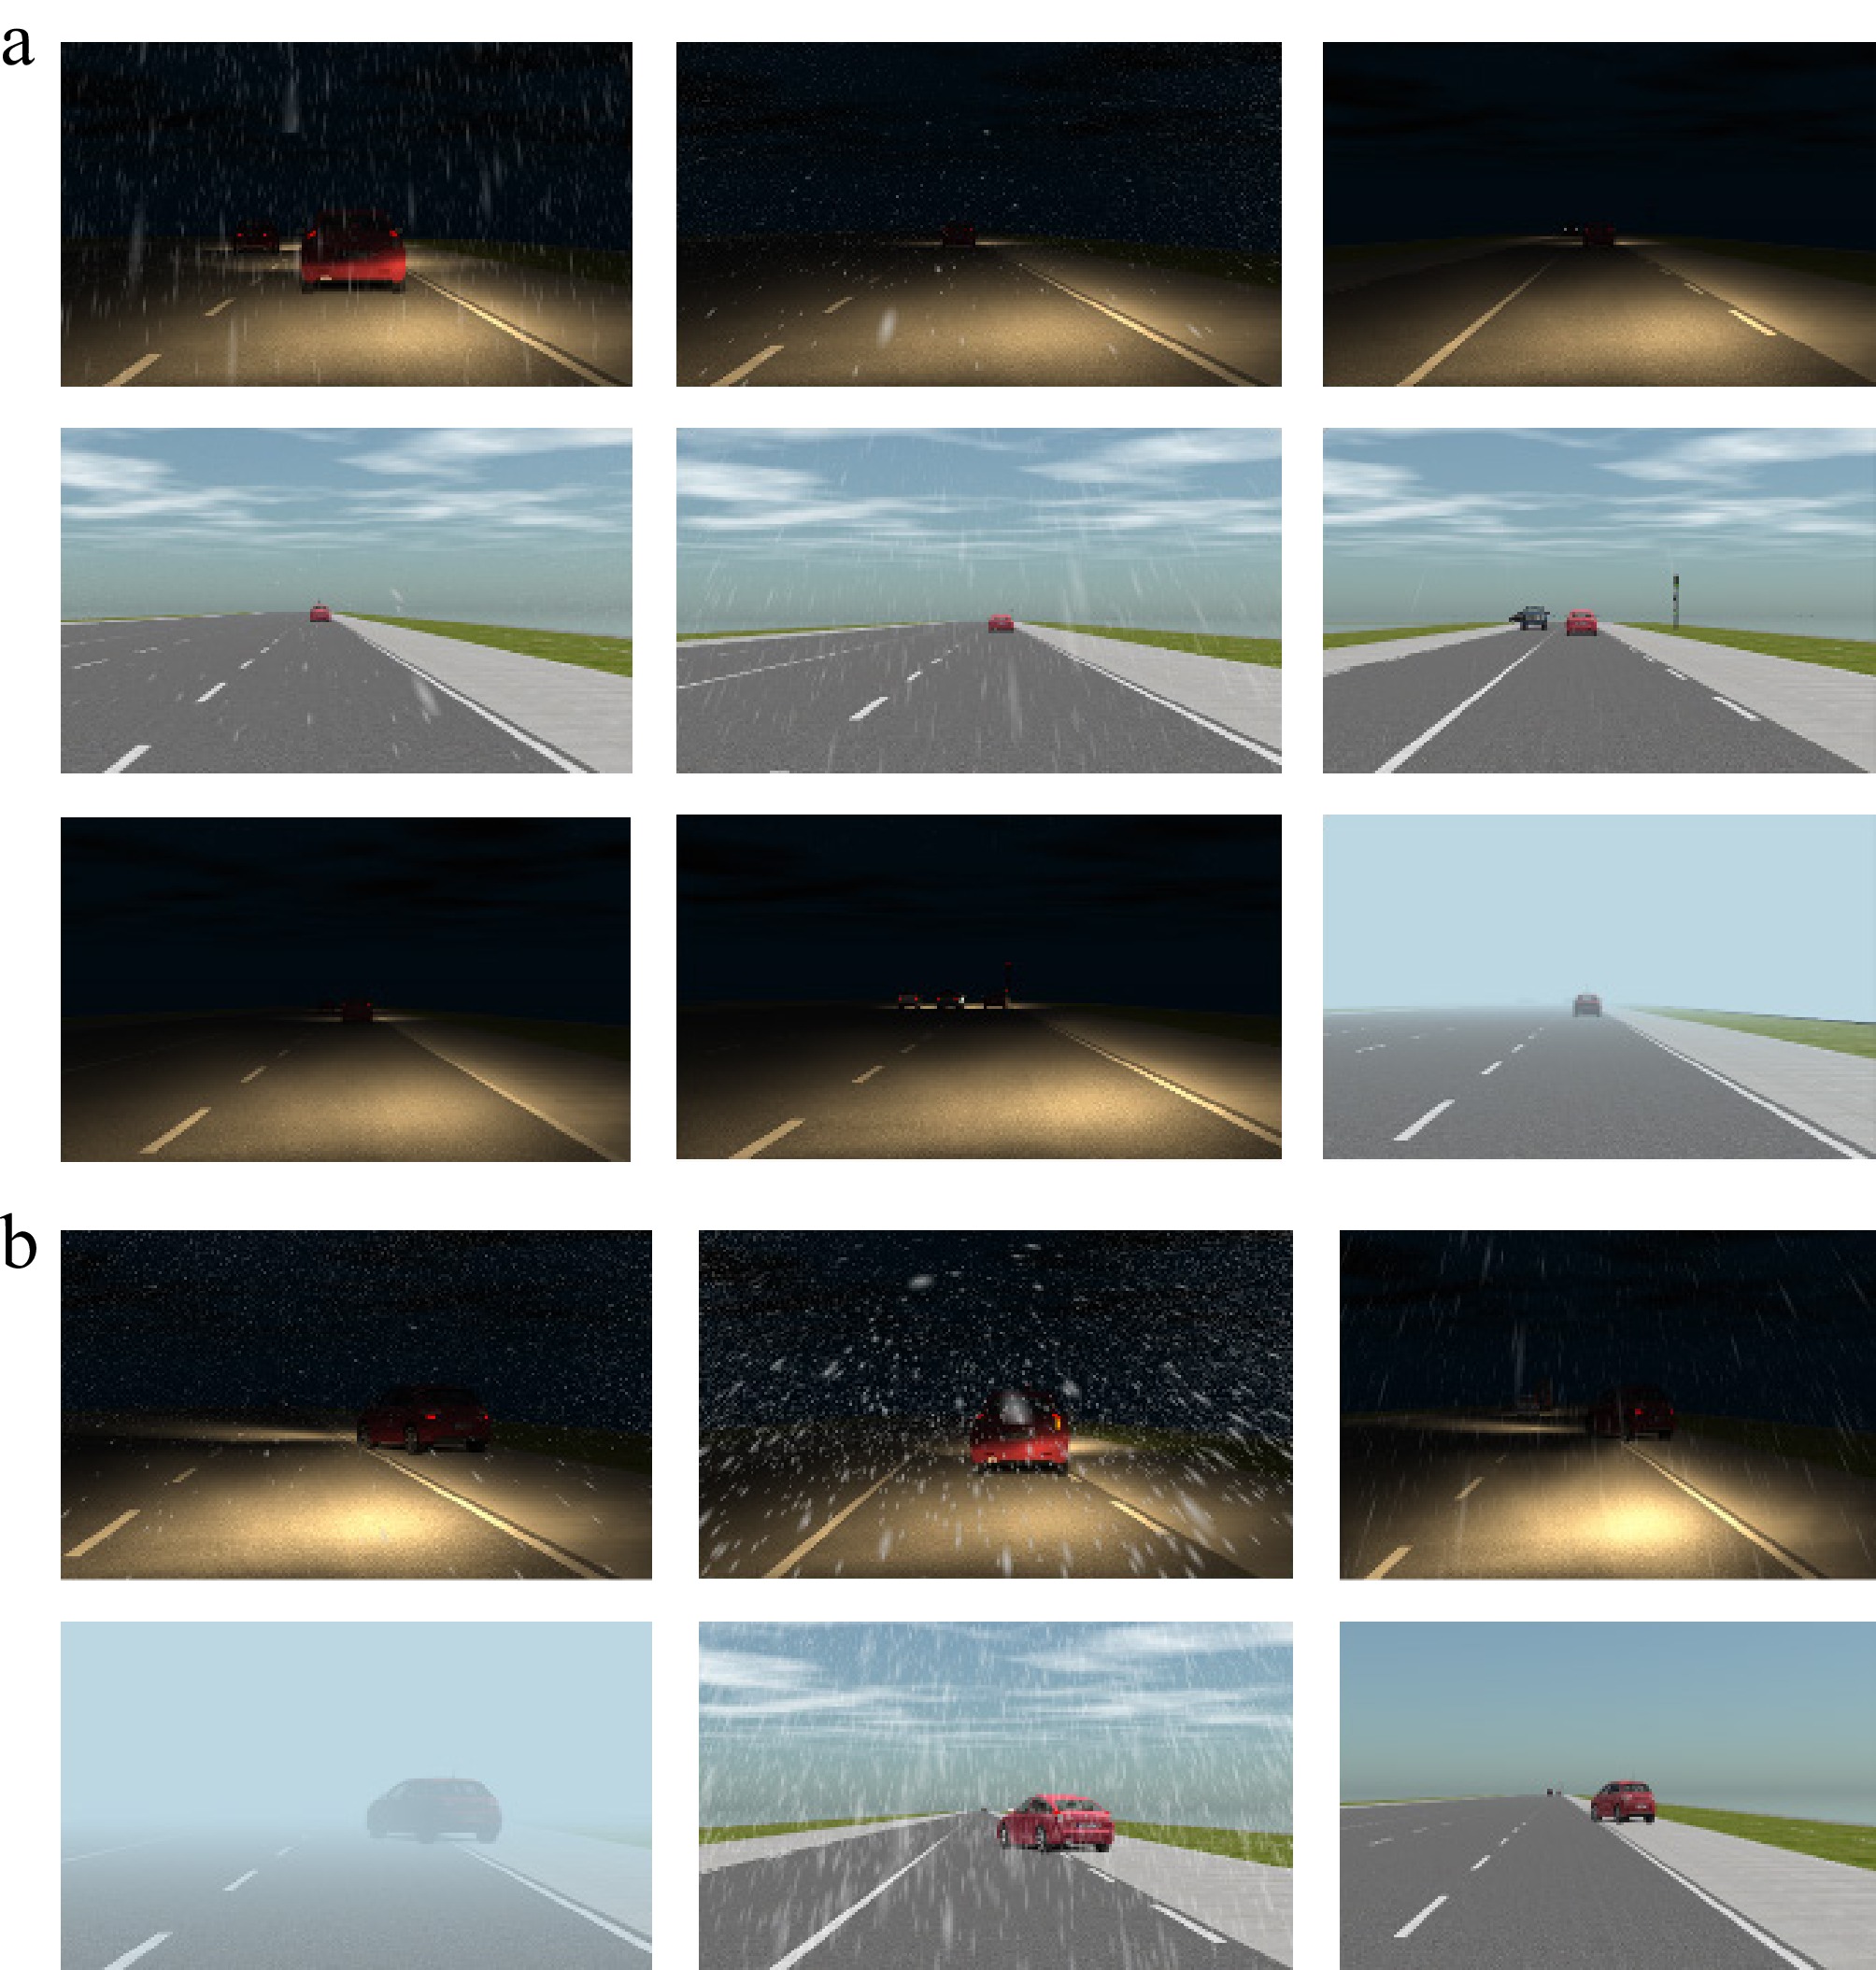
Figure 15.
Fifteen representative simulation test scenarios. (a) Car-following scenario. (b) Cut-in scenario.
To further demonstrate the validity of the constructed scenarios, we visualized the test performance of the vehicle in the car-following Scenario 1 and the cut-in Scenario 1, as shown in Figs 16 and 17. In the car-following scenario, a 6-s segment after the car-following began was extracted, while in the cut-in scenario, a 3-s segment during the insertion process was selected. The analysis results reveal that in the car-following scenario, the autonomous driving system detected the lead vehicle and initiated a deceleration to maintain a safe following distance. In the cut-in scenario, the test vehicle decelerated as the lead vehicle inserted and briefly accelerated afterward to adjust its speed, while maintaining a safe distance from the lead vehicle. The simulation results indicate that the autonomous system demonstrated reasonable reactions and behaviors in both scenarios, further confirming the validity and effectiveness of the constructed test scenarios. Furthermore, a visual analysis of 10 repeated test results shows that while the overall trends remained consistent, there were differences in how the vehicle handled specific details. This not only validates the rationality and effectiveness of the constructed test scenarios but also demonstrates the high reliability and applicability of the test results.
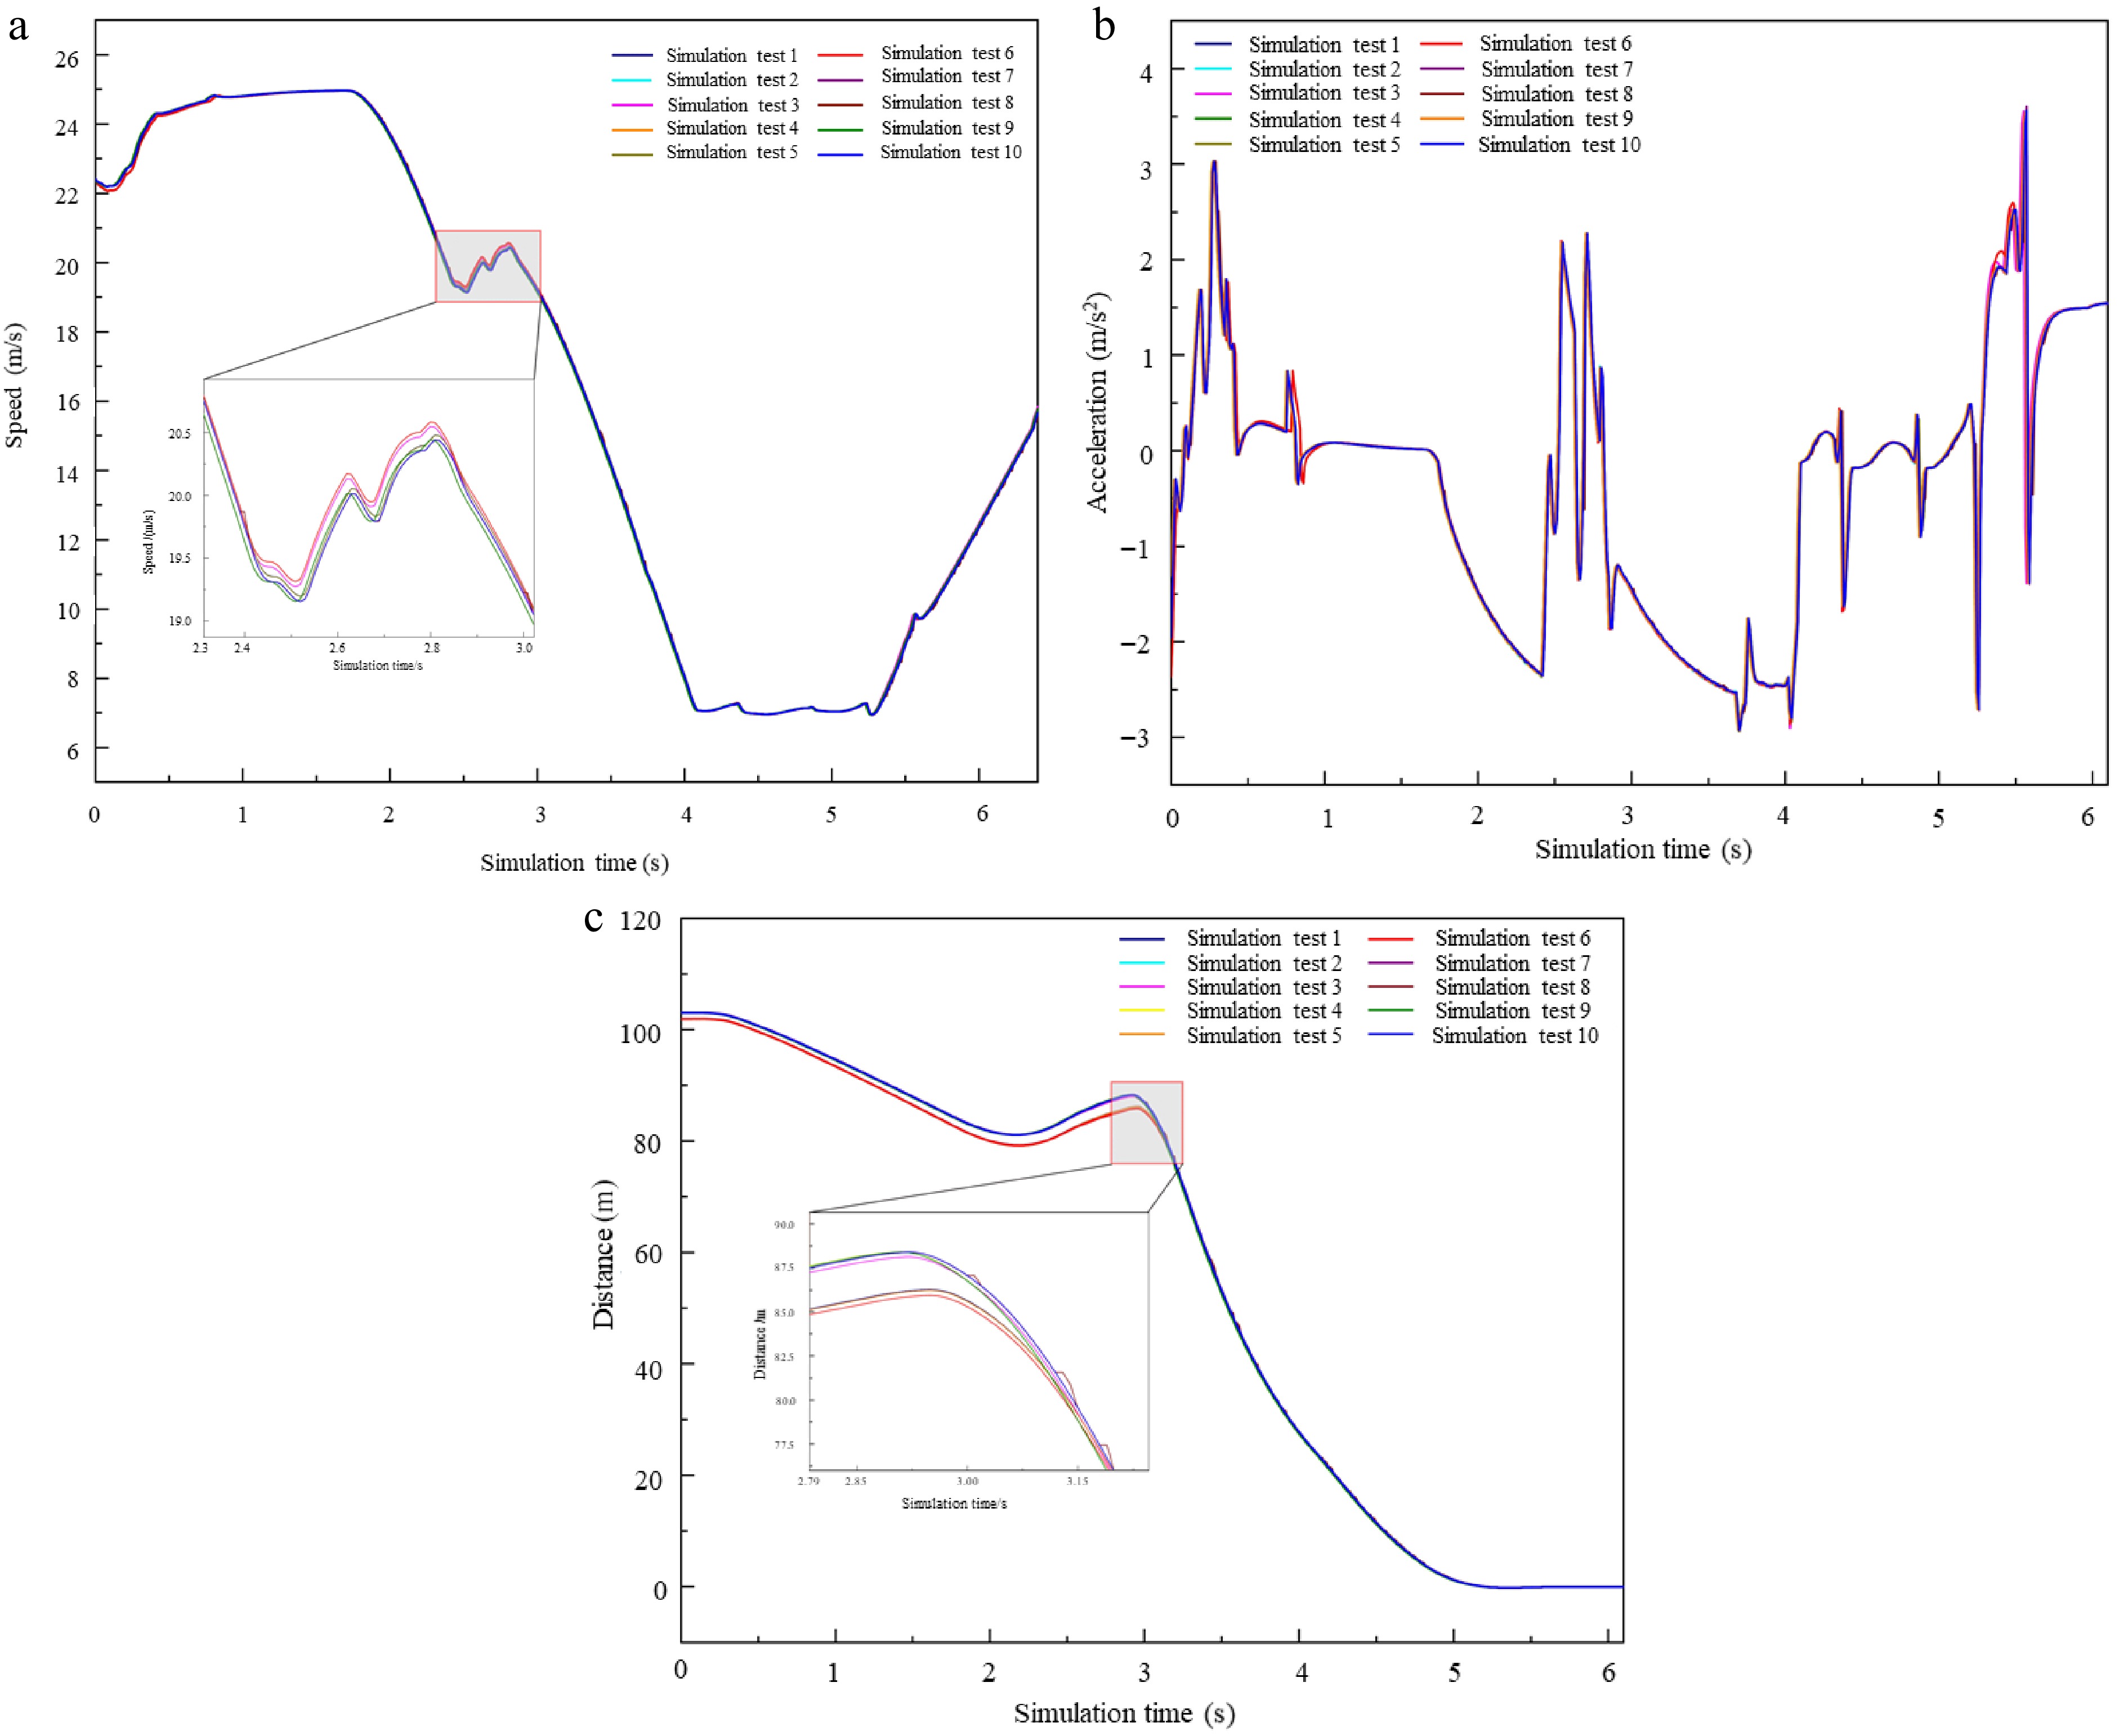
Figure 16.
Simulation test results for car-following Scenario 1. (a) Ego vehicle speed. (b) Ego vehicle acceleration. (c) Relative distance.
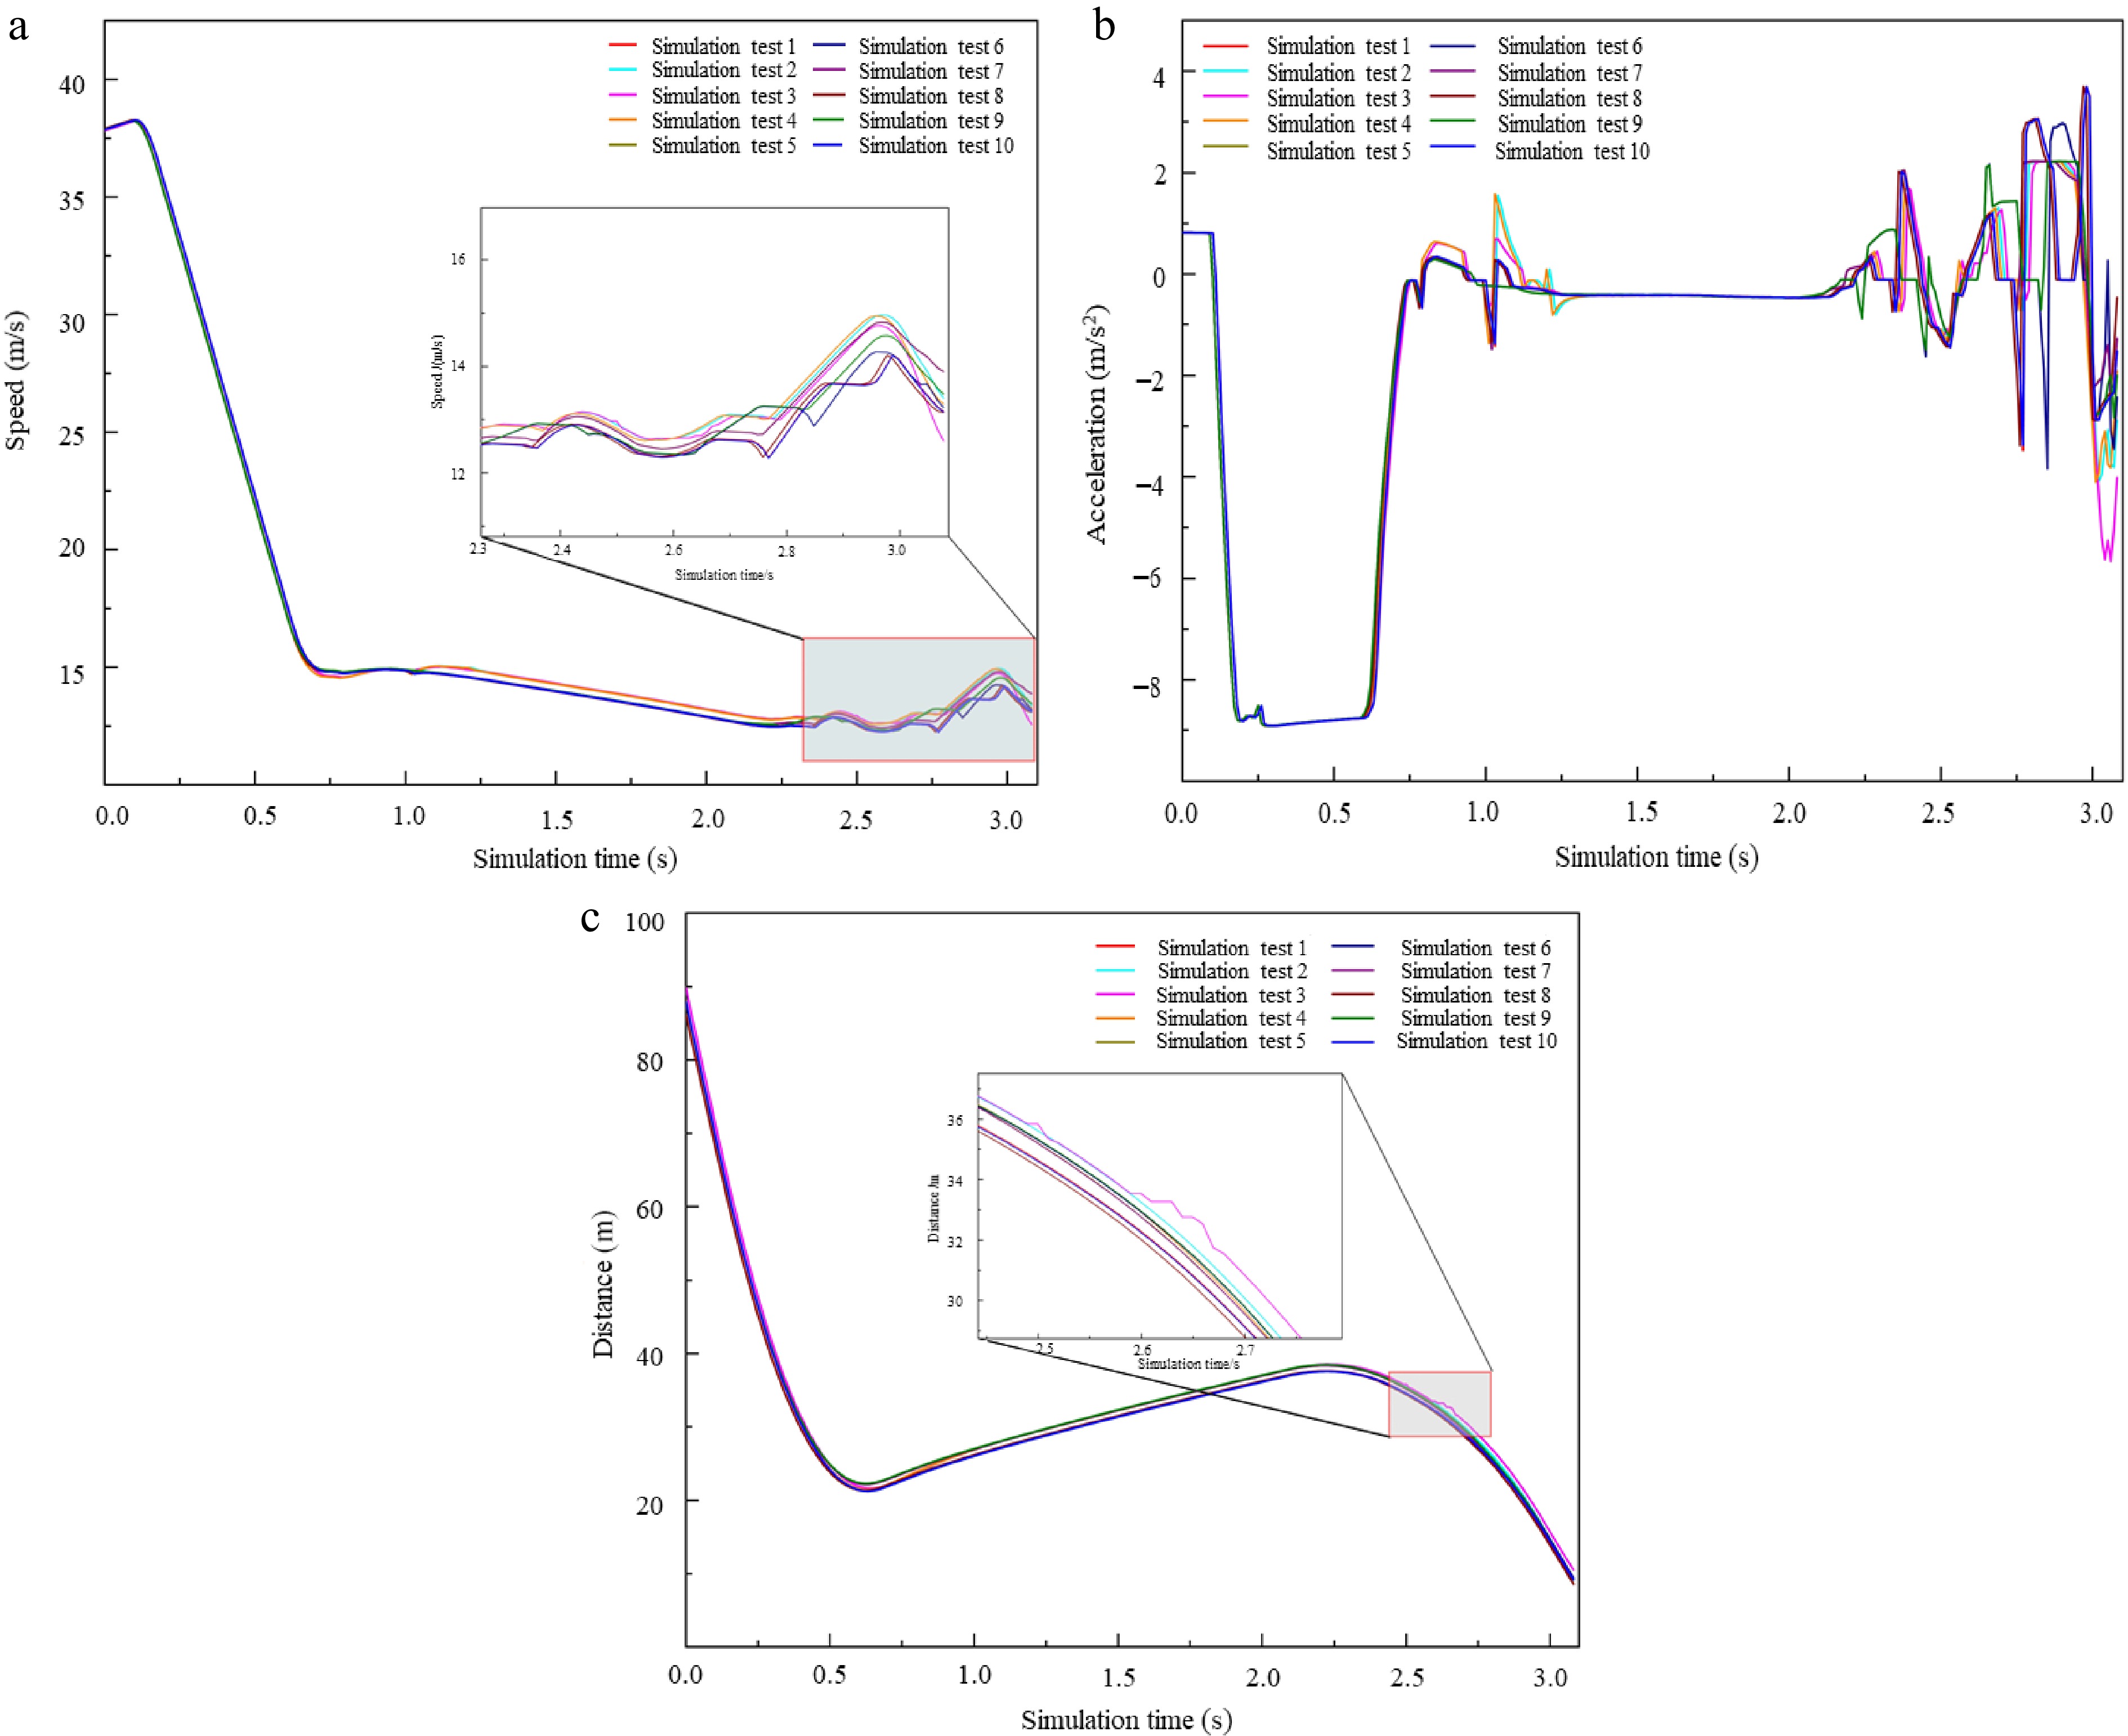
Figure 17.
Simulation test results for cut-in Scenario 1. (a) Ego vehicle speed. (b) Ego vehicle acceleration. (c) Relative distance.
-
To meet the demands of high-level autonomous driving safety testing and align with the widely adopted scenario-based testing methods, this paper proposes a novel approach for constructing typical autonomous driving safety test scenarios. This method can generate representative and targeted safety test cases for autonomous driving. The key conclusions are as follows:
(1) Based on the concept of autonomous driving safety, the Safety Impact Coefficient (SIC) is introduced as a selection criterion, effectively quantifying the impact of a scene on autonomous driving safety.
(2) By analyzing the coupling relationships between safety factors and scene features, key scene elements are identified. The PICT-based strength combination method is employed to generate and generalize test scenarios, while k-prototypes clustering is used to construct typical test case scenarios.
(3) Results from the SPMD dataset demonstrate that the proposed method successfully identifies dynamic scene features with strong correlations to scene safety. It generates effective test scenarios that meet the required quantity while capturing different safety impact levels, and produces representative key test cases.
(4) Simulation test results further validate that the test cases generated by the proposed method exhibit good rationality and effectiveness when tested on autonomous driving systems.
The proposed method addresses the limitation of insufficient targeting in traditional test scenario generation approaches. It provides theoretical support and practical reference for the construction of virtual scenario libraries for autonomous driving safety testing, thereby improving testing efficiency and reducing associated costs and risks. The proposed framework is not limited to the car-following and cut-in scenarios considered in this study, and can be naturally extended to more complex traffic scenarios, such as intersection interactions and pedestrian crossings, by incorporating additional scenario elements and safety-related indicators. However, due to limitations in experimental conditions and available resources, the generated test scenarios remain limited in scale and diversity, and are not yet sufficient to comprehensively cover the complexity of real-world traffic environments. Future work will focus on expanding the scale and diversity of scenarios, as well as further validating and refining the proposed method under more complex traffic conditions, in order to enhance its practicality and generalization capability.
-
The authors confirm contributions to the paper as follows: study conception and design: Guo B, Guo H; data collection: Liu X; analysis and interpretation of results: Liu X, Han Z; draft manuscript preparation: Shi W, Liu J. All authors reviewed the results and approved the final version of the manuscript.
-
The data that support the findings of this study are available in the SPMD repository. These data were derived from the following resources available in the public domain: http://doi.org/10.21949/1504482.
-
This work is supported by the National Natural Science Foundation of China (52202503), the National Key Laboratory of Automotive Chassis Integration and Bionics (20230209), the Hebei Natural Science Foundation (F2025203057), and the Hebei Province Graduate Innovation Ability Training Funding Project (CXZZBS2026068). The authors would also like to express their sincere gratitude to Professor Lisheng Jin from the School of Vehicle and Energy, Yanshan University, for his valuable guidance and support in the experimental design and manuscript preparation.
-
The authors declare that they have no conflict of interest.
- Copyright: © 2026 by the author(s). Published by Maximum Academic Press, Fayetteville, GA. This article is an open access article distributed under Creative Commons Attribution License (CC BY 4.0), visit https://creativecommons.org/licenses/by/4.0/.
-
About this article
Cite this article
Guo B, Guo H, Liu X, Han Z, Shi W, et al. 2026. Research on methods for constructing typical safety test scenarios in autonomous driving. Digital Transportation and Safety 5(2): 144−158 doi: 10.48130/dts-0026-0012 

Research on methods for constructing typical safety test scenarios in autonomous driving
- Received: 02 April 2026
- Revised: 23 April 2026
- Accepted: 13 May 2026
- Published online: 29 June 2026
Abstract: To address the limitations of traditional test scenario construction, including single-dimensional screening metrics and the challenge of balancing efficiency and quality, this paper proposes a method for constructing typical test scenarios for autonomous driving safety evaluation. First, the Safety Impact Coefficient (SIC) is introduced as a screening metric to analyze the coupling relationships between autonomous driving safety characteristics and scenario elements, enabling the identification of key scenario factors. Next, a PICT variable-strength combination strategy is adopted to construct multidimensional test scenario sets, designed to meet diverse requirements for evaluating autonomous driving safety. Finally, a k-prototypes clustering method is utilized to generate representative and targeted typical test cases. Validation results on the SPMD dataset and through simulation tests demonstrate that the proposed method can efficiently and accurately generate critical test cases that cover various safety impact levels. Moreover, the constructed test cases exhibit strong rationality and effectiveness in autonomous driving system testing. This research addresses the lack of specificity in traditional test scenario construction methods, offering robust technical support for enhancing testing efficiency and reducing costs in autonomous driving safety evaluations.
-
Key words:
- Autonomous driving /
- Test scenario /
- Scenario construction /
- PICT /
- K-prototypes