


-
On April 15, 2019, the Notre Dame Cathedral in Paris, France, which stores a large collection of artistic treasures within a great historical and culturally valuable building, suddenly caught fire, causing severe damage to the structures with the exception of the main structure. According to data from the Fire Rescue Bureau of the Chinese Ministry of Emergency Management over about a decade, China had reported nearly 400 fires in cultural relics and ancient buildings[1,2]. Due to the presence of wooden structures and flammable materials in ancient buildings, there generally is a high probability of fire occurrence. Installing fire protection equipment would cause a certain degree of damage to the structure of ancient buildings, in order to communicate and transmit information with the surrounding environment in a timely manner, the fire detection sensor network transmission should be carried out as efficiently as possible with minimal intervention[2]. Therefore, the security technology needs to design appropriate fire warning algorithms, with a timely warning in order to eliminate fires in their early stages.
Image fire detection technology based on deep learning mainly includes recognition and detection[3−6]. Park & Ko integrated Elastic into the Backbone module of YOLOv3 network, and used a random forest classifier to determine whether the target was a flame. This method can effectively detect fire information in complex scenes, but the model is large and requires high computational power for inference, which cannot meet the requirements of real-time inspection[7]. Xu et al. proposed a salient object detection algorithm that integrates pixel level and target level to detect smoke in open spaces, which the original feature information of the image is preserved to a large extent, but the network itself had insufficient feature utilization, resulting in low average classification performance[8].
For this reason, Lei et al.[9] designed a Fire risk level prediction of Heritage of the Wooden Pillar Palace Group based on entropy and XGBoost, and early warning system equipped with MHMapGIS for real-time positioning, In this study, a fire risk index-driven solution is proposed based on machine learning to predict the fire risk level of Heritage of the Wooden Pillar Palace Group, the visualization was achieved by combining the machine learning model and spatial analysis to form a time series of fire-risk-rank maps of palaces.
Traditional fire detection technology mainly identify the characteristics of flames on image processing, combining image processing and pattern recognition technology, the suspected area is first marked, and then the feature extraction of the framework is carried out, then, pattern recognition technology is used to identify and classify these features. The accuracy and reliability cannot be guaranteed by means of the traditional image recognition methods. Zhang & Zhang[10] designed a smoke warning system based on the Internet of Things and image processing, the system uses image processing and convolutional CNN networks for smoke detection, combined with the ESP8266 microprocessor, the experimental results show that there are higher learning efficiency, accuracy and better convergence; Qian[11] had designed a real-time monitoring system based on big data technology, communication technology, and cloud computing technology, it evaluates the degree of fire risk through Bayesian networks and combines sensor centroid algorithms for real-time positioning, from their experimental results it was reported that the detection position is accurate and the speed is fast.
This article combines the artificial neural networks with the deep learning to perform an innovative grid based visual fire risk warning onthe Imperial Palace, China, integrating the grid based algorithms into the security monitoring end, specifically dividing geographical areas into the regular grid units and analyzing relevant data for each unit, in order to monitor fire risk factors in real-time (this article focuses on smoke). Using artificial neural networks in deep learning and adopting smoke detection technology, the smoke situation in the grid area is detected. In addition, referring to the idea of cyclic queues, dynamically update the risk status of each region in the overall grid. Finally, the application effect of the design algorithm were explored with MHMapGIS. The results visually displayed the specific grid area of smoke, and the real-time feedback warning function of fire warning was implemented in the security monitoring terminal.
-
Data gridding is a method of dividing building areas into regular grids, assigning discrete data with uneven spatial distribution, such as the number of detectors, to the grid according to a certain algorithm. Each grid uses a feature value to represent the numerical value of the grid, thereby transforming the data from scattered to continuously changing. The common grid methods include equidistant grid method, nearest neighbor grid method, inverse distance method, Kriging method, and radial basis function method. In practical work, suitable methods are often chosen for data gridding based on different research objectives and data characteristics. Zhou et al.[12] proposed a step-by-step extension meshing algorithm to target the issues of complex surfaces being unable to be directly extended. The algorithm detects and processes the concave and convex corners of complex surfaces, and verifies its effectiveness through the CATIA reverse engineering module to reconstruct data. Wen[13] compared and analyzed the cross validation results of three gridding algorithms: inverse distance method, Kriging method, and radial basis function method, and concluded that the Kriging method had the best effect on data gridding. Gao et al.[14] regarded the problem of lower transmission rate and processing efficiency using the bilinear interpolation and improved matrix Apriori algorithm for the grid partitioning and data compression. For the discrete nature of fire risk grid feature in the complexity of buildings, commonly used algorithms include equidistant grid method and inverse distance method.
Equal spacing grid method
-
The equidistant gridding algorithm is an algorithm that evenly divides the overall area of a building into grid cells based on the required number of grids and assigns eigenvalues. The equidistant grid algorithm displays fire risk areas more intuitively, and its biggest feature is simplicity and regularity. Due to the equal size of each grid cell, this algorithm can more conveniently process and calculate relevant data.
Inverse distance method (IDW)
-
The inverse distance method (IDW) is one of the most commonly used meshing methods for transforming irregular distribution points into regular distribution points. This method assumes that things that are closer to each other are more similar than things that are farther apart. When making numerical predictions for unknown points, the inverse distance method will calculate the correlation based on the known data around the point. Compared with the known data at a farther distance, the closest distance has a greater impact on the predicted value of the point. Each measurement data point has a local influence that is inversely proportional to the distance between them and decreases as the distance increases. In the inverse distance method, this influence is converted into assigned weights, the closer the point is to the predicted position, the greater the assigned weight, and the larger the distance, the smaller the weight value. In the inverse distance method, there are two important parameters: the distance power exponent and the search neighborhood. The power exponent of distance determines the rate at which weights decrease with distance.
The distance Di from the predicted position (xi, yi) to the known data point position (x0, y0) in a two-dimensional spatial plane is:
$ {D_i} = \sqrt {{{\left( {{x_0} - {x_i}} \right)}^2} + {{\left( {{y_0} - {y_i}} \right)}^2}} $ (1) In the search area, find the distance between the N nearest discrete points to the predicted position point (xi, yi), and the weight function and predicted value of the predicted position (xi, yi) are:
$ {\lambda }_{\left({\text{x}}_{\text{i}},\;{\text{y}}_{\text{i}}\right)}=\dfrac{1}{{\left({D}_{i}\right)}^{p}}\Bigg/{\displaystyle \sum _{i=1}^{N}\dfrac{1}{{\left({D}_{i}\right)}^{p}}} $ (2) $ {Z}_{\left({x}_{i},\;{y}_{i}\right)}={\displaystyle \sum _{i=1}^{N}{\lambda }_{i}*{Z}_{i}=}{\displaystyle \sum _{i=1}^{N}\dfrac{{Z}_{i}}{{\left({D}_{i}\right)}^{p}}}\Bigg/{\displaystyle \sum _{i=1}^{N}\dfrac{1}{{\left({D}_{i}\right)}^{p}}} $ (3) In the formula, Di is the distance between the predicted position and the known data point position, λ(xi, yi) is the weight assigned to the predicted position, Z (xi, yi) is the predicted value of the predicted point position, Zi is the observed value of a known data point, N is the number of samples involved in the calculation, P is the power exponent of the distance function, generally taken as 2.
-
Considering the vast area of the Imperial Palace, China, if a single equidistant grid is used for partitioning, it will result in a lack of mapping of characteristic data such as building density and pedestrian flow, ignoring the non-uniformity of characteristic attributes within the area, and leading to higher or lower risks deviated from actual situation in certain areas. Therefore, combining equidistant grid division and IDW algorithm, with equidistant grid division as the main method and IDW method as the auxiliary, in the IDW method section, it is proposed to use building density as a weight function for unknown prediction, fully considering the differences in building density in the Imperial Palace and the resulting differences in pedestrian flow. In addition, two optimization methods, grid grouping search and density compensation, were proposed to flexibly divide the region into grid units of different sizes and densities, further accurately reflecting the fire risk in different parts, and fully improving the accuracy and real-time performance of the fire warning algorithm.
Density weight function
-
In this grid partitioning algorithm, the inverse method based on building density is adopted, the rules are, that the greater the weight assigned, the denser the building density, and the smaller the grid assigned. According to the IDW method, the weight function is the building density. The method for determining the number of buildings in the grid area within a two-dimensional plane supported by coordinates is as follows:
$ BuildNu{m_i} = \left\{ {\begin{array}{*{20}{c}} {1\begin{array}{*{20}{c}} {}&{contain} \end{array}} \\ {0\begin{array}{*{20}{c}} {}&{exclude} \end{array}} \end{array}} \right. $ (4) $ {N_i} = \sum\limits_{i = 1}^N {BuilNu{m_i}} $ (5) In the formula, 'contain' means that the grid contains the building, and 'exclude' is that the grid does not include the building, where N represents the total number of buildings in the entire area and Ni represents the number of buildings in the i-th area.
$ {\lambda _i} = {{{{\left( {{N_i}} \right)}^p}} \mathord{\left/ {\vphantom {{{{\left( {{N_i}} \right)}^p}} {\sum\limits_{i = 1}^N {{{\left( {{N_i}} \right)}^p}} }}} \right. } {\sum\limits_{i = 1}^N {{{\left( {{N_i}} \right)}^p}} }} $ (6) $ {W_i} = \sum\limits_{i = 1}^N {{\lambda _i}*{W_0}} = \sum\limits_{i = 1}^N {{{{{\left( {{N_i}} \right)}^p}*{W_0}} \mathord{\left/ {\vphantom {{{{\left( {{N_i}} \right)}^p}*{W_0}} {\sum\limits_{i = 1}^N {{{\left( {{N_i}} \right)}^p}} }}} \right. } {\sum\limits_{i = 1}^N {{{\left( {{N_i}} \right)}^p}} }}} $ (7) In the formula, p is the power exponent of the density index, usually taken as 1 or 2, λi is the weight assigned to the i-th grid area, where W0 is the number of known grid areas and Wi is the predicted value for the i-th grid area.
Grid grouping search
-
Through multiple experiments with the global equidistant grid algorithm, it was found that when the input data is large, the algorithm takes a longer computation time and the results obtained from multiple operations had certain errors, making its search efficiency difficult to meet user needs. Assuming the size of the data is N, this algorithm adopts the traditional double traversal method for the search processing. It traverses the building vector file based on the grid to distinguish the spatial relationship between the grid and the building, and then assigns feature values. Therefore, its algorithm complexity is O (N2/2), and the operation time is relatively longer. In order to improve the running speed and searching speed of the algorithm, a grid grouping searching algorithm is proposed based on the idea of global equidistant grid algorithm and human-computer interaction performance.
Firstly, using the gridding idea of the equidistant grid algorithm to divide some grid areas with relatively large space, which are called the grid groups. Then, the spatial relationships of the building vector files are sequentially distinguished based on the grid group. Finally, shield the building data that is not related to the grid group, and only traverse the buildings within the grid group during the subsequent double grid partitioning. If the number of grids in a grid group is M, then the algorithm complexity within that grid group is O (M2/2), obviously M << N, O (M2/2) < O (N2/2). Therefore, the optimized algorithm significantly reduces its complexity, accelerating the algorithm's running speed and building searching speed. Taking the example of a grid group with 3 in the x direction and 3 in the y direction.
Density compensation optimization
-
The concept of density compensation is applied in many data gridding algorithms. Grid density compensation refers to setting different weight coefficients for different spatial units, such as grids and pixels, in order to improve the reliability and accuracy of spatial analysis. It sets better division standards for areas with lower density or uneven distribution to achieve more accurate gridding results. There are three common types of density compensation methods based on spatial distribution, attribute distribution, and spatiotemporal variation. Pipe et al.[15] propose a sampling data density compensation algorithm based on the numerical iteration method, which uses the interpolation to complete gridding and is applied to image processing. Zhou et al.[16] uses the grid area as a density compensation function for sampling data, but the running efficiency is low and the iterative convergence is difficult to control. For the selected Chinese Imperial Palace building vector map, the spatial distribution of buildings is uneven, with higher density in the northern half and sparsity in the southern half. This can also cause attribute data such as personnel density and the number of cultural relics to tilt towards the northern half of the buildings. Therefore, the proportion factor compensation method is chosen for density compensation.
The scale factor compensation is a common density compensation method, which has great advantages in solving the problem of imbalanced sample distribution in tasks such as classification, detection, and image processing. Then we adjust the number of grids based on the density differences of different types of grid groups, increasing the number of uneven sides, in order to achieve the goal of balancing the density distribution. Choose the reciprocal 1/d of the absolute difference in grid coordinate length and width as the density compensation factor for this algorithm, i.e.:
$ d = \left| {xLenth - yLenth} \right| $ (8) In the formula, xLenth and yLenth represent the coordinate length and coordinate width of the grid area, respectively. The algorithm flowchart is shown in Fig. 1. In the SetField () risk grid step, the weights are assigned based on the feature data indicators.
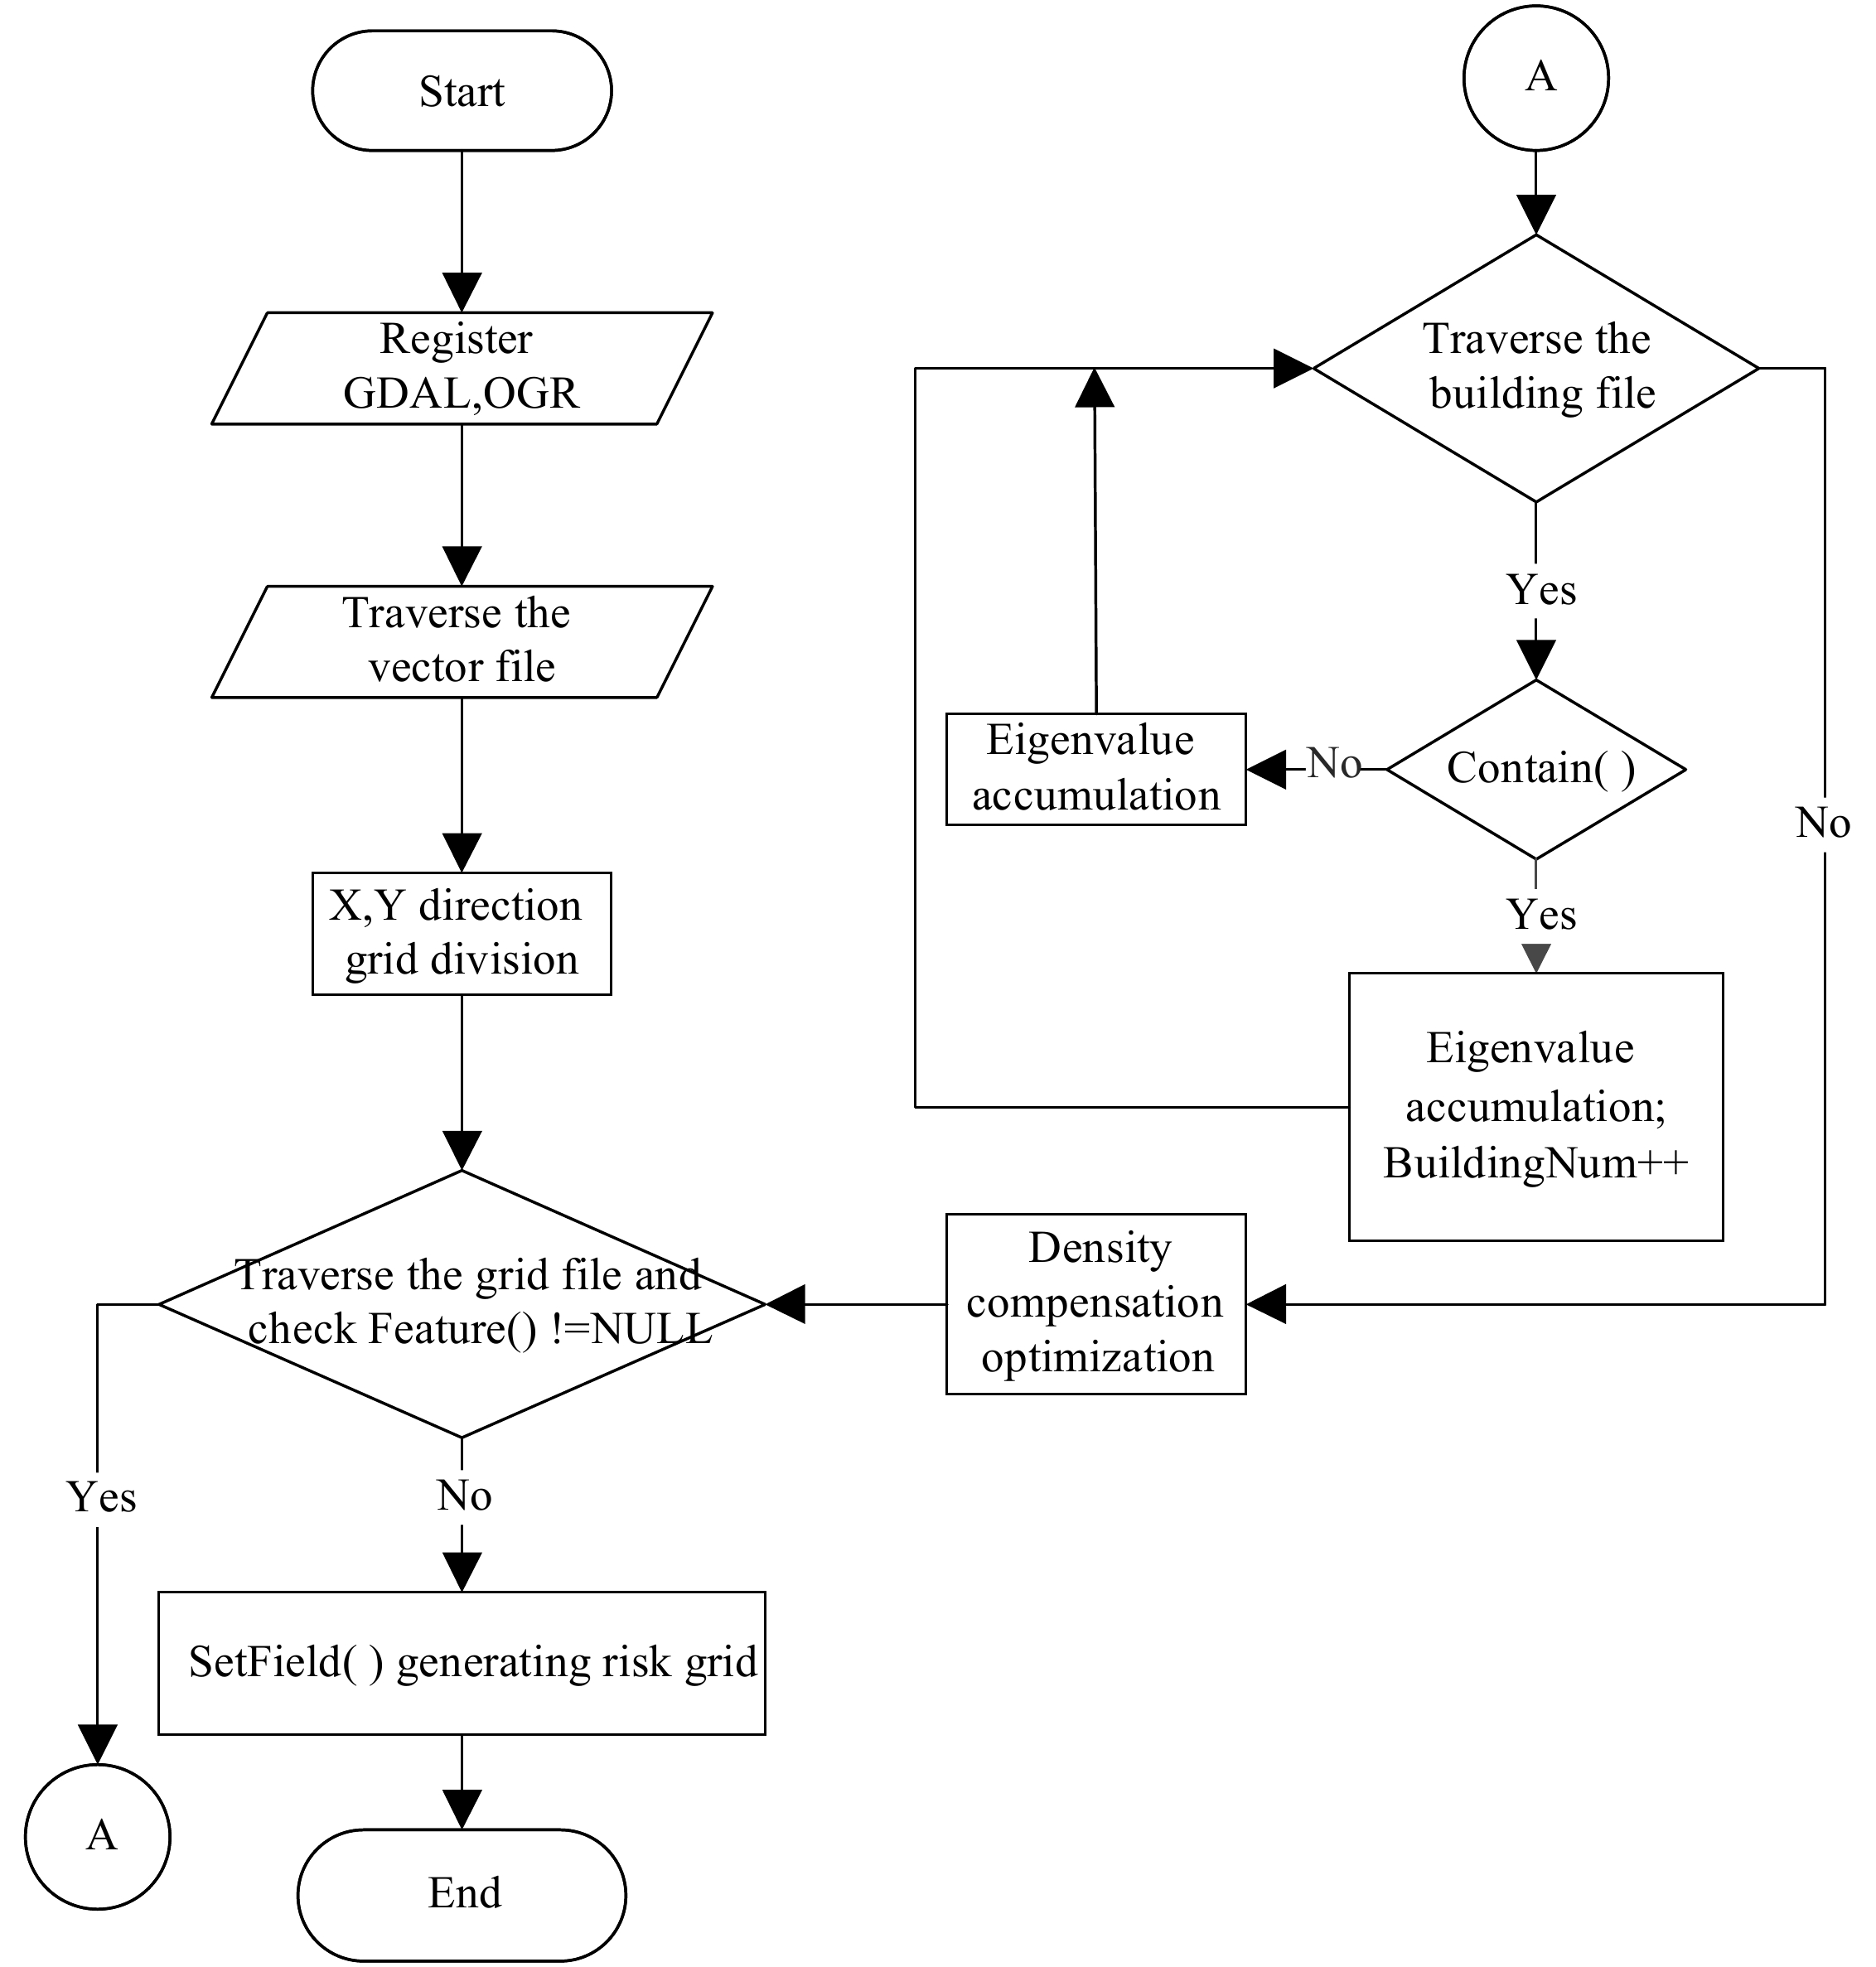
Figure 1.
Algorithm flowchart.
Grid output
-
The implementation code of our algorithm is based on Visual Studio 2022 combined with GDAL extensive library, GEOS extensive library, and PROJ extensive library, writing a DLL dynamic link library into MHMapGIS software. MHMapGIS is a map application based on Geographic Information Systems (GIS), providing the functions such as the map data visualization, the spatial analysis, the map editing, and the data querying. With the help of GIS technology, the professional analysis functions can be established to analyze and manage a large amount of data that runs through the entire process of disasters, including their origin, the development factors, and the impact scope. The advantage of GIS technology lies in its ability to complete complex tasks such as inputing, the management, the processing, the spatial analysis, and the modeling visualization from the different types of data[17,18].
In terms of software parameters, the driver program selects 'ESPI Shapefile', and the output file format of the driver program is shown in Table 1. The selection of the spatial reference coordinate system is WGS84. WGS84 (World Geodetic System 1984) is a commonly used geographic coordinate system based on the Earth's ellipsoid, which represents a geographic location through longitude and latitude, and is currently a popular choice and a benchmark for global positioning systems. Considering the human-machine interaction, an interface window were added for dynamic data input, and the required formal parameters were also joined to the declaration function of extern 'C' _declspec (dllexport) to complete this setting.
Table 1. Output file format.
File format File attribute information .shp Store geometric shape data of geographic features such as points, lines, and surfaces, including coordinates, shape types, etc. .shx Spatial index files, accelerating search and access to geographic features from. shp files .dbf Store attribute data of geographic features in table form, including field names, field types, etc. .prj Store projection information of geographic data and describe a reference system for geographic coordinates. According to the algorithm flowchart, the fields are divided into grids, as shown in Fig. 2a−d. As shown in Fig. 2, the results of adding equidistant grid divisions are compared and analyzed. It can be clearly seen from the figure that the grid is relatively dense in the northern half of the area with higher building density at the junction of the gate and other entrances, and regulatory authorities should pay the special attention ahout the risk changes in these areas. When carrying out fire prevention renovation on the wooden ancient buildings in the Imperial Palace, the Protection First Principle should be respected, and the renovation process cannot damage the ancient buildings, nor affect the original form, pattern, and style of the ancient buildings in the Imperial Palace. For key protected and high-risk areas, two or more fire detectors should be simultaneously used to quickly and accurately detect fire information. When the wired connection between the detector and the controller is difficult, the wireless communication methods such as WiFi technology, ZigBee technology, etc. should be used for information communication.
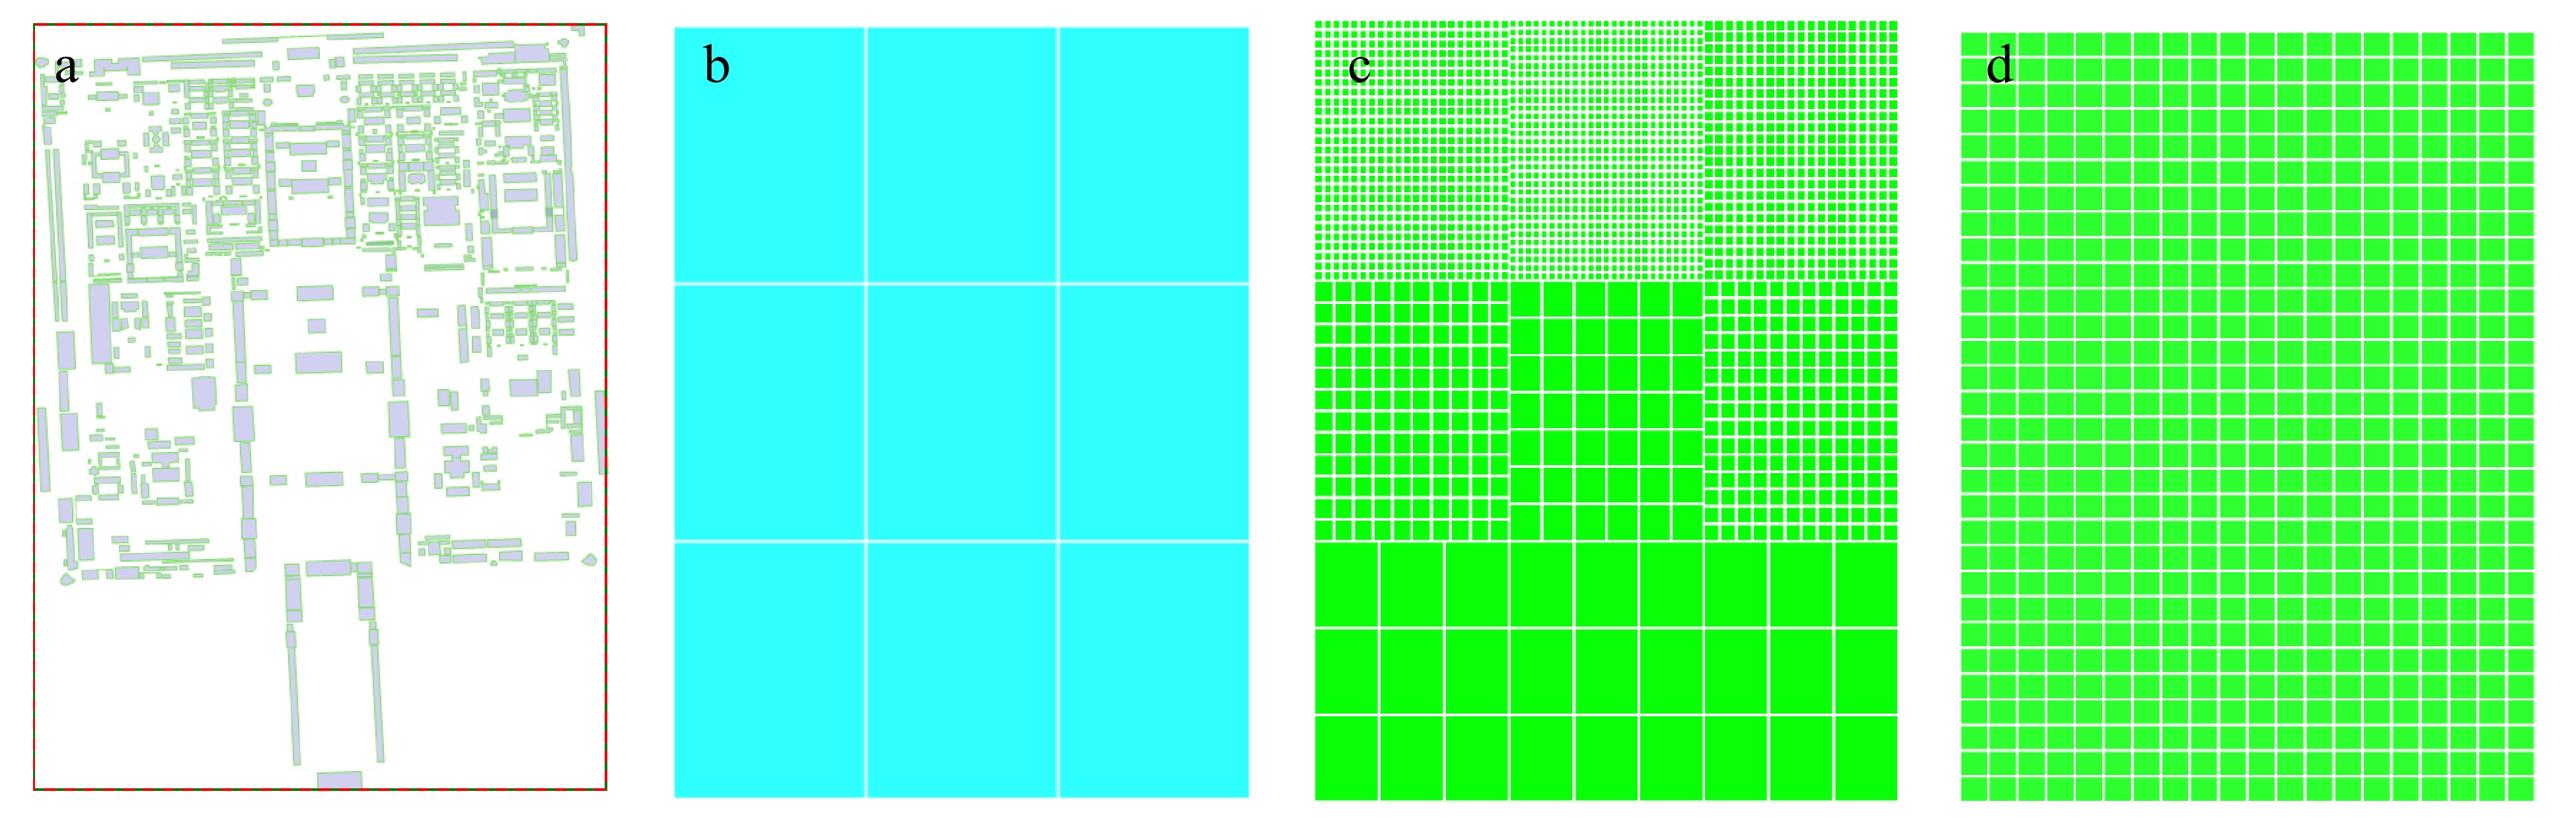
Figure 2.
Algorithm result graph. (a) the Imperial Palace City map, (b) 3 × 3 grouping search, (c) optimized inverse grid division, (d) equidistant grid division.
By comparing Fig. 2c & d, when the uneven distribution of buildings is higher, the effect of the optimized algorithm for grid division is more obvious and more accepted. Since fully considering the non-uniformity of the region, the risk level and the details of the northern part of the building group are better than the global algorithm and then the computational performance and search speed are superior to the global algorithm, which provides convenient architecture for the subsequent smoke risk identification. To determine the risk level, the corresponding colors are rendered in each grid area, the smoke detection results will also be used as the algorithm output in order to make timely corresponding warning measures whether there is a fire or not.
-
The fire development stage is divided into three stages: no fire, smoldering fire, and open flame. Fire warning not only requires the evaluation of fire risk factors, but it is best to receive timely warning in the smoke stage before smoldering fire and open flame. With the continuous advancement of visual image resolution technology, high-definition cameras have rapidly become popular, and the improvement in resolution makes it possible for security technology to provide early warning before the formation of an open flame. Therefore, we studied the identification and application of abnormal smoke behavior in monitoring images in fire risk factors. The latest AI intelligent monitoring technology enables us to analyze surveillance videos in real-time, once abnormal behavior is detected, even in situations with large amounts of data, combining deep learning could provide more efficient and accurate security solutions of the Imperial Palace and Large Ming and Qing ancient architectural complexes. Generally speaking, the various advanced algorithms based on YOLOv5, YOLOv8 and other network structures are used to compare datasets stored in databases, and combined with external hardware facilities, warning signals could be issued.
Cai et al.[19] improved the network structure of YOLOv5s by using the Ghost Convolution module in the convolutional module and adding the Vision Transformer structure in the backbone network. The experimental results showed that this improvement measure reduced the model parameters by 17%, and also improved the accuracy and detection speed. Wang et al.[20] improved the Neck structure in the YOLOv structure for small object detection in complex environments, replacing three-scale detection with four-scale detection, and combined it with a weighted bidirectional feature pyramid network structure to optimize hyperparameters through genetic algorithm, the experimental results showed that the average detection speed of the improved algorithm was improved, and the number of false detections and missed detections was reduced. Ma et al.[21] introduced the CBAM module to replace the Focus module in YOLOv5s architecture, and replaced the GIoU loss function with CIoU. The experiment showed that the improved algorithm increased detection speed and accuracy, and can be applied in the road surface and tunnel environments.
YOLOv5 network architecture
-
YOLOv5 is one of the currently popular and widely used object detection networks, characterized by the high detection accuracy and the fast computational speed. It had achieved good results in industries, construction, transportation, and other fields. There are four versions of object detection algorithms based on YOLOv5: YOLOv5s, YOLOv5m, YOLOv5l, and YOLOv5x, among which YOLOv5s has the smallest weight[22]. Taking into account the model file size, computational speed, and accuracy, YOLOv5s, which has the fastest detection speed and higher accuracy, was selected for our subsequent research tool. The YOLOv5s network structure is shown in Fig. 3, which includes four parts: input, backbone, feature detection module, and output/prediction.
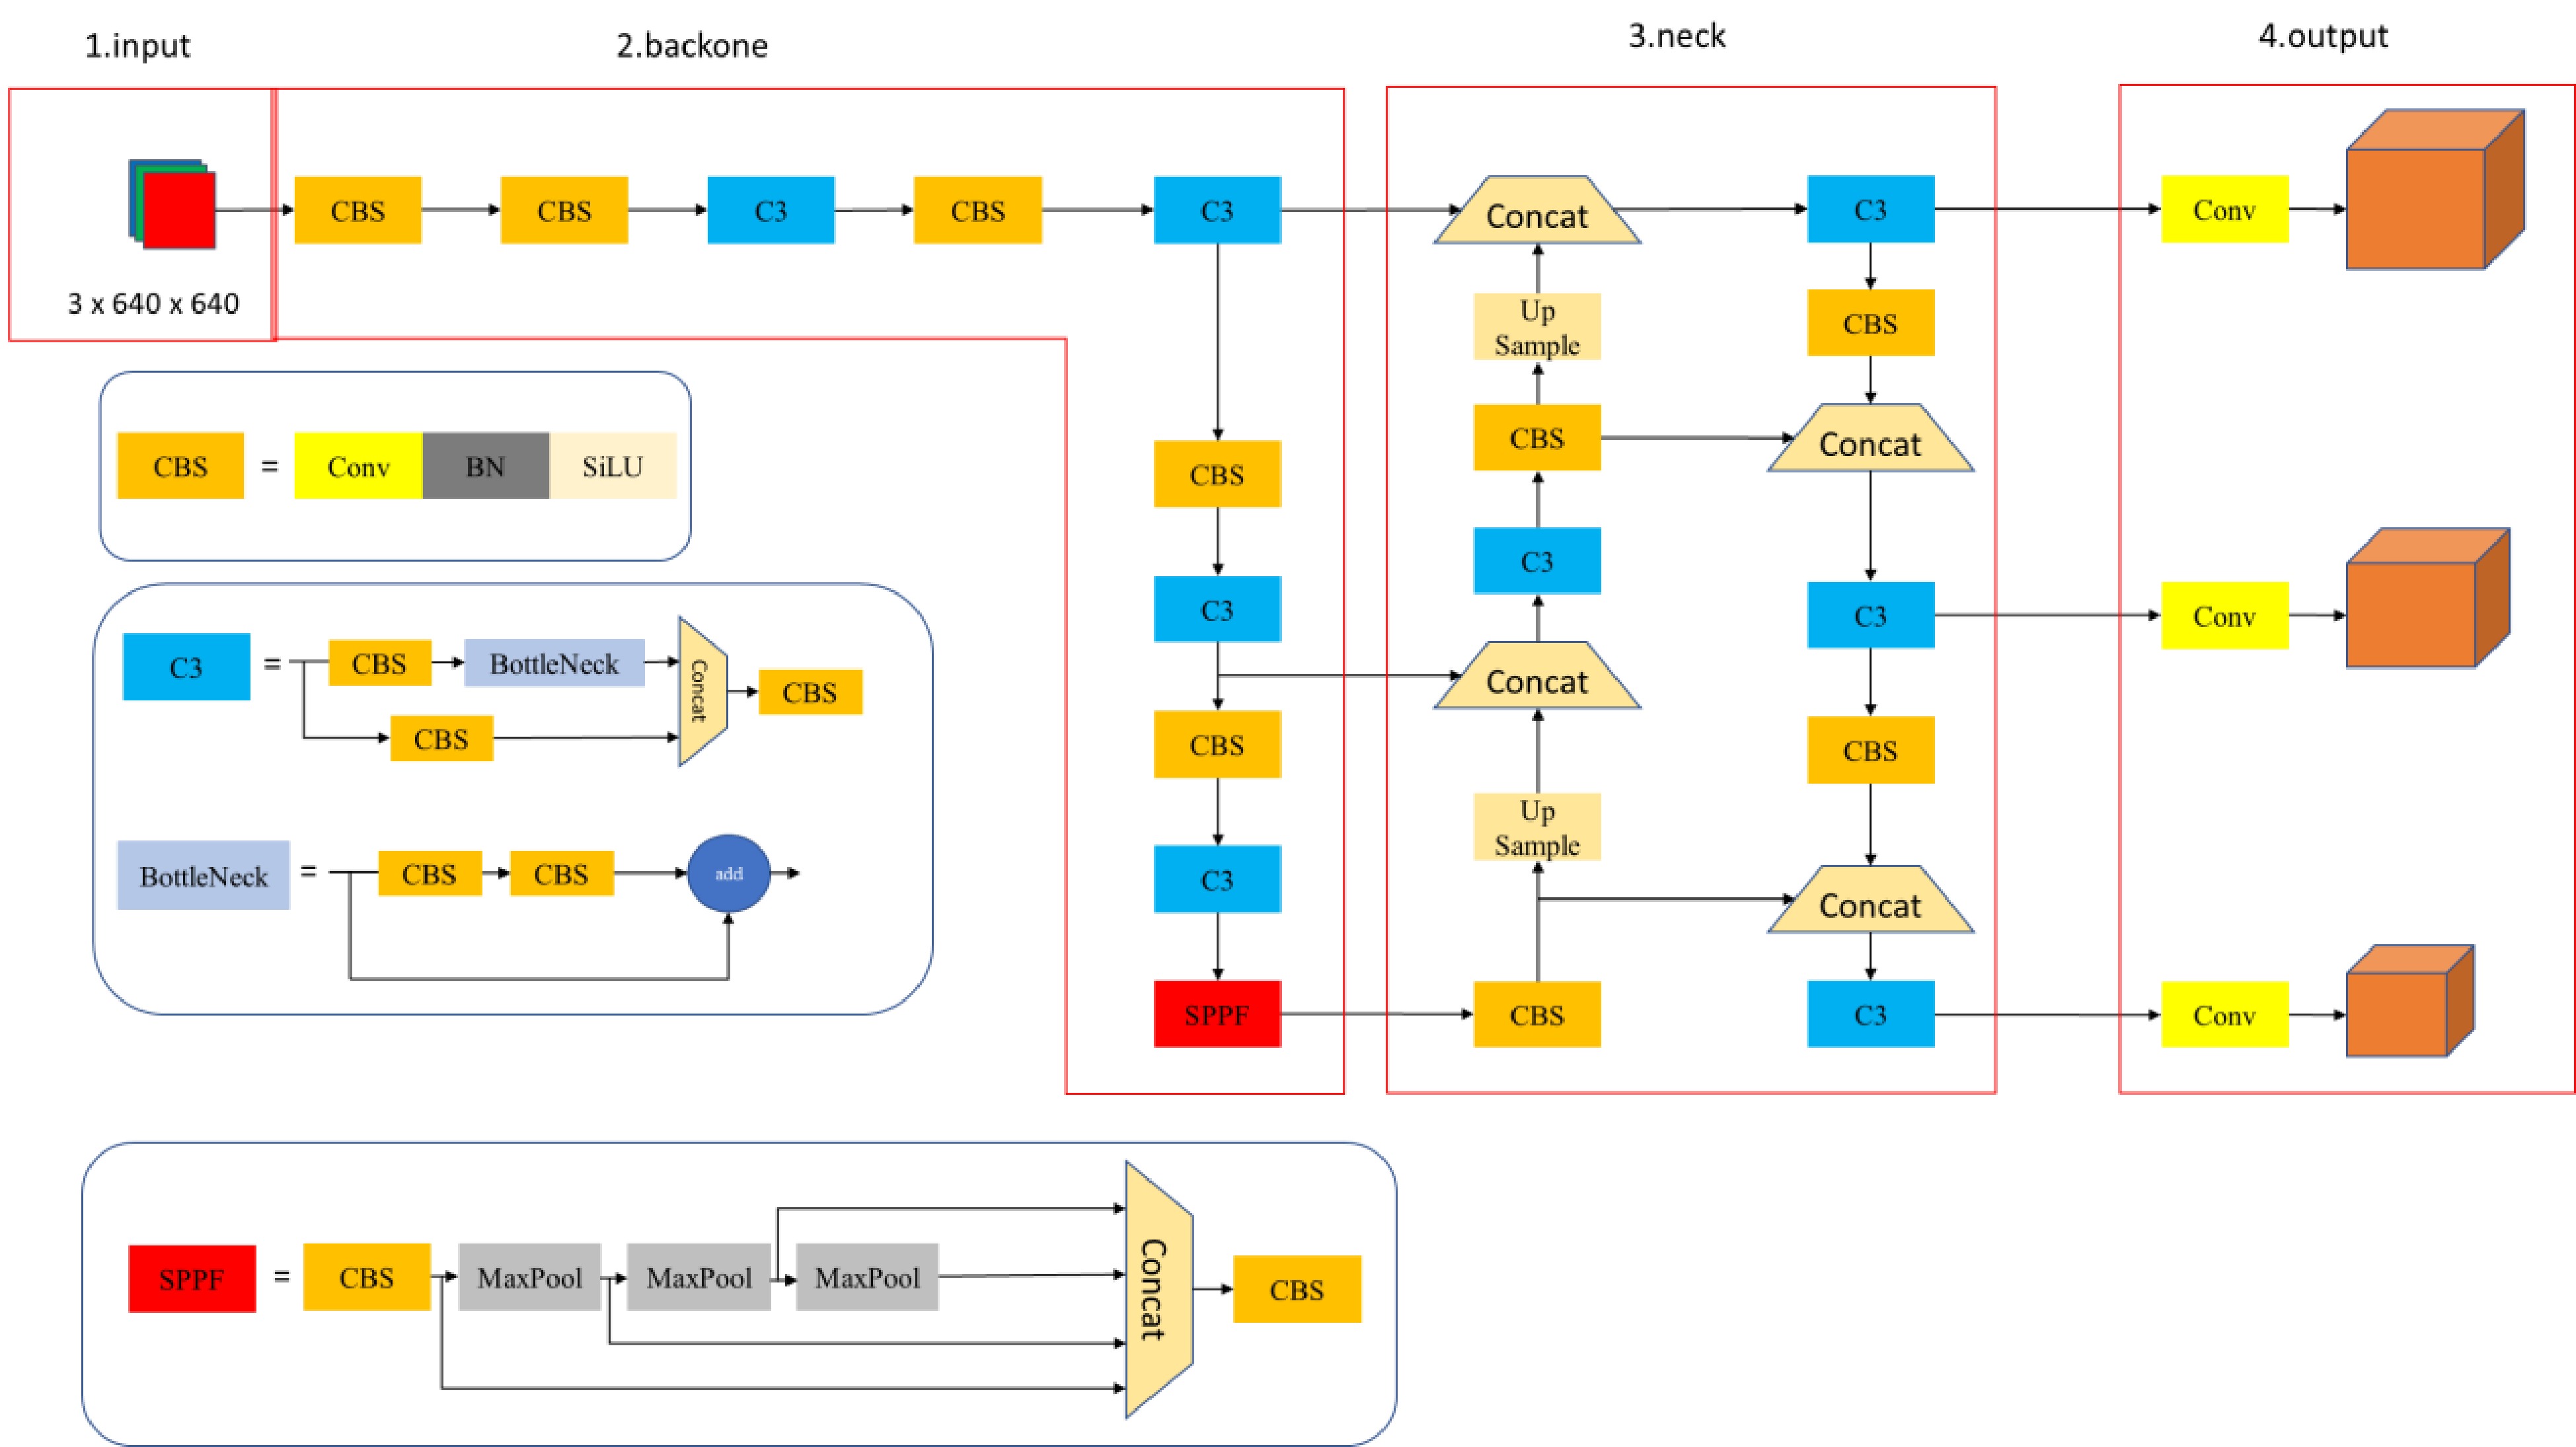
Figure 3.
YOLOv5s network architecture diagram.
Datasets and evaluation indicators
-
The model was trained in a hardware environment with an Intel Core I5-10200H processor, with 16 GB of memory, NVIDIA GeForce RTX3060, and 6 GB of independent graphics memory. Using the programming language Python 3.8 and the Python deep learning framework, YOLOv5s smoke detection model was trained. The construction of the training sample dataset for smoke detection involves searching publicly available fire images or videos online and using auxiliary annotation tools to preliminarily annotate the dataset. This dataset includes 14,554 images, including various smoke scenes in the background of ancient buildings. Among them, there are 11,352 images of effective fire smoke that may cause fires, and 3,202 images of ineffective smoke from chimneys such as steam engines and boilers. The proportion of effective smoke in the total dataset is 78%.
In terms of training parameter settings, the training round is set to 100 epochs, and the original dataset is divided into a training set and a validation set in a 9:1 ratio, all data are averaged after three experiments to ensure the reliability of the training results.
In order to evaluate the comprehensive performance of YOLOv5s based object detection algorithm, this experiment uses precision (P), recall (R), and mean average precision (mAP) as evaluation indicators. The calculation formula is as follows:
$ P = \dfrac{{T P}}{{T P + F P}} $ (9) $ R = \dfrac{{T P}}{{T P + F N}} $ (10) $ AP = \int_0^1 {PdR} $ (11) $ mAP = \dfrac{1}{n}\sum\limits_{i = 1}^n {A{P_i}} $ (12) In the formula, TP (true positions) is the number of correctly predicted positive class samples, FP (false positions) is the number of incorrectly predicted positive class samples, FN (false negatives) is the number of incorrectly predicted negative class samples, and n is the number of classes in the dataset.
Experimental results and analysis
-
The results of an object detection algorithm in YOLOv5 architecture was analyzed using a dataset. Figures 4−6 show the indicator and detection results of the smoke detection model based on YOLOv5s during the training process. Under the given training and validation sets, the target localization loss (box loss) and target confidence loss (obj loss) ultimately converge to a small value, achieving the expected training objectives. For the differentiation, 'train' is added on the various losses in the training set, and 'val' is added on the various losses in the validation set in Fig. 4. The final accuracy and mAP both reached 0.99, indicating that the smoke detection model based on YOLOv5s has good performance in most small-scale target fire detection tasks.
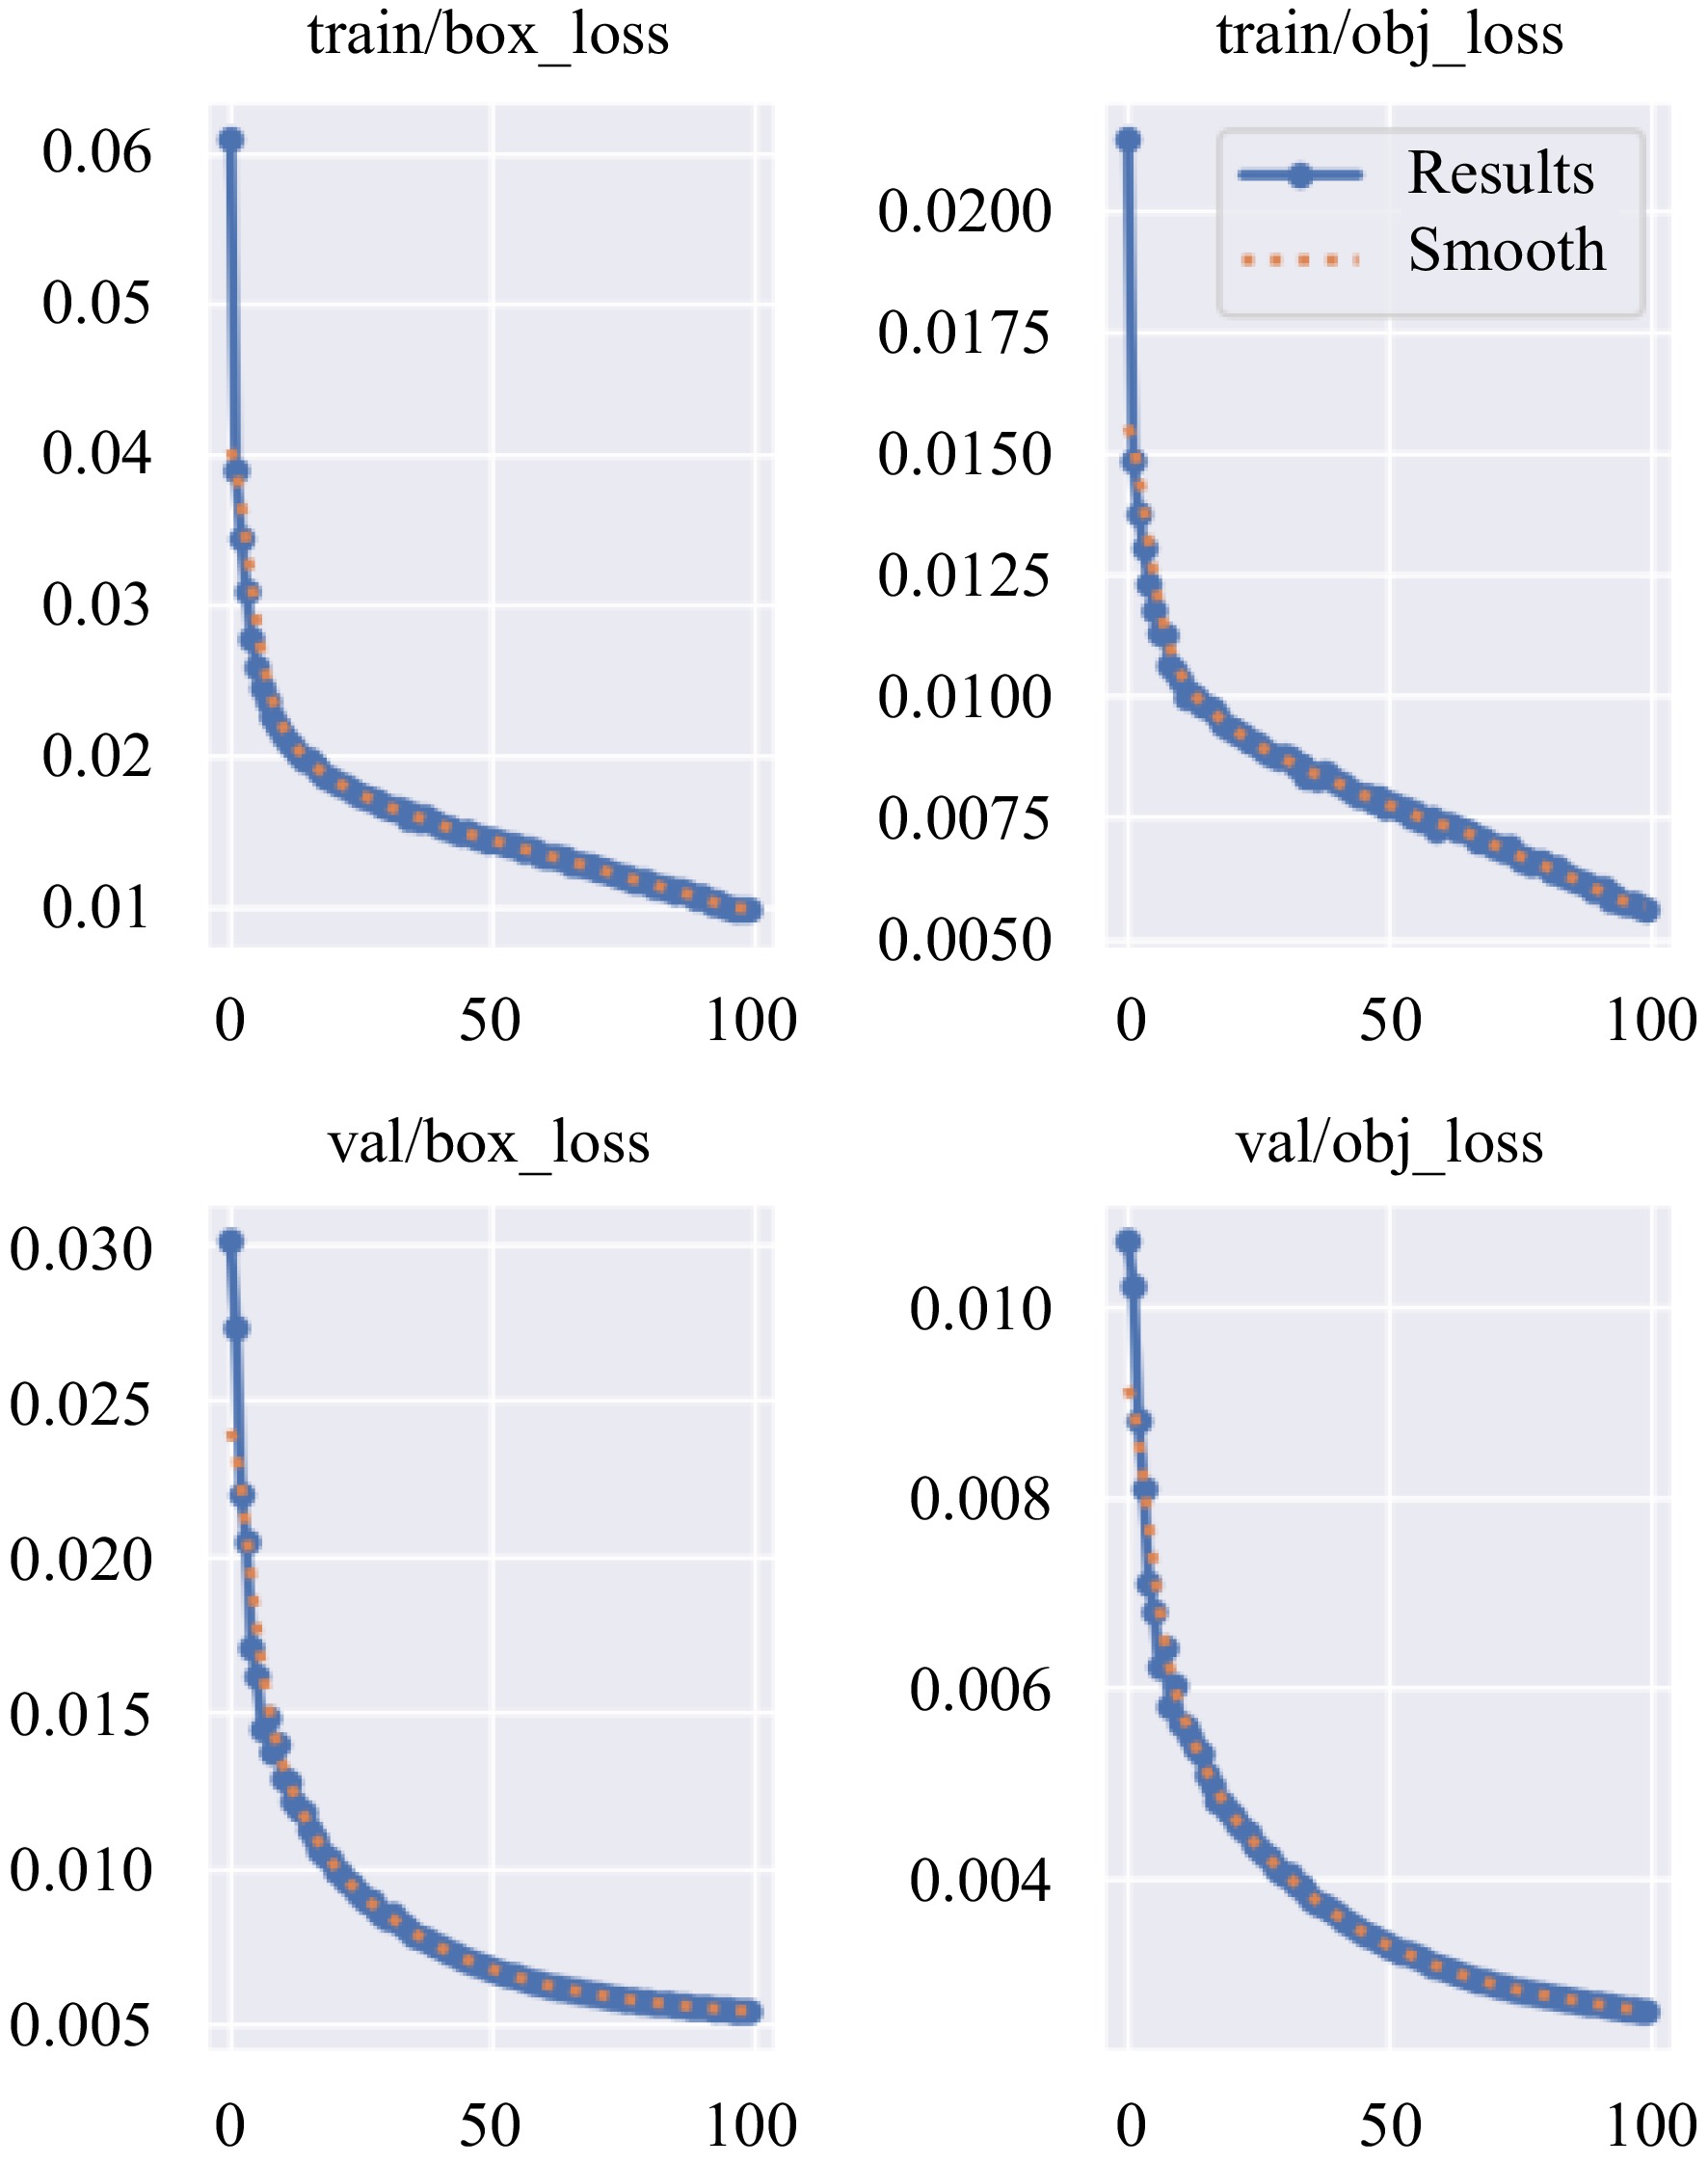
Figure 4.
Loss-epoch.
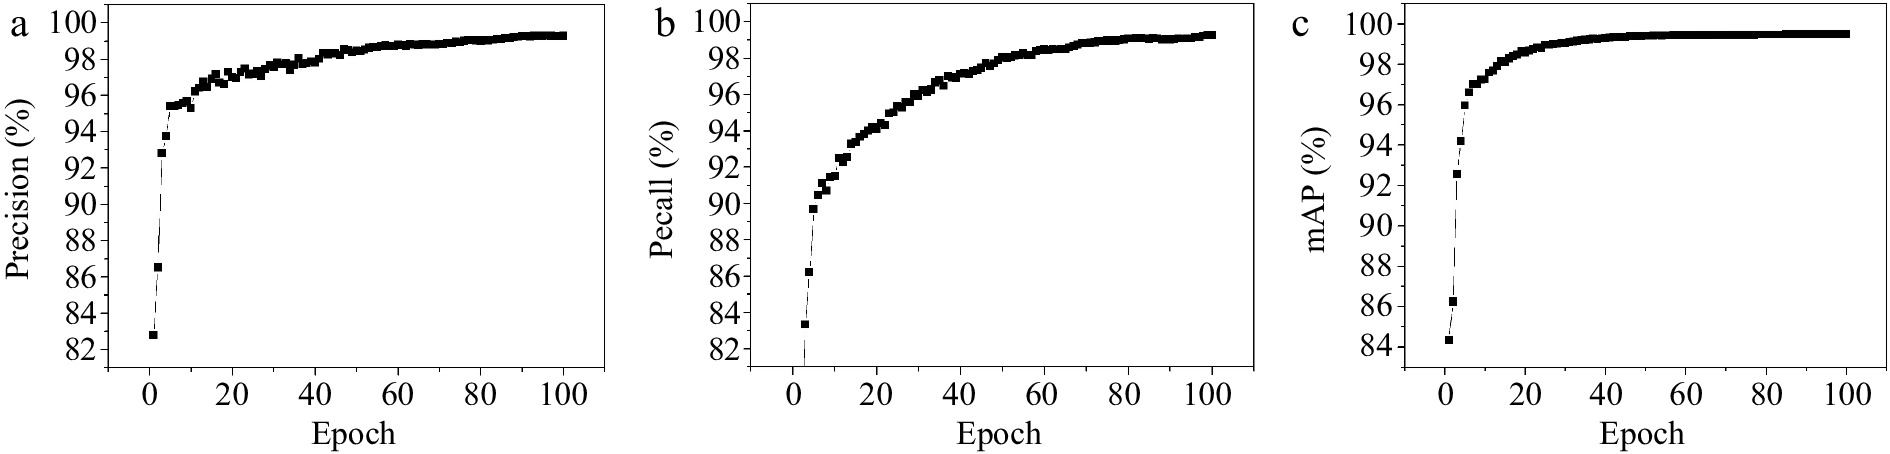
Figure 5.
(a) Precision, (b) recall, (c) mAP result.
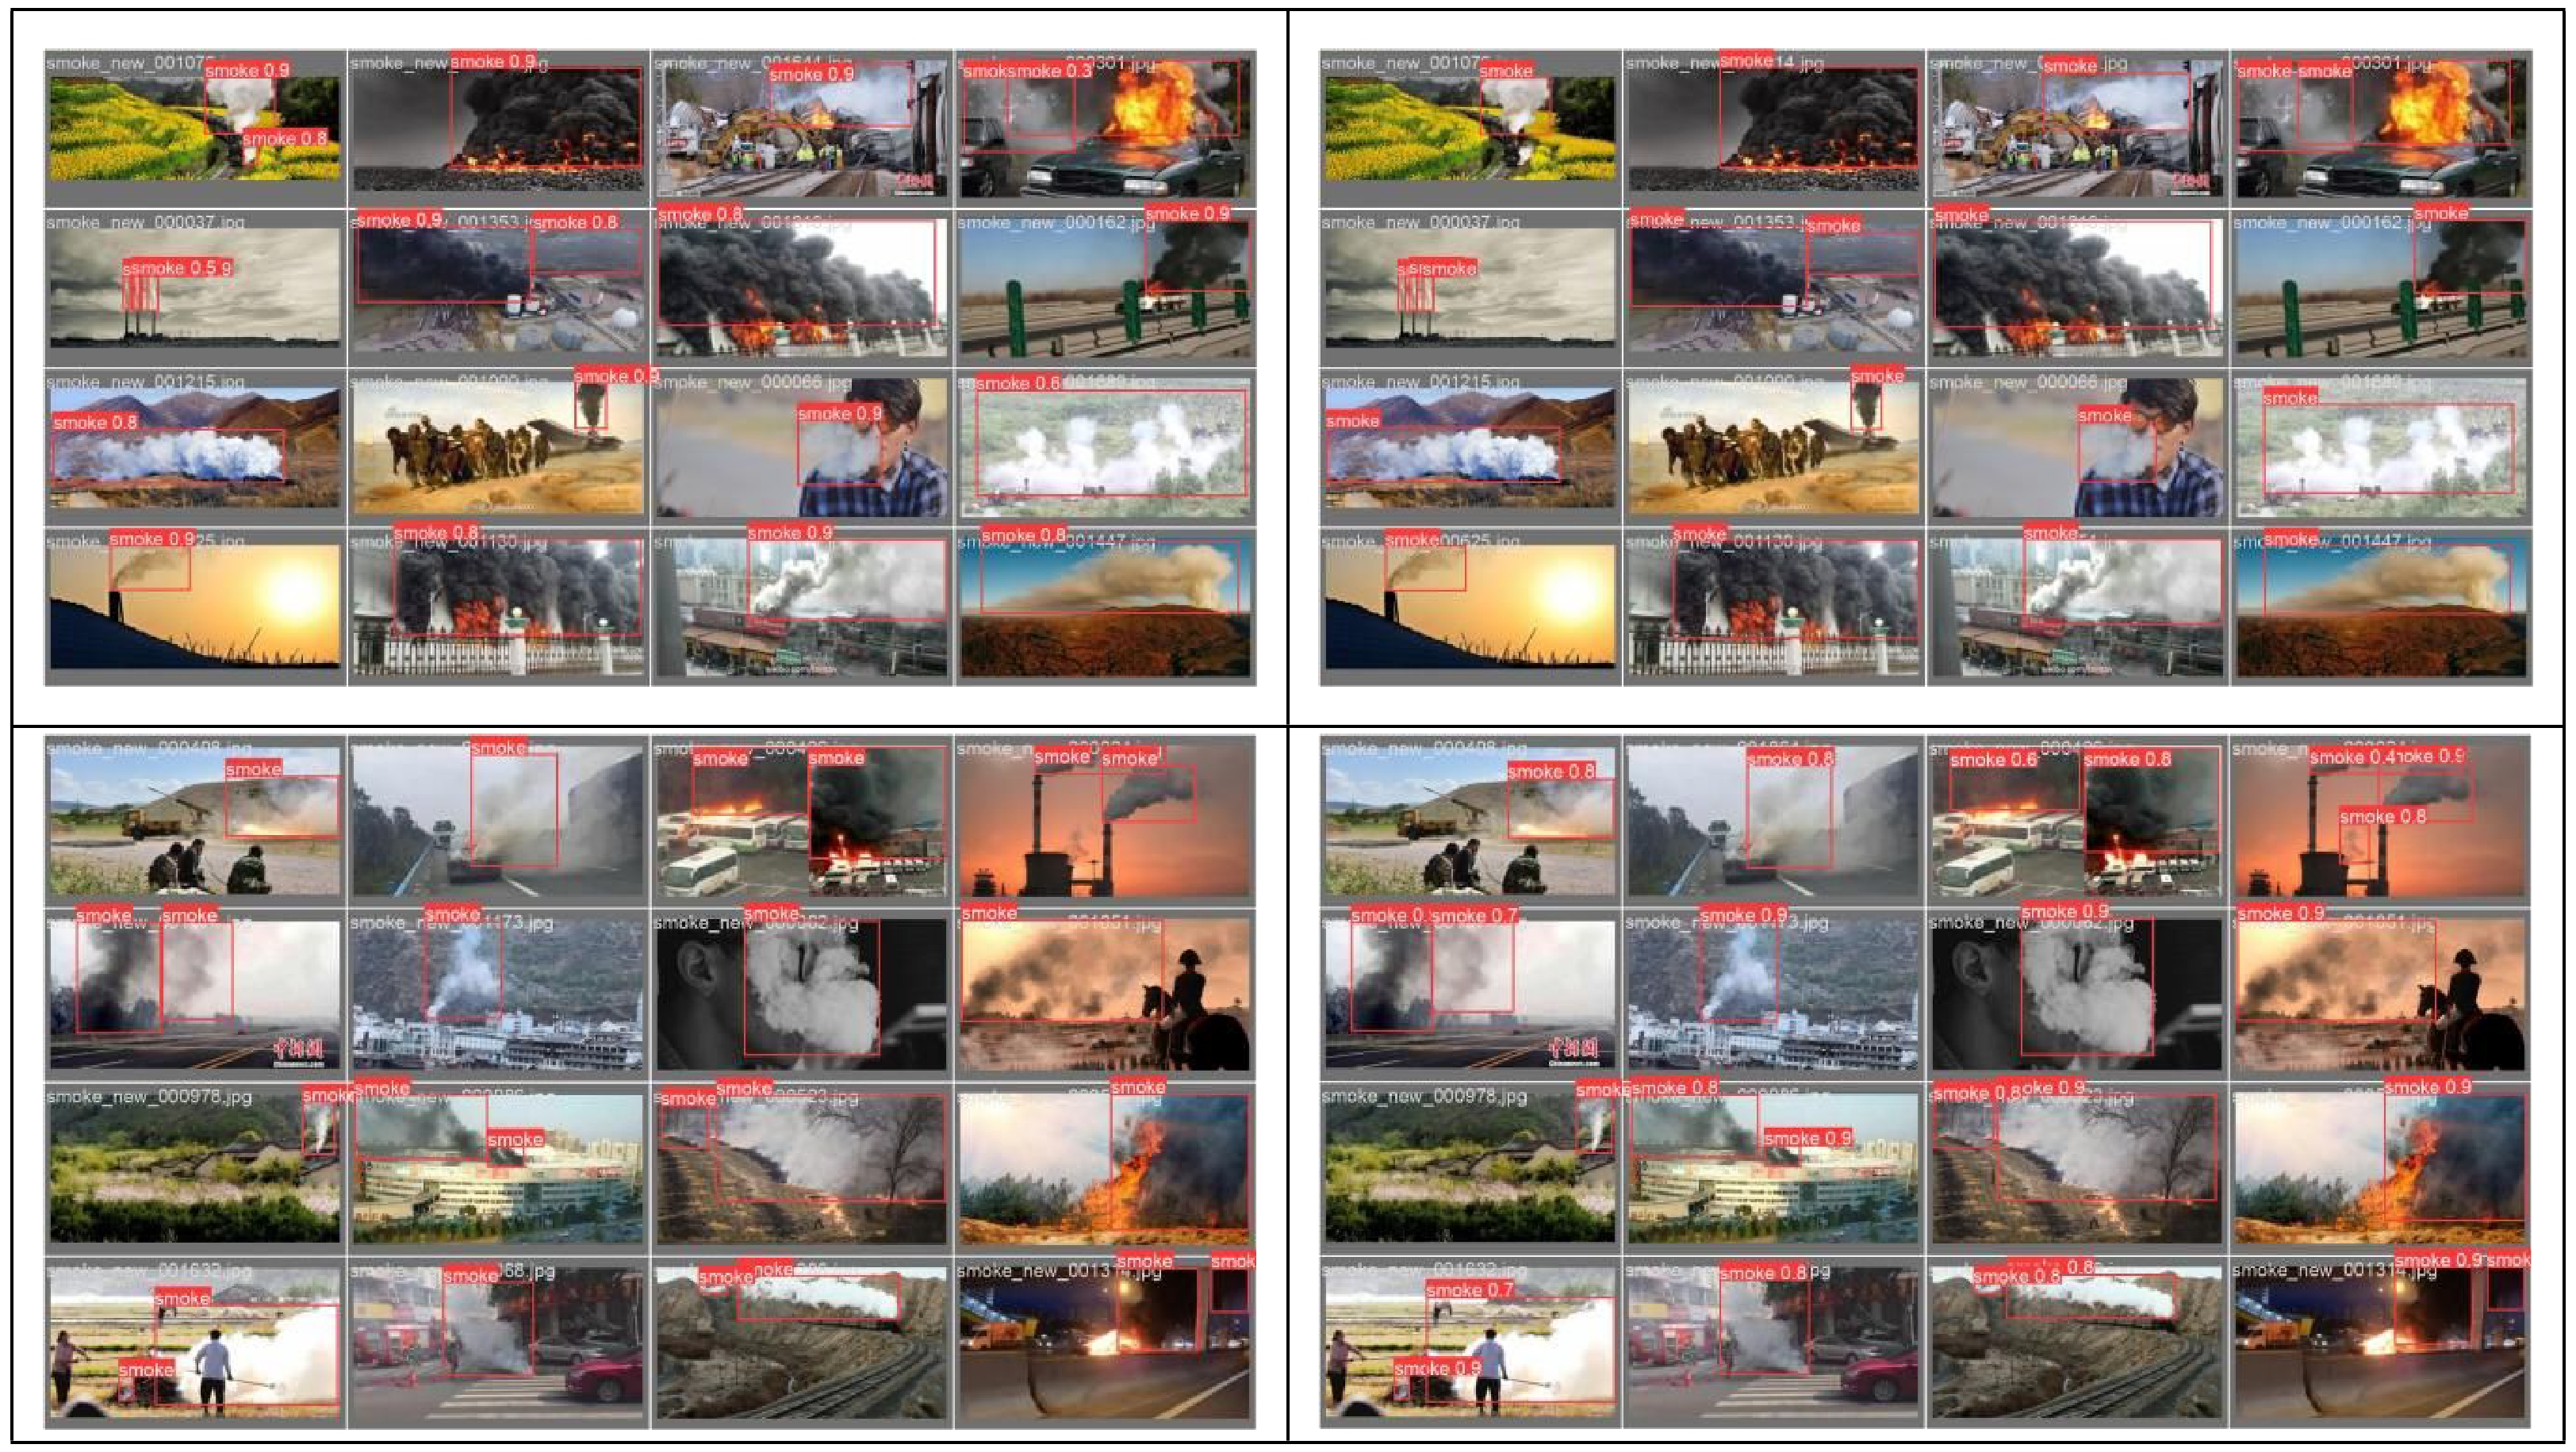
Figure 6.
YOLOv5s detection results.
The data of Figs 4−6 show that the proposed smoke detection model can achieve higher accuracy and average precision (mAP) values in fire detection tasks, reaching a level of 0.99, on 100 training sessions. However, considering the limited amount of training dataset, these experimental results still have a certain improved rate. To further improve model performance and reduce error rates, more training data and more complex and comprehensive network structures need further exploration in the future. The overall observation shows that due to the large-scale background detection faced by this task, there are small-scale samples in the dataset, and there may be interconnections between fires and ancient buildings. Therefore, the proposed smoke detection model still has certain reference value to the gridding algorithm on Imperial Palace.
-
The design of overall practice is based on the combination of the inverse proportional gridding algorithm and smoke detection, aiming to monitor overall changes through macroscopic gridding and display risk grid areas. At the same time, micro level smoke sensor detection technology is used to detect the smoke and then the fire situation in various areas, to analyze possible fire risks, and in a timely manner transmit the situation to the overall grid by the prominent color render, the grid area status is dynamically updated based on the idea of circular queues. The wireless communication methods adopted for information exchange and positioning, include technologies such as WiFi, Bluetooth, ZigBee, etc. Figure 7 is the flowchart of this algorithm.
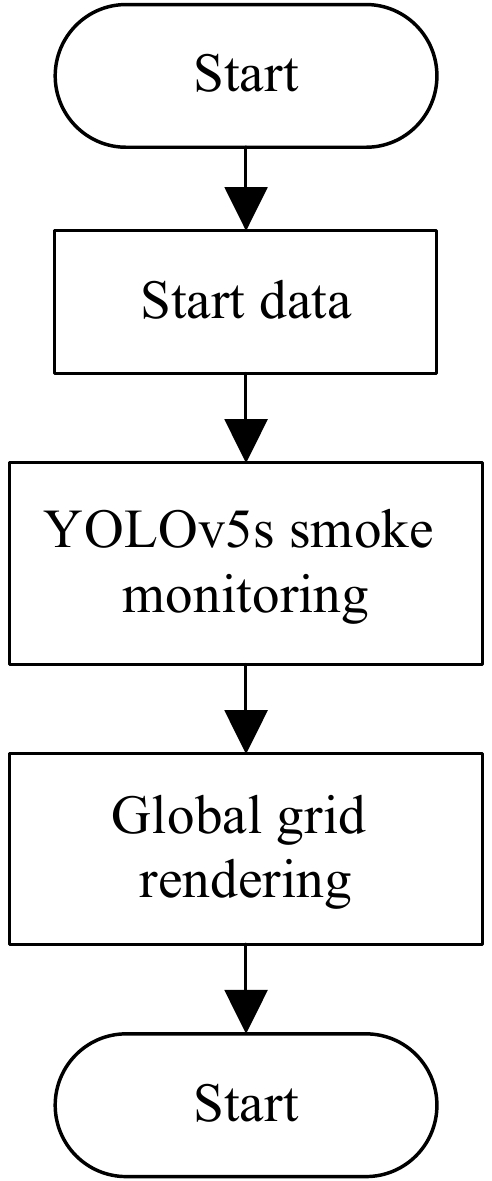
Figure 7.
Algorithm chart.
In the specific implementation process, the inverse grid algorithm is used to divide the observation area into grids, and the data was collected and analyzed in each grid, and then the areas where fires may occur displayed using processing and analyzing data. Smoke detection technology is real-time monitoring of various areas to determine whether abnormal smoke was caused by a fire. Using wireless communication technology, the identified abnormal smoke area information is transmitted to the overall grid and rendered in color, so that relevant personnel can quickly take corresponding measures.
In order to verify the effectiveness of our algorithm, ZigBee technology, which has low power consumption, fast efficiency, and can adapt to harsh environments, was selected as the wireless communication technology during the implementation process. For the selection of controllers, we used TI's CC2530 chip, this chip has the characteristics of strong functionality and high cost-effectiveness, it inherits industry standard enhanced 8051 core, RF core, 5-channel DMA, 7-12 bit ADC, and watchdog timer internally, in addition, the chip also has programmable FLASH memory, which only requires some peripheral circuits to build a functionally rich ZigBee node. In the remote communication section, a GPRS module was chosen for remote wireless communication, this module is capable of transmitting data and location information to the monitoring server and converting them into the overall grid. The monitoring server monitors and manages the data of sensor nodes, and the color of the grid area returns to normal from red or continues to remain red (red represents a fault, green after normal recovery).
In the implementation and verification process, according to the algorithm flow, we conducted real-time smoke detection and recognition through cameras in various regions, analyzed abnormal smoke situations, and the results are shown in Fig. 8a & b. When the smoke may be abnormal smoke caused by fire hazards, the risk color of the corresponding area will also change to red. Once the smoke is controlled in a timely manner, the risks in the relevant areas will be eliminated, and the grid area will gradually return to a safe green color. If not, the overall high-risk color will continue to be maintained. For the smoke detection part, if abnormal smoke caused by an identified fire, the grid position and fire data of the area are transmitted to the overall grid through the GPRS module, and the color of the area is changed to red. If it is not abnormal smoke, it will gradually return to a safe green color. The state of the grid area is dynamically updated using the idea of cyclic queues. Through this verification of our practice and implementation, we can monitor the smoke situation in the Imperial Palace, China, in real time, give timely warnings, and take necessary measures to prevent and then deal with fire risks.
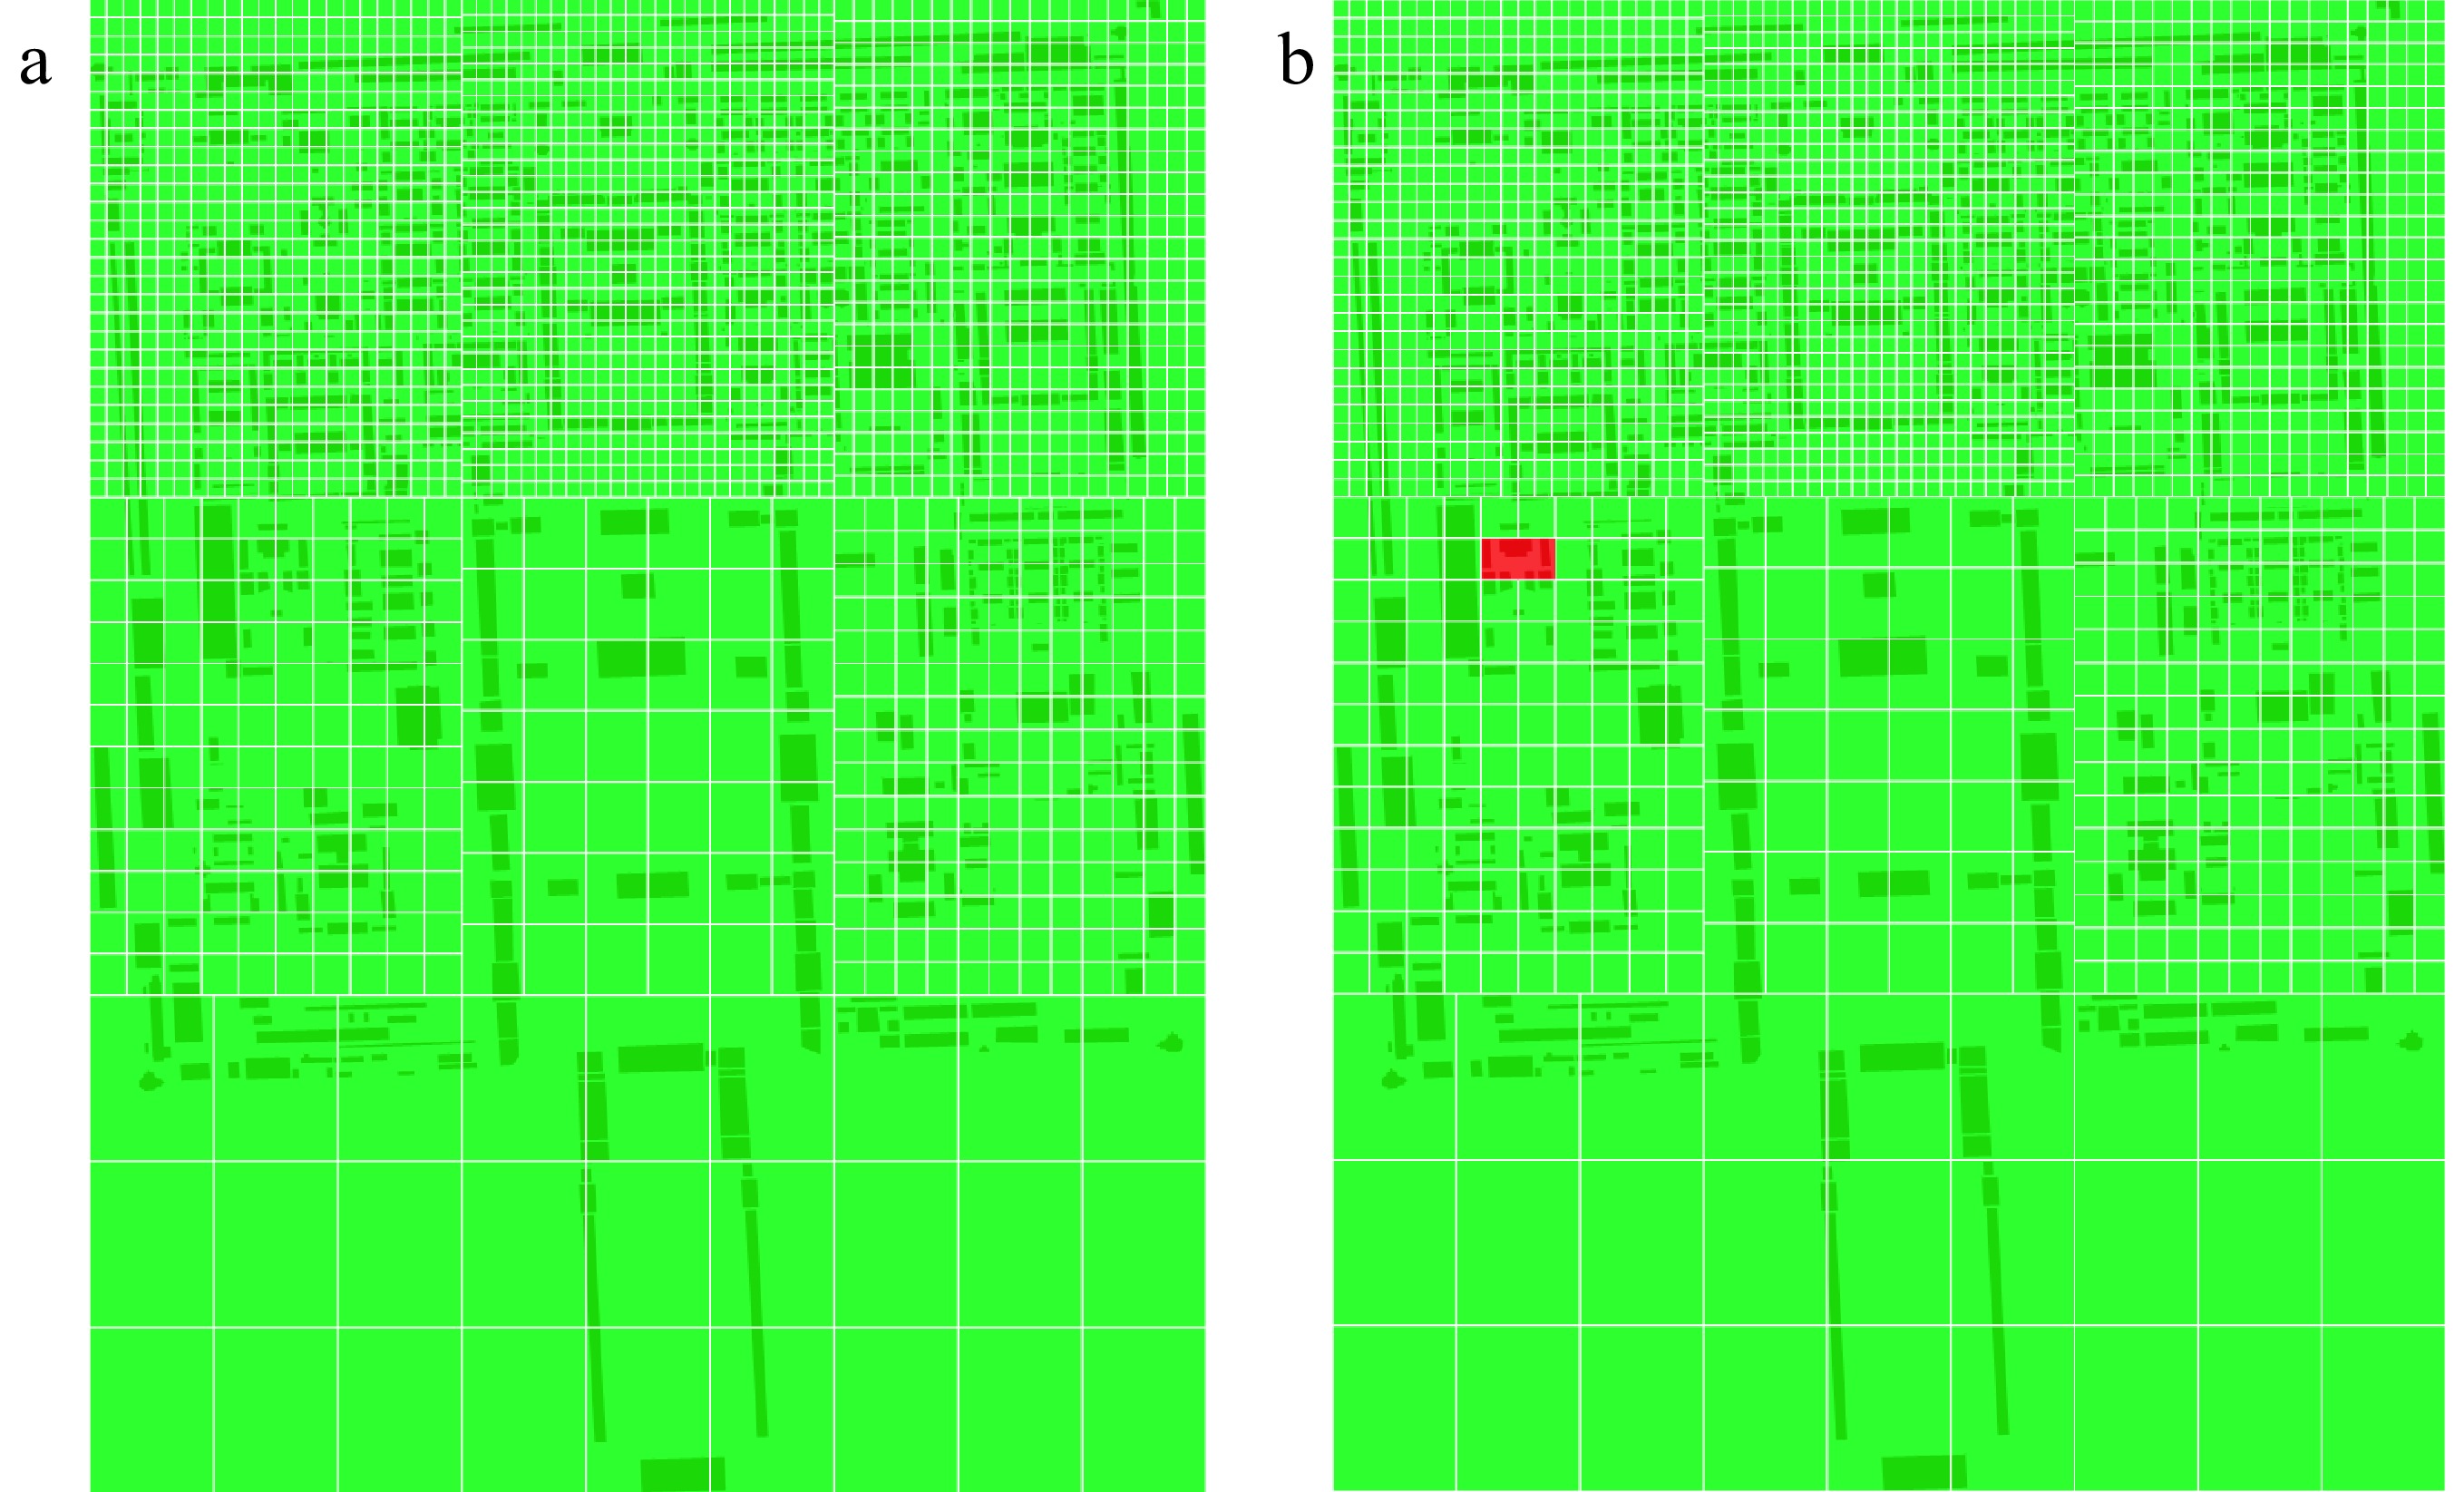
Figure 8.
Algorithm result graph.
-
The fire warning algorithm designed in this article, which integrates the inverse proportional grid algorithm and smoke detection technology on YOLOv5 architecture to solve the problems of fire risk assessment and real-time monitoring. Using specific grid partitioning to represent risk areas and real-time detection of smoke distribution, the algorithm can promptly determine whether the smoke is abnormal smoke caused by a fire and provide feedback to the security center, after the hidden danger is controlled, the corresponding grid area status will turn green. If its symptom cannot be eliminated, it will continue to remain red, and the area status will be dynamically updated using the circular queue idea. For the areas of concentrated human flow, the detectors can be added, the relevant staff can be arranged for diverting and evacuating the masses. This algorithm improves the efficiency of fire prediction and processing, ensures the safety of cultural relics and personnel, and is suitable for the protection of ancient square buildings such as the Imperial Palace, China.
The research is funded by the National Key Research and Development Program of China (No. 2021YFC1523500).
-
The authors confirm contribution to the paper as follows: study conception and design, draft manuscript preparation: Wang Z; analysis and interpretation of results: Peng J, Wang Z; Imperial Palace graph preparation: Wang B; data collection, algorithm design (software): Liu X; study supervision: Di C. All authors reviewed the results and approved the final version of the manuscript.
-
All data generated or analyzed during this study are included in this published article.
-
The authors declare that they have no conflict of interest.
- Copyright: © 2024 by the author(s). Published by Maximum Academic Press on behalf of Nanjing Tech University. This article is an open access article distributed under Creative Commons Attribution License (CC BY 4.0), visit https://creativecommons.org/licenses/by/4.0/.
-
About this article
Cite this article
Wang Z, Peng J, Liu X, Di C, Wang B. 2024. Research on grid based fire warning algorithm with YOLOv5s for palace buildings. Emergency Management Science and Technology 4: e008 doi: 10.48130/emst-0024-0007 

Research on grid based fire warning algorithm with YOLOv5s for palace buildings
- Received: 05 March 2024
- Revised: 17 March 2024
- Accepted: 19 March 2024
- Published online: 07 May 2024
Abstract: In response to the early warning requirements of fire security technology in the Imperial Palace & large Ming and Qing ancient architectural complexes in China, a grid based fire warning algorithm is proposed by combining neural network YOLOv5s smoke detection technology. In this algorithm, the inverse proportional gridding algorithm based on building density is used to optimize the grid of buildings, and compared with the results of the equidistant grid algorithm, the risk distribution division is more detailed and reasonable. The smoke detection part uses YOLOv5s based smoke detection technology to detect the distribution of fire smoke in various areas, and the positioning of this area in the overall grid realized by the remote transmission module. With detection experiments on relevant datasets, the results show that its accuracy and mAP both reach 0.99. By utilizing the collaborative effect of inverse proportional gridding algorithm and smoke detection technology, a grid based visualization of smoke warning is achieved.
-
Key words:
- Fire warning /
- Grid based algorithm /
- Smoke detection /
- YOLOv5s