


-
Currently, some gas pipelines have been laid prematurely, lacking technological maturity. As numerous pipelines enter the aging stage, ensuring their prolonged safe operation becomes challenging. Analyzing and controlling gas pipeline leakage accidents is crucial to mitigating risks and reducing the likelihood of incidents.
Through an analysis of accident cases, it has been established that urban gas pipeline leakage incidents are rarely caused by a single risk factor; rather, they result from the combined influence of multiple risk factors, a phenomenon known as multi-factor mutual coupling. Currently, numerous scholars both domestically and internationally have conducted research on accident causation from the perspective of risk coupling. The concept of 'coupling' originated in physics, and Professor White from Cornell University in the United States first introduced the concept of 'risk coupling' in the 20th century. He posited that there are extensive interactions among factors within risk systems and applied the concept of 'coupling' from the 'human-machine-environment' system to industrial accident risk management. Subsequently, the theory of risk coupling gradually found application across various domains.
In the field of highway bridge protection, Kameshwar & Padgett proposed a multi-hazard coupling risk assessment method, considering the coupling of risks between hurricanes, waves, and earthquakes. They established a multi-hazard risk assessment model based on parameterized vulnerability, which improved upon previous research focusing on risk assessment methods under single-hazard conditions[1]. In forest fire prevention, Nuthammachot & Stratoulias conducted a study on the impact of multiple risk factors coupling on the probability of forest fires. They used the Analytic Hierarchy Process (AHP) to analyze the coupling of geographical information system factors such as altitude, slope, aspect, precipitation, river distance, settlement distance, and land and evaluated the fire risk in the Huai Sai District's peat swamp forest in Thailand. They also mapped the fire potential based on the evaluation results[2]. In the field of automation system risk control, Nakamura aimed to reduce system failure rates and improve system risk management technology. They utilized methods to mitigate system failures, quantifying the coupling effects between system configuration elements and system failure frequency. This numerical representation effectively addressed the main obstacles of insufficient data and the inability to quantitatively describe the effectiveness of risk mitigation assessments[3]. In the domain of factory safety management, Wang et al. analyzed the coupling mechanism of risk factors in mechanical workshops from four dimensions: human factors, material factors, environmental factors, and management factors. They constructed safety assessment indicators for mechanical processing workshops, established a coupling model, and evaluated the safety of mechanical workshops under multi-factor interaction coupling[4]. In the field of hazardous chemical transportation risk prevention and control, Morita & Jin collected and organized a large number of accidents related to hazardous goods transportation. Through an analysis of accident causes, they analyzed the coupling situation of the four systems of personnel, machinery, environment, and management, and calculated their coupling degrees. The results indicated that the coupling degree of three factors was higher than that of two factors and four factors[5].
In terms of selecting and establishing risk coupling models, various scholars have made different attempts. Some scholars divide the risk factors influencing the system into multiple systems for analysis and construct coupling models to quantitatively analyze the degree of coupling between systems. For example, Li divided the impact of engineering construction into two systems, including the natural system and the engineering system, and established two system coupling models to analyze their coupling processes[6]. On the other hand, Xiong et al. decomposed the risk assessment indicators for debris flows on long-distance pipelines into two systems: the pipeline body and the natural environment. They further subdivided specific indicators under each subsystem, used the entropy weight method to determine the weights of indicators, and evaluated the robustness of long-distance pipelines facing debris flow risks based on coupling principles[7], making the establishment of system risk models more accurate. Qiao et al. analyzed coal mine accidents from the perspectives of homogeneous coupling and heterogeneous coupling. They used system dynamics principles to construct a coal mine accident risk factor coupling model and provided an effective method for quantitatively analyzing the degree of coupling between subsystems[8]. Xue et al. studied the risk formation mechanism of coupled disasters. They first elaborated on the definition and types of coupled disasters, analyzed possible outcomes of coupling, including zero coupling, weak coupling, and strong coupling, and used a risk matrix to visually represent the coupling effects of risk factors with fuzzy relationships[9].
Additionally, some scholars have developed different risk coupling models for quantitative analysis and measurement of the degree of coupling between various risk factors. For instance, Sun et al. conducted a study on accidents involving passenger ropeways. They used statistical data to identify failure risks in passenger ropeways and analyzed the coupling types of risk factors. Through specific case analysis, they found that different factor couplings resulted in different failure probabilities, with the N-K multi-factor coupling model indicating the highest coupling value for four factors[10]. On the other hand, Li et al. improved the traditional N-K risk coupling model, addressing the limitations that required a large amount of statistical data for application. They used the analytic hierarchy process to convert the probability of accidents into the frequency of risk factors for risk coupling calculations, applying this approach to the analysis of fire risks in public buildings[11]. Zhao et al. used factor risk coupling theory to analyze explosions in oil tank areas. They proposed an evaluation method based on a risk coupling matrix and conducted an explosion risk assessment on an oil tank area to determine the weights of various risk factors and risk levels under the concept of risk coupling[12]. Meanwhile, Shen et al. considered risk coupling effects and conducted research on risk warning issues during the construction of super-tall buildings. They proposed a new risk warning model covering personnel, operations, equipment, and fuse indicators. They established new criteria for determining indicator levels and analyzed the impact of multiple factor couplings on warning indicators using indicator discounting, presenting a new risk warning approach[13]. He focused on submarine oil and gas pipelines, analyzing databases and summarizing leakage risks of submarine pipelines. Using the Decision-making Trial and Evaluation Laboratory (DEMATEL) method and coupling coordination theory, they constructed a submarine pipeline coupling risk assessment model. The authors integrated risk causation theory and fault trees into Bayesian networks, developing a coupling risk assessment model capable of quantifying the probability of leakage risk failure[14]. Li et al. studied the coupled construction risks of large underground spaces in urban areas. They added source variables, failure indicators, and failure criteria to the traditional safety risk quantification model, calculating the system's failure rate. Using the Guangzhou South Station subway deep foundation pit project as an example, the analysis showed that the coupling between risk factors was mostly positive, and the coupling between some factors could even amplify local system risks by more than twice[15].
The research in risk coupling primarily focuses on qualitative analysis of risk factor management and quantitative assessment of risk factor couplings. Various coupling models such as risk propagation coupling models and N-K models have been commonly employed for establishing these couplings. Although these models analyze risk couplings, they lack a visual representation of the couplings between risk factors. Therefore, this paper considers establishing a complex network model of risk factors based on complex network theory. The characteristic parameters of complex network models can reflect the coupling relationships between risk factors and can be used to identify key risk factors using network node importance.
The concept of complex networks emerged relatively recently but has become a popular research area. The origin and development of complex networks can be summarized in several key stages. In 1998, Watts & Strogatz sought a middle ground between completely regular and completely random topological structures, leading to the discovery of small-world networks characterized by high clustering and small characteristic path lengths, achieved through rewiring networks[16]. In 1999, Albert & Hawoong analyzed various complex networks and observed that the degree distribution of network nodes follows a power-law distribution, introducing the important characteristic of scale-free networks[17]. Subsequently, Ullah et al. improved the identification of global and local node importance by proposing a central measurement method (LGC) that simultaneously considers the local and global topological structures of networks to identify important nodes. The LGC method was compared with local structure (GLS), global structure model (GSM), and eigenvector (EVC) methods, showing superior performance compared to the latter two[18]. These groundbreaking studies paved the way for the application of complex networks in various fields. In the field of tropical cyclone prediction research, Gupta et al. developed a method using complex networks to construct continuous overlapping short-time window networks based on average sea level pressure data. They found that network metrics such as degree and clustering exhibited important features of tropical cyclones[19]. In the water quality assessment field, Sitzenfrei improved the water quality assessment model for large water distribution systems by developing a novel high computational efficiency water quality assessment method based on complex network analysis. This method reduced the computational burden of typical models and achieved correct recognition rates between 96% and 100%[20]. In the field of electric power transportation and trade, Pu et al. explored the structural characteristics and evolution of cross-border electricity trade networks using complex network methods. They utilized advanced network analysis methods such as Exponential Random Graph Models (ERGM) to identify factors influencing network formation. The results showed that the scale of the electricity trade network continues to expand, but many economies have not participated. The centrality of the network shifted from west to east, with high internal electricity interconnection levels in Europe and increased coordination among Asian countries in the cross-border electricity trade network. Cross-border electricity trade contributes to reducing carbon dioxide emissions, achieving renewable energy transformation, and reducing mismatches between electricity supply and demand[21]. In the field of epidemiology, complex networks have also been widely applied. Lombardi et al. employed complex network methods to investigate the spread of epidemics in the Lombardy region by using an origin-destination matrix containing commuting flow information between 1,450 urban areas. They conducted large-scale simulations of epidemic spread on networks associated with three major motives (i.e., work, study, and occasional travel) to quantify the potential contributions of each type of traveler to the epidemic transmission process[22]. Scabini et al. proposed a layered spatial complex network model to represent different transmission paths of viruses between individuals and modeled the spread of the novel coronavirus. They simulated isolation, social distancing, or preventive measures to estimate the potential outcomes under current isolation levels in Brazil[23]. Importance is one of the crucial features in complex networks. Xu et al. addressed the common oversight in existing evaluation methods, which often neglect the impact of edges on nodes, by proposing a new method that simultaneously assesses node and edge centrality through a mutually updating iterative framework[24]. This method has found wide application in the financial sector. Samal et al. analyzed daily closing prices of financial market indices from different countries and regions spanning 15 years from 2000 to 2015 using complex network methods. They studied the impact of intense stock market fluctuations on the interactions between market indices in the financial market, and the results showed that the use of complex network methods can effectively assess the vulnerability of financial markets[25].
From the literature review, it can be seen that the concept of risk coupling provides a new perspective for risk analysis, with applications in various fields. However, there is still room for improvement in practical applications, especially in obtaining specific data for coupling degree and coupling probability. The lack of clear and visual models for coupling processes and mechanisms is another challenge. In the research, many scholars have focused on evaluating the safety status of urban buildings or equipment under the coupling effects of various natural disasters. And also many scholars have explored methods of coupling or integration and applied various models or mathematical methods for risk assessment. However, there is limited research on the coupling effects of risk factors in gas pipeline leakage accidents, as well as the analysis of interaction mechanisms between risk factors.
The application of complex network theory in analyzing complex systems has significant advantages, allowing for the intuitive representation of relationships between multiple entities. Although the application of complex networks is relatively new, it has already shown great potential in studying various complex systems, such as social networks, food chains, supply chains, and power networks. Existing studies have applied complex network analysis to analyze the network structures of oil and gas pipeline networks. However, similar network structures also exist between risk factors and their coupling relationships in the context of accident causation. In the complexity of gas pipeline systems, there are various risk factors with complex interactions. The multi-factor coupling between risk factors makes the accident process complex and networked, exhibiting the characteristics of a complex network. Therefore, this study integrates multi-factor coupling theory with complex network theory, constructs a complex network with risk factors as nodes and the coupling relationships between risk factors as edges, and identifies key risk factors.
Initially, risk factors are measured using the N-K model formula, and their coupling relationships are assessed through a system dynamics model. The obtained data is integrated into UCINET to formulate a complex network model for quantitative analysis. This involves measuring the coupling degree of secondary risk factors and scrutinizing network characteristic parameters to identify the more critical risk factors within the network.
-
During the gas pipeline operation, various risk factors come into play. Following the Classification and Code of Hazard and Harmful Factors in the Production Process[26] and considering accident cases, these factors can be categorized into four subsystems: human factors, equipment factors, environmental factors, and management factors. The coupling of these four subsystem risk factors, either directly or indirectly, influences the gas pipeline system, causing overall or local characteristics to change. When these changes surpass a certain threshold, leakage accidents occur. Figure 1 illustrates the relationship between the risk tolerance of the gas pipeline system and each subsystem.
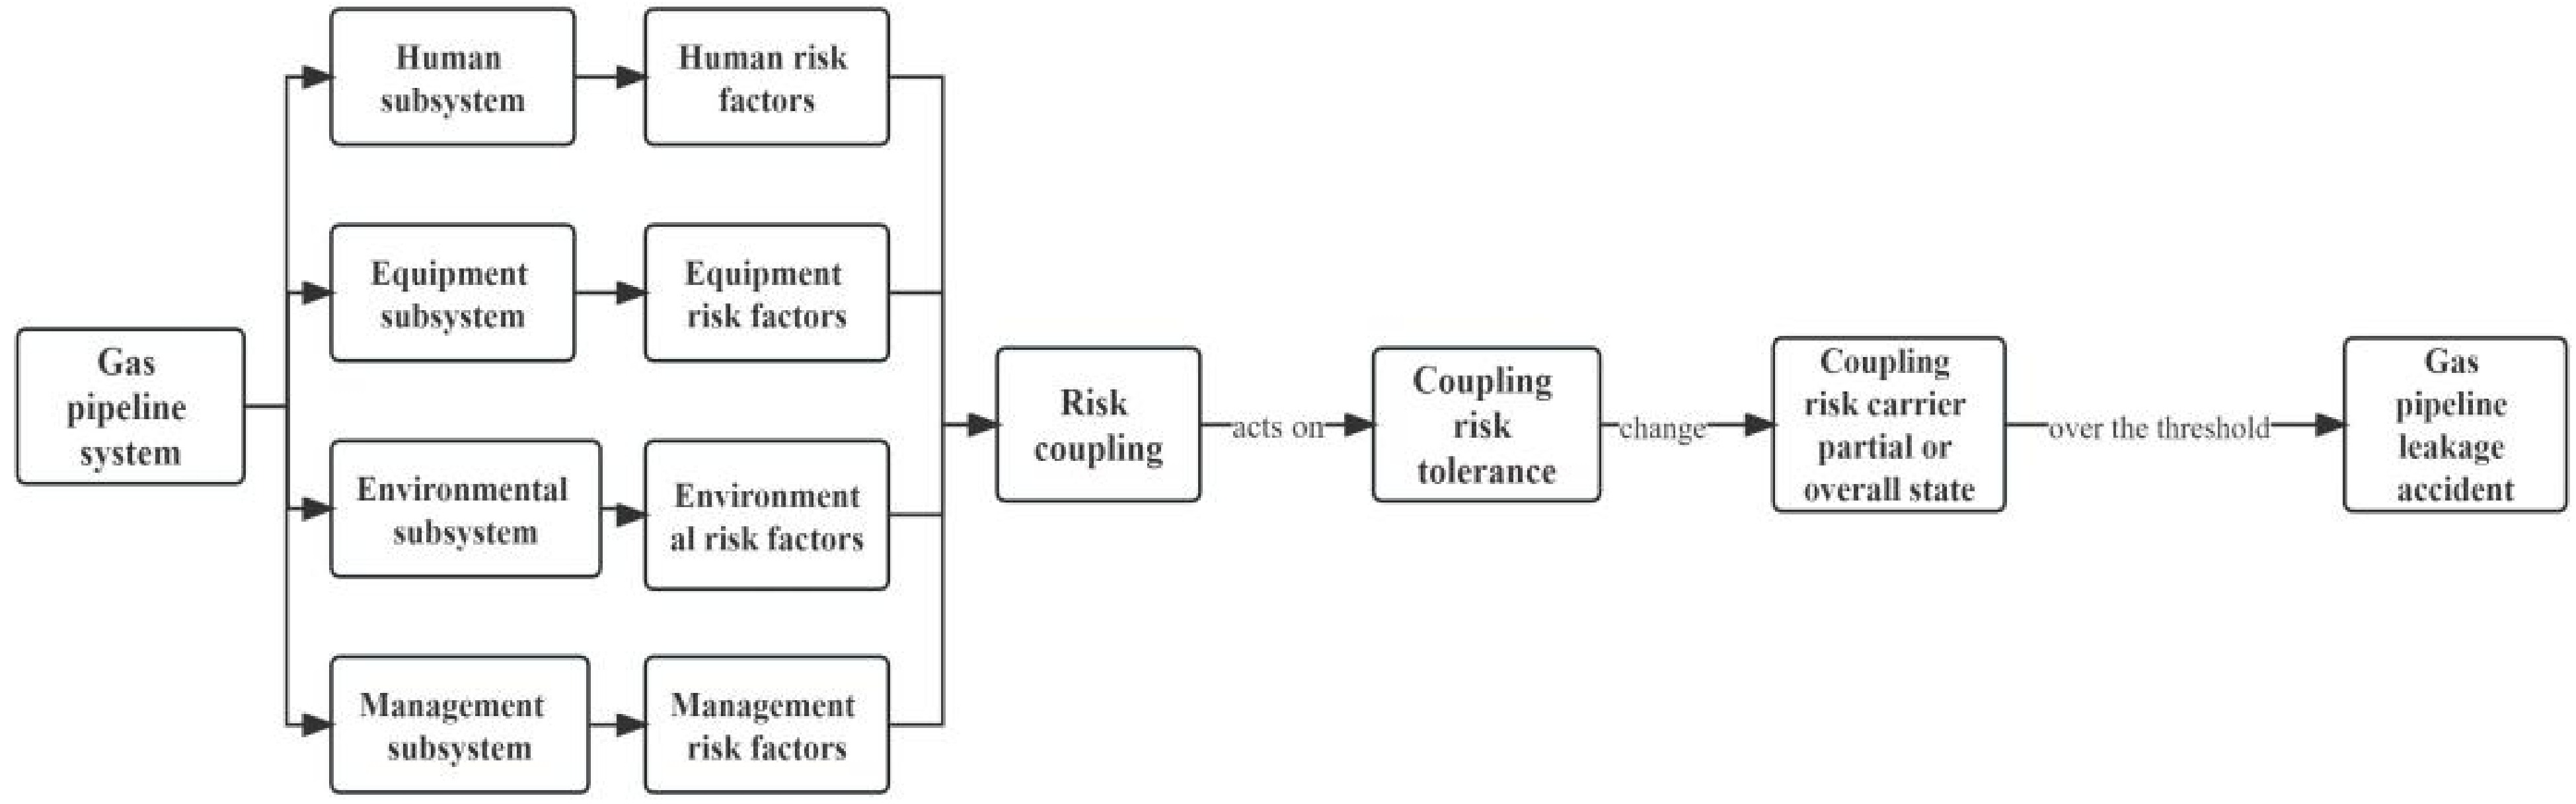
Figure 1.
Relation between the risk tolerance body of the gas pipeline system and each subsystem.
To streamline the research, the leakage risk coupling of gas pipelines is categorized into one-factor coupling, two-factor coupling, and multi-factor coupling:
(1) One-factor coupling refers to the mutual influence between the risk factors of the same type in the gas pipeline leakage risk system. Since the leakage risk of gas pipeline is divided into four subsystems: human factor risk coupling, equipment factor risk coupling, environmental factor risk coupling, management factor risk coupling.
(2) Two-factor coupling refers to the interaction between two types of subsystems in the gas pipeline leakage risk system. Two-factor coupling in gas pipeline leakage risk includes:
Human factor-equipment factor coupling;
Human factor-environmental factor coupling;
Human factor-management factor coupling;
Equipment factor-environmental factor coupling;
Equipment factor-management factor coupling;
Environmental factor-management factor coupling.
(3) Multi-factor coupling refers to the interaction between three or more different types of subsystem risk factors in the gas pipeline leakage risk system. Multi-factor coupling in gas pipeline leakage risk includes:
Human factor-equipment factor-environmental factor coupling;
Human factor-management factor-environmental factor coupling;
Human factor-equipment factor-management factor coupling;
Equipment factor-management factor-environmental factor coupling;
Human factor-equipment factor-environmental factor-management factor coupling.
Introduction to the N-K model
-
Numerous scholars have made substantial progress in researching risk coupling across various domains. Commonly utilized coupling models include the Structural Equation Model, Coupling Degree Model, and N-K Model. Among these, the Structural Equation Model serves as a qualitative analysis model and is therefore unsuitable for calculating the degree of coupling between risk factors in gas pipeline leakage accidents within the scope of this study. While the Coupling Degree Model can calculate the degree of risk coupling among various risk factors, it necessitates the manual setting of upper and lower limit values in the model parameters, resulting in subjectivity.
On the other hand, the N-K Model, grounded in historical statistical data, offers a more objective approach to quantitatively analyzing the degree of mutual influence among elements within complex systems. Following a comprehensive evaluation of the strengths and limitations of each model, the N-K Model is proposed for adoption in this study. Its utilization will facilitate an exploration of the coupling laws and the strength of coupling relationships about gas pipeline leakage accident risks, leveraging historical data for a more rigorous analysis.
In the N-K model introduction[27], quantitative analysis is achieved through the N-K model formula to calculate the risk coupling value T. The formula is as follows:
$ T(a,b,c,d)=\sum _{h=1}^{H}\sum _{i=1}^{I}\sum _{j=1}^{J}\sum _{k=1}^{K}{P}_{hijk}\cdot {\mathit{log}}_{2}({p}_{hijk}/({p}_{h...}\cdot {p}_{.i..}\cdot {p}_{..j.}\cdot {p}_{...k}\left)\right) $ (1) Where h = 1, 2, ... H; i = 1, 2, ...I; j = 1, 2, ... J; k = 1, 2, ... K.
The first-level risk factors—human a, equipment b, environmental c, and management d—are represented. Phijk signifies the probability of risk coupling that human factor in the h state, machine factor in the i state, environmental factor in the j state, and management factor in the k state. The T value quantitatively assesses accident risk coupling, where a larger T value indicates a greater accident risk. This calculation enables the identification of significant coupling relationships among first-level risk factors based on their respective risk coupling values.
The N-K model, which is based on historical statistical data, can objectively quantify the degree of reciprocal effect between different elements within a complex system. After considering the advantages and limitations of various models, the N-K model will be employed to study the coupling effect and coupling strength relationship of the gas pipeline system, based on historical data.
Introduction to the UCINET
-
UCINET software was developed by a group of network analysts at the University of California, Irvine. The team responsible for the software's expansion include Stephen Borgatti, Martin Everett, and Linton Freeman[28].
Social network analysis is a widely used research tool in the social sciences. However, it is not confined to the social sciences; it is also used to analyze networks and complex systems in a variety of natural scientific disciplines. In the past, our research primarily focused on attribute data such as gender, age, income, attitudes, and values. However, because we live in a specific social setting, our behaviors are influenced by others. Conventional statistics works with attribute data, while social network analysis focuses on relational data. It examines social phenomena and structures from a relational perspective, capturing attitudes and behaviors shaped by social structures.
UCINET is currently the most popular software for social network analysis. It is an integrated software package that includes NetDraw for one-dimensional and two-dimensional data analysis and Mage for developing applications in three-dimensional visual analysis. It also integrates the free software program Pajek for analyzing large-scale networks. UCINET is a Windows program and is widely recognized and frequently used for processing social network data and similar types of data.
Introduction to the related theories of the complex network model
-
Complex network theory leverages topological network structures, incorporating fundamental graph theory principles to construct network graphs for researching real-world complex systems. This paper specifically concentrates on analyzing the network node degree.
(1) Degree and degree distribution
Node degree serves as the most intuitive parameter to gauge the significance of nodes within the topological network connections. In a directed network graph, node degree is categorized into in-degree and out-degree. In-degree represents the connections from other nodes to the specified node, while out-degree signifies the connections from the specified node to other nodes. The degree k of the directed network ki is equal to the sum of the in-degree and out-degree of the node. Nodes with larger degrees typically wield substantial influence in the network, forming the basis for node importance ranking.
The average node degree of the network is computed by summing the degrees of all nodes and averaging the results. The formula for the average node degree <k> is as follows:
$ \lt k \gt =\dfrac{1}{N}\sum _{i=1}^{N}{k}_{i} $ (2) A higher <k> value indicates a more complex network.
Degree distribution provides a macroscopic statistical depiction of the network, reflecting the characteristics of network nodes. It represents the probability of randomly selecting a node with a node degree k. The distribution probability of the node degree in the network is denoted as P(k).
$ P\left(k\right)=\dfrac{{n}_{k}}{N} $ (3) Where nk represents the number of nodes with a node degree of k, and N is the total number of nodes in the network.
(2) Degree of centrality
To uniformly measure the importance of nodes in the network using degree indicators, normalization is applied. Assuming the network contains N nodes, with node vi having a degree ki. It is referred to as DC(vi). The degree centrality of the nodes can be represented using the following formula:
$ {DC}_{\left({v}_{i}\right)}=\dfrac{{k}_{i}}{N-1} $ (4) -
This study examined 47 gas pipeline leakage accidents, analyzing the prevalence and occurrences of one-factor risk coupling, two-factor risk coupling, and multi-factor risk coupling. The results of this analysis are detailed in Table 1, providing insights into the coupling relationships among primary risk factors.
Table 1. Couple times and frequency of each risk factor.
Coupling type Coupling factors No. of couplings Frequency One-factor coupling Human 0 P1000 = 0 Equipment 0 P0100 = 0 Environment 1 P0010 = 0.021 Management 0 P0001 = 0 Two-factor coupling Human-Equipment 1 P1100 = 0.021 Human-Environment 5 P1010 = 0.106 Human-Management 22 P1001 = 0.468 Equipment-Environment 1 P0110 = 0.021 Equipment-Management 1 P0101 = 0.021 Environment-Management 0 P0011 = 0 Multi-factor coupling Human-Equipment-Environment 2 P1110 = 0.041 Human-Equipment-Management 9 P1101 = 0.191 Human-Environment-Management 2 P1011 = 0.041 Equipment-Environment-Management 0 P0111 = 0 Human-Equipment-Environment-Management 3 P1111 = 0.063 Based on the number of risk factors involved in coupling, the risk coupling of gas pipeline leakage accidents is categorized into one-factor risk coupling, two-factor risk coupling, and multi-factor risk coupling. The coupling probability of each risk is calculated using the following method.
(1) One-factor risk coupling
Take P0… as an example, P0… = P0000 + P0100 + P0001 + P0101 + P0110 + P0011 + P0111 .
The same way to calculate P1…,P.0..,P.1..,P..0.,P..1.,P…0,P…1 .
(2) Two-factor risk coupling
Take P00.. as an example, P00.. = P0000 + P0010 + P0001 + P0011 .
The same way to calculate P01..,P11..,…,P1..1 .
(3) Muti-factor risk coupling
Take P000.as an example, P000.=P0000+P0001.Similarly, it can be calculated for the P100.,P010.,…,P11.1 .
The coupling probabilities of single, two, and multiple factors under different coupling forms are detailed in Table 2.
Table 2. Coupling probabilities for different coupling forms.
One-factor coupling Two-factor coupling Muti-factor coupling P0... = 0.063 P00.. = 0.021 P0.1. = 0.042 P1.0. = 0.680 P000. = 0.000 P010. = 0.021 P110. = 0.212 P011. = 0.021 P.0.. = 0.636 P.00. = 0.468 P0..1 = 0.021 P1..0 = 0.168 P00.0 = 0.021 P01.0 = 0.021 P11.0 = 0.062 P01.1 = 0.021 P..0. = 0.701 P..00 = 0.021 P.0.1 = 0.509 P11.. = 0.316 P0.00 = 0.000 P0.10 = 0.042 P1.10 = 0.147 P0.11 = 0.000 P...0 = 0.210 P0.0. = 0.021 P..01 = 0.680 P.11. = 0.125 P.000 = 0.000 P.010 = 0.127 P.110 = 0.062 P.011 = 0.041 P1... = 0.931 P0..0 = 0.042 P.10. = 0.233 P..11 = 0.104 P100. = 0.468 P.001 = 0.468 P.101 = 0.212 P.111 = 0.063 P.1.. = 0.358 P.0.0 = 0.127 P.1.0 = 0.083 P1.1. = 0.251 P10.0 = 0.106 P0.01 = 0.021 P1.01 = 0.659 P1.11 = 0.104 P..1. = 0.293 P10.. = 0.615 P..10 = 0.189 P.1.1 = 0.275 P1.00 = 0.021 P00.1 = 0.000 P10.1 = 0.509 P11.1 = 0.254 P...1 = 0.784 P01.. = 0.042 P.01. = 0.168 P1..1 = 0.763 P.100 = 0.021 P001. = 0.021 P101. = 0.147 P111. = 0.104 P1111 = 0.063 (four factors) Table 3 presents the risk coupling values for the various risk coupling forms.
Table 3. Risk coupling values for different risk coupling forms.
Coupling type Coupling factors Risk coupling value code Risk coupling value Two-factor coupling Human-Equipment T21 0.028 Human-Environment T22 0.038 Human-Management T23 0.056 Equipment-Environment T24 0.015 Equipment-Management T25 0.010 Environment-Management T26 0.034 Muti-factor
couplingHuman-Equipment-Environment T31 0.087 Human-Management-Environment T32 0.100 Human-Equipment-Management T33 0.405 Equipment-Management-Environment T34 0.401 Human-Equipment-Environmental-Management T4 0.426 The research results lead to the following conclusions:
(1) The risk coupling value rises as the number of elements engaged in the coupling increases. Four-factor coupling has the highest risk, followed by three-factor coupling, and the lowest risk is found in two-factor coupling.
(2) In the three-factor coupling, the human-management-environment risk coupling value is the highest, followed by the equipment-management-environment, This indicates a higher risk associated with both environmental and management factors. It suggests a need for enhanced supervision of gas pipeline environmental conditions and a focus on improving the overall competency of management personnel by relevant departments and stakeholders.
(3) In two-factor coupling, the coupling value between human factors and management factors demonstrates the highest value and poses the greatest risk. The significant coupling value in human-management risk highlights unsafe behaviors among relevant personnel and unreasonable operational practices in management, increasing the likelihood of gas pipeline leakage accidents. Consequently, it is imperative to concentrate efforts on reducing the probability of coupling effects between human risk factors and managed risk factors.
Coupling analysis of secondary risk factors
-
Although the N-K model can examine the coupling impact among the first-level risk factors in gas pipeline leakage accidents, it primarily focuses on this initial level, potentially limiting the depth of analytical results. To overcome this constraint, we build an accident risk coupling network using complex network theory inside the gas pipeline. This enables a more comprehensive analysis of the coupling effect among secondary risk factors, providing targeted insights.
Referring to the Classification and Code of Hazard and Harmful Factors in the Production Process[26], secondary risk factors associated with gas pipeline leakage accidents were identified from an analysis of 47 cases. Table 4 details these secondary risk factors.
Table 4. Risk factors for city gas pipeline leakage U.
Factors Category Description Human
factor risk AA1 Malicious sabotage A2 Unauthorized operations and operational errors A3 Improper maintenance A4 Laxity in patrolling A5 Poor physiological condition A6 Low psychological resilience A7 Weak safety awareness among staff A8 Lack of sense of responsibility A9 Inadequate professional skills A10 Insufficient emergency response capabilities Equipment
factor risk BB1 Piping corrosion B2 Stress corrosion B3 Failure of internal protective layers B4 Failure of external protective layers B5 Failure of electrical protection B6 Pipe material defects B7 Equipment failures B8 Equipment design flaws B9 Failure of safety protection devices B10 Equipment aging and wear Environmental factor risk C C1 Hydrogeological conditions C2 Soil environment C3 Natural disasters C4 Unclear or missing signage C5 Unauthorized occupation of ground space C6 Ground traffic environment Management factor risk D D1 Unreasonable personnel arrangements D2 Incomplete rules and regulations D3 Failure to implement rules and regulations D4 Inadequate safety culture development D5 Insufficient employee training and education D6 Decision-making errors D7 Inadequate awareness and education of surrounding residents Utilizing the 47 accident reports, an analysis was conducted on the relationships between secondary risk factors. The coupling relationships of the risk factors were dissected, where the split risk factors i and j have i→j and j→i. In this context, i→j implies that risk factor i will exert a certain degree of influence on j, while j→i signifies that risk factor j will influence i. When both relationships coexist, it indicates that risk factors i and j mutually influence each other. The obtained coupling relationships between secondary risk factors are outlined in Table 5.
Table 5. Coupling relationship of secondary risk factors.
Coupling system Incidence relation Human factor risk coupling A5→A3; A5→A4; A5→A8; A6→A10; A7→A2; A7→A4; A8→A4; A8→A7; A8→A3 Equipment factor risk coupling B1→B10; B1→B2; B2→B1; B2→B10; B3→B1; B4→B1; B5→B1; B5→B3; B5→B4; B8→B7; B8→B6; B10→B4; B10→B3; B10→B7 Environmental factor risk coupling C1→C3; C3→C4; C4→C5 Management factor risk coupling D2→D4; D3→D4; D3→D5; D6→D1 Human factor-equipment factor coupling A3→B7; A3→B10; A3→B9; A3→B5; A3→B4; A3→B6; A2→B7; A2→B9; A1→B7; A1→B9; A1→B5; A1→B4; A1→B6 Human factor-environmental factor coupling A1→C4; A2→C5; A3→C4; A3→C5; A3→C6; A4→C5; A7→C5; A9→C4; A9→C6; C1→A4; C1→A10; C3→A4; C4→A2; C6→A4; C6→A10; A4→C4; A7→C4 Human factor-management factor coupling A5→D6; A6→D6; A7→D4; A8→D3; A8→D7; A9→D6; A10→D6; D1→A4; D1→A3; D1→A9; D1→A10; D2→A2; D2→A3; D2→A4; D3→A2; D3→A3; D3→A4; D4→A2; D4→A7; D5→A2; D5→A3; D5→A9; D5→A6; D7→A10; D7→A1 Equipment factor-environmental factor coupling C1→B4; C1→B5; C1→B10; C2→B1; C2→B2; C2→B4; C2→B5; C3→B10; C3→B9; C3→B7; C3→B5; C3→B4; C4→B4; C5→B2; C5→B10; C6→B2; C6→B10; C1→B4; C1→B5; C1→B10 Equipment factor-management factor coupling D5→B5; D5→B7; D5→B9; D5→B10; D3→B7; D3→B9; D3→B5; D3→B10; D7→B4; D2→B7; D2→B9; D2→B10; D7→B5 Environmental factor-management factor coupling D1→C5; D1→C4; D2→C5; D2→C4; D7→C4; D7→C5; D5→C4; D5→C5; D3→C4; D3→C5 After identifying the connections between nodes, the UCINET software is employed to construct a directed correlation network model for the leakage risk of gas pipelines. To facilitate data input into the modeling software, the connections between nodes are binarized and transformed into a matrix format. If node i→j has influence, it is denoted as 1; if there is no influence i→j has no connection, it is represented as 0. Due to the extensive data, only a part of the subset is presented in Fig. 2 for illustrative purposes.
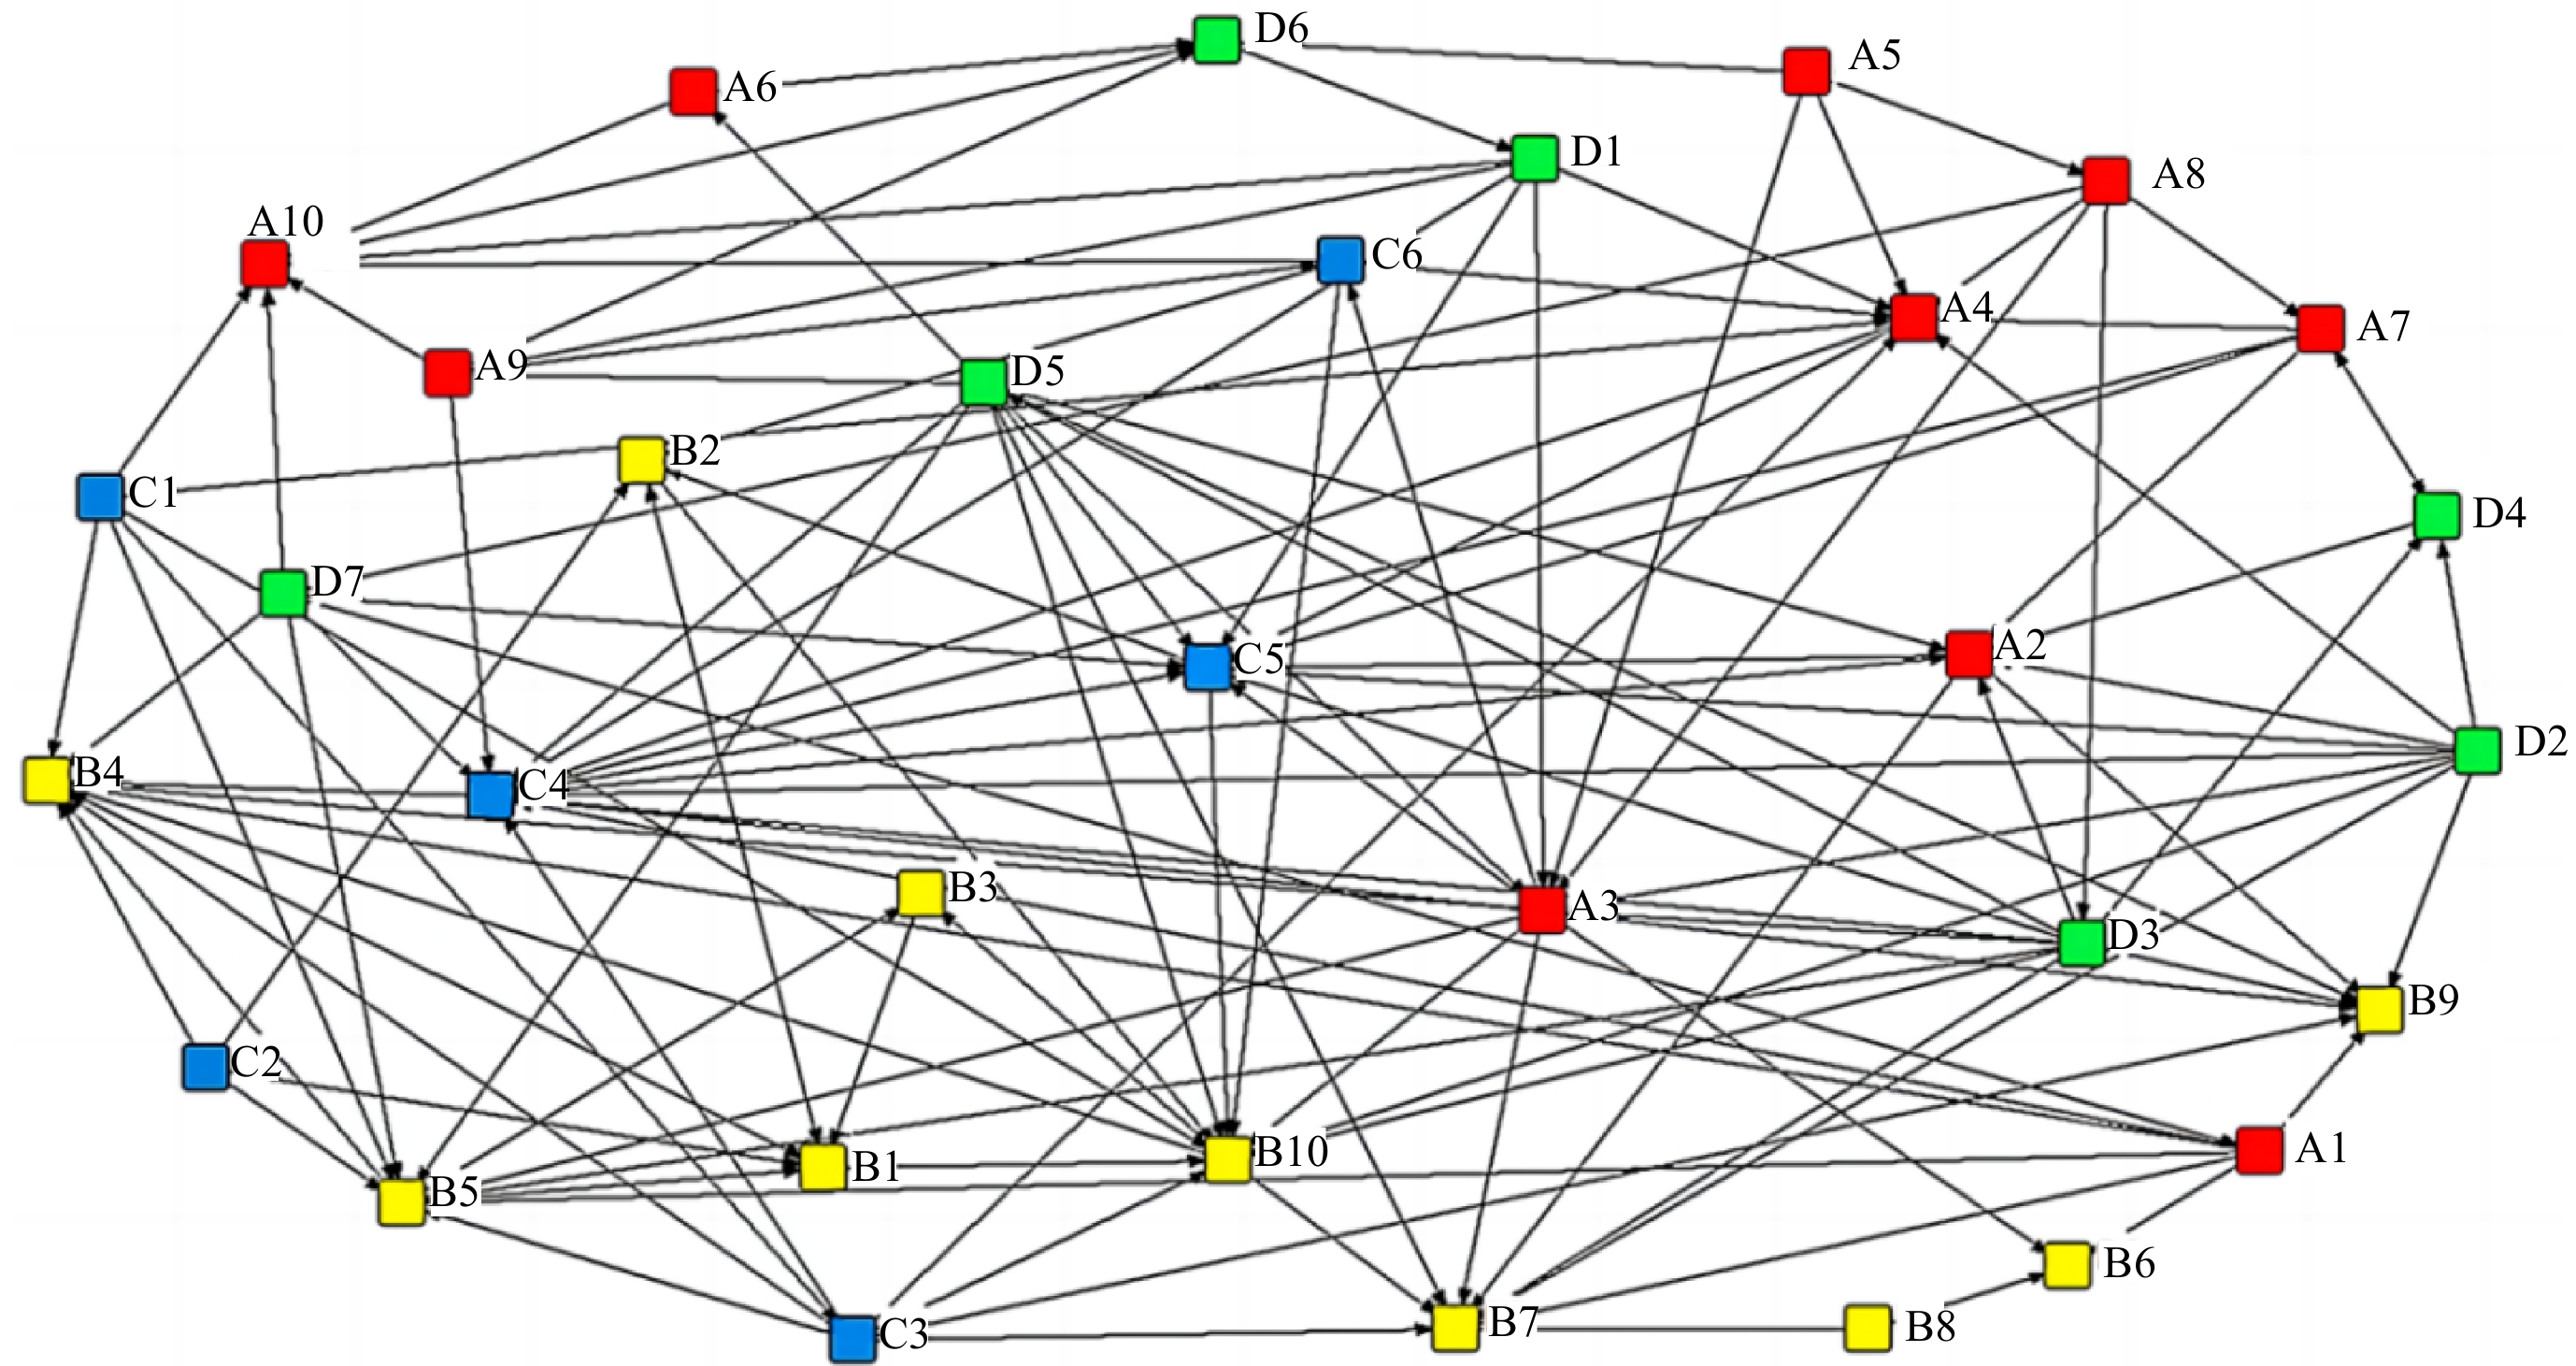
Figure 2.
Node connectivity data matrix.
The data has been imported into UCINET to generate a multi-factor coupled risk network model for gas pipeline leakage accidents. The model consists of 33 nodes and 125 edges. Each node in Fig. 3 represents a specific risk factor, with colors indicating different risk categories: red for human factor risk, yellow for equipment factor risk, blue for environmental factor risk, and green for management factor risk. The coupling relationships between these risks are shown as directed arrows between nodes. Figure 3 visually depicts the complex interconnections within the gas pipeline leakage risk network.
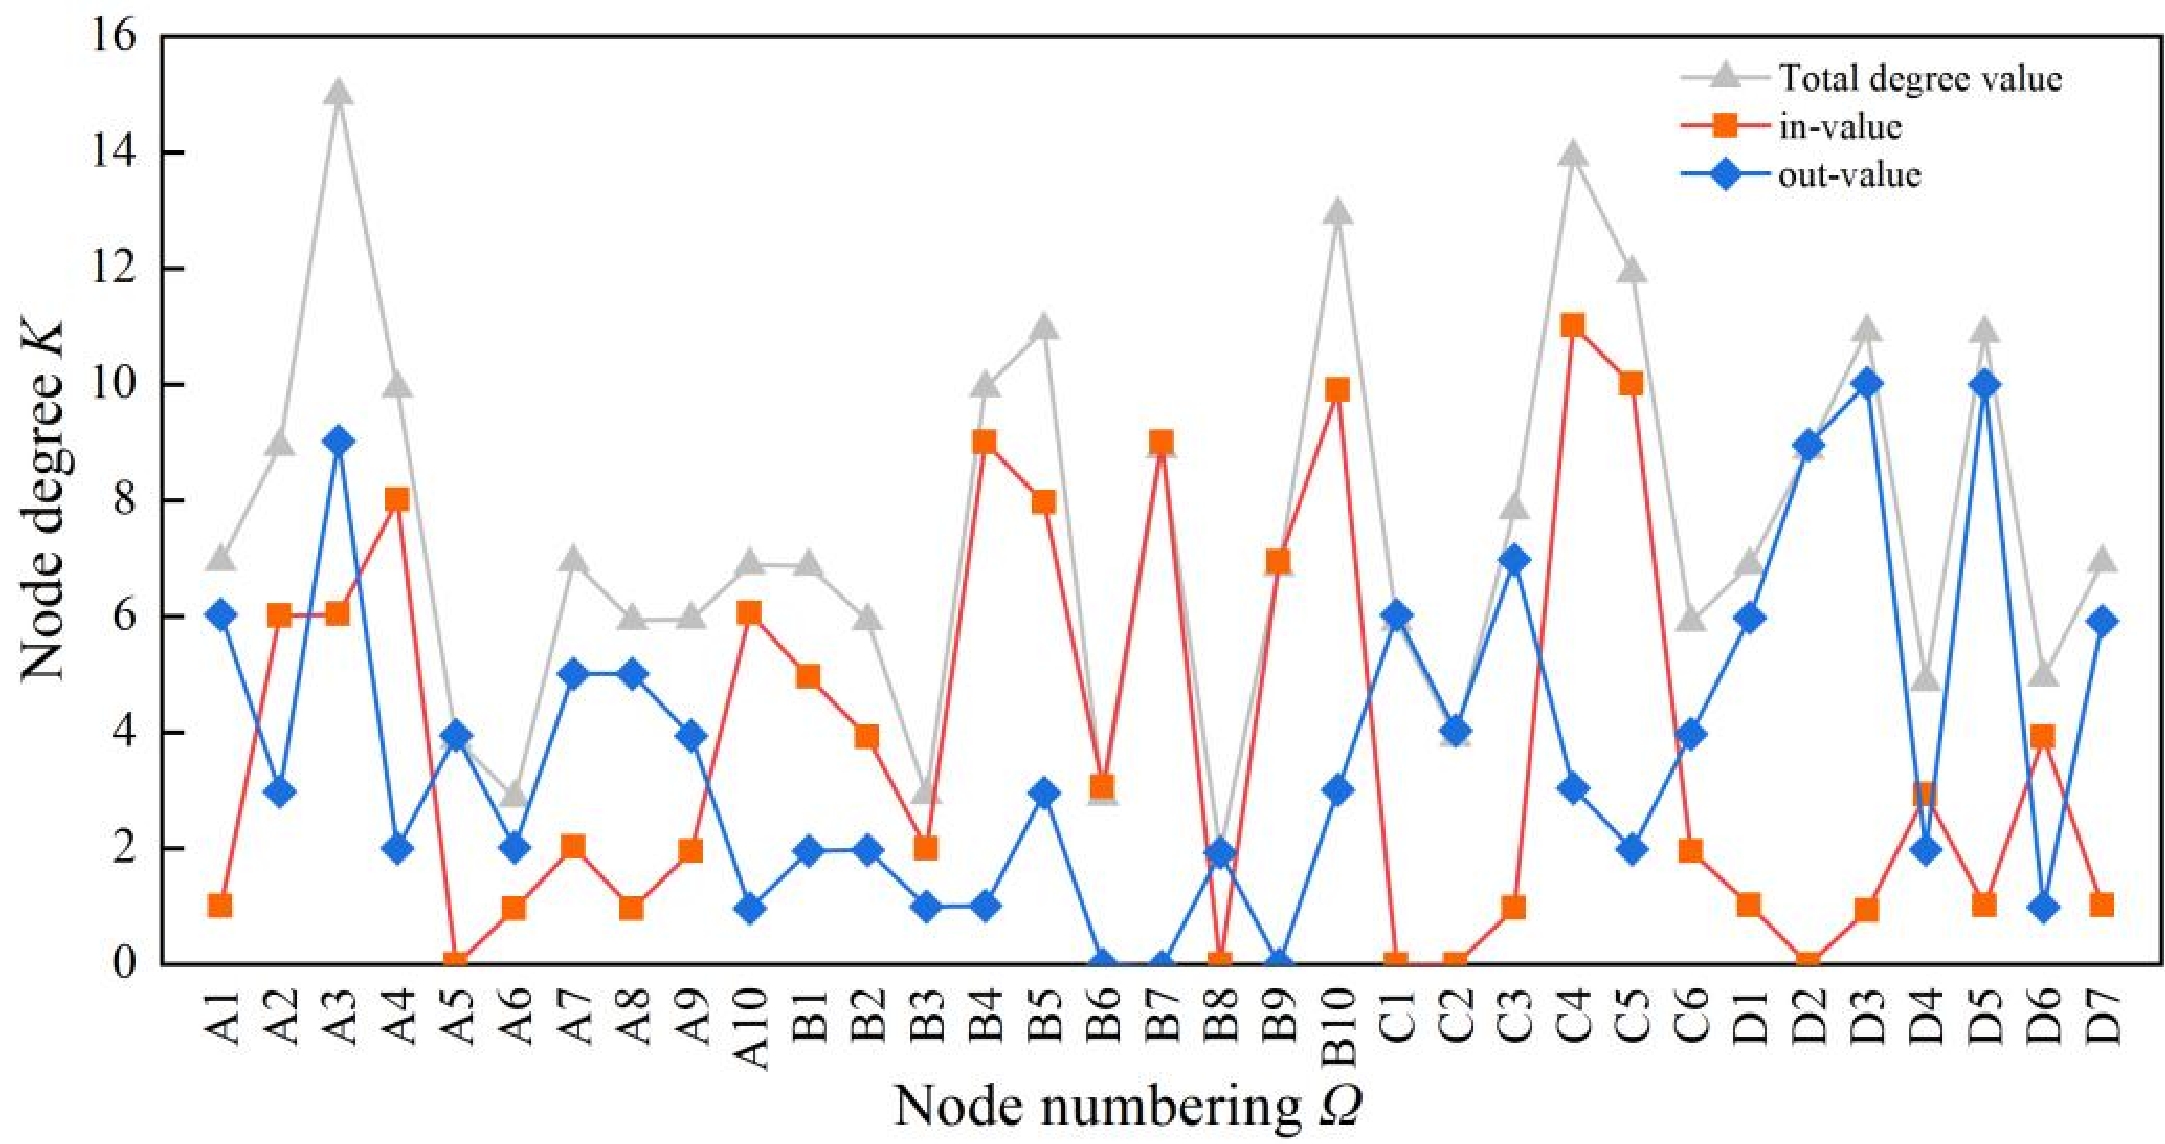
Figure 3.
Multi-factor coupled network model for gas pipeline leakage accidents.
The node degree k in the network is a very important index, that is, the definition and calculation formula are introduced accordingly in Eqn. (2). The gas pipeline leakage accident risk coupling network model established in this study is a directed network, in which the nodal degree includes both out-degree centrality and in-degree centrality. In this model, the out-degree centrality measures the direct influence capability of the risk factor associated with the node, while the in-degree centrality measures the susceptibility of the node's risk factor to external influences. Table 6 illustrates the values of each node's degree in the gas pipeline leakage risk network model.
Table 6. Degree value of each node.
Panel point Out-degree In-degree Total degree value Panel point Out-degree In-degree Total degree value A1 6 1 7 B8 2 0 2 A2 3 6 9 B9 0 7 7 A3 9 6 15 B10 3 10 13 A4 2 8 10 C1 6 0 6 A5 4 0 4 C2 4 0 4 A6 2 1 3 C3 7 1 8 A7 5 2 7 C4 3 11 14 A8 5 1 6 C5 2 10 12 A9 4 2 6 C6 4 2 6 A10 1 6 7 D1 6 1 7 B1 2 5 7 D2 9 0 9 B2 2 4 6 D3 10 1 11 B3 1 2 3 D4 2 3 5 B4 1 9 10 D5 10 1 11 B5 3 8 11 D6 1 4 5 B6 0 3 3 D7 6 1 7 B7 0 9 9 As computed by the UCINET software, the average node degree of the network is (<k> = 7.58). It represents the average of each risk factor being coupled with the other 7.58 risk factors. Figure 4 illustrates the node degree distribution of the coupling network.
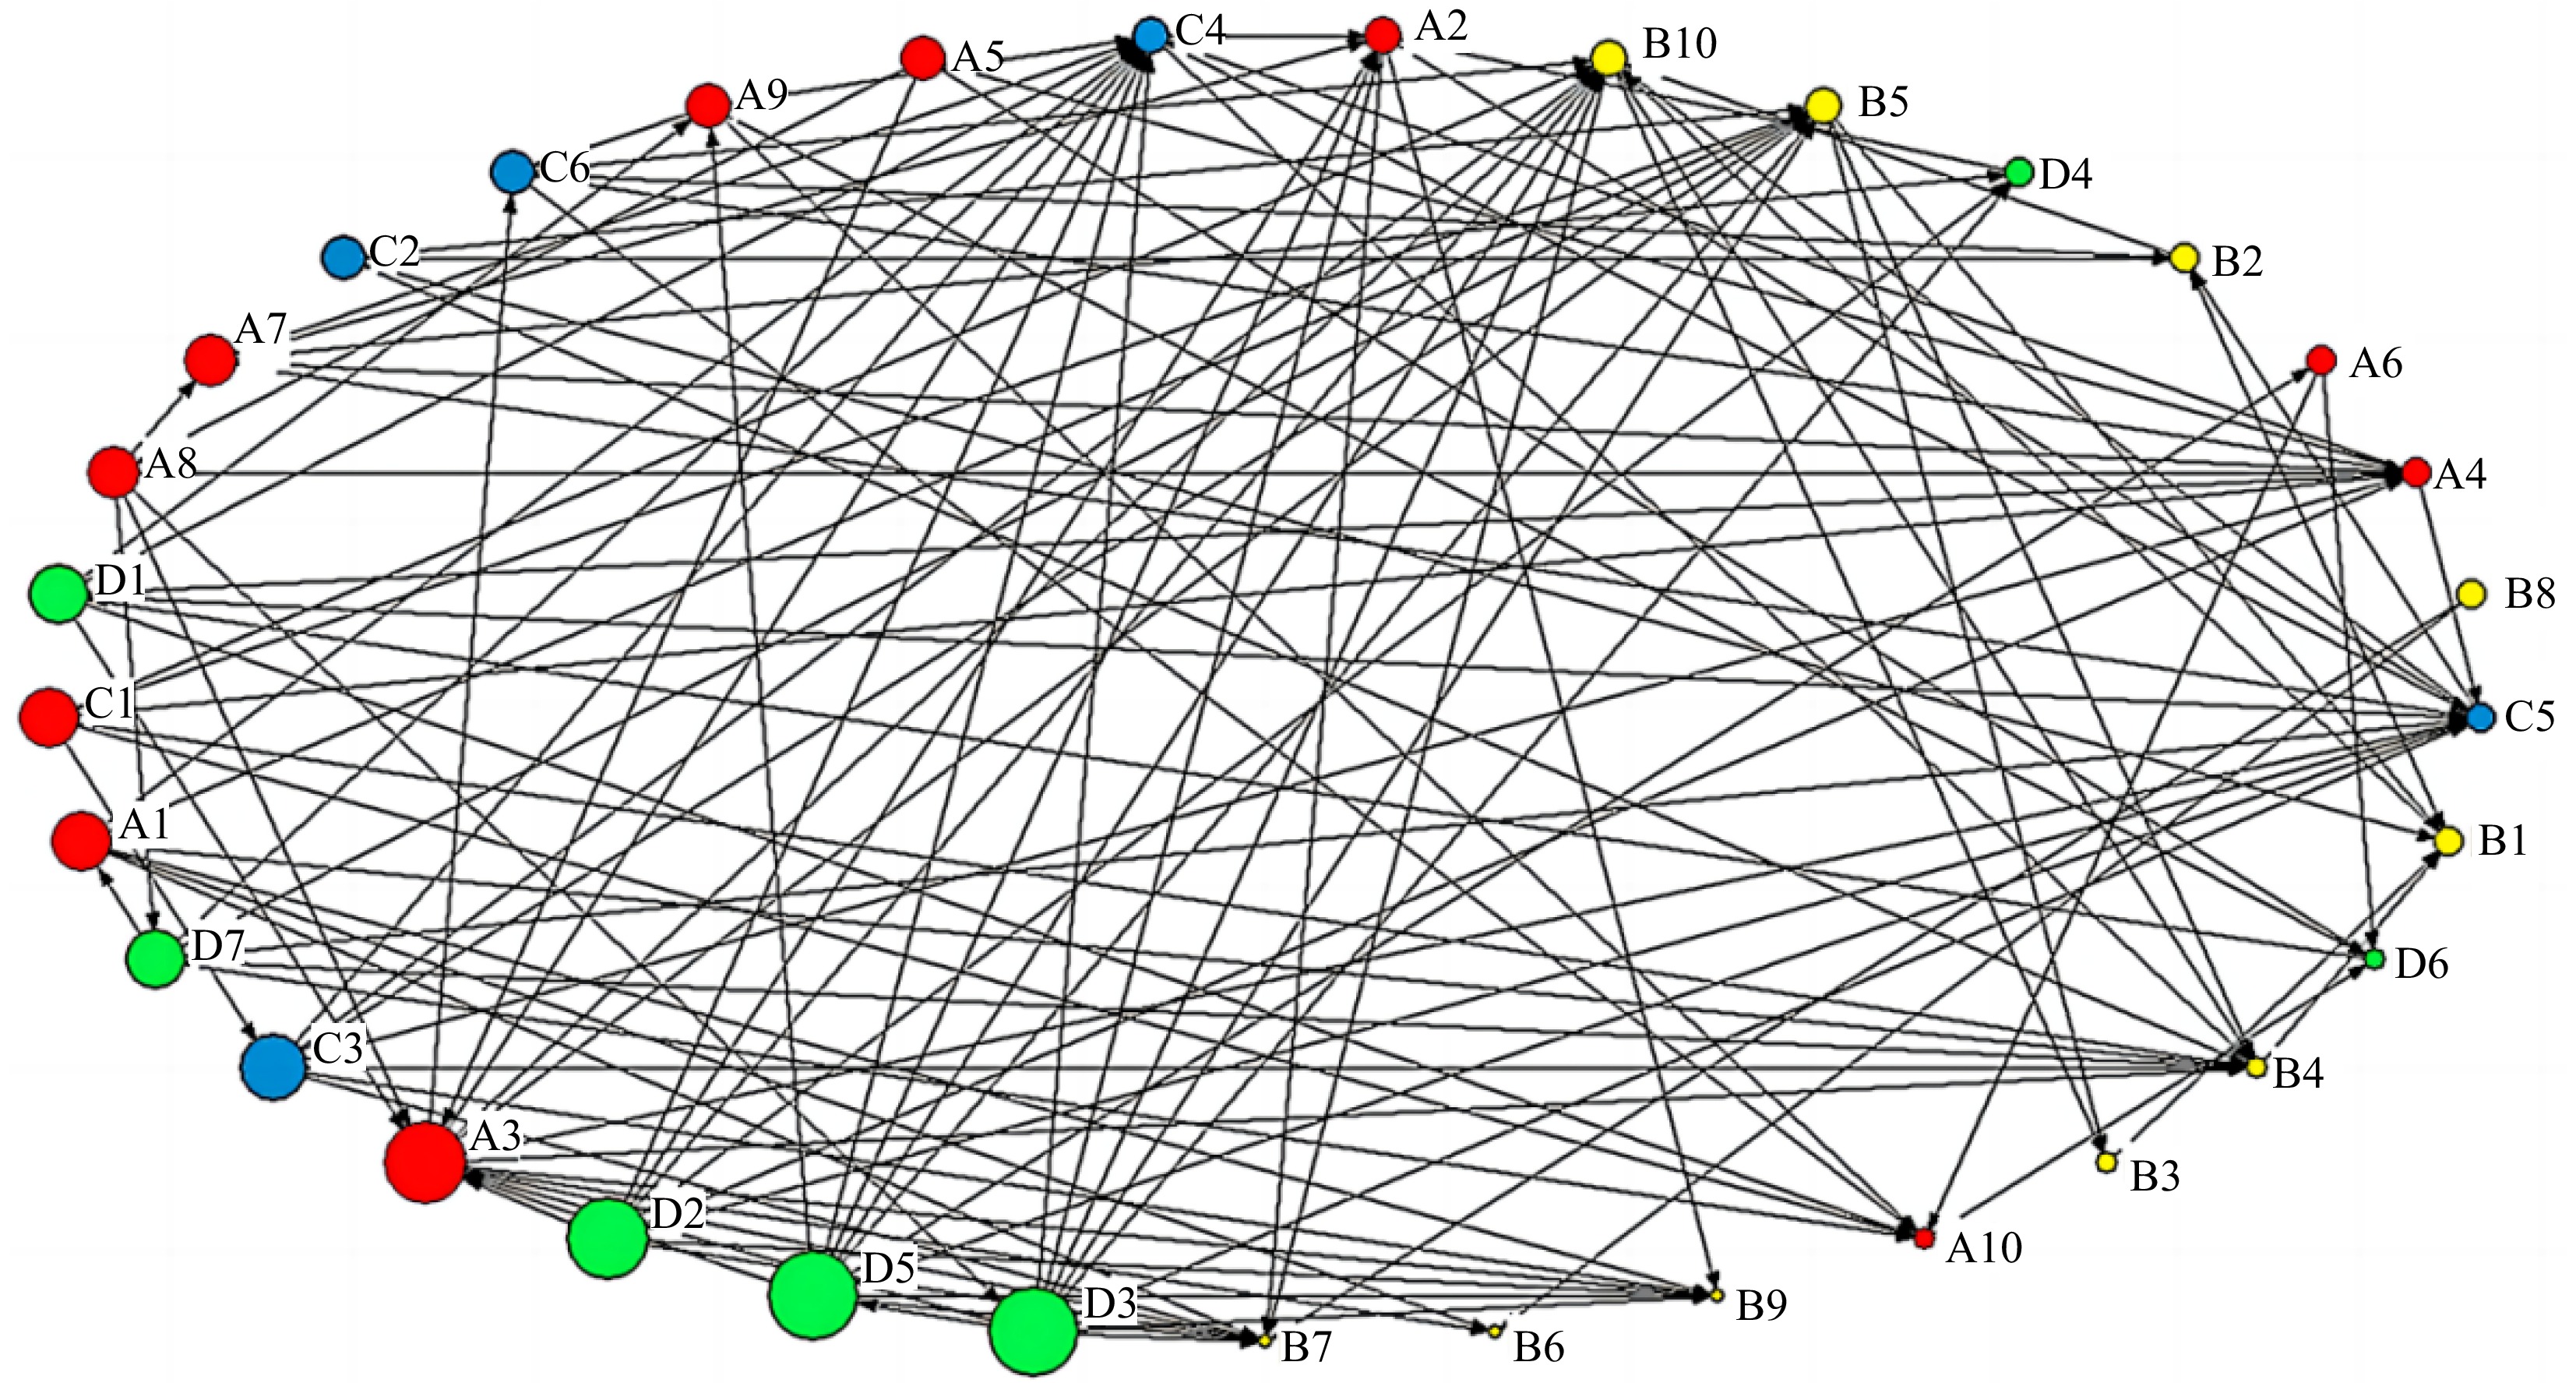
Figure 4.
Node degree in the network.
As evident from Fig. 4, improper maintenance (A3) has the highest total value for improper maintenance, followed by unclear or missing signage (C4) and equipment aging and wear (B10). While these risk factors share high total values, the nature of their impact differs. The elevated total values for B10 and C4 primarily stem from their high in-degree, indicating that B10 and C4 act as central nodes influencing other factors.
To provide a more intuitive analysis of the degree centrality of each risk factor, the UCINET visual analysis function was employed to input the degree and degree centrality data of the nodes. Resulting in the visual network map of the out-degree centrality of nodes presented in Fig. 5.
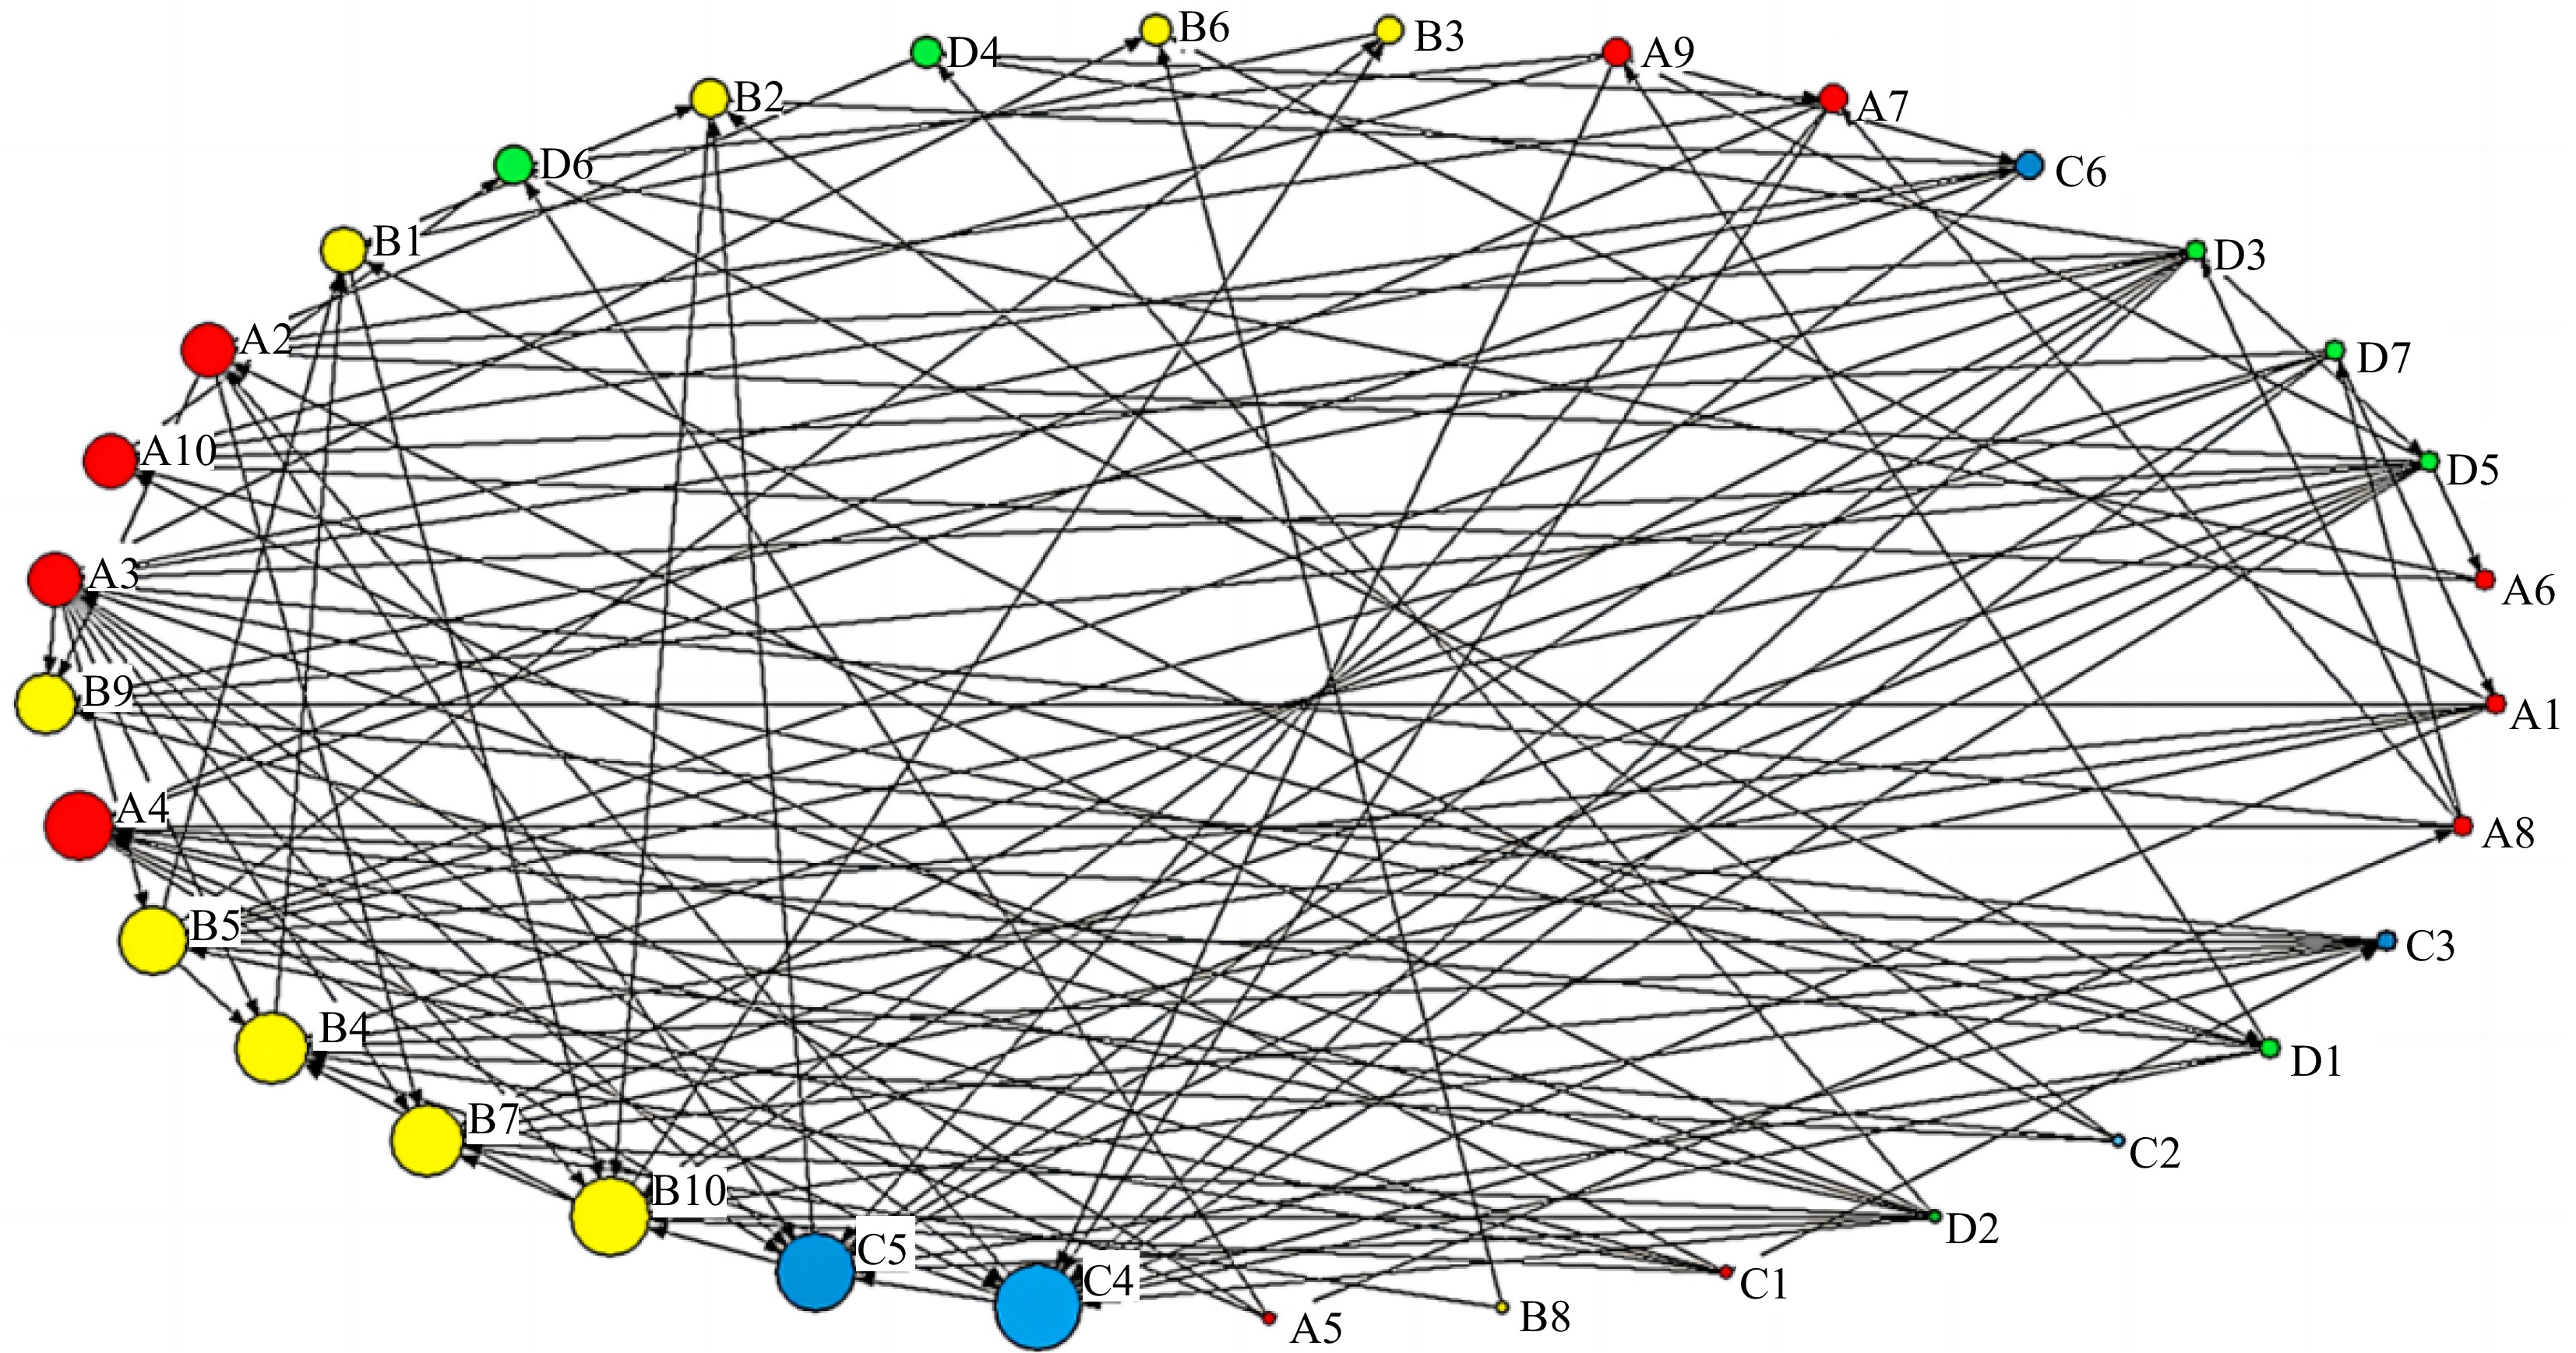
Figure 5.
Node out-degree visualization network.
Table 7 displays the top six risk factors for out-degree in the gas pipeline leakage risk network model. The results in the table indicate that the six risk factors with the highest out-degree centrality are Failure to implement rules and regulations (D3), Insufficient employee training and education (D5), Incomplete rules and regulations (D2), Improper maintenance (A3), Natural disasters (C3), Inadequate awareness and education of surrounding residents (D7). In the risk network model, these six nodes hold the greatest influence. They can impact other nodes and create risk coupling, where risk factors related to management make up as much as 66.7% of the total. To break the link between risk factors, one should concentrate on these critical nodes, controlling and managing the main risk factors to lessen their influence on other components.
Table 7. The top six risk factors for out-degree.
Ranking Number Risk factor Classification Out-degree 1 D3 Failure to implement rules and regulations Management factor risk 10 2 D5 Insufficient employee training and education Management factor risk 10 3 D2 Incomplete rules and regulations Management factor risk 9 4 A3 Improper maintenance Human factor risk 9 5 C3 Natural disasters Environmental factor risk 7 6 D7 Inadequate awareness and education of surrounding residents Management factor risk 6 Figure 6 presents the visual network map of node in-degree centrality in the gas pipeline leakage risk network model.
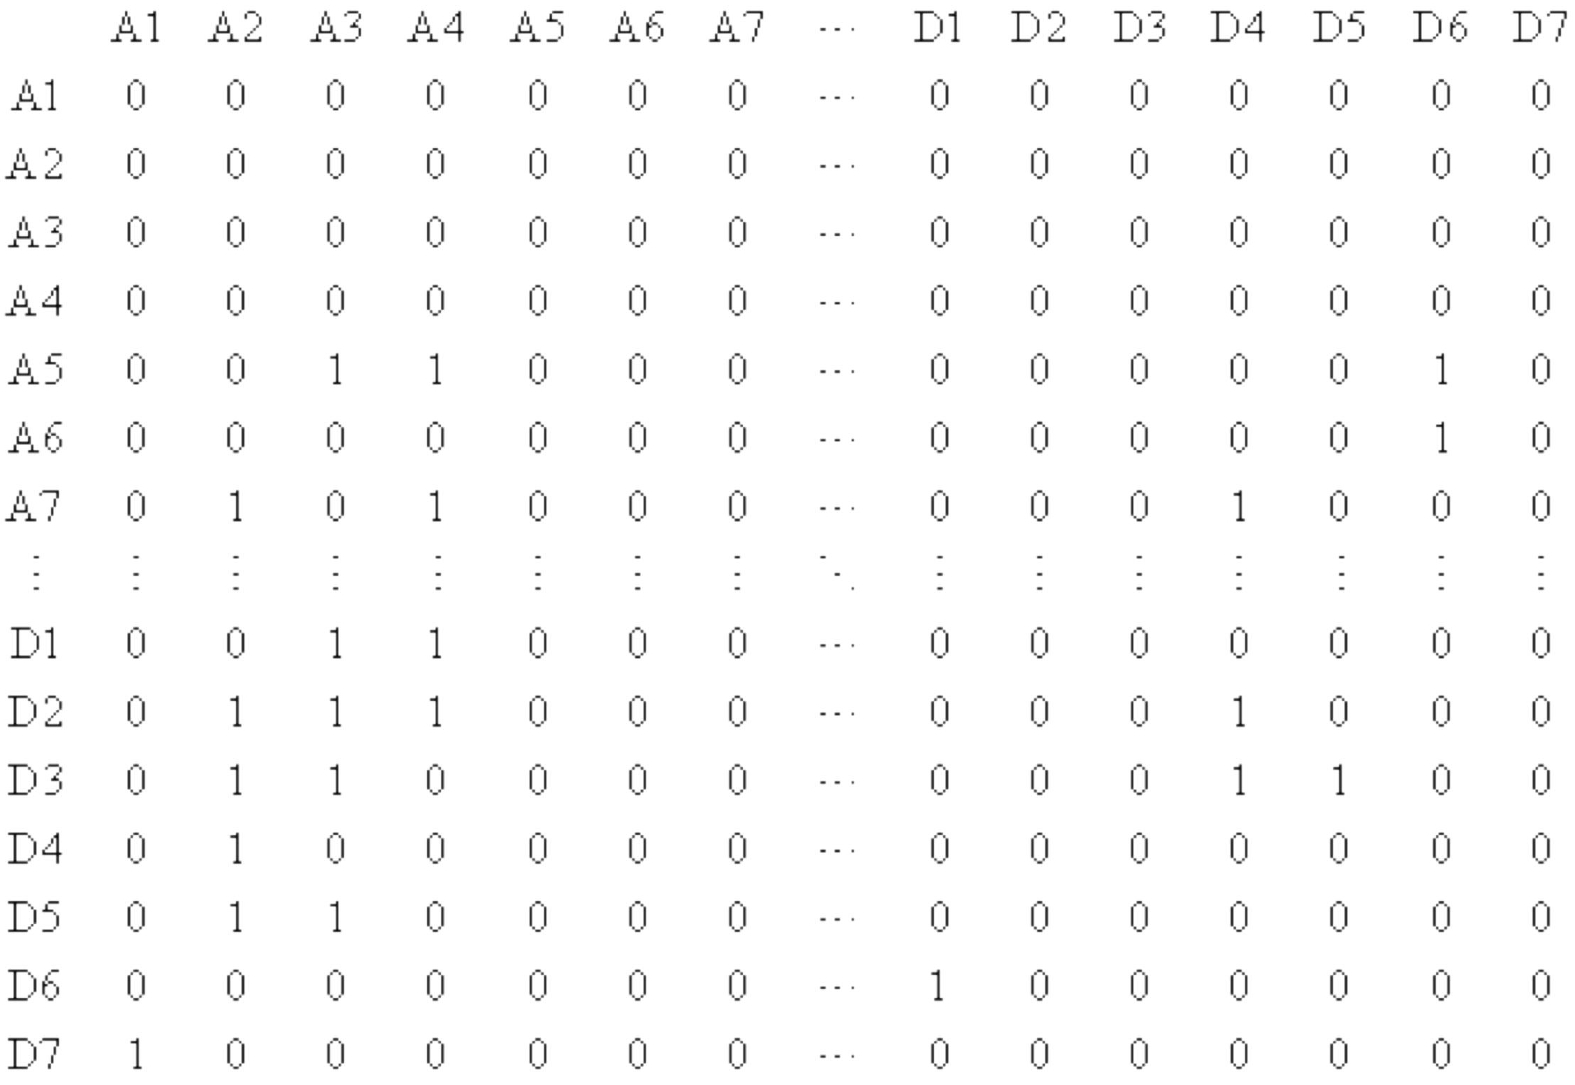
Figure 6.
Node in-degree visualization network.
Table 8 outlines the top six risk factors based on in-degree centrality in the gas pipeline leakage risk network model. The table shows that the six risk factors with the highest in-degree centrality are Unclear or missing signage (C4), Unauthorized occupation of ground space (C5), Equipment aging and wear (B10), Equipment failures (B7), Failure of external protective layers (B4), Failure of electrical protection (B5). Among these six risk factors, four are related to equipment risks and two to environmental risks. The in-degree centrality of these top six factors accounts for 44.8% of the total in-degree. By concentrating on the nodes that are susceptible to external influences, risk factors can be strengthened in their defensive capacity against such influences, thereby decreasing the likelihood of risk factor coupling and increasing the gas pipeline system's resilience to risks.
Table 8. The top six risk factors for in-degree.
Ranking Number Risk factor Classification In-degree 1 C4 Unclear or missing signage Environmental factor risk 11 2 C5 Unauthorized occupation of ground space Environmental factor risk 10 3 B10 Equipment aging and wear Equipment factor risk 9 4 B7 Equipment failures Equipment factor risk 9 5 B4 Failure of external protective layers Equipment factor risk 9 6 B5 Failure of electrical protection Equipment factor risk 8 Among the 33 risk factors, the top six in terms of the total degree value are as follows:
(1) A3 - Improper maintenance;
(2) C4 - Unclear or missing signage;
(3) B10 - Equipment aging and wear;
(4) C5 - Unauthorized occupation of ground space;
(5) D3 - Failure to implement rules and regulations;
(6) B5 - Failure of electrical protection.
Risk factors with high total degree values are considered key nodes in the multi-factorial coupling network of gas pipeline leakages. During the operation of the pipelines, it's important to manage and control these key nodes specifically, thereby reducing the connectivity of the network. This targeted approach aims to decrease the coupling of risk factors, ultimately minimizing the potential for accidents within the network. Based on these findings, a decision analysis is carried out with an emphasis on the system's major risk variables for the safety management and control of the gas pipeline system.
(1) Improper maintenance:
Improper maintenance is one of the main causes of leakage accidents, and maintaining equipment in good condition is essential for ensuring the safe operation of pipelines. Inadequate and delayed maintenance, as well as possible harm from staff operating equipment incorrectly while it is being maintained, are all examples of improper maintenance. Failure to promptly detect these issues may create accident hazards or lead to further escalation of accidents. Pipeline companies should establish equipment inspection and maintenance systems that clearly define responsibilities, establish supervision and reward/punishment mechanisms, and ensure the implementation of these systems. To improve field personnel's professional technical competence and safety awareness, safety education and professional skills training should be provided.
(2) Unclear or missing signage:
There have been numerous cases of accidents during construction due to unclear or missing signage. Gas pipeline signage should comply with local laws and regulations, and pipeline companies should improve signage along the pipeline. Signage may become illegible due to human damage or exposure to weather, leading to oxidation and blurred text. To make sure that the signage along the pipeline is complete, intact, and readable, routine inspections should be carried out.
(3) Equipment aging and wear:
The key to dealing with equipment aging and wear is the timely identification of problems. For example, if the anti-corrosion coating of a pipeline is not maintained promptly due to excessive service life, it may result in a more severe loss of external protection, resulting in cathodic protection failure and accelerated pipeline corrosion. Pipeline companies should strictly enforce inspection and testing regulations for pipelines, conduct regular maintenance, and establish relevant records. Equipment with quality issues should be replaced promptly, and potential hazards should be eliminated promptly.
(4) Unauthorized occupation of ground space:
Long-term encroachments on pipelines by structures, equipment, or debris can cause ground settlement, leading to uneven stress on the pipeline and resulting in loose connections, deformation, fractures, and other issues. Pipeline companies should strengthen daily inspections, promptly report any unauthorized encroachments, and remove illegal encroachments promptly. Additionally, incentivizing surrounding residents to participate in supervision and preventing encroachments on gas pipelines through reward policies can also be effective.
(5) Failure to implement rules and regulations:
After creating strong norms and guidelines, appropriate reward and punishment systems should be implemented. The application of regulations and norms should be supervised, and inspections should be conducted in strict accordance with the reward and punishment systems. Management personnel of pipeline companies should attach importance to the implementation of regulations and rules and emphasize this during training and education. A positive safety culture should be cultivated, and a strong sense of responsibility among practitioners should be fostered to actively implement relevant regulations and rules.
(6) Failure of electrical protection:
The failure of electrical protection in gas pipelines is a significant cause of pipeline corrosion. Ensuring that the pipeline's electrical protection system is in normal operation is key to ensuring the safe operation of gas pipelines. Pipeline companies should strengthen the monitoring, inspection, and maintenance of the electrical protection system, monitor the operation status of the anti-corrosion coating and cathodic protection, nip pipeline corrosion in the bud, and prevent its further deterioration.
-
This study integrates the N-K model with complex network theory to examine the interrelated risk factors in gas pipeline leakage incidents, yielding notable insights. However, the analysis recognizes certain limitations that warrant further exploration:
(1) The identification of risk factors about gas pipeline leakages in this investigation drew upon an extensive review of literature, publications, and case studies. Nonetheless, it is feasible that certain risk aspects might be inconspicuous or not given adequate consideration in routine pipeline operations, thereby leading to incomplete risk assessments. Moreover, factors critical in the escalation of leakage incidents into severe disasters—such as the site of ignition, volume of leaked gas, and the ignition energy—have substantial impacts. These factors not only significantly influence the emergency but also present considerable challenges in detection and management. Their coupling dynamics are intricate and require more in-depth investigation.
(2) Analyses in extant reports on gas leakage accidents often focus predominantly on the immediate causes, with a lack of emphasis on underlying indirect factors. Consequently, the risk couplings derived from such case studies are not exhaustive. It is imperative to develop a more holistic approach that encompasses both direct and indirect causes, thereby providing a more comprehensive account of risk factors in pipeline leakages.
(3) The study of node degree in the network can be utilized to assess the accuracy of the importance of network nodes in theory. However, in practice, controlling risk factors in urban gas pipeline systems is more complicated than simply identifying crucial nodes in a network.
-
In conclusion, this paper undertakes a systematic analysis of gas pipeline leakage risk factors. The N-K model is employed for quantitative analysis, revealing that a higher degree of coupling among risk factors corresponds to increased overall risk. Muti-factor coupling is identified as the most risky form. Then constructing a complex network model for the quantitative analysis of second-order risk factors. Node degree analysis identifies key nodes in the multi-factor coupling network, including improper maintenance (A3), unclear or missing signage (C4), equipment aging and wear (B10), unauthorized occupation of ground space (C5), failure to implement rules and regulations (D3), and failure of electrical protection (B5). To enhance pipeline operation safety, these key nodes should be the primary focus, reducing network connectivity and minimizing the coupling of risk factors. The objective is to prevent leakage incidents and ensure the safe operation of gas pipelines.
Controlling the critical risk factors associated with natural gas pipeline leakage incidents holds paramount significance in practical terms. Firstly, this initiative serves as an effective means to diminish the occurrence probability of natural gas pipeline leaks, thereby mitigating the environmental and safety risks posed to individuals. Secondly, by effectively managing these key risk factors, it becomes possible to enhance the safety and reliability of natural gas pipeline transportation systems, thereby ensuring the stability of natural gas supply and sustaining energy provision. Moreover, the strategic control of these pivotal risk factors can lead to a reduction in post-accident economic losses and environmental contamination levels. Consequently, this approach contributes significantly to minimizing the socio-economic impact of disasters, thereby safeguarding public interests and societal stability.
-
The authors confirm contribution to the paper as follows: study conception and design: Ding JS, Han XF, Ni L; data collection: Ding JS; analysis and interpretation of results: Ding JS; draft manuscript preparation: Ding JS. All authors reviewed the results and approved the final version of the manuscript.
-
The data that support the findings of this study are available in the Ministry of Emregency Management of the People's Republic of China . These data were derived from the following resources available in the public domain: https://www.mem.gov.cn/.
-
The datasets generated during and/or analyzed during the current study are available from the corresponding author on reasonable request.
-
The authors declare that they have no conflict of interest.
- Copyright: © 2024 by the author(s). Published by Maximum Academic Press on behalf of Nanjing Tech University. This article is an open access article distributed under Creative Commons Attribution License (CC BY 4.0), visit https://creativecommons.org/licenses/by/4.0/.
-
About this article
Cite this article
Ding J, Han X, Ni L. 2024. Research on multi factor coupling accident triggering mechanism and accident risk control of gas pipeline leakage. Emergency Management Science and Technology 4: e009 doi: 10.48130/emst-0024-0010 

Research on multi factor coupling accident triggering mechanism and accident risk control of gas pipeline leakage
- Received: 07 February 2024
- Revised: 25 March 2024
- Accepted: 03 April 2024
- Published online: 07 May 2024
Abstract: In the domain of gas pipeline operations, significant safety hazards prevail. This study delves into the triggering mechanisms behind gas pipeline leakage incidents, pinpoints key risk factors contributing to these occurrences, and proposes effective control measures. By classifying risk coupling forms associated with various accidents, the N-K model formula is utilized to assess the coupling degree of primary risk factors. The resultant coupling relationship is integrated into the University of California at Irvine NETwork (UCINET), forming a complex network model for quantitative analysis. Secondary risk factors' coupling degrees are measured, and the network's characteristic parameters are scrutinized. Noteworthy risk factors within the network include improper maintenance (A3), unclear or missing signage (C4), equipment aging and wear (B10), unauthorized occupation of ground space (C5), failure to implement rules and regulations (D3), and failure of electrical protection (B5). By controlling the above risk factors, disrupting the coupling process of risk factors, and blocking the transmission pathways of risk factors, the objective is to prevent leakage incidents and ensure the safe operation of gas pipelines.
-
Key words:
- Gas pipeline leakage /
- Risk coupling /
- N-K model /
- System dynamics /
- Complex network theory