


-
The chemical industry, as one of the fundamental sectors in China, has experienced a significant rise in safety accidents. Statistics show that between 2016 and 2020, the chemical safety production situation in China is not optimistic[1]. According to the life cycle theory of chemical products, chemical products often go through five stages: reaction and production, output, waste disposal, transportation, and storage[2]. During the production stage, operations are conducted under high temperatures and pressures due to the flammable, explosive, and drug-manufacturing properties of the chemicals involved. Accidents occurring at this stage can pose a serious threat to public safety[3].
Accident briefings often record important information and contain a wealth of professional knowledge. This information is instrumental in comprehending the precursors of accidents and primary causes, playing a vital role in accident prevention and control[4,5]. Traditionally, the analysis of historical accident briefings relies on mathematical statistics. For instance, Wang et al. employed statistics to analyze hazardous chemical accidents in China's chemical industry during the 1989−2019 high temperature season, focusing on accident locations, types, involved chemicals, and occurrence links. This research offered scientific recommendations for safely storing combustible substances during the summer[6]. In analyzing the 'Tianjin Port dangerous chemical explosion accident', statistical analysis indicates that the causative factors of chemical accidents can be classified into four categories: human factors, equipment and technology factors, external environmental factors, and management factors[7]. However, employing statistical methods necessitates careful sample selection based on sampling theory to minimize errors in conclusions. The challenge of obtaining reliable data in accident analysis can significantly impact research credibility. Furthermore, mathematical statistics often only scratch the surface of accidents, potentially overlooking deeper connections between causative factors and patterns[8]. Consequently, scholars are increasingly turning to data mining for analyzing extensive accident briefing data, uncovering hidden information, actual values, or rules[9]. Data mining technology has yielded positive outcomes in various areas of accident report analysis. For example, Castro & Kim used the decision tree method to explore the effects of different causative factors on the risk level of traffic accidents, and found that the causative factors involving people and road conditions often lead to traffic accidents with serious consequences[10]. Kim et al. took multiple features as synthetic targets to process and analyze the traffic accident briefings[11]. Moreover, data mining has also been employed to analyze 500,000 collected traffic accident briefings to identify correlation rules between driver errors and accident severity[12]. In the field of chemical accidents, data mining techniques have also produced some results. In the study conducted by Niu Yi, data mining was applied to analyze accident briefing data from a chemical enterprise spanning 2010 to 2016. The LDA topic model was utilized to extract the causative topics from the briefing papers, revealing potential information within the dataset[13]. After collecting 109 investigation reports of chemical safety accidents from 2015 to 2020, Yang et al. used the Human Factor Analysis and Classification System (HFACS) to analyze the factors causing accidents, and concluded that human factors are often pivotal in the occurrence and evolution of accidents[14].
Data mining technology, compared to traditional statistical methods, enables the rapid and thorough extraction of accident information from briefings, aiding in the prevention and control of accidents. According to existing studies, it is understood that accidents are not isolated incidents[15]. Although injuries may appear to occur suddenly at a specific moment, they are the result of the interaction of multiple levels of causative factors. To effectively mitigate chemical production accidents and enhance enterprise risk management, this study extensively utilizes and analyzes gathered briefings on these incidents. Firstly, employing data mining and complex network modeling, we aim to find correlations between causative factors and accident patterns, seeking to identify key factors in the chemical production accident system. Subsequently, we leverage the briefings to generate time series data on chemical production accidents. Utilizing the SARIMAX model, accident trends were forecast, thereby aiding in the identification of periods with a higher incidence of accidents.
-
Research relies on data, and it is imperative to ensure both sufficient data volume and data validity. This study utilized crawler code to collect a total of 1,900 chemical production accident briefings from the official websites of emergency management agencies (bureaus) in different provinces of China, as well as the Chemical Accidents Information Website, spanning from 2012 to 2023. The collected accident briefing data encompass a diverse range of common accident types in chemical production processes. After the collection is completed, the information extraction work is carried out according to the content involved in the accident briefings. To meet the subsequent data mining and accident trend prediction research, the information extracted from the accident briefings includes three major categories: accident basic information, accident causative information, and accident consequence information, as shown in Table 1.
Table 1. Category of accident information extraction.
Category Information extraction content Basic information Times: years, months, season, time period. Corporations: nature of enterprise, industry, province. Addressees involved: operational phase, fixtures, type of hazardous chemical. Cause information Accident patterns: first accident, secondary accident. Causative factor layer: man, machine, environment, management. Consequence information Accident casualties: number of deaths, number of injuries. Classification of severity: fatal, injury, harmless. As can be seen from the collected accident briefings, chemical production accidents often lead to secondary incidents after the initial incident due to untimely control or other reasons, resulting in an expansion of the consequences. Therefore, in this study, in the process of extracting information from accident briefings, we consider dividing accident patterns into 'First Accident' and 'Secondary Accident', which represent the pattern of the initial incident triggered by the main causative factors in chemical production accidents and the pattern of the secondary incident generated by the interlocking of the initial incident, respectively. For example, in a specific briefing: 'At 23:10 on 27 February 2021, workers inhaled hydrogen sulfide gas while preparing to resume production at a chemical plant in Jilin, resulting in five deaths and eight injuries. The cause of the accident was found to be a failure of the power supply system in the workshop, which prevented the ventilation system from working properly. Consequently, hydrogen sulfide gas, released from high-level tanks on the third floor, couldn't be ventilated through the ventilation pipelines. This resulted in the release of hydrogen sulfide gas from the tank openings, spreading to the stairwell. Subsequently, a significant accumulation of hydrogen sulfide occurred in the stairwell, reaching lethal concentrations. An employee unknowingly passed through the stairwell and inhaled large quantities of hydrogen sulfide gas resulting in poisoning. During the resuscitation process, the poisoning incident occurred due to the failure of several people to wear protective equipment, which led to the expansion of the consequences'. In this specific briefing, the 'First Accident' is presented as a 'leak' and the corresponding 'Secondary Accident' is 'poisoning', due to the leakage of hydrogen sulfide gas. The First Accident and the Secondary Accident provide further insight into the occurrence pattern of chemical production accidents.
For the acquisition of causative factors of chemical production accidents, text mining was considered as a method to extract the causative factors extracted from accident briefings texts[16]. After text segmentation, vectorization and normalization of accident briefings texts, the text feature vectors are screened and similar or identical causative factors are merged, and a total of 55 representative causative factors of chemical production accidents are finally obtained from 1,900 accident briefings. By the accident causative factors 'MMEM' theory[17], the causative factors obtained from the above text mining are classified according to the four levels of human factors, equipment and technology, environment, and management. Then the accident causative factors under all the levels, as well as the First Accident patterns and Secondary Accident patterns are numbered, as shown in Table 2.
Table 2. Causative factors and patterns of chemical production accidents.
Layers Causative factors Human Improper or faulty operation (H01) Illegal changes in production processes or procedures (H10) Unauthorized welding operation (H02) Smoking violation (H11) Work without safety equipment (H03) Human-caused fires (H12) Violation of safety operating regulations (H04) Human-caused damage to equipment or piping (H13) Unauthorized use of equipment or raw materials that pose a safety hazard (H05) Failure to close valves promptly after operation (H14) Failure to carry out fire separation or clearance of flammable material prior to operation (H06) Unauthorized absence (H15) Incorrect or excessive addition of reaction materials (H07) Command error (H16) Failure to conduct safety tests prior to operating in a limited space (H08) Lack of specialized skills (H17) Operating equipment without appropriate qualifications (H09) Machine Equipment or system failure (Eq01) Equipment ageing leakage (Eq13) Circuit short or power supply system failure (Eq02) Equipment not equipped with electrostatic discharge device (Eq14) Pipe rupture (Eq03) Valve failure (Eq15) Problems with process or technology (Eq04) Heat or static electricity from mechanical friction (Eq16) Reaction kettle over-temperature or over-
pressure (Eq05)Material strength defects (Eq17) Tank rupture leak (Eq06) Clogged pipes (Eq18) Seal failure or ineffective sealing (Eq07) Failure of ventilation equipment (Eq19) Valve internal leakage (Eq08) Pump body failure (Eq20) Broken or disconnected pipe connections (Eq09) Boiler rupture (Eq21) Safety defects in equipment or failure of safety interlocking devices (Eq10) Flange leakage (Eq22) Loose or dislodged valve (Eq11) Collapse of support frame (Eq23) Seal dislodged or corroded (Eq12) Safety valve trip (Eq24) Environment High temperature exposure (En01) Ambient moisture corrodes equipment or reacts with substances (En04) Rainstorm (En02) Lightning fire (En05) Gale (En03) Cold temperatures (En06) Management Failure to rationalize storage according to the nature of the chemical (M01) Illegal handling of reaction gases or wastes (M05) Illegal business (M02) Failure to regularly service equipment (M06) Ventilation not switched on due to chaotic management (M03) Deficiencies in fire management (M07) Deficiencies in security management (M04) Insufficient training in emergency response capacity (M08) First
AccidentExplosion (FA01) Over-pressure (FA06) Fire (FA02) Object strikes (FA07) Poisoning (FA03) Fall from height (FA08) Leakage (FA04) Other (FA09) Over-temperature (FA05) Secondary Accident Explosion (SA01) Leakage (SA05) Fire (SA02) Object strikes (SA06) Poisoning (SA03) Fall from height (SA07) Blindly Rescue (SA04) No secondary accidents (SA08) Methods
-
As shown in Fig. 1, the steps of this study include the following. Based on the premise of the theoretical support of the above literature, this paper innovatively proposes to study chemical production accidents, which have a more complex accident mechanism, through data mining technology, complex network, and predictive modeling of time series data. Firstly, the association rules analysis is carried out by the Eclat algorithm, which seeks to explore the potential correlation between accident causative factors and accident occurrence patterns. Then, based on the results of association rule mining, this study constructs a network model of accident causative factors and determines the key causative factor nodes in a quantitative way through network centrality analysis. Finally, this study considers a more in-depth application of the collected chemical production accident briefings. As it is known from previous studies[6], there are certain seasonal characteristics of chemical production accidents, so this study considers the quarterly statistics of the proportion of accidents in each quarter to the total amount in the year (Accident-Percentage) and creates the chemical production time series data. Then, through a series of works: smoothing judgment, first-order difference processing, SARIMAX model selection and feasibility verification, model fitting, etc., the trend of chemical accidents in China in the coming period is predicated innovatively and provide data support for identifying the high-incidence period of accidents.
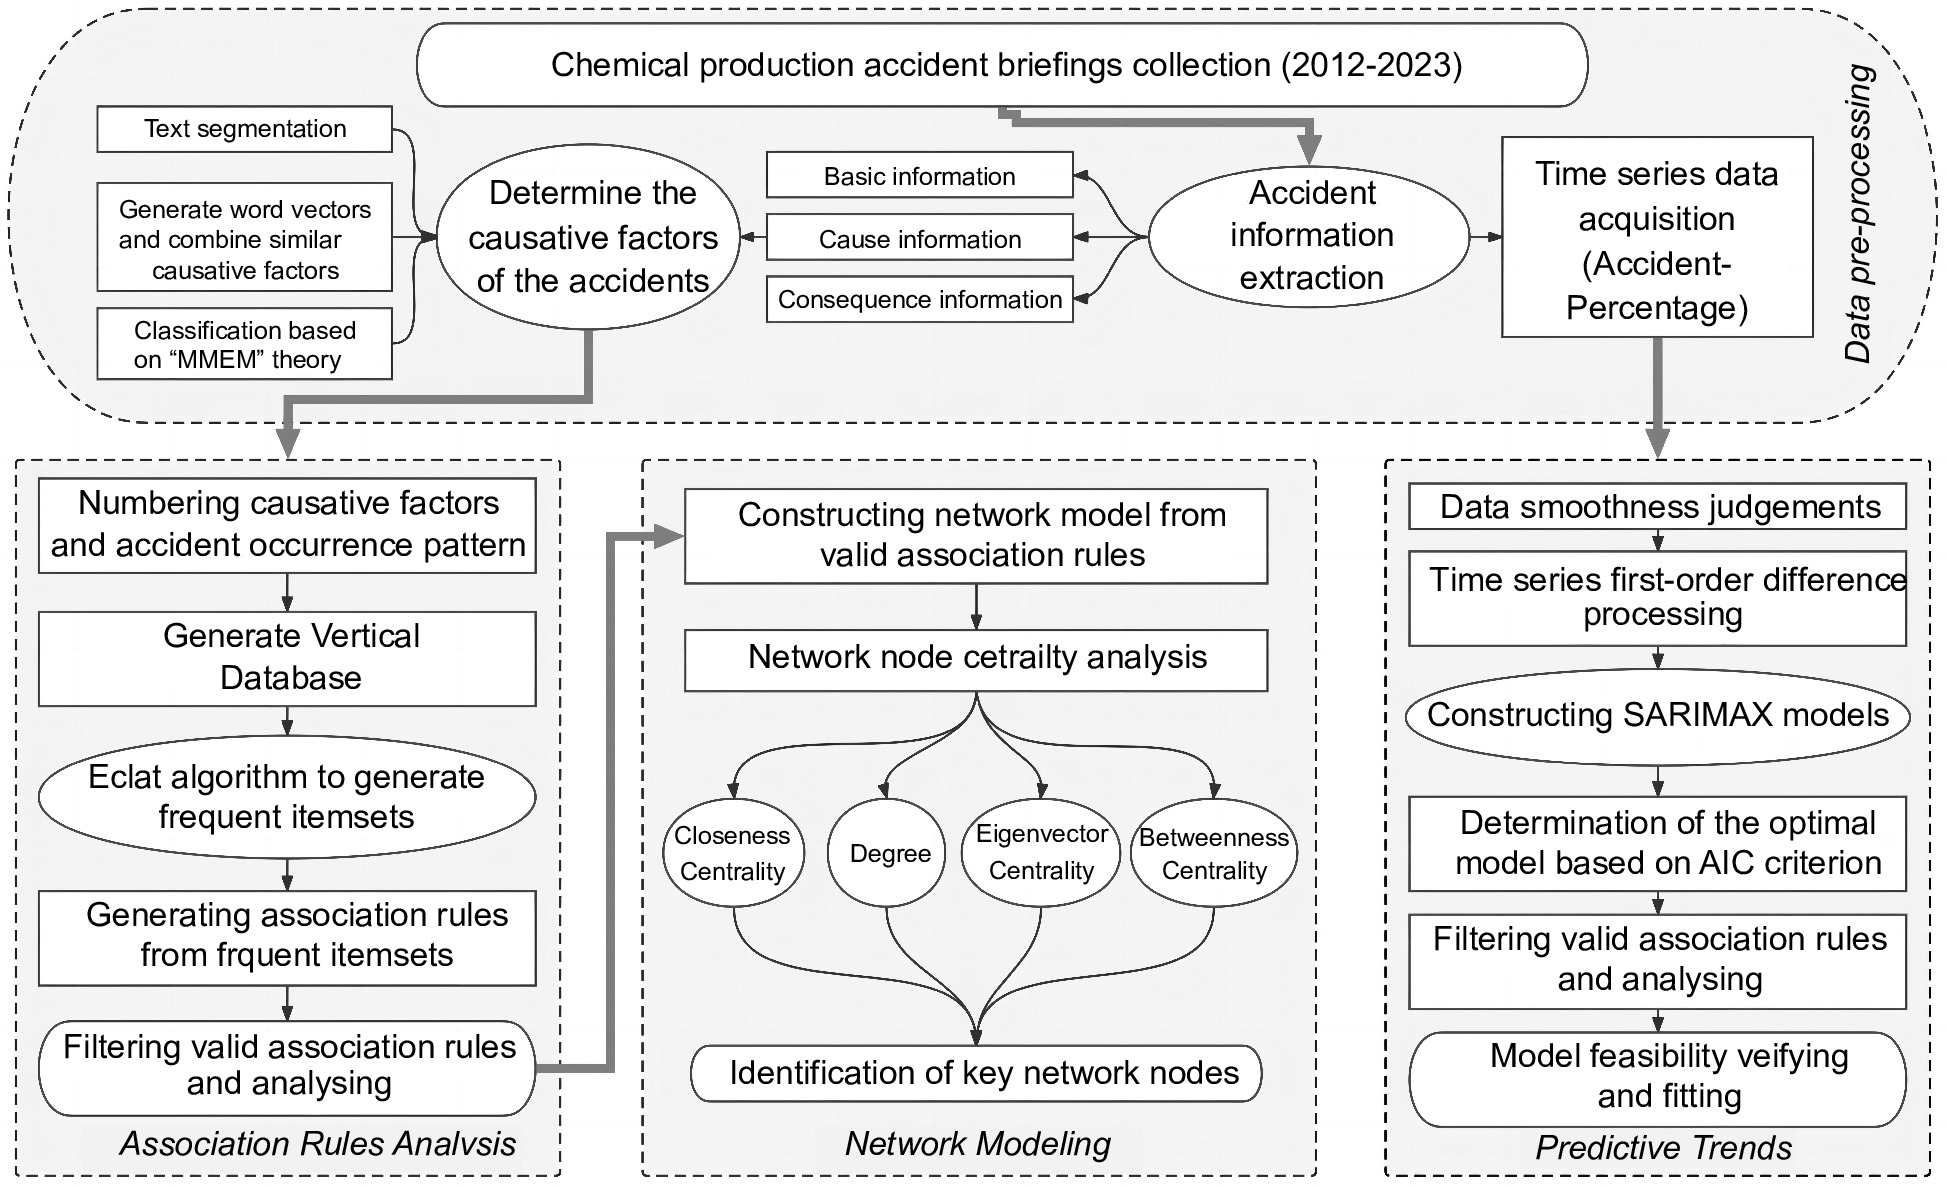
Figure 1.
Process of analyzing chemical production accidents based on data mining.
Association rule mining
-
Association rule mining is used to analyze the potential correlation between the antecedent and the consequent of a rule and to find the hidden information that cannot be obtained in traditional mathematical and statistical analysis. In this study, association rule mining technology is applied to chemical production accidents to analyze the correlation between the causative factors of accidents and the patterns of accidents. Through the association rules analysis, previously undiscovered or neglected information can be obtained from massive accident briefings, which can provide certain help for enterprises in the identification of hidden hazard sources, accident prevention, and control, it also provides data support for the construction of the accident causative factors network model.
The traditional Apriori algorithm performs well in handling small data sets, but with the expansion of the data volume, the Apriori algorithm needs to scan the data table several times, which takes up a large amount of computer hardware resources and generates association rules that are not ideal, and there are more invalid rules. In this paper, we consider using the Eclat algorithm for association rule mining to improve the efficiency and accuracy of association rule results. Compared with the traditional association rule algorithm, the Eclat algorithm adopts the new database structure of vertical data representation, applies the vertical database to store the data, and searches the frequent items based on the probability lattice theory by using the equivalence relationship based on prefixes to divide the search space into smaller subspaces[18]. The vertical database consists of items and all the transaction numbers (TIDs) that contain the items. Based on the chemical production accident dataset, the causative factor items and the accident occurrence pattern items counted above are integrated to construct the vertical database, as shown in the example in Fig. 2. Unlike the horizontally structured database used by the traditional Apriori algorithm, the vertical database is identified by items, and the Eclat algorithm avoids the problem of the large amount of time required for multiple I/O (Input/Output) operations by scanning each item[19].
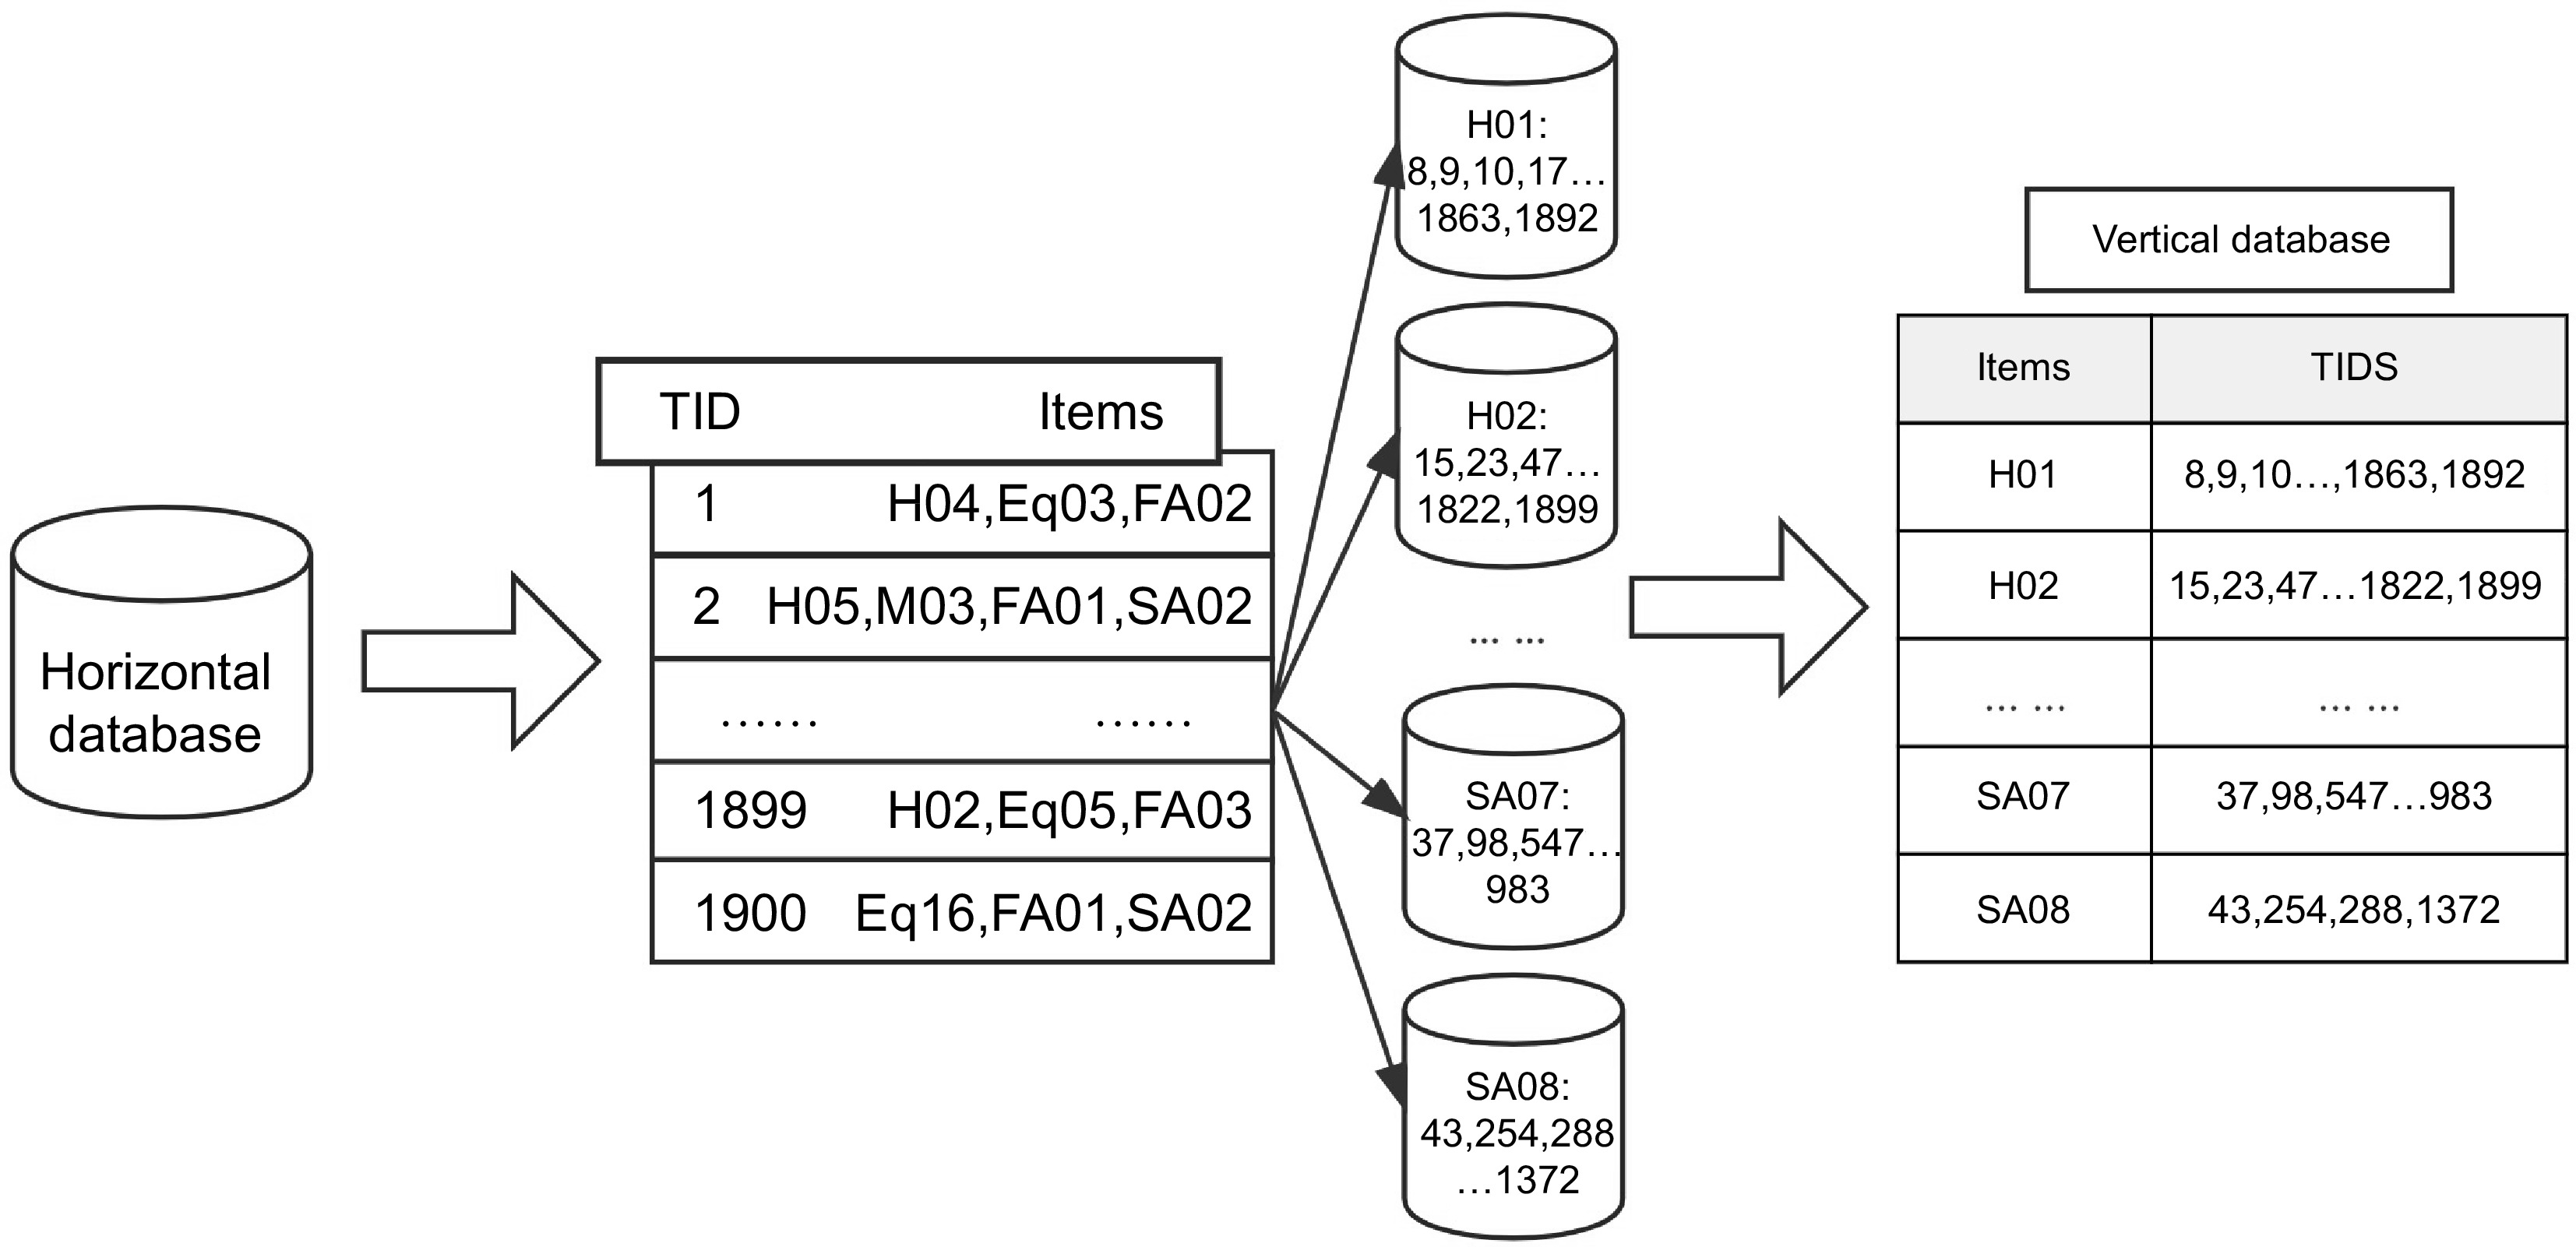
Figure 2.
Example of a vertical database.
The Eclat algorithm implementation consists of two main steps: 1) Scanning the vertical database to get the set of TIDs of all items and their containing transactions, and calculating the support of all items by modeling. A support threshold is set when performing association rule mining, and items less than the threshold are pruned (removed from the collection). After pruning is complete, then construct the frequent term set. 2) After the completion of the above, each item will be merged with all other items to get a new candidate set. And so on, keep iterating the operation to get all the candidate sets. Then do the intersection process according to the TIDs of the candidate sets to get the TIDs of the new candidate sets. If the support of the new candidate set is less than the threshold value, pruning is done again, and the cycle is repeated again[20].
Support and Confidence are used to evaluate the results of association rules. The Eclat algorithm needs to find out the rules whose support and confidence are greater than the preset threshold value, the higher the support of a rule indicates its higher universality, and the higher the confidence indicates the higher the credibility of the rule[21]. In addition to confidence value and support value, lift value can also provide an overall measure of a rule. The lift measures the correlation between the rule's antecedent and the rule's consequent. If the lift is greater than 1, it means that there is a positive correlation between the antecedent and the consequent, and the higher the lift, the more valuable the information provided by the rule, and vice versa for a negative correlation. Normally we consider that rule with a lift value greater than 1 to be a valid rule. Threshold determination has an important impact on the results of the association rule algorithm rule generation, due to the different values of the minimum confidence threshold and the minimum support threshold, there will be differences in the association rules generated according to the frequent item set[22]. If the threshold value is set too high, it may ignore some correlation rules of practical significance, which can often play a guiding role in accident prevention and control. If the threshold value is set too low, a large number of interference rules and some irrelevant rules will be generated. At present, the determination of the threshold value in the association rule analysis algorithm is usually calculated using the formula (1) and (2)[23]. The formula is related to the number of occurrences of the rule antecedent and the total number of associated rules. After calculation, this study finally determines that the minimum support threshold value is 0.015 and the minimum confidence threshold value is 0.25.
$ S upport\;\left(Q\right)=\dfrac{Number\;of\;accident\;which\;factor\;Q\;appears}{Total\;number\;of\;accident\;occurred} $ (1) $ Conf idence\;\left(Q\to R\right)=\dfrac{Support(Q\cup R)}{Support\left(Q\right)} $ (2) Network modeling of accident causative factors
-
The study of accident causative factors is often based on modeling. Zhang & Lowndes studied typical causative factors in gas protrusion accidents using fault trees[24]. Wu et al. used the 24-model to qualitatively analyze the causative factors of the major hazardous chemical explosion accident in Xiangshui in comparison with other models, which provided a common framework for companies and regulatory agencies to prevent hazardous chemical accidents[25]. Network modeling has a good track record in identifying important factors in a system. Complex relational network models can systematically analyze individual nodes within a network, quantifying where each node in the network is located in the network system, its impact on the nodes associated with it, and the degree of node criticality[26]. This study applies the relational network model to the analysis of chemical production accidents, constructs a network model of causative factors for chemical production accidents, and determines the key causative factors in the model through the analysis of network centrality, so as to understand the system of causative factors for accidents in a more comprehensive way.
In this study, Gephi software was used to generate complex network models. In the network model, the network layout adopts the random layout form, and the connection between nodes is set as a directed connection due to the existence of certain directionality between the causative factors and the accident occurrence pattern. In the network model, the node size indicates the frequency of the causative factor, and the greater the frequency, the larger the node. The node color depth indicates the sum of the connectivity of each node and the connectivity of each node, the larger the value the deeper the color. The thickness of the edge indicates the weight value of the enhancement of the association rule, the higher the enhancement the thicker the edge is. The color depth of the edges is determined by the connectivity of the nodes entering and exiting the network, the darker the color, the more important the position of the nodes entering and exiting the network is in the network.
To clarify the key nodes in the network model of causative factors of chemical production accidents, to put forward targeted prevention strategies, this paper applies Gephi software to analyze the centrality of network nodes and identifies the key nodes in the network. Based on the ranking of indicators such as Degree Distribution, Closeness Centrality Distribution, Betweenness Centrality Distribution, and Eigenvector Centrality, determine the key nodes in the network, and these nodes are the important causative factors in the chemical production accidents system. Degree Distribution can intuitively react to the status of a node in the network. The larger the node degree value, the more edges are connected into and out of the node, and the deeper the influence of the node on other nodes in the network. Closeness Centrality Distribution is used to measure the shortest distance from a node to every other node in its connected component. This concept is widely used in application scenarios such as the discovery of key nodes in the network. The value of Closeness Centrality, ranging from [0, 1], indicates that nodes with values closer to 1 are nearer to the center of the network. Betweenness Centrality Distribution is used to measure the probability that a node is in the shortest path between any two other nodes. The concept was first proposed by Linton in 1977, and is able to accurately calculate the nodes that play an important role as bridges and mediators between multiple parts of the network model. Eigenvector Centrality measures the influence of nodes on network transmission. Edges from high centrality nodes contribute more to the target node's centrality than edges from low centrality nodes, a target node having a high eigenvector centrality value means it is connected to many high centrality nodes[27]. Eigenvector centrality emphasizes the surroundings in which a node is located, for example, in a network model of causative factors and accident patterns, causative factor nodes with higher eigenvector centrality value are more likely to be closer to accident pattern nodes and need to be guarded against.
Prediction of chemical production accident trend
-
The essence of accident prediction in the chemical industry lies in conducting a quantitative analysis to evaluate prospective safety conditions. This analysis can be categorized into macroscopic and microscopic levels, depending on the prediction objectives. At the macroscopic level, historical accident data is analyzed through mining and forecasting techniques to identify general trends in accident occurrences. This process assists relevant departments in anticipating potential risks and supports the formulation of safety policies through robust data. At the microscopic level, the focus shifts to identifying specific latent hazards within a system, conducting quantitative predictions, and implementing measures to mitigate these hazards, thus enhancing system safety. The research presented in this paper is primarily grounded in the macroscopic level, employing scientific models to forecast general accident trends and periods of high incidence in the chemical industry.
A time series data is a set of data observed based on time (years, quarter, month, day, etc.). Time series data can be analyzed by fitting the appropriate model to forecast a future period. Generally speaking, time series analysis mainly includes two ways, one is to establish the mechanism of series generation by monitoring and capturing the formation pattern of the series; the other is to predict the possible development trend based on the manual acquired data. Auto regressive Integrated Moving Average Model (ARIMA) is a model commonly used for forecasting tasks on time series data, the main purpose of the model is to complete the description of the time series through a specific mathematical model and to predict future values based on historical data with historical inheritance characteristics and periodicity[28]. In the process of statistics of chemical production accidents, due to the existence of certain seasonal variation characteristics of time series data, this study considers the construction of Seasonal-ARIMA (SARIMA). The SARIMA model is usually expressed as SARIMA(p,d,q)(P,D,Q), where P is the number of seasonal auto regressive terms, D is the seasonal differencing term, and Q is the seasonal moving average term[29]; p is the number of auto regressive terms, q is the number of sliding average terms, and d is the differencing term. The mathematical expression of the SARIMA model is shown in formula (3), where yt is a non-stationary time series, ωt is a Gaussian white noise process, E,p(Bm), θQ(Bm) are seasonal moving average polynomials, and B is the backward shift operator[30].
$ E,p\left({B}^{m}\right){\varphi }_{p}\left(B\right)(1-{B}^{m}{)}^{D}(1-B{)}^{d}{y}_{t}={\theta }_{Q}\left({B}^{m}\right){\theta }_{q}\left(B\right){\omega }_{t} $ (3) In actual production, the occurrence of chemical production accidents is often influenced by certain external factors, such as the occurrence of major accidents, the revision of safety laws and regulations, and changes in the total output value of the chemical industry. The appearance of these external factors will have a certain impact on the number of chemical production accidents in a certain period. Therefore, this study constructs the SARIMAX model by introducing the exogenous variable X based on the original SARIMA model, which is an extension of the SARIMA model by adding exogenous variables through the correlation between predictor variables and response variables[31]. The format of the SARIMAX model is SARIMA(p,d,q)(P,D,Q)-AR(X), The components of X in this study include (the following indicators are weighted and summed): (1) Number of accidents of major and above level; (2) The quantification of the impact of the revision of the Law of the People's Republic of China on Production Safety; (3) The average value of the Petroleum and Chemical Industry Prosperity Index (PICP).
Applying the SARIMAX model for time series data prediction, firstly, we need to judge whether the collected time series data are smooth or not, and if they are not smooth, difference processing is required. The time series Auto Correlation Function (ACF) and Partial Auto Correlation Function (PACF) provide information about the lag period, and the model parameters can be selected based on the information provided by the ACF as well as the PACF plots[32]. The final model determination needs to be determined by relevant evaluation metrics, which commonly include low Schwartz-Bayes information criterion (SBIC), Akaike information criterion (AIC), and high adjusted R2 and least volatility (sigma 2)[31−33]. Among them, the AIC criterion is more widely used in the work of evaluating the effectiveness of model information extraction. Once the model has been determined, it is necessary to validate the feasibility of the chosen model, and once the model diagnostics are satisfactory, the fitted predictions can be made.
-
When the support and confidence thresholds are the same, the results of association rule mining by the Apriori algorithm and the Eclat algorithm under the same size dataset are shown in Table 3.
Table 3. Comparison of two algorithms.
Algorithms No. of rules generated No. of valid
rules (lift > 1)Time
(t/s)Apriori 167 49 87 Eclat 96 63 62 It can be seen that the Eclat algorithm can improve the efficiency of the algorithm by reducing the number of I/O. Compared to the Apriori algorithm which generates a large number of invalid rules, the Eclat algorithm generates a higher proportion of valid association rules to all the generated rules. The Eclat algorithm performs better on datasets with large amounts of data.
Analysis
-
Among the 96 association rules generated by the Eclat algorithm, the top 20 item sets with the highest frequency are shown in Fig. 3. We believe that an association rule with a Lift greater than 1 is regarded as a valid association rule, that is, the Lhs and Rhs of the rule are positively correlated. A total of 63 valid rules are retained for the 96 association rules after redundant rule deletion and deletion of rules with Lift value less than 1 and sorted these rules by Lift value from highest to lowest. There are four types of association rules represented in Fig. 4, and the visual representation of 63 valid association rules is shown in Fig. 5. Each point with a color represents an association rule, the size of the point is determined by the Confidence of the association rule, the larger the value, the larger the point; the color depth of the point is determined by the Lift value, the larger the value, the deeper the color.
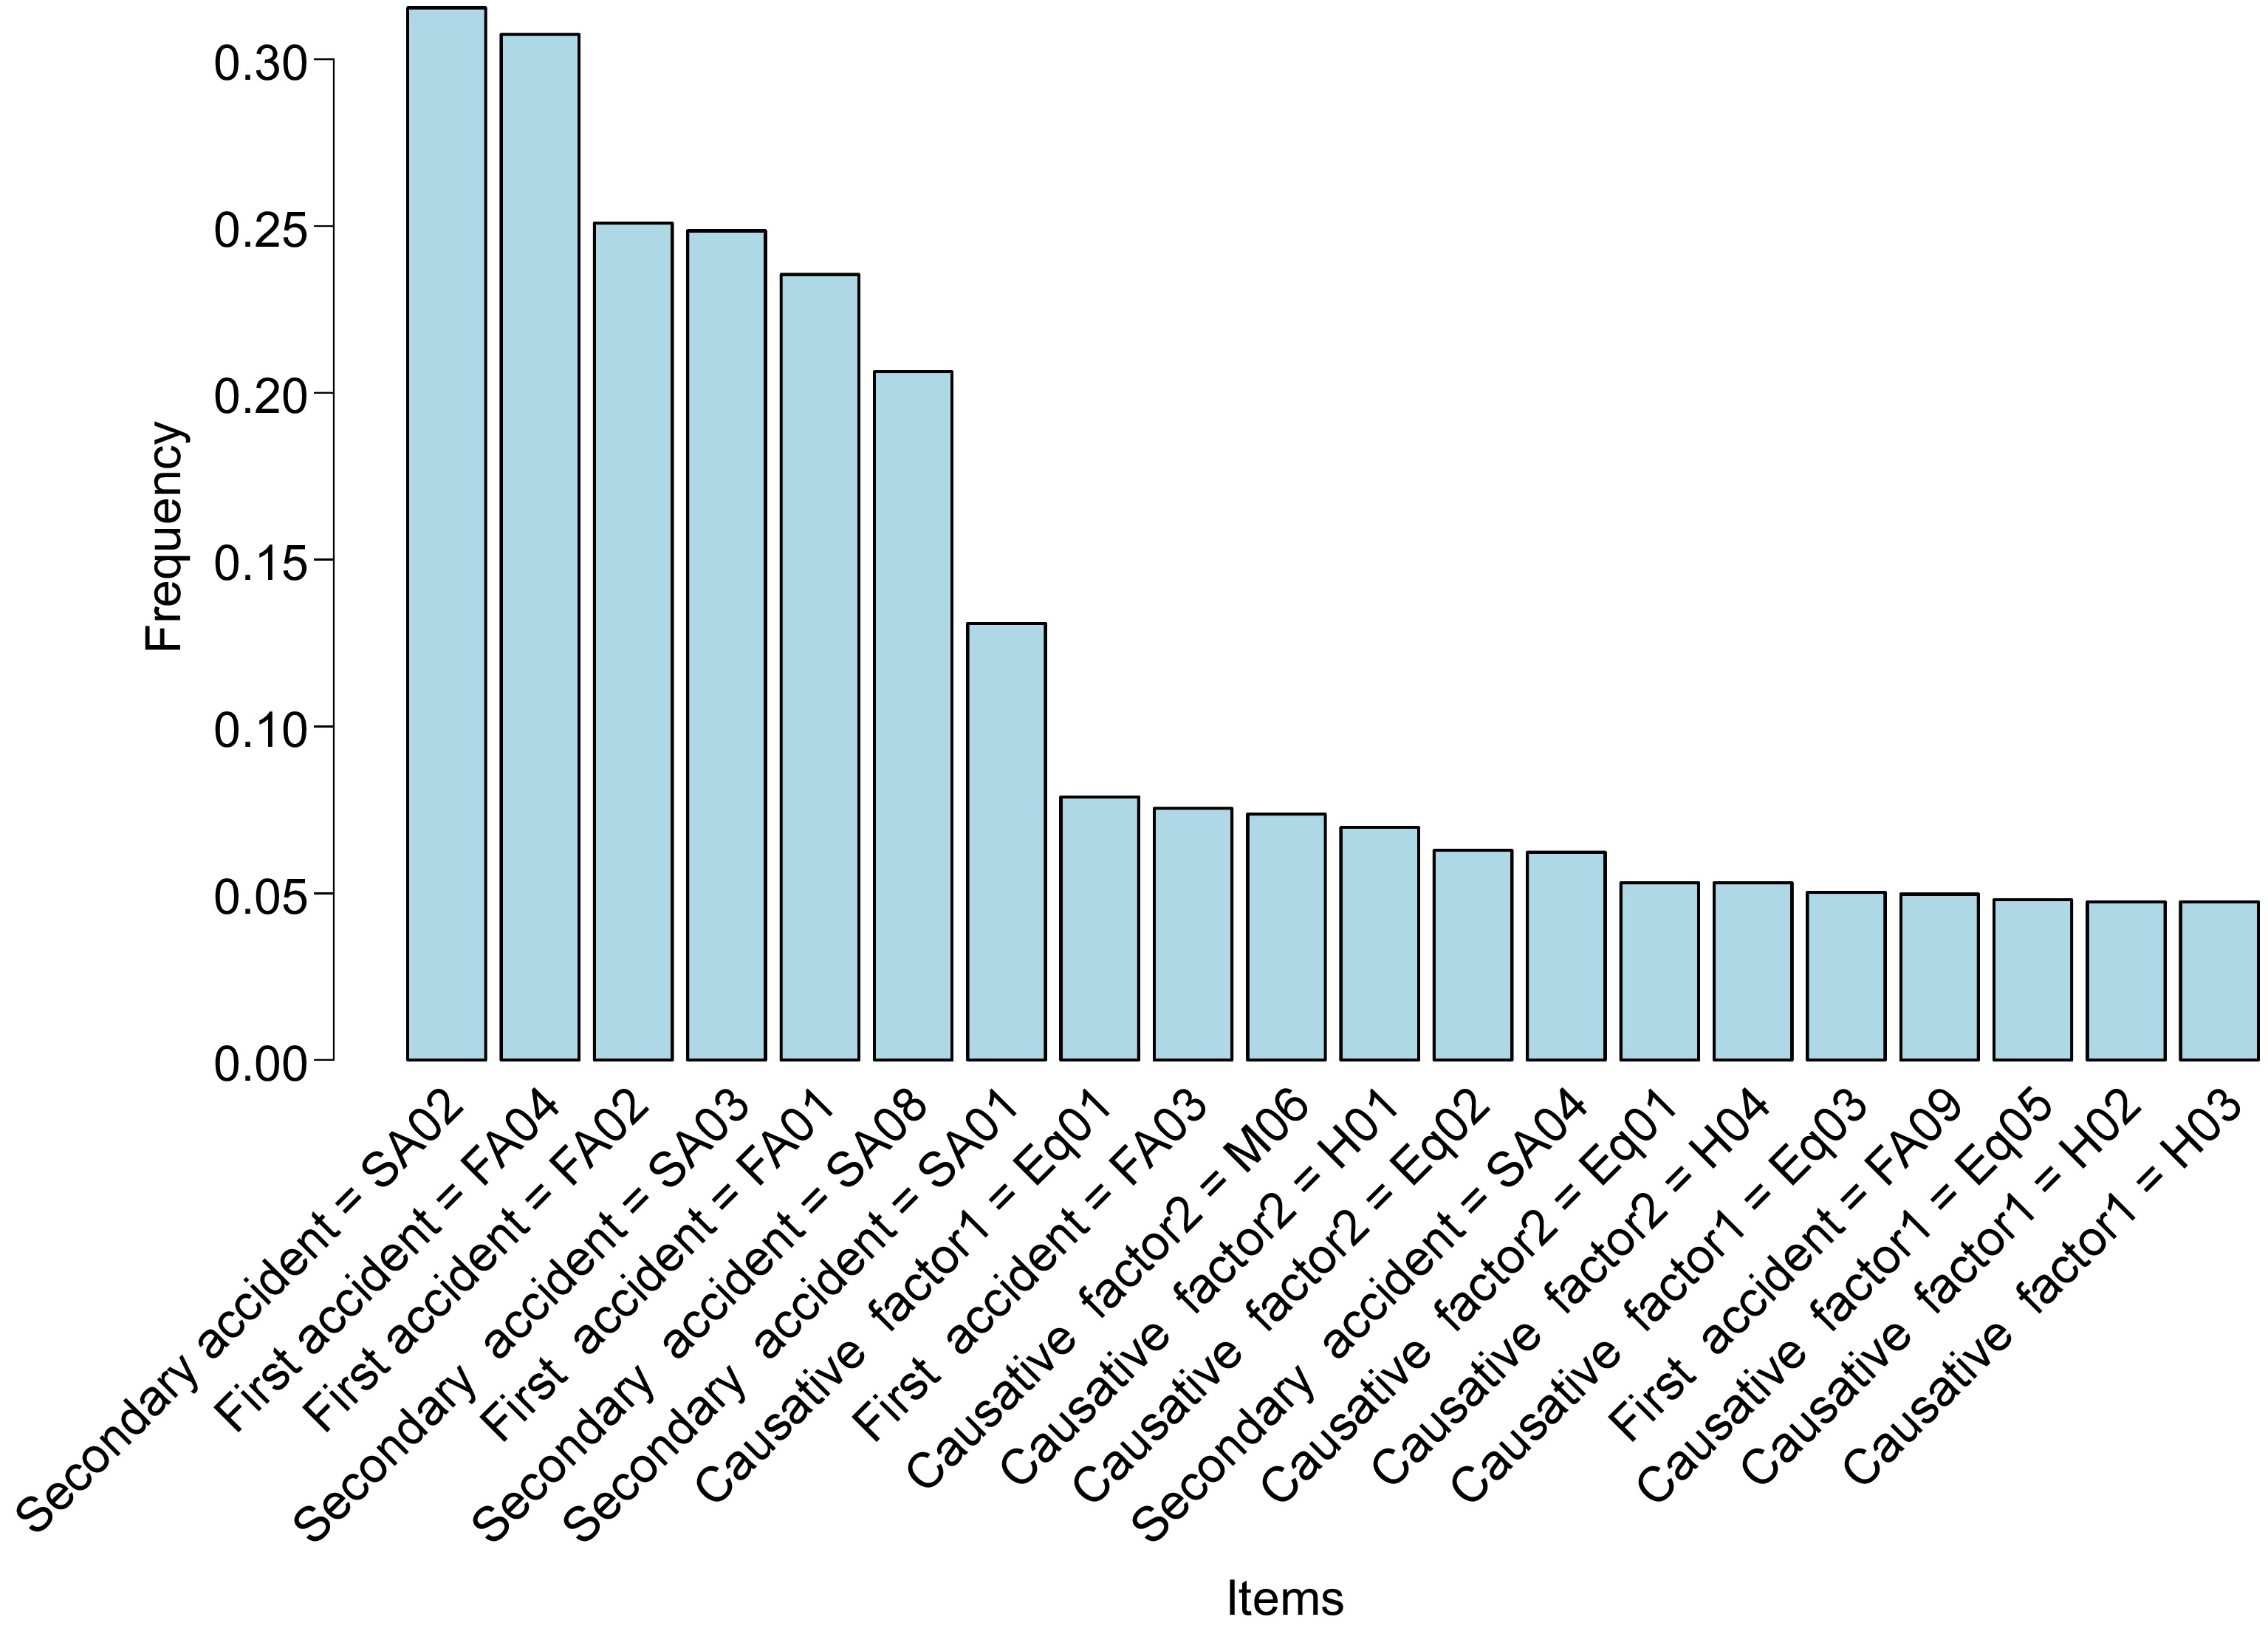
Figure 3.
Histogram of the top 20 frequency ranked items.
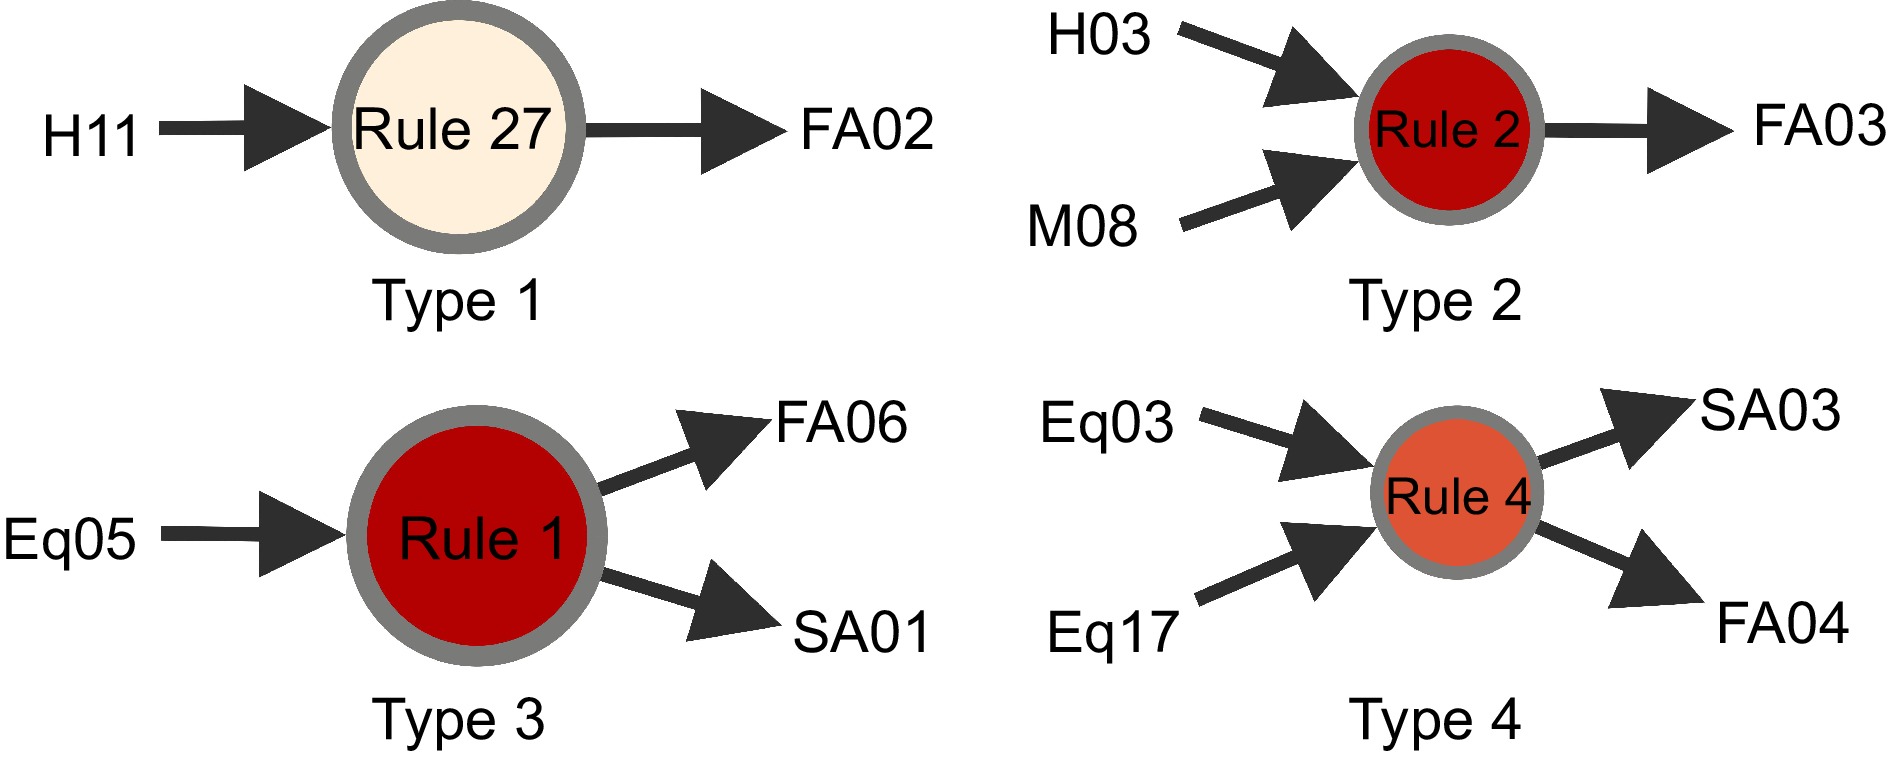
Figure 4.
Examples of different association rule types.
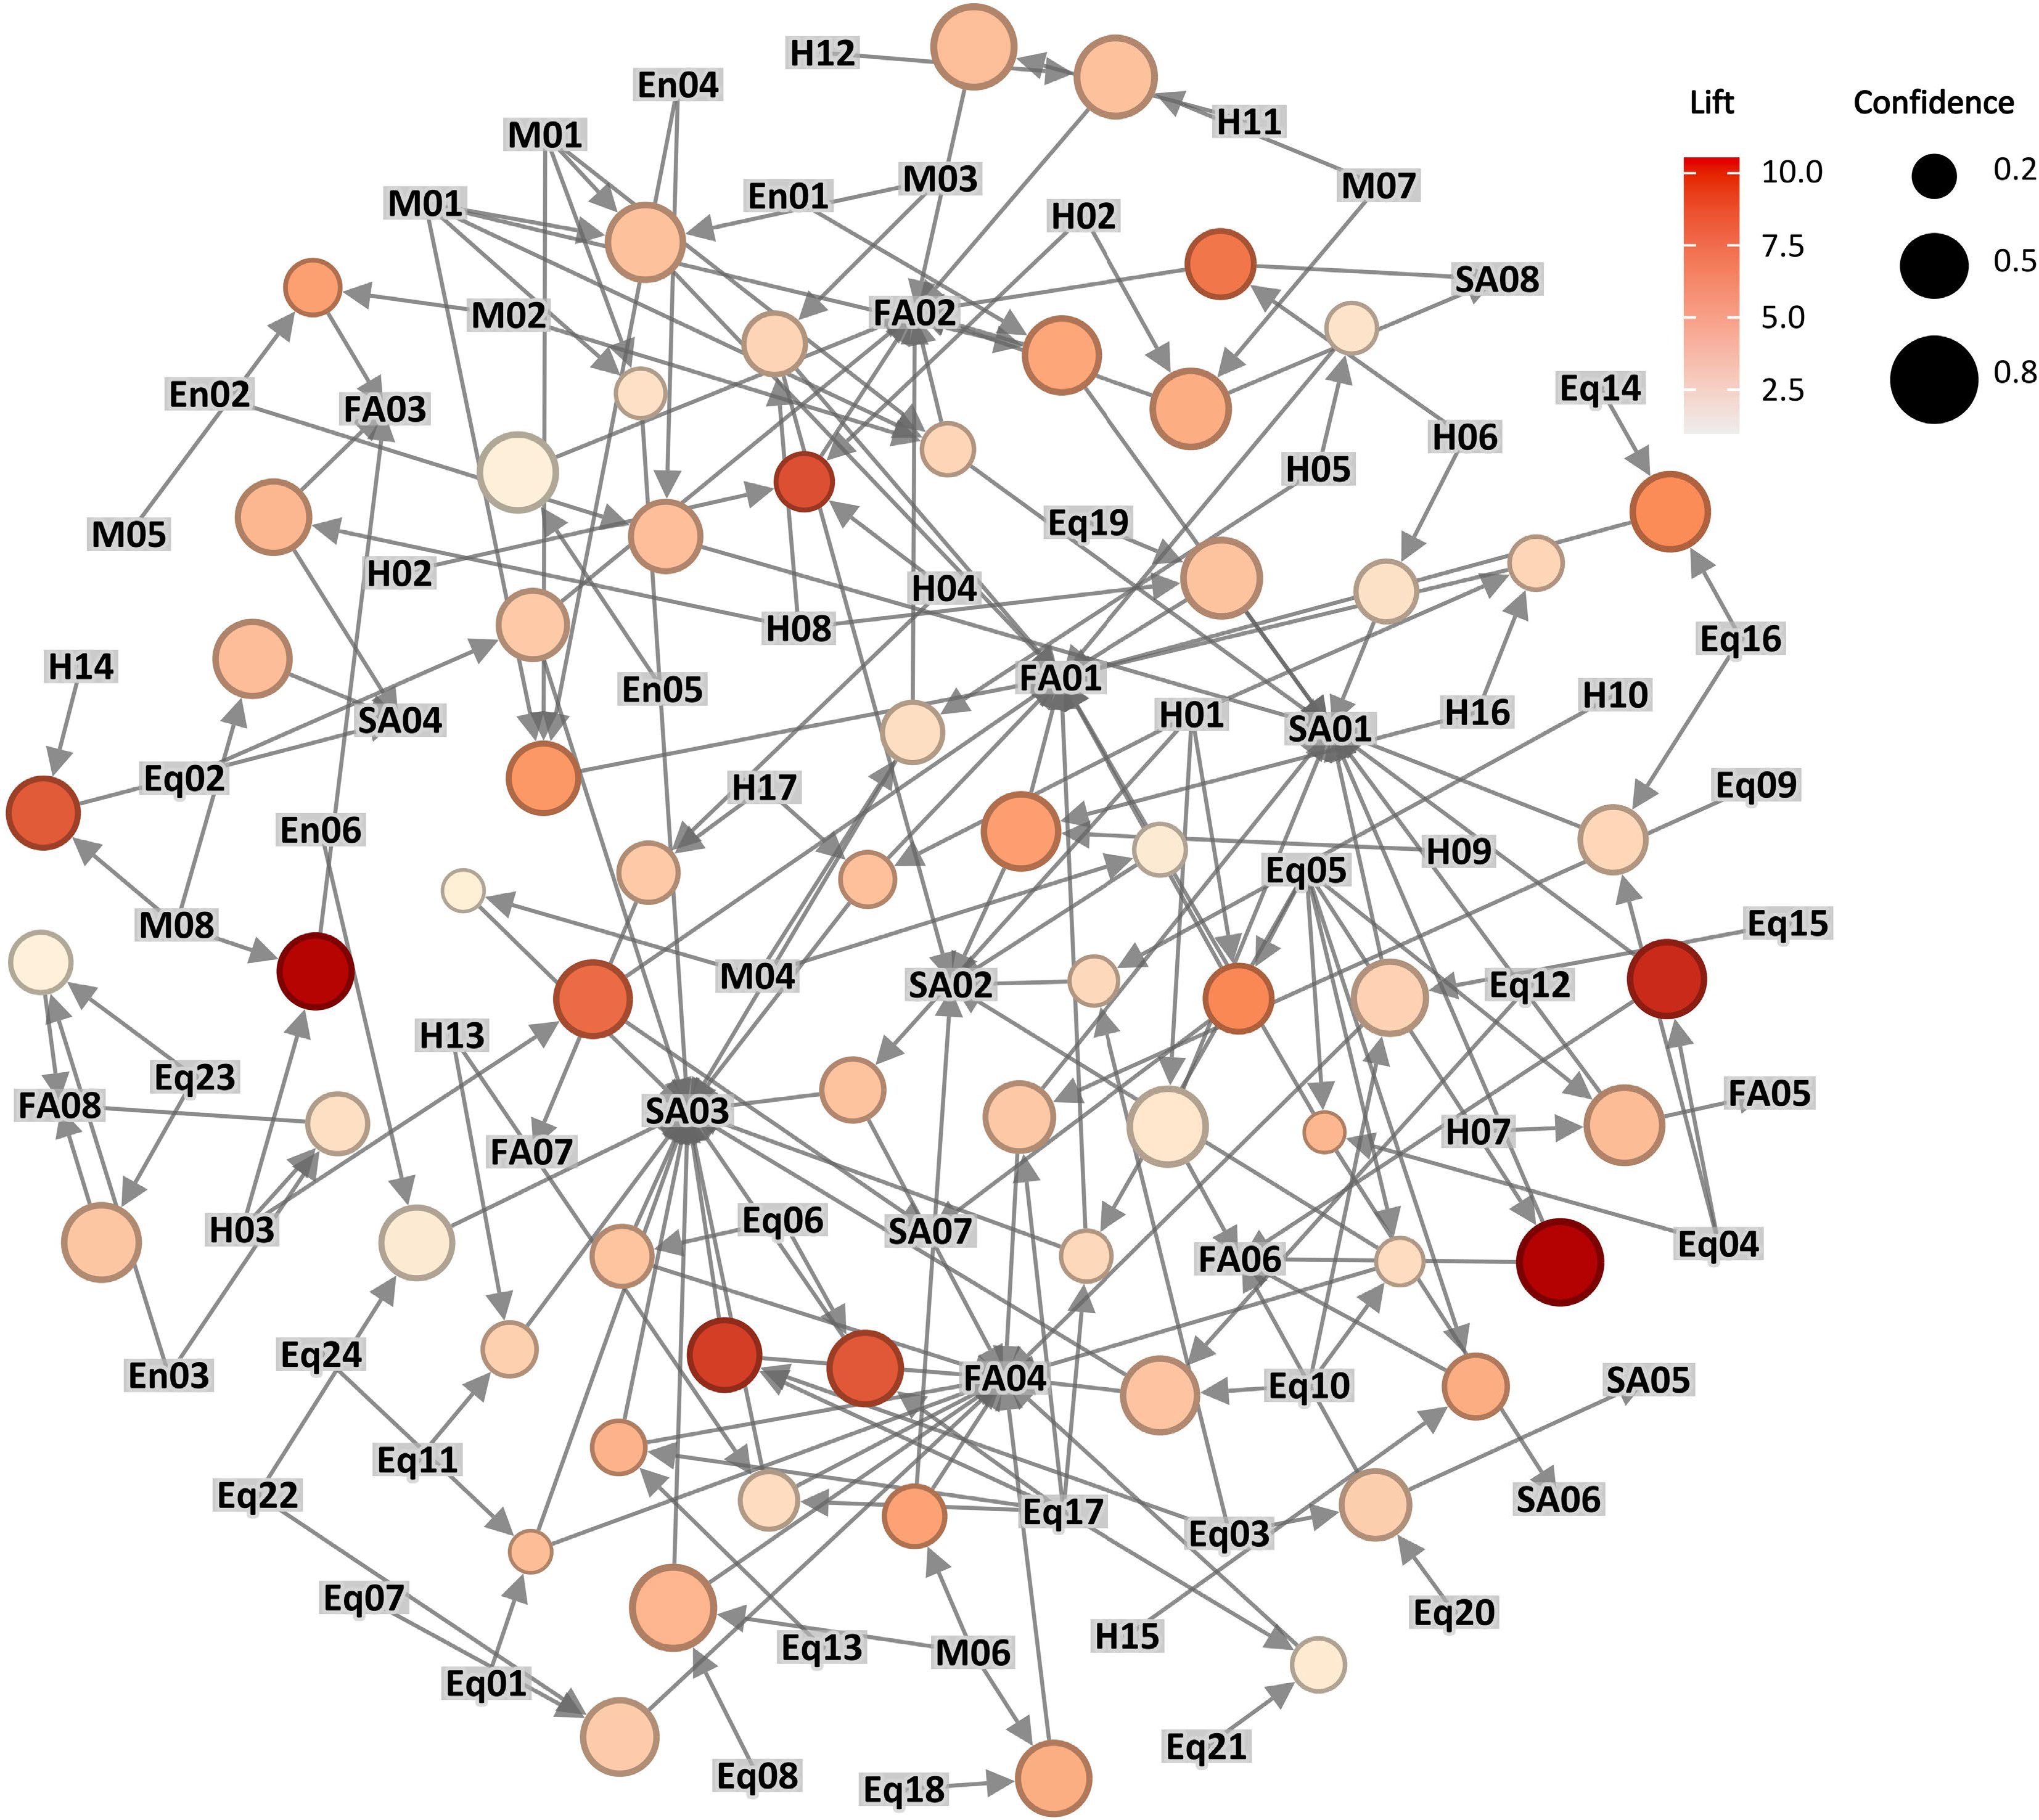
Figure 5.
Visualization of valid association rules.
The scatter plot of the distribution of Confidence, Support, and Lift values of the valid association rules is shown in Fig. 6. It can be seen that among the 63 valid association rules, there are results such as Rule 1−10 with very high Lift values, and most of the rules have Lift values of (2, 5), which is at a relatively high level, with high Lift values, indicating that these association rules have certain practical significance. Confidence values between (0.5, 0.8), indicate that the confidence of these association rules is at a high level, that is, the occurrence of the Lhs will have the occurrence of the Rhs. From the scatter plot, we can also see that in some association rules (e.g., Rule 5, 7, 11, 13, etc.), although the Support value is low, the Lift and Confidence values are high, that is, the frequency of these rules is low, but it is more credible and there is a certain practical significance.
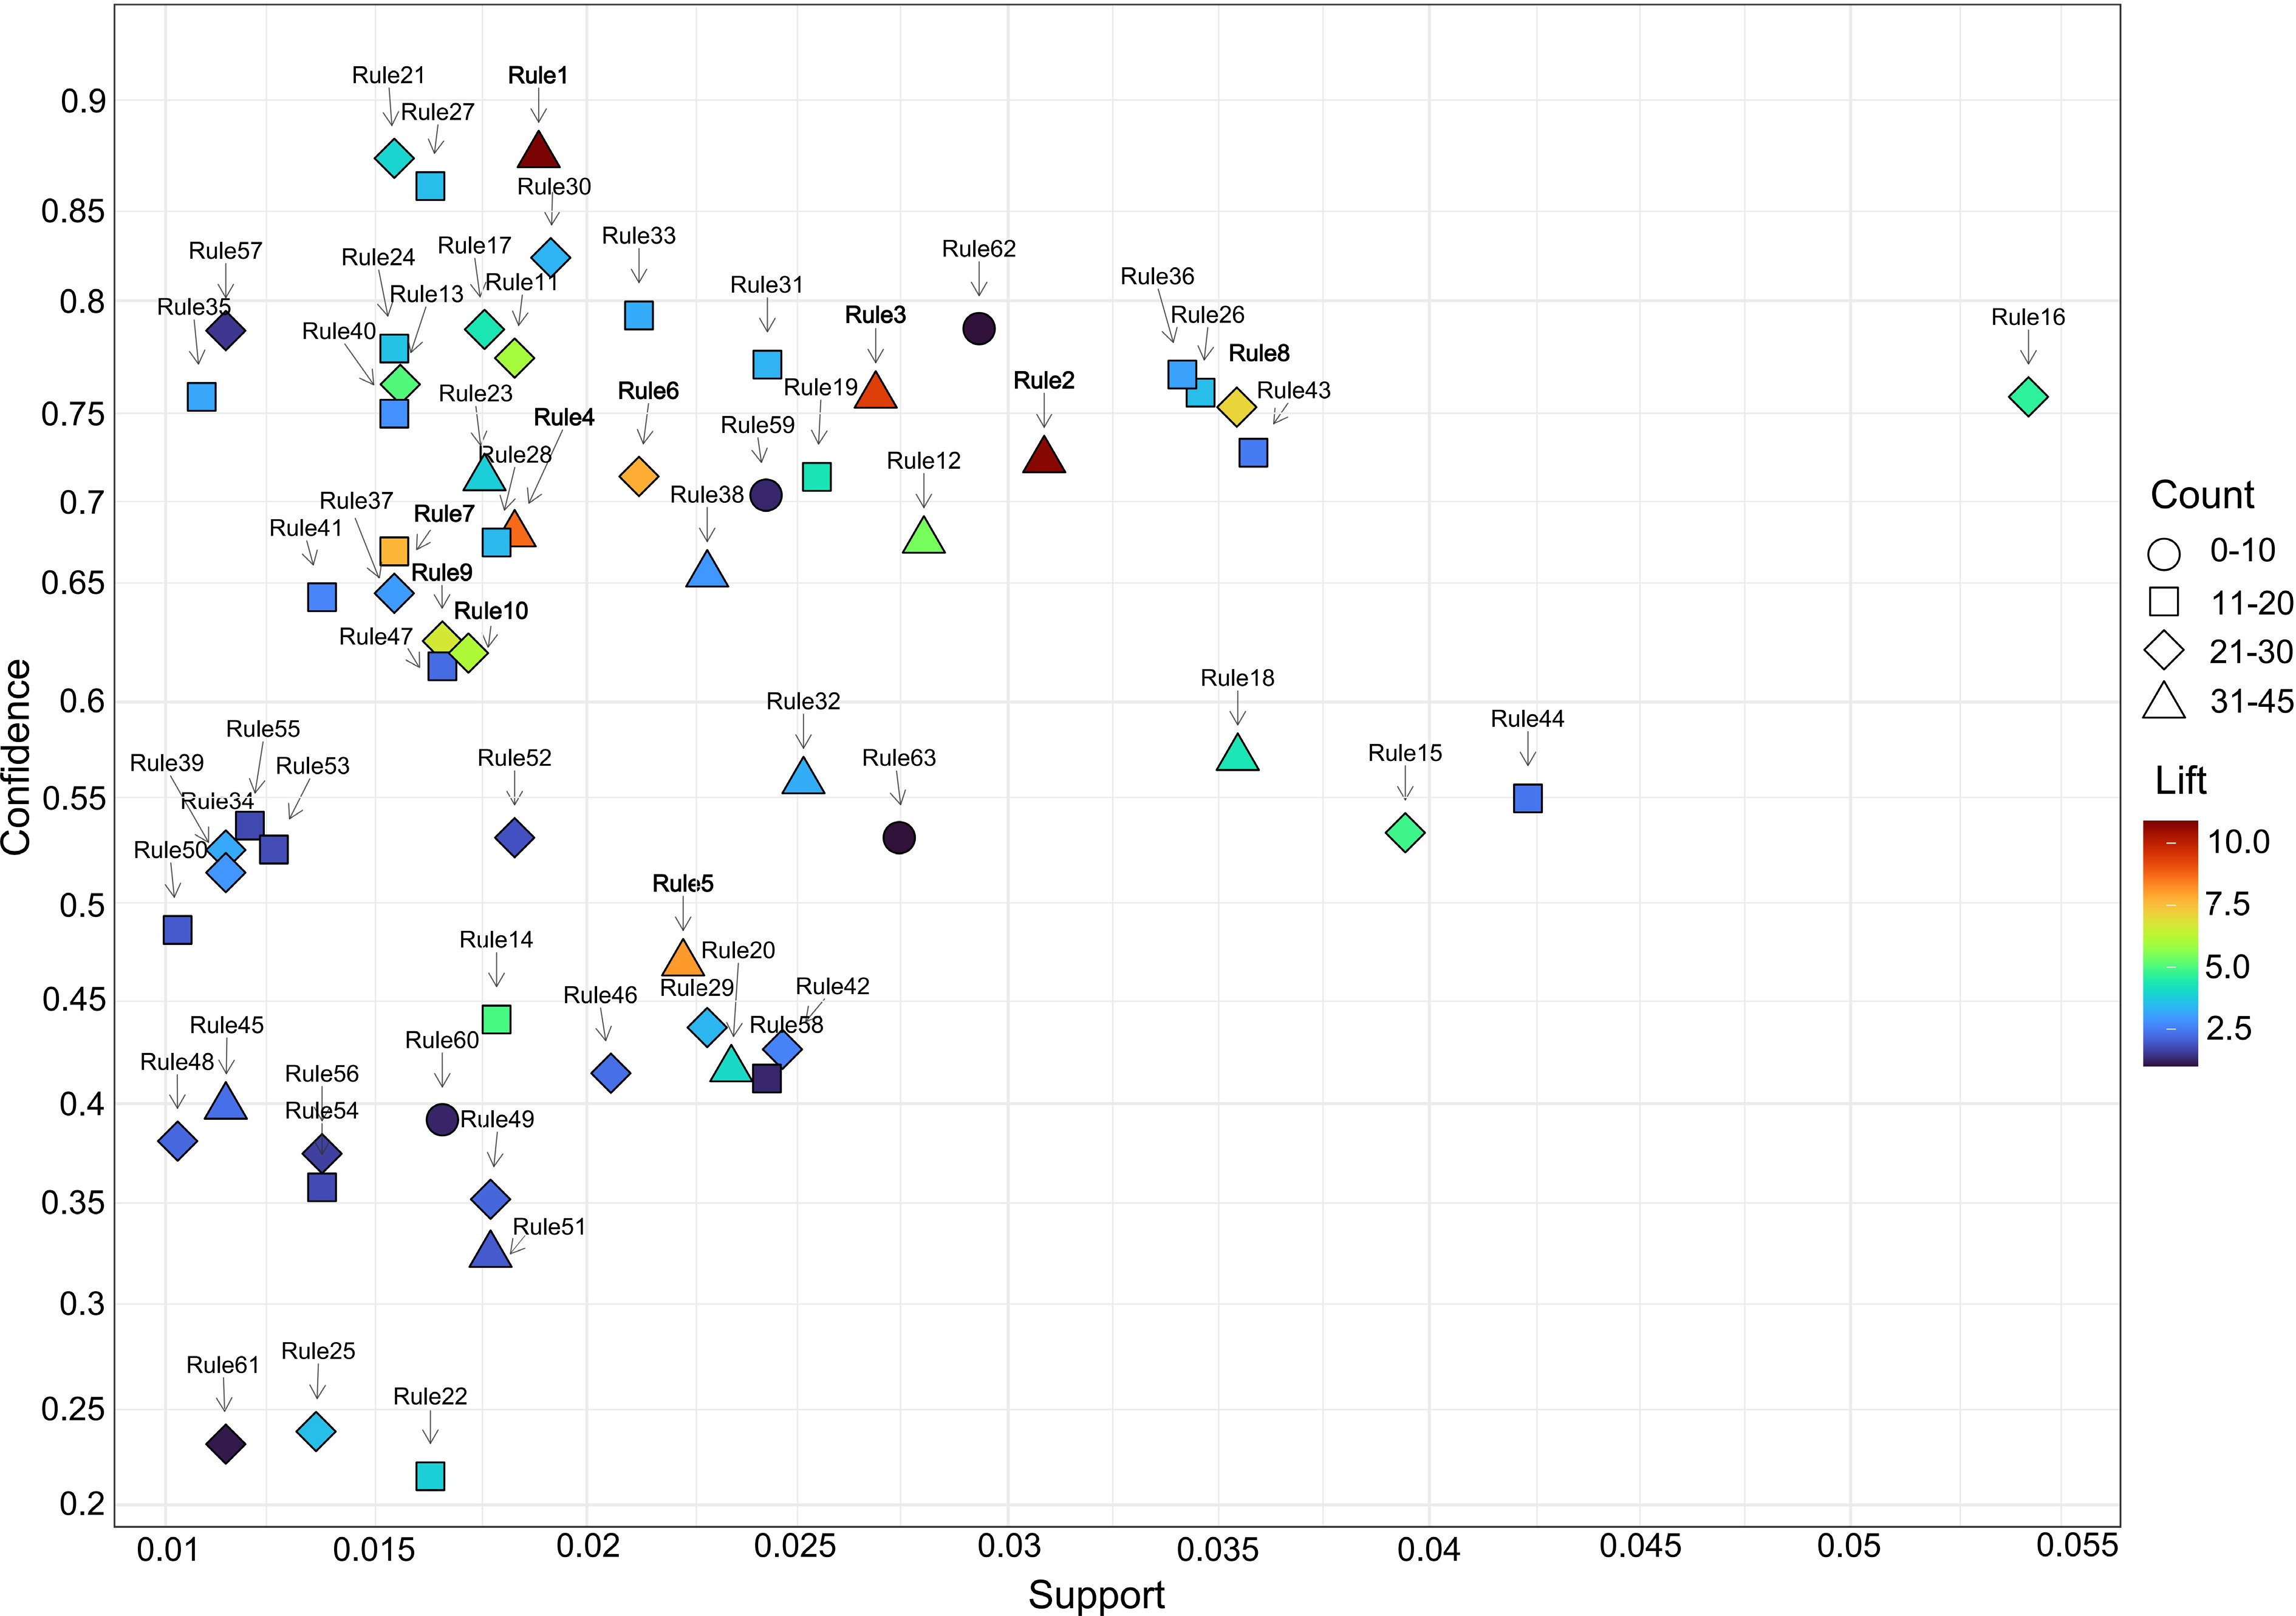
Figure 6.
Scatter plot of the distribution of important values of association rules.
The specific results of association rules generated by the Eclat algorithm are shown in Table 4. The results of the study show some undiscovered or underappreciated intrinsic associations between the causative factors and accident patterns. By comprehensively summarizing and analyzing the specific results of association rule mining technology, we can summarize the association rules that are of practical help to chemical production safety management and put forward relevant suggestions to provide certain support for enterprises in the work of hazard identification, accident prevention and control.
Table 4. Table of results of association rules for chemical production accidents.
Lhs Rhs Support Confidence Lift Count 1 {Eq05} => {FA06, SA01} 0.018857 0.872609 10.594386 39 2 {H03, M08} => {FA03} 0.030857 0.720602 10.445452 45 3 {Eq04} => {FA06, SA01} 0.026857 0.752778 9.130587 35 4 {Eq03, Eq17} => {FA04, SA03} 0.018286 0.683636 8.462905 41 5 {H02, H04} => {FA02} 0.022286 0.469881 7.873096 34 6 {Eq06, Eq17} => {SA03} 0.021238 0.712457 7.567132 25 7 {H14, M08} => {SA04} 0.015429 0.675116 7.467463 18 8 {H03} => {FA01, SA07} 0.035429 0.746988 6.903249 21 9 {H06} => {FA02, SA08} 0.016571 0.630435 6.513123 29 10 {H01, Eq05} => {FA01, SA01} 0.016571 0.627705 5.947571 25 11 {Eq16, Eq14} => {FA01} 0.018286 0.771429 5.811594 26 12 {En04, M01} => {FA01} 0.028001 0.680556 5.299092 31 13 {H09, H16} => {FA01, SA02} 0.015571 0.758333 4.946804 22 14 {M02, M05} => {FA03} 0.017857 0.441861 4.857999 19 15 {M06} => {FA04, SA02} 0.039429 0.534884 4.739863 22 16 {En01, M01} => {FA02, SA01} 0.054223 0.752121 4.562423 24 17 {H02, M07} => {FA02, SA08} 0.017571 0.785714 4.232118 18 18 {H15, Eq05} => {FA06} 0.035452 0.572254 4.225193 31 19 {Eq18, M06} => {FA04} 0.025461 0.712252 4.195752 19 20 {Eq13, Eq17} => {FA04, SA03} 0.023429 0.417101 3.941898 41 21 {Eq08, Eq17} => {FA04, SA02} 0.015429 0.870968 3.833074 21 22 {Eq05, Eq04} => {FA01, SA06} 0.016286 0.214286 3.746835 18 23 {H08} => {FA03, SA04} 0.017571 0.711628 3.722009 34 24 {Eq05, H07} => {FA05, SA01} 0.015429 0.776191 3.509662 18 25 {Eq01, Eq24} => {FA04, SA03} 0.013571 0.236559 3.446755 22 26 {M08} => {SA04} 0.034569 0.754203 3.434612 19 27 {H11} => {FA02} 0.016286 0.857143 3.416856 14 28 {En04, En02} => {SA01} 0.017857 0.679570 3.387493 14 29 {H01, H17} => {FA01, SA03} 0.022857 0.437869 3.319013 25 30 {H12, M07} => {FA02} 0.019143 0.821429 3.274487 21 31 {M01, M03} => {FA01} 0.024286 0.768182 3.264962 16 32 {H01} => {FA04, SA03} 0.025143 0.560656 3.173137 31 33 {Eq19, H08} => {FA01, SA01} 0.021238 0.792662 3.157745 15 34 {Eq06} => {FA04, SA03} 0.011429 0.526316 3.117362 20 35 {Eq12, Eq10} => {FA04, SA03} 0.010857 0.752113 3.090149 19 36 {Eq23} => {FA08} 0.034137 0.763224 3.015276 12 37 {Eq09, Eq17} => {FA04, SA01} 0.015429 0.654225 2.927509 23 38 {Eq02} => {FA02, SA03} 0.022857 0.663636 2.862905 32 39 {H04, H17} => {FA07} 0.011429 0.515054 2.851092 20 40 {Eq07, Eq22} => {FA04} 0.015429 0.743754 2.744540 19 41 {Eq03, Eq20} => {FA06, SA05} 0.013714 0.652284 2.602230 17 42 {Eq11, H13} => {SA03} 0.024643 0.426992 2.541138 24 43 {Eq15, Eq10} => {FA04, SA01} 0.035824 0.724271 2.421214 12 44 {M03, H08} => {FA01, SA02} 0.042341 0.551981 2.348722 17 45 {M01, M02} => {FA02, SA01} 0.011429 0.398507 2.267932 31 46 {H01, H16} => {FA01} 0.020571 0.415082 2.253382 26 47 {Eq04, Eq16} => {SA01} 0.016571 0.617857 2.199636 19 48 {Eq17, Eq05} => {FA01, SA03} 0.010286 0.381255 2.131466 27 49 {Eq03, H10} => {SA02} 0.017714 0.352273 2.116807 21 50 {H13, Eq17} => {FA04, SA03} 0.010286 0.486486 1.957130 18 51 {Eq10, Eq05} => {FA04, SA02} 0.017714 0.324638 1.954165 31 52 {H05, M04} => {FA02, SA03} 0.018286 0.532432 1.836788 21 53 {En03, H03} => {FA08} 0.012571 0.526559 1.769477 15 54 {M01} => {SA03} 0.013714 0.358209 1.736471 18 55 {H06} => {SA01} 0.012001 0.538462 1.707079 14 56 {H05} => {FA01} 0.013714 0.375000 1.592841 24 57 {H01} => {FA06, SA01} 0.011429 0.785116 1.474553 20 58 {Eq21, Eq17} => {FA04} 0.024275 0.412414 1.265134 14 59 {Eq22, En06} => {SA03} 0.024254 0.703145 1.252132 10 60 {M04} => {SA02} 0.016571 0.391892 1.242411 13 61 {M04} => {SA03} 0.011429 0.230270 1.087294 20 62 {En05} => {FA02} 0.029312 0.786116 1.002431 7 63 {En03, Eq23} => {FA08} 0.027416 0.532441 1.000123 10 Rule 1 indicates that under the premise of abnormal over-pressure and over-temperature of the reaction kettle (Eq05), it often causes physical overpressure explosion (SA01). This rule has a high degree of confidence (0.872) and support (10.593), and also has a high proportion in the statistics, so the actual production needs to focus on. In the reaction kettle reaction production process there are many dangerous factors: rule 22 can be seen in its main accident form for the explosion accident (FA01) and explosion after the object strikes the accident (SA06); Material strength problems lead to shell damage corrosion (Eq17), interlocking device failure (Eq10), often leading to the occurrence of accidents are the main factors (rules 48, 51 are reflected); Problems with the process (Eq04), operator error or overfilling leading to uncontrolled reactions (H07) are often a secondary factor in accidents (reflected in rules 10, 22, 24). Combined with the Accident Trajectory Crossing Theory, in the prevention of reaction kettle overpressure accidents, we can consider proposing preventive measures by cutting off the two paths of equipment factor trajectory and human factor trajectory. For example, it can improve the material strength of the reaction kettle, using corrosion-resistant and rigid materials to manufacture the kettle and accessories; setting up pressure-reducing valves, rupture discs, and other safety interlocking devices; in the process or man-made problems caused by the reaction kettle out of control after the over-pressure can be released in a timely manner, and so on. All of these measures can provide targeted prevention of reactor over-pressure explosion accidents as well as secondary accidents such as object strikes (SA06) caused by reactor accessories flying out after an explosion.
Rules 23, 33, and 44 also indicate a more important type of accident occurrence pattern. The antecedent of the rule (LHS) contains 'limited space operation without safety testing (H08)', which can be learned that workers violate the regulations on limited space operation, and do not carry out the required testing of toxic substances or flammable and explosive substances before entering (H08). These behaviors often result in poisoning or explosion accidents. Combined with rules 2 and 26 it can be seen that in an accident in limited space operation, the 'First Accident' in the form of poisoning and asphyxiation, and after the occurrence of specific 'Secondary Accidents' often exists in the form of blind rescue (SA04) leading to expansion of the consequences. This is closely related to the lack of daily emergency rescue ability training (M08) for safety management departments of chemical enterprises (confidence = 0.754). After the accident, rescuer often has poor safety awareness, do not consider their own safety, enter the restricted space, and blindly carry out rescue, leading to the occurrence of secondary accidents. Preventing the occurrence of such accidents requires companies to start with management and strictly implement the operating procedures of 'First ventilation, then detection, and finally operation', and to test and clean up toxic and hazardous substances in the limited space before operation. Operators must obtain a limited space operating license and wear protective equipment and must operate under the condition of confirming safety and having safety commanders present to supervise. Enterprises should also strengthen the daily emergency safety education, and professional knowledge education for emergency rescue personnel, to avoid the expansion of the consequences of accidents caused by the lack of blind rescue capabilities.
Among the many association rules, some of them have fewer occurrences but higher Confidence and Lift values of the rules. The correlation between the causative factors and the patterns indicated by these rules is often overlooked in actual chemical production, yet the consequences of these accidents indicated by these correlation rules are large. For example, Rule 59 indicates that the associated causative factor of flange leakage (Eq22) exists under the environment of low temperature (En06), and these two causative factors often cause personnel poisoning accidents with serious consequences. It was analyzed that flange bolts tend to shrink under low temperatures, gaskets create gaps, and the medium leaks due to the difference in internal and external pressures, resulting in poisoning accidents. Although this type of accident accounts for a small proportion of the dataset, the serious consequences of personnel poisoning and casualties usually occur, and the correlation rule has a high value of Confidence and Lift, that is, it indicates that the rule has a high degree of credibility, and it should be focused on. Combined with the Accident Trajectory Crossing Theory, consider cutting off the trajectory of the equipment factors to prevent the accident from occurring. Such as considering the replacement of flange sealing form, using steel elastic gaskets to prevent leakage, or using insulation cover and other forms of flange insulation to avoid the phenomenon of cold shrinkage. Further examples are Rule 11 and Rule 47, reflecting the explosion accidents caused by static electricity from mechanical friction (Eq16). The above rules also relate to the causative factors: equipment is not equipped with a static electricity export device (Eq14), process or technology problems (Eq04). Analysis shows that the occurrence of such accidents is usually due to process or technical problems. Combined with the accident briefings, this type of accident is often due to flammable liquids or flammable gases in the process of conveying an abnormal increase in flow control, resulting in friction between the conveying medium and the wall of the pipe generated by static electricity. Due to the equipment is not equipped with a static electricity conductivity device, the static electricity accumulates to generate sparks and ignite flammable substances. Conveyance of flammable substances in high concentrations, resulting in accidents is often in the form of an explosion. This type of accident rule has a low value of Support, indicating that it does not apply to other accident cases, but the Confidence and the Lift values are high, i.e., if the above causative factors occur, there is a high likelihood that they will lead to an explosion. In order to control the occurrence of the above types of accidents, including the control of process flow, flow abnormalities in a timely manner to shut down the valve or material pumps, the installation of electrostatic discharge device for the equipment and other measures can be considered.
For the rest of the rules, we can also summarize them and find certain patterns. For example, rules 4, 6, 20, 21, 37, 50, and 58 focus on pipelines, high-temperature boilers, valves, tanks, and other special equipment critical connection welding, due to material aging, and strength decline caused by leakage accidents. The size of this type of accident is often small, and can be controlled in time, due to leakage often leading to 'Secondary accidents' such as fire and localized poisoning. These rules for chemical enterprises to determine the key maintenance of special equipment maintenance parts to provide certain recommendations. Another example are rules 5, 9, 17, 27, 30, 52, and 55 which focus on the fire accidents caused by human factors. These include operators performing welding operations without determining safe ignition conditions (H02), failure to carry out fire separation or clearance of flammable material prior to operation (H06), employee smoking violation (H11), illegal use of equipment or raw materials with safety hazards (H05) and other factors. From these correlation rules, it can be learned that fires caused by unregulated operation of welding operations tend to occur more frequently. Therefore, chemical companies need to focus on the safety management of welding operations and especially need to regulate the behavior of operators. Such as welding operations need to do a good job of improving the effective fire isolation and cleaning of flammable substances in the operating area, the operators need to carry out systematic welding professional training, and so on.
This study analyses a large amount of accident briefing data through association rule mining techniques. By summarizing the results of association rule mining, some typical accident patterns in the chemical production process are identified, as well as the intrinsic correlation between some undiscovered or unappreciated causative factors and accident patterns. The purpose of this study is to deepen the understanding of the causes of chemical production accidents and to assist relevant departments in carrying out effective safety management. Through the internal correlation between the causative factors and the accident occurrence patterns, combined with the Accident Trajectory Crossing Theory, scientific suggestions are provided for enterprises in the prevention and control of fire and explosion, poisoning in confined spaces and other specific accidents, and hazard identification.
Network centrality analysis
-
Based on the 63 valid association rules generated by the above research, a complex network model is constructed using Gephi software. Firstly, the causative factors as well as the accident patterns involved in the above effective association rules are taken as the nodes of the network model, and the rule relationships are taken as the edges between the nodes. Due to the different rule lift values, the rule lift value is considered as the weight of the network edges for the construction of the network model. The visualization of the accident causative factors network model is shown in Fig. 7.
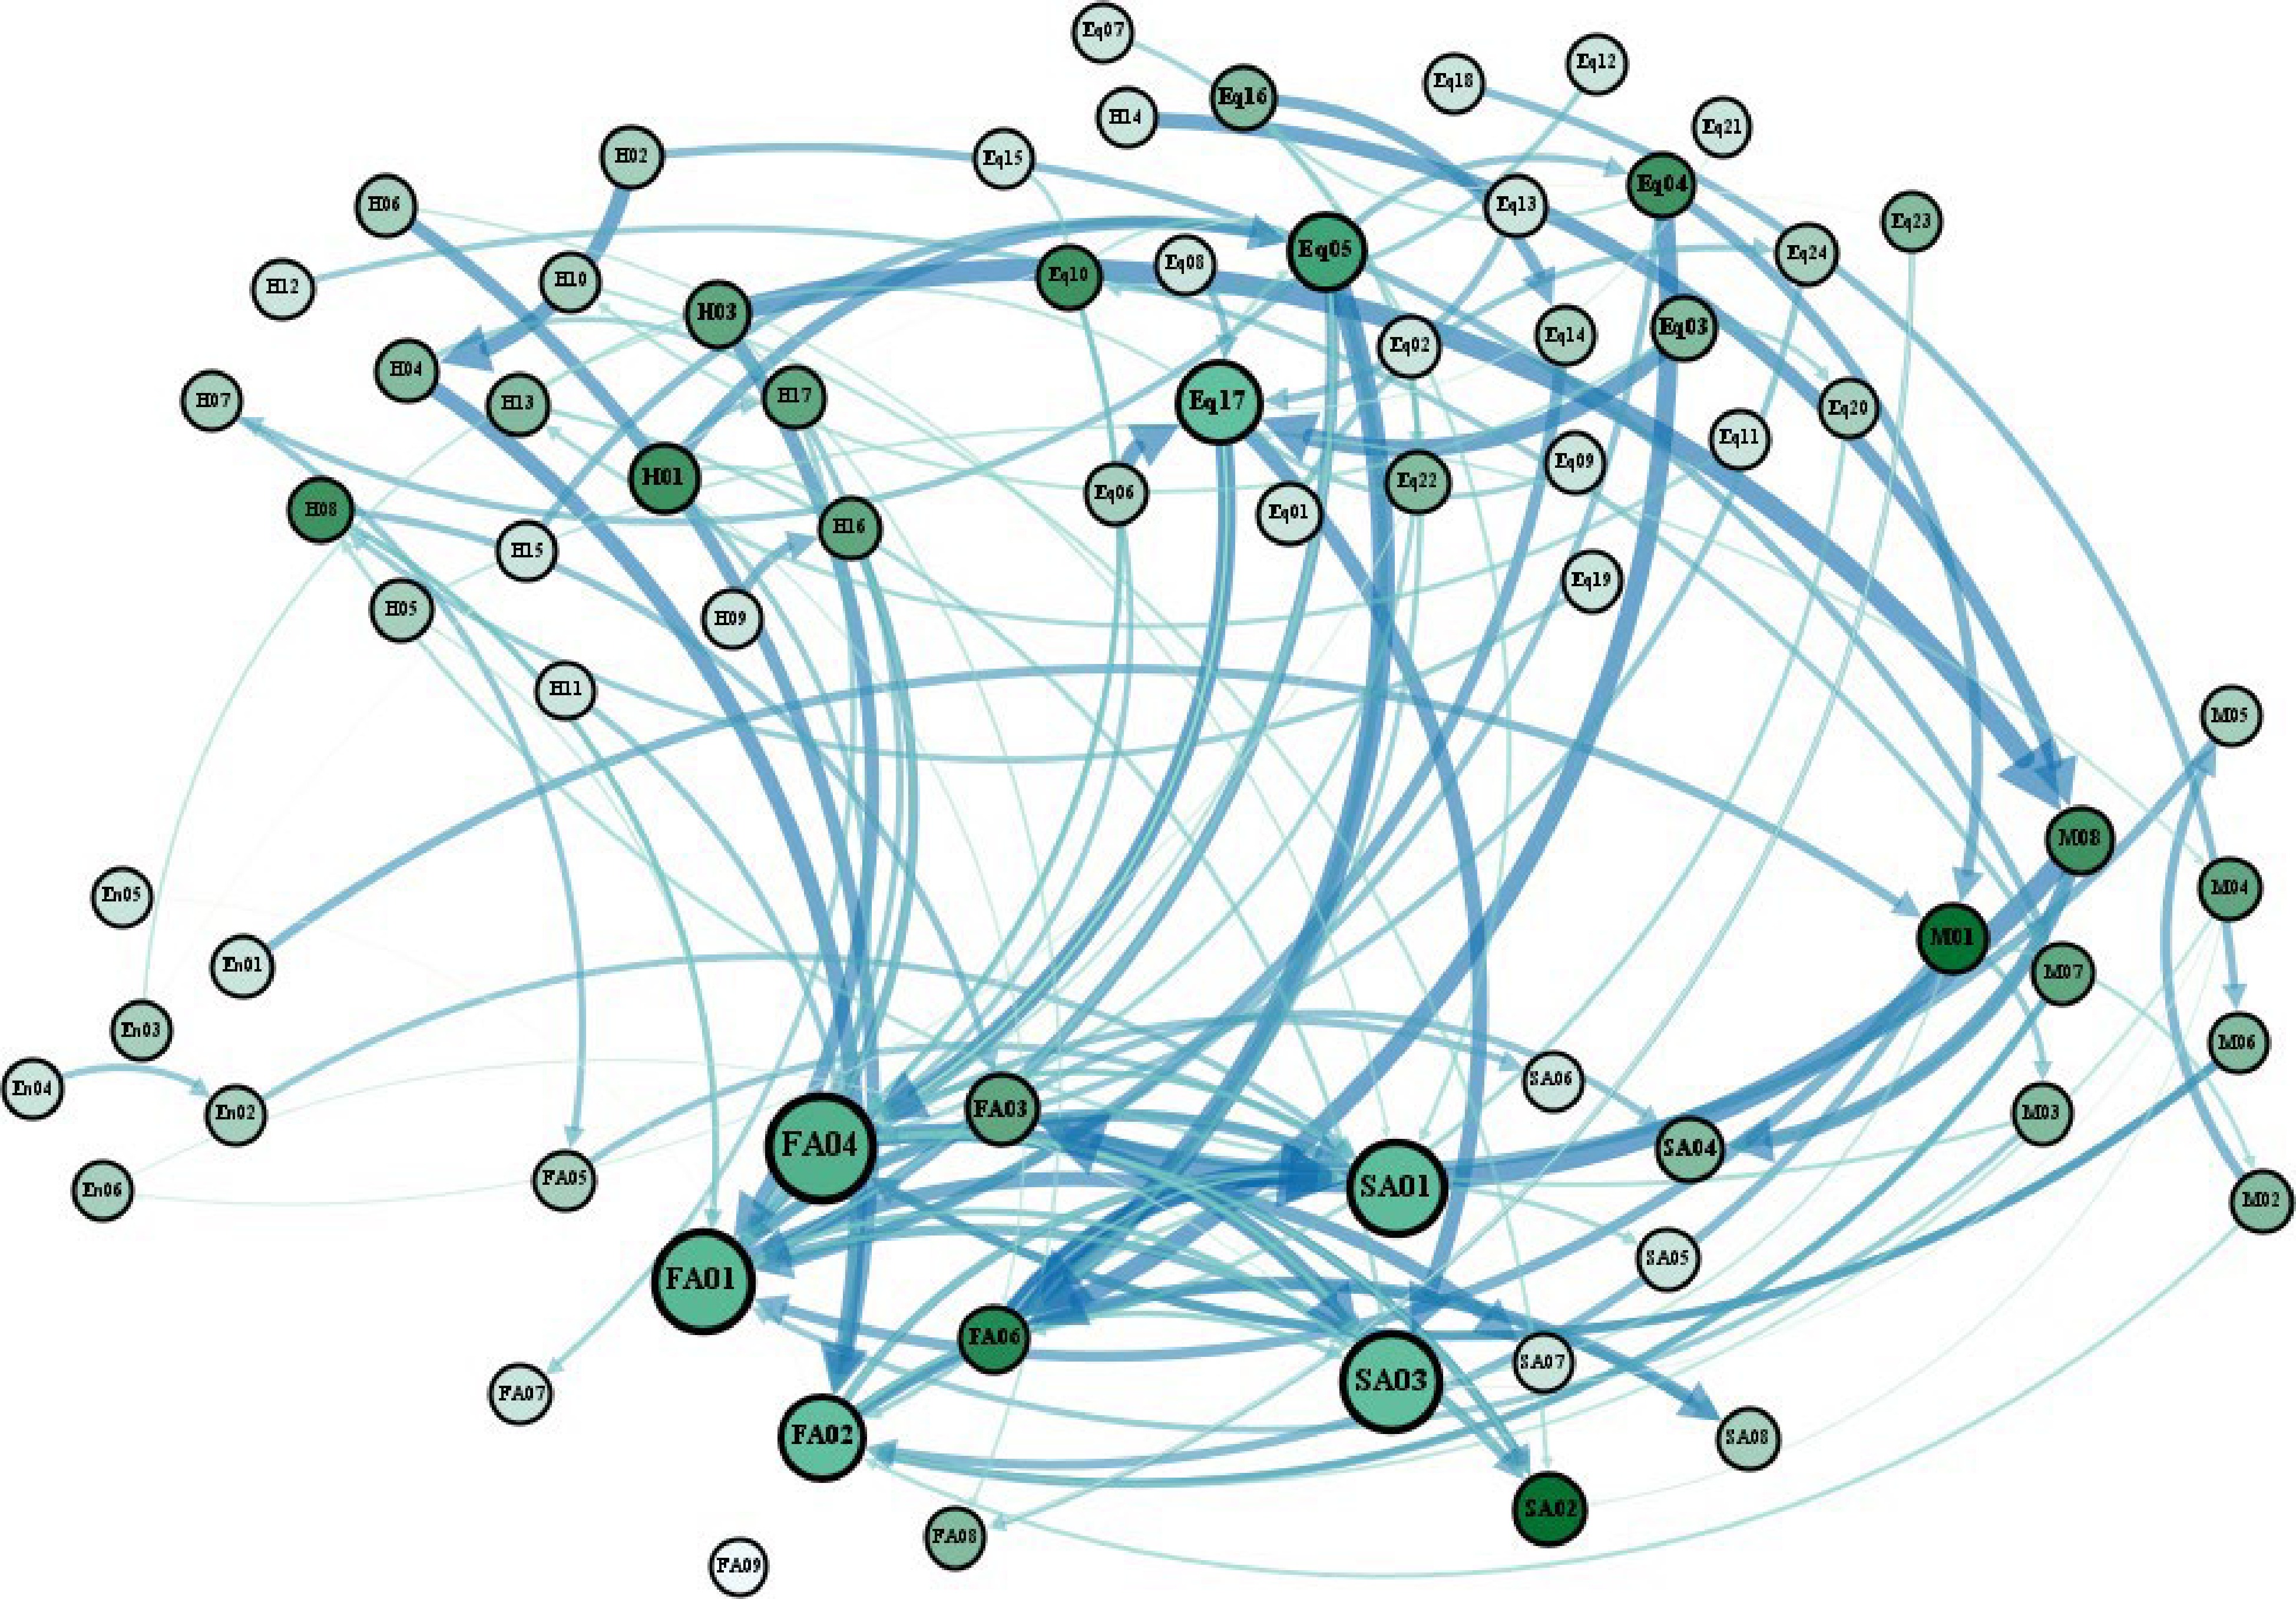
Figure 7.
Network modeling of accident causative factors.
Gephi software was used to iteratively calculate the network model and analyze the centrality of each causative factor node in the network. The main evaluation indicators include node degree, node closeness centrality, node betweenness centrality, and eigenvector centrality. The distribution of values of the above evaluation indicators are shown in Fig. 8. In the bubble plot, different colors represent different types of causative factor nodes, and the size of the bubble represents the degree value of each node.
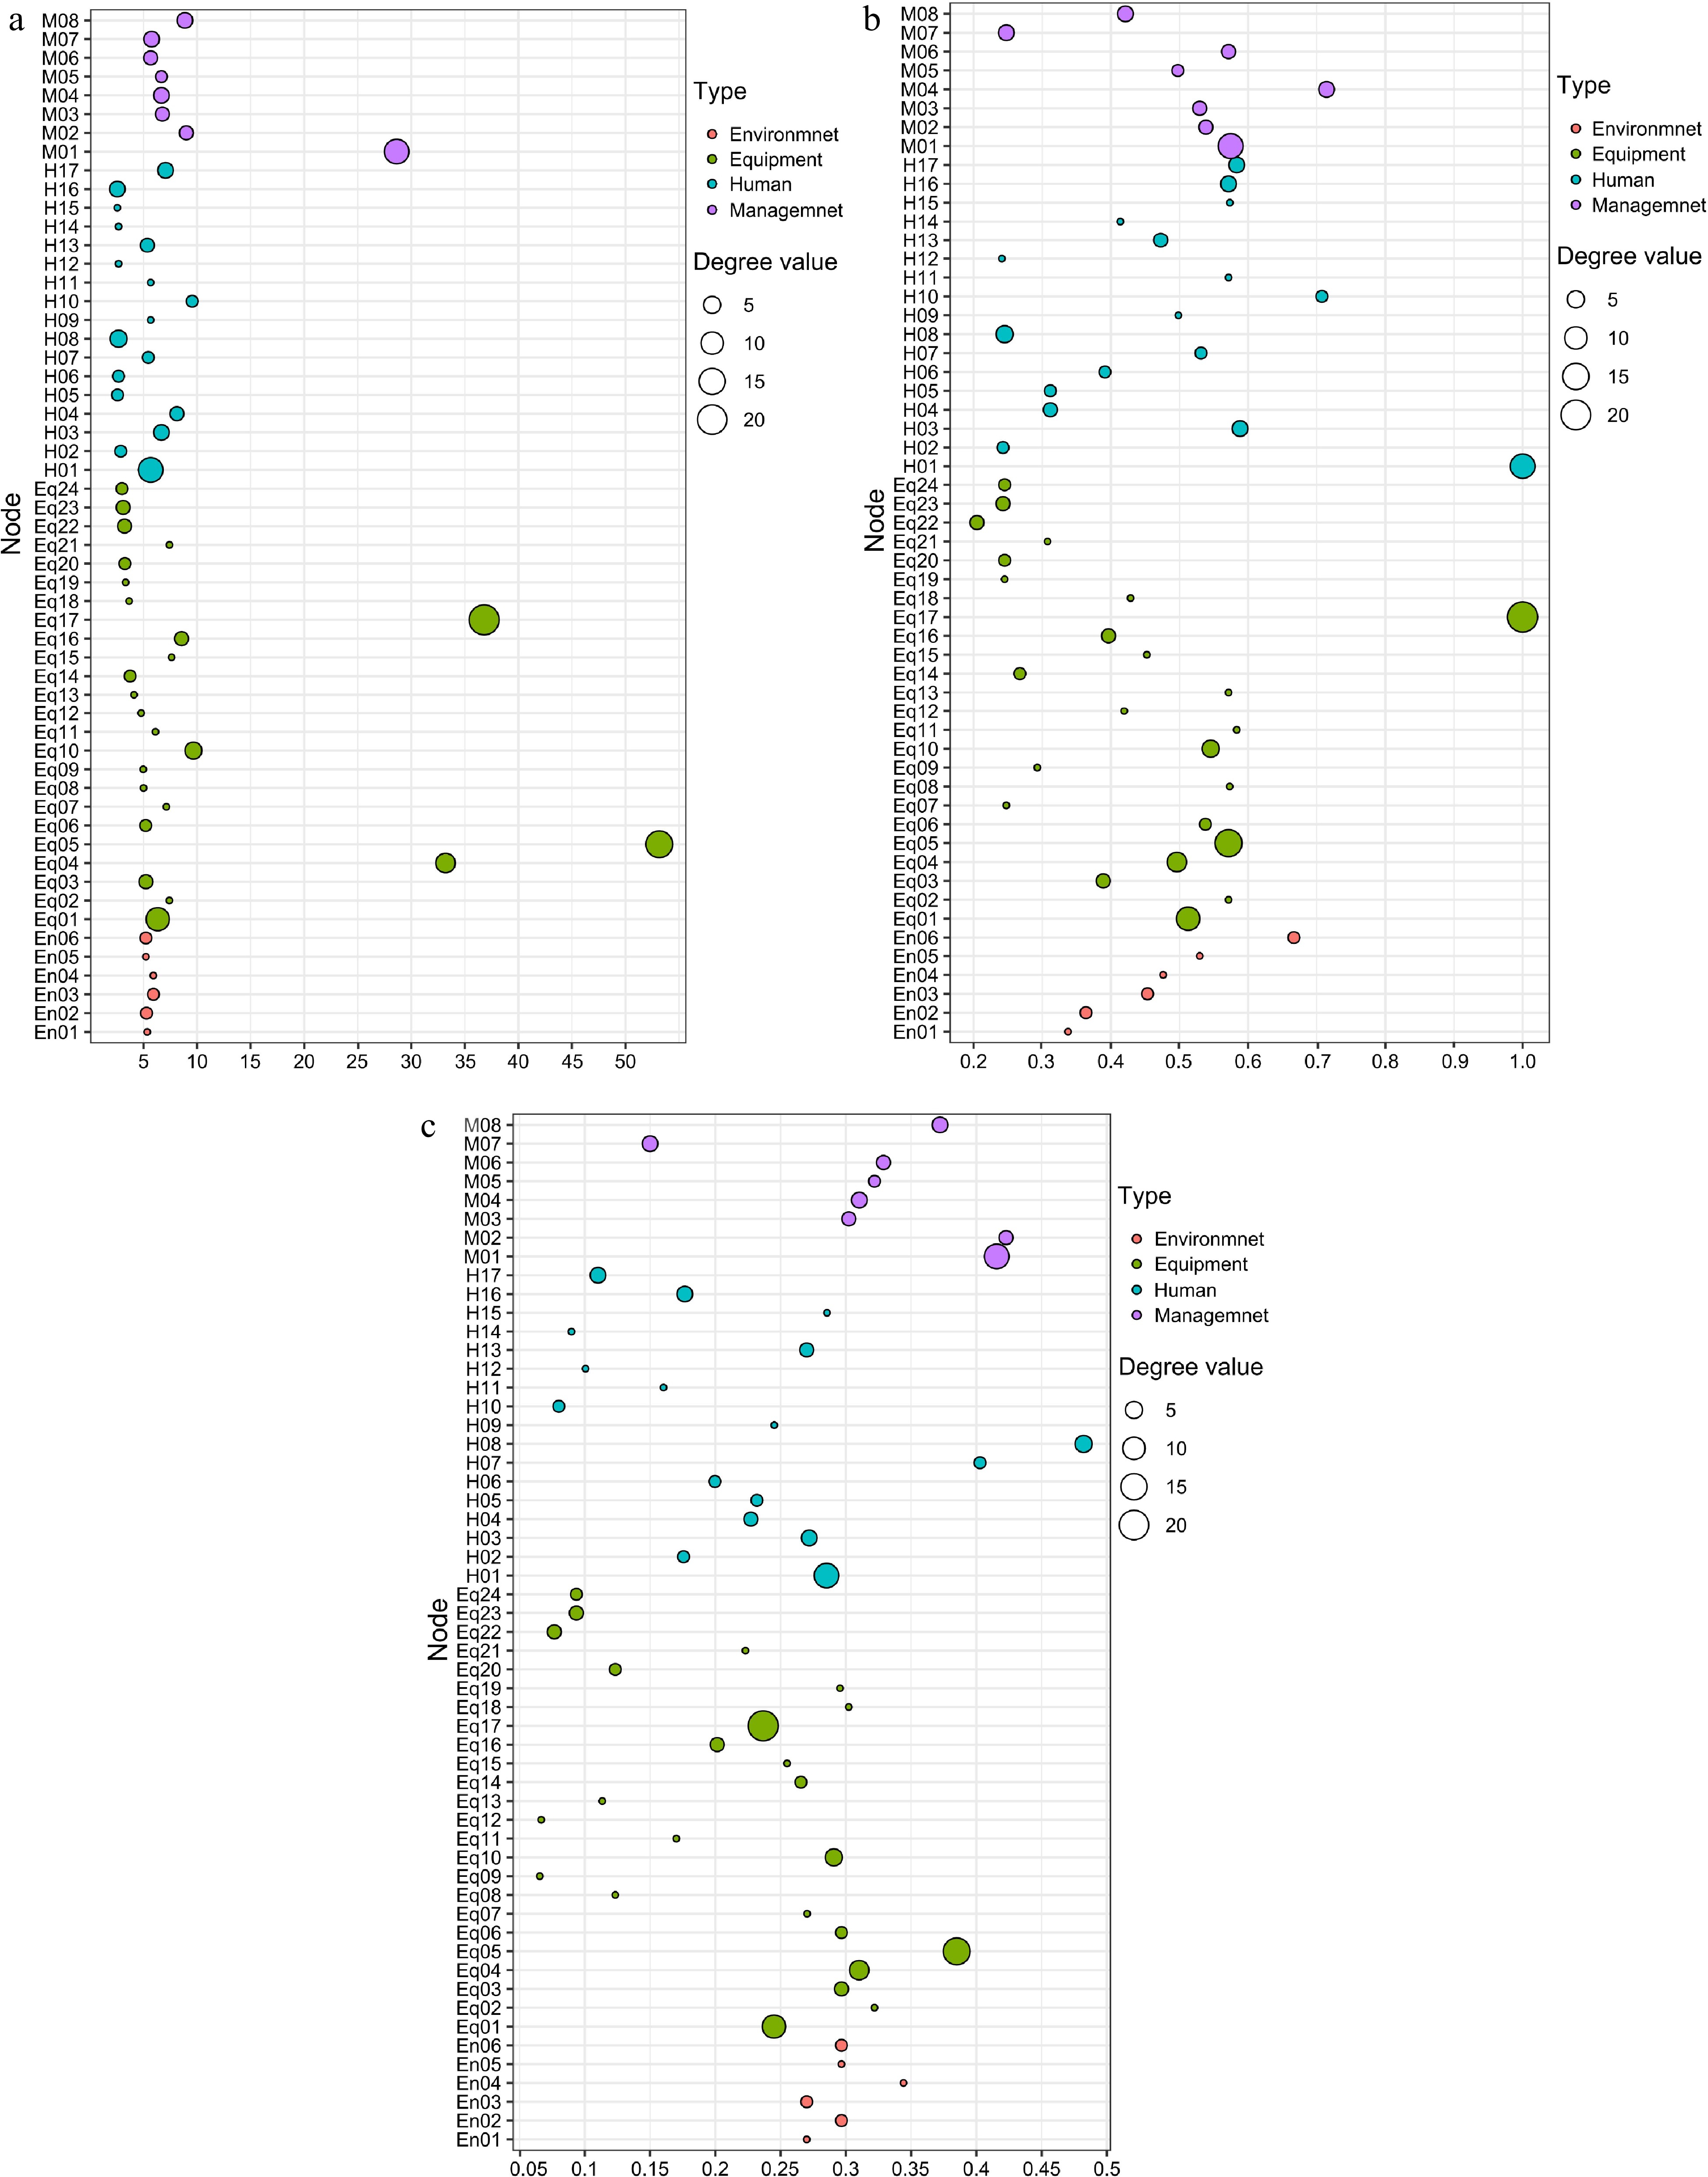
Figure 8.
Distribution of each centrality value of nodes. (a) Betweenness-degree centrality distribution, (b) Closeness-degree centrality distribution, and (c) Eigenvector-degree centrality distribution.
After calculation by Gephi software, the causative factor nodes with the top eight scores for each evaluation indicator were screened, and the statistical results are shown in Table 5. Combining the network model and the centrality values of each node, the following conclusions can be drawn:
Table 5. Key causative factors of chemical production accidents.
Evaluation indicators Causative factor nodes of chemical production accident Value Degree distribution Material strength defects (Eq17) 21 Reaction kettle over-temperature or over-pressure (Eq05) 16 Improper or faulty operation (H01): 13 13 Failure to rationalize storage according to the nature of the chemical (M01) 13 Equipment or system failure (Eq01) 11 Problems with process or technology (Eq04) 7 Safety defects in equipment or failure of safety interlocking devices (Eq10) 5 Failure to conduct safety tests prior to operating in a limited space (H08) 5 Betweenness centrality Reaction kettle over-temperature or over-pressure (Eq05) 53.159 Material strength defects (Eq17) 36.806 Problems with process or technology (Eq04) 33.199 Failure to rationalize storage according to the nature of the chemical (M01) 28.638 Safety defects in equipment or failure of safety interlocking devices (Eq10) 9.658 Illegal changes in production processes or procedures (H10) 9.542 Illegal business (M02) 8.993 Insufficient training in emergency response capacity (M08) 8.861 Closeness centrality Improper or faulty operation (H01) 1.0 Material strength defects (Eq17) 1.0 Deficiencies in security management (M04) 0.714286 Illegal changes in production processes or procedures (H10) 0.707421 Reaction kettle over-temperature or over-pressure (Eq05) 0.666667 Work without safety equipment (H03) 0.588235 Lack of specialized skills (H17) 0.583333 Failure to rationalize storage according to the nature of the chemical (M01) 0.574492 Eigenvector centrality Failure to conduct safety tests prior to operating in a limited space (H08) 0.482147 Illegal business (M02) 0.422739 Failure to rationalize storage according to the nature of the chemical (M01) 0.415532 Incorrect or excessive addition of reaction materials (H07) 0.402775 Reaction kettle over-temperature or over-pressure (Eq05) 0.384915 Insufficient training in emergency response capacity (M08) 0.372148 Ambient moisture corrodes equipment or reacts with substances (En04) 0.344168 Failure to regularly service equipment (M06) 0.328852 At the human factors level, the nodes of improper operation or error (H01), failure to conduct safety inspection before working in limited space (H08), failure to wear safety protective equipment (H03), illegal change of production process (H10), and lack of professional competence (H17) are the key nodes, i.e., the important causative factors in the chemical production accident causation system. The closeness centrality value of H01 is 1, which indicates that this node is located in the centre of the network and has some correlation with many other nodes. Combined with the network model, workers' operation errors often trigger a series of causative factors under other levels (mainly under the equipment level), such as problems in the reaction process, faults in the reaction equipment, and static electricity generated by friction, which work together and lead to accidents. At the environment and equipment level, equipment material problems (Eq17), reaction kettle temperature and pressure control (Eq05), chemical reaction process problems (Eq04), safety interlocking device problems (Eq10), and storage environment humidity and substance reaction (En04) are the key causative factors for accidents. Eq17 has a high closeness centrality value (1) and a high betweenness centrality value (36.806), which means that this node is located in the center of the network in the network model and plays a key connection role in each part. Combined with the network model, material strength problems are often caused by factors such as material design problems (Eq04) or insufficient daily management of related equipment (M06), and material strength defects often lead to the appearance of other causative factors in the equipment level in succession. Eq05 has the highest betweenness centrality (1), indicating that this node plays an important role as a bridge between the levels of the network. Reaction kettle over-temperature and over-pressure are often triggered by the presence of other causative factors, and reaction kettle over-temperature and over-pressure often lead to the emergence of other causative factors as well, resulting in accidents. Among the management level, insufficient training of emergency response capability (M08), hazardous chemical storage management problem (M01), safety management problem (M04), illegal operation without qualification (M02), and special equipment maintenance management problem (M06) are the key nodes in the causation model, which need to be highly valued.
In each level, there is less correlation between nodes within the level and more correlation between nodes between different levels. Combined with the chemical production process, it can be seen that the occurrence of accidents is often not caused by a certain type of causative factors, but is the result of the mutual coupling of causative factors under different levels. Such as human factors under the causative factor node will often appear with the equipment level under the causative factor node's common role, and often due to human causes leading to equipment failure, management problems, or environmental factors, leading to human error. Enterprise daily safety management, we can focus on the key causative factors in the model nodes, for the prevention and control of accidents, you can play an important role in controlling the model bridge nodes or nodes in the center of the network, cut off the path of accidents, reduce the same or similar pattern of accidents, play a multiplier effect. The construction of the chemical production accident network model provides certain suggestions and help for safety managers to systematically study the causes of chemical production accidents and accident patterns.
Chemical production accident prediciton with time series data
Time series data acquisition and model selection
-
First of all, the collected accident briefings need to be statistically processed. In this study, the proportion of each quarter to the total number of accidents in every year from 2012 to 2023 was obtained quarterly. Due to the existence of certain seasonal and temporal characteristics of chemical production accidents[6], this percentage data (referred to as Accident-Percentage time series data) has a certain historical inheritance and periodic characteristics, and can be used to fit the SARIMAX model and predict the occurrence trends of accidents. Figure 9 shows the trend in the number of Accident-Percentage from the beginning of 2012 to the end of 2023 by per quarter. It can be clearly observed from Fig. 9 that this time series data has certain periodic characteristics. As shown, the Accident-Percentage is small in the first quarter of the same year, but the proportion generally tends to increase over time, reaching a maximum in the third quarter of each year, and then a minimum as the timeline lengthens. In this paper, to validate the accuracy of the SARIMAX model predictions, the sample period is divided into two time periods: the first quarter of 2012 to the fourth quarter of 2022 is used as a training set for training the SARIMAX model, and fitting it, and the first quarter of 2023 to the fourth quarter of 2023 is used as a test set for validating the accuracy of the SARIMAX model obtained from the training.
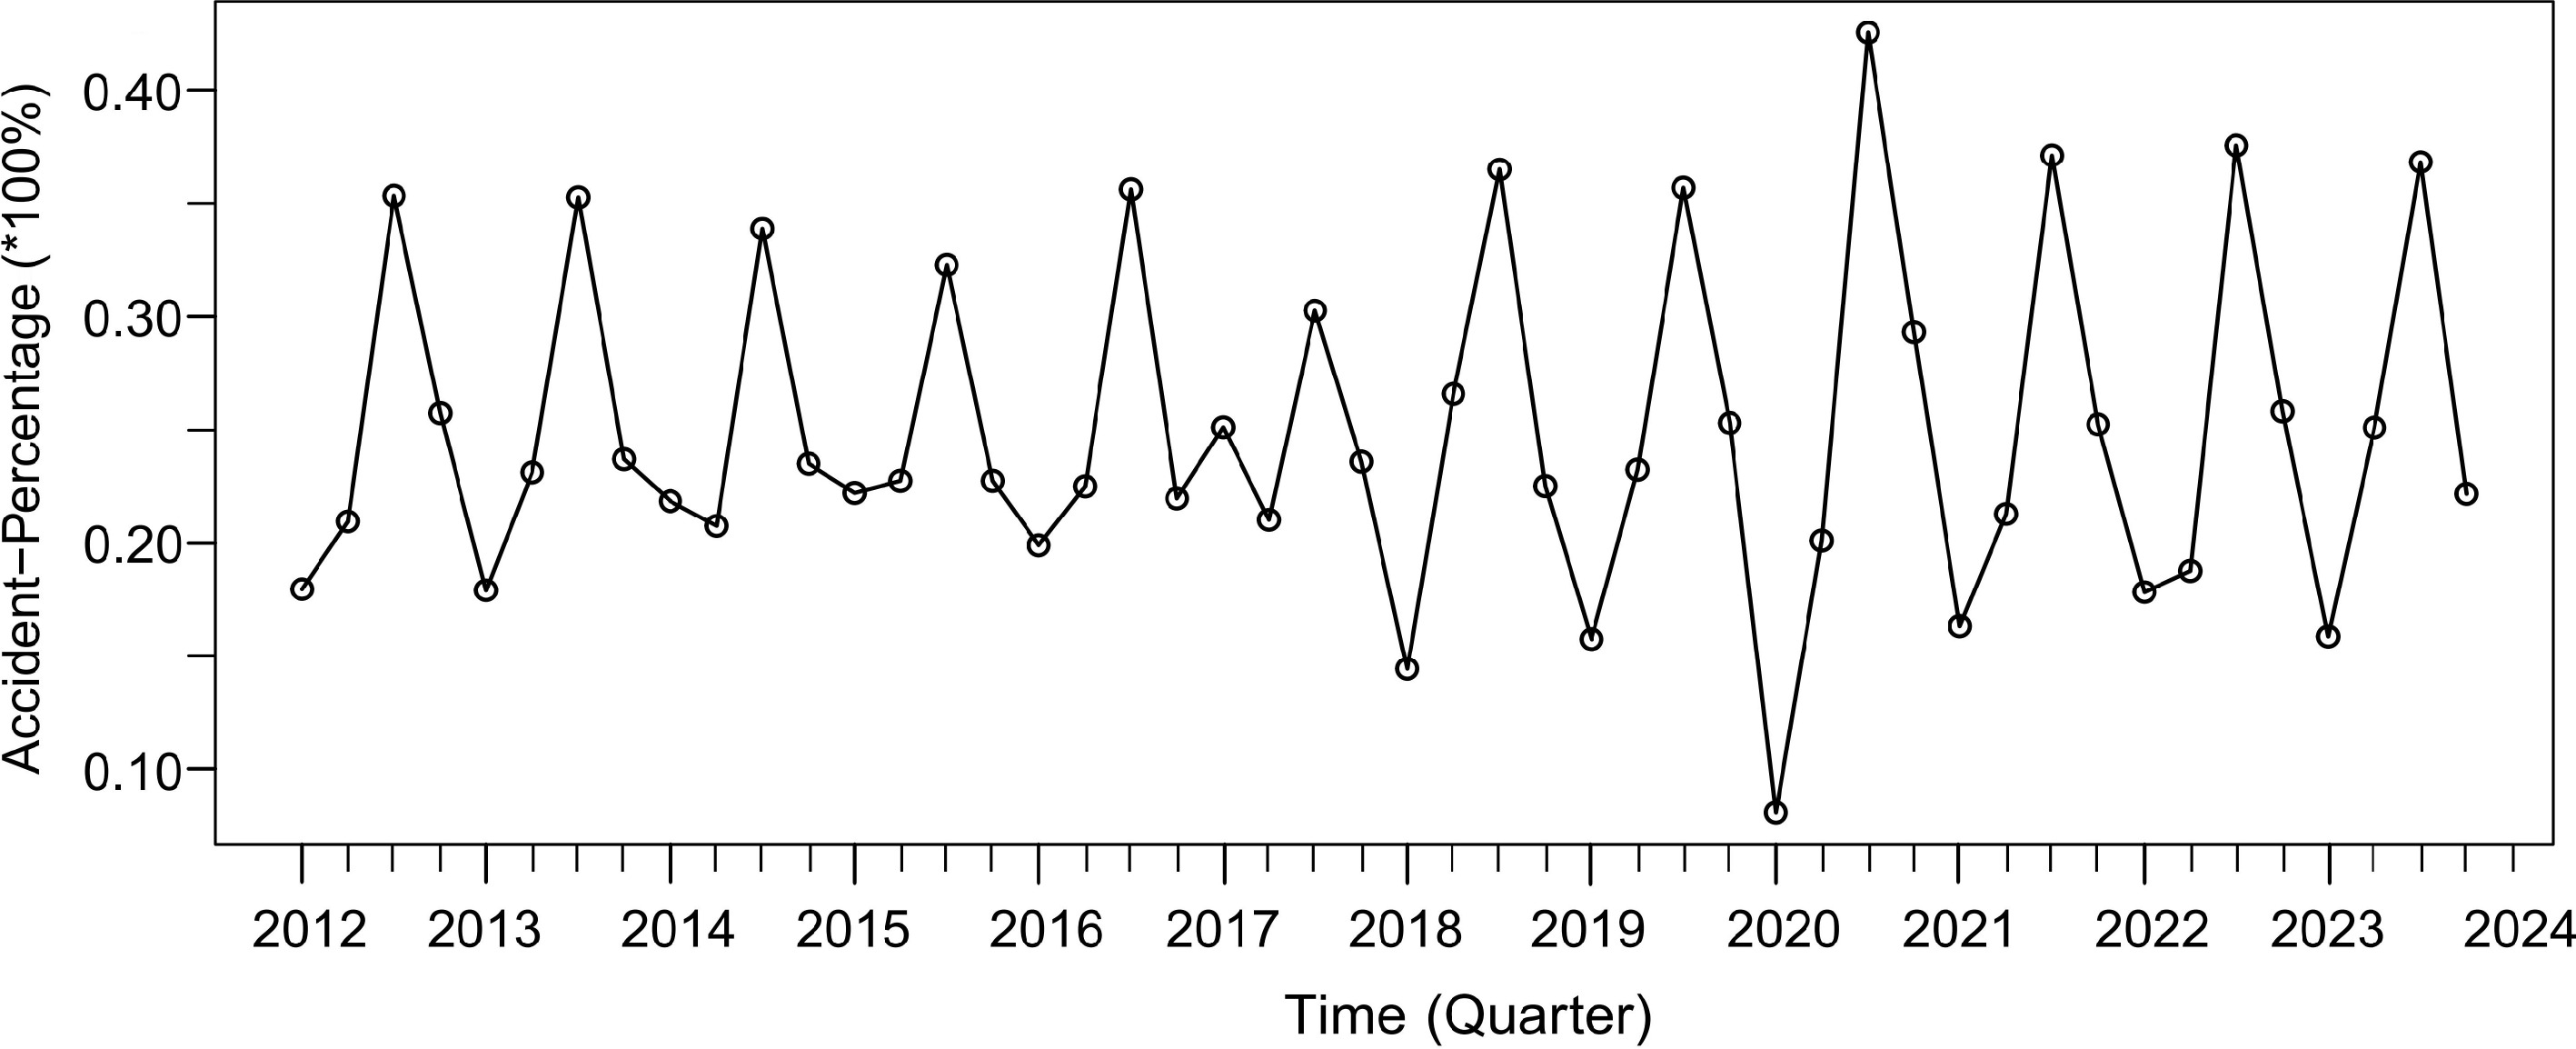
Figure 9.
Trend of Accident-Percentage from 2012 to 2023.
Smoothness test with ACF and PACF plots
-
The time series data of chemical production accidents are tested for smoothness to determine whether they are smooth time series, and the fitted time series must be tested for smoothness before fitting the time series model to avoid pseudo-regression[34]. Augmented Dickey-Fuller (ADF) test was used in this paper to determine the smoothness of the quantity sequence during the sample period, and the results are shown in Table 6.
Table 6. ADF test results.
Data Dickey-Fuller Lag order p-value Alternative Original series ADF test Da1 −3.4473 5 0.06219 Stationary ADF test after first-order differencing Da2 −6.2364 5 0.01 Stationary From the results in Table 6, the Dickey-Fuller (Test statistic) for the training set time series data is −3.4473, with a p-value of 0.06219, and the p-value is significantly higher than 0.05. Therefore, the hypothesis that 'the original series contains a unit root' is accepted at the 5% level of significance, and the original time series data is a non-smoothness time series data. After the first-order differencing treatment, the ADF test was performed again, and the Dickey-Fuller value and the corresponding p-value were −6.2364 and 0.01, where the p-value was significantly less than 0.05, and therefore the hypothesis of containing a unit root was rejected at the 5% level of significance, therefore the time series after the first-order differencing was a smoothness time series data. The trend plot of the time series data after first-order differencing is shown in Fig. 10.
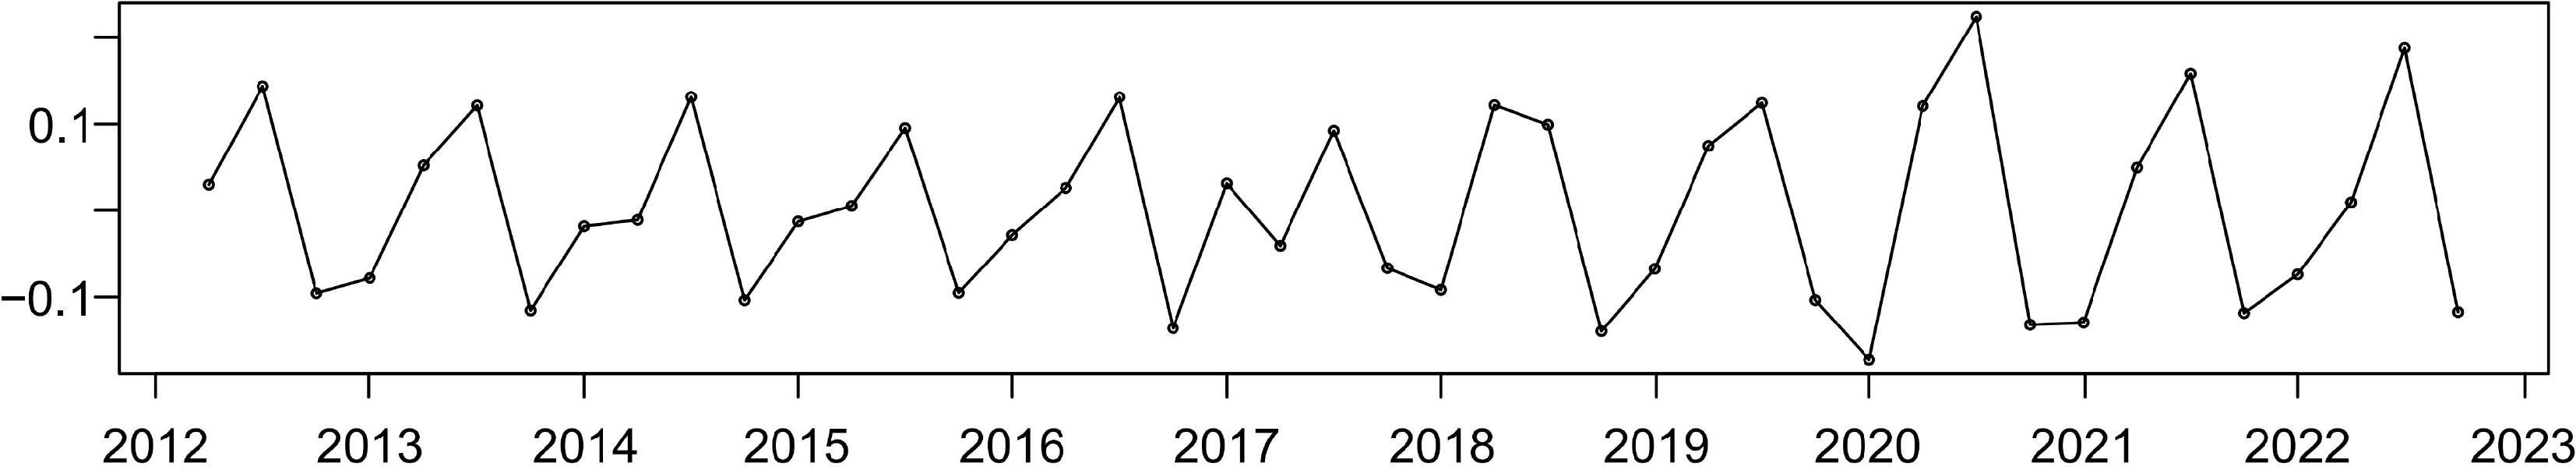
Figure 10.
The trend of the time series data after first-order differencing.
Figure 11 shows the Auto Correlation Function (ACF) plot and Partial Auto Correlation Function (PACF) plot of the Accident-Percentage time series data after first-order differencing, respectively. The horizontal axis of the ACF plot and the PACF plot represent the order of lag, and the vertical axis represents the correlation coefficient between the corresponding lag series and the original series. To reduce the effect of other variables in the autocorrelation coefficient, consider taking partial derivatives of the correlated variables, known as partial autocorrelation functions (PACF). The dashed blue areas in both plots represent confidence intervals that indicate whether the correlation coefficients are statistically significant. In simple terms, if the correlation number falls within the confidence interval, it means that the correlation coefficient of the corresponding two series can represent their true correlation. From Fig. 11, it can be clearly observed that there is a certain degree of smoothness characteristic of Accident-Percentage after first-order differencing, and there is a significant trailing phenomenon in the ACF plot of Accident-Percentage with a lag of 15 orders. At the same time, there is a more significant third-order truncation in the PACF plot[34]. As a result, the Accident-Percentage time series data after first-order differencing has some degree of smoothness as well as periodic trends. To further increase the accuracy of SARIMA prediction, X, which is closely related to the occurrence of accidents, will be further used as an exogenous variable to fit the SARIMAX model.
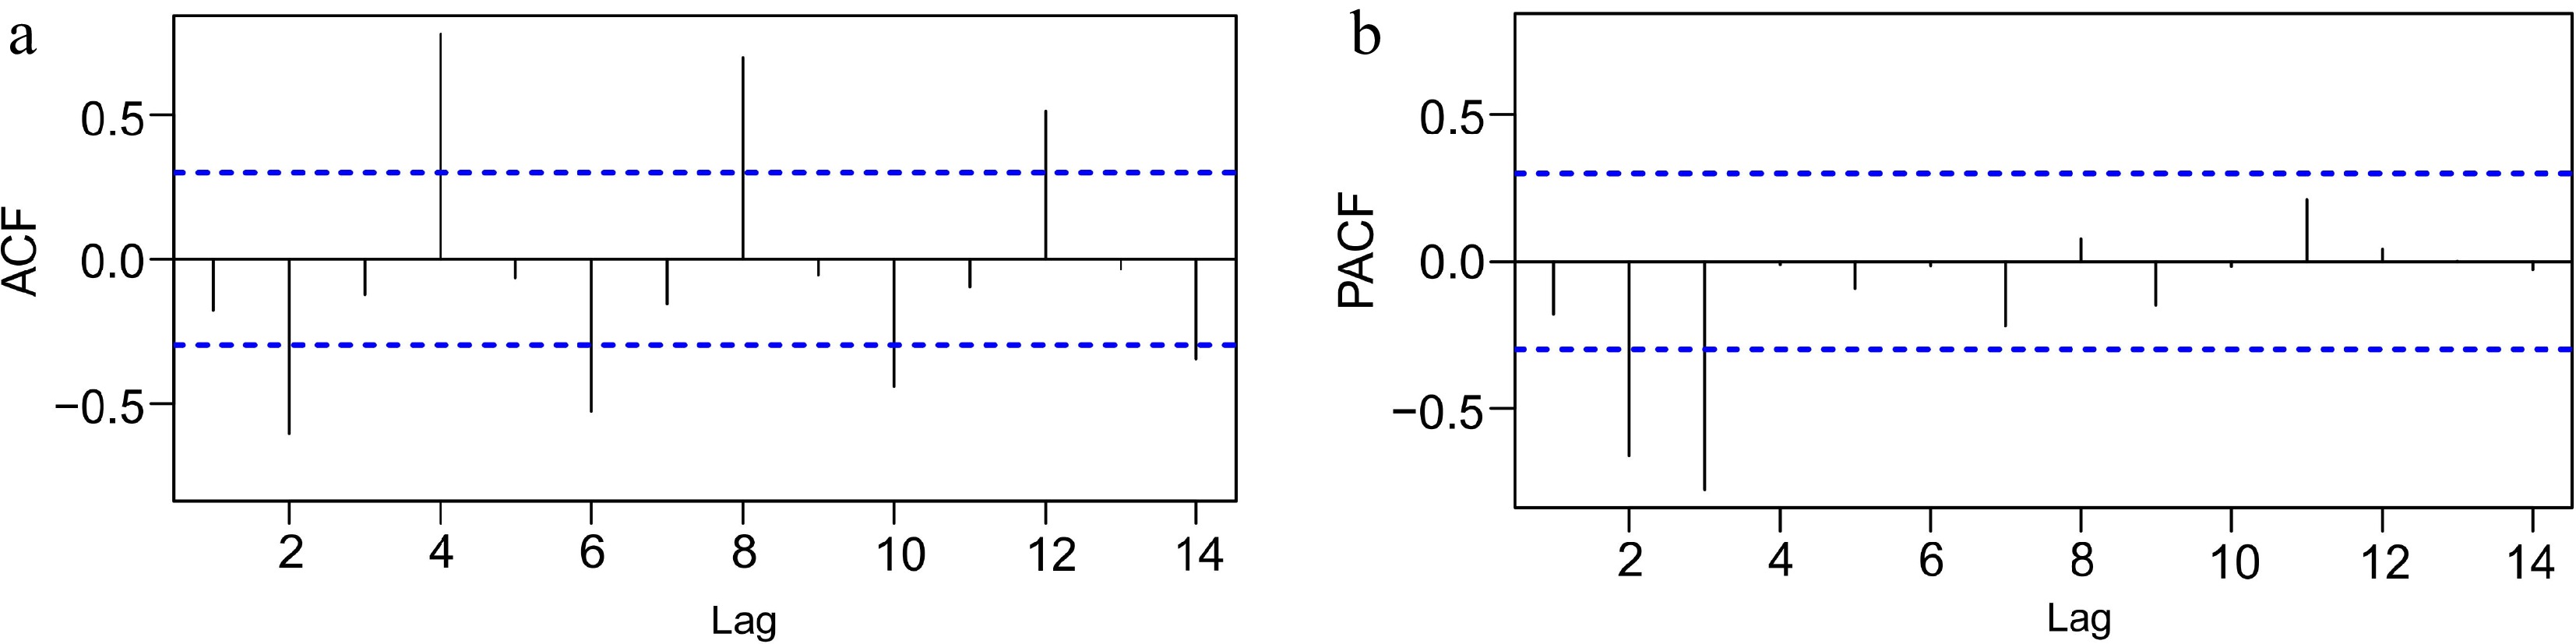
Figure 11.
(a) Auto correlation functions plot. (b) Partial auto correlation functions plot.
Model selection
-
In order to fit the Accident-Percentage time series data in the time period of the sample period more effectively, and to make the later prediction effect more accurate, this paper selects the Akaike Information Criterion (AIC) to evaluate the different models and select the optimal model[35]. In this paper, it is initially considered that the optimal SARIMAX model is selected from the following models with different combinations of P/D/Q parameters and the AIC values for the different SARIMAX model fits are shown in Table 7.
Table 7. Values of different evaluation indicators for the SARIMA models.
SARIMAX model Model evaluation criterion AIC Sigma2 SBIC Log likelihood SARIMA(1,1,2) (1,1,0)[4]-AR(X) −149.87 7.96 −144.02 76.03 SARIMA(1,1,1)(1,1,0)[4]-AR(X) −151.82 8.57 −144.31 77.31 SARIMA(0,1,1)(1,1,0)[4]-AR(X) −153.53 8.89 −146.88 80.77 SARIMA(0,1,2)(1,1,0)[4]-AR(X) −151.79 8.44 −145.97 80.93 SARIMA(2,1,2)(1,1,0)[4]-AR(X) −147.98 7.24 −143.73 75.92 SARIMA(2,1,0)(1,1,0)[4]-AR(X) −146.39 7.03 −144.68 75.41 SARIMA(2,1,1)(1,1,0)[4]-AR(X) −149.95 7.91 −144.27 76.58 SARIMA(1,1,0)(1,1,0)[4]-AR(X) −147.74 7.54 −145.53 76.21 By the AIC minimum criterion, the AIC value of the fitted SARIMA(0,1,1)(1,1,0)[4]-AR[X] model is −153.53, which is the smallest value of the eight types of SARIMAX models with different lag orders. Therefore, this model can better fit the Accident percentage time series data in the training set. Next, the feasibility of the selected model was verified by Standardized residual plots, ACF of residual and P-value for Ljung-Box Statistic plots, and the results are shown in Fig. 12.
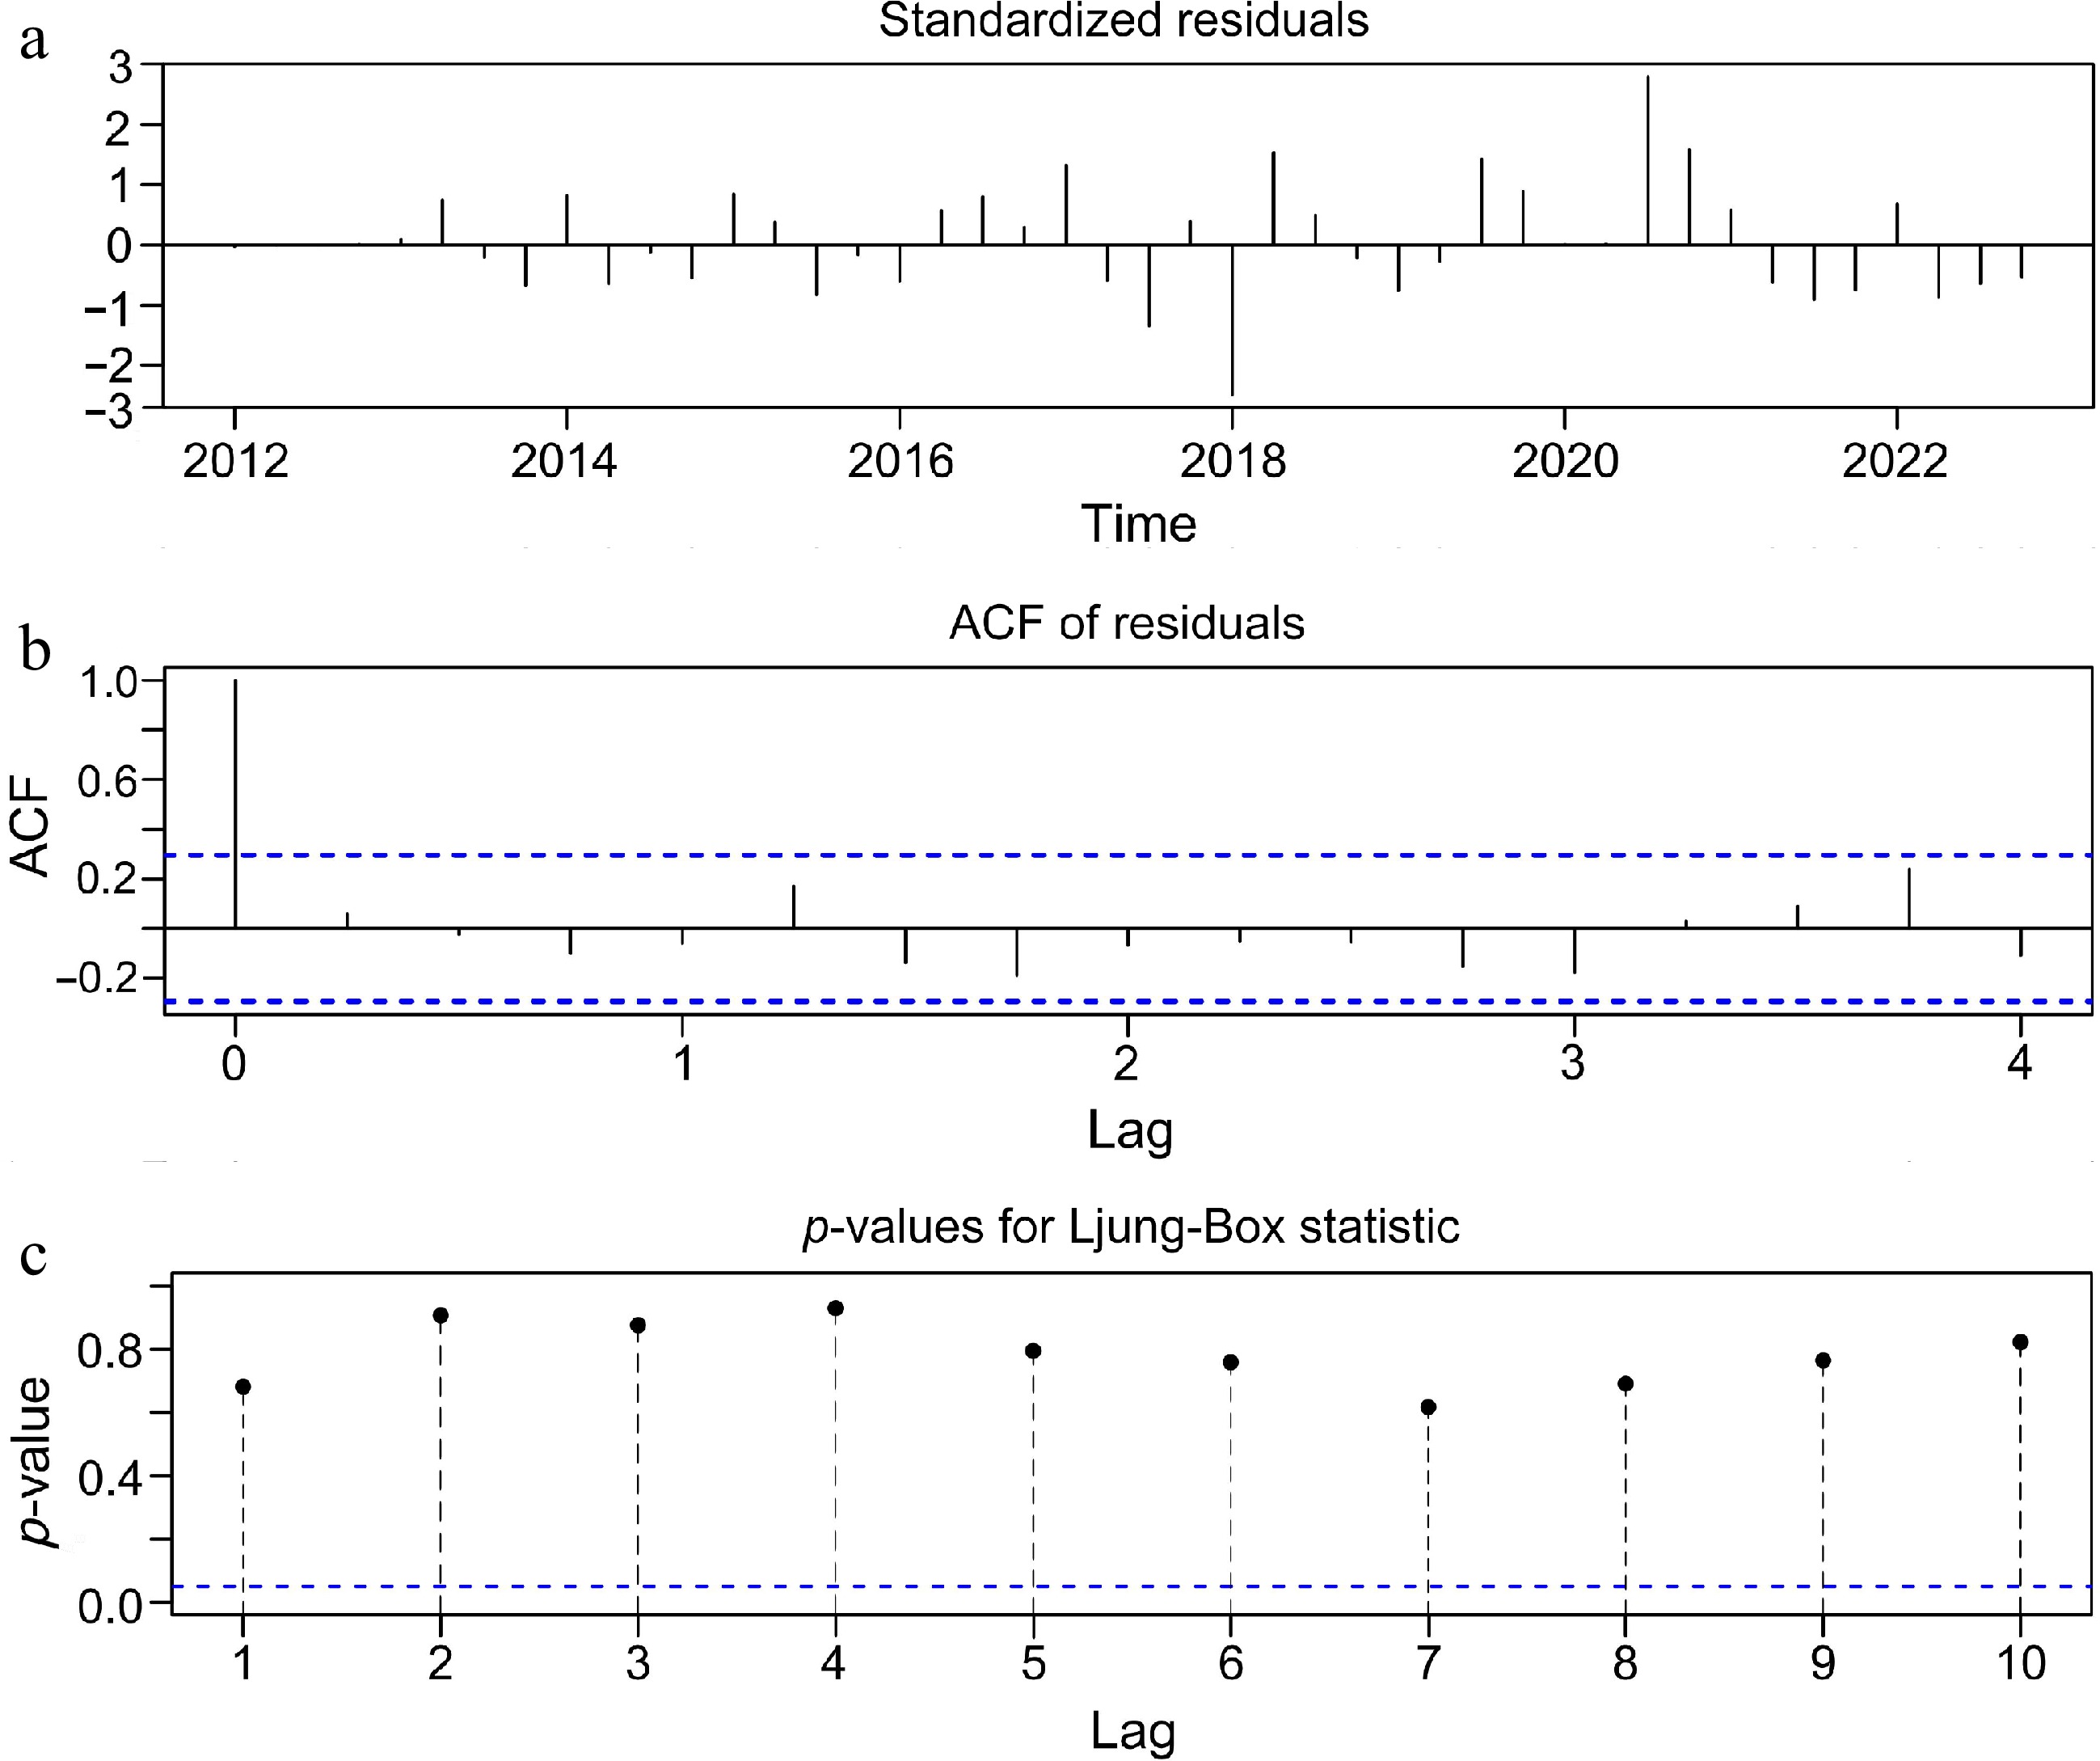
Figure 12.
Correlation plot for model feasibility validation. (a) Standardized residual. (b) ACF of residual. (c) p-value for Ljung-Box Statistic.
The analysis is as follows:
(1) Standardized Residual Plot. The standardized residuals of a good SARIMAX model should be free of fluctuating aggregation. From Fig. 12a, it can be clearly observed that the standardized residuals have lost their aggregation after the time series data starting from the first quarter of 2012 to the fourth quarter of 2022 have been fitted with the SARIMA(0,1,1)(1,1,0)[4]-AR[X] model.
(2) ACF of Residual Plot. A good ARIMA model with an Auto Correlation Function fitted to the residuals does not have significant auto correlation. The ACF plot in this example performs well and is within the confidence interval throughout the lag period, demonstrating that there is no significant auto correlation in the standardized residuals of the Accident-Percentage time series data within the training set after model fitting.
(3) P-value for Ljung-Box Statistic Plots. If the p-values of the Ljung-Box statistic are all greater than 0.05, this indicates that the residuals are not correlated in any way. As can be seen in Fig. 12c, after fitting the model, the p-value of the Ljung-Box test is significantly greater than 0.05 at a lag of 10 periods. Therefore, the selected model can well extract all the information of the time series data for the period of 2012−2022, and the remaining is only 'noise data'.
In summary, the SARIMA(0,1,1)(1,1,0)[4]-AR[X] model can fit the Accident-Percentage time series data from the beginning of the first quarter of 2012 to the fourth quarter of 2022 very well, and therefore the model can be used to forecast the series.
Model fitting and analysis
-
The SARIMAX model determined above was used to fit the collected time series data of chemical production accidents for the years 2012−2022 to predict the trend of the accidents in the last four periods of the training set, and the prediction results are shown in Fig. 13, and the specific values are shown in Table 8.
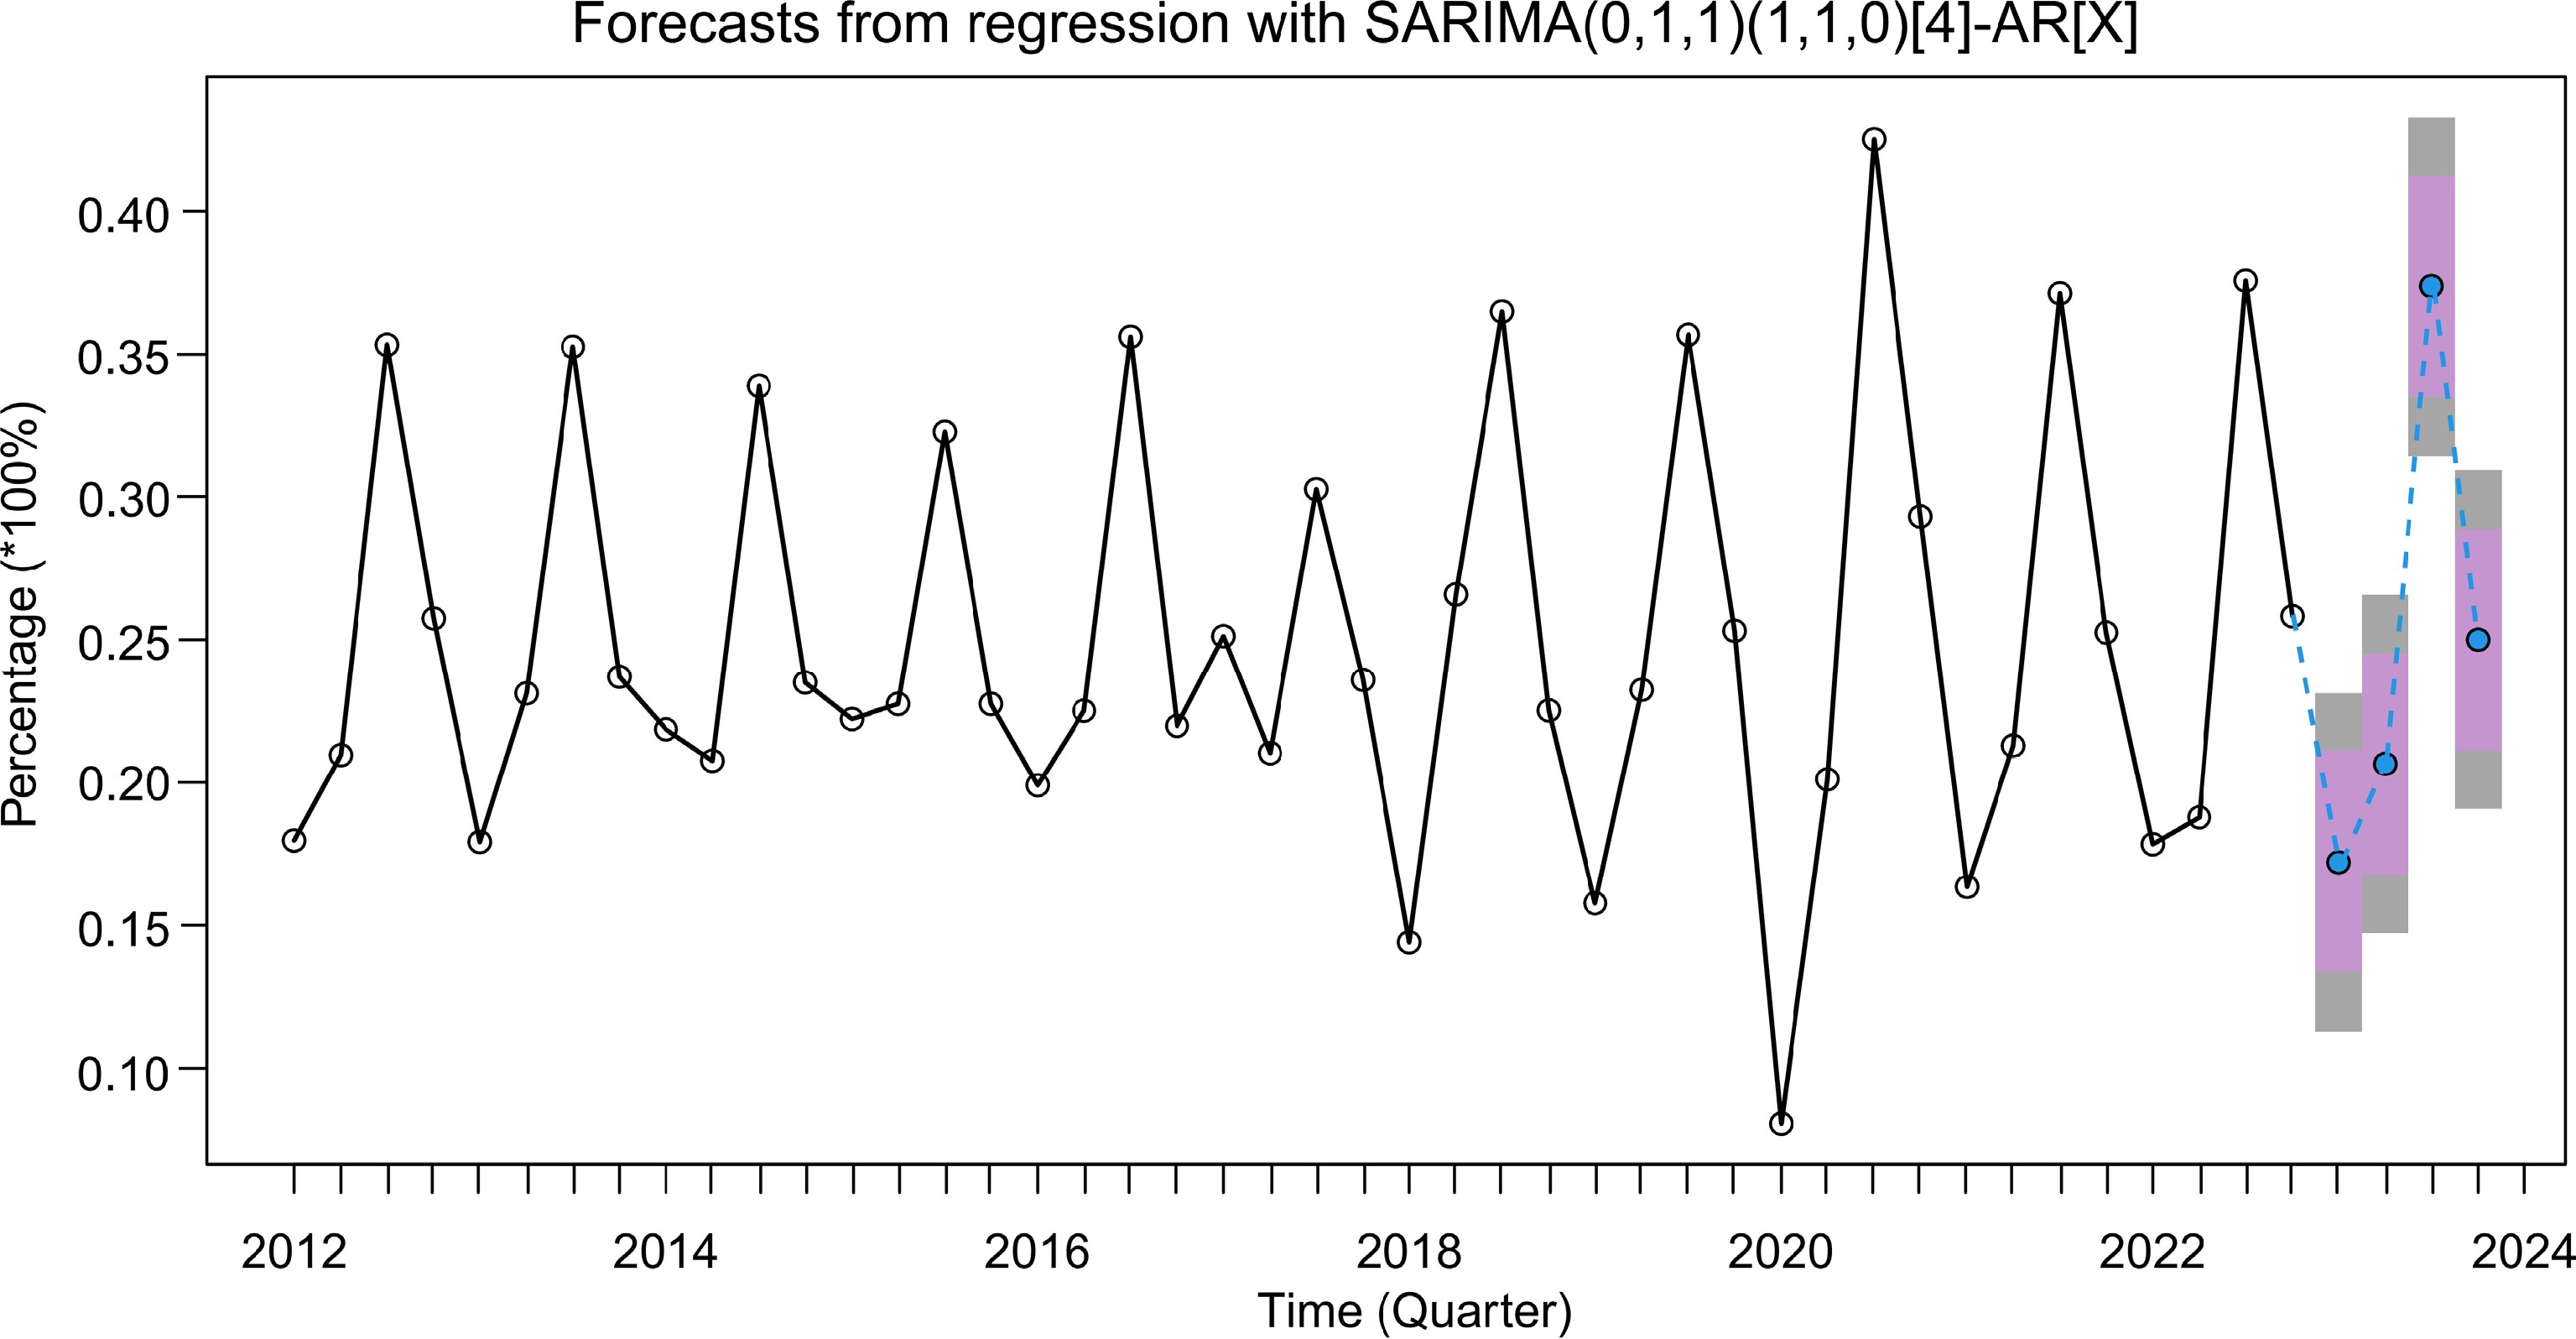
Figure 13.
Trend predition with historical Accident-Percentage data.
Table 8. SARIMAX predition values for the year 2023.
Forecast Lo80 Hi80 Lo95 Hi95 2023 Q1 0.1720433 0.1333529 0.2107337 0.1128714 0.2312152 2023 Q2 0.2065148 0.1678244 0.2452053 0.1473429 0.2656867 2023 Q3 0.3737203 0.3350299 0.4124107 0.3145484 0.4328922 2023 Q4 0.2499829 0.2112925 0.2886735 0.1908112 0.3091548 From Fig. 13, it can be seen that during the predicted four periods, the trend is similar to that of the training set, showing an inverted U-shaped trend: from 17.2% in the first quarter of 2023 its rises to 37.37% in the third quarter of 2023, and then falls to 25% in the fourth quarter of 2023. Forecasts in Table 8 are specific forecasts, while Lo80 and Hi80 are the upper and lower end forecasts with 80% confidence intervals at that point in time, respectively (purple area in Fig. 13), and similarly Lo95 and Hi95 are the upper and lower end forecasts with 95% confidence intervals at that point in time (grey area in Fig. 13. These two regions indicate that there is an 80% and 95% probability, respectively, that the predicted value of Accident-Percentage time series data will fall within this confidence interval during the forecast period. Next, the predicted values are compared with the actual values in the test set (2023). Figure 14 clearly shows that there is only a small difference between the predicted values fitted by the SARIMAX model and the actual Accident-Percentage values, and that the predicted trends are basically the same as the actual trends in the test set. Meanwhile, Fig. 14 shows that most of the predicted values fitted by the SARIMAX model are within the 80% prediction interval, with only one value higher than this interval, while all of them are within the 95% prediction interval. Therefore, it can be seen that the SARIMAX model has high accuracy in predicting Accident- percentage time series data, and can accurately predict the trend of accidents.
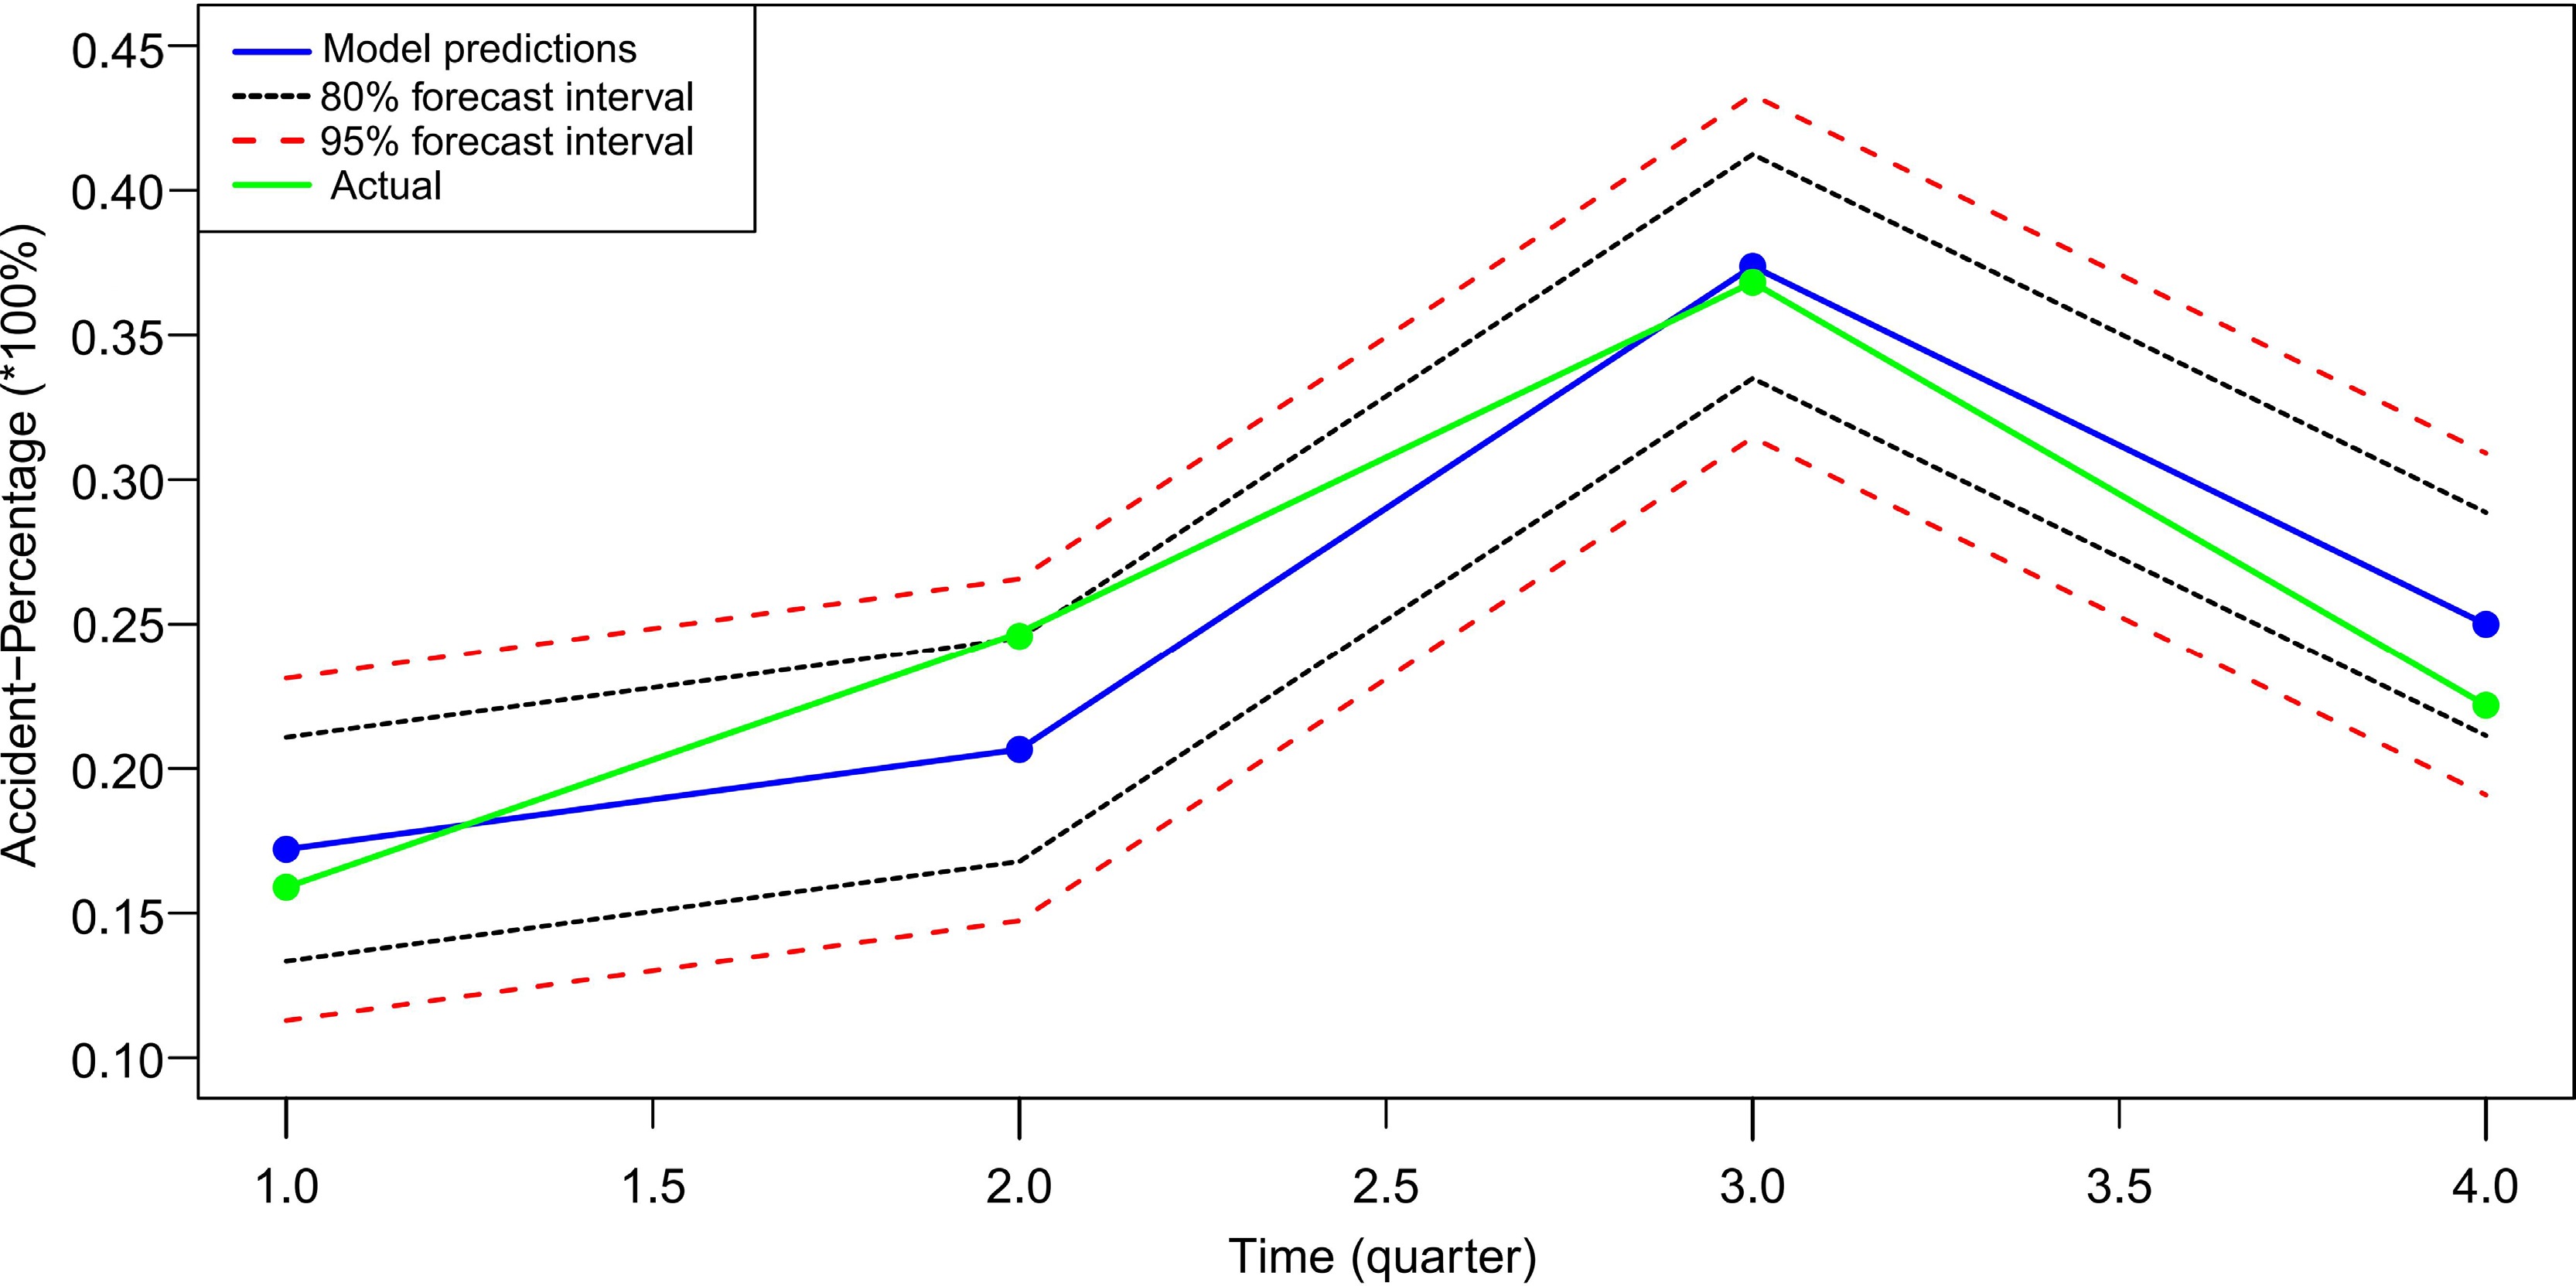
Figure 14.
Comparison of the model predicition values with the actual values in the year 2023.
Combined with the fitting results of the above model, it can be seen that the trend of chemical production accidents in the next four forecast periods (from the first quarter to the fourth quarter of 2023) is similar to that before. According to the prediction results and trends of the number of accidents in the sample period, it can be seen that the Accident-Percentage values in the first quarter and the fourth quarter of each year are small, and the first quarter is usually the lowest and the trend of accidents increased again in the second quarter. The third quarter tends to be the most frequent quarter of the year. The analysis shows that the lowest proportion of accidents in the first quarter of the year may be related to the fact that there are more holidays in the first quarter and the chemical enterprises have stopped production for a long time, and the reason why the second quarter tends to increase significantly compared with the first quarter may also be related to the prolonged suspension of production. Some large-scale chemical equipment often malfunctions when they are started up after a long period of suspension of production. In addition, after returning to work during holidays, employees generally have a weak sense of safety and are relatively slack in their thinking, at which time there may be some omissions in the safety management of the enterprise. According to the forecast results and the change trend of Accident-Percentage value in the sample period, it can be seen that the third quarter of each year, namely July to September, is the highest occurrence period of chemical production accidents in the whole year, and the proportion of accidents accounts for the maximum value of the total number of accidents in the whole year. In the forecast results, the Accident-Percentage reached the highest value of 37.37% in the third quarter of 2023. The analysis shows that July to September is the season with the highest temperature in the whole year, and the high-temperature weather poses certain challenges to the use and storage of hazardous chemicals with active physical and chemical properties. According to the statistics of the accident briefings, due to the hot weather, nitrification, phosphide and other hazardous chemicals spontaneous combustion resulting in major safety incidents is not uncommon. In the study of the above causative factors and accident occurrence patterns, there are also many association rules (Rules 31, 45, 46, etc.) to show the spontaneous combustion accidents of dangerous chemicals occurring in high-temperature weather.
According to the prediction results of SARIMAX model fitting and the above analysis, it can be seen that in the whole year, the beginning of the second quarter and the month of the third quarter are the key periods for the whole year, and they are also the periods with a high incidence of chemical production accidents, which need to be paid attention to. Chemical enterprises can refer to the prediction results and carry out targeted safety production education and vocational skills training for employees at this stage after the holiday. It can also increase safety investment, introduce a safety production reward system, and improve the enthusiasm of employees in safety production, to reduce accidents caused by human negligence. Similarly, in the high-temperature period of summer each year, chemical enterprises need to focus on the storage and use of hazardous chemicals with active physical and chemical properties, improve the daily safety inspection and the update frequency of hazardous chemical storage lists, and prevent the occurrence of spontaneous combustion accidents of hazardous chemicals in high-temperature weather.
-
This study employs data mining technologies to conduct an extensive analysis of briefings on chemical production accidents, yielding insights that surpass the capabilities of traditional mathematical statistics. These results significantly support hazardous chemical production enterprises in areas such as safety management, accident prevention, hazard identification, accident trend forecasting, and overarching safety regulation.
By applying association rule mining with the Eclat algorithm, the research reveals critical, intrinsic associations and robust measures of confidence, support, and lift, elucidating relationships between various causative factors (reactor over-temperature, over-pressure, and limited space operation accidents), and their corresponding accident patterns. The study also examines associations involving less frequent but significant accident occurrence patterns. Furthermore, the construction of a causative factor network model using Gephi® software, coupled with network centrality analysis, has identified key factor nodes, thereby enhancing the prevention and control of similar incidents. Additionally, the analysis incorporates time-series data and SARIMAX model fitting to predict future accident trends based on quarterly Accident-Percentage data.
Despite its contributions, the study acknowledges several limitations, including the insufficient quantity of data and a weak correlation between association rule mining and accident trend predictions. Future research will aim to expand the data collection timeframe and refine the analysis of specific accident patterns by integrating association rule mining with time series prediction to develop more precise prevention strategies.
-
The authors confirm contribution to the paper as follows: Conceptualization: Bian H, Jiang J; formal analysis, investigation, software, writing - original draft: Shi Y, Bian H; methodology: Wang Q, Bian H, Pan Y; project administration: Bian H, Pan Y; supervision: Pan Y, Jiang J; validation, writing - review and editing: Wang Q, Bian H; visualization: Pan Y. All authors have read and agreed to the published version of the manuscript.
-
The datasets generated and analyzed during the current study are not publicly available due to ongoing research commitments. However, the data supporting the findings of this study are available from the corresponding author upon reasonable request.
The authors are grateful for the support given by the Young Scientists Fund of National Natural Science Foundation of China (No. 52004134) and the Key Program of National Natural Science Foundation of China (No. 51834007).
-
The authors declare that they have no conflict of interest. Yong Pan and Juncheng Jiang are the Editorial Board members of Emergency Management Science and Technology who were blinded from reviewing or making decisions on the manuscript. The article was subject to the journal's standard procedures, with peer-review handled independently of these Editorial Board members and their research groups.
- Copyright: © 2024 by the author(s). Published by Maximum Academic Press on behalf of Nanjing Tech University. This article is an open access article distributed under Creative Commons Attribution License (CC BY 4.0), visit https://creativecommons.org/licenses/by/4.0/.
-
About this article
Cite this article
Shi Y, Bian H, Wang Q, Pan Y, Jiang J. 2024. Analysis of chemical production accidents in China: data mining, network modeling, and predictive trends. Emergency Management Science and Technology 4: e006 doi: 10.48130/emst-0024-0009 

Analysis of chemical production accidents in China: data mining, network modeling, and predictive trends
- Received: 11 December 2023
- Revised: 25 January 2024
- Accepted: 19 March 2024
- Published online: 19 April 2024
Abstract: In recent years, China has experienced frequent chemical production accidents. This study collates 1900 briefings of such accidents from 2012 to 2023, sourced from a variety of repositories. By employing association rule mining, we analyzed the connections between causative factors and patterns of these accidents. The analysis revealed significant association rules characterized by high lift values, severe consequences, and patterns not previously recognized. A network model was constructed utilizing Gephi® software to represent the causative factors of these accidents. Through a centrality analysis of the network nodes, key factors contributing to these incidents were identified. Moreover, a SARIMAX model was developed and validated using time series data to predict future accident trends in chemical production. The forecasts generated by this model provide valuable insights for chemical production sectors, highlighting periods with an increased likelihood of accidents. Conclusively, this integration of data mining and predictive modeling could provide a critical method for improving safety protocols and enhancing risk management in chemical industry.
-
Key words:
- Chemical production accidents /
- Data mining /
- Network modeling /
- Accident analysis