


-
Today, safety and security have become essential conditions for the survival of society. Both concepts are multidimensional, and have various aspects and extremely complex connotations. Safety and security cover many areas, such as human rights, health care, food, ecology, environment, morality, culture, politics, national territory, military, economy, society, society, technology, information, resources, markets, property, assets, materials, etc. Currently, experts have realized that security is an interdisciplinary science that contains a system of knowledge about the phenomena and laws of security[1]. The development of security in various fields gradually demonstrates a tendency to develop a universal theory of security and safety. At the same time, each security science that corresponds to a particular field of activity is characterized by its problems and methods of solving them.
Security is now considered one of the most important goals of civilization. That is why the concept of safety and security civilization (SSC) has been developed, which is divided into 12 areas[2]. Among them, technical safety stands out, covering industrial facilities that are sources of potential danger. According to the SSC concept, technical safety is referred to as the 10th component, which may be described as the 'innovative ability to create safe equipment'. By this, the authors of the concept understand the use of technological means to improve the level of social protection, enhance the monitoring of production safety, and create opportunities for early warning of accidents. This is achieved by developing intelligent safety systems, analyzing large databases, and other technologies[2].
A separate component of the SSC concept is to increase public literacy and knowledge of safety and security through education. As a result, a safety culture will be formed in society. The safety culture in the manufacturing process of products is as follows. Designers should not only think about how the object will function properly but also about how it will deteriorate and what will cause it to fail. Operators who use initiative-taking maintenance strategies, thus preventing emergencies, also putting the SSC concept into practice. The risk-based maintenance (RBM) strategy for industrial equipment is known, which monitors safety and aims to prevent dangerous failures[3]. There is a transition from the 'find and fix' principle of equipment maintenance to the 'learn and prevent' motto.
The purpose of this paper is to present the main stages of the algorithm for assessing the technical condition of industrial equipment by monitoring the level of safety developed by the authors. The task was also to outline the place of technical safety in the civilizational concept of safety and security. In the research aspect, the task arose to quantify the influence of organizational and legal factors on the level of losses from accidents and on the change in the position of equal risk curves.
-
The problem of technical safety was addressed by experts in the 1950s, associating it primarily with the mistakes of operators who control technical systems. A threshold frequency (0.01...0.02) was established, which is used to assess the reliability of systems[4]. At present, this approach has evolved into such a specific area of reliability theory as the reliability of the machine-human system. In the 1960s, attention began to be paid to the consequences of failures, which led to the emergence of risk analysis and the fault tree method[5,6]. These are universal tools that are based on the study of the development of a sequence of failures of technical system elements. The fault tree allows you to determine the probability of an emergency, which in many cases is equivalent to the probability of failure. Documents have been developed that regulate the acceptable level of risk and the procedure for determining it for various fields of technology.
In the early 1970s, an additional impetus to the development of engineering safety was the realization that with the development of unit productivity of technological machines and units, the way to ensure reliability as learning the lessons of failures is very costly. Moreover, at that time there were several accidents at industrial plants with a considerable number of deaths[7]. Methods were developed for identifying hazards and for quantifying the consequences of failures.
Engineering safety assessment methods evolved from structural mechanics when the statistical theory of strength was applied to assess seismic risk[8]. Since then, the concept of safety as a synonym for reliability has been applied to technical facilities whose operation is intended to reach a limit state. Since the 1970s, the probabilistic safety analysis of nuclear power plants has been actively developing in the world, designed to initially show that their operation does not cause damage to human health and the environment that exceeds the losses from the operation of other energy systems. The solution to a similar problem, that air transportation is safer than passenger transportation by other modes of transport, contributed to the intensive development of aviation. Successes in the development of probabilistic safety methods in nuclear power and aviation have prompted their use to assess the service life of potentially hazardous mechanical systems in virtually all areas of technology.
Another source of technical safety was the concept of probabilistic structural integrity, which emerged as a counter to the deterministic approach. Deterministic calculations, which had prevailed since the mid-19th century, led to errors in predicting the behavior of structures. This situation was the result of not considering sufficient information about the operating conditions of the facility. The probabilistic approach is a traditional method of overcoming the uncertainty of the initial parameters. Back in the 1920s, it became clear that the effectiveness of forecasting was based on the use of both the average values of the initial data and their variances; in the 1940s, the concept of a statistical safety factor was already used[9]. At the same time, the classical theory of reliability, based on mathematical and statistical methods, began to actively develop. They complemented the probabilistic approach of structural integrity.
This path eventually led to the emergence of structural reliability methods. Unlike classical reliability methods, they are based on probabilistic physical methods or Physics of Failure[10]. They consider the nature of degradation processes acting on the product. It can be considered that structural reliability is a Mature Reliability Methodology. Having been developed for mechanical systems, it is now being applied to electronic systems, which have traditionally been the area of interest of classical reliability[11].
Since the end of the 20th century, proactive strategies for equipment maintenance have been developed in industry. They are aimed at maintaining proper levels of safety and reliability while reducing equipment maintenance costs. The share of repair personnel can reach up to 30% of the metallurgical enterprise staff. If the average share of maintenance costs for all costs in general industrial production is 5%, then this share for chemical production is 6.8%, and for steelmaking, it is already 12.8%. In metallurgy, maintenance costs are 8.6% of investments in production (against 3.8% in chemistry)[12].
For large-scale manufacturing facilities, where a significant number of units are operated under identical conditions, it is advisable to use reliability-centered maintenance (RCM). Here, mathematical, and statistical approaches of classical reliability are used. For small-scale, unique production facilities, it is important to apply a service strategy risk-based maintenance (RBM). An individual approach together with probabilistic and physical methods is adequate.
The actualization of RBM is facilitated by the global trend of extending the operation of industrial facilities that have overcome the standard service life. Long-term operated facilities, created during the period of economic growth in the second half of the 20th century, are approaching the end of their standard service life, which is associated with an increase in the risk of operation and the number of man-made accidents. However, often, despite obsolescence, their mechanical systems still have sufficient technical resources. It is inexpedient (impossible) to completely decommission such facilities, but it is more rational to extend the service life by diagnosing their systems, and modernizing weak points. At the same time, it is required to comply with technical safety standards, which means the property of structures that allows them to be operated, minimizing damage from failures.
From the above review, it follows that engineering safety can be interpreted as the reliability of critical elements of a system, the failure of which is associated with significant losses. Thus, ensuring safety characterizes the current stage of development that follows the methods of mechanical system reliability. At the beginning of the 21st century, the transition from ensuring strength to ensuring safety has become so rapid that some scientists consider it a second revolution in the science of strength[12].
-
In many engineering practices, safety is interpreted as the technical condition of an object in which all existing risks do not exceed their limit values[13]. This leads to three problems: (1) Choosing a metric for quantifying risk and safety; (2) Setting the limit level of such an indicator; (3) Combining individual risks into a single overall risk of the entire technical system.
Risk and safety indicators
Natural risk indicator
-
Traditionally, risk is calculated as a function of two variables:
$ i=fS $ (1) where f is the frequency of emergency failures [failures/time], and S is the intensity of damage from them individually [damage/accident]. This means that the risk has the dimension of the amount of damage per unit of time [damage/time]. The peculiarity of this metric is that both variables in Eqn (1) are interdependent. This is reflected in Farmer's method, which studies the relationship between the cumulative frequency Fn = f1 + f2 +...+ fn for the number of levels n with accident severity N. Usually, the Farmer curve is represented by the following formula:
$F={F}_{1}{N}^{-a} $ (2) where F1 is the frequency of failures with conditional single losses, a is risk aversion factor.
If in Eqn (2) the indicator
$ a=1 $ 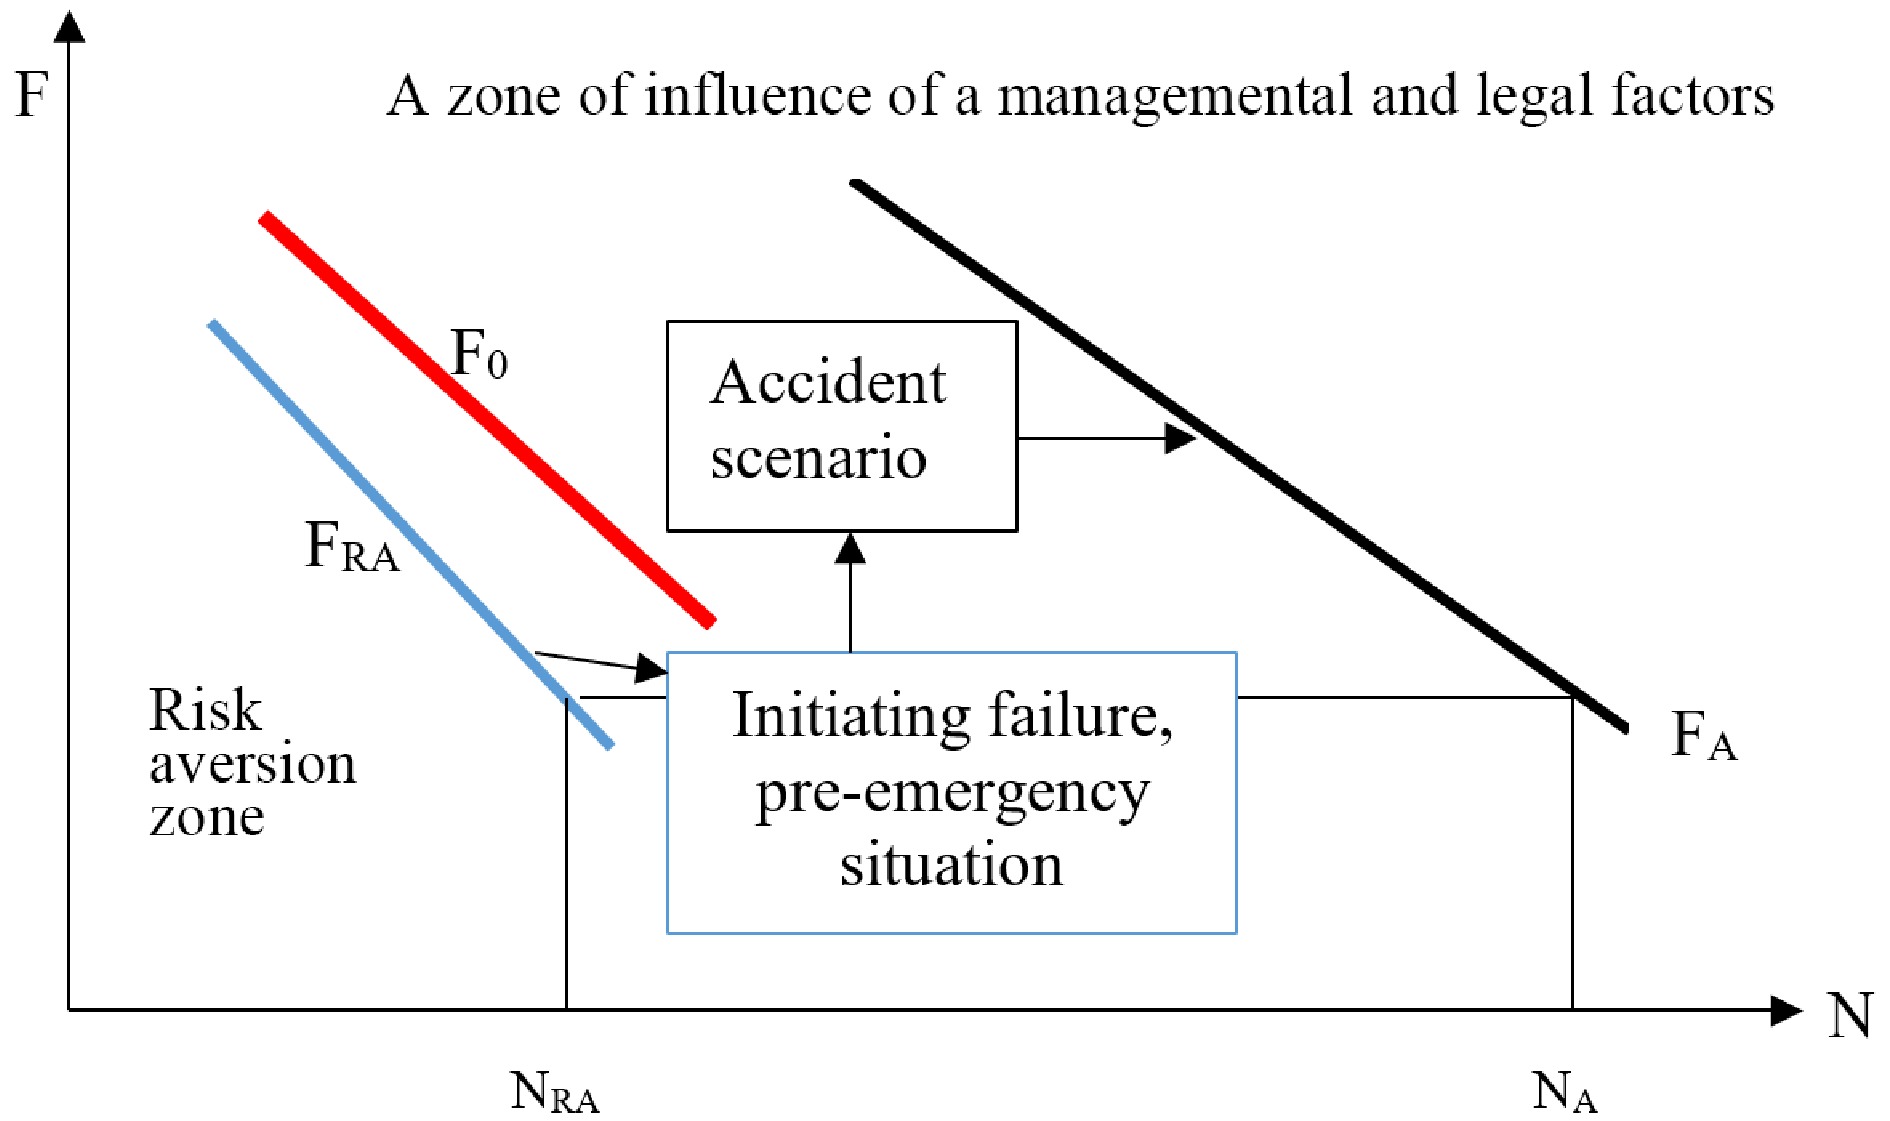
Figure 1.
F-N-curves of neutral risk (F0), risk aversion (FRA) and the scheme of formation of high-risk curves (FA).
For mechanical systems, as a rule, the index of Eqn (2) is greater than one: 1 < α < 2. A situation is formed when the object does not perceive risk at the expected level, fulfilling a more optimistic scenario. The F-N diagram corresponding to this situation is called the risk aversion curve (FRA, Fig. 1). The effect of risk aversion is related to the properties of a mechanical system, the laws of aging of its elements and is objective.
Dimensionless risk indicator
-
According to some regulatory documents, risk is interpreted as a combination of the probability and severity of failure, primarily accompanied by injury or damage to human health[4]. Using the Bayesian interpretation of probability as a measure of the reliability of the result, the risk can be represented as follows:
$ i=QS$ (3) where Q is the probability of failure (accident). That is, the risk is a specific indicator that determines the absolute (total) damage I during the operation time t:
$ I=it$ (4) At the initial stages of risk analysis, experts used the probability of failure Q as its main characteristic. The reason for this is that the severity of failure or intensity of damage has a vague interpretation[14]. It was decided to separate its material and frequency components into risk assessment. The use of Q in this aspect makes it possible to consider safety as the reliability of purely critical elements of a technical system. Then safety R represents the opposite side of the risk.
The disadvantage of the Q indicator is that it is difficult to use as a comprehensive diagnostic parameter of technical condition. It is poorly sensitive to the operating time t[15]. In comparison, it is more effective to use a dimensionless risk indicator in the form of odds-ratio:
$ \rho =Q/P=Q/(1-Q) $ (5) where P is the probability of failure during the service life.
Then the operation will be safe:
$ R=1-\rho $ (6) Thus, in this form, safety is consistent with its interpretation as the technical condition of a facility in which the risks of its operation do not exceed acceptable (permissible) levels. Dimensionless risk indicators vary from zero (complete safety) to one (termination of the safe state). According to Eqn (3), the full risk ρ occurs when the facility's operating time equals its average durability T0, and the reliability P is 50% or Q = 0.5. That is, the risk measure in the form of Q is less conservative than the metric ρ. At realistically achievable levels of reliability, where the probability of failure does not exceed Q < 0.05, the level of safety R practically becomes equal to the probability of failure P. That is, under conditions of Q < 0.05, the risk is equal to the probability of failure: ρ ≈ Q.
Given the level of damage from the failure of the entire technical system SΣ , denoting the significance of the failure of the i-th element under the influence of the k-th degradation process as criticality
$ u_{ik}=S/S_{ik \Sigma} $ (7) we obtain the generalized risk of the system:
${i}_{\Sigma }={S}_{\Sigma }\cdot \sum {Q}_{ik}\cdot {u}_{ik} $ (8) Thus, it is possible to compare risks within a single entity using a dimensionless expression that is signed as a sum, which can be called the dimensionless risk of the system:
$ {\rho }_{\Sigma Q}=\sum {Q}_{ik}\cdot {u}_{ik} $ (9) If we use the dimensionless risk indicator ρik instead of Qik, we get the same result:
${\rho }_{\Sigma }=\sum {\rho }_{ik}\cdot {u}_{ik}$ (10) On this basis, risk can be interpreted as the product of the probability of failure and its significance, which is confirmed by Eqn (6).
Resource safety index
-
In general, the algorithm for determining reliability P may differ for sudden and gradual failures. The same may apply to the determination of the dimensionless risk ρ. This problem is fundamentally solved by using the comparative model 'operating time - resource', which embodies the resource approach[3]. It works well at the stage of operation when the diagnosis of residual life is conducted by controlling the natural parameter, which is the operating time t. The ratio of the maximum operating time t at the time of control to the minimum resource TP (determined in the statistical aspect by its distribution functions) forms a guaranteed safety margin nTP. The logarithm of its current value forms the resource safety index (resource safety index). It decreases linearly with operating time. Reaching zero value by the resource safety index indicates that the facility is operated with an unacceptable risk.
The probabilistic reserve of the resource nTP is the inverse of the probabilistic accumulated damage in the resource interpretation dP. Then, for an individual safety index with level P = R,[3,14,15] is true:
$ {\beta }_{Pik}=\mathit{lg}\dfrac{{T}_{P}}{t}={lg}{n}_{TP}={lg}{d}_{P}^{-1}$ (11) In the resource-based interpretation, the current damage a is equal to the dimensionless risk index[14]. Then the resource safety index for systems will be:
$ {\beta }_{P\Sigma }={{lg}(\Sigma {u}_{ik}\cdot 1{0}^{-{\beta }_{Pik}})}^{-1} $ (12) Acceptable levels of risk and safety
-
The criterion of calculation under the concept of comprehensible risk is formalized in an aspect:
$ \rho_T \lt \left[\rho\right]\; \ \ \ \ or\ \ \ \ \; R_T \gt \left[R\right] $ (13) when current risk levels or safety ρТ and RТ are compared with limiting values [ρ] and [R]. Determining the latter is an original obstacle that is caused by the variability of risks over time.
The basic possibility of criteria application of safety and risk control is illustrated using diagrams of optimal life expectancies Тopt and risks ρopt (Fig. 2).
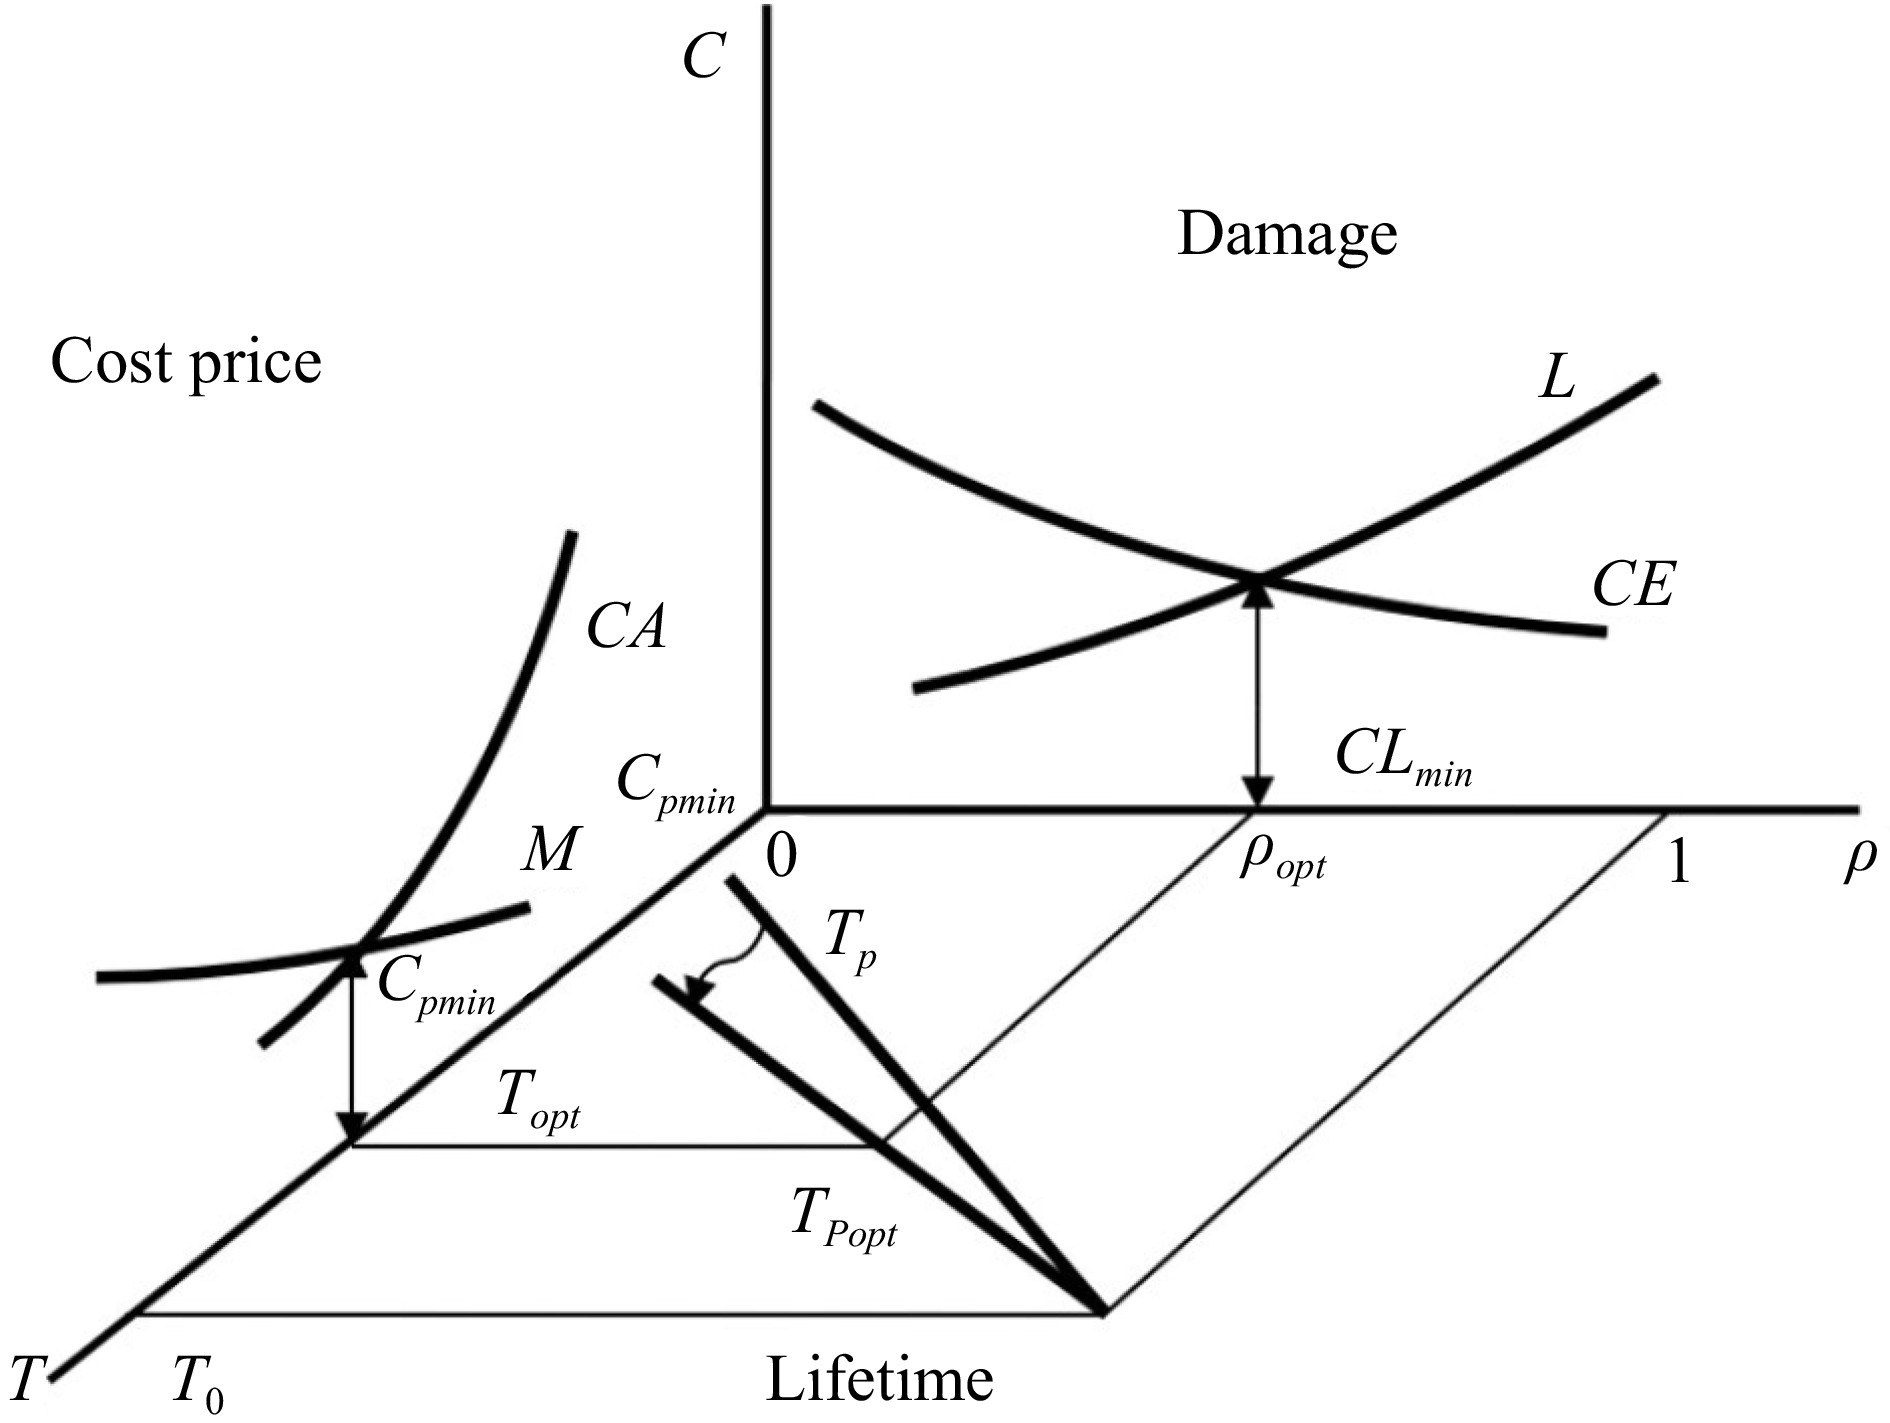
Figure 2.
The principle of finding the optimal risk ρopt and improving safety when transitioning from the assigned resource allocation function F to the initial resource allocation function Fopt , the guaranteed value of which should correspond to the optimal risk ρopt and the optimal service life Topt.
Their values correspond to the minimum of the cost of production Cpmin and the potential injury CLmin, estimated in monetary unit C. The cost price Cp, in addition to fixed costs, includes the cost of equipment CA, which is reduced by amortization, both maintenance costs and reconditioning M, which increases with the aging of the equipment. Total damage СL consists of expected material losses of manufacture L which are as high as the risk is higher, and from the cost of the technical system CE itself which under abnormal conditions can be taken out of service. The link between the diagrams is proposed to be realized using a distribution function of life expectancies ТР due to which the operational performance of risk ρ returns itself to a material component.
Optimization of the function ТРopt at which the median (determined) value of life expectancy of Т0 corresponds to complete risk is done in the direction of increasing in accuracy of prediction (arrow, Fig. 2). The demanded guaranteed longevity should be fixed taking into account cost reasons and corresponds to the magnitude of Topt which should guarantee safety R = 1 − ρорt . The predicted value of TR in the function of TРopt should be not less than the demanded value. Thus, an increase in the accuracy of life prediction expectancy is equivalent to an increase in the safety of maintenance. Thus, the average level of T0 is reached by traditional actions. The proposed approach allows us to fix an objectively admissible level of safety - risk now of control, as [ρ]Т or [R]Т.
Diagnosing the technical condition
-
Ensuring industrial safety is based on the concept of phased assignment of the warranty service life of technological equipment. This concept is an integral part of the field of mechanical engineering, sometimes called Lifetime Mechanics[16]. The idea of implementing machines with the help of resource mechanics is that objects are designed for a guaranteed assigned service life, and during operation, due to the identification of aging models, the technical condition is reassessed, a more accurate (with less scatter) initial service life is established, and then the sequence of residual resources is determined. At the same time, reliability and safety indicators are determined using the 'accumulated operating time - lifetime' comparative model. This makes it possible to design a material-efficient product with the required level of reliability, and at the stage of operation - to ensure safety at the fullest exhaustion of the resource.
In the studies by Belodedenko & Bilichenko[13], and Belodedenko et al.[15], the authors demonstrated the possibility of using the natural risk indicator as a diagnostic parameter of the technical condition of the facility. Over the course of operation, the risk of the intensity of total losses increases. The parameters of the Farmer's curve also change the unchanged position which corresponds only to a certain technical condition of the object. Changes in the quality of the technical condition are characterized by a new position of the F-N curve. This algorithm is effective for determining the optimal service life of a facility but is not suitable for planning ongoing rehabilitation activities.
For this purpose, it is more productive to use dimensionless risk and safety indicators. The safe stage of operation is limited by the guaranteed durability before the appearance of a crack TР when the reliability is p ˂ 0.95. At this stage, the technical condition is controlled by the resource safety index, the critical value of which is βР = 0 (green zone, Fig. 3).
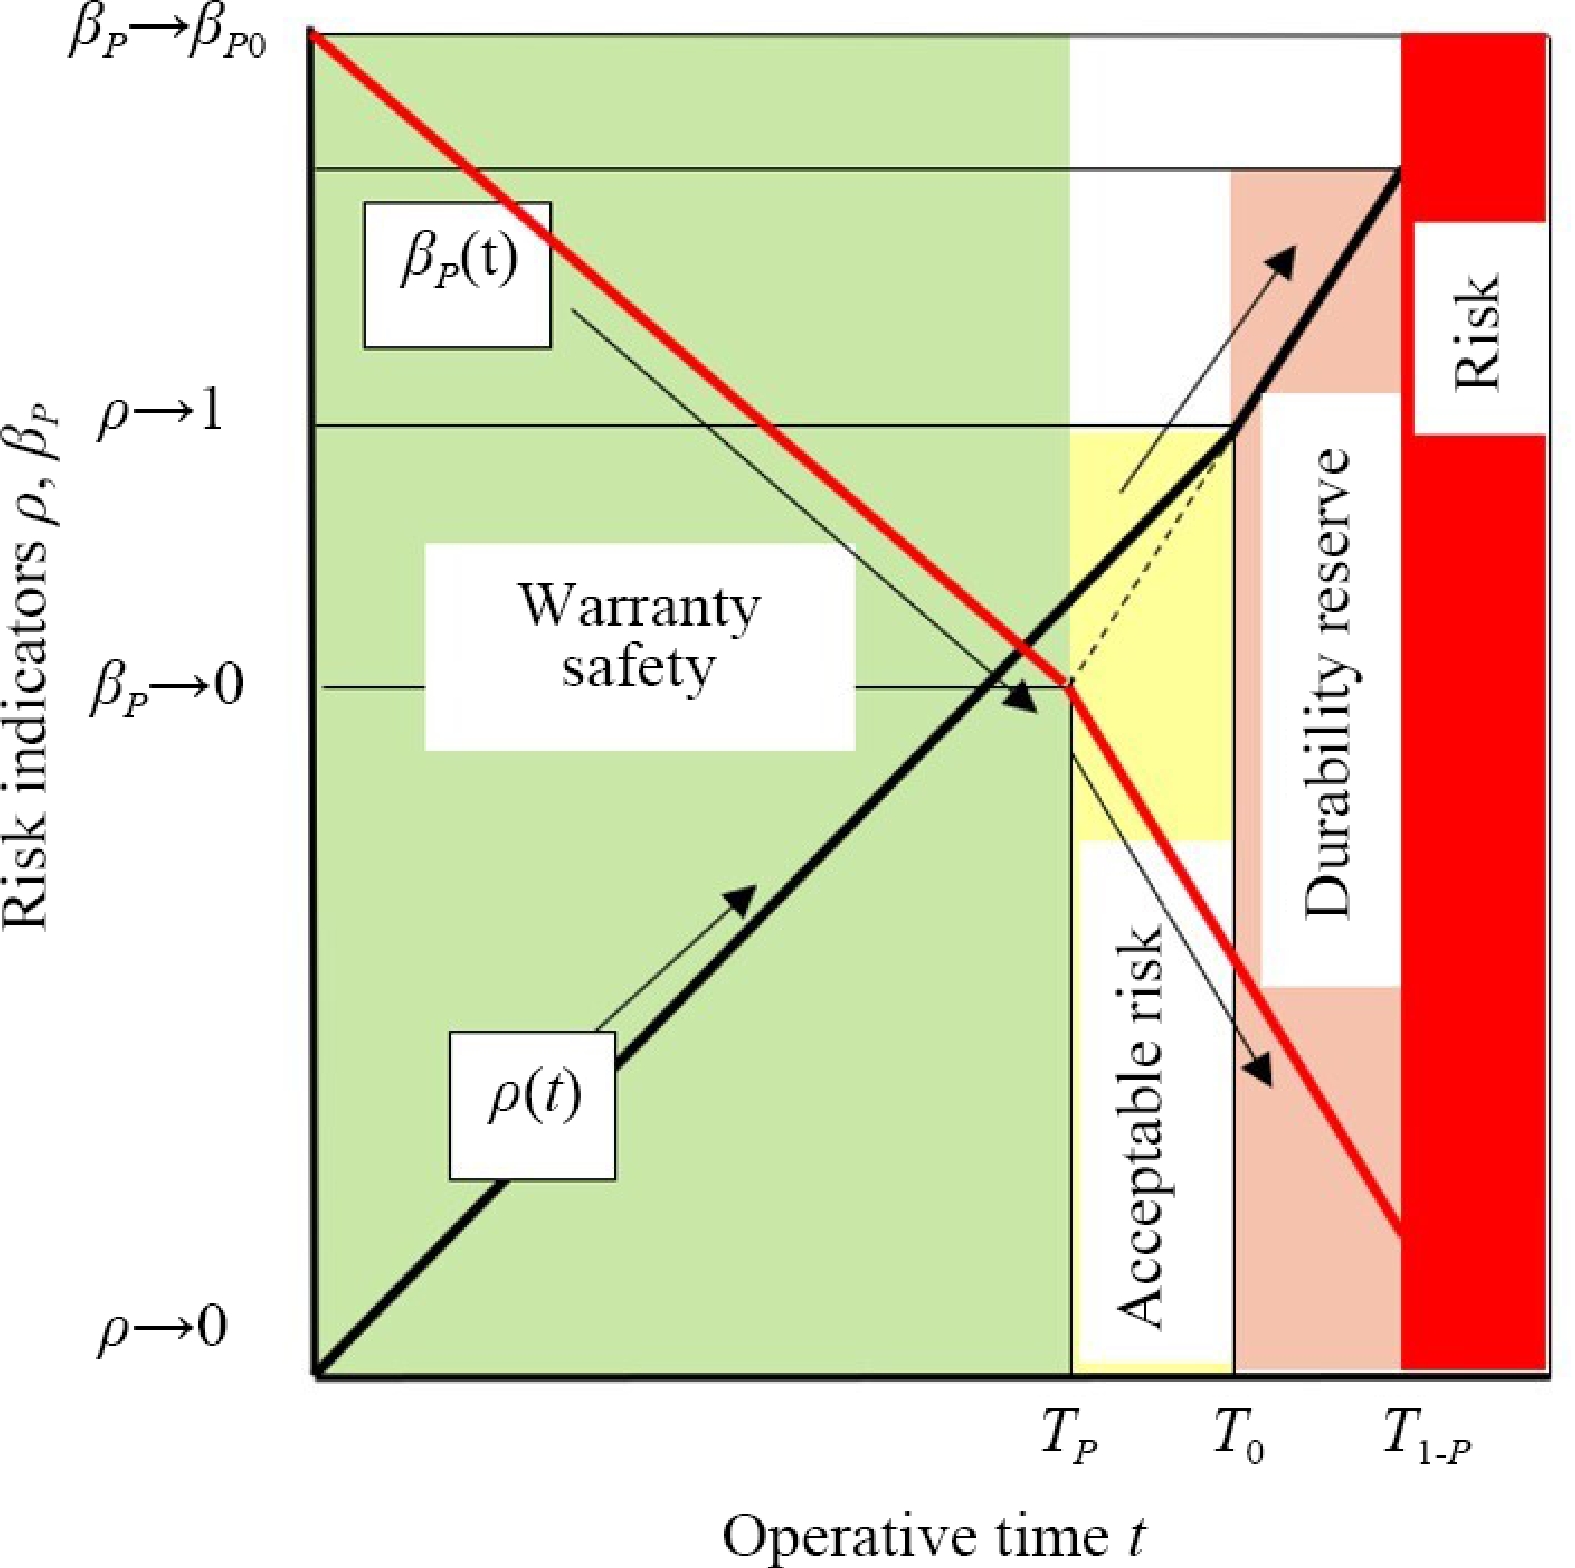
Figure 3.
Application of risk and safety indicators for diagnosing technical conditions.
The initial value of the safety index βР0 is 0 and corresponds to the logarithm of the guaranteed durability. During operation, the value of βР decreases linearly. After the guaranteed service life is exhausted, in most situations, reliable operation of the system is possible, but the technical condition is already controlled by a dimensionless risk indicator ρ. The zone of acceptable risk, into which the safety zone passes, is closed between ρ→0 and the critical value ρ = 0, when the reliability becomes p = 0.5 and the durability is the median T0 (yellow zone, Fig. 3). Further operation of structures is accompanied by the appearance of cracks that cannot always be detected by diagnostic tools. This stage is characterized, as a rule, by the growth of the crack to a size that can be confidently detected by diagnostic tools. The service life T1-Р corresponds to an increased risk (pink zone, Fig. 3). Operation in this zone can be perceived as a resource reserve. When the operating time reaches this value t > T1-P, the object needs to be repaired (red zone, Fig. 3). The purpose of diagnostics during the service life extension procedure is to find out in which zone the equipment is located and what are the parameters of the service life exhaustion function. In this role, the safety functions βР (t) and risk ρ(t) are used. The intensity of resource depletion changes at each stage.
-
The interdisciplinary nature of safety is most clearly manifested when considering organizational and legal factors when calculating total losses L (Figs 1, 2). The level of losses depends not only on the properties of the technical system, which can be determined by Farmer's curves F0 and FRA. For this purpose, the severity of failures is used, which is limited by the knowledge of one branch of technology. F-N curves determine the probability of an initiating failure or emergency (Fig. 1). Further risk analysis is conducted using logical and probabilistic models in the form of fault trees and accident scenarios. Further losses depend on the organization of production. If a failure triggers the next chain of failures, its severity will increase. Then the neutral risk curve is transformed into an increased risk curve (FA, Fig. 1). Since low-severity failures (upper part of Fig. 1) are associated with less consequences, the new F-N curves will have a lower slope and a value of a < 1. In addition to managemental factors, it is also worth considering legal factors, as fines are used to regulate safety. While the F0 and FRA curves are objective, the FA high-risk curves are subjective. Thus, the presence of managemental and legal factors gives the security problem a complex interdisciplinary aspect.
In the area bounded by the curves F0, FRA, the severity of failures N can be measured in various dimensions, such as downtime, product loss, or the number of fatalities. For high-risk curves FA, the severity must be evaluated in monetary terms.
To illustrate the above, based on the information provided in the previous studies[13,17], the authors developed scenarios of similar accidents of two blast furnaces (BF). In terms of the intensity of damage from accidents, metallurgy ranks 4th−5th after rocket and space technology, nuclear power, chemical reactors, ahead of the mining industry, transport, construction, and mechanical engineering[13]. Both accidents were accompanied by explosions in the furnace space and 'bouncing' of the furnace body, after which red-hot charge poured out onto the cast house. The first accident occurred on September 7, 1993, at a metallurgical plant in Ukraine. The second accident occurred on November 11, 2001, at a steel plant in Wales, UK.
After both accidents, BF's operation became impossible, and they were taken out of service. The explosions were caused by water meeting molten smelting products. In the first case, water entered the furnace as steam condensation through the upper structure of the BF, and in the second case, it was caused by the burnout of refrigerators in the lower part of the BF (Figs 4, 5). In these figures, the events that initiated the accidents are obscured.
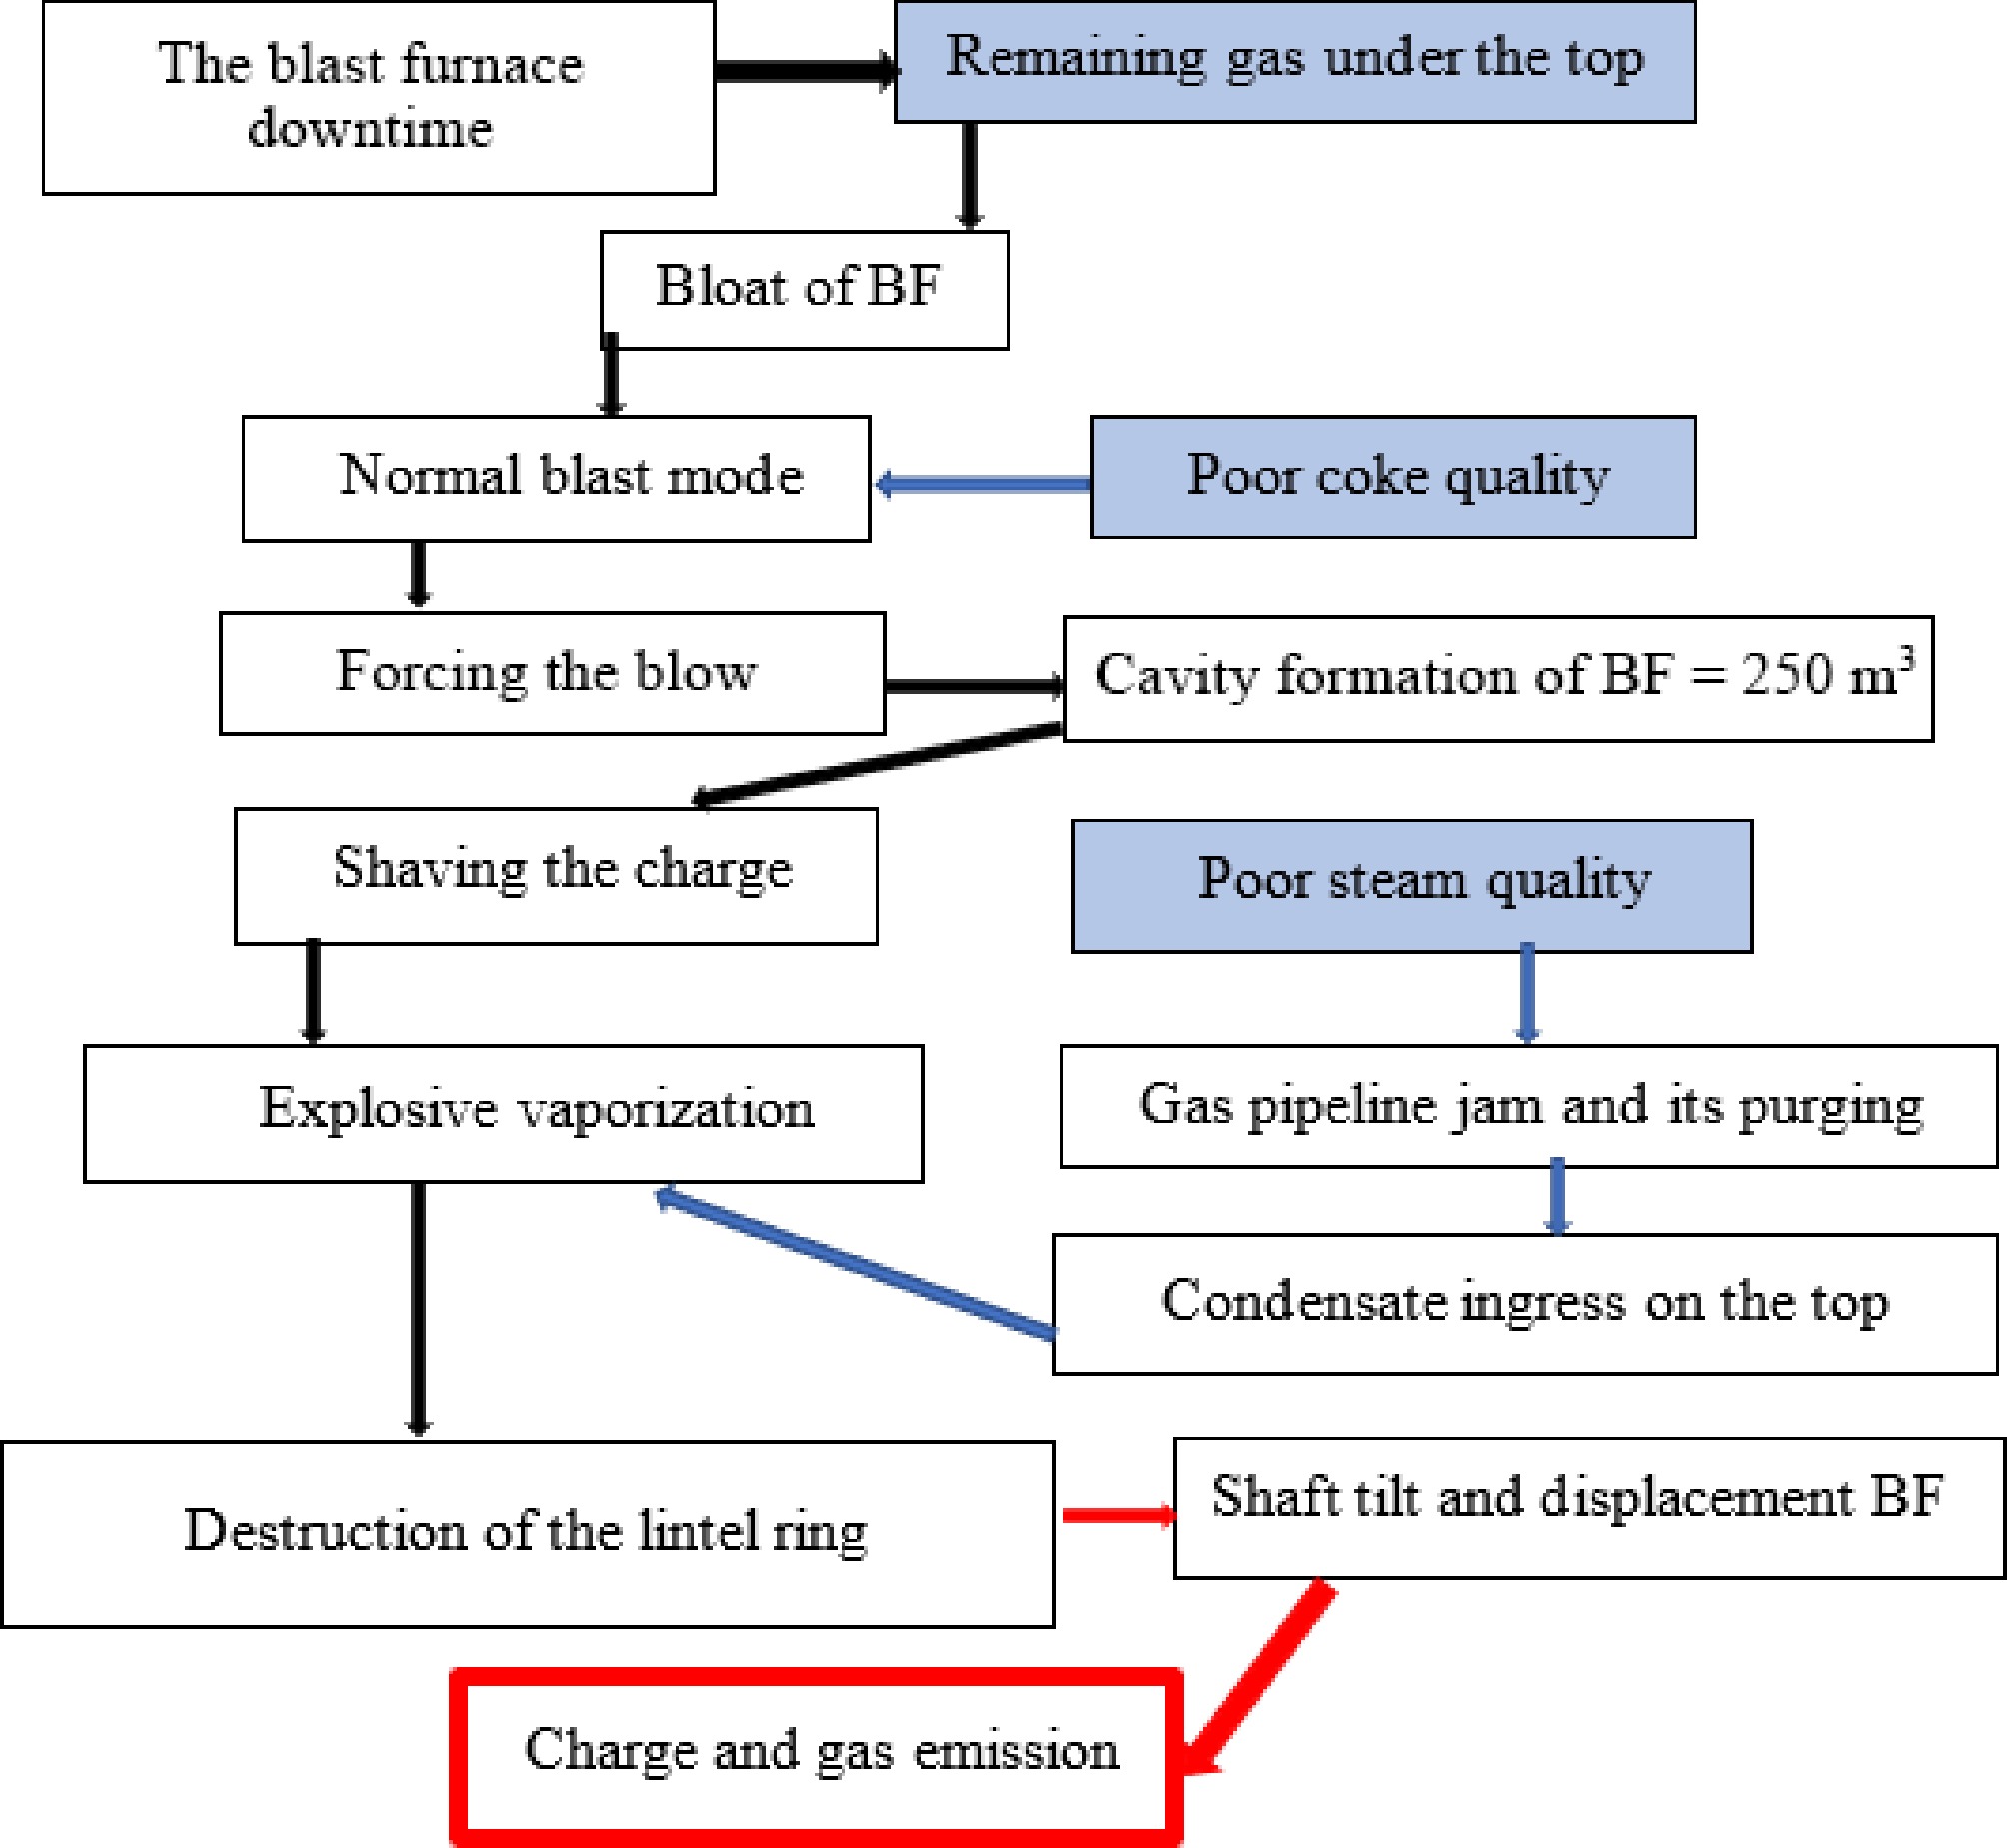
Figure 4.
Scenario of the accident at the blast furnace in Ukraine.
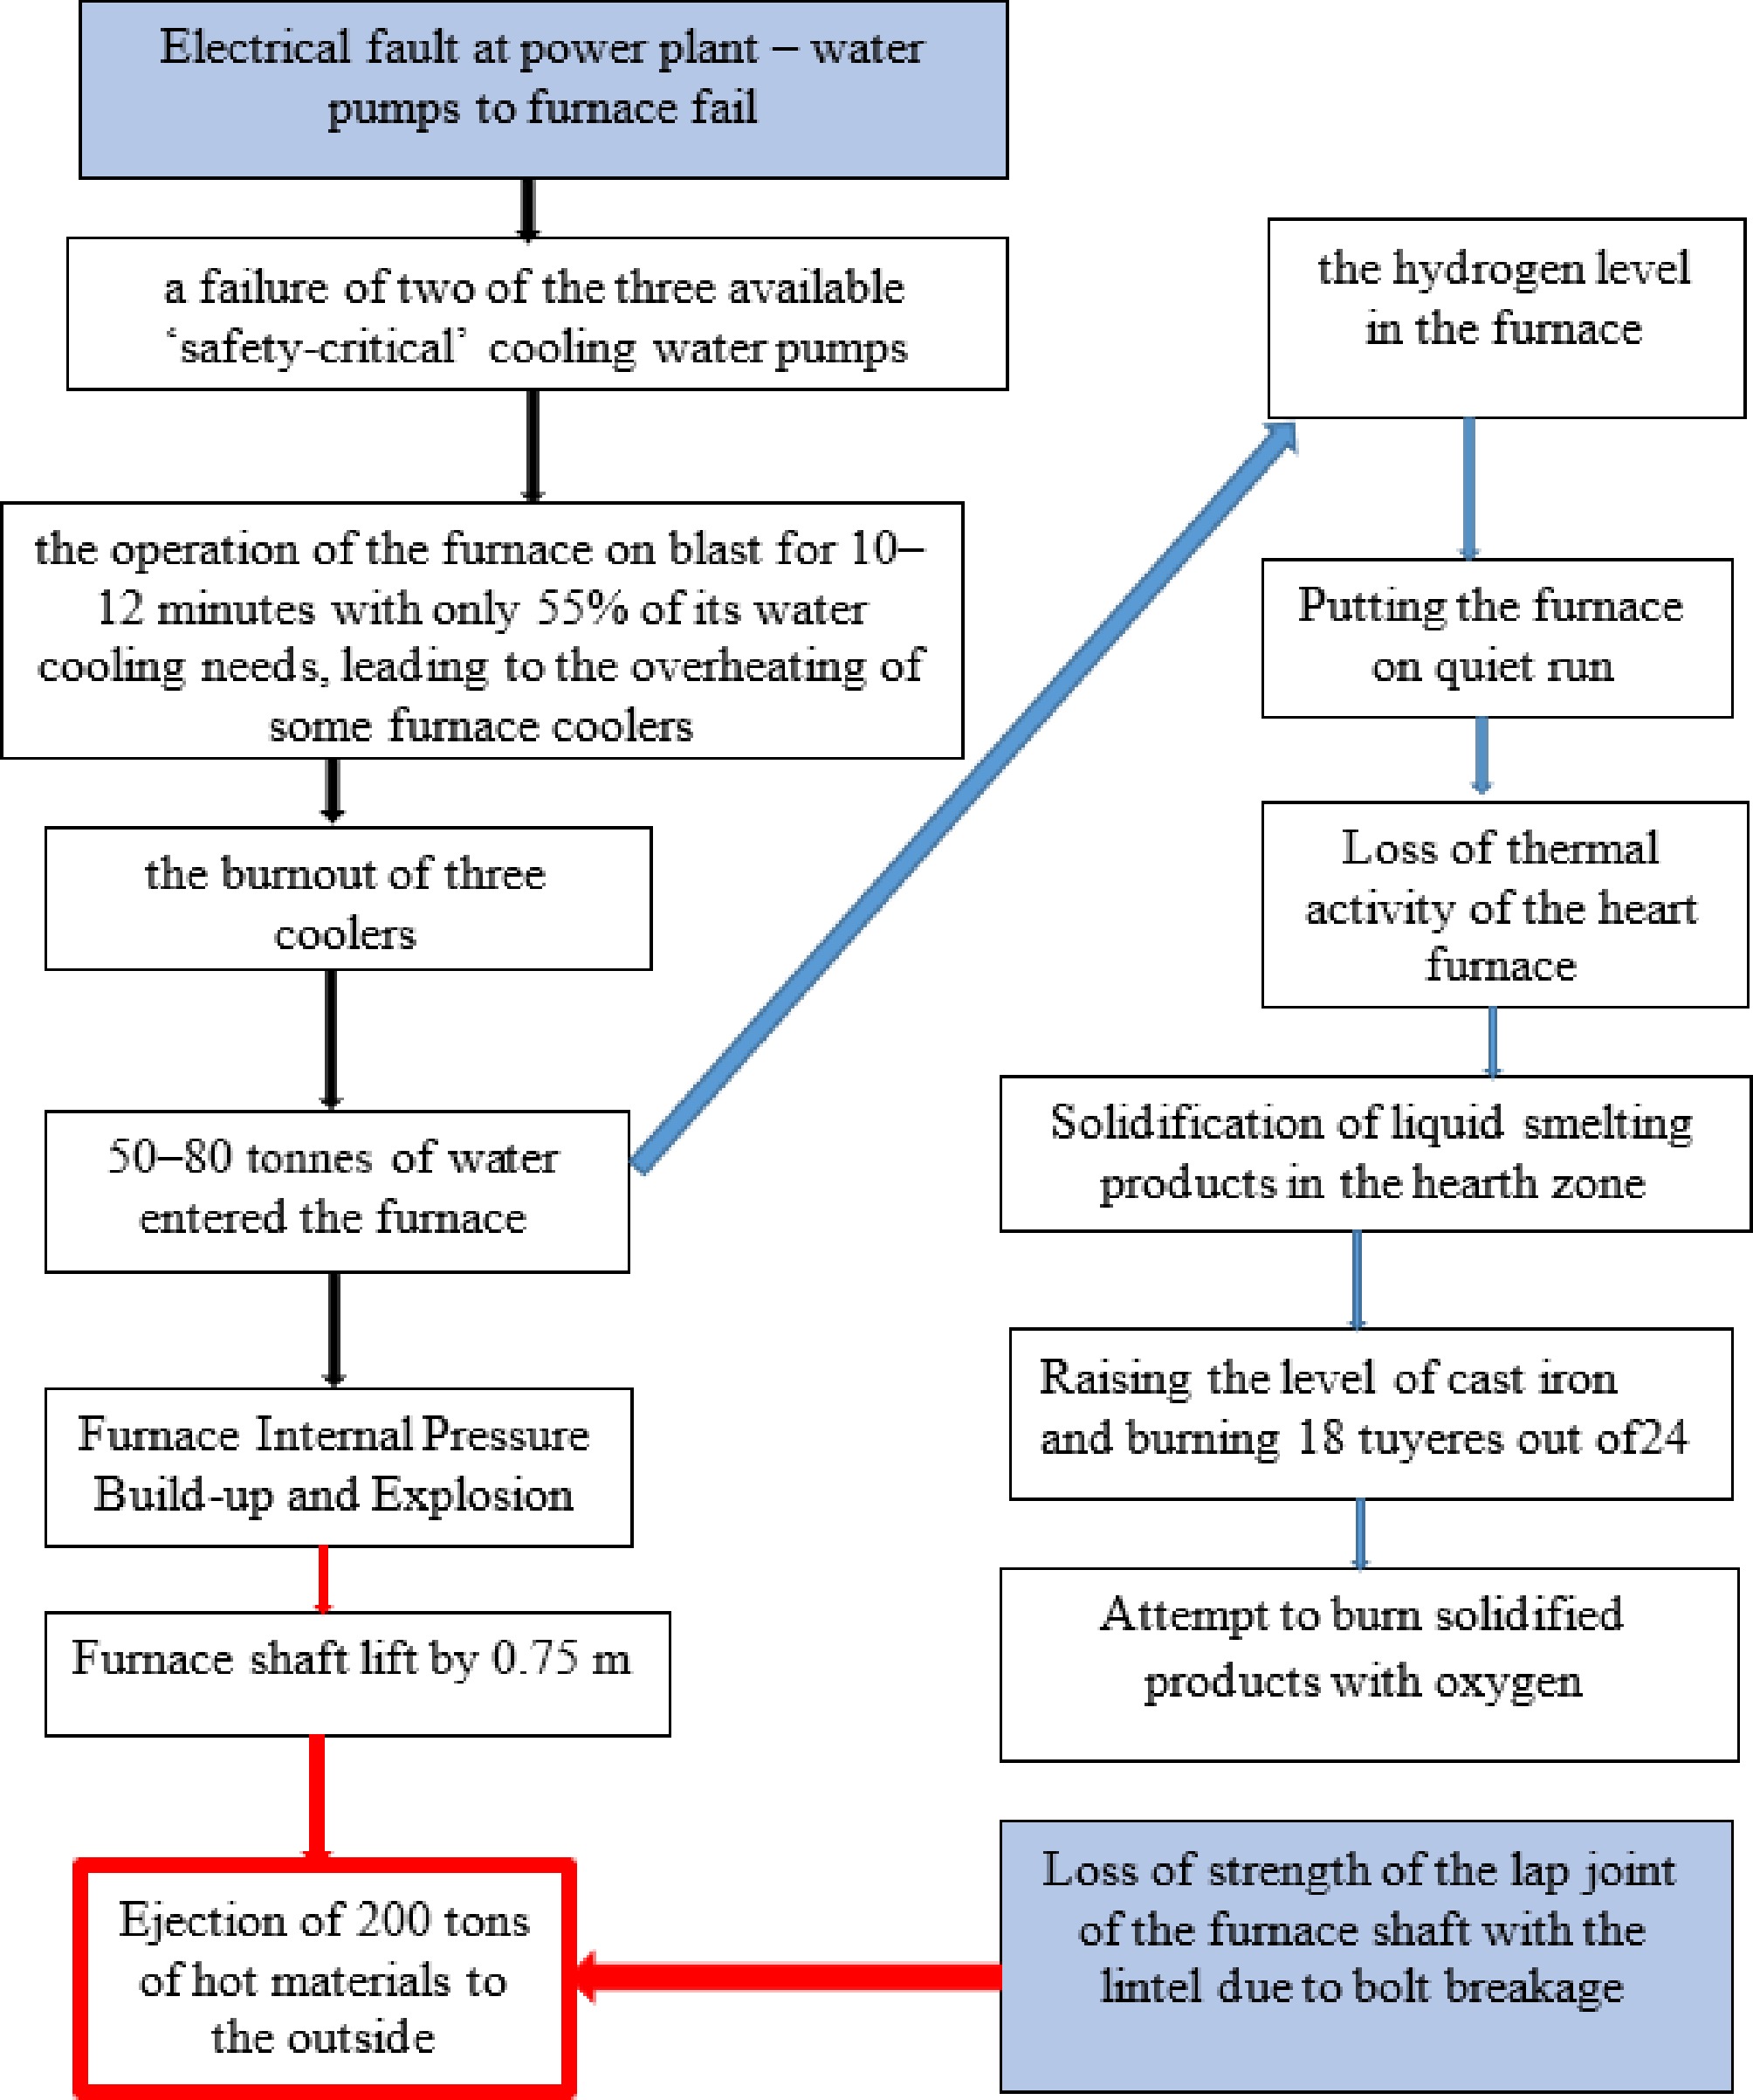
Figure 5.
Scenario of the accident at the blast furnace in Wales.
The accident in the Ukraine is the most serious in the steel industry. It killed 18 people and injured more than 30 workers. According to the investigation report, the accident was preceded by a chain of events and personnel actions that violated 11 points of the technical operation regulations. Moreover, each violation could not have led to a similar outcome. An unfavorable combination of eight production factors was observed (Fig. 4). Such a scenario is difficult to predict without a precedent. All of this demonstrates the relevance of developing emergency scenarios.
The second accident in Waless claimed the lives of three workers. The court fined the company that operated the plant at the time £1.33 million and awarded £1.75 million in damages. This does not include production losses.
In both cases, the accident developed for about two days. The staff took certain measures to stop the unfavorable events. Both accidents occurred at the final stages of the BF campaign. Therefore, the condition of the supporting structures was not perfect. In the first case, the furnace failure occurred along with the shaft causing in the tuyeres and in the shoulder (bosh). In this part, cracking was observed, which led to a decrease in strength. In the second case, the furnace lifting from the explosion was made possible by the destruction of the bolts that connected the furnace shaft (upper furnace shell) to the furnace shell (bosh shell). The bolts were made of different steel grades and were prone to brittle fractures. If they had been made of the steel specified in the drawings, the strength of the connection would have been preserved[17].
Several conclusions can be drawn from the above. A related factor in accidents is damage to mechanical equipment that is not detected promptly. Therefore, diagnosing the technical condition of structures is an integral part of a safety culture. In the first case, many fatalities were caused by an organizational factor. Two shifts of personnel were present at the foundry during the explosion. This is unacceptable. In this aspect, unmanned technologies should be promoted. The legal factor worked in the second case, as the court-imposed penalties that increased the severity of the accident.
It is not always possible to obtain numerical information about losses from industrial accidents. For example, in the Ukraine, system statistics of accidents not related to injuries are not kept[18]. A negative trend emerges when enterprise management is reluctant to cover accidents and does not consent to the publication of the results of inspections of the technical condition of equipment conducted by third-party specialized organizations. In this regard, the noted tendency to non-disclosure of accident data should be overcome. Thanks to them, specialists receive another result in joint research of safety mechanical systems under operating conditions. Conducting such tests by one organization is contrary to the trends of modern science.
Critical elements
-
A careful analysis of an accident makes it possible to estimate the position of the curves of increased risk FA relative to the curves F0, FRA (Fig. 1). For this, it is necessary to find out the initiating failure that preceded the accident. The severity of the initiating failure NRA (Fig. 1) can be taken as the cost of the planned repair cp of the critical node, which led to this failure. Then the calculated actual damages to overcome the consequences of the accident will be the cost of the corrective repair cc. As is known, the ratio of repair costs cr = cc/cp is a cost analog of risk, which is related to the latter through the following Equation[15]:
$ i={S}_{\Sigma }{\rho }_{\Sigma }={c}_{p}{c}_{r}$ (14) At the same time, the average value cp is measured as the intensity of spending over a certain period. In this case, the assessment of the severity accident NA will be determined by the same formula. Since the severity of the accident can be represented as the intensity of costs, the coordinates of the NA point will be clearly recorded on the F-N diagram (Fig. 1).
In the last decade, there has been an overcoming of the false trend of the closure of accident investigations. This is evidenced by the extensive information distributed in open sources regarding the accident at the Sayano-Shushen hydroelectric power station in Russia. The accident occurred on August 17, 2009. As a result of the destruction of the hydraulic unit, the engine room of the station, which housed 10 hydraulic units, flooded. The accident claimed the lives of 77 people. The total damage from the accident (loss of fixed assets, localization of consequences) amounted to approximately US
${\$} $ ${\$} $ The cost of preventive repair of a threaded connection can reach US
${\$} $ Another example of increased risk assessment was obtained for the first stage of the СТ7-9С aircraft gas turbine engine[14]. The cost of its planned repair сp is 9.7 monetary units, and the diagnostic inspection is worth 2.7 monetary units. Emergency repair after the destruction of the blade of the turbine disk (initiating failure) сc will cost 2000 monetary units. Thus, the relative cost of emergency or corrective repair (analog of risk) is сr = 2000/9.7 = 206. Only the technical side of the problem is considered here.
Therefore, the position of the increased risk curves FA can be estimated through the cost analog of the risk cr, which for dangerous objects of technology reaches the value cr→102...104. That is, the F-N curve shifts to the zone of large N losses by 2...4 orders of magnitude, and sometimes more. Elements of the technical system, the failure of which leads to losses much greater than the cost of them, can be classified as critical or responsible. Special attention is paid to the design and manufacture of such elements. At the stage of operation, resource forecasting of critical elements is conducted according to probabilistic-physical models or based on the physics of failures[20]. This approach is the basis of the theory of individual structural reliability, which ensures the safety of operation.
Reliability and safety
-
The second section deals with the areas of application of initiative-taking RCM and RBM maintenance strategies. Despite the given prerequisites for the evolution of safety in technology as a term, service personnel do not always understand which strategy to choose. After all, both strategies use the same methodological base. Therefore, it is worth considering in more detail the differences between reliability and safety methodologies.
The consumer is not so interested in high reliability as in minimizing losses from failures. That is, it is the function (result) that reliability realizes that is important, not reliability itself as a means. Since absolute reliability is unattainable for complex technical systems (such as power structures of technological equipment and vehicles with many potentially dangerous places and damaging processes affecting them), they should be provided with the required level of safety, the purpose of which is closely related to risk analysis.
Reliability deals with multi-scale failure streams. While the objects of reliability are all elements of a technical system, the objects of safety are the basic load-bearing structures and critical parts, the failure of which is associated with losses greater than the cost of the parts themselves. The emergence of the Farmer curve as the main risk analysis tool is an attempt to consider the scale of failures.
In safety tasks, each product is analyzed individually rather than as a batch. Individual forecasting is performed, which is the basis for a maintenance strategy based on technical condition. At the same time, probabilistic-physical methods of durability use the Bayesian interpretation of probability as a measure of confidence in the truth of a judgment. Reliability methods are more successful in assessing serviceable states, and in a safety system, serviceable states are predicted.
Failure of classical reliability
-
The modern theory of reliability is unacceptable for assessing the predictive values of the parameters of single-use structures since it is based on the construction of the corresponding general set of such parameters, which is not clear in this case.
While general sets for loads and material properties are quite accessible for construction and study, such sets do not exist in principle for the parameters of unique structures, and there are no adequate ways to construct them. Namely, unique structures are prone to catastrophic accidents.
Safety issues arise in the face of beyond-design (extreme) operating conditions and/or fluctuations in the properties of the mechanical system of resistance to external operating factors. In practice, both conditions are realized due to the appearance of: 1) overloads, and 2) defects (cracks). Therefore, when analyzing the safety of mechanical systems, the main attention is paid to these factors. Under normal operating conditions and in good condition, the mechanical system is safe.
The goal of optimal design of structures is to achieve reliable consumer characteristics at a minimum cost, including equipment maintenance. The proposed algorithm for finding the acceptable risk meets these requirements (Fig. 2).
The basic concept of in-service safety is related to accident prevention, which means that initiating failures must be diagnosed and prevented.
-
Several interpretations of the concept of technical security are given, which confirms the conclusion that the connotation of safety and security is extremely complex[2]. Considering managemental and legal factors in risk assessment makes technical security interdisciplinary, which demonstrates its belonging to the civilizational concept of safety and security. A quantitative assessment of the influence of managemental and legal factors on the level of losses from accidents and on the change in the position of equal risk curves has been obtained. Such an assessment can be carried out through a cost analog of risk, which can reach the value of cr→102…104. This value of the cr indicator characterizes the belonging of an element of a technical system to a critical one. The failure of a critical element leads to losses that significantly (102... 104 times) exceed the cost of its repair.
The risk indicators of industrial equipment operation are considered. The natural risk indicator is recommended to be used to determine the life of an object. The dimensionless risk indicator ρ as a diagnostic parameter is recommended to be used to assess the technical condition of the basic elements of the facility. The resource safety index βР as a diagnostic parameter is recommended for critical elements of the technical system.
The innovative contribution of the authors to the development of CSS consists in the formulation of the concept of high-risk curves by considering organizational and legal factors. In turn, the theory of engineering safety was enriched by the concept of the resource safety index developed by the authors.
-
The authors confirm contribution to the paper as follows: writing - original draft, Visualization, Methodology: Bilichenko G, Rassokhin D; formal analysis: Rassokhin D; writing - review & editing, supervision, data curation, conceptualization: Belodedenko S. All authors reviewed the results and approved the final version of the manuscript.
-
All data generated or analyzed during this study are included in this published article.
-
The authors declare that they have no conflict of interest.
- Copyright: © 2025 by the author(s). Published by Maximum Academic Press on behalf of Nanjing Tech University. This article is an open access article distributed under Creative Commons Attribution License (CC BY 4.0), visit https://creativecommons.org/licenses/by/4.0/.
-
About this article
Cite this article
Belodedenko S, Bilichenko G, Rassokhin D. 2025. Engineering safety in the aspect of the safety and security civilization. Emergency Management Science and Technology 5: e002 doi: 10.48130/emst-0025-0001 

Engineering safety in the aspect of the safety and security civilization
- Received: 05 September 2024
- Revised: 10 December 2024
- Accepted: 16 December 2024
- Published online: 22 January 2025
Abstract: The present article is devoted to the methods of quantitative risk analysis used to ensure the engineering safety of industrial equipment. It aims to clarify the latter's place in the concept of the civilization of safety and security. The features that make engineering universal in engineering are its interdisciplinary nature and the presence of a safety culture. Interdisciplinarity is manifested when considering organizational and legal factors for risk assessment. This is demonstrated by the example of two blast furnace accident scenarios. The safety culture is implemented through initiative-taking maintenance strategies through risk-based maintenance. The theoretical foundations of this strategy are presented: risk and safety indicators, an algorithm for finding the optimal level of risk, and a method for diagnosing the technical condition of mechanical systems. Recommendations on using risk and safety indicators depending on the criticality of the element being diagnosed are given.
-
Key words:
- Engineering safety /
- Reliability /
- Maintenance /
- Risk indicators /
- Safety and security civilization