


-
The popularity of kiwifruit stems from its high content of ascorbic acid, minerals, dietary fiber, phenols, and other beneficial compounds[1,2]. Simultaneously, diverse kiwifruit varieties and species exhibit a broad spectrum of fruit color transformations attributed to the accumulation of chlorophyll, anthocyanins, and carotenoids[3,4]. Carotenoids serve as the primary determinant for the yellow flesh color in kiwifruits while also possessing numerous other functionalities such as free radical scavenging, anti-aging properties, cardiovascular disease prevention, vision protection, and enhancement of immune system resilience[5,6]. The human body is incapable of biosynthesizing carotenoids on its own; therefore, fruits and vegetables serve as the primary source for human intake of these compounds[7]. Kiwifruit, particularly yellow-fleshed kiwifruit, is abundant in carotenoids[3]. Consequently, the biosynthesis of carotenoids in kiwifruit has become a prominent area of research.
The metabolic pathways of carotenoids in plants are currently well-understood, their biosynthesis and degradation pathways exert a significant influence on the accumulation of metabolite components[8]. In the carotenoid biosynthesis pathway, phytoene synthase (PSY) catalyzes the conversion of geranylgeranyl pyrophosphate into phytoene as the initial step[9]. Subsequently, phytoene desaturase (PDS), zeta-carotene desaturase (ZDS), and carotenoid isomerase (CRTISO) collectively facilitate the transformation of phytoene into lycopene[6]. The biosynthesis pathway of carotenoids is then bifurcated into α and β branches. In the α branch, lycopene epsilon-cyclase (LCYE) and lycopene beta-cyclase (LCYB) facilitate the cyclization of lycopene to generate α-carotene. Subsequently, cytochrome P450 beta-ring carotenoid hydroxylase (CYP97A) and cytochrome P450 epsilon-ring carotenoid hydroxylase (CYP97C) convert it into lutein[10,11]. In the β branch, LCYB facilitates the conversion of lycopene into β-carotene. Then, beta-carotene hydroxylase (BCH) catalyzes its transformation into β-cryptoxanthin and zeaxanthin[6]. The interconversion between lutein and zeaxanthin is facilitated by the enzymes zeaxanthin epoxidase (ZEP) and violaxanthin de-epoxidase (VDE)[12,13]. The degradation of carotenoids is carried out by the involvement of carotenoid cleavage dioxygenases (CCD) and 9-cis-epoxycarotenoid dioxygenase (NCED), leading to their conversion into oxygen-containing lysates[6]. Currently, genes encoding enzymes involved in carotenoid metabolism have been isolated and identified in kiwifruit, and it has been found that they can regulate the metabolism of carotenoids in kiwifruit[3,14,15].
The regulation of carotenoid biosynthesis in plants has been attributed to the involvement of numerous transcription factors. HY5 regulates the expression of PSY and enhances carotenoid accumulation in Arabidopsis thaliana[16], while MYB68 directly inhibits the transcription levels of CrBCH2 and CrNCED5, leading to the accumulation of α- and β-carotene in citrus fruits with blocked downstream conversion[17]. Papaya CpEIN3a and CpNAC2 form a protein complex to recognize PDS2, PDS4, LCYE, and BCH promoters, thereby positively regulating carotenoid accumulation[18]. The expression of BCH1/2 and LCYB is activated by MADS32 and MYB7, respectively, to promote carotenoid biosynthesis in kiwifruit[19,20].
The basic helix-loop-helix (bHLH) transcription factor constitutes a vast family of pivotal regulators in plants, playing indispensable roles in plant growth, development, and stress response[21,22]. PIF1, a member of the bHLH transcription factor family, specifically recognizes PSY promoter G-box response elements and exerts inhibitory effects on carotenoid biosynthesis in Arabidopsis thaliana[16]. CpbHLH1 and CpbHLH2 regulate carotenoid biosynthesis in papaya by activating CpCYCB and CpLCYB genes[23]. CsTT8 directly binds to and activates the promoters of CsPDS, CsLCYE, CsZEP, and CsNCED2, ultimately facilitating the direct promotion of citrus carotenoid accumulation[22]. A total of 206 bHLH genes have been isolated and identified in kiwifruit[24]. It has been reported that transcription factor bHLH in kiwifruit plays a direct or indirect role in regulating color metabolism, particularly anthocyanin biosynthesis[25,26]. There is however limited research on the regulation of carotenoid biosynthesis by bHLH in kiwifruit.
Actinidia valvata is commonly used as a rootstock; nevertheless, it serves as an exceptional breeding resource owing to the high carotenoid content found in its fully ripened fruit[27,28]. Therefore, it is of significant importance to investigate the biosynthesis of carotenoids in Actinidia valvata. In this study, a comprehensive analysis of the variations in carotenoid components and the expression of carotenoid biosynthesis genes during postharvest ripening of Actinidia valvata was conducted. Additionally, a transcription factor bHLH149 was identified and its molecular mechanism in regulating carotenoid biosynthesis determined. This study lays the foundation for enhancing the regulatory network of carotenoid metabolism in kiwifruit.
-
The kiwifruit (Actinidia valvata) was harvested from the kiwifruit germplasm resource nursery in Fengxin County, Jiangxi Province (China) approximately 130 d after flowering, and promptly transported back to the laboratory. Around 200 pest-free, disease-free, and mechanically undamaged fruits were carefully selected and stored at room temperature (22 ± 1 °C, with a relative humidity of 85%) for 8 d. Fruit firmness and chromatic aberration were measured every 2 d. Subsequently, the pulp (excluding seeds and skins) was rapidly frozen using liquid nitrogen and preserved in a refrigerator set at −80 °C.
Fruit firmness and chromatic aberration
-
The determination of fruit firmness was conducted using the established methodology[29]. A total of 15 fruits were measured in each trial, and the results were denoted as N.
The colorimeter CR-400 (Konica Minolta Sensing, Inc., Osaka, Japan) was utilized for detecting chromatic aberration. The fruit was cut horizontally to determine the color at the equator. Each time, six fruits were selected, and the experiment repeated three times. The a* and b* values (a*, where negative to positive indicates the change from green to red; b*, from negative to positive indicates the change from blue to yellow) were recorded.
Extraction and detection of carotenoids
-
One gram of pulp was finely powdered using liquid nitrogen and then transferred into a 10 mL centrifuge tube. The powder was mixed with 5.0 mL of cold 80% acetone solution (containing 0.1% butylated hydroxytoluene). The mixture was left in the dark for 60 min until the flesh turned white. Subsequently, it was centrifuged at 4 °C and 12,000 g for 10 min to collect the supernatant for further use.
The total carotenoid content was quantified according to the light absorption value of the supernatant at 450 nm. The carotenoid content was quantified using the AB Sciex QTRAP 6500 LC-MS/MS platform, as provided by MetWare (
www.metware.cn ).Gene expression analysis
-
The total RNA from kiwifruit pulp was extracted using a plant total RNA extraction kit (TIANGEN, Beijing, China). The extracted RNA was reverse-transcribed into cDNA using MonScript™ RTIII All-in-One Mix with dsDNase (Monad, Suzhou, China). The relative gene expression was determined using real-time fluorescence quantitative PCR and calculated by 2−ΔΔCᴛ[30]. The specific primers for gene expression are provided in Supplementary Table S1.
Yeast one-hybrid (Y1H) assays
-
The recombinant bHLH149-AD plasmid was generated by integrating the open reading frame (ORF) sequence of bHLH149 into the pGADT7 effector vector. The proLCYB-pHIS2 reporter vector was constructed by incorporating the LCYB promoter sequence into the pHIS2 reporter vector. The yeast strain Y187 was transformed with both the proLCYB-pHIS2 reporter vector and the bHLH149-AD effect vector, and then plated on SD/-His/-Leu/-Trp, and SD/-His/-Leu/-Trp + 5 mM 3-amino-1,2,4-triazole (3AT) defect medium, respectively. The yeast was incubated at a constant temperature of 30 °C in darkness for 3−5 d.
Sequence analysis of bHLH149
-
The phylogenetic analysis of bHLH149 and bHLH from other species was conducted using MEGA11 software, while DNAMAN software was utilized for performing multiple sequence alignment.
Subcellular localization of bHLH149
-
The ORF sequence of bHLH149 was inserted into the pSuper1300 vector containing the GFP tag. Subsequently, the constructed bHLH149-GFP plasmid was transfected into Arabidopsis protoplasts, and the fluorescence signal emitted by the fusion protein was visualized using laser confocal microscopy[30]. The primer sequences used for vector construction are provided in Supplementary Table S2.
Transcriptional activation assay
-
The ORF sequence of bHLH149 was cloned into the pGBKT7 vector to generate the bHLH149-BD recombinant plasmid. BD-empty + AD-empty (negative control), p53-BD + largeT-AD (positive control), and bHLH149-BD + AD-empty were transformed into yeast strain AH109, respectively. Subsequently, they were plated on SD/-Trp/-Leu (SD-TL), SD/-Trp/-Leu/-His (SD-TLH), and SD-TLH + X-α-Gal selective media, respectively. The yeast cultures were then incubated at 30 °C for 3−5 d, and the growth of the yeast colonies was observed. The primer sequences used for vector construction are provided in Supplementary Table S2.
Dual luciferase reporter (DLR) assay
-
The ORF of bHLH149 was cloned into the pGreenII 0029 62-SK vector as an effector, while the LCYB promoter sequence was inserted into the pGreenII 0800-LUC vector as a reporter. The DLR assay follows the previously reported method[30]. At least six bioreplicates were performed for each experiment. The primers used are listed in Supplementary Table S2.
Statistical analysis
-
The software GraphPad Prism 8.0 was used for the purpose of generating plots and conducting data analysis, with the data being presented in the format of mean ± standard deviation (SD). Statistical analysis was performed using SPSS 20.0, where a significance level of p < 0.05 indicated statistical significance.
-
The yellow color of the fruit deepened and the firmness decreased as the storage time extended (Fig. 1a, b). Chromatic aberration analysis reveals a gradual elevation in both a* and b*, indicating a progressive transition of the flesh to bright yellow (Fig. 1c, d).
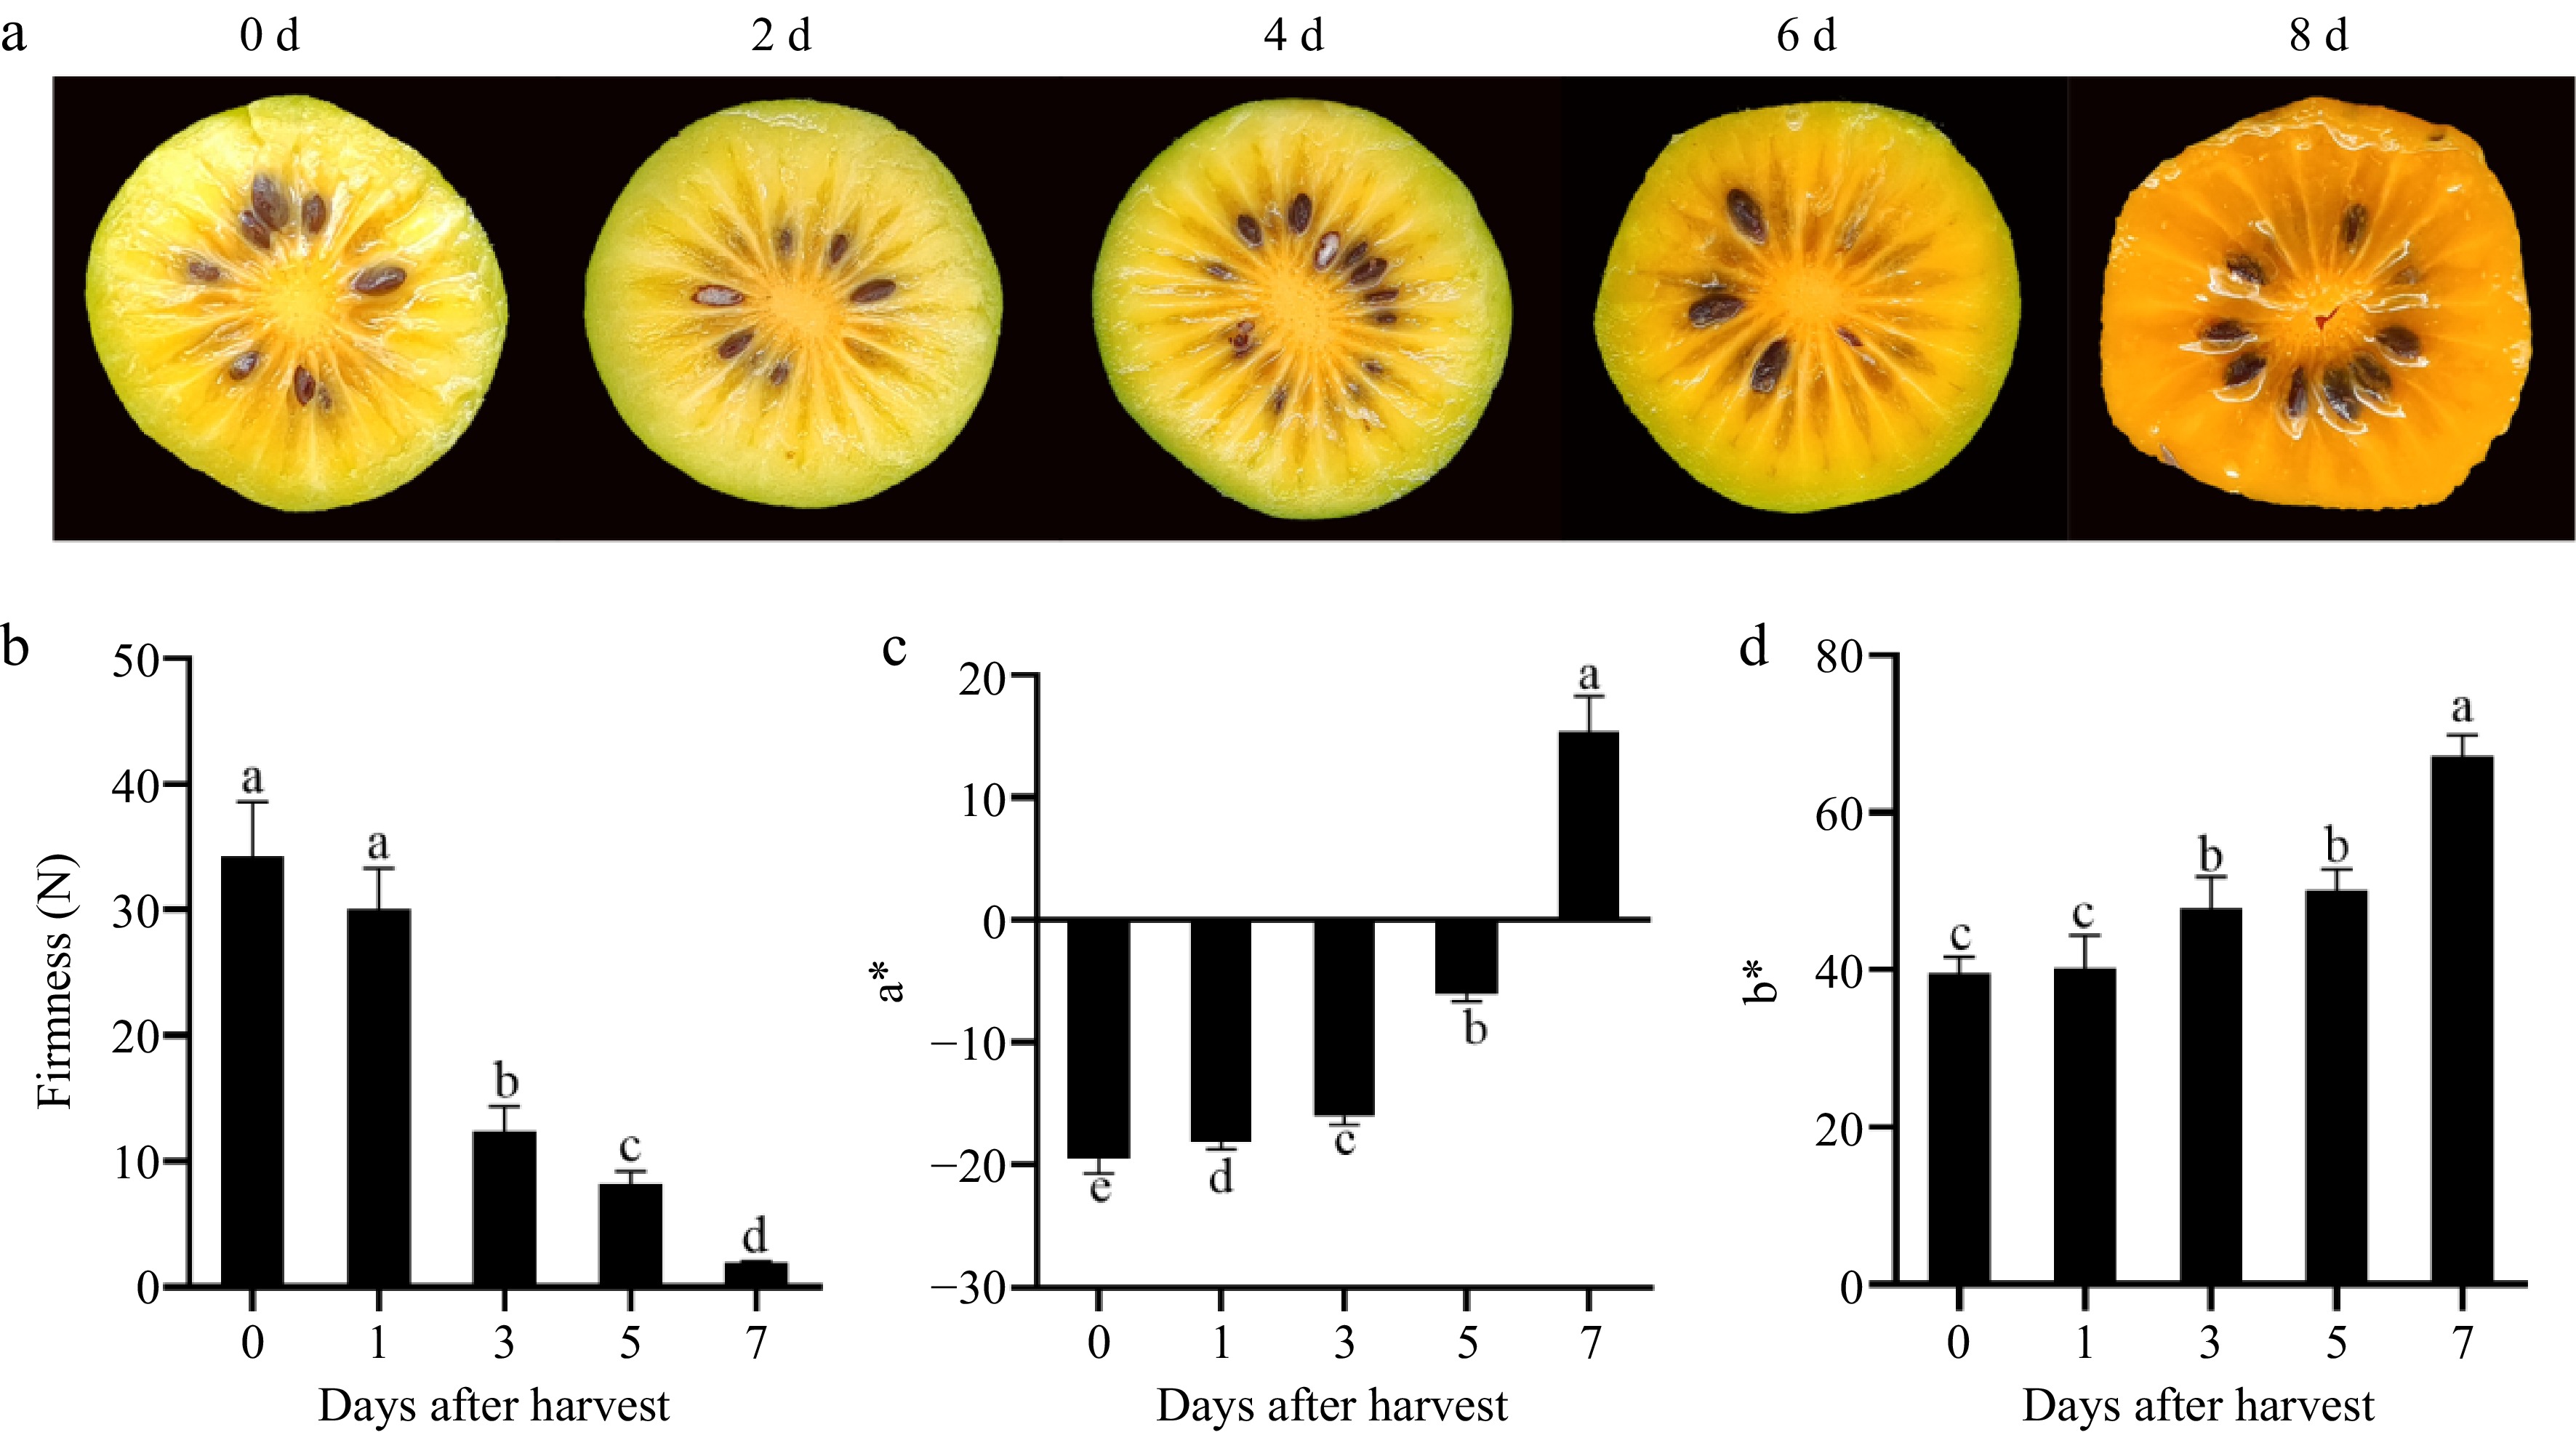
Figure 1.
Color change during postharvest ripening of Actinidia valvata. (a) Appearance of mesocarp during postharvest ripening of Actinidia valvata. Changes in (b) firmness, (c) a*, and (d) b* of mesocarp during postharvest ripening of Actinidia valvata. Bars with different letters indicate significant difference (p < 0.05).
Changes in carotenoid content during postharvest ripening
-
The carotenoid content in the pulp remained unchanged on the 1st d after harvest but exhibited an increase starting from the 3rd d and reached its peak on the 7th d (Fig. 2a). The present study identified five carotenoid components (lutein, β-carotene, β-cryptoxanthin, neoxanthin, and zeaxanthin). Among them, lutein had the highest content and its concentration was consistent with the total carotenoid content which accounted for 61.44% of the total on day 7 (Fig. 2b). The contents of β-carotene, β-cryptoxanthin, neoxanthin, and zeaxanthin also increased during fruit ripening; however, their levels were significantly lower compared to lutein, highlighting the predominant role of lutein as a key carotenoid component in Actinidia valvata (Fig. 2b−f).
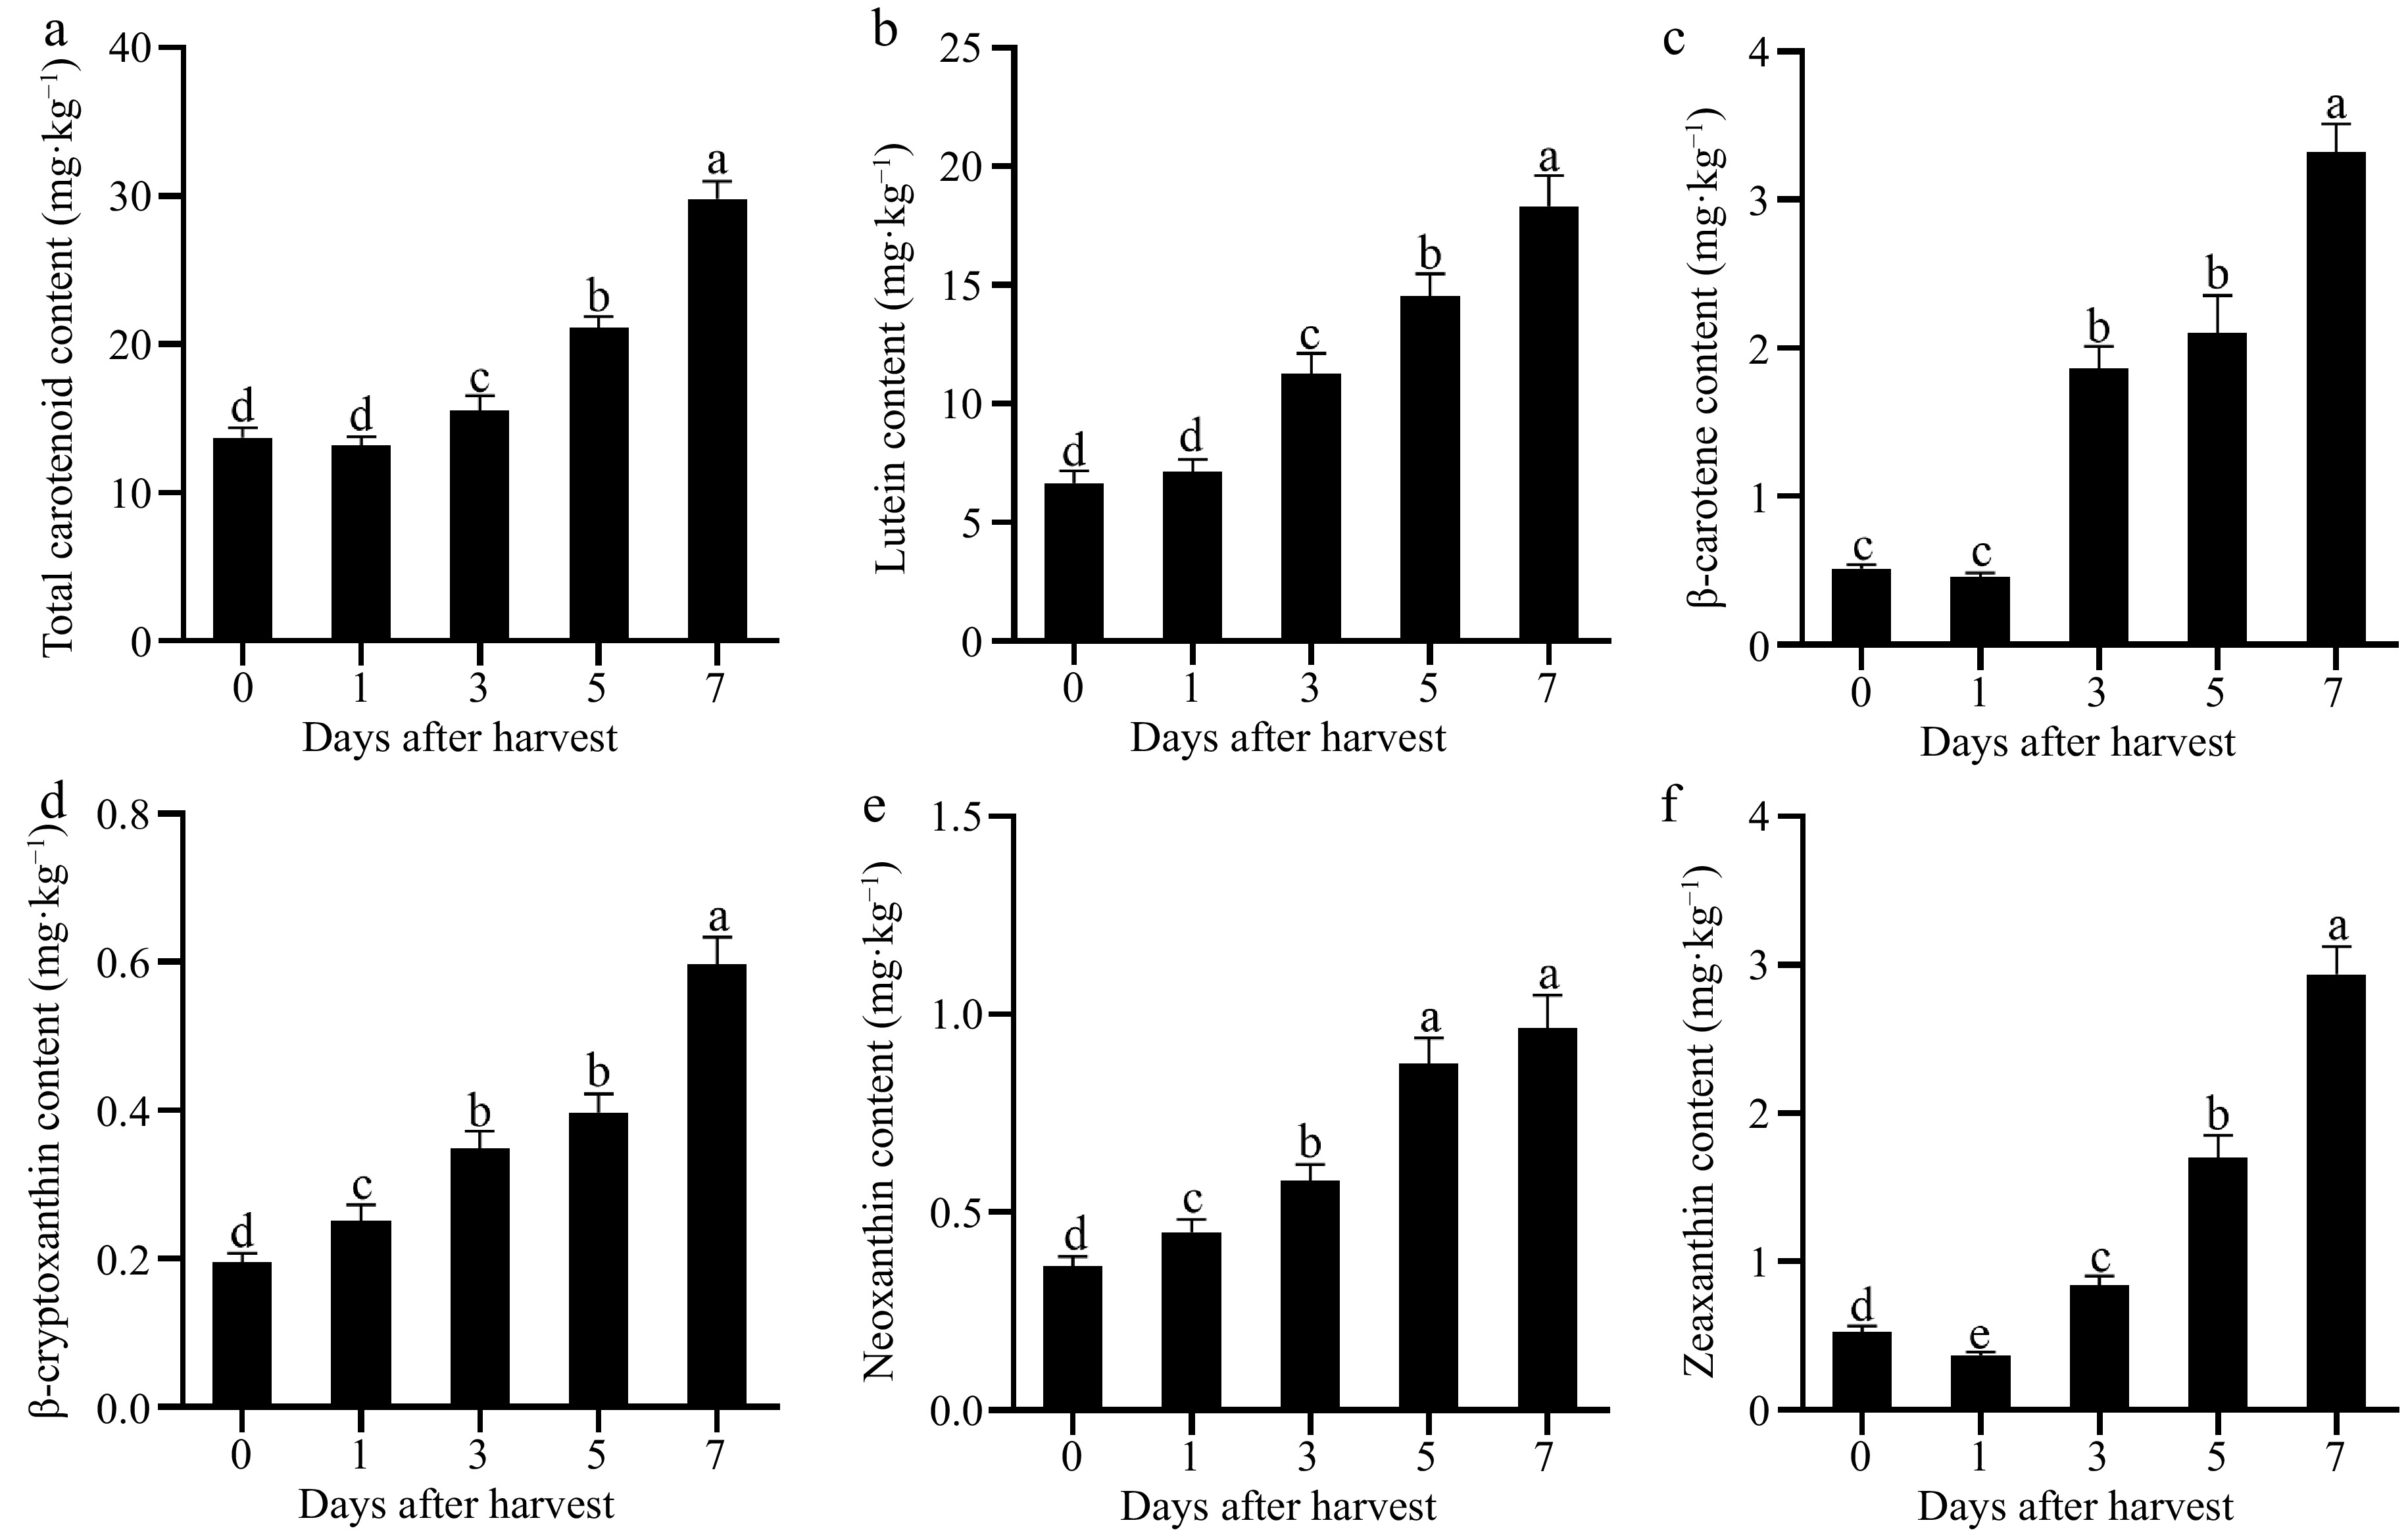
Figure 2.
Changes in (a) total carotenoid, (b) lutein, (c) β-carotene, (d) β-cryptoxanthin, (e) neoxanthin, and (f) zeaxanthin during postharvest ripening of Actinidia valvata. Bars with different letters indicate significant difference (p < 0.05).
Expression changes of carotenoid metabolism genes during postharvest ripening
-
The expression of genes associated with carotenoid metabolism was examined to investigate the underlying factors contributing to carotenoid changes during postharvest ripening. Among the 10 carotenoid biosynthesis genes, except for ZDS, the expression levels of PSY, PDS, CRTISO, LCYE, LCYB, CYP97A, BCH, VDE, and ZEP were all found to be up-regulated during fruit ripening. Notably, LCYB exhibited the highest level of expression (Fig. 3a). The observed expression pattern showed a positive correlation with the total carotenoid content (R2 = 0.9671, Supplementary Fig. S1). The expression of the CCD gene in the carotenoid degradation pathway decreased during fruit ripening, whereas there was no significant change in NCED expression (Fig. 3b).
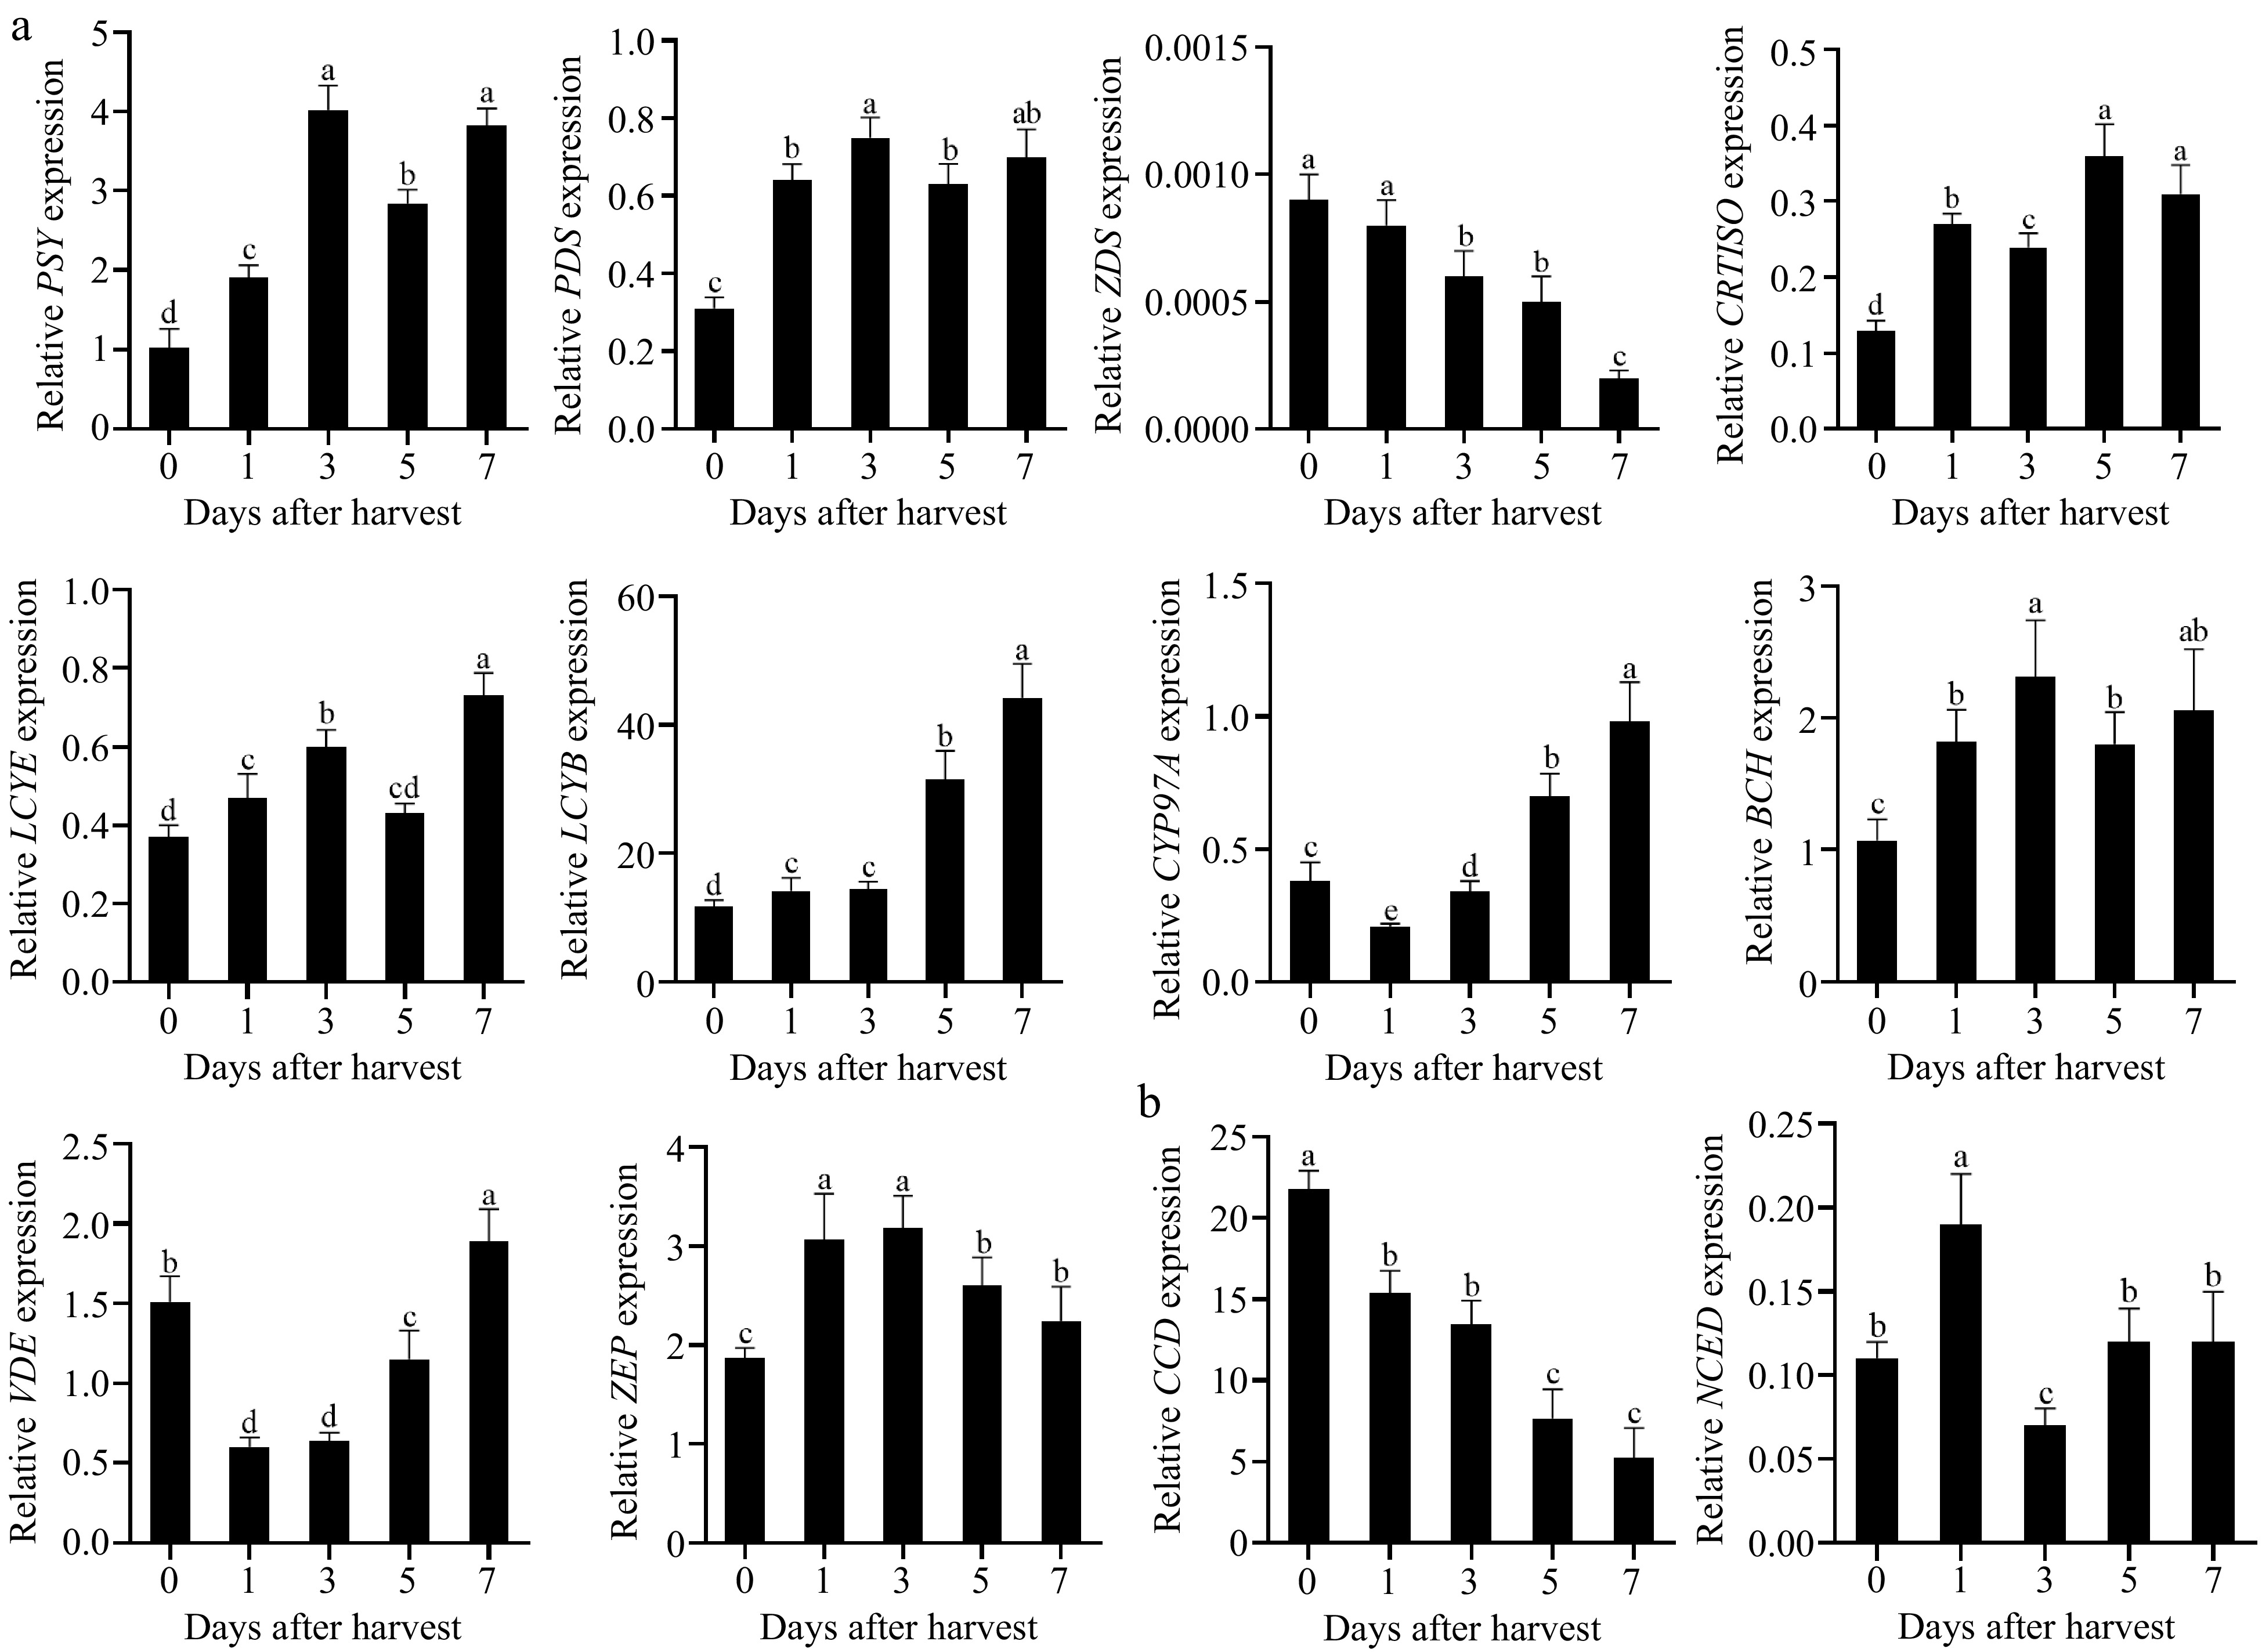
Figure 3.
Changes of relative expression levels of (a) carotenoid biosynthesis, and (b) degradation genes during postharvest ripening of Actinidia valvata. Bars with different letters indicate significant difference (p < 0.05).
bHLH149 binds to the LCYB promoter
-
To investigate the transcriptional regulation of LCYB, a bHLH transcription factor (bHLH149) was successfully identified through Y1H screening using the LCYB promoter as bait. The basal activity of the LCYB promoter was not observed in yeast cells treated with 3AT (Fig. 4a). However, co-expression of bHLH149 resulted in the activation of a 3AT resistance reporter gene under the control of the LCYB promoter (Fig. 4b), indicating that bHLH149 can bind to the LCYB promoter. Interestingly, it was found that bHLH149 does not directly bind to the PSY promoter (Supplementary Fig. S2). Phylogenetic tree analysis revealed that bHLH149 bore the highest similarity to ClbHLH149, a member of the bHLH family of Camellia lanceoleosa (Fig. 5a). Further comparisons of amino acid sequences have revealed that bHLH149 possesses a unique conserved domain of bHLH, which exhibits high similarity to the corresponding domains in other species (Fig. 5b).
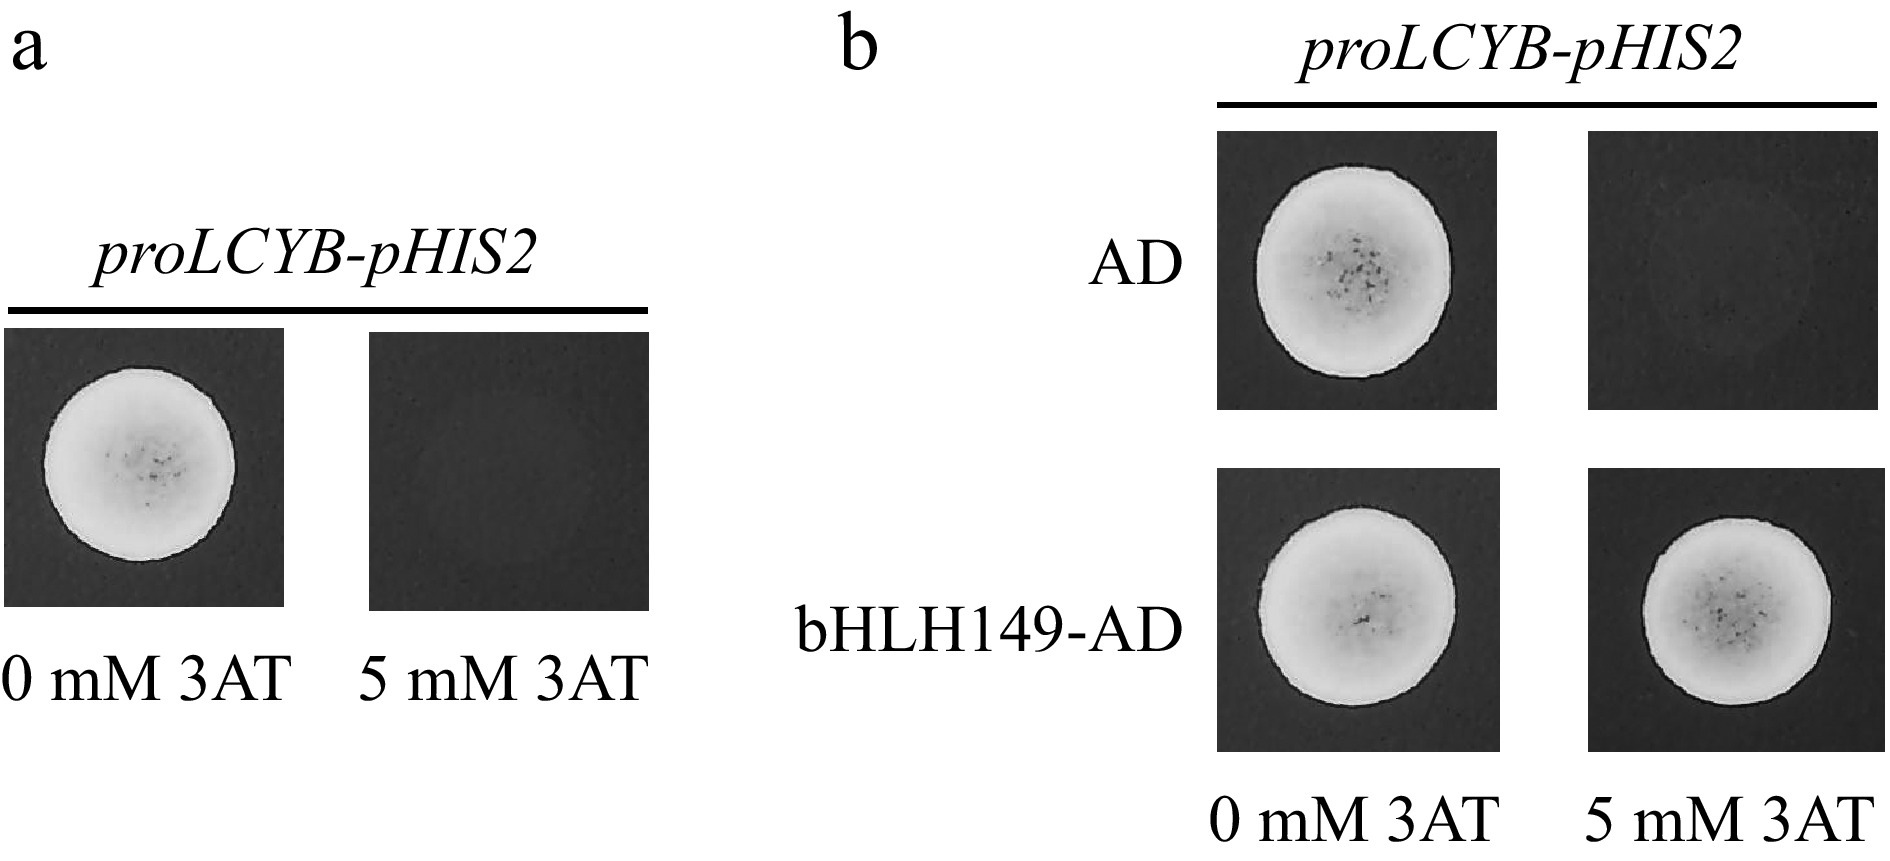
Figure 4.
bHLH149 transcription factor was obtained by Y1H screening of LCYB promoter as bait. (a) LCYB promoter activation activity was inhibited on SD/-His/-Leu/-Trp + 5 mM 3AT medium. (b) Y1H verifies the interaction between bHLH149 transcription factor and the LCYB promoter.
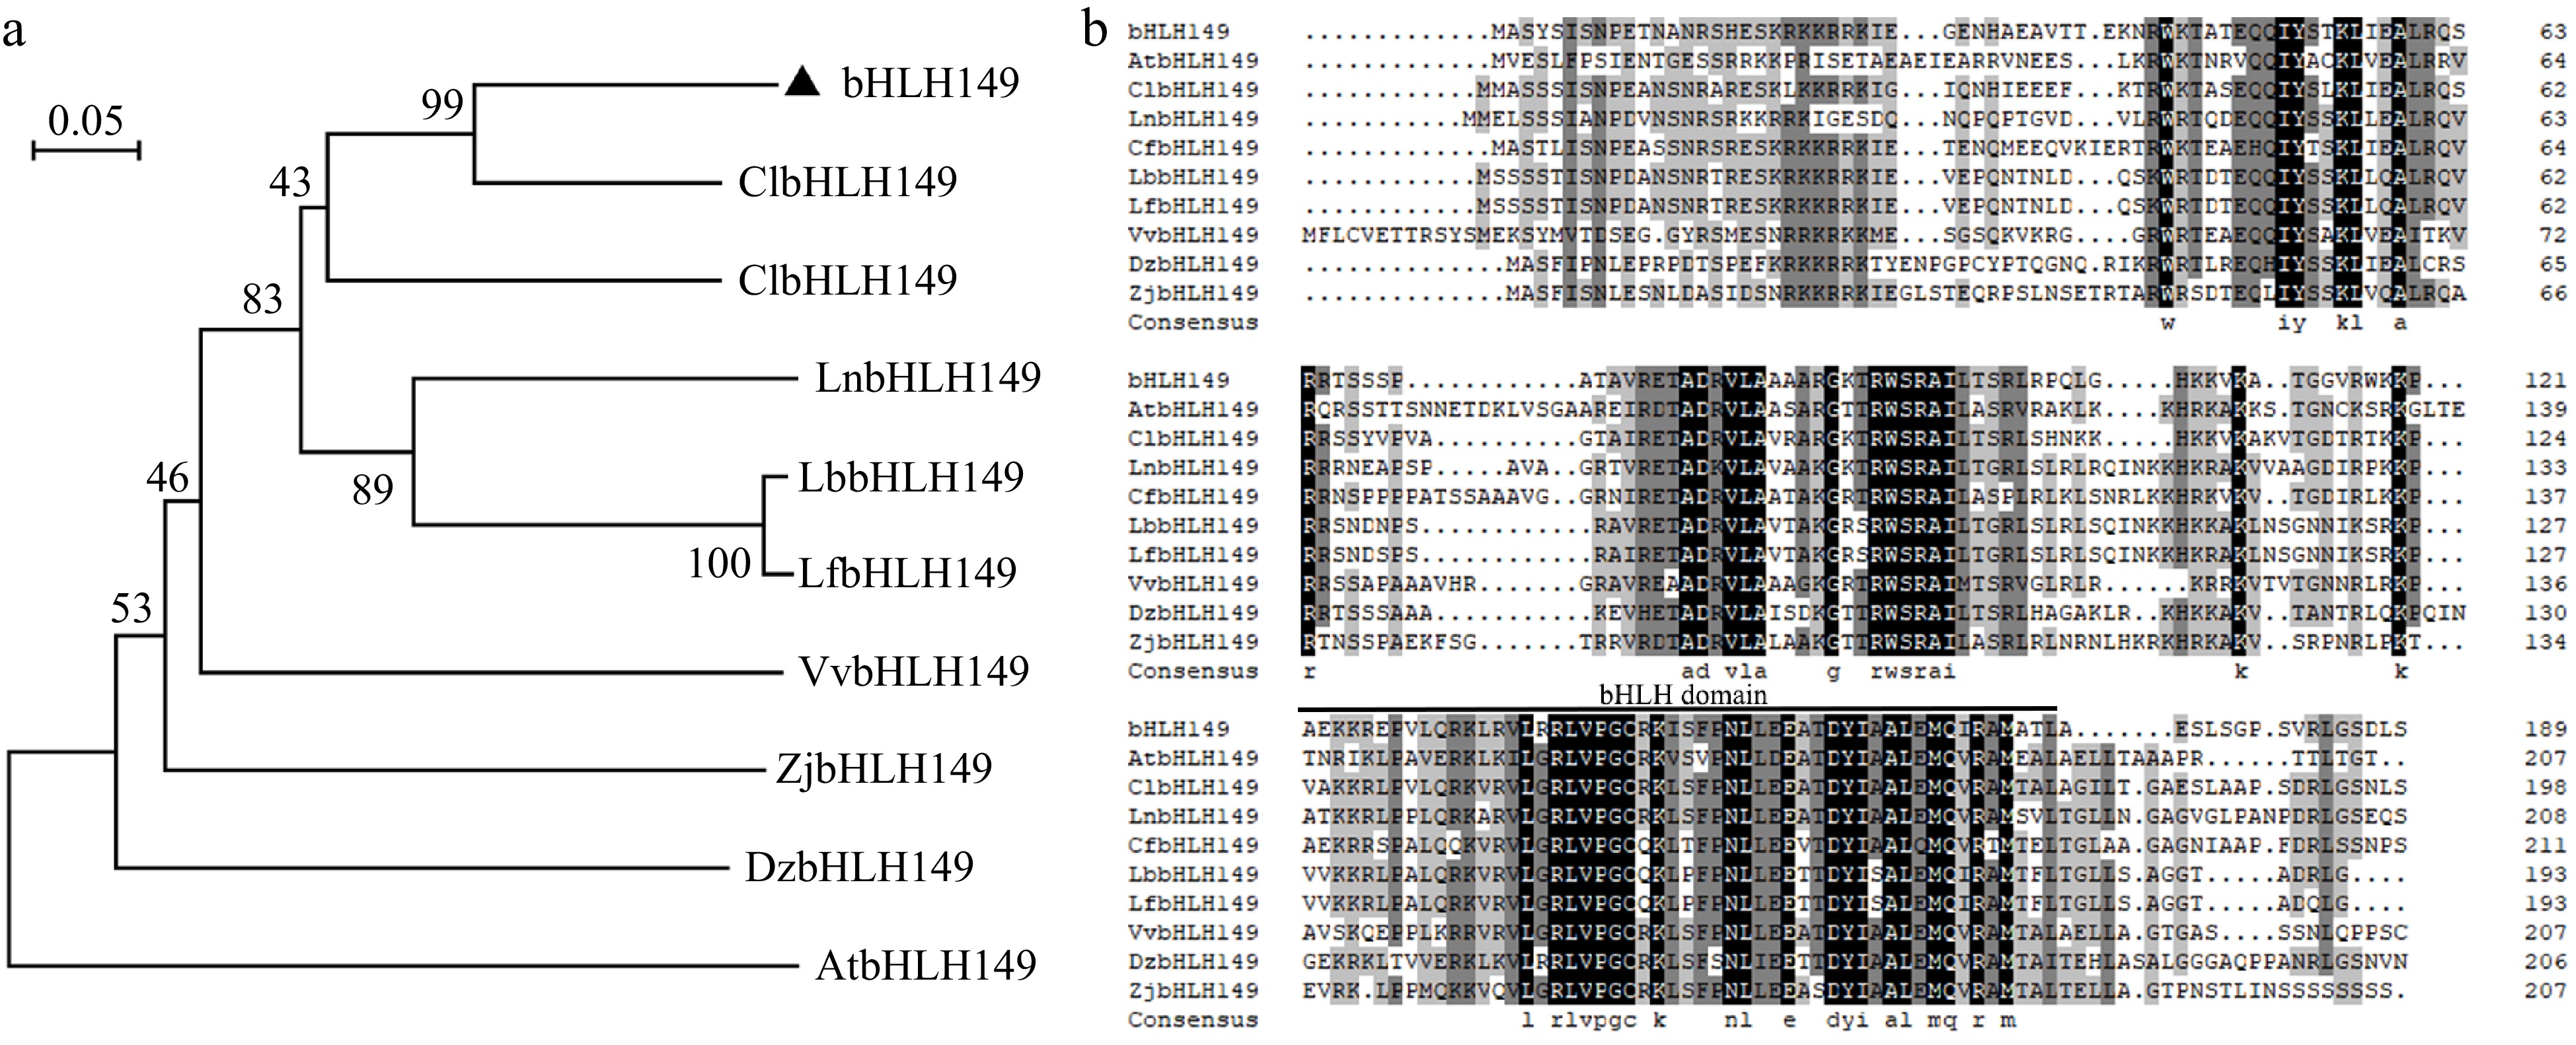
Figure 5.
Phylogenetic tree of bHLH149 and analysis of bHLH protein sequences with other species. (a) Phylogenetic analysis of bHLH149 with bHLH members from other species. (b) Multiple sequence comparison analysis of bHLH149 with bHLH members from other species. The bHLH domain is overlined. Cl, Camellia lanceoleosa (KAI8024841.1); Cf, Cornus florida (XP_059652277.1); In, Ipomoea nil (XP_059652277.1); Lb, Lycium barbarum (XP_060167312.1); Lf, Lycium ferocissimum (XP_059313316.1); Vv, Vitis vinifera (XP_059313316.1); Zj, Ziziphus jujuba (XP_015874890.3); Dz, Durio zibethinus (XP_015874890.3); At, Arabidopsis thaliana (AT1G09250).
bHLH149 is a transcriptional activator
-
The expression of the bHLH149 gene was up-regulated during fruit ripening (Fig. 6a), and its expression level exhibited a positive correlation with the total carotenoid content (R2 = 0.9947, Supplementary Fig. S3). The subcellular localization of bHLH149 in the nucleus was confirmed by the expression of bHLH149-GFP in Arabidopsis protoplasts (Fig. 6b), which is consistent with its function as a transcription factor. Yeast two-hybrid (Y2H) assay was further used to verify the transcriptional activity of bHLH149. The results showed that yeast cells containing bHLH149-BD exhibited robust growth in the selective medium and effectively activated transcription of the yeast GAL4 reporter gene, resulting in a distinct blue coloration (Fig. 6c). These findings strongly suggest that bHLH149 has transcriptional activation activity.
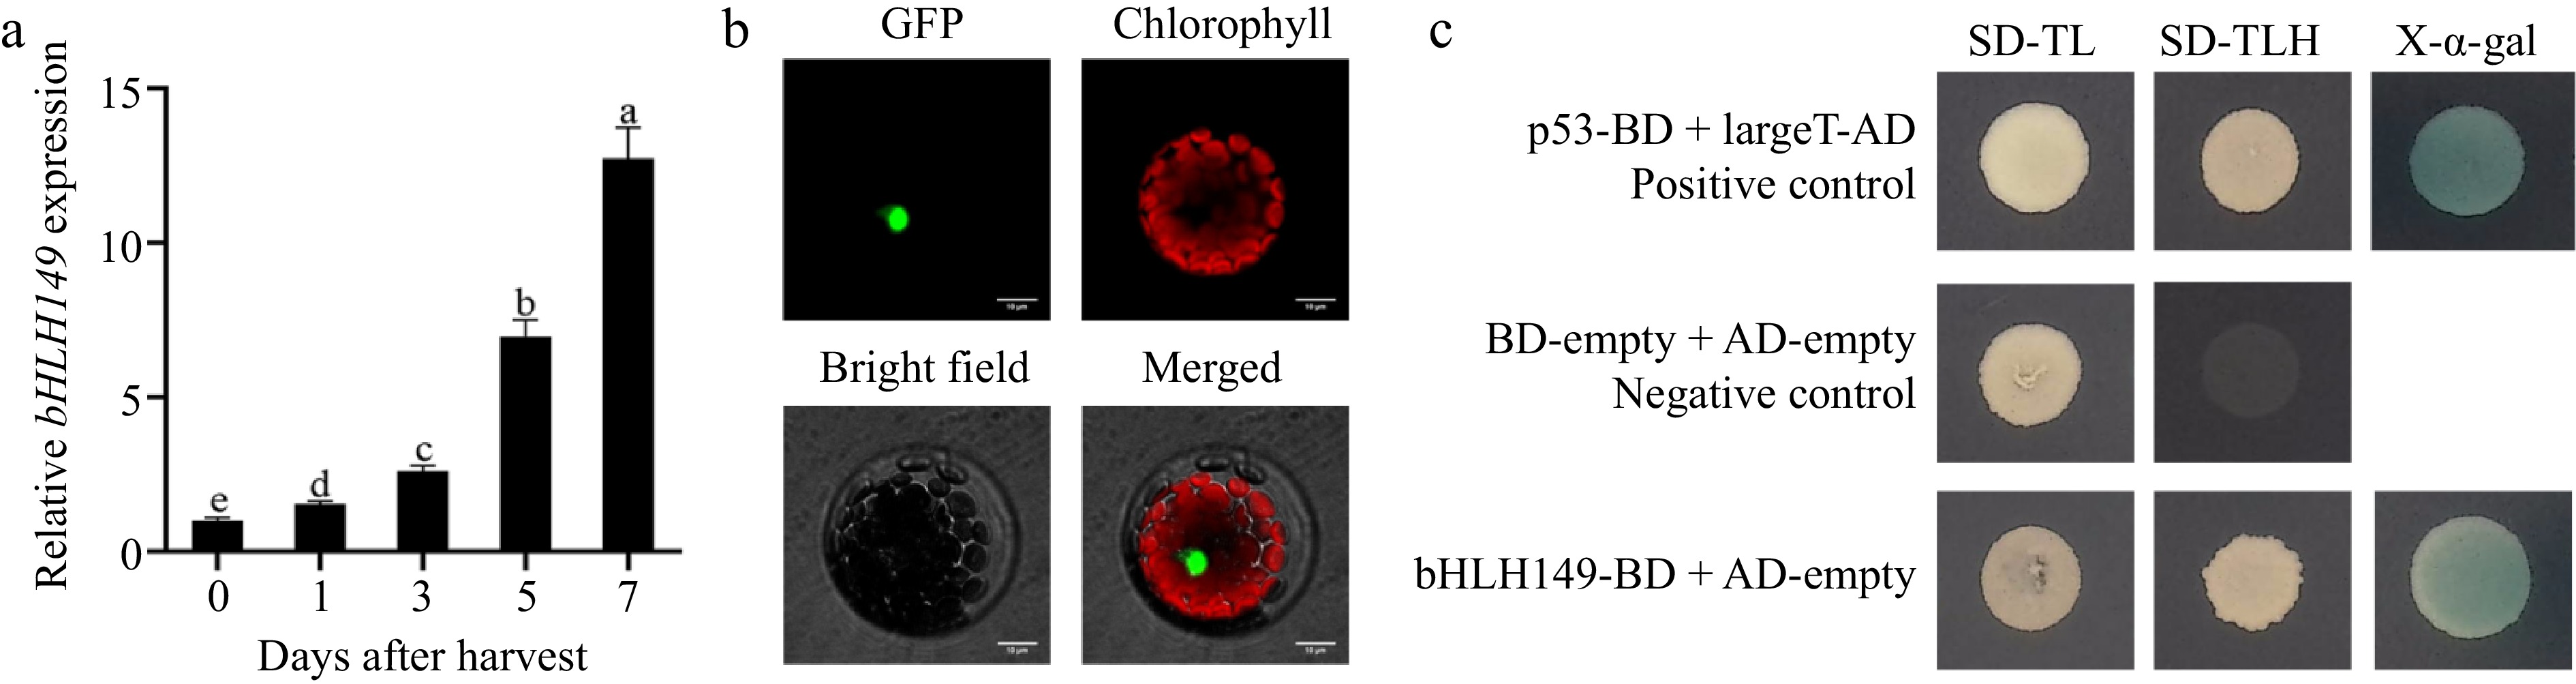
Figure 6.
Molecular characterization of bHLH149. (a) Changes of relative expression level of bHLH149 during postharvest ripening of Actinidia valvata. Bars with different letters indicate significant difference (p < 0.05). (b) Subcellular localization of bHLH149 in Arabidopsis protoplasts. Bar = 10 μm. (c) Detection of self-activation of bHLH149 in yeast cells.
bHLH149 can activate LCYB promoter activity
-
DLR analysis was conducted to investigate the potential of bHLH149 in enhancing the expression of LCYB (Fig. 7a). As anticipated, the presence of bHLH149 significantly enhanced the activity of the LCYB promoter, resulting in a higher LUC/REN ratio compared to the control group (Fig. 7b).
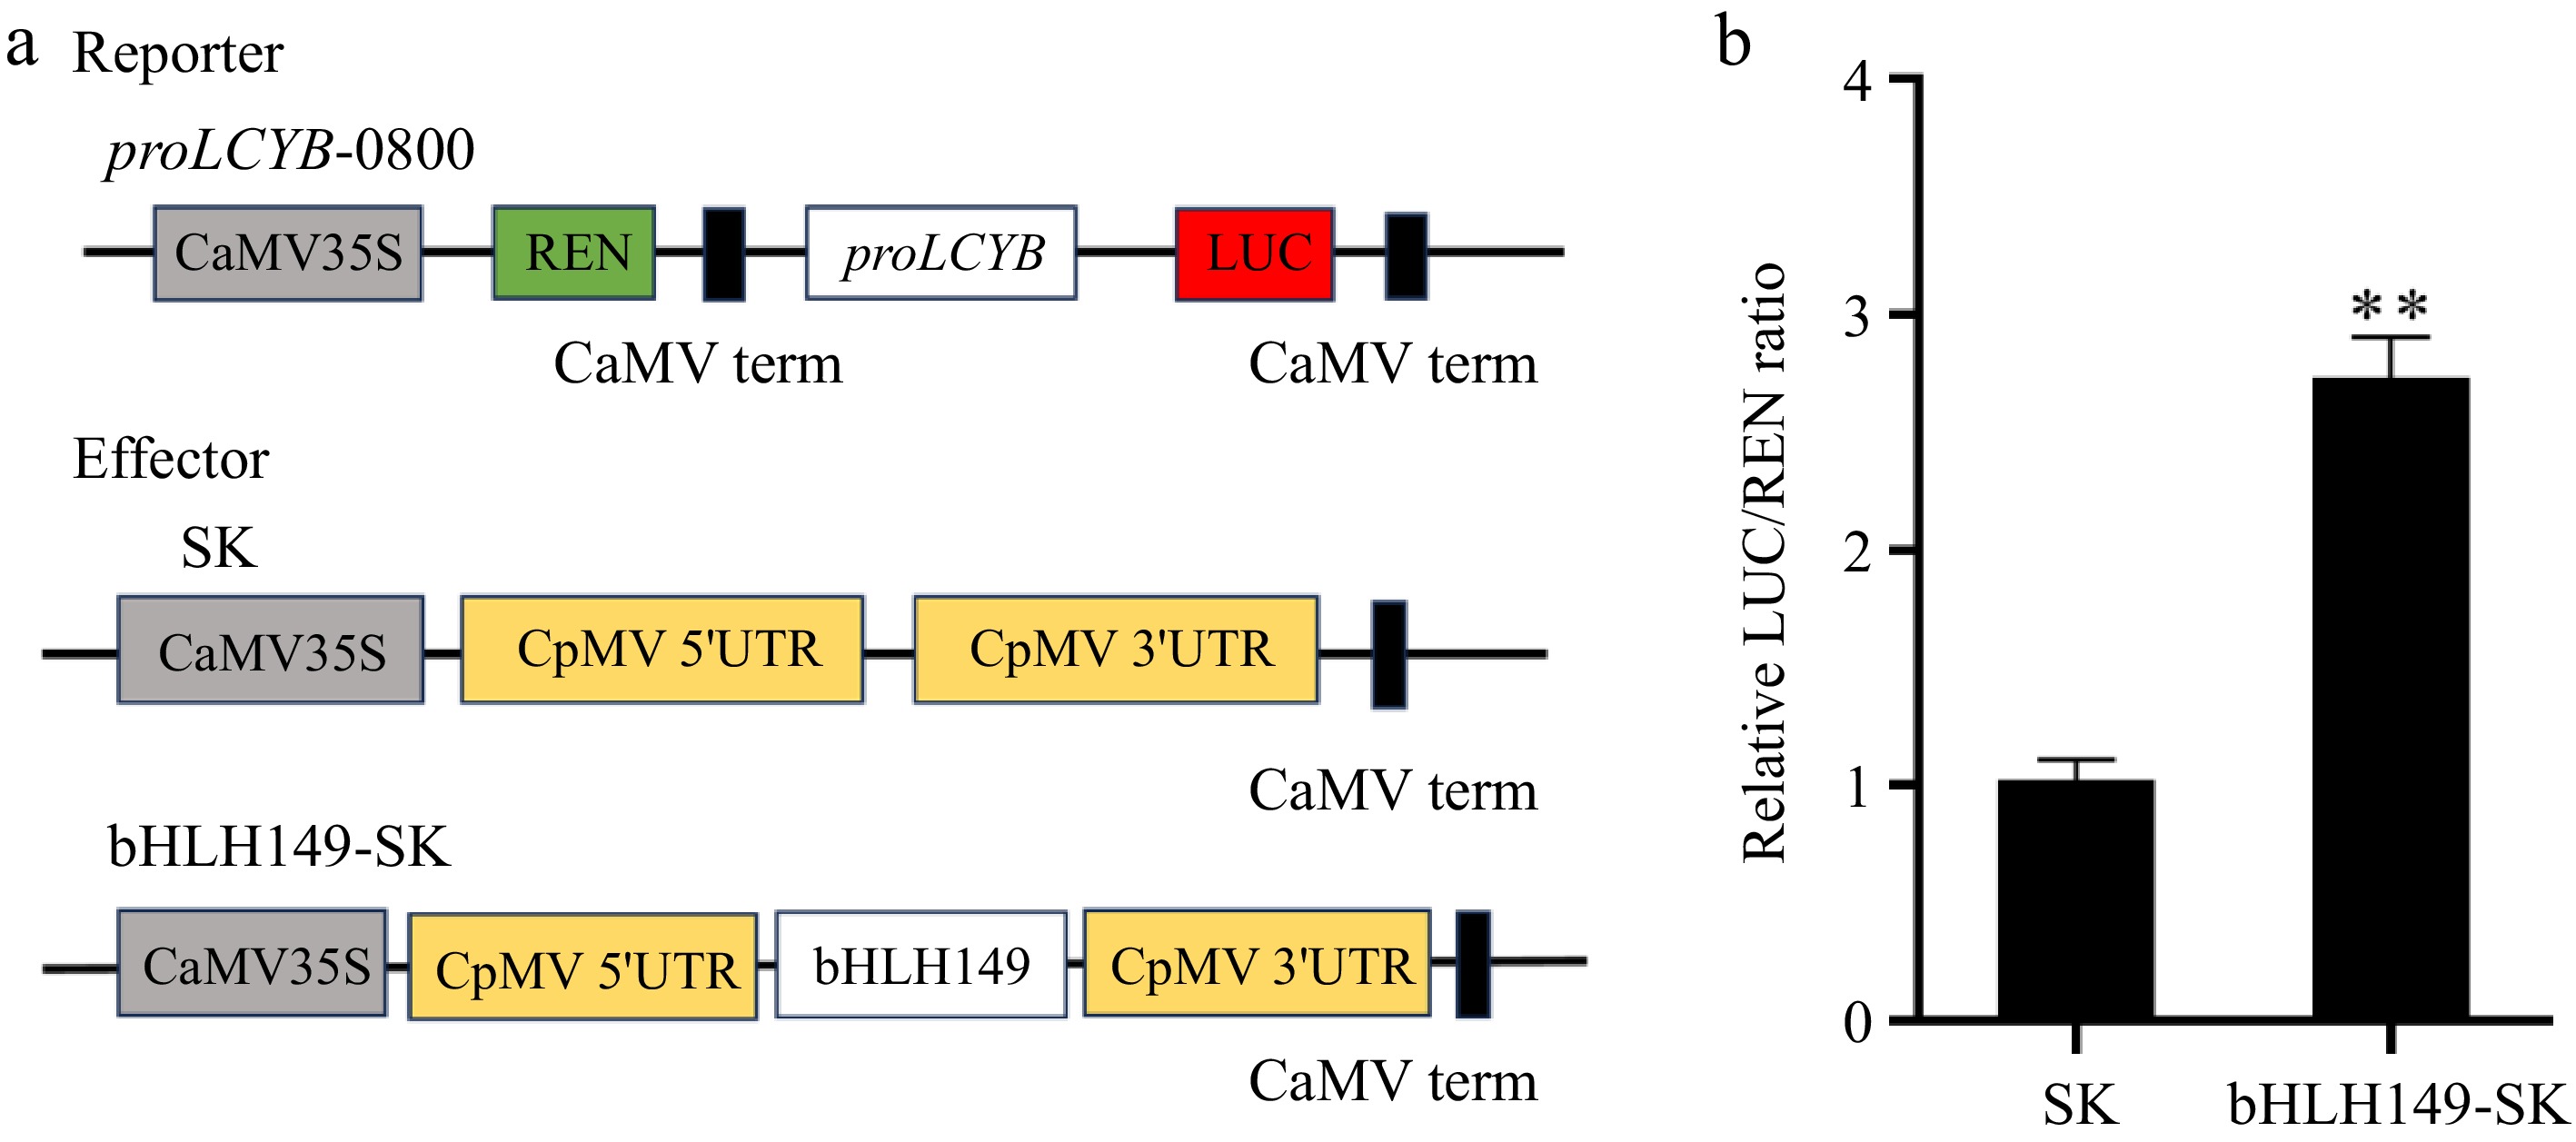
Figure 7.
bHLH149 activates LCYB promoter activity. (a) Schematic diagram of the double reporter. (b) bHLH149 activated the activity of LCYB promoter. Asterisks indicate significant difference (p < 0.01).
-
Carotenoids play a crucial role in plant physiology, influencing the development process of fruits and vegetables, enhancing the aesthetic appeal of horticultural plants, and enriching their nutritional profile[4,5,31]. The fruit color of different species of kiwifruit varies significantly, with Actinidia arguta having relatively low carotenoid content compared to Actinidia polygama and Actinidia valvata[28]. Specifically, when ripened and softened, the carotenoid content in Actinidia macrosperma is 90 times higher than that in Actinidia chinensis[32]. In the present study, it was observed that as Actinidia valvata ripens and softens, its yellow color deepens while carotenoids rapidly accumulate, resembling the pattern seen in Actinidia macrosperma[20].
The carotenoid components varied among different species of kiwifruit. Lutein and β-carotene were predominantly accumulated in 'Hayward' (Actinidia deliciosa) and 'Hort 16A' (Actinidia chinensis)[33], as well as in pepper[34], mango[35], and papaya[36], exhibiting consistent findings. The lutein content in most Actinidia chinensis varieties was significantly lower compared to that of 'Hayward', whereas the β-carotene content exhibited a slightly higher level than that of 'Hayward'[37]. The levels of lutein and β-carotene in Actinidia rufa and Actinidia arguta were significantly higher compared to those found in 'Hayward'[37]. Moreover, the content of lutein in Actinidia macrosperma is notably greater than that found in Actinidia arguta[20]. In this study, the ripening and softening of Actinidia valvata were found to significantly increase the content of lutein, which occupied a dominant position among carotenoids, followed by β-carotene. These findings support previous research on yellow-fleshed kiwifruit.
The relationship between the expression of carotenoid metabolism genes and the accumulation of carotenoids has been extensively investigated in various crop species. The accumulation of β-carotene and lycopene was predominantly observed in tomato fruits, while the expressions of PSY and PDS exhibited a gradual increase throughout fruit development[38]. The accumulation of carotenoids in loquat is associated with the expression of PSY[39]. Lutein and β-carotene were mainly accumulated in bilberry, while the expression levels of carotenoid metabolic-related genes PSY, PDS, LCYB, LCYE, and CCD1 exhibited a positive correlation with carotenoid content throughout fruit development[40]. The LCYE gene plays a crucial role in the biosynthesis of carotenoids in carrot roots[41]. The accumulation of carotenoids in kiwifruit with different fruit colors was investigated, revealing a consistent correlation between the expression level of the LCYB gene and carotenoid accumulation when β-carotene and lutein were identified as the predominant carotenoid compounds in the fruit[3]. The present findings also confirm this observation. As fruits ripen and soften, the majority of carotenoid biosynthesis genes exhibited an up-regulated expression pattern; however, the LCYB gene displayed the highest expression level and was significantly positively correlated with carotenoid content.
The transcriptional regulation of carotenoids in fruits involves several confirmed transcription factors, including MYB, NAC, WRKY, and MADS[18,42−44]. The elucidation of the molecular regulatory mechanism underlying carotenoid metabolism is instrumental in enhancing the quality of kiwifruits. However, except for AdMYB7 and AcMADS32, which directly regulate LCYB and BCH1/2 expression respectively to promote carotenoid biosynthesis, no other transcription factors governing carotenoid metabolism have been identified in kiwifruit[19,20]. The members of the bHLH family possess a highly conserved bHLH domain, comprising approximately 60 conserved amino acids[45]. Proteins belonging to the bHLH superfamily typically participate in various physiological processes through recognizing the bHLH domain[45]. Previous studies have demonstrated that bHLH transcription factors play a crucial role in regulating the biosynthesis and accumulation of carotenoids in fruits. Moreover, the involvement of PIF1 in the regulation of carotenoid biosynthesis and fruit ripening has been demonstrated in grape[46] and Arabidopsis[16], where it binds to PBE-box on the promoter region of the PSY1 gene within the carotenoid biosynthesis pathway. The binding of BoPIF4 and BobHLH66 to the promoter of BoBCH in broccoli leads to the activation of their expression, thereby promoting senescence[47]. However, the precise molecular regulatory mechanism underlying the involvement of bHLH transcription factors in carotenoid metabolism of kiwifruit remain incompletely understood. In this study, the LCYB promoter was used as a bait to screen for a bHLH149 transcription factor, whose expression is closely associated with kiwifruit coloration during postharvest ripening. Remarkably, the findings demonstrate its direct activation of LCYB expression. These results strongly imply the involvement of the bHLH149 transcription factor in carotenoid biosynthesis and accumulation during postharvest ripening of kiwifruit.
-
Overall, it was discovered that the transcription factor bHLH49 specifically binds to the LCYB promoter and exerts a positive regulatory effect on its transcriptional activity, thereby playing a crucial role in controlling carotenoid biosynthesis during kiwifruit ripening. The findings enrich our comprehension of the transcriptional regulation governing carotenoid biosynthesis and accumulation during postharvest ripening of kiwifruit.
This study was funded by the National Natural Science Foundation of China (32060704, 32302627), Natural Science Foundation of Jiangxi Province (20232BAB205040), and the Strategic Co-operation Project between Chongqing Municipal People's Government and the Chinese Academy of Agricultural Sciences (CQ-CAAS-08).
-
The authors confirm contribution to the paper as follows: study conception and design: Gan Z, Huang Z; data collection: Zhang Y, Yang C, Cao Q; analysis and interpretation of results: Gan Z, Zhu L, Kai W, Chen C; draft manuscript preparation: Gan Z, Huang Z, Chen J. All authors reviewed the results and approved the final version of the manuscript.
-
All data generated or analyzed during this study are included in this published article and its supplementary information files.
-
The authors declare that they have no conflict of interest.
- Supplementary Table S1 Table S1 Primers for qRT-PCR.
- Supplementary Table S2 Primers for vector construction.
- Supplementary Fig. S1 Correlation analysis between LCYB gene expression and total carotenoid content.
- Supplementary Fig. S2 Y1H verifies the interaction between bHLH149 transcription factor and PSY promoter.
- Supplementary Fig. S3 Correlation analysis between bHLH149 gene expression and total carotenoid content.
- Copyright: © 2025 by the author(s). Published by Maximum Academic Press, Fayetteville, GA. This article is an open access article distributed under Creative Commons Attribution License (CC BY 4.0), visit https://creativecommons.org/licenses/by/4.0/.
-
About this article
Cite this article
Gan Z, Zhang Y, Yang C, Cao Q, Zhu L, et al. 2025. A kiwifruit bHLH149 transcription factor modulates carotenoid biosynthesis by directly activating LCYB during postharvest ripening. Fruit Research 5: e003 doi: 10.48130/frures-0024-0036 

A kiwifruit bHLH149 transcription factor modulates carotenoid biosynthesis by directly activating LCYB during postharvest ripening
- Received: 08 August 2024
- Revised: 17 September 2024
- Accepted: 24 September 2024
- Published online: 09 January 2025
Abstract: The carotenoid content in kiwifruit undergoes dynamic changes during the ripening process, yet the underlying mechanism remains unclear. Herein, the variation in carotenoid content was investigated during the postharvest ripening process of kiwifruit (Actinidia valvata). The results demonstrated a gradual increase in total carotenoid content during postharvest ripening and softening, accompanied by a deepening of the yellow flesh. The levels of all five carotenoid components also exhibited an upward trend with fruit ripening, with lutein content being the highest among them, thus indicating its pivotal role as the most significant carotenoid component in kiwifruit. The expression analysis of genes associated with carotenoid metabolism during postharvest storage revealed an upward trend in the expression levels of biosynthesis-related genes, while a downward trend was observed for degradation-related genes. Notably, the lycopene beta-cyclase (LCYB) gene exhibited the highest expression levels, which were significantly and positively correlated with carotenoid content. A basic helix-loop-helix transcription factor protein, bHLH149, capable of binding to the LCYB promoter was identified through yeast one-hybrid library screening. The expression of bHLH149 increased during fruit ripening and showed a positive correlation with carotenoid content. As a nuclear localization protein, bHLH149 acts as a transcriptional activator and significantly enhances LCYB promoter activity, thereby promoting carotenoid biosynthesis. The collective findings suggest that bHLH149 may play a role in the carotenoid biosynthesis pathway during kiwifruit ripening by positively regulating the transcription of LCYB, thereby enhancing our comprehension of the regulatory network governing carotenoid biosynthesis in kiwifruit.
-
Key words:
- Kiwifruit /
- Carotenoid biosynthesis /
- bHLH149 /
- Postharvest ripening