


-
The rapid advancement of artificial intelligence, big data, and sensor technology has propelled crop phenomics research into a phase of accelerated development[1,2]. Various sensor modalities are essential for acquiring phenotypic data; however, traditional methods relying on manual observation and limited datasets suffer from subjectivity, low throughput, and insufficient dimensionality. To overcome these limitations, automated phenotyping platforms have been introduced. In recent years, diverse crop phenotyping systems have been developed globally, including rail-based systems[3,4], unmanned vehicles[5], robotic platforms[6], and drones[7]. Each system presents unique challenges: unmanned vehicles risk damaging crops during operation, increasing data uncertainty; drones are limited by low ground resolution and challenges in managing large data volumes; and rail-based platforms are costly and confined to restricted operational areas. In contrast, robotic phenotyping platforms, with their compact size, adaptability, and high levels of automation, effectively navigate complex environments with minimal crop disturbance. These features enhance the efficiency of data acquisition and improve analytical precision.
Recent advancements in multi-source sensor technologies, including LiDAR, thermal infrared, multispectral, and RGB cameras, have significantly enhanced the collection of comprehensive phenotypic information[2]. RGB cameras are used to estimate textural features and vegetation indices[8,9]. Thermal infrared cameras assess plant transpiration and identify genotypes with heat tolerance and drought resistance[10]. Multispectral cameras provide insights into chlorophyll content, vegetation indices, and nitrogen concentration[11]. LiDAR technology is primarily applied to three-dimensional structural modeling and biomass estimation of crops[2]. Despite their utility, phenotypic parameters derived from individual sensors are inherently limited, requiring image or point cloud segmentation to isolate crop-specific regions of interest. However, each sensor type has limitations: infrared images often have indistinct contours, multispectral images may lack color texture, and LiDAR point clouds rely on structural information that necessitates complex segmentation algorithms[12]. In contrast, RGB images offer detailed color and texture information, which improves segmentation performance in complex scenarios, such as overlapping leaves[13]. Moreover, RGB image segmentation algorithms are computationally efficient and suitable for high-throughput applications with limited resources[13]. Given these limitations, a critical research focus is the rapid and effective integration of multimodal data to create unified, feature-enhanced phenotypic datasets, and thereby facilitating the extraction of crop-specific regions of interest. This integration facilitates the extraction of crop-specific regions of interest, addressing gaps in traditional phenotypic analysis.
In the field of multi-source sensor data fusion, numerous researchers have made significant advancements. Teng et al. developed a multimodal sensor fusion framework to construct multimodal maps[14]. Pire et al. introduced agricultural robot datasets that integrate odometry and sensor data layers[15]. Yin et al.[16] and Das et al.[7] presented multi-sensor datasets for ground robots and drones, respectively, enabling the extraction of key plant attributes. Sagan et al.[17] utilized support vector regression and deep neural networks to combine multimodal phenotypic information, such as canopy spectra and textures, for yield prediction. Xie et al. applied accelerated robust features to fuse close-range depth and snapshot spectral images, generating 3D multispectral point clouds[18]. Zhang et al. proposed a thermal direct method, utilizing infrared features to fuse visible, infrared, and depth images with localization algorithms, thereby creating continuous thermal clouds[19]. Li et al. demonstrated that fusing LiDAR and RGB camera data enhances temporal phenotyping accuracy[20]. Sun et al. introduced a Fourier transform-based image registration technique for multispectral reflectance, which was further extended with posture estimation and multi-view RGB-D image reconstruction to produce multispectral 3D point clouds[21]. Correa et al. applied pattern recognition and statistical optimization to fuse thermal and near-infrared images into a unified multispectral 3D image[22]. Lin et al. utilized structure-from-motion (SfM) technology to generate RGB and thermal point clouds, employing the Fast Global Registration (FGR) algorithm for precise integration into RGB-T point clouds[23]. Existing research predominantly focuses on multi-sensor crop information acquisition, with several teams sharing multi-source datasets and fusion methods. Some studies leverage intrinsic and extrinsic parameters for data fusion[19,21,22], while others conduct feature-level fusion on drones[17]. However, outdoor environments introduce challenges such as wind interference, low resolution, and flight altitude variability. Similarly, 3D reconstruction methods[21,23] face limitations, including lengthy processing times and data loss. Despite advancements in multi-source sensor data fusion, the integration of thermal infrared and multispectral data remains underexplored; yet, this fusion holds significant potential for enhancing phenotypic analysis. Thermal infrared data provide valuable insights into plant transpiration and stress responses, while multispectral data reveal important information about plant chlorophyll content, water stress, and nitrogen levels. By combining these two data sources, a more comprehensive understanding of plant health and growth dynamics can be achieved.
To address these gaps, this study proposes a multi-source sensor fusion system implemented on a robotic phenotyping platform within a controlled greenhouse environment. The key contributions include high-throughput data acquisition, multi-dimensional phenotyping, and optimization of extrinsic parameters. Additionally, standardized data structures, 2D-3D mapping for crop region of interest (ROI) extraction, and rapid algorithms for measuring multi-dimensional phenotypic parameters are also developed. The system demonstrates superior performance compared to existing UGV-LiDAR platforms. This study aims to develop a low-cost, practical, and high-throughput crop phenotyping system for non-destructive, automatic measurement, and rapid analysis of phenotypic parameters.
The primary goals of this study are to:
● Improve the efficiency of data acquisition in greenhouse environments by automating the collection and integration of multi-source sensor data;
● Enhance the accuracy and reliability of phenotypic parameter extraction through the fusion of multi-modal sensor data;
● Develop a standardized data structure that facilitates seamless integration and analysis of multi-source sensor data for phenotypic assessment.
● Validate the performance of the proposed system by comparing its efficiency and accuracy to existing systems, particularly in terms of cost and scalability.
-
This study presents a phenotyping robotic platform designed for high-throughput collection of phenotypic raw data and the development of analytic algorithms to establish a comprehensive phenotyping pipeline for greenhouse strawberries (see Fig. 1). The hardware for data collection includes a four-wheel-drive agricultural robot developed by the Digital Plant Key Laboratory at the Information Technology Research Center of the Beijing Academy of Agricultural and Forestry Sciences. This robot features a lifting mechanism and an array of multi-source sensors, including LiDAR, high-frame-rate multispectral camera, an RGB-D camera, a thermal infrared camera, and a micromaster controller. A complete workflow was developed, encompassing all stages from data acquisition to processing (illustrated in Fig. 1). This workflow includes sensor data collection, segmentation of plant regions of interest (ROI) from RGB images, calibration of intrinsic and extrinsic parameters of the sensors, fusion of multi-source sensor data into a standardized data structure, extraction of phenotypic parameters, and evaluation of phenotypic resolution effects during analysis. This integrated approach enhances the efficiency and accuracy of data acquisition, providing a robust foundation for advanced data analysis and plant phenotyping.
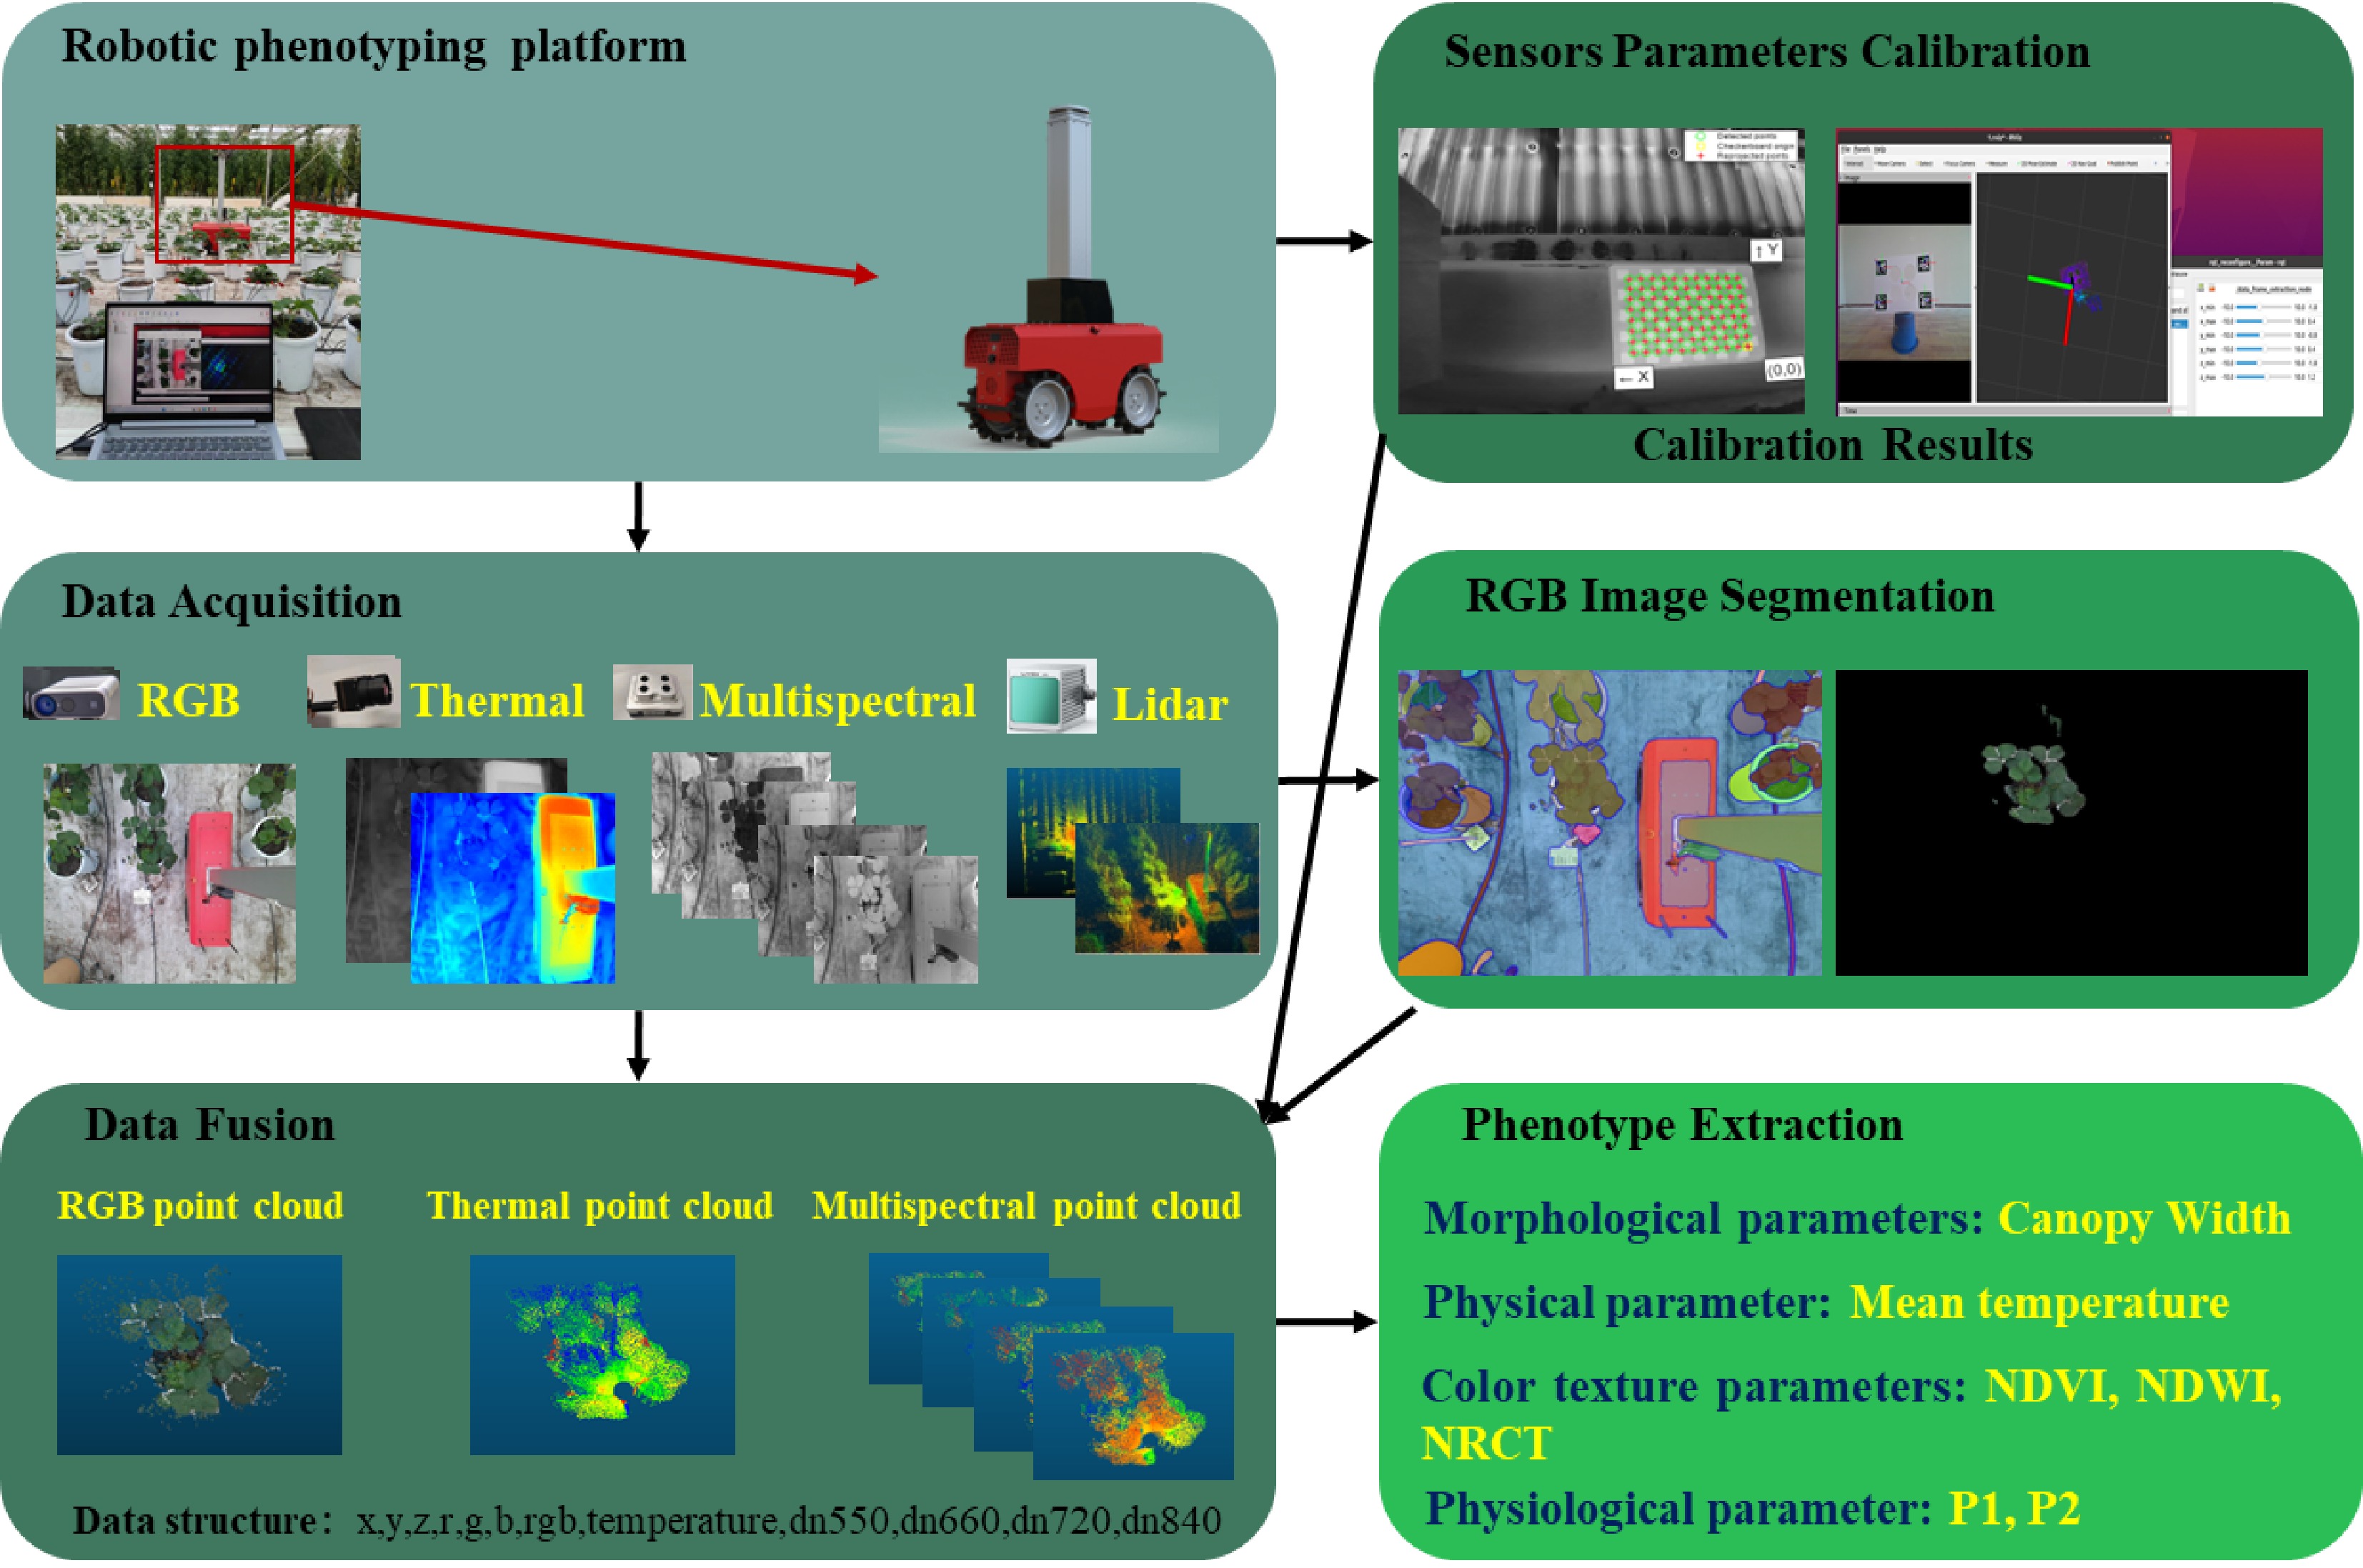
Figure 1.
Flow from data acquisition to data processing.
Experimental design
-
The experimental phase of this study was conducted in a linked greenhouse at the Beijing Academy of Agricultural and Forestry Sciences, Beijing, China (39°56' N, 116°16' E), a controlled environment tailored for advanced agricultural research. As shown in Fig. 2a, the strawberry cultivation area consisted of ten columns, each containing 36 pots, with three pots assigned to each variety, resulting in a total of 360 plants for phenotyping analysis. Data were collected on March 27, 2024, using a multi-source sensor system integrated into a robotic platform (Fig. 2b). This platform was designed to navigate between rows and capture high-quality phenotypic data across various environmental and plant parameters. Data were gathered from two columns of healthy strawberry plants, representing 72 pots and 24 distinct varieties, offering a diverse dataset for evaluating the system's robustness and scalability. The selection of 24 distinct strawberry varieties was based on the need to capture a diverse set of phenotypic traits across a range of genotypes. The operational procedures and technical specifications of the multi-source sensor system are outlined in Fig. 2c, which demonstrates the integration of RGB, infrared, and multi-spectral cameras, as well as a LiDAR sensor for precise data acquisition. For comparative performance evaluation, the UGV-LiDAR[5] system was also used to collect additional data on the same strawberry plants. This system allowed for the assessment of the proposed robotic platform's effectiveness in terms of data consistency, acquisition speed, and multi-dimensional phenotyping accuracy.
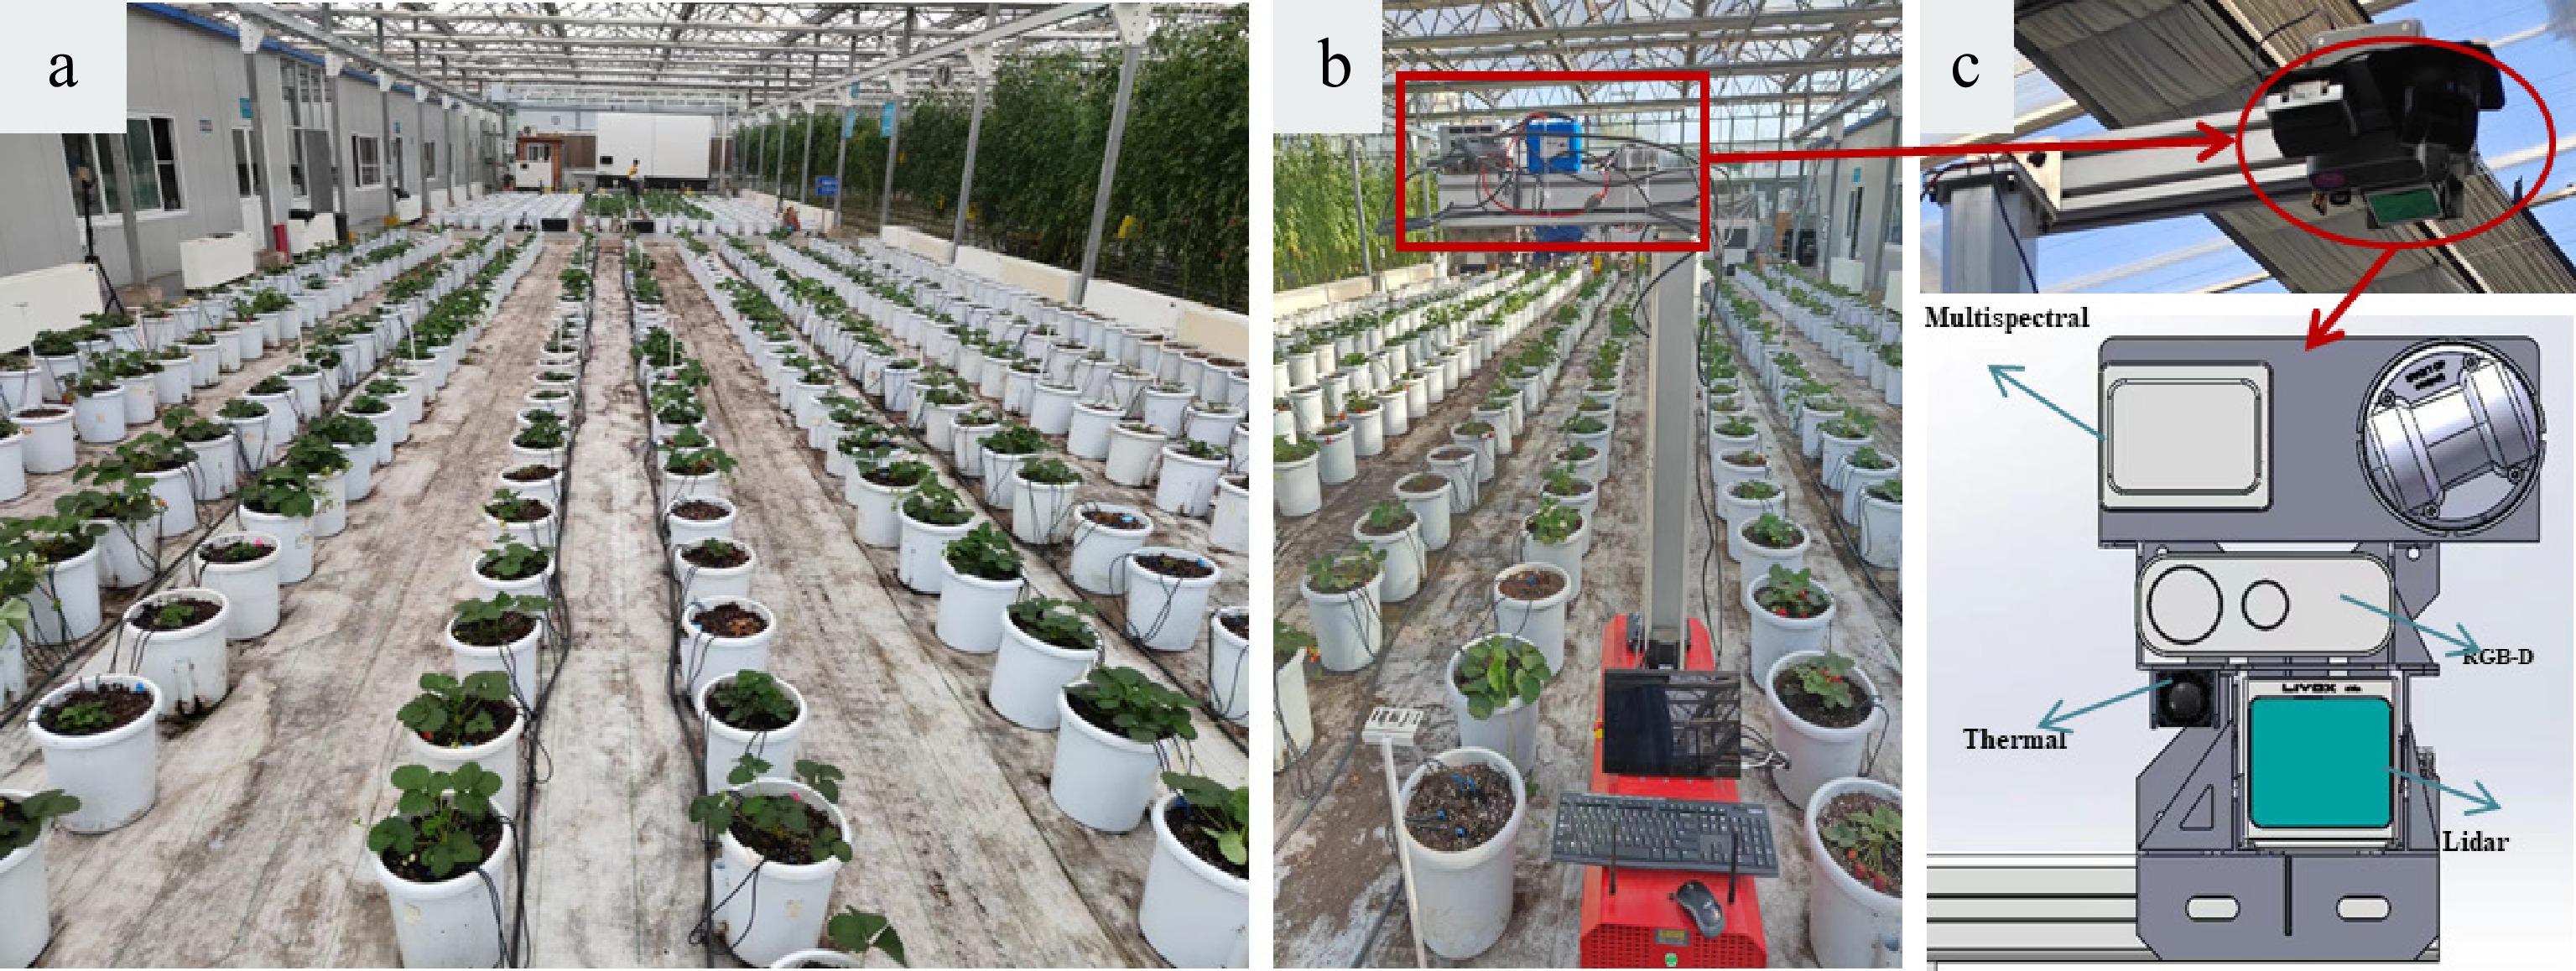
Figure 2.
(a) Strawberry planting distribution map; (b) Our platform; (c) Multi-source sensor layout.
Hardware designs
-
The hardware architecture consists of two primary components: the robotic platform and the multi-source sensor array. The robot's wheelbase is 340 mm, which is smaller than the spacing between two rows of pots in the greenhouse (approximately 400 mm), allowing the robot to move freely between the rows. It is equipped with five servo motors and corresponding motor drivers, four of which control the wheels, while the fifth operates the elevation system. The drive system utilizes pulse-width modulation (PWM) for communication. The elevation system adjusts the platform's height to accommodate different growth stages, ensuring all parts of the plants remain within the sensors' field of view. Additionally, the elevation system is designed to support the weight of the onboard sensors and the microcontroller. The specific relevant parameters of the platform are shown in Table 1.
Table 1. Robotics platform related parameters.
Parameters Description Size 1,006 mm × 340 mm × 521 mm Motor specification 200 W, servo motor Battery specification 48 V 35 AH Quantity 80 kg Running speed 0.5 m/s Maximum load of the lifting system 10 kg Height of the top from the ground 1.5~3.1 m The multi-source sensor system, shown in Fig. 2c, was developed using Solidworks 2023 software and integrates advanced imaging technologies, including the Azure Kinect DK RGB-D camera, the CropEye-A1 high-frame-rate four-channel multispectral camera, the IrayT3Pro long-wave infrared (LWIR) camera, and the Livox Avia LiDAR. The Azure Kinect DK captures RGB, depth, and near-infrared images simultaneously. The CropEye-A1 facilitates the acquisition of four spectral bands—green, red, red-edge, and near-infrared—at 30 frames per second. The IrayT3Pro LWIR camera provides a relative accuracy of 0.1 °C and a 62.9° field of view, while the Livox Avia LiDAR offers non-repeating and repeating scanning modes, enabling adaptability to various scenarios.
As illustrated in Fig. 3, the platform connects to an industrial personal computer (IPC) via a remote control system, allowing indirect control of the robot's movement and lift bar. Power is supplied to the microcontroller and LiDAR through a built-in lithium-ion battery using a 48 V to 12 V step-down module. A laptop connected to the same local area network (LAN) as the microcontroller enables remote data acquisition control. The platform employs a four-wheel-drive system, where each wheel is powered by an independent brushless motor and steered via a four-wheel differential mechanism. The differential ratio, defined as the speed difference between the right and left wheels, determines the turning radius; a higher differential ratio results in a smaller turning radius. The control module includes an Arduino control board, five encoders, and an industrial computer. This closed-loop system utilizes RS485 communication to regulate wheel movement, steering, and the lift bar's height adjustment.
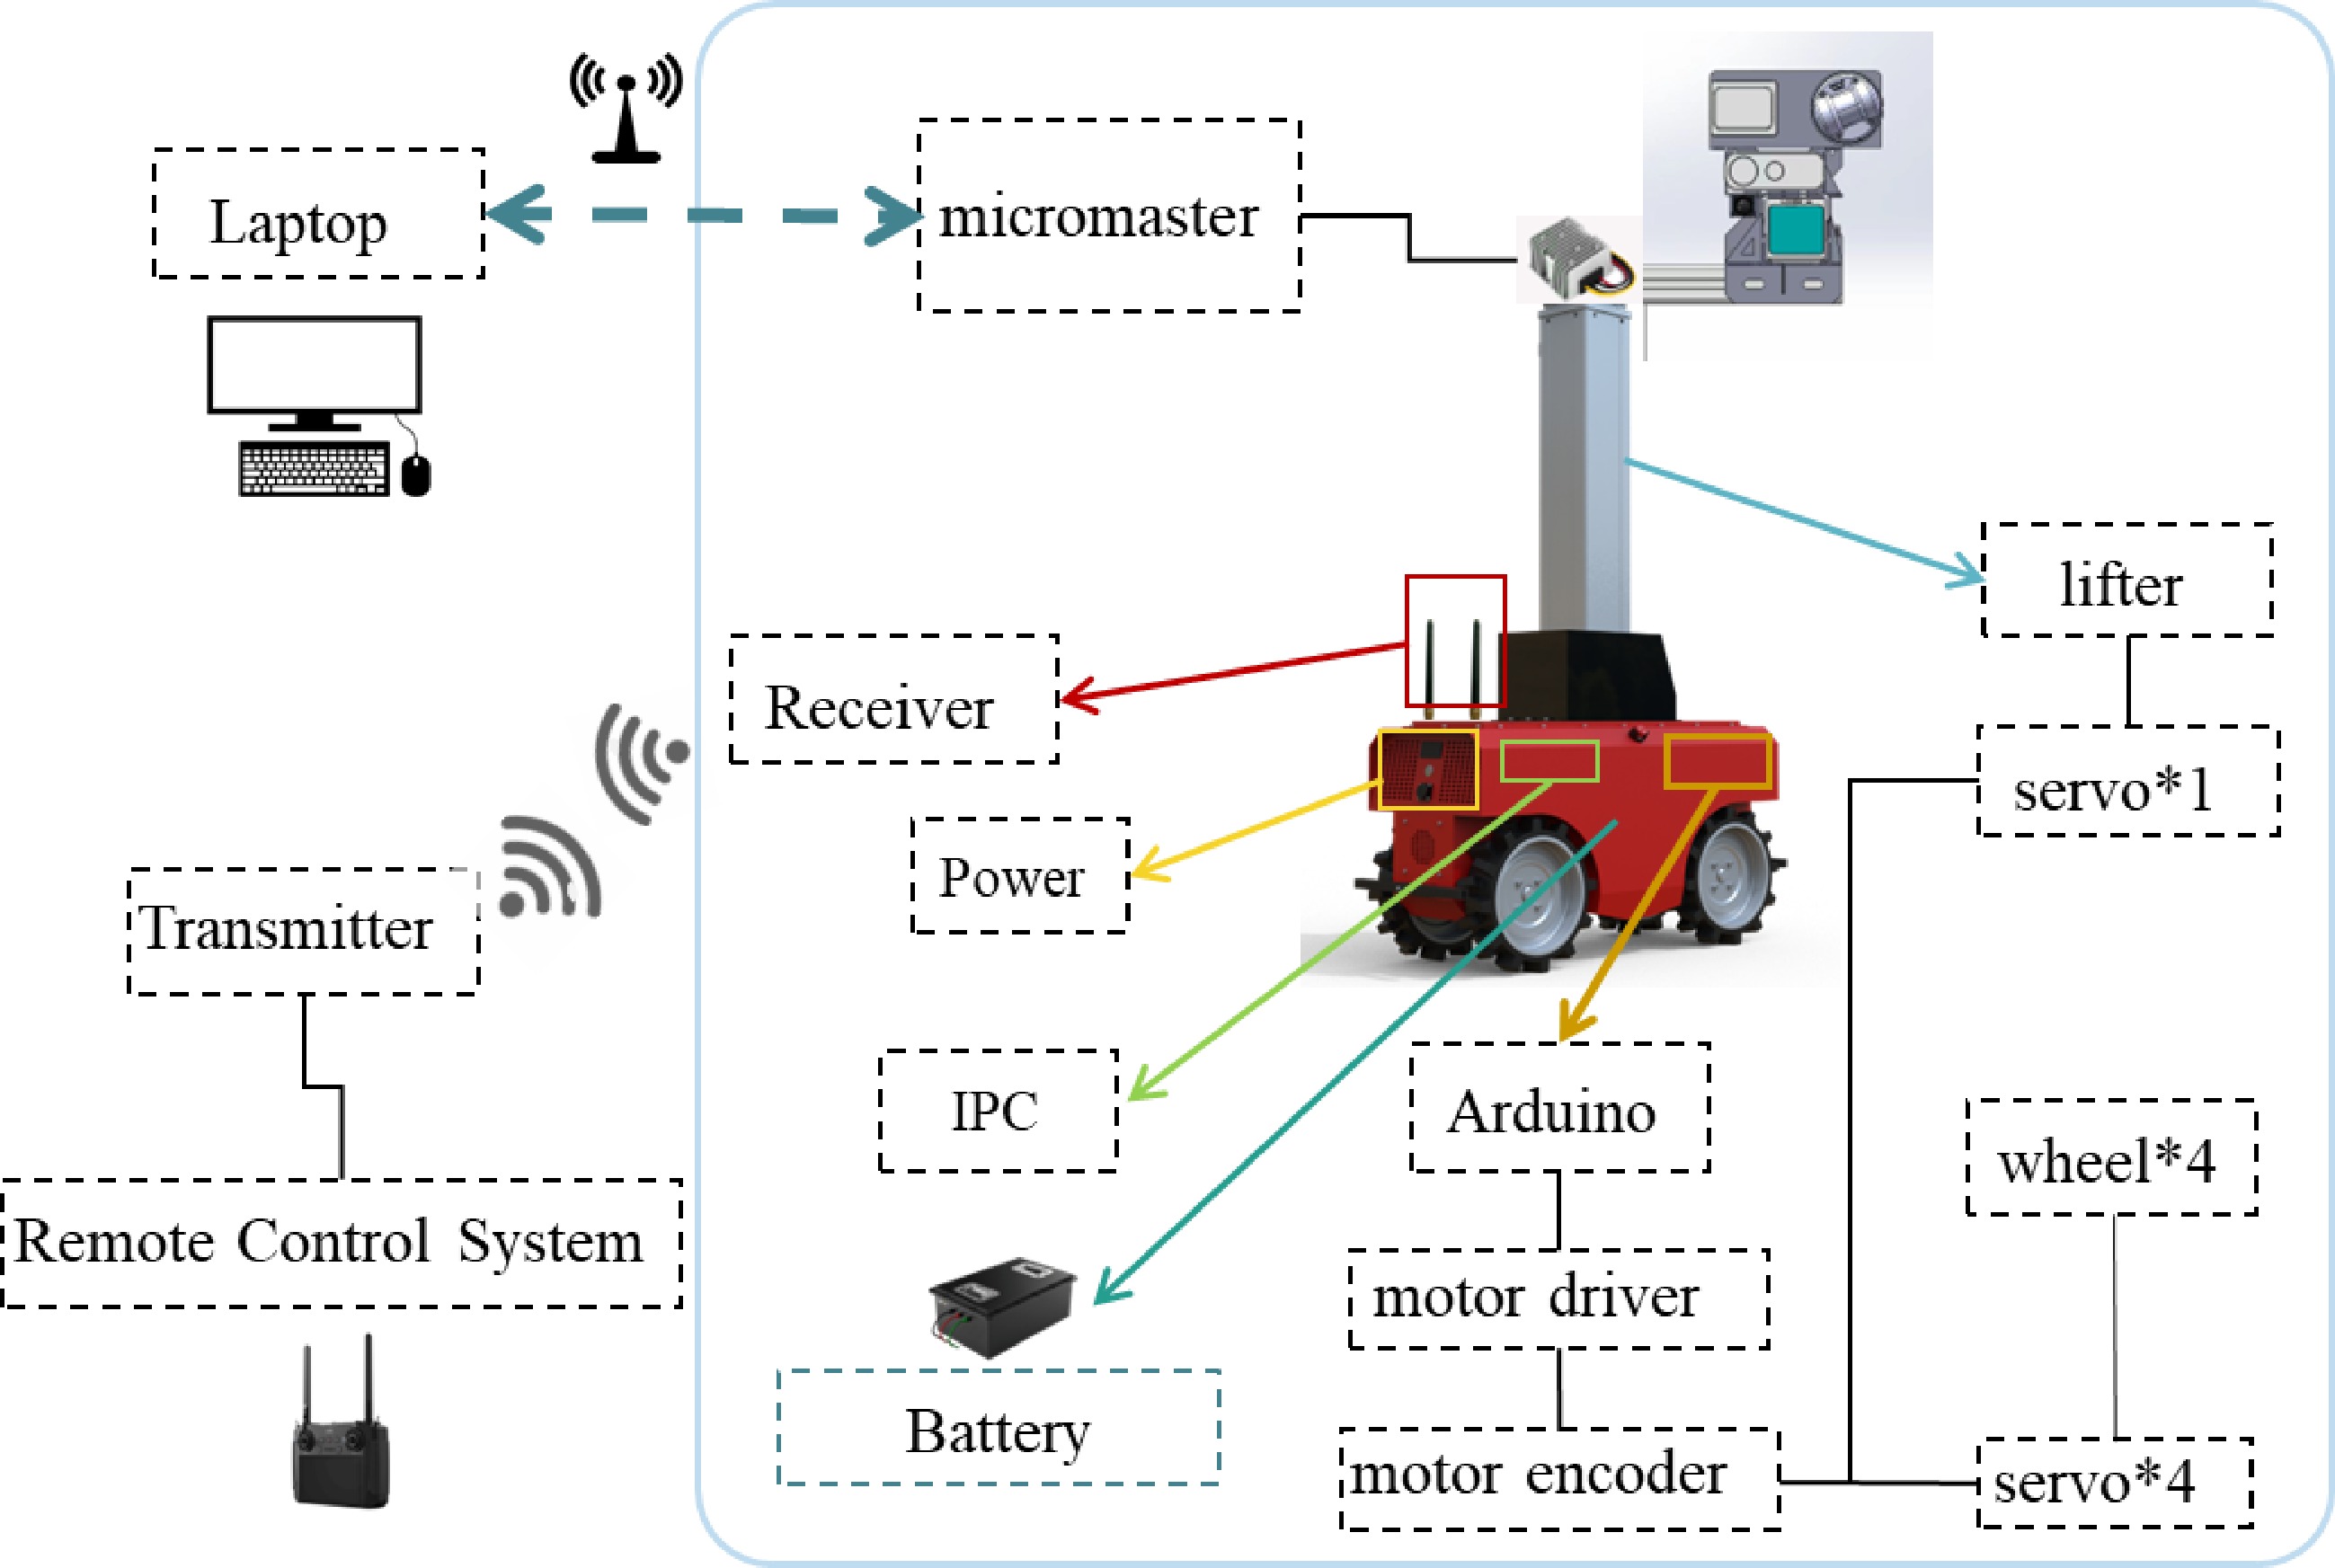
Figure 3.
Control system.
Data acquisition
-
The hardware design described above enables efficient data acquisition through its integrated sensor array and precise control mechanisms. However, the use of depth cameras in brightly lit greenhouse environments often leads to incomplete depth information. To overcome this challenge, LiDAR scanning technology was used to capture three-dimensional point cloud data of the crops. Additionally, a long-wave infrared (LWIR) camera was used to capture thermal infrared images and their corresponding pixel temperature matrices; an RGB camera was utilized for RGB image acquisition; and a four-band multispectral camera was employed to collect multispectral images.
The microcontroller, running the Ubuntu 20.04 operating system with ROS (Robot Operating System) Noetic, served as the central node for managing the RGB-D camera, LWIR camera, multispectral camera, and LiDAR. These sensors primarily published image and point cloud data as node messages. The ROS framework was selected for its capability to support real-time multi-source sensor data fusion in future applications. While the RGB-D camera and LiDAR utilized official publishing nodes, custom nodes were developed for the multispectral and thermal infrared cameras. These custom nodes defined specific message formats, including temperature matrices, ISO settings for multispectral images, and auto-exposure times, which were subsequently published.
For data storage, nodes published by each sensor were subscribed to and saved. Data acquisition was conducted at fixed points: the robot paused at designated positions, adjusted the elevation column to align with the crop height, and remained stationary for approximately 10 s. During this time, LiDAR point cloud data were collected, and data from all cameras were simultaneously saved. This duration was carefully calibrated to balance data quality and efficiency; a shorter duration could compromise point cloud accuracy, while a longer duration might increase data volume, reduce efficiency, and complicate subsequent storage and fusion processes.
Multi-source sensor calibration
-
To accurately determine the intrinsic and extrinsic parameters of various multi-source sensors, a calibration process was conducted involving the capture of images from visual sensors using a calibration plate, along with the corresponding three-dimensional point cloud data from the LiDAR. The calibration procedure was organized into three main stages to ensure accurate alignment: first, the intrinsic parameters and distortion coefficients of all cameras were calibrated; next, the extrinsic parameters between the LiDAR and the selected cameras were calibrated; and finally, the extrinsic parameters were optimized. The cameras used in this study include RGB-D cameras, multispectral cameras, and long-wave infrared (LWIR) cameras. The outcome of the calibration process includes the internal parameters and distortion coefficients for each camera lens, as well as the extrinsic parameters relating each camera to the LiDAR.
The calibration of internal parameters is essential for ensuring precise alignment and integration of visual sensors with other sensor modalities. In this study, the camera calibration toolbox in MATLAB (MathWorks, R2023a, USA) was employed to determine the internal parameters of the relevant visual sensors. For the calibration of thermal infrared cameras, a specialized checkerboard grid made of iron, with alternating black and white squares of materials with different thermal capacities, was used. This design facilitated the identification of feature points on the checkerboard, whereas conventional calibration boards often fail to accurately detect the checkerboard feature points. After obtaining the internal camera parameters, we proceeded with calibrating of the extrinsic parameters between the camera and the LiDAR. This was achieved by combining the calibration plate method[24] with a targetless calibration approach[25], establishing an initial external parameter. To account for potential inaccuracies in the external parameters, a manual calibration technique was employed to refine the transformation matrix[26]. Using the real-time transformed external parameters, the point cloud was projected onto the image, and the alignment of the projected image with the original image was continuously monitored and adjusted until optimal alignment was reached. This meticulous process ensures precise sensor data fusion and provides a robust foundation for subsequent data analysis and processing.
Multi-source sensor data fusion
-
Multi-source sensor data fusion can be primarily divided into two components: image preprocessing and data fusion. The image preprocessing phase focuses on extracting the region of interest (ROI) masks for plant areas from RGB images using segmentation techniques and color reduction methods. Since LiDAR's accuracy in single-plant segmentation is generally lower than that of image segmentation, and considering the superior efficiency of RGB image segmentation, this study employs the Fast-SAM[27] algorithm to segment crop regions within RGB images. This method not only generates crop masks but also facilitates the transfer of color information from the strawberry contour regions of the original images to the masks, achieving color restoration. The two-dimensional data from each camera serves as the basis for data fusion. Our goal is to align this two-dimensional information with the three-dimensional coordinate system of the LiDAR, integrating color data from RGB images, the pixel temperature matrices from thermal infrared images, and spectral reflectance data (including green, red, red-edge, and near-infrared bands) from multispectral images.
The comprehensive data fusion process, illustrated in Fig. 4, involves cameras with varying resolutions, fields of view, and coordinate systems. Using previously acquired external parameters, we standardize the camera data within the LiDAR coordinate system, enabling the fusion of positional, color, temperature, and spectral reflectance information. This methodology addresses challenges arising from the fusion of data from cameras with different resolutions, positional discrepancies, and variations in fields of view. To support this approach, we developed a standardized data structure capable of recording the fused multi-source sensor data, offering significant scalability to accommodate future sensor integrations.
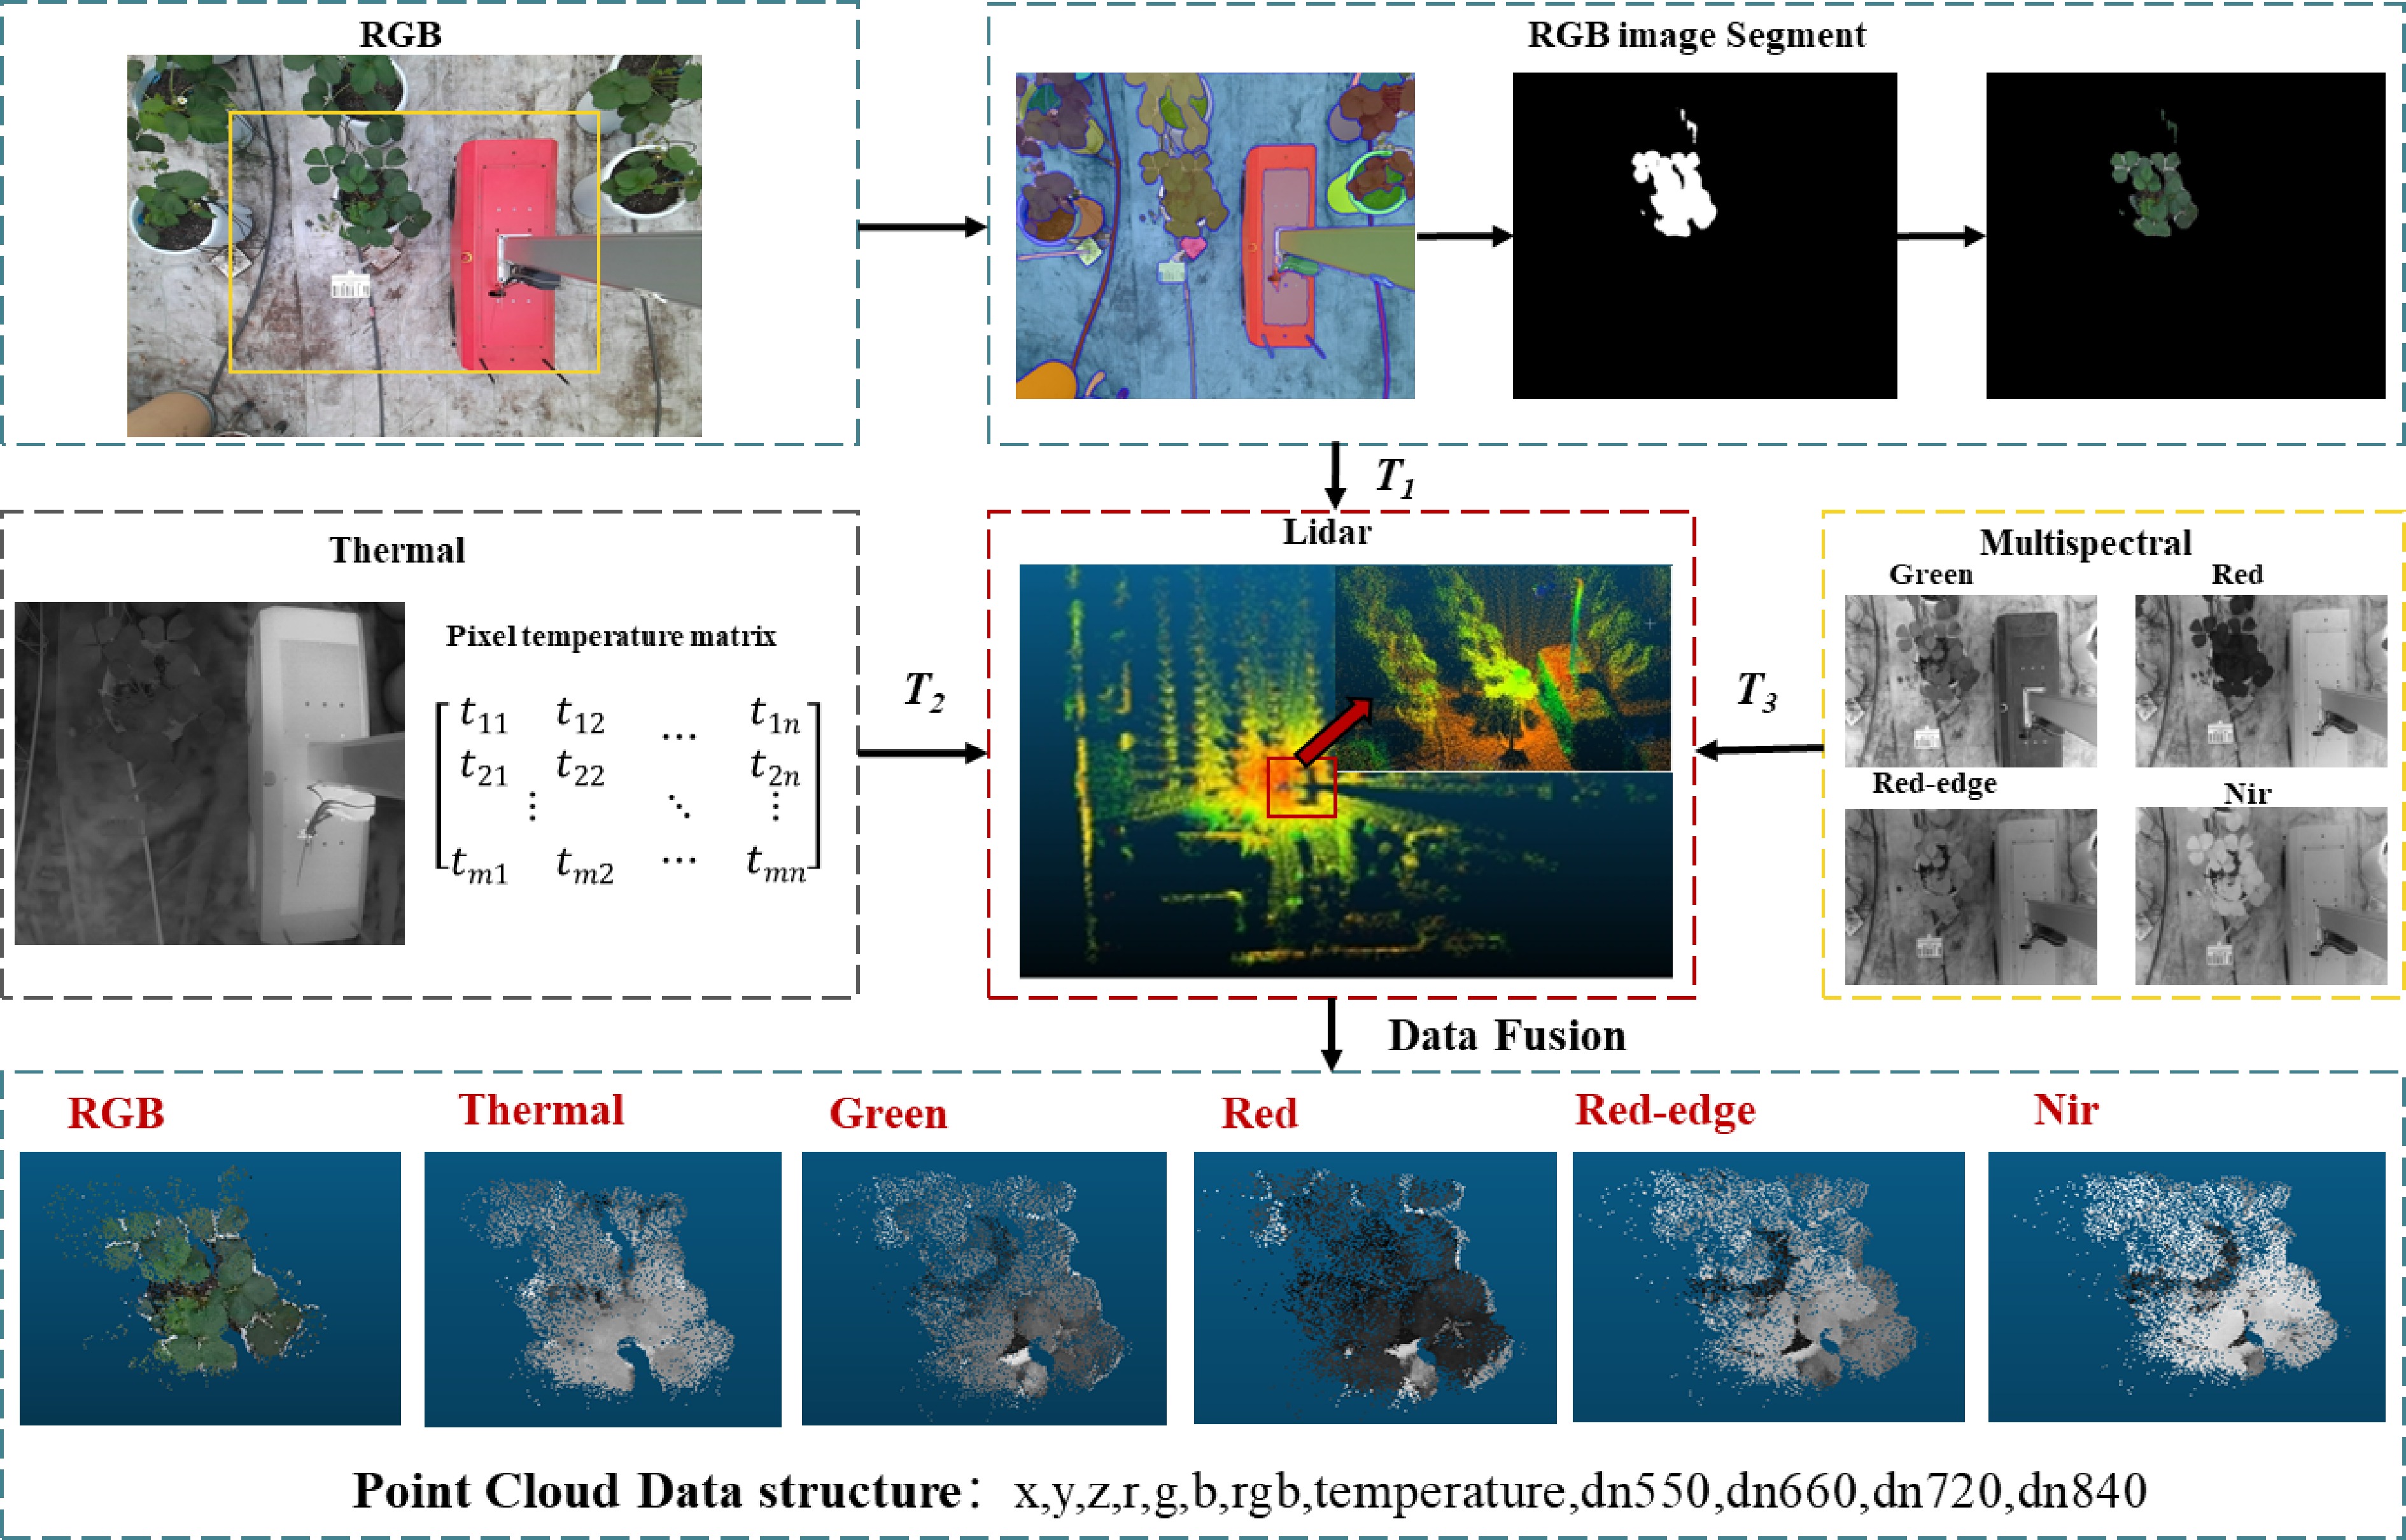
Figure 4.
The synchronized data fusion process involves the pixel matrices m and n of the thermal infrared image, which represent the image width and height. Transformation matrices T1, T2, and T3 correspond to the transformations from the RGB camera, thermal infrared camera, and multispectral camera, respectively, to the LiDAR coordinate system.
Extraction of phenotypic parameters
-
To validate the multi-dimensional phenotypic indices of plants, we classified them into four distinct types: canopy width, Normalized Difference Water Index (NDWI), Normalized Difference Vegetation Index (NDVI), and Normalized Relative Canopy Temperature (NRCT), along with two ratio indices, P1 and P2. The P1 and P2 values are comprehensive indices used to assess the water regulation capacity and overall plant health of strawberry varieties. These indices were used to analyze variations in water availability and overall plant health across different species.
Canopy width is defined as the maximum distance between any two points on the plant's projection onto the ground, serving as an indicator of its growth status. The NDVI[28,29] is used to assess plant health by evaluating chlorophyll content through differential reflectance in the near-infrared (NIR) and red-light wavebands. The NDWI[29] is an important index for identifying water bodies, monitoring vegetation moisture content, and evaluating plant health. The NRCT[17] is similar to the Crop Water Stress Index (CWSI)[29], which measures water stress levels in plants and reflects their transpiration and water content. Finally, we developed the P1 and P2 ratio indices to concurrently monitor water usage and health variations across different strawberry cultivars. In this study, we employed data obtained through the fusion method described above, extracted the relevant attributes, and successfully constructed the phenotypic parameters.
NDVI, NDWI, NRCT, P1, P2 are calculated as shown in Eqns (1)−(5):
${\rm NDVI} = \frac{NIR-Red}{NIR+Red} $ (1) ${\rm NDWI} = \frac{Green-NIR}{Green+NIR} $ (2) ${\rm NRCT} = \frac{{T}_{i}-{T}_{min}}{{T}_{max}-{T}_{min}} $ (3) ${\rm P1} = \frac{NDVI}{NRCT} $ (4) ${\rm P2} = \frac{NDWI}{NRCT} $ (5) Where,
$ NIR $ $ Red $ $ Green $ $ {T}_{i} $ $ {T}_{min} $ $ {T}_{max} $ Evaluation indicators
-
The efficacy of the algorithms in predicting maximum canopy size and mean temperature was assessed using the Root Mean Square Error (RMSE) and the Coefficient of Determination (R²), with comparisons made against manually recorded data. The mean temperature measurements were obtained using a FOTRIC-280 thermal imager. Additionally, the performance of the clustering algorithm was evaluated using the Adjusted Rand Index (ARI), a modified version of the Rand Index (RI) that quantifies clustering effectiveness by partitioning sample points into multiple clusters. The ARI accounts for the likelihood of random assignments and yields values ranging from −1 to 1. A value close to 1 indicates strong alignment between the clustering results and the actual conditions, while a value near 0 suggests that the clustering outcome is comparable to random assignment. A value close to −1 signifies a complete discordance between the clustering results and the actual conditions. These metrics allow for a comprehensive evaluation and validation of the algorithm's accuracy and reliability.
RMSE, R2, RI, ARI are calculated as shown in Eqns (6)−(9):
$ {\rm RMSE} = \sqrt{\dfrac{1}{n}{\sum\nolimits _{i=1}^{n}}{\left({{P}_{i}-M}_{i}\right)}^{2}} $ (6) $ {\rm R}^{2} = \dfrac{\sum _{i=1}^{n}({P}_{i}-{P}_{a})({M}_{i}-{M}_{a})}{\sqrt{\sum _{i=1}^{n}{({P}_{i}-{P}_{a})}^{2}\sum _{i=1}^{n}{({M}_{i}-{M}_{a})}^{2}}} $ (7) $ {\rm RI} = \dfrac{a+b}{{C}_{n}^{2}} $ (8) $ {\rm ARI} = \dfrac{RI-E\left(RI\right)}{max\left(RI\right)-E\left(RI\right)} $ (9) In this context,
$ {P}_{i} $ $ {M}_{i} $ $ {P}_{a} $ $ {M}_{a} $ $ {C}_{n}^{2} $ $ E\left(RI\right) $ $ max\left(RI\right) $ -
In this study, we systematically optimized the external parameters between each camera and the LiDAR system, with the results presented in Fig. 5. The calibration of external parameters for multispectral and thermal infrared images is more complex than for RGB images due to their lower resolution and lack of distinct contours. As a result, accurately optimizing the initial external parameters of these sensors is crucial.
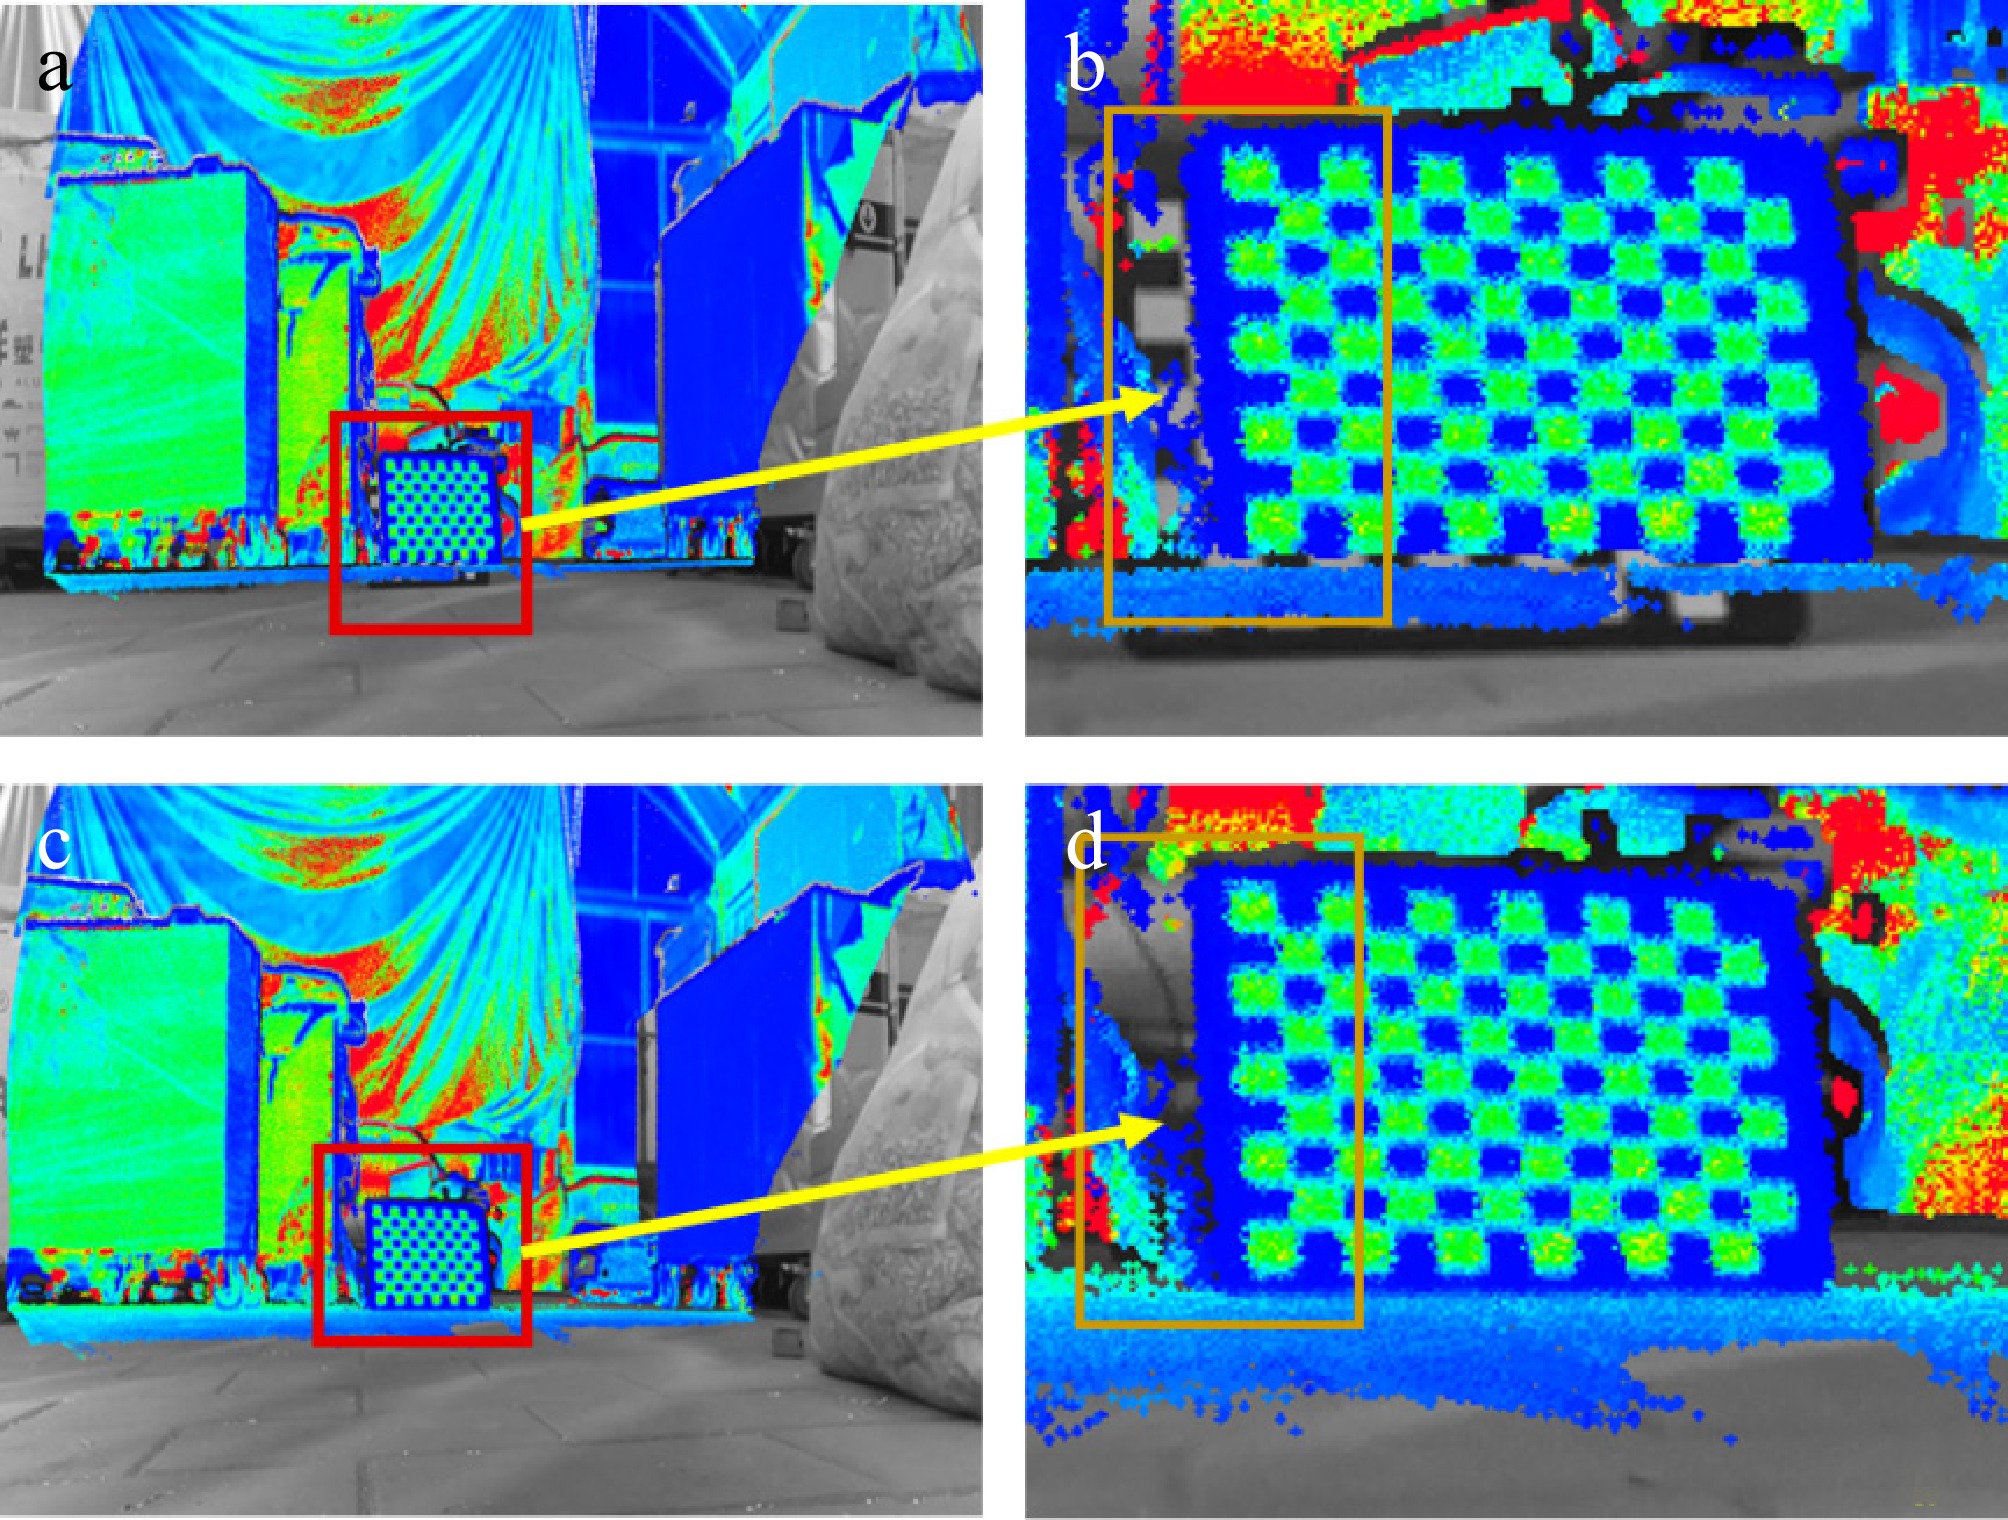
Figure 5.
Schematic diagram of the fine-tuned external parameter: (a) before adjustment; (b) after adjustment; (c) local zoom in before adjustment; (d) local zoom in after adjustment.
We examined the external parameter between the green band lens of the multispectral camera and the LiDAR to demonstrate the optimization process. Initially, we projected the point cloud onto the image using the transformation matrix. During this projection, a noticeable offset appeared in the red-framed calibration plate (Fig. 5a). Figure 5b provides a magnified view of this region. After adjustments, the offset was nearly eliminated, as shown in Fig. 5c, with an enlarged view of the corrected area in Fig. 5d. This optimization process yielded more accurate external parameters, establishing a solid foundation for subsequent multi-source sensor data fusion. This improvement not only enhances the accuracy of data fusion but also supports further data analysis and processing.
Visualization of multi-source sensor data fusion
-
In the data fusion process, we first employed the Fast-SAM model to segment the RGB images, isolating the region of interest (ROI) corresponding to the plants. This step ensured accurate ROI extraction before integrating data from lower-resolution sensors. After segmentation, the RGB images were integrated with data from additional sensors within a unified field of view using the fusion methodology described above. During this step, the areas outside the plant mask were standardized to black, and these regions were removed during the fusion process, resulting in the generation of ROI point clouds for the strawberry plants. These point clouds included thermal, green, red, red-edge, and near-infrared spectral bands, which were enhanced using pseudo-color processing (see Fig. 6). The resulting fused point cloud data were organized into a customized, standardized data structure, consolidating location, color, temperature, and spectral data. This approach not only improves the data's usability but also provides a comprehensive foundation for subsequent analysis and applications.
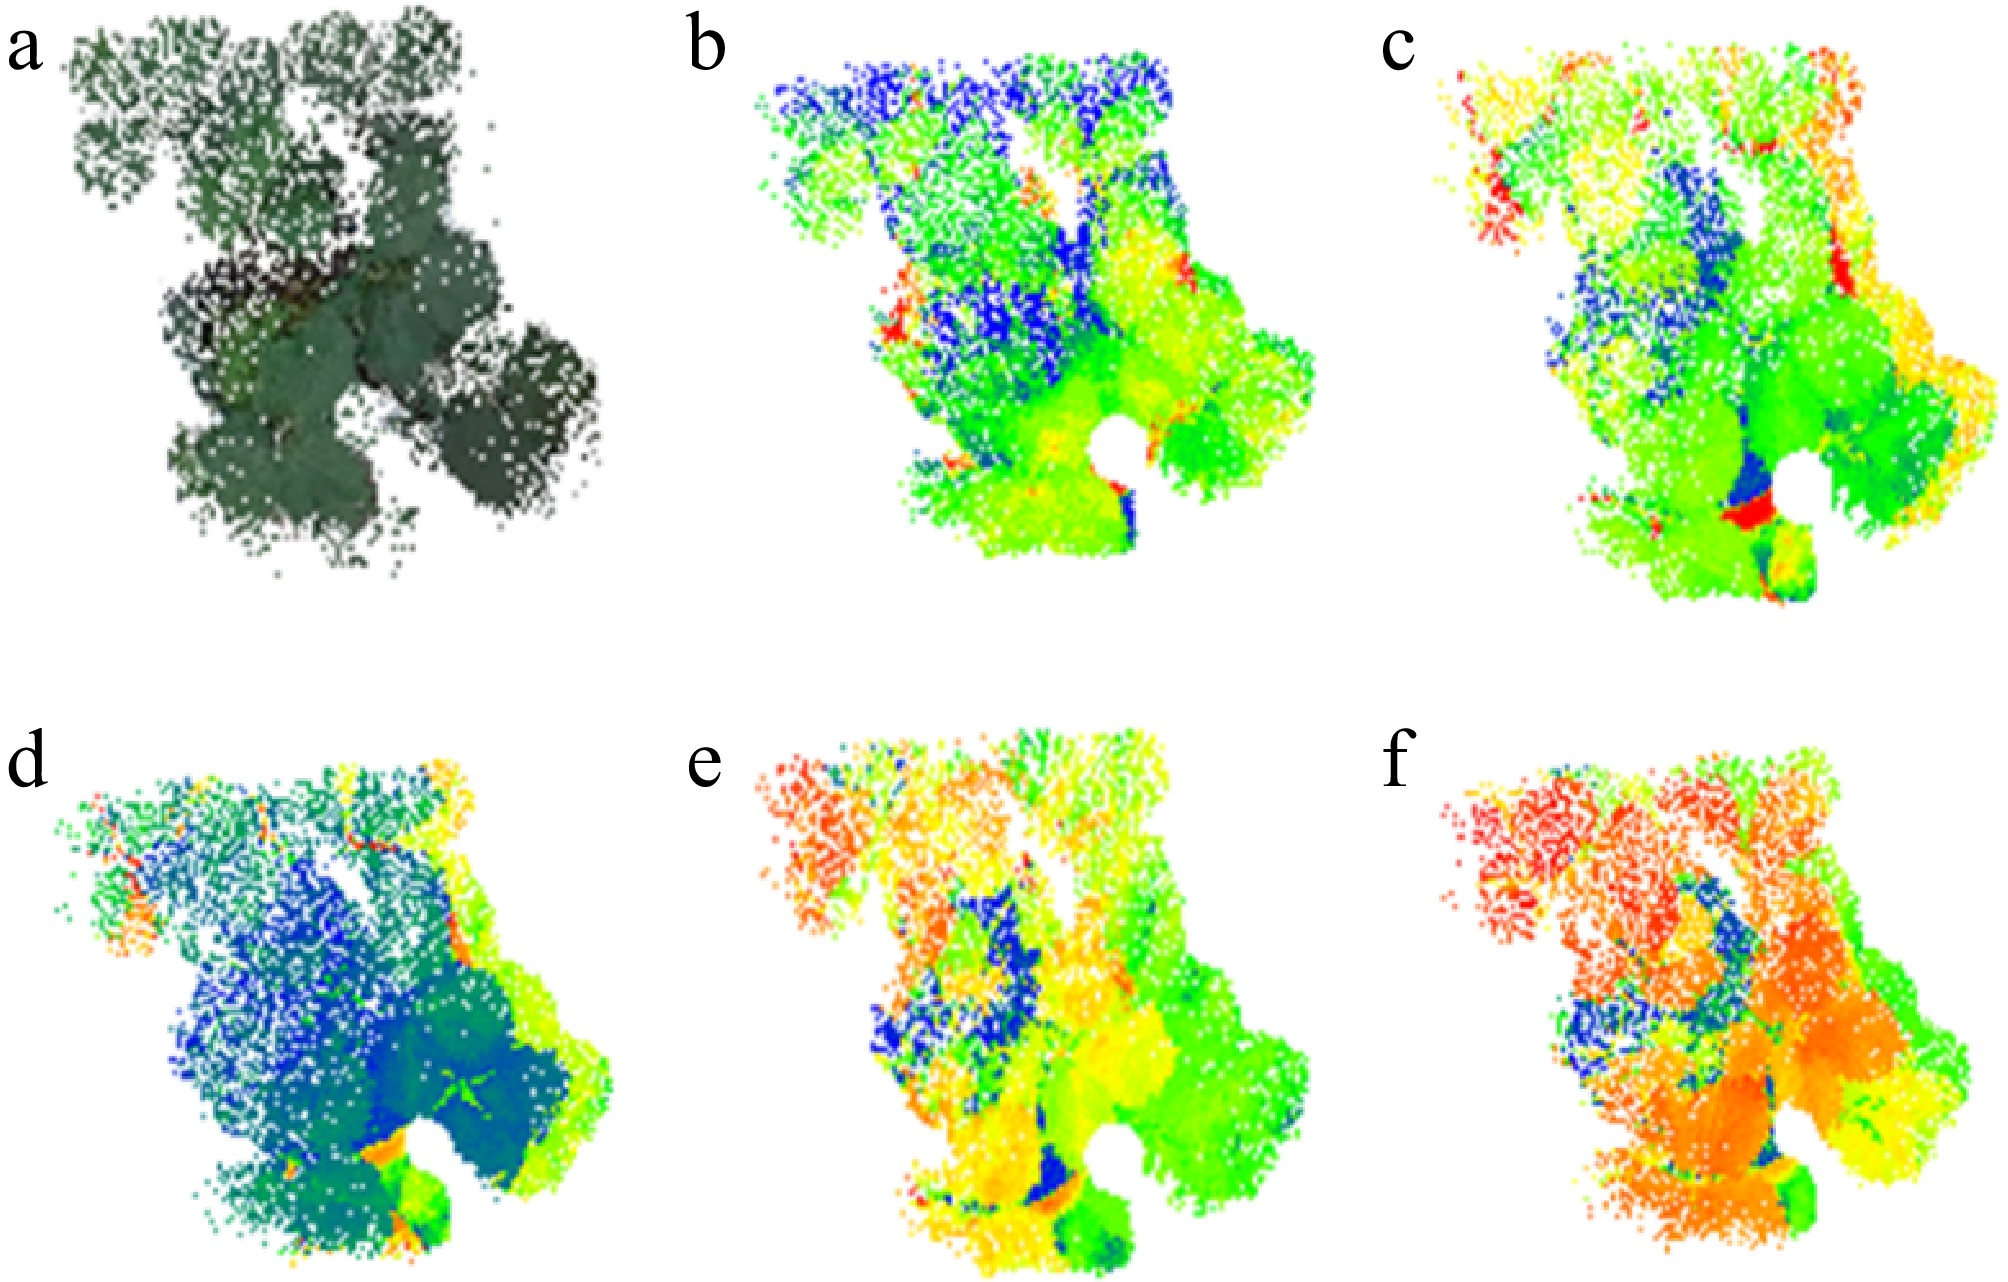
Figure 6.
Acquisition of plant ROI by RGB image segmentation after fusion of individual component point clouds: (a) RGB; (b) thermal; (c) green light band; (d) red light band; (e) red edge band; (f) NIR band.
Phenotype extraction accuracy
-
This study examined 72 strawberry plants, correlating the crown width and average temperature extracted from point clouds fused with multi-source sensor data with the corresponding manually measured values. A linear regression model was used for the analysis, with the horizontal axis representing manually obtained values and the vertical axis representing point cloud-derived values. The RMSE and R² were computed for both parameters. As shown in Fig. 7a, the algorithm's estimate of crown width demonstrated high accuracy, with an R² value of 0.9864 and an RMSE of 0.0185 m. In contrast, as shown in Fig. 7b, the estimate of average temperature exhibited lower accuracy, with an R² value of 0.8324 and an RMSE of 0.1732 °C. Despite this, the linear correlation between the manually measured and algorithm-derived crown widths remained strong, indicating that our methodology can reliably estimate strawberry crown dimensions. However, the relatively high RMSE in the algorithmic temperature measurements compared to the actual values may be due to the averaging process used for the temperature readings of the potted strawberries and their surrounding environment, which likely introduced some error.
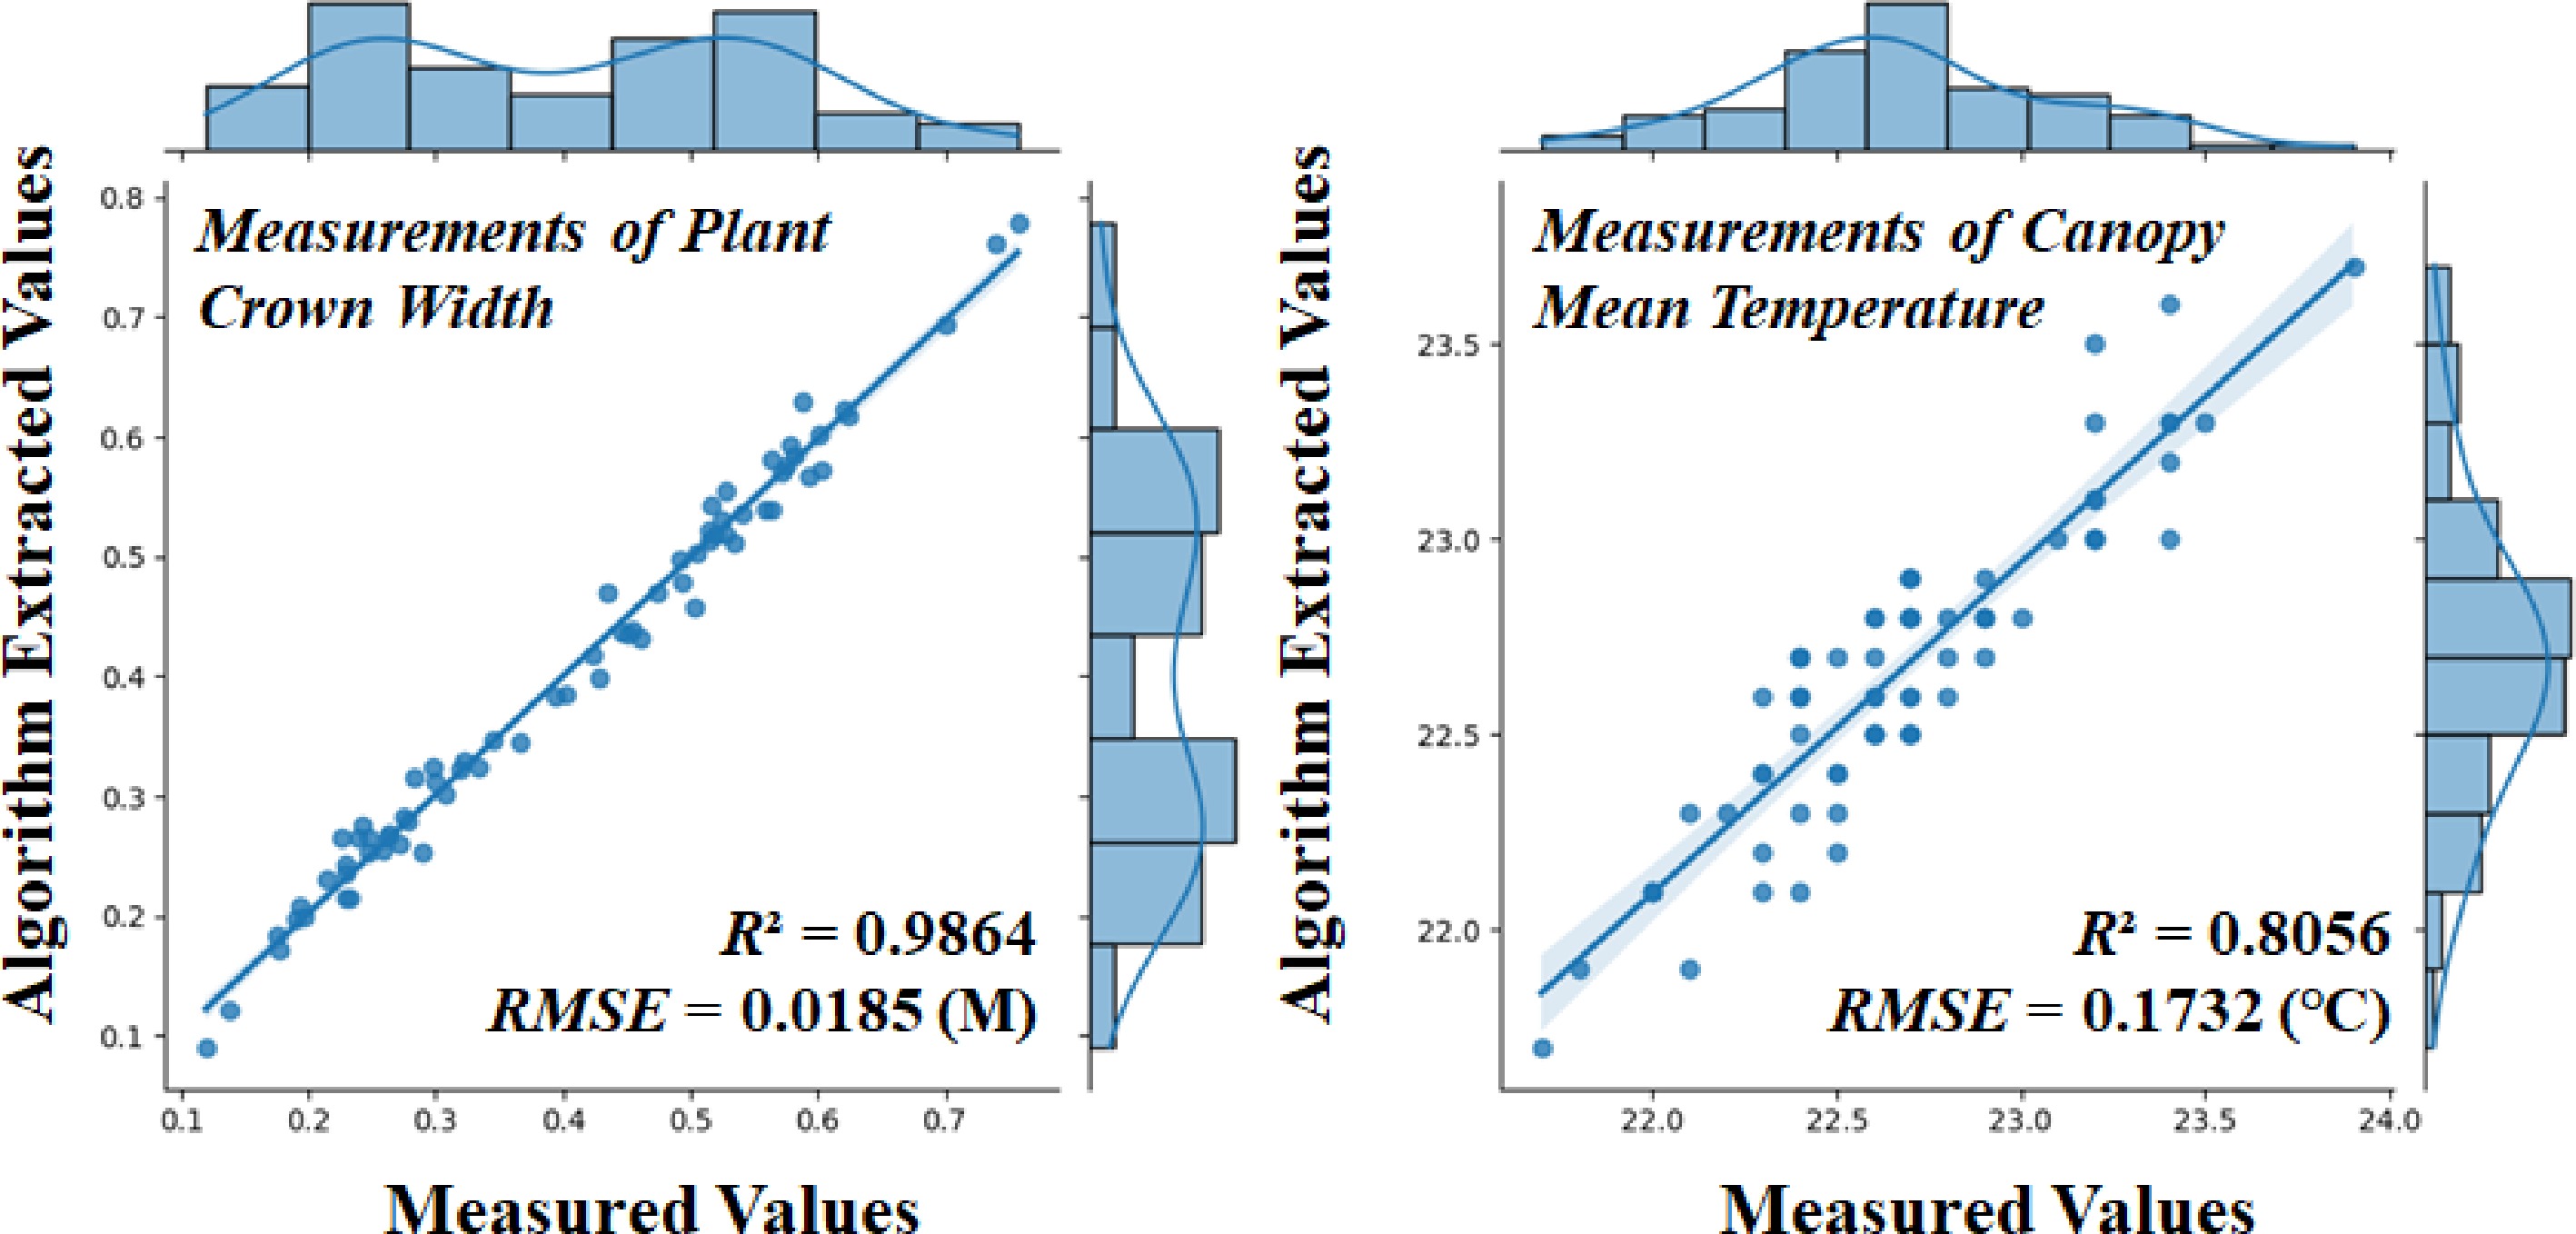
Figure 7.
Linear fit of the algorithm to the manually measured values of canopy width, and mean temperature for 72 strawberry plants.
Inversion of phenotypic parameters
-
This study conducted a comprehensive analysis of 72 strawberry plants to assess their physiological and health status. The analysis included the calculation of several indices—such as the NDVI, NDWI, NRCT, and composite ratio indices P1 and P2—to examine varietal differences in moisture content and health status.
As shown in Fig. 8, the NDVI values for strawberry plants ranged from 0.2 to 0.8, which is typical for healthy plants, with notable differences in health status observed across varieties. The NDWI values ranged from −0.7 to −0.1, indicating that most plants maintained moderate water content. Negative NDWI values reflected lower reflectance in the green band compared to the near-infrared (NIR) band, and the significant inter-varietal differences in NDWI highlighted variations in water retention capacity. In comparison to NDVI, NDWI showed less variability and greater consistency within individual cultivars. The NRCT values ranged from 0.1 to 0.7, with considerable differences across cultivars, reflecting their varying capacities for water stress adaptation and thermoregulation. While no distinct patterns were observed in crown distribution among varieties, crown consistency within individual cultivars outperformed NDVI, NDWI, and NRCT, suggesting a high degree of uniformity within each variety.
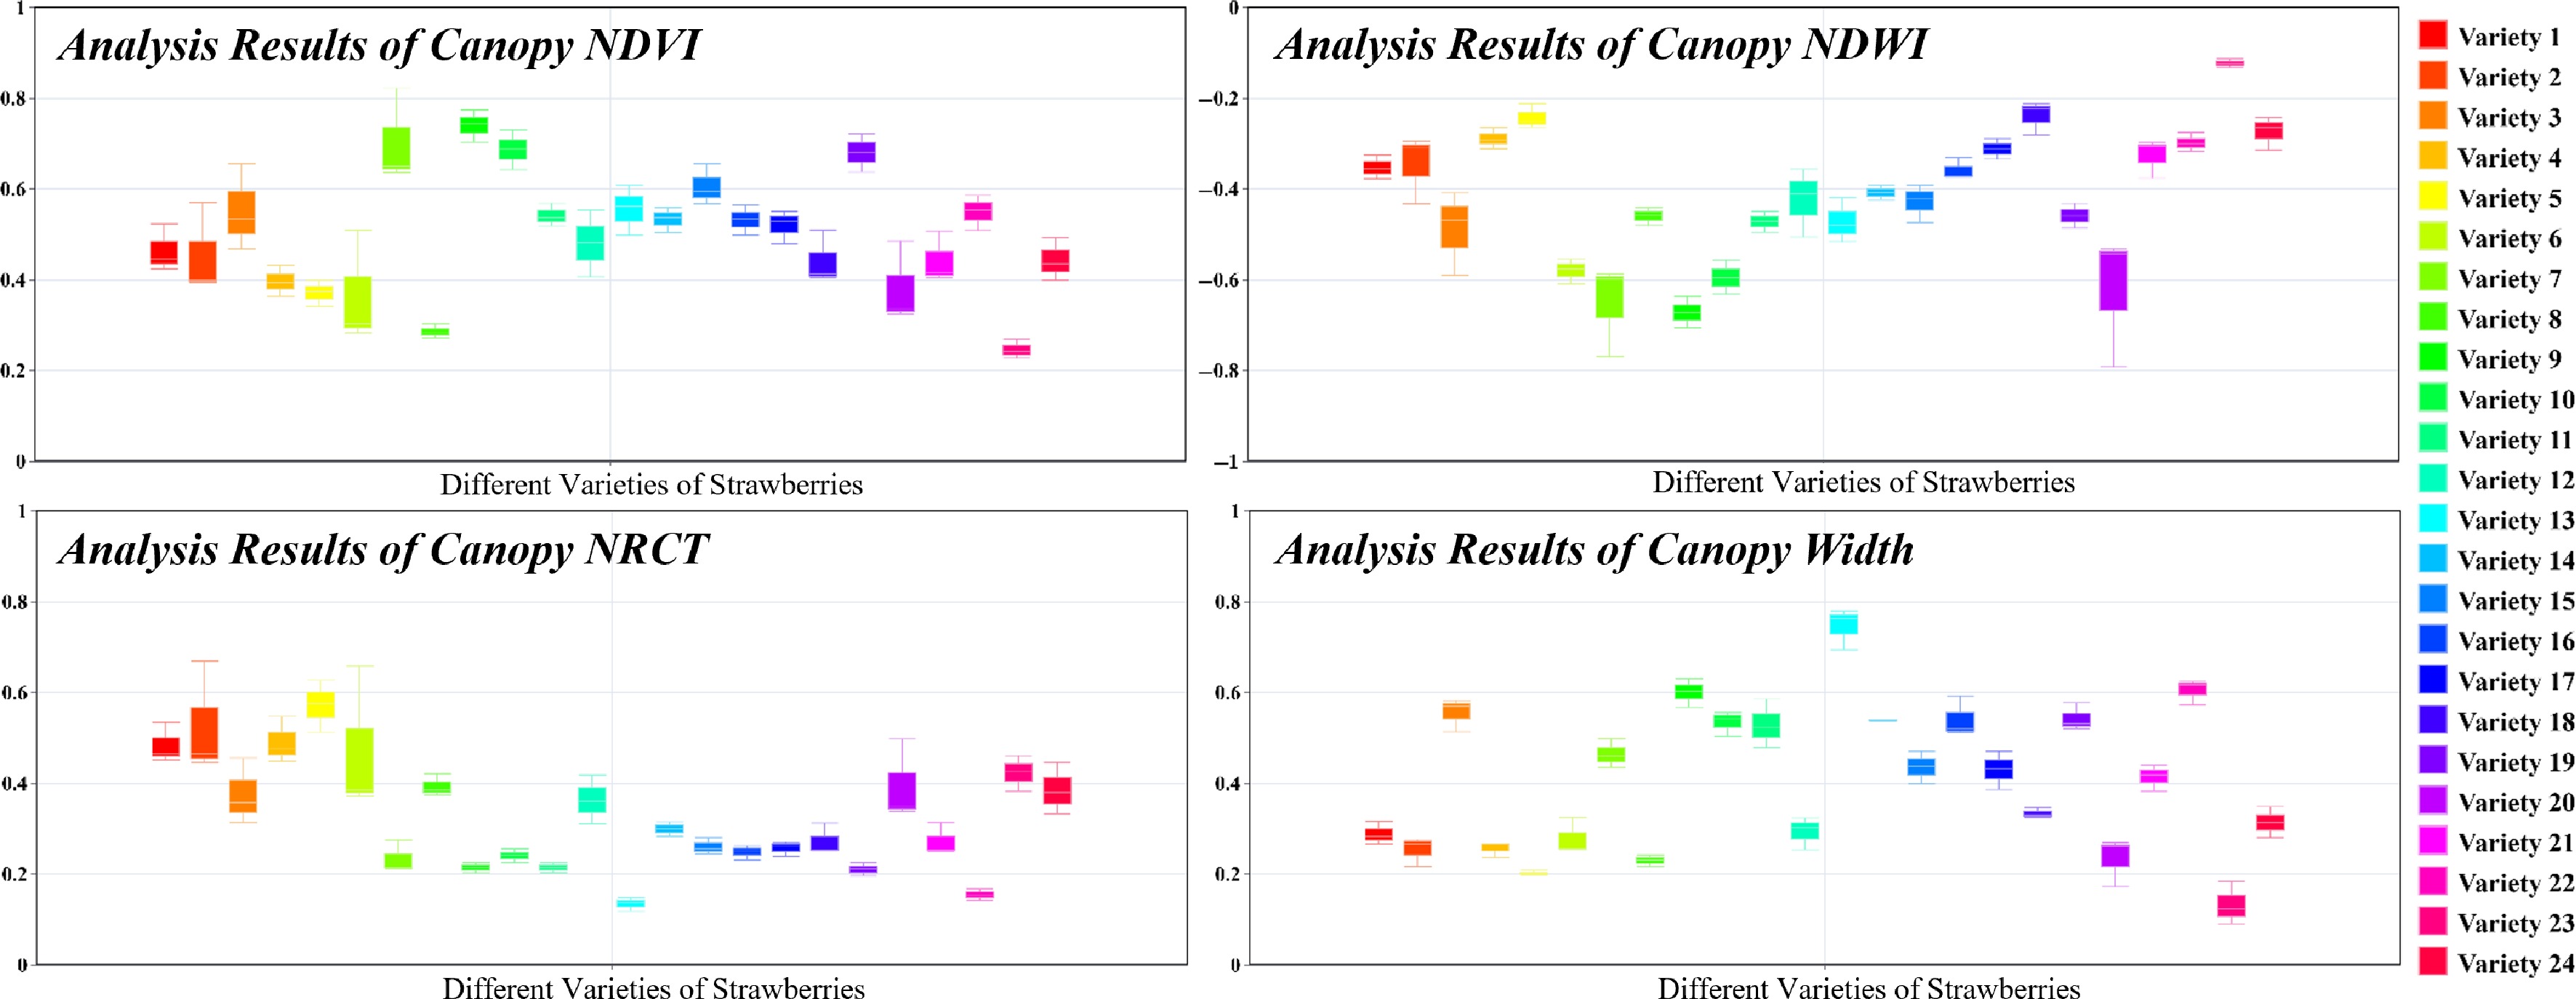
Figure 8.
Variability of NDVI, NDWI, NRCT, and width among varieties with consistency among the same varieties.
A higher P1 value combined with a lower P2 value indicates superior performance in both aspects. As shown in Fig. 9, significant differences in the mean P1 and P2 values were observed across varieties, highlighting variability in water-use efficiency and health status. Analysis of the distribution on the left side of Fig. 9 reveals that variety 13 exhibited the highest P1 value and the lowest P2 value, suggesting optimal water regulation and plant health. The weight distribution on the right side of the figure further reveals that the color intensity of the three plants within each variety reflects their contributions to the P1 and P2 indices. Darker colors indicate greater contributions, allowing for the identification of standout plants within each variety. This weighting analysis plays a critical role in guiding targeted selection and optimization processes.
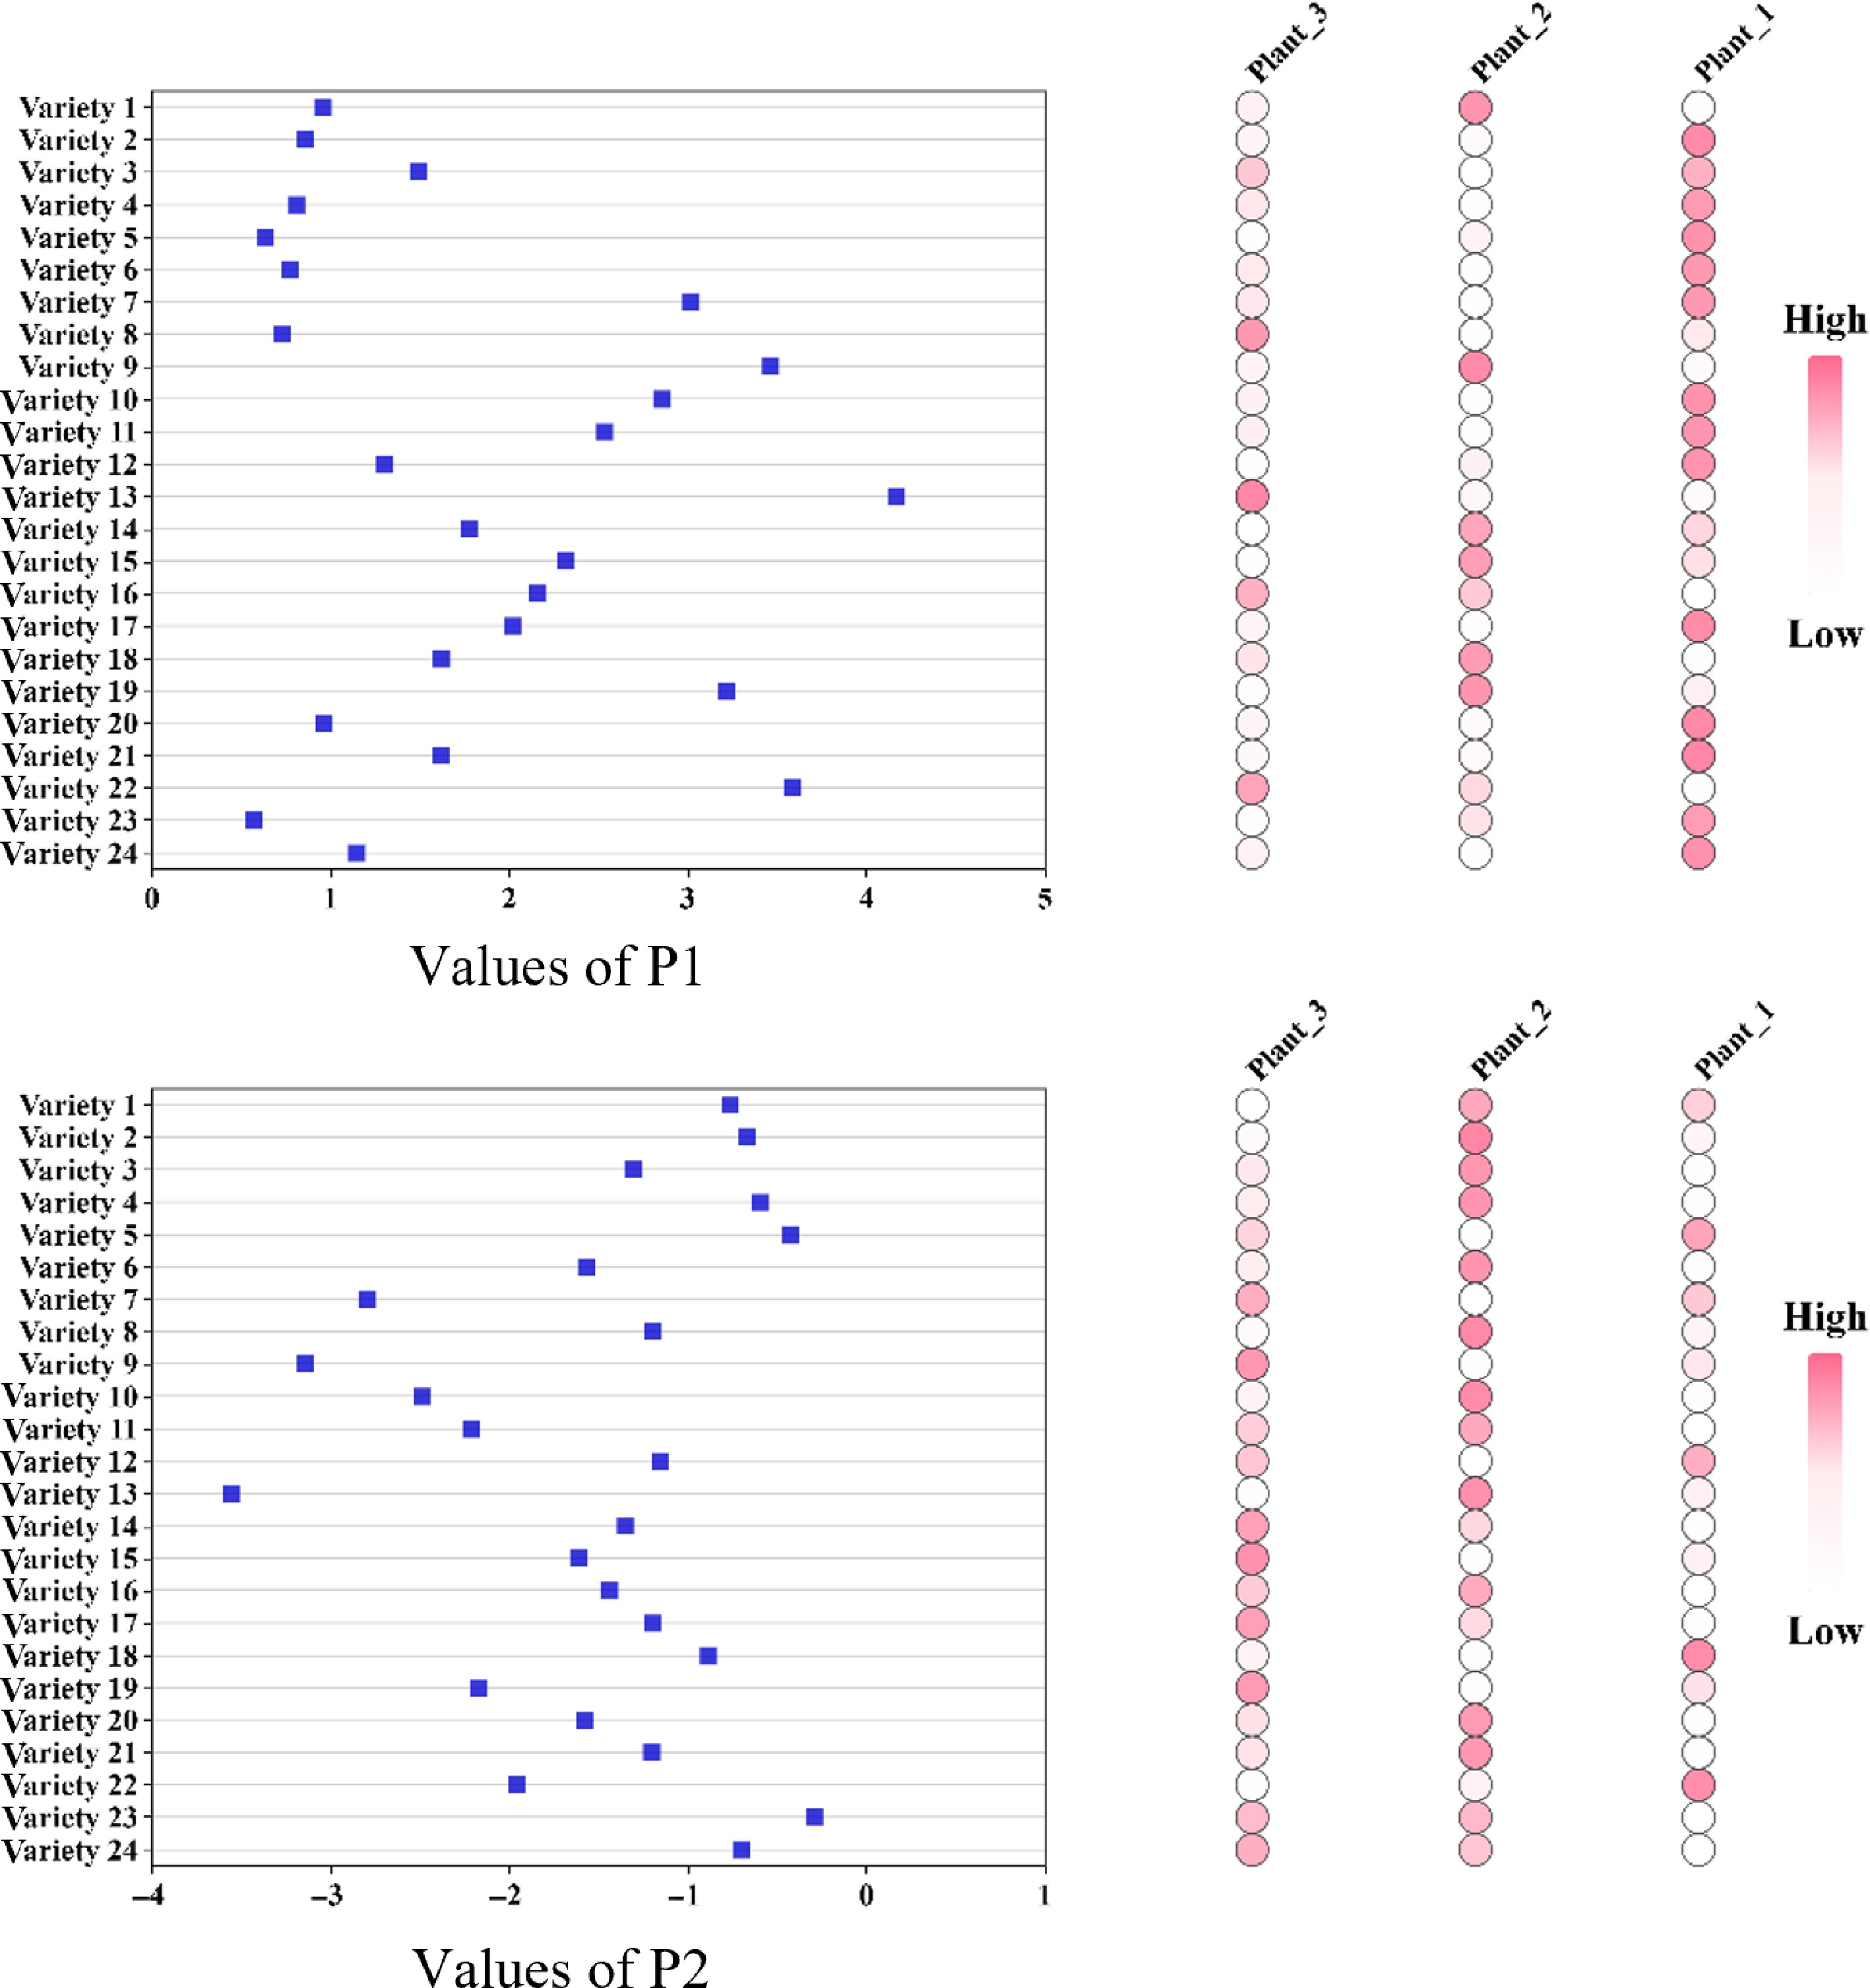
Figure 9.
Differences in P1 and P2 between varieties and consistency between the same varieties.
In summary, the selection of optimal varieties can be based on the combination of the highest P1 value and the lowest P2 value. The weight distribution graph offers a refined understanding of intra-varietal performance differences, providing valuable insights for informed decisions in strawberry breeding and cultivation management.
Identification of strawberry varieties using multiple phenotypic parameters
-
As shown in Fig. 10, an automatic cluster analysis was conducted using the K-Means algorithm to assess crown width, P1 value, and P2 value across 72 strawberry plants. The results revealed that clustering based solely on crown width identified significantly fewer varieties than the anticipated 24, with an adjusted Rand index (ARI) of only 0.05. In contrast, when the P1 and P2 values—derived from the integration of NDVI, NDWI, and NRCT—were used, the number of identified varieties increased to 18 and 14, respectively, with corresponding ARI values of 0.69 and 0.46. However, these results still fell short of the target of 24 varieties.
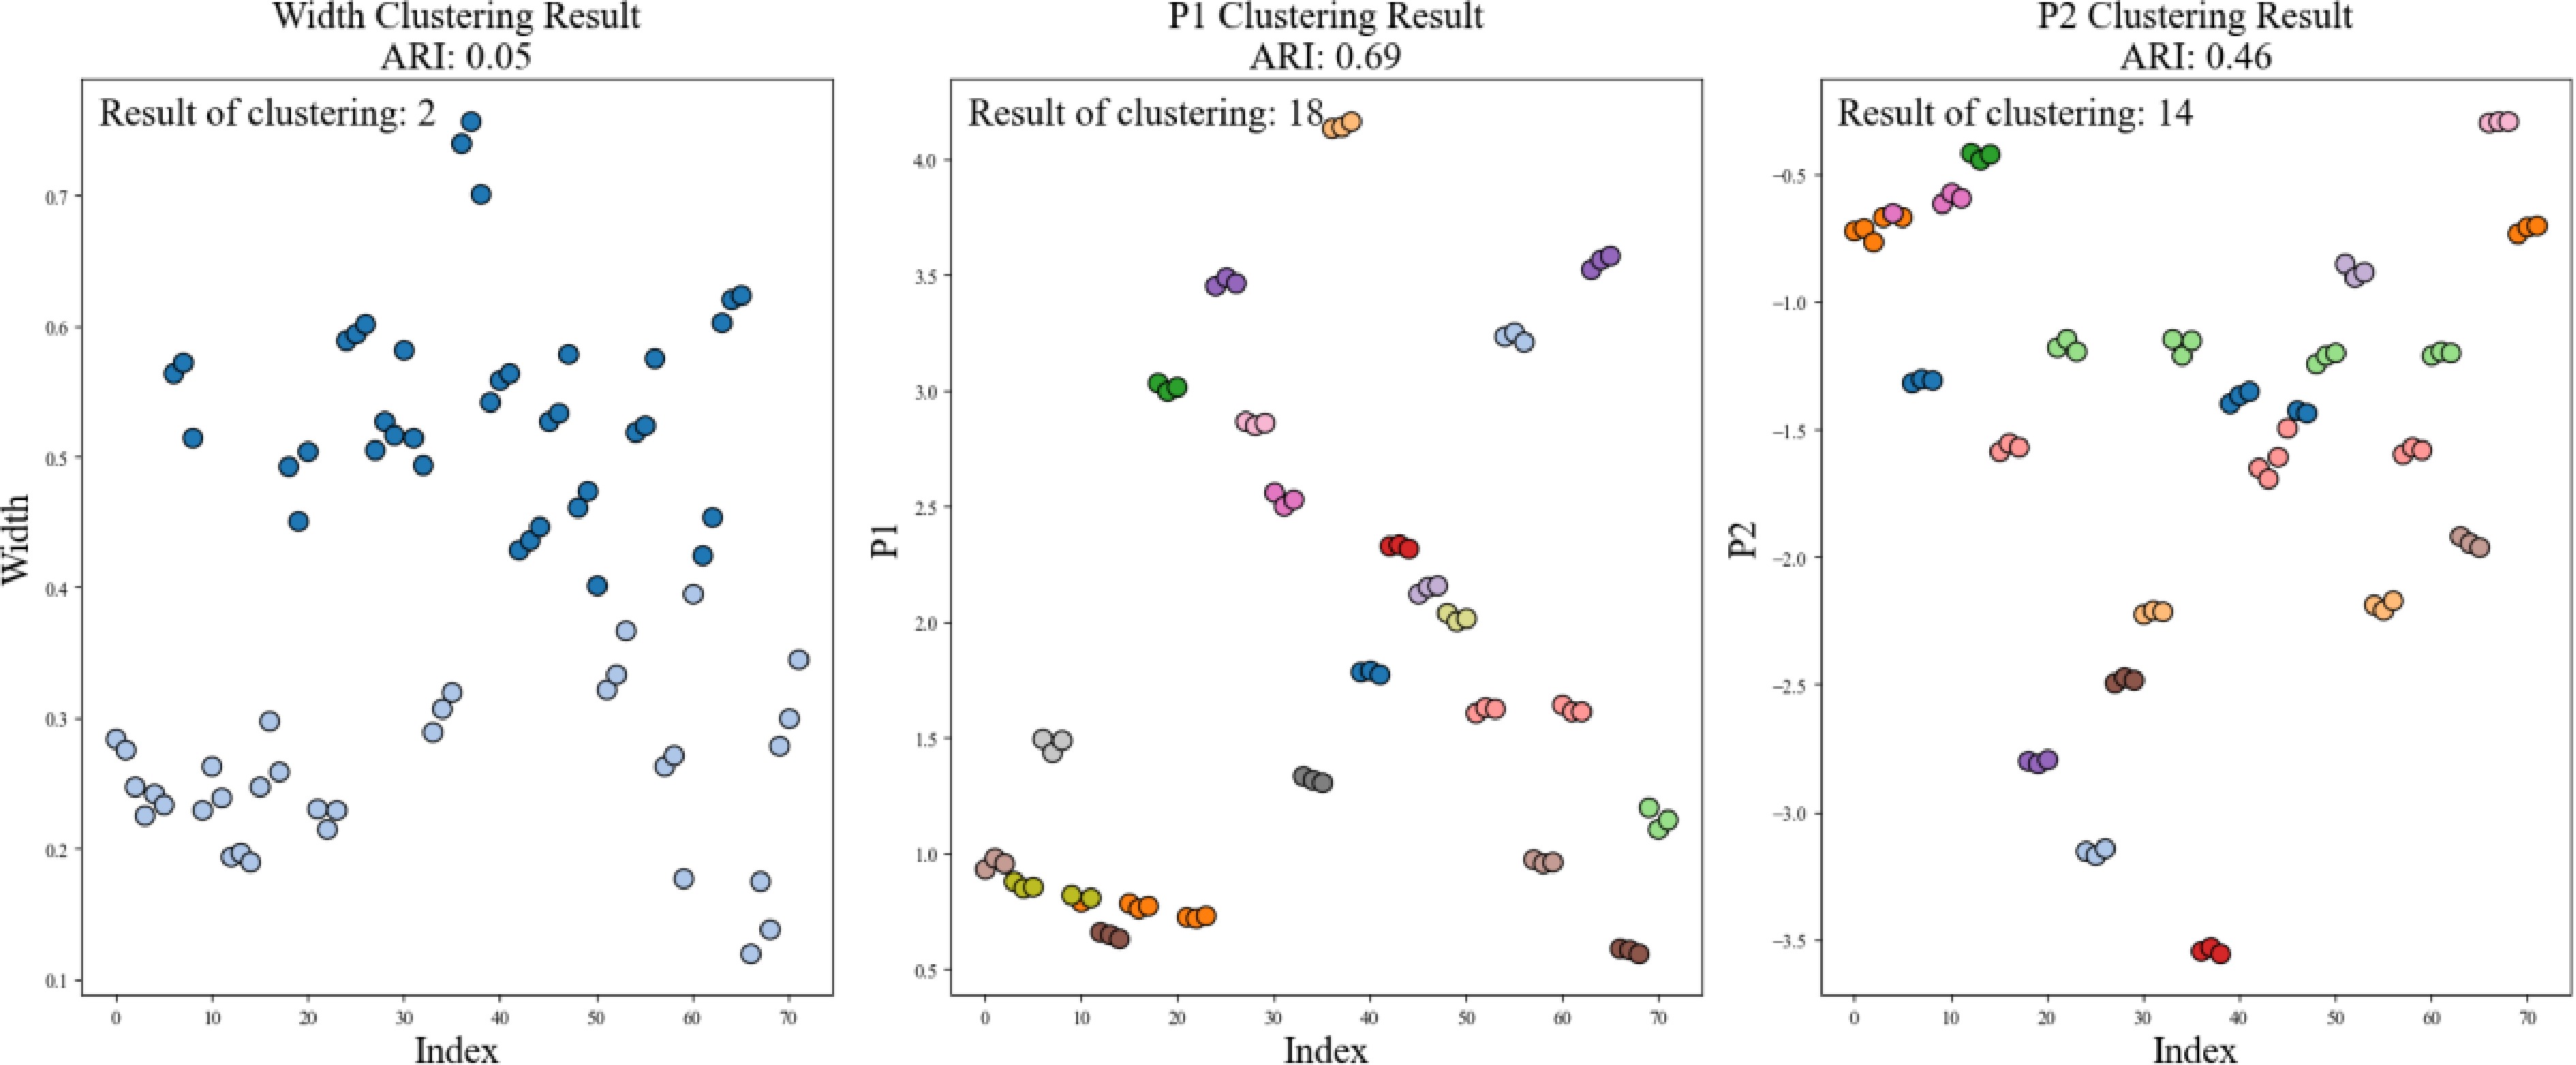
Figure 10.
Width, P1, and P2 were analyzed for individual clustering.
As shown in Fig. 11, we examined various combinations of phenotypic parameters for a more comprehensive clustering analysis. When the P1 and P2 values were subjected to two-dimensional automatic clustering, the number of identified varieties increased to 20, and the ARI improved to 0.75. By integrating crown width with the P1 and P2 values and applying principal component analysis (PCA), the number of varieties further increased to 23, achieving an ARI of 0.80. Although this result approached the expected 24 varieties, it indicated room for further improvement.
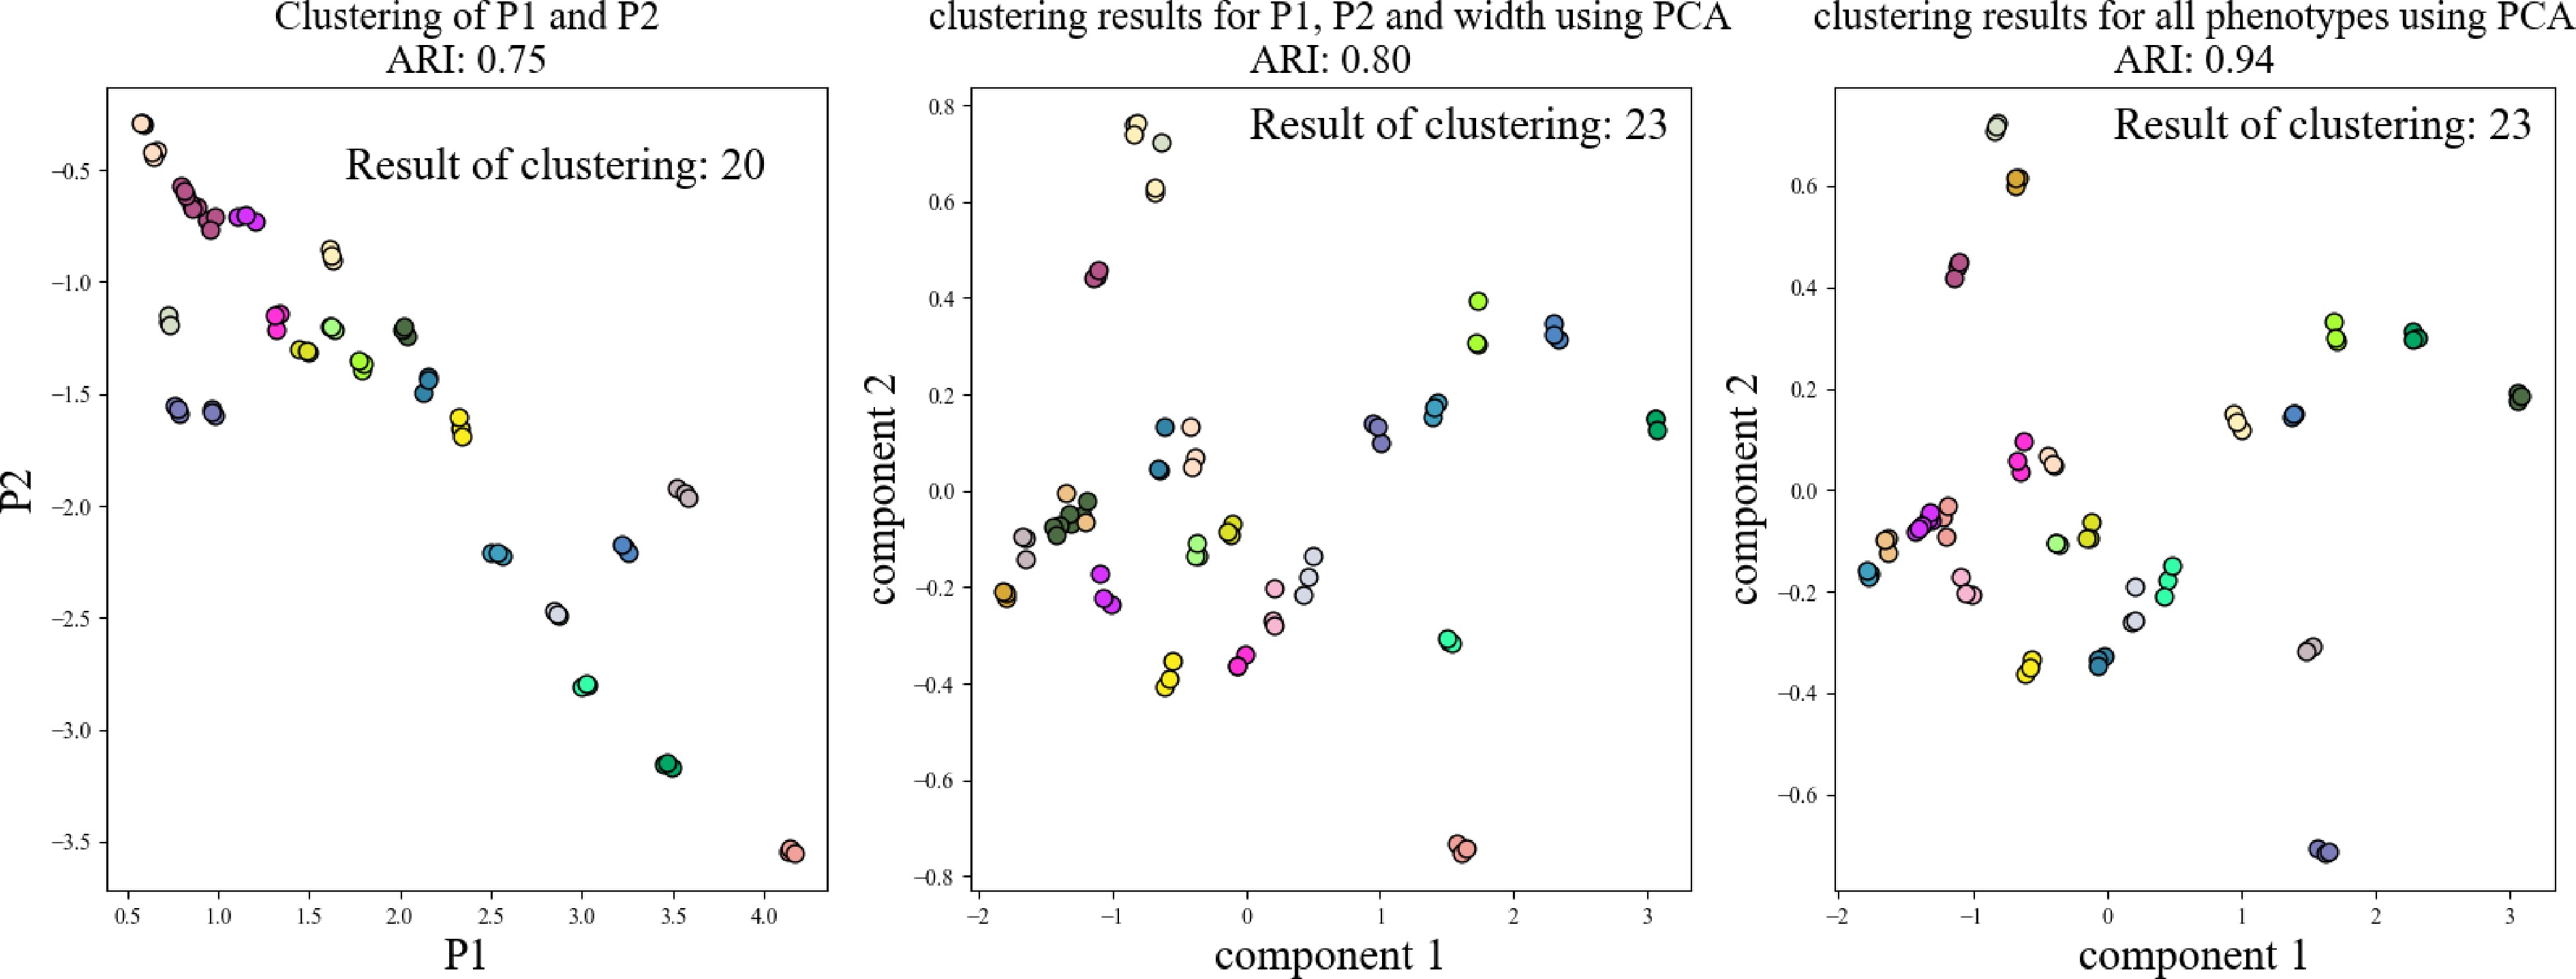
Figure 11.
Combination of NDVI, NDWI, NRCT, width, P1, and P2 followed by cluster analysis.
Ultimately, by combining multi-dimensional parameters—including NDVI, NDWI, NRCT, crown width, P1, and P2, we successfully classified the plants into 23 distinct varieties through a comprehensive clustering analysis, achieving a high ARI of 0.94. Nonetheless, a slight discrepancy remained, likely due to insufficient differentiation among certain varieties, which prevented the clustering results from fully aligning with expectations. Improving the resolution of phenotypic measurements or incorporating additional parameters could enhance the model's ability to resolve finer distinctions between varieties, potentially achieving more accurate results.
-
In this study, we conducted a comparative analysis of the performance of the robotic phenotyping platform and the UGV-LiDAR system previously established by our team. The UGV-LiDAR system requires a pause in operation until the slide process is completed, achieving a data acquisition rate of 810 plants/h. In contrast, our platform adjusts the height of the elevator bar to accommodate two plant pots, optimizing the sensor's field of view. Due to the sparse nature of the LiDAR single-frame point cloud, our system necessitates a 10-s stationary period to accumulate a denser point cloud, resulting in a slightly lower acquisition speed of 600 plants/h. Despite this minor reduction in speed, our platform is more cost-effective, with an estimated cost of approximately USD
${\$} $ ${\$} $ As shown in Table 2, although our method may not be the fastest in terms of data acquisition speed, it outperforms the UGV-LiDAR system in point cloud processing time and provides overall cost efficiency. Furthermore, our platform demonstrates superior performance in multi-dimensional phenotyping resolution efficiency, data consistency, and data scalability. Our method enables the rapid extraction of individual components from the fused point cloud and provides efficient resolution of phenotypic parameters. Meanwhile, it also ensures data consistency by aligning all camera data with the LiDAR coordinate system and simplifies the integration of new sensor data by requiring only a single calibration of internal and external parameters. This facilitates the seamless incorporation of new data into the existing system and enhances the scalability of data dimensionality. In contrast, while the UGV-LiDAR system can collect RGB, thermal infrared, multispectral, and LiDAR data, it lacks integration. It requires additional time-consuming data fusion, which compromises data consistency and reduces the efficiency of subsequent multi-dimensional phenotypic parameter analyses.
Table 2. Comparison of various performance aspects of the robotic phenotyping platform with the UGV-LiDAR.
Comparison term Ours UGV-Lidar[5] Efficiency of data acquisition 600 plants/h 810 plants/h Pipeline processing time 2,894 ms/plant 13,672 ms/plant Cost (${\$} $) 8,200 11,780 Efficiency of phenotyping High Low Data consistency High Low Data extension High Low Storage space usage Small Large Moreover, our customized standardized data structure offers significant advantages in storage space efficiency. Typically, the multi-sensor image data, temperature matrix files, and point cloud files for a single strawberry plant occupy approximately 30 MB of storage, with this requirement increasing with image resolution and point cloud quality. In contrast, our tailored data structure consolidates all sensor attributes and aligns the data within a unified coordinate system, occupying only about 5 MB of storage space. This size is primarily determined by the point cloud file, with minimal impact from the other image and temperature matrix files, demonstrating exceptional storage performance. This advantage is crucial for future data storage efforts.
Advancement of methodology
-
This study presents a multi-source sensor data fusion system developed for robotic phenotyping platforms, designed to acquire high-throughput, multi-dimensional phenotyping data and facilitate the rapid analysis of various phenotypic parameters. The system integrates multiple sensors, including an RGB-D camera, a thermal infrared camera, a four-channel high-frame-rate multispectral camera, and LiDAR, all mounted on the elevation system of the robotic platform. The platform's elevation and robot movement are controlled via a remote control system, facilitating the efficient acquisition of multi-dimensional phenotypic data.
Additionally, the system includes a multi-dimensional phenotype analysis pipeline for automated phenotypic assessment. A Fast-SAM image segmentation model is employed to extract regions of interest (ROIs) from RGB images, which are then aligned with data from other sensors in relation to the LiDAR coordinate system. To facilitate data fusion, a standardized data structure encompassing positional, color, thermal, and spectral information was developed.
The study also examines multi-dimensional phenotypic parameters derived from multi-source data collected from 72 potted strawberry plants grown in a greenhouse. The estimation of plant canopy and mean temperature showed higher accuracy compared to manual measurements. Vegetation indices, including NDVI, NDWI, and NRCT, were used to construct ratio indices P1 and P2. Both individual and combined clustering analyses were performed on these parameters, with the latter proving more effective. The optimal clustering outcome identified 23 out of the 24 strawberry varieties, achieving an ARI of 0.94. These results suggest that a more comprehensive combination of phenotypic parameters improves clustering accuracy and highlights the effectiveness of multi-source sensor data fusion in enhancing variety identification.
In conclusion, compared to the previously used UGV-LiDAR system, the proposed system offers advantages in terms of cost-effectiveness, efficient pipelined acquisition of plant ROI point clouds, and improved multi-dimensional phenotypic resolution while also demonstrating strong data consistency and scalability.
Limitations of method
-
The primary limitation of this study lies in the quality of the ground soil, which restricts the robot's movement. For instance, uneven terrain or low-lying areas can cause the robot to lurch during motion, leading to poor data acquisition. Additionally, the robot's anti-vibration system requires further optimization, as its jerky movements may complicate future efforts to construct maps using odometers. Furthermore, this study only integrates multi-source sensor data for a single frame, without constructing a real-time map during the robot's operation. Moreover, we focused on extracting primary multi-dimensional phenotypic indices without delving into the impact of spectral and thermal data on the plant's entire growth cycle. Thus, this study serves primarily as a reference for multi-source sensor data fusion in multi-dimensional phenotyping research. Additionally, the RMSE between the algorithmic and actual temperature measurements was substantial. This discrepancy may be attributed to the use of the average temperature of the potted strawberries and their surroundings in the actual measurements, which introduced some errors. Finally, this work was conducted exclusively under controlled greenhouse conditions, with plans for future experiments in outdoor environments.
Future research will aim to implement real-time fusion of multi-source sensors. By applying the odometry data for position tracking, we will stitch together each frame of time-synchronized point clouds from multi-source sensor data, remove the robot body from the field of view in each frame, and construct a map of the fused point cloud. High temporal alignment of the fused point clouds collected over time will facilitate multi-dimensional monitoring of crop growth states. Specifically, the research will focus on the following areas:
1. Further optimization of image segmentation and data fusion algorithms to enhance real-time processing speed and potentially using custom-labeled crop datasets;
2. Optimization of the temperature measurement method to reduce errors and improve average temperature estimation accuracy, possibly by utilizing high-precision temperature sensors;
3. Integration of additional sensors, such as hyperspectral cameras, to capture richer spectral information and improve crop phenotype detection;
4. Large-scale validation under diverse crop types and outdoor field environments to ensure the method's broad applicability and robustness;
5. Development of an integrated agricultural management platform to streamline the acquisition, processing, analysis, and multi-dimensional phenotypic parameter resolution, enabling user-friendly operation and management.
-
This study presents a novel robotic phenotyping platform that integrates multi-source sensor data fusion for high-throughput acquisition and analysis of multi-dimensional plant phenotypic data. A comparison with the previous UGV-LiDAR system reveals that our platform offers significant advantages in data acquisition efficiency, cost-effectiveness, and multi-dimensional phenotyping. While the acquisition speed is slightly lower, the system ensures superior data consistency, scalability, and storage efficiency, thanks to a customized data structure and the ease of integrating new sensors. Additionally, the platform accurately extracts and analyzes phenotypic parameters, such as canopy width, mean temperature, and various vegetation indices, and constructs relevant composite indices (P1 and P2) for cluster analysis. The results demonstrate that including more phenotypic parameters in the analysis yields more accurate clustering results, further highlighting the value of multi-source sensor data fusion in enhancing the accuracy of strawberry variety identification. Future research will focus on optimizing real-time sensor fusion, expanding sensor types, developing multimodal crop population models, and conducting large-scale validation in diverse environments, to create an integrated agricultural management platform for practical crop monitoring.
This work was partially supported by the National Key R&D Program of China (2022YFD2002300), Construction of Collaborative Innovation Center of Beijing Academy of Agricultural and Forestry Sciences (KJCX20240406), and the Natural Science Research Project of Anhui Provincial Education Department (2023AH040009).
-
The authors confirm contributions to the paper as follows: study design: Guo X, Gou W, Li Y; developing the rail-based phenotyping platform: Tan X, Xing X; data acquisition: Zuo Q, Tan X; data analysis: Li Y, Wen W, Yang S, Gou W, Guo X; realizing the data fusion method: Tan X, Guo X, Liang D, Huang L; manuscript writing and revision: Li Y, Gou W, Tan X. All authors reviewed the results and approved the final version of the manuscript.
-
The datasets generated during and/or analyzed during the current study are available from the corresponding author on reasonable request.
-
The authors declare that they have no conflict of interest.
-
# Authors contributed equally: Xi Tan, Yinglun Li, Wenbo Gou
- Copyright: © 2025 by the author(s). Published by Maximum Academic Press, Fayetteville, GA. This article is an open access article distributed under Creative Commons Attribution License (CC BY 4.0), visit https://creativecommons.org/licenses/by/4.0/.
-
About this article
Cite this article
Tan X, Li Y, Gou W, Yang S, Wen W, et al. 2025. Design and application of a multi-source sensor data fusion system based on a robot phenotype platform. Fruit Research 5: e032 doi: 10.48130/frures-0025-0023 

Design and application of a multi-source sensor data fusion system based on a robot phenotype platform
- Received: 20 January 2025
- Revised: 17 March 2025
- Accepted: 09 April 2025
- Published online: 20 August 2025
Abstract: The compact, high-throughput phenotyping platform, characterized by its portability and small size, is well-suited for crop phenotyping across diverse environments. However, integrating multi-source sensors to achieve synchronized data acquisition and analysis poses significant challenges due to constraints in load capacity and available space. To address these issues, we developed a robotic platform specifically designed for phenotyping greenhouse strawberries. This system integrates an RGB-D camera, a multispectral camera, a thermal camera, and a LiDAR sensor, enabling the unified analysis of data from these sources. The platform accurately extracted key phenotypic parameters, including canopy width (R² = 0.9864, RMSE = 0.0185 m) and average temperature (R2 = 0.8056, RMSE = 0.1732 °C), with errors maintained below 5%. Furthermore, it effectively distinguished between different strawberry varieties, achieving an Adjusted Rand Index of 0.94, underscoring the value of detailed phenotyping in variety differentiation. Compared to conventional UGV-LiDAR systems, the proposed platform is more cost-effective, efficient, and scalable, with enhanced data consistency, making it a promising solution for agricultural applications.
-
Key words:
- Robotics /
- Phenotyping platform /
- Multi-source sensors /
- Data fusion /
- Phenotyping /
- Variety identification