


-
Salt stress negatively impacts plant growth and development, primarily disrupting their productivity and survival in arid and semi-arid regions worldwide[1]. It affects various physiological processes in plants, including seed germination, biomass production, reproductive growth, photosynthesis, nitrogen metabolism, stomatal regulation, and carbohydrate metabolism[2]. Nitrogen plays a crucial role in plant metabolism, as all key processes depend on proteins, of which nitrogen is a vital component[3]. Nitrogen deficiency affects plant growth, carbon fixation, leaf gas exchange, chlorophyll fluorescence parameters, thylakoid membrane structure, carbohydrate levels, metabolites, and seedling respiratory enzymes, among other processes[4,5]. Adequate nitrogen absorption and assimilation are beneficial for plant growth and resistance to salt stress. Nitrate and ammonium are the two main inorganic nitrogen sources for plants. Nitrate, once absorbed by the roots, is reduced to ammonium by nitrate reductase (NR) and nitrite reductase (NiR), and subsequently enters the glutamine synthetase (GS, EC 6.3.1.2)/glutamate (Glu) synthase (GOGAT, EC 1.4.7.1) cycle for assimilation into organic nitrogen. In contrast, ammonium directly enters the GS/GOGAT cycle to participate in the formation of organic nitrogen[6,7]. Specifically, GS catalyzes the production of glutamine from ammonium and Glu, while GOGAT catalyzes the conversion of glutamine and 2-oxoglutarate (2-OG) to produce two molecules of Glu. One molecule of Glu can serve as a substrate for GS, and the other can be used for the synthesis of proteins, nucleic acids, and other nitrogen-containing compounds[8]. Numerous studies have demonstrated that salt stress affects nitrification and ammonification processes in soil, as chloride (Cl−) competes with nitrate (NO3−) and leads to ion toxicity and ion imbalance, which explicitly restricts nitrogen uptake, transport, and assimilation processes[9]. Therefore, the GS/GOGAT cycle is essential for maintaining nitrogen use efficiency (NUE) in plants under salt stress[10]. It is well known that varieties capable of maintaining high GS/GOGAT activity exhibit greater resistance to salt stress[11]. However, under salt stress conditions, the enzymatic activities of GS and GOGAT are reduced in most plants, which limits amino acid production and can lead to increased accumulation of NH4+. The accumulation of NH4+ in a saline environment has been reported to trigger the activation of the alternative glutamine dehydrogenase (GDH, EC 1.4.1.2) pathway for its assimilation[12]. In various studies, the accumulation of NH4+ has been observed to coincide with a sharp increase in GDH activity. This alternative pathway can be considered a mechanism of salt tolerance[13].
GOGAT is a key rate-limiting enzyme in the GS/GOGAT cycle. In plants, Glu synthase primarily exists in two forms: Fd-GOGAT, which uses ferredoxin (Fd) as an electron donor, and NADH-GOGAT, which uses NADH as an electron donor[14]. In most crops, salt stress inhibits GOGAT activity and gene expression. For instance, in cucumber and Populus simonii, salt stress significantly suppresses GOGAT activity, leading to a marked reduction in nitrogen assimilation rates[15,16]. However, compared to salt-sensitive varieties, salt-tolerant varieties maintain higher GOGAT activity and transcript levels under salt stress[17−19]. This suggests that maintaining high GOGAT expression is crucial for enhancing nitrogen assimilation rates under salt stress. In higher plants, GS exists as two distinct isoforms: cytosolic GS1 and plastidic GS2. GS1 is encoded by a multigene family, while GS2 is encoded by a single nuclear gene. Transgenic rice plants overexpressing GS2 (plastidic) exhibit enhanced photorespiration and salt tolerance under salt stress conditions[20]. Therefore, GS positively regulates plant tolerance to salt stress by enhancing the rate of nitrogen assimilation. The GDH gene family in plant genomes typically contains three to four members, including both NAD- and NADP-dependent forms. The reactions catalyzed by GDH are reversible. Studies on Casuarina glauca have revealed that GDH2 in Frankia plant shoots is significantly upregulated under salt stress across three salt treatment gradients, indicating that plants respond to salt stress by activating the GDH pathway[21]. Numerous transcription factors regulate the NUE of plants. The overexpression of the DNA-binding single finger protein 1 (Dof1) transcription factor appears to enhance nitrogen uptake and assimilation in plants under low nitrogen conditions. Dof1 is a key activator of several genes involved in organic acid metabolism. Studies overexpressing maize Dof1 in Arabidopsis have shown that plant growth improves under low nitrogen conditions, with increased levels of amino acids (glutamine and Glu) and total nitrogen content[22]. Recent experiments overexpressing ZmDof1 in rice have demonstrated that under nitrogen-limited conditions, transgenic rice plants exhibit increased nitrogen and carbon accumulation, as well as enhanced photosynthesis rates. Nitrogen accumulation is particularly pronounced in the roots, and the biomass of these roots is higher than that of control plants. Additionally, experiments have found that C2H2, AP2, and NAC transcription factors are also involved in the nitrogen assimilation processes in plants. TaZFP1, a C2H2 type-ZFP gene of T. aestivum, mediates salt stress tolerance of plants by modulating diverse stress-defensive physiological processes[22].
Black wolfberry (Lycium ruthenicum) is a perennial halophytic shrub belonging to the Lycium genus in the Solanaceae family. It possesses characteristics such as salt and drought tolerance and is an endemic species in the saline-alkali desert regions of northwestern China[23]. Multi-omics research has revealed that under salt stress, the differentially expressed genes and metabolites in black wolfberry leaves are significantly enriched in nitrogen metabolism pathways, suggesting that nitrogen metabolism plays an important role in the plant's response to salt stress[24]. Additionally, under high concentrations of NaCl stress, the proline content in the roots and stems of both black wolfberry and Ningxia wolfberry (L. barbarum) increases significantly, with black wolfberry consistently exhibiting higher proline levels than Ningxia wolfberry[25]. Research has shown that under salt stress, the biosynthesis of proline primarily occurs through a pathway that uses Glu as a substrate[26]. These findings suggest that black wolfberry may resist salt stress by enhancing its nitrogen assimilation processes. However, to date, the genetic basis of the key nitrogen assimilation genes GOGAT, GS, and GDH in black wolfberry, as well as whether black wolfberry maintains a high nitrogen assimilation rate under salt stress, remains unclear. Therefore, this study employs bioinformatics and computational biology methods, utilizing the transcriptome data of black wolfberry under different NaCl stress concentrations from our research group, to analyze the transcriptional regulatory patterns of GOGAT, GS, and GDH genes in black wolfberry under NaCl stress. Furthermore, based on the results of molecular evolutionary analysis, the impact of Fd-GOGAT mutation sites on protein function is discussed, providing a reference for further studies on the role of nitrogen assimilation-related genes in the salt tolerance of black wolfberry.
-
The whole genome sequences and annotation files of Ningxia wolfberry (L. barbarum), African boxthorn (L. ferocissimum), and tomato (Solanum lycopersicum) were downloaded from the NCBI database (
www.ncbi.nlm.nih.gov ) on March 5, 2024. The respective version numbers for these genomes are ASM1917538V2, AGI_CSIRO_Lferr_CH_V1, and SL4.0. The black wolfberry genome, designated as 'Final', was obtained from the Figshare repository (https://figshare.com ). Additionally, transcriptome data for Chinese wolfberry (L. chinense) and white-fruited L. ruthenicum were obtained from NCBI for transcript assembly, with the accession numbers SRR12805582 and SRR18059520, respectively. The transcript assembly for L. chinense, the white fruit of L. ruthenicum, was performed using Trinity (version 2.15.1)[27] with default parameters.Bioinformatics analysis of the GOGAT gene family in Lycium species
Identification of GOGAT gene family members
-
The CDS sequences of tomato GOGAT genes were downloaded from the SOL Database (
http://solgenomics.net/ , accessed on 5 March 2024). The downloaded tomato GOGAT genes were then aligned to the tomato genome using BLAST (2.16.0) to verify the accuracy of the annotation information. The accurately identified tomato GOGAT genes were subsequently aligned to the genomes or transcriptomes of Lycium species to obtain candidate GOGAT genes in Lycium species. Finally, the resulting candidate genes were aligned to the Non-Redundant Database/Nucleotide Sequence Database (NR/NT) to confirm the accuracy of the identification results. The identification method for GS and GDH was consistent. The protein sequences of the GS and GDH genes were downloaded from the Arabidopsis official database (TARE:www.arabidopsis.org ). The AtGS and AtGDH PFAM models were constructed using hmmbuild. Subsequently, the AtGS and AtGDH PFAM models were used to search for protein sequences containing the characteristic domains of GS and GDH in the tomato genome, with a sequence screening threshold of E-value < 0.001. Then, the tomato GS and GDH sequences were used to build PFAM models, which were subsequently employed to search the genomes of Lycium species in order to identify the GS and GDH genes in Lycium species. Finally, the presence of characteristic domains was further verified in the NCBI-CDD database (www.ncbi.nlm.nih.gov/structure/bwrpsb/bwrpsb.cgi ).Phylogenetic relationships, gene structure, and motif analysis
-
Based on the identification results of GOGAT, GS, and GDH gene family members in Lycium species and tomato, the CDS sequences of each gene were selected for phylogenetic tree construction. The phylogenetic relationships of the GOGAT, GS, and GDH genes from the six species mentioned above were inferred using IQ-Tree (2.3.4)[28] based on the maximum likelihood method, with the nucleotide substitution model set to TIM2+F+G4, Blosum62+F+G4, and Blosum62+F+G4. Gene structures were visualized using GSDS (
https://gsds.gao-lab.org , accessed on 12 April 2024)[29]. Motif prediction was performed using MEME (https://meme-suite.org/meme/info/status?service=MEME&id=appMEME_5.3.31625885416694-401203024 , accessed on 27 April 2024), with a significance threshold of p < 0.05.Analysis of the physicochemical properties of proteins
-
The physicochemical properties of the polypeptide chains corresponding to the proteins of Lycium species were predicted using the online software Expasy (
https://web.expasy.org/protparam/ , accessed on 12 May 2024). The predicted properties include the number of amino acids, molecular weight (Da), isoelectric point (pI), GRAVY index, and instability index.Transcriptional regulatory analysis
-
The upstream 2,000 bp regulatory region sequence of the black wolfberry GS, GOGAT, and GDH genes was extracted, and the PlantTFDB database (
https://planttfdb.gao-lab.org/ , accessed on 1 June 2025)[30] was utilized to predict the binding sites of transcription factors. The transcriptional regulatory network was constructed using Cytoscape (version 3.10.0)[31]. Protein-protein interactions were predicted using STRING software (https://cn.string-db.org/cgi/input?sessionId=bybyzz3LRoB1&input_page_show_search=on ) with tomato set as the reference species at a confidence threshold of 0.9. The network visualization was subsequently refined using Cytoscape software.Transcription factor-DNA docking analysis
-
The DNA-binding domains of transcription factors were predicted using PlantTFDB. The binding sites of transcription factors on the DNA sequence were predicted using JASPAR (
https://jaspar.elixir.no/inference , accessed on 3 June 2025). The docking conformation of the transcription factor-DNA complex was predicted using the Alphafold3 server (https://alphafoldserver.com/ , accessed on 3 June 2025)[32]. The interactions at the transcription factor-DNA interface were analyzed using PDBePISA (www.ebi.ac.uk/pdbe/pisa/ , accessed on 4 June 2025). Visualization was performed using PyMOL 3.1[33].Transcriptomic analysis of black wolfberry root and leaf tissues under salt stress
Material processing and transcriptomic analysis
-
The plant materials used were black wolfberry tissue culture seedlings preserved in the Tissue Culture Laboratory of the Forestry College at Gansu Agricultural University. The cultivation conditions were as described by Wei et al.[34]. Healthy and vigorous seedlings were selected and cultured in 1/2 Hoagland's solution. When the seedlings reached 14 d of growth, NaCl solutions were added at concentrations of 0, 50, and 250 mmol/L. The roots and leaves of the seedlings from each NaCl concentration were sampled at 0, 1, and 12 h post-treatment for transcriptomic sequencing. Each treatment was replicated in triplicate. Clean reads were aligned to the black wolfberry transcriptome using Hisat2 (2.2.1)[35]. Gene alignment quantification was performed using featureCounts (2.0.3)[36], and the Fragments Per Kilobase of transcript per Million mapped reads (FPKM) value for each gene was calculated based on gene length. Differential expression analysis between the two groups was conducted using DESeq2 (1.22.1)[37], with the Benjamini & Hochberg method employed to adjust the p-values. Genes with adjusted p-values (FDR) and |log2FoldChange(FC)| > 1 were considered to be significantly differentially expressed.
Expression level of the GS, GOGAT, and GDH gene in black wolfberry under salt stress
-
Extract the expression data of the GS, GOGAT, and GDH genes and related transcription factors in black wolfberry under salt stress. Use one-way ANOVA in SPSS 22.0 to assess the significance of differences (p < 0.05) among different treatments and treatment times. Visualization was performed using Origin 2021. The K-means analysis of transcriptional factor expression patterns was performed using the stats package in R version 4.2.0. The data were normalized using the log2 transformation, while all other parameters were set to their default values[38].
Identification of transcription factors in black wolfberry
-
Transcription factors in black wolfberry transcripts were identified using the PlantTFDB database (
https://planttfdb.gao-lab.org/ ).Molecular evolutionary analysis and comparative protein structure analysis
Molecular evolutionary analysis
-
The molecular evolutionary analysis was conducted as described by Qi et al.[39]. Specifically, the branch-site model from PAML 4 (v4.9j)[40] was employed to analyze the selective pressure and identify positive selection sites within each member of the black wolfberry GS, GOGAT, and GDH gene family. The Bayesian Empirical Bayes (BEB) method was used to calculate the probability of positive selection sites. Additionally, likelihood ratio tests (LRTs) were performed to assess the significance of the difference between Model A0 and Model A1, and a significance threshold of 0.05 was applied.
Protein model construction and quality assessment
-
A homology template search for the black wolfberry Fd-GOGAT protein was conducted using the SWISS-model module (
https://swissmodel.expasy.org/interactive , accessed on 17 August 2024). Based on the search results, the crystal structure of the Synechocystis sp. GOGAT protein (1LLW, 2.70Å) was selected as the template for homology modeling. Subsequently, the Modeller[41] software was utilized for single-template modeling to predict the monomeric structure of the Fd-GOGAT protein. The parameters were set to predict 100 models, and the optimal model was selected using the DOPE and GA341 scoring functions. The quality of the constructed model was assessed using the online software SAVES v6.0 (https://saves.mbi.ucla.edu/ , accessed on 17 August 2024). A model was considered acceptable if more than 90% of the amino acid residues fell within the 'red zone'. Homology structure comparison and 3D structure visualization were performed using UCSF Chimera (1.16)[42], and VMD (1.9.4) software.Protein structure comparison
-
The hydrophilicity of the polypeptide chain amino acid residues was predicted using ProtScale (
https://web.expasy.org/protscale/ ), with the method set to Hphob./Kyte & Doolittle. Potential positively selected sites were subjected to single-point mutation prediction using the online tool Missense 3D[43] (http://missense3d.bc.ic.ac.uk/missense3d/ ). Molecular docking of Fd with the substrate glutamine was performed using AutoDock (4.2.6)[44]. The mutation sites were visualized, and protein surface electrostatic potential analysis was conducted using PyMOL software. -
Both the Lycium species and tomato genomes or transcriptomes contain two GOGAT genes, namely Fd-GOGAT and NADH-GOGAT, which are 1:1 orthologous genes between Lycium and tomato (Fig. 1). The exon/intron structures of the Fd-GOGAT and NADH-GOGAT genes in Lycium and tomato consist of 33/32 and 23/22 exons/introns, respectively. Notably, the full lengths of the Fd-GOGAT and NADH-GOGAT genes are approximately 70 Kb and 12 Kb, with coding sequences (CDS) of approximately 5.0 Kb and 6.6 Kb, respectively. This suggests that Fd-GOGAT may possess a more complex regulatory pattern. The Fd-GOGAT and NADH-GOGAT genes in Lycium and tomato contain a total of 71 motifs. The number and relative positions of these motifs are nearly identical across different gene isoforms, indicating that the evolutionary trajectory of Fd-GOGAT and NADH-GOGAT proteins may be relatively conserved. However, in terms of motif quantity, the functional complexity of NADH-GOGAT proteins may be greater.
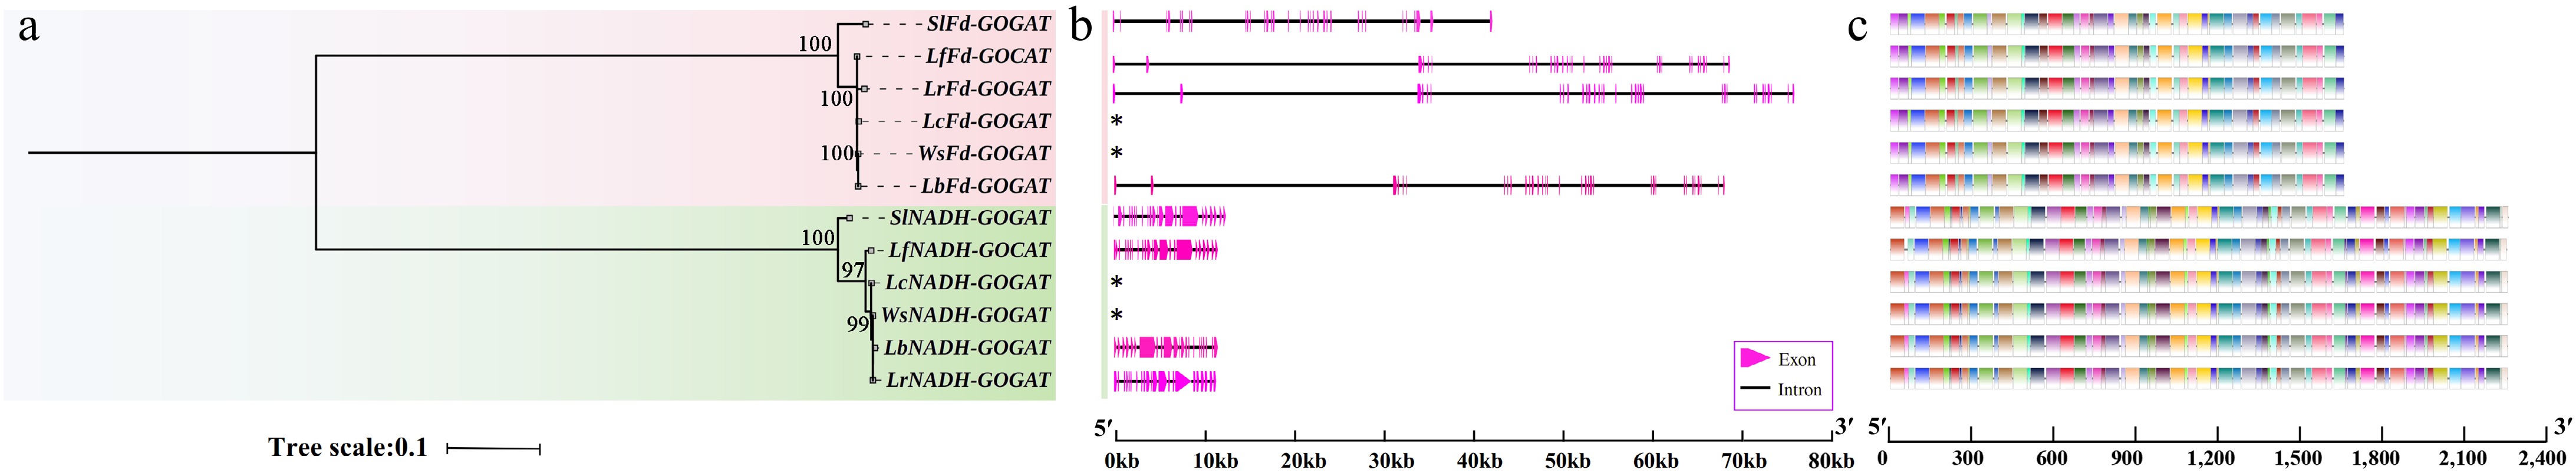
Figure 1.
Phylogenetic tree, gene structure, and motifs of the GOGAT genes in Lycium species. (a) Phylogenetic tree. (b) Gene structure. (c) Motif distribution diagram. See the legend within the figure for details.
In this study, a total of 22 GS genes were identified in Lycium species and tomato (Fig. 2). Phylogenetic analysis revealed that these genes belong to two distinct clades: the GS2 and GS1 clades. Interestingly, GS2 genes are single-copy genes in both Lycium species and tomato, whereas the number of GS1 gene copies varies among these species. The tomato genome contains four GS1 genes, while Lycium species have 1−3 GS1 genes. For example, L. barbarum has only one GS1 gene, and L. chinense has two, indicating that the evolution of GS1 genes in Lycium species is not entirely uniform. Motif analysis showed that GS genes in Lycium species contain 14 motifs, with motif9/14 and 12 being unique to GS2, while the other 11 motifs are shared between GS1 and GS2, possibly representing the major functional domains of GS genes. Gene structure analysis revealed that GS1 genes in Lycium species have a structure consisting of 12 exons and 11 introns, while GS2 genes have 13 exons and 12 introns. Moreover, the gene lengths of orthologous genes are similar, suggesting that the structural evolution of GS genes in Lycium species is highly conserved.
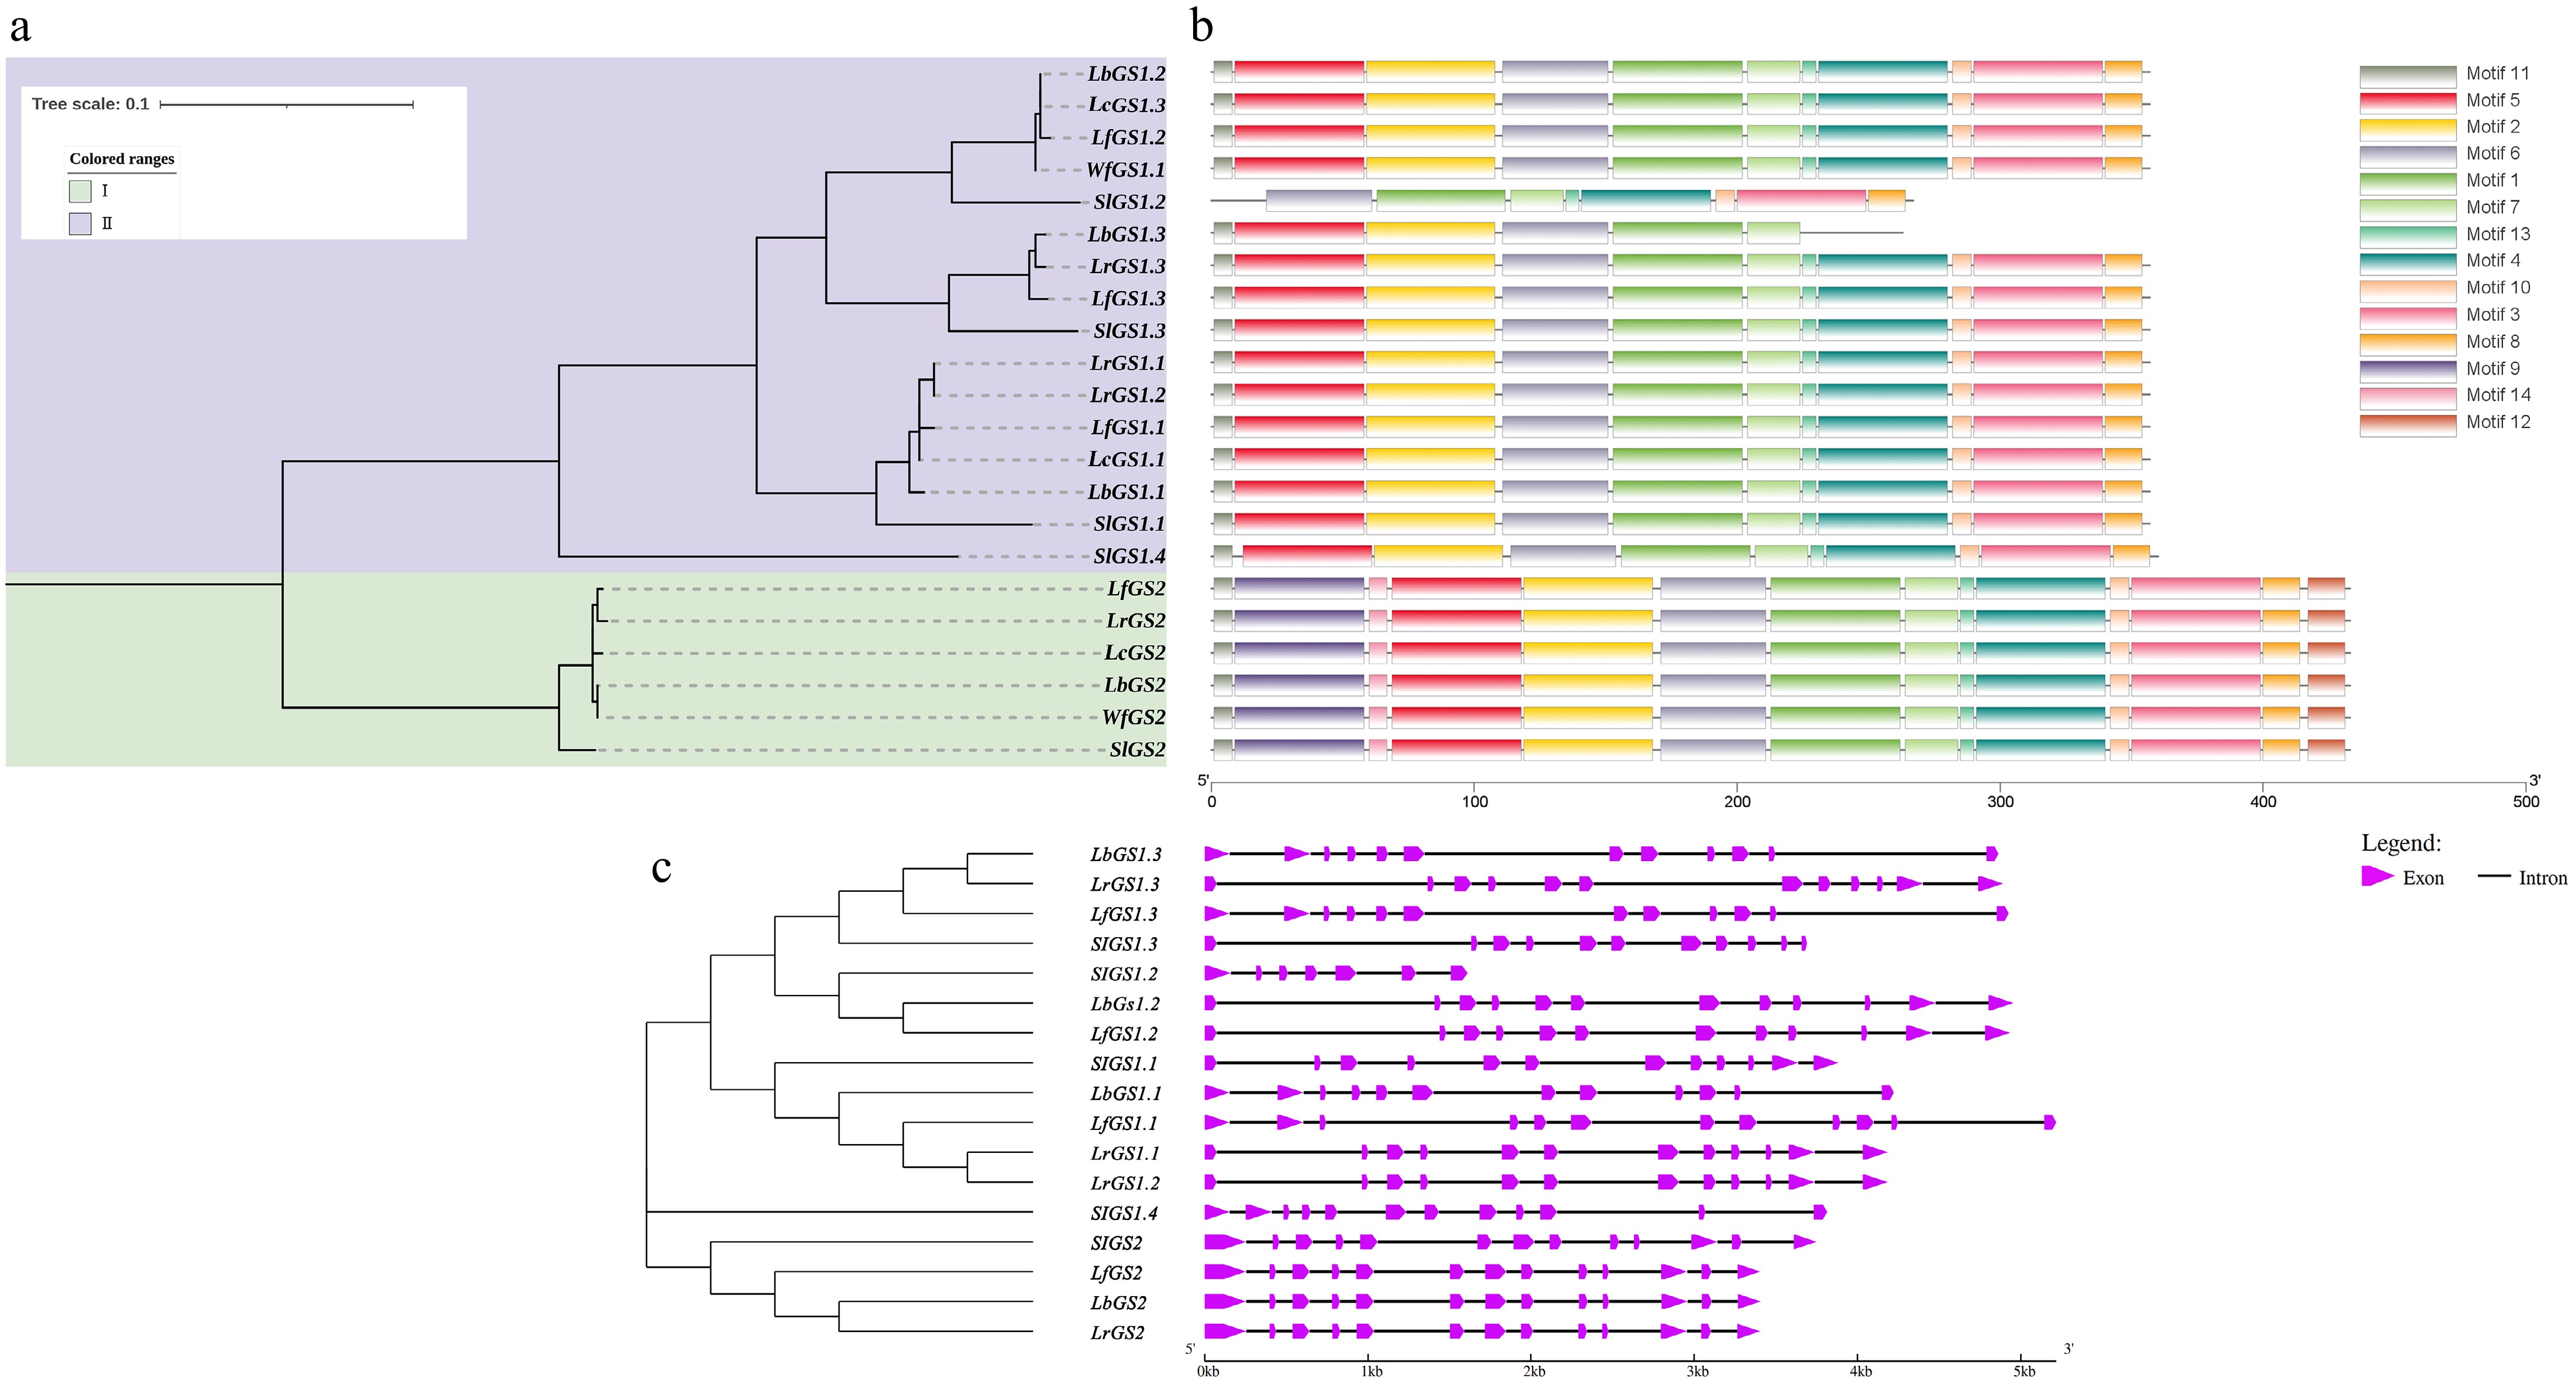
Figure 2.
Phylogenetic tree, gene structure, and motifs of the GS genes in Lycium species. (a) Represents the phylogenetic tree. (b) Depicts the motif distribution diagram. (c) Illustrates the gene structure.
In this study, a total of 22 GDH genes were identified in Lycium species and tomato (Fig. 3). The phylogenetic tree revealed that these genes belong to three distinct clades: NADP-GDH, GDH4, and GDH1/2/3 clades. NADP-GDH and GDH4 are 1:1 orthologous genes in both tomato and Lycium species, indicating highly conserved evolution. Notably, in clade III (GDH1/2/3), tomato has three genes (GDH1/2/3), but no ortholog of tomato GDH1 was found in Lycium species. Additionally, only L. ruthenicum and L. barbarum contain both GDH2 and GDH3, whereas other Lycium species have only a single GDH2 or GDH3 gene in their genomes. Motif analysis showed that GDH genes in Lycium species contain 24 motifs, with NADP-GDH having 23 motifs, GDH4 having 11 motifs, and GDH2/3 having 12 motifs, with Motif20 being specific to GDH2/3. Gene structure analysis revealed that the gene structures of GDH2/3/4 in Lycium species consist of nine exons and eight introns, while NADP-GDH has a structure of 15 exons and 14 introns. Interestingly, the gene lengths of GDH in Lycium species vary significantly between different species, especially for NADP-GDH. For example, LfNADP-GDH is longer than LbNADP-GDH. Furthermore, the gene structure of tomato SlNADP-GDH was found to consist of 16 exons and 15 introns, indicating that the evolution of NADP-GDH in Lycium or Solanaceae species is relatively active.
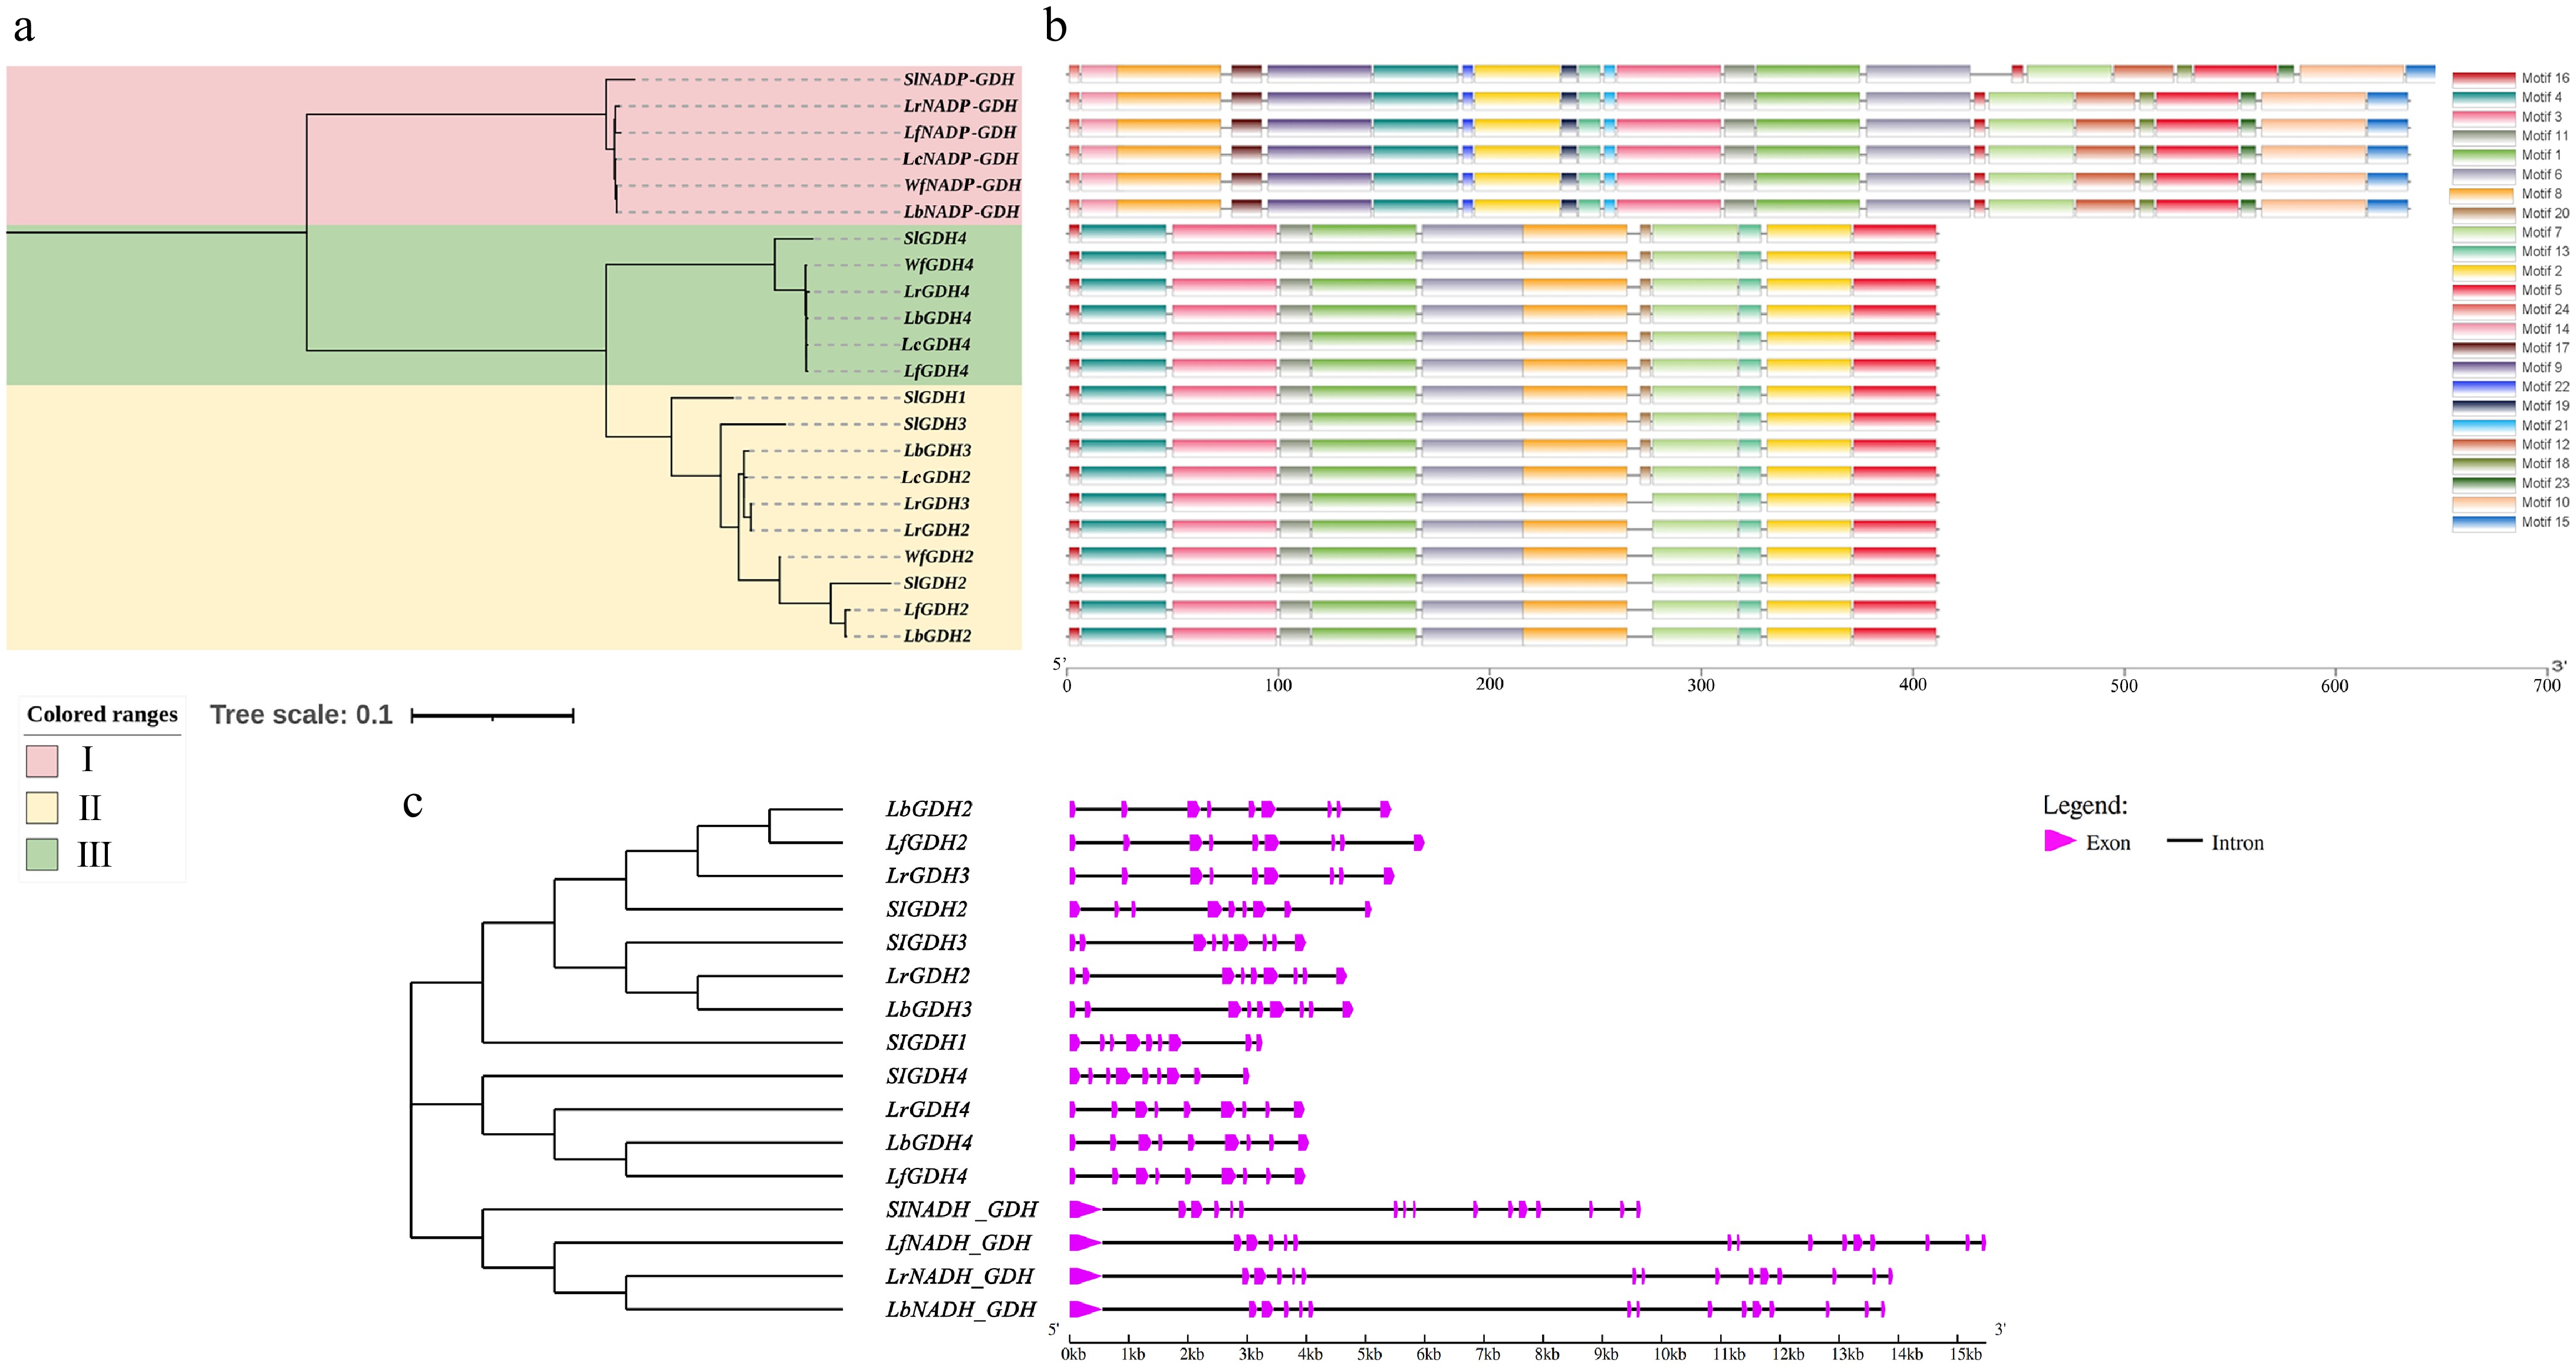
Figure 3.
Phylogenetic tree, gene structure, and motifs of the GDH genes in Lycium species. (a) Phylogenetic tree. (b) Motif distribution diagram. (c) Gene structure.
Biophysical and biochemical properties of GS, GOGAT, and GDH proteins in the Lycium genus
-
The biophysical and chemical properties of the GOGAT, GS and GDH proteins are presented in Table 1. The Lycium species Fd-GOGAT gene encodes 1,621–1,623 amino acids, with a molecular weight ranging between 176,704.76 and 176,983.22. The NADH-GOGAT gene encodes 2,205–2,208 amino acids, with a molecular weight ranging from 241,521.06 to 243,143.78. The grand average of hydropathy (GRAVY) values for GOGAT proteins in Lycium species are all less than 1, indicating that they are hydrophilic proteins. However, the hydrophilicity of NADH-GOGAT proteins is generally greater than that of Fd-GOGAT. Additionally, the instability index of GOGAT proteins in Lycium species is greater than 30, suggesting relatively low stability. Nevertheless, NADH-GOGAT exhibits slightly higher stability compared to Fd-GOGAT. Notably, the pI of the Fd/NADH-GOGAT proteins in black wolfberry is higher than that of their homologous proteins in other species. The GS genes encode proteins consisting of 456 or 432 amino acids, with a molecular weight ranging from 39,076.99 to 47,564.94. Overall, the pI of GS2 is > 6, while the pI of GS1 is between five and six. Compared to GS2, GS1 is more hydrophilic, as the overall GRAVY score of GS1 is less than –0.4, whereas the GRAVY score of GS2 is greater than 0.4. Additionally, all GS proteins are unstable (Instability index > 30), but GS1 is more stable than GS2. The GDH genes encode proteins consisting of 411 or 634 amino acids, with a molecular weight ranging from 44,755.46 to 70,634.26. The pI of GDH ranges from 6.09–8.07, and the pI of most GDH2/3 proteins is > 7. The GRAVY results indicate that all GDH proteins are hydrophilic, but NADP-GDH is significantly more hydrophilic than other GDH proteins. However, NADP-GDH is less stable (Instability index > 30), while other GDH proteins are considered stable.
Table 1. Biophysicochemical properties of GOGAT proteins in the Lycium genus.
Polypeptide chain No. of
amino acidsMolecular weight (Da) pI GRAVY Instability index LrFd-GOGAT 1,623 176,983.22 6.25 −0.15 38.04 LbFd-GOGAT 1,623 176,889.00 6.20 −0.16 38.09 LcFd-GOGAT 1,621 176,704.76 6.11 −0.16 37.80 WfFd-GOGAT 1,623 176,889.00 6.20 −0.16 38.09 LfFd-GOGAT 1,623 176,874.97 6.20 −0.16 38.42 LrNADH-GOGAT 2,208 243,143.78 6.35 −0.28 35.69 LbNADH-GOGAT 2,208 241,918.47 6.31 −0.27 35.85 LcNADH-GOGAT 2,208 241,933.38 6.31 −0.28 35.77 LfNADH-GOGAT 2,205 241,521.06 6.34 −0.28 35.21 WfNADH-GOGAT 2,208 241,913.43 6.34 −0.28 35.85 LbGDH4 411 44,519.79 6.09 −0.16 21.28 LcGDH4 411 44,461.75 6.23 −0.15 20.21 LfGDH4 411 44,504.78 6.23 −0.16 20.21 WfGDH4 411 44,505.76 6.09 −0.16 20.21 LrGDH4 411 44,505.76 6.09 −0.16 20.21 LbNADP-GDH 634 70,618.20 6.65 −0.43 36.73 LfNADP-GDH 634 70,473.98 6.65 −0.43 36.80 LcNADP-GDH 634 70,618.20 6.65 −0.43 36.73 WfNADP-GDH 634 70,634.26 6.65 −0.43 36.30 LrNADP-GDH 634 70,537.10 6.65 −0.43 37.83 LbGDH2 411 44,872.37 6.51 −0.19 20.26 LfGDH2 411 44,886.40 6.51 −0.19 21.51 LcGDH2 411 44,696.36 6.90 −0.15 21.85 WfGDH2 411 44,814.42 8.07 −0.20 21.41 LrGDH2 411 44,755.46 7.65 −0.15 22.13 LrGDH3 411 44,862.38 6.64 −0.19 19.86 LbGDH3 411 44,563.22 7.21 −0.13 21.25 LfGS2 432 47,523.80 6.12 −0.38 42.33 LbGS2 432 47,536.88 6.48 −0.38 42.06 LrGS2 432 47,564.89 6.28 −0.38 42.79 WfGS2 432 47,564.94 6.48 −0.37 42.06 LcGS2 432 47,549.92 6.73 −0.37 40.96 WfGS1.1 356 38,962.82 5.51 −0.44 37.46 LcGS1.1 356 39,160.12 5.65 −0.45 41.05 LrGS1.1 356 39,076.99 5.65 −0.45 39.67 LfGS1.1 356 39,061.03 5.65 −0.44 38.92 LbGS1.1 356 39,161.11 5.53 −0.45 41.13 LrGS1.2 356 39,076.99 5.65 −0.45 39.67 LfGS1.2 356 39,001.00 5.65 −0.40 38.53 LbGS1.2 356 39,005.03 5.79 −0.40 38.10 LbGS1.3 356 38,958.82 5.50 −0.43 37.77 LfGS1.3 356 39,003.82 5.50 −0.46 38.54 LrGS1.3 356 38,972.89 5.61 −0.43 37.46 LcGS1.3 356 39,005.03 5.79 −0.40 38.10 Transcriptional regulation of GOGAT under salt stress in L. ruthenicum
Expression level of GOGAT gene under salt stress in L. ruthenicum
-
The results of the expression analysis (Fig. 4) show that under NaCl stress, the expression level of LrFd-GOGAT in leaf tissues was significantly downregulated. Specifically, under 0.5% NaCl treatment, the expression was reduced by 21% and 32% at 1 and 12 h, respectively. Although the expression level was upregulated under 0.5% NaCl treatment, there was no significant difference compared to CK. Furthermore, with the prolongation of time after treatment, the expression of LrFd-GOGAT in leaf tissues was markedly downregulated. In contrast, under NaCl stress, the expression of LrFd-GOGAT in root tissues was mainly upregulated, particularly at 12 h after NaCl treatment, where it was upregulated by 1.79-fold under 2.5% NaCl treatment.The expression pattern of LrNADH-GOGAT in leaf tissues was similar to that of LrFd-GOGAT. It is noteworthy that the inhibitory effect on LrNADH-GOGAT was more severe. In root tissues, the expression of LrNADH-GOGAT showed no significant change under 0.5% NaCl treatment. However, under 2.5% NaCl treatment, its expression was significantly downregulated at 1 h compared to CK, but was significantly upregulated at 12 h, reaching 1.40-fold of the control.
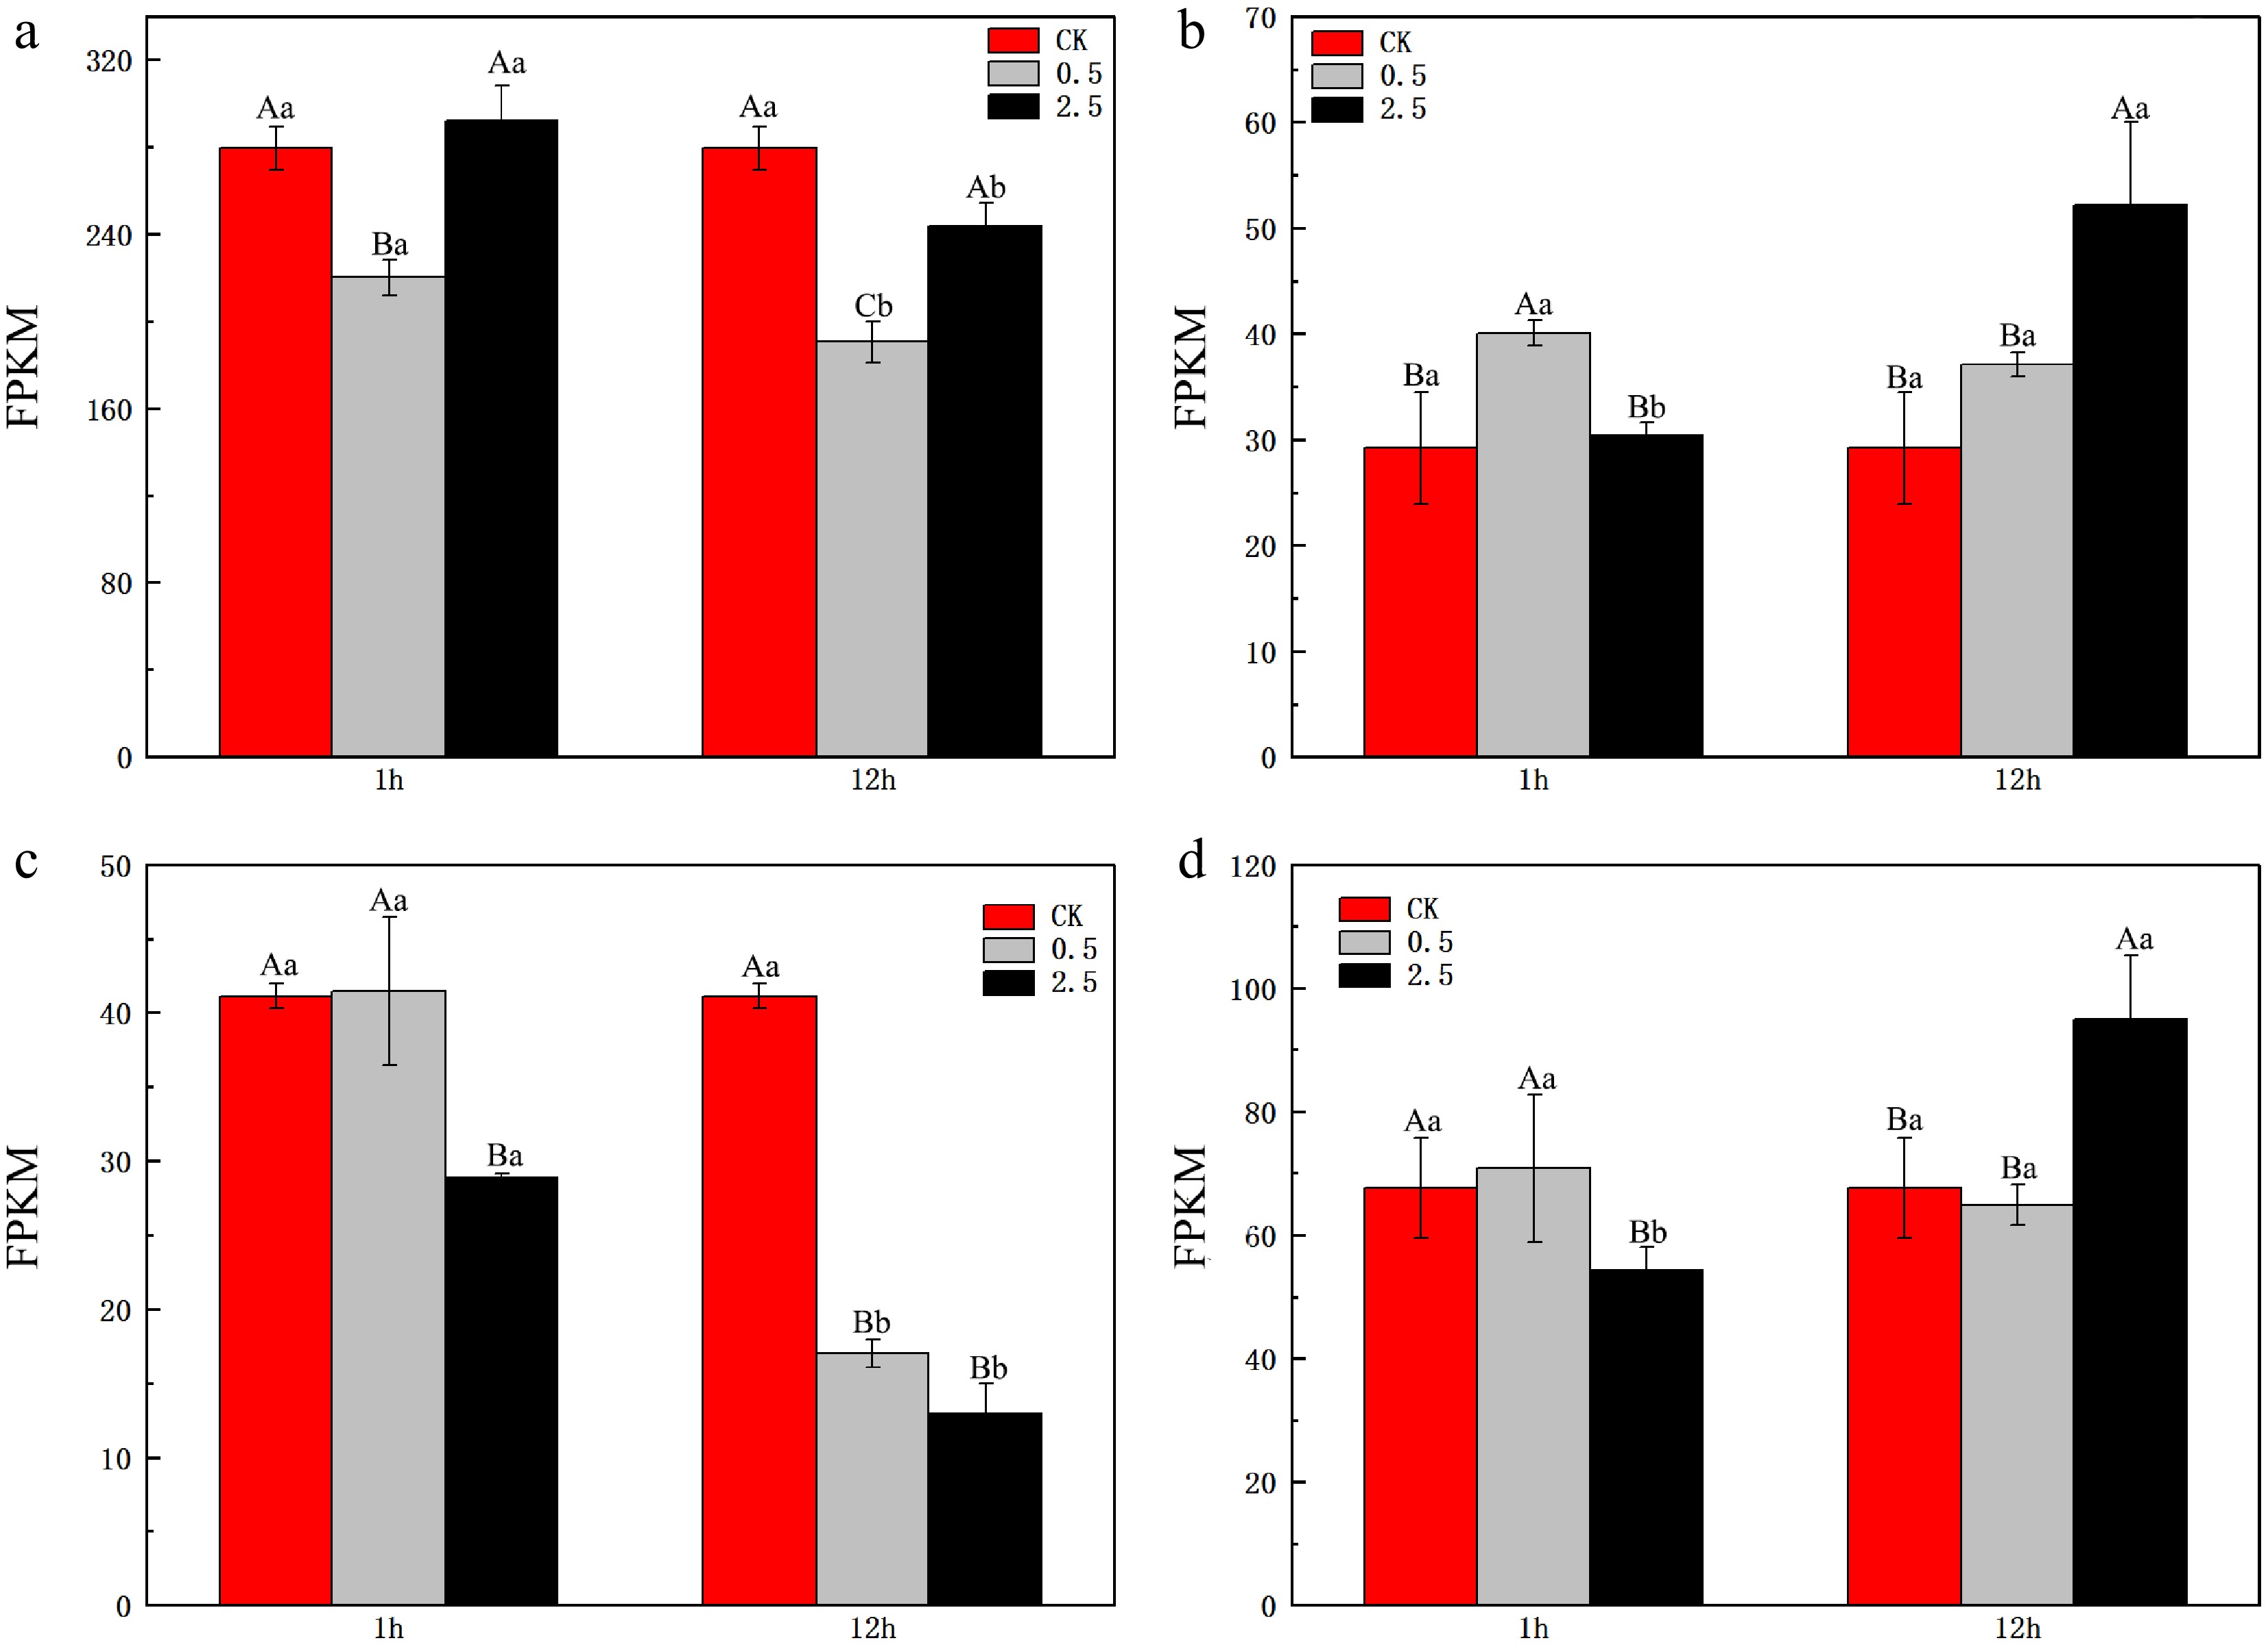
Figure 4.
Expression levels of GOGAT in the leaves and roots of L. ruthenicum under NaCl treatment. (a) Expression level of LrFd-GOGAT in leaf tissues. (b) Expression level of LrFd-GOGAT in root tissues. (c) Expression level of LrNADH-GOGAT in leaf tissues. (d) Expression level of LrNADH-GOGAT in root tissues. Different uppercase letters (A, B, C) within the same subfigure indicate statistically significant differences (p < 0.05) among samples within a group, while distinct lowercase letters (a, b, c) represent significant differences (p < 0.05) between different groups.
The expression levels of LrGSs under salt stress are shown in Fig. 5. LrGS2 is the predominantly expressed GS gene in leaves (Fig. 5c). The expression of LrGS2 in leaves was significantly upregulated after 1 h of 2.5% NaCl stress, and although its expression level decreased by 12 h of stress, it did not fall below the normal physiological level. This indicates that LrGS2 can be induced by salt stress but that salt stress does not suppress its expression level in leaves. The expression of LrGS2 in roots was low, but it was significantly upregulated after 1 h of 0.5% NaCl stress (Fig. 5g). In addition, the expression level of LrGS1.2 in leaves was also significantly upregulated after 1 h of 0.5% NaCl stress (Fig. 5d). LrGS1.1 is the predominantly expressed GS gene in roots, and its expression was upregulated by 1.59-fold after 1 h of 0.5% NaCl stress (Fig. 5e). As the degree of stress increased and the duration of stress continued, the expression of LrGS1.1 was significantly downregulated. Furthermore, with increasing salt concentration and prolonged stress duration, the expression levels of other GS genes were also downregulated, both in leaves and roots.
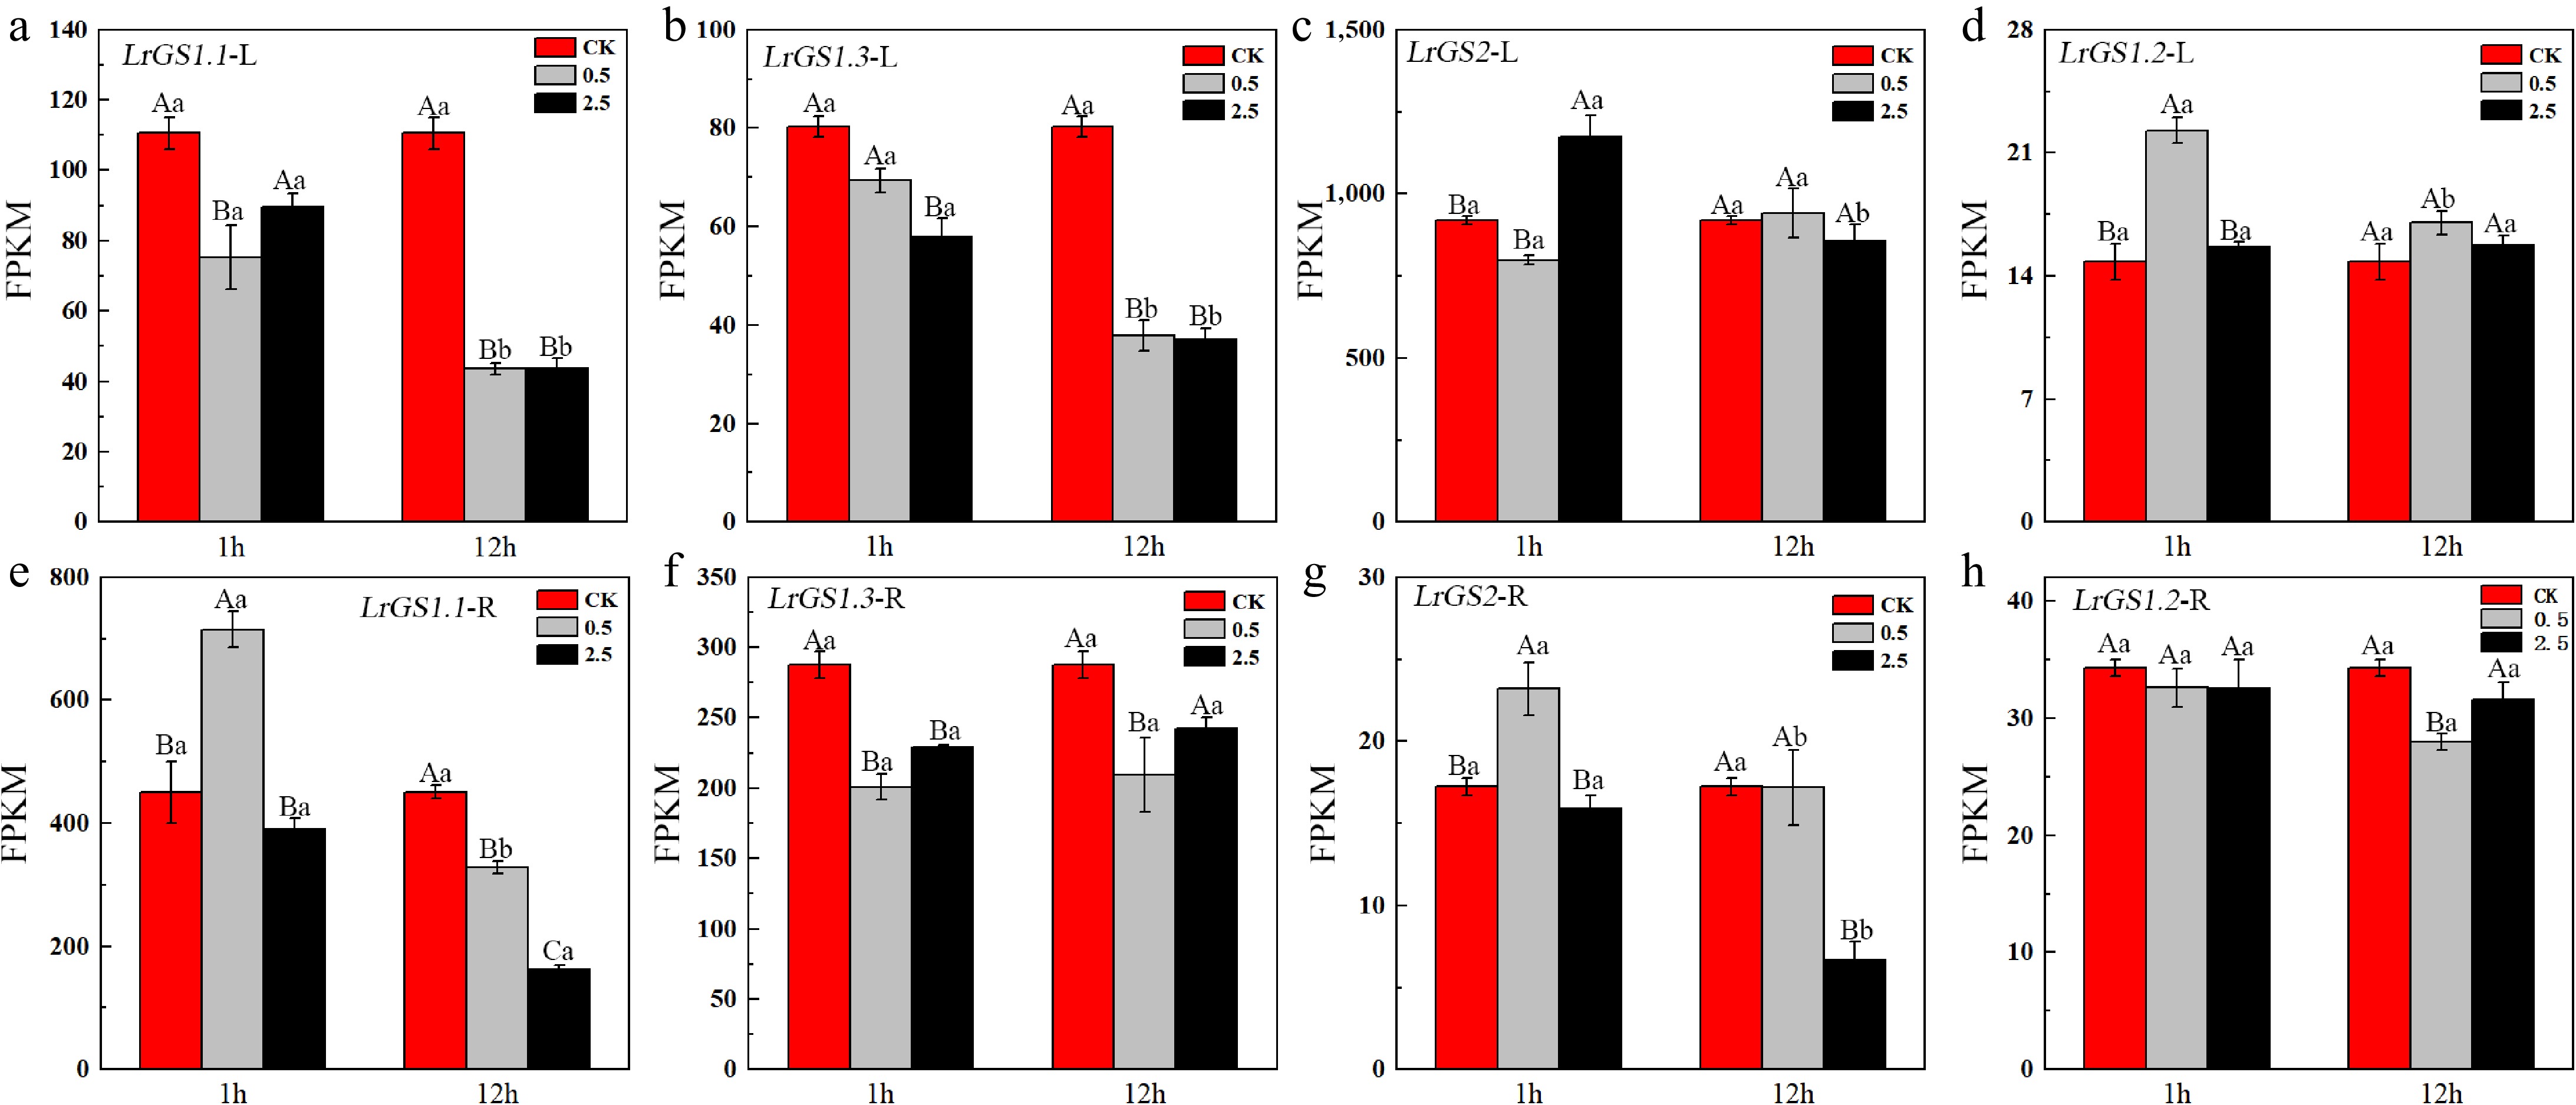
Figure 5.
Expression levels of GS in the leaves and roots of L. ruthenicum under NaCl treatment. Different uppercase letters (A, B, C) within the same subfigure indicate statistically significant differences (p < 0.05) among samples within a group, while distinct lowercase letters (a, b, c) represent significant differences (p < 0.05) between different groups. 'L' is leaf, 'R' is root.
The expression levels of LrGDHs are much lower than those of LrGSs (Fig. 6), and the expression levels of most LrGSs genes decreased under NaCl stress, especially in leaves. LrGDH4 is the predominantly expressed GDH gene in both leaves and roots, and its expression was significantly downregulated in both roots and leaves under NaCl stress. However, it is noteworthy that the expression levels of LrNADP-GDH and LrGDH2 were significantly upregulated at 12 h of NaCl stress.
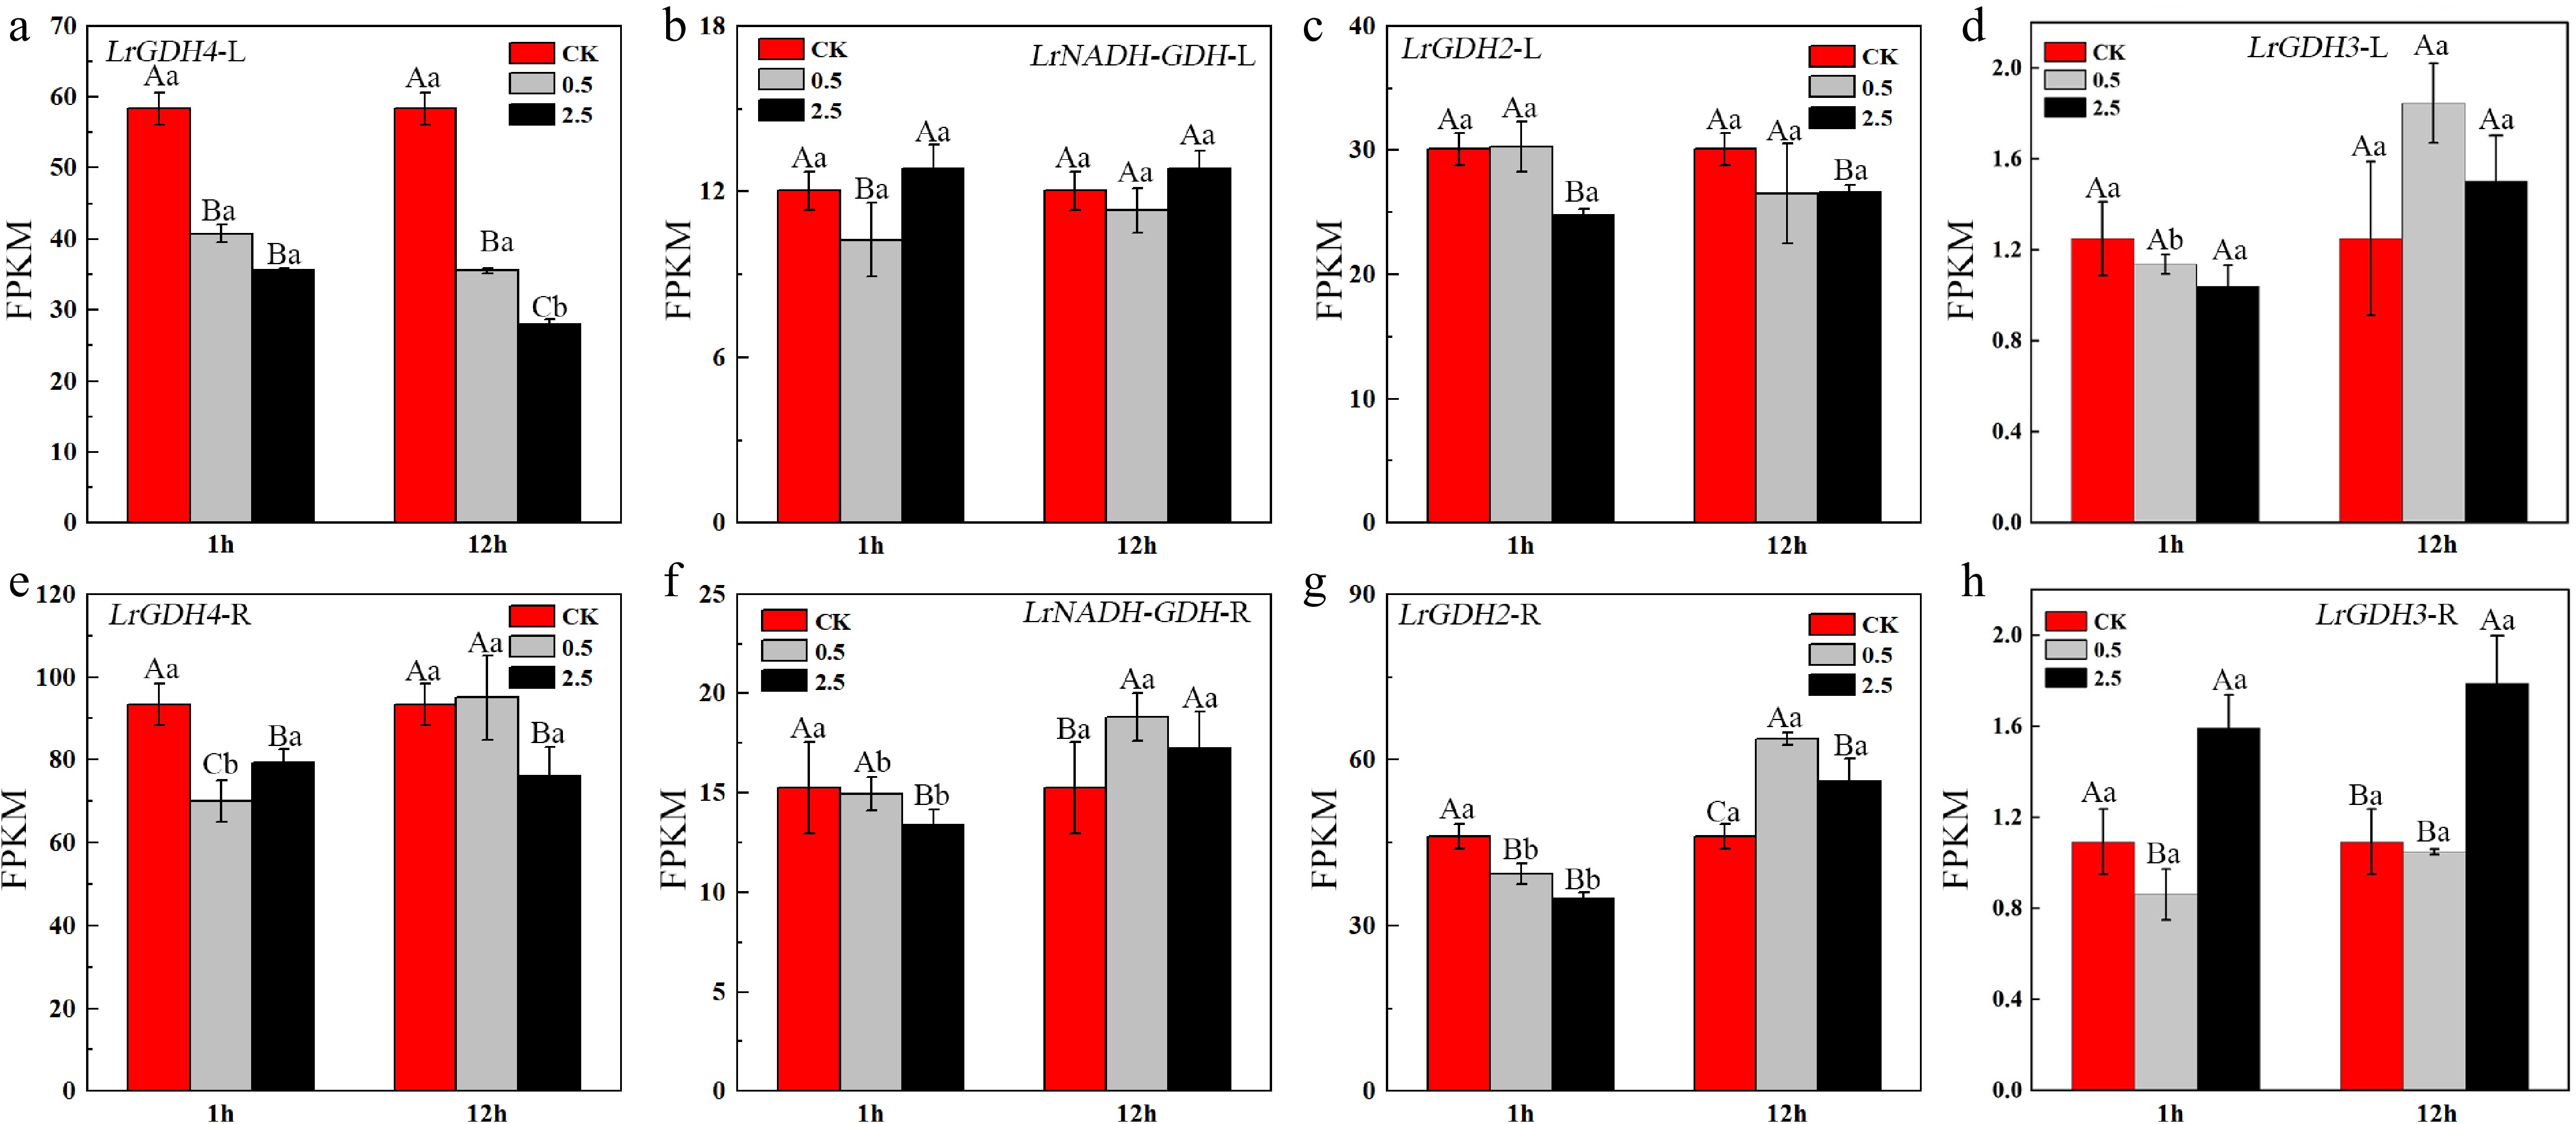
Figure 6.
Expression levels of GDH in the leaves and roots of L. ruthenicum under NaCl treatment. Different uppercase letters (A, B, C) within the same subfigure indicate statistically significant differences (p < 0.05) among samples within a group, while distinct lowercase letters (a, b, c) represent significant differences (p < 0.05) between different groups. 'L' is leaf, 'R' is root.
Transcriptional regulatory network of the GOGAT gene in L. ruthenicum
-
The protein-protein interaction results showed that out of the ten nitrogen assimilation-related genes in black wolfberry, seven exhibited significant interactions, including two GOGAT, two GS, and two GDH (Fig. 7a). To explore the role of transcription factors (TFs) in the regulation of nitrogen assimilation in black wolfberry, transcription factors regulating the expression of nitrogen assimilation-related genes were predicted. The results indicated that 19 TF families may be involved in the regulation of the seven nitrogen assimilation-related genes in black wolfberry, with the C2H2, Dof, GRAS, AP2, and BBR-BPC families having the highest number of binding sites (Fig. 7b). Therefore, members of these five TF families were identified and their expression under salt stress was analyzed. The results showed that 42 AP2 genes, six BBR-BPC genes, 84 C2H2 genes, 36 Dof genes, and 20 GRAS genes were expressed in the leaves and roots of black wolfberry. Under salt stress, their expression patterns in leaves and roots were classified into eight distinct expression profiles (Fig. 7c, d). In the leaves, the expression levels of 13 genes were upregulated with increasing salt stress concentration and duration. In the roots, the expression levels of four genes were upregulated with increasing salt stress concentration and duration. Notably, C2H2-63 was the only gene whose expression level in both roots and leaves was upregulated with increasing salt concentration and stress duration.The expression analysis of C2H2-63 showed that under normal physiological conditions, the expression level of C2H2-63 in roots was 3.6 times higher than in leaves. Under 0.5% NaCl stress, there was no significant change in the expression levels of C2H2-63 in roots and leaves. However, under 2.5% NaCl stress, the expression of C2H2-63 was upregulated by 2.33-fold and 2.15-fold after 1 h and 12 h of stress in roots, respectively, and by 1.30-fold after 1 h of stress in leaves. This suggests that C2H2-63 plays a positive role in the response of black wolfberry to salt stress.
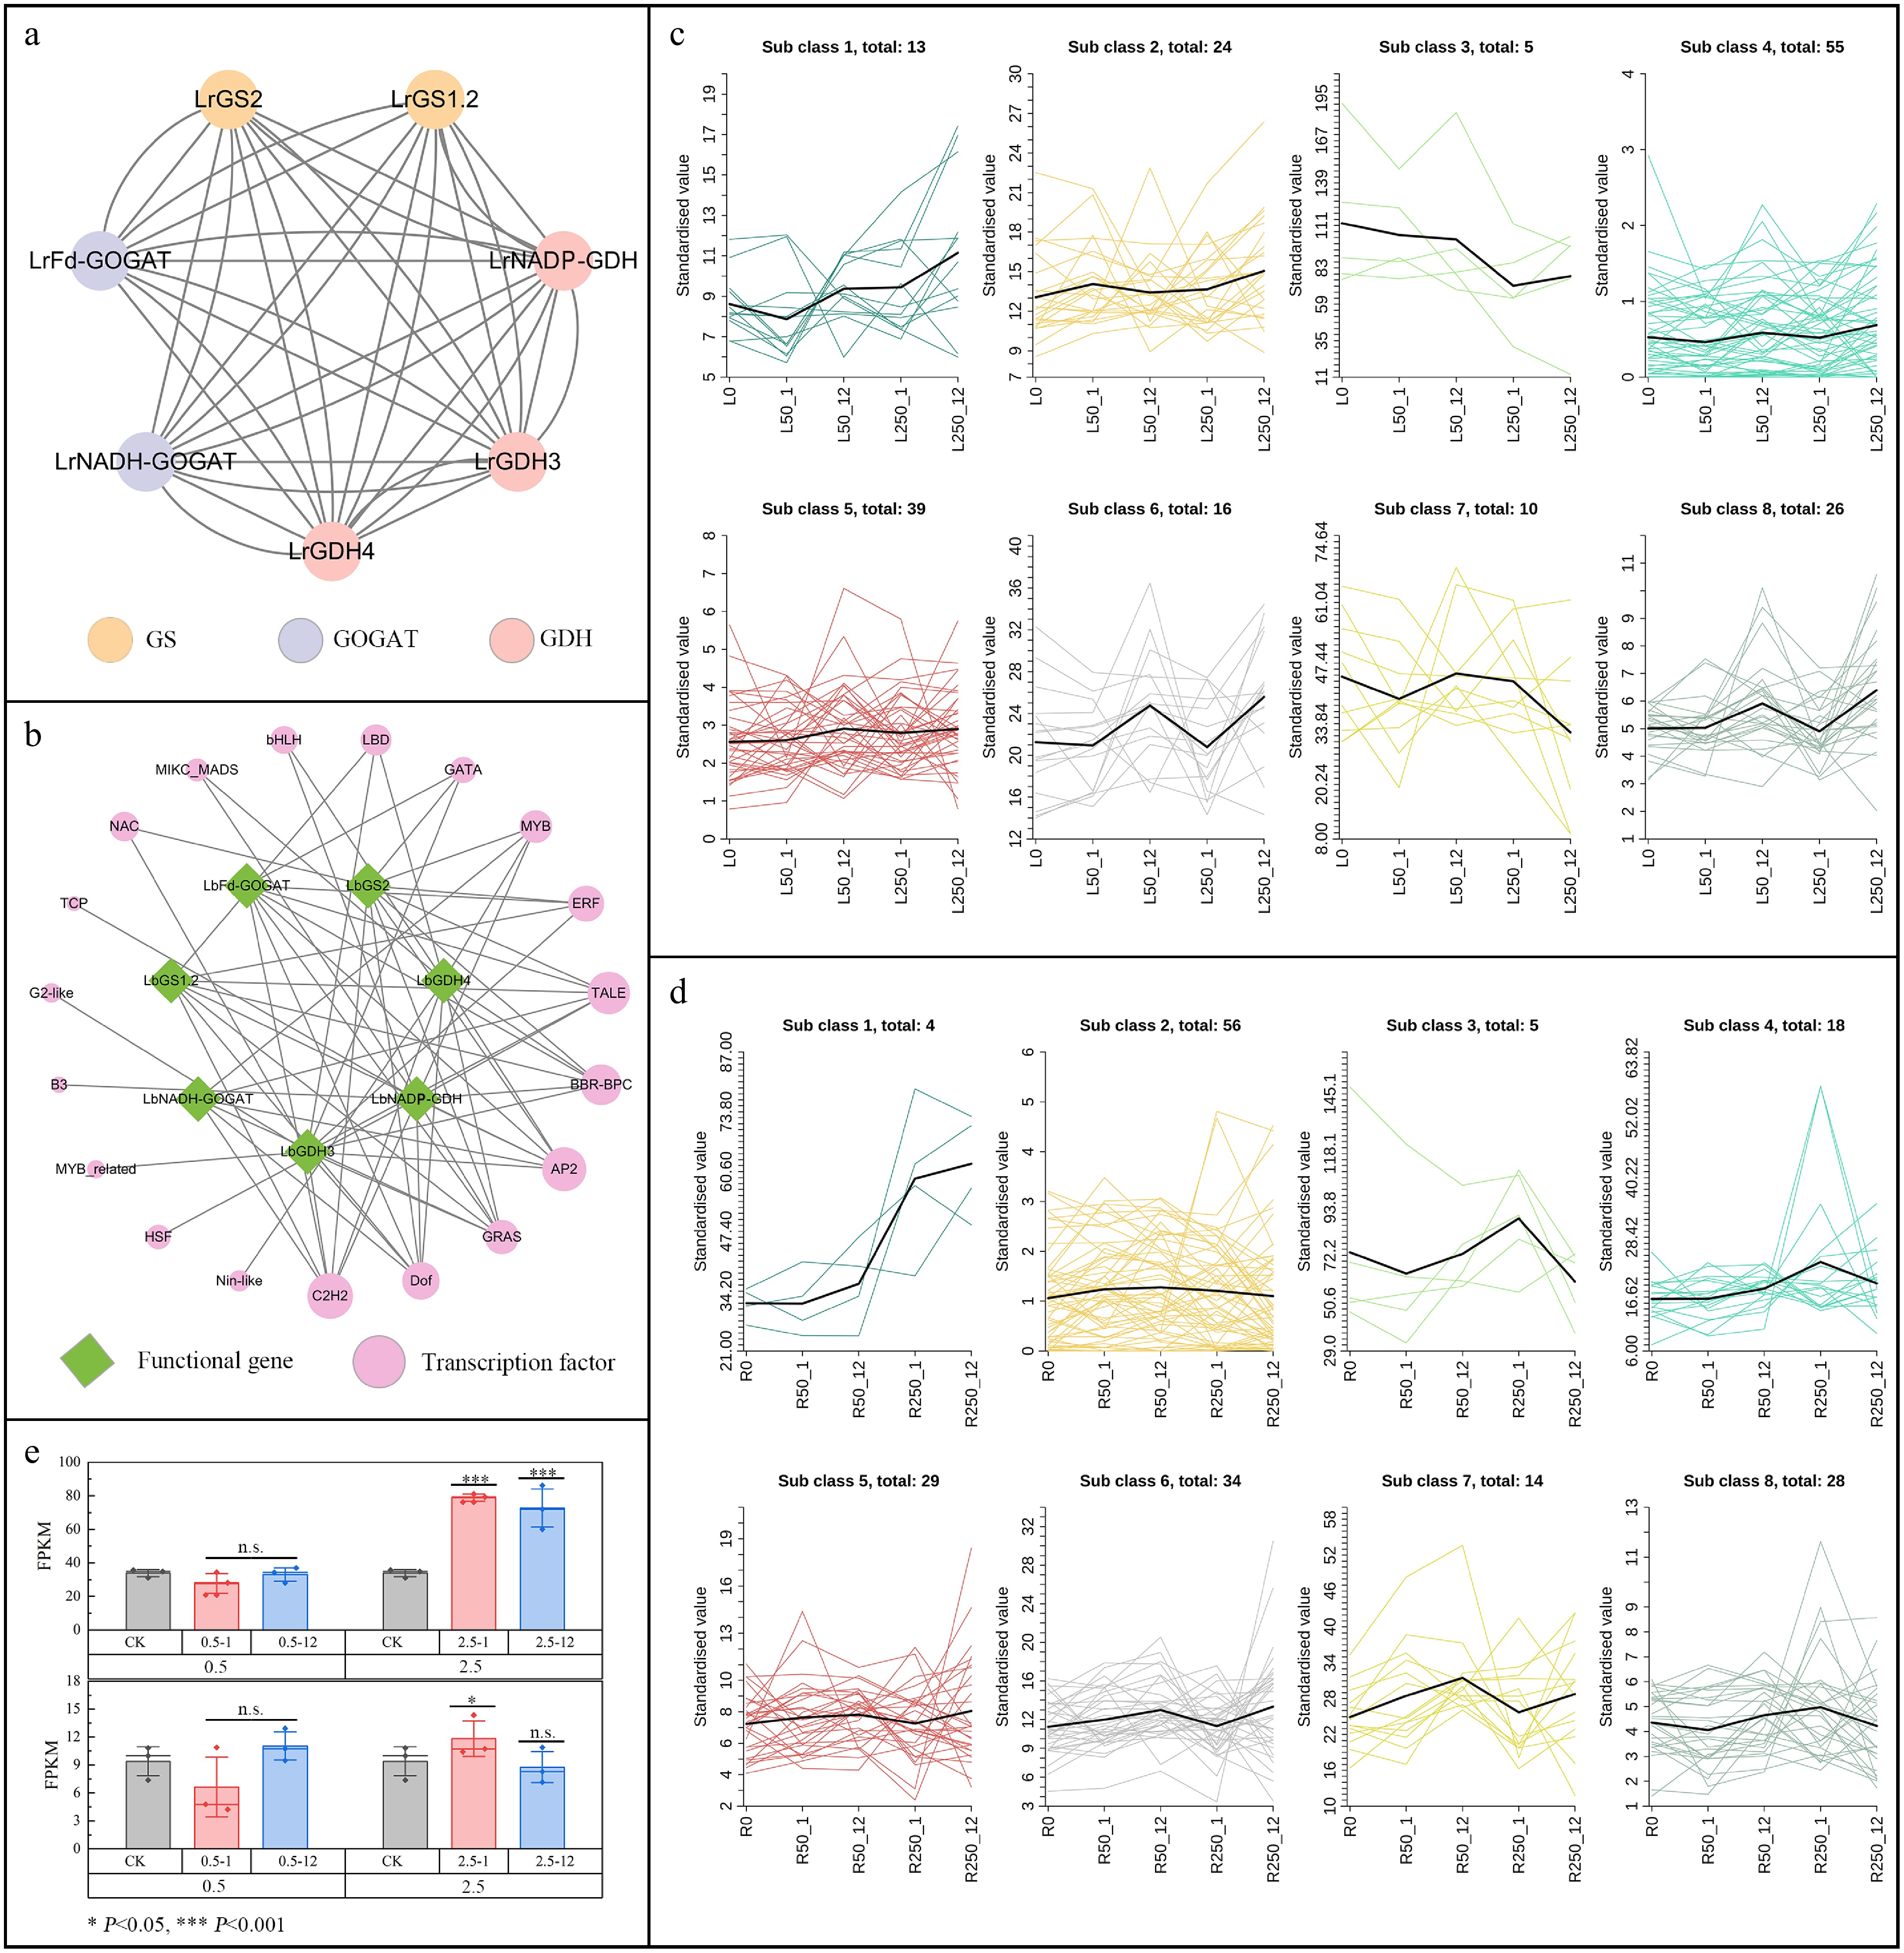
Figure 7.
Transcription regulatory network and correlation analysis of GOGAT, GS, and GDH in L. ruthenicum. (a) Protein interaction networks of GOGAT, GS, and GDH. (b) Transcription factor regulatory network for protein interaction. (c) Expression pattern of TFs under salt stress in leaves. (d) Expression pattern of TFs under salt stress in root. (e) Expression of C2H2-63 under salt stress.
TF-DNA docking analysis
-
To verify whether C2H2-63 has a regulatory role in the nitrogen assimilation-related genes of black wolfberry, this study used AF3 to perform molecular docking of C2H2-63 with the promoter regions of the seven nitrogen assimilation-related genes. The results showed that the C2H2-63 protein structure contains a typical C2H2 domain (Fig. 8a), and that C2H2-63 is able to bind to the promoter regions of all seven nitrogen assimilation-related genes in black wolfberry (Fig. 8b−h).
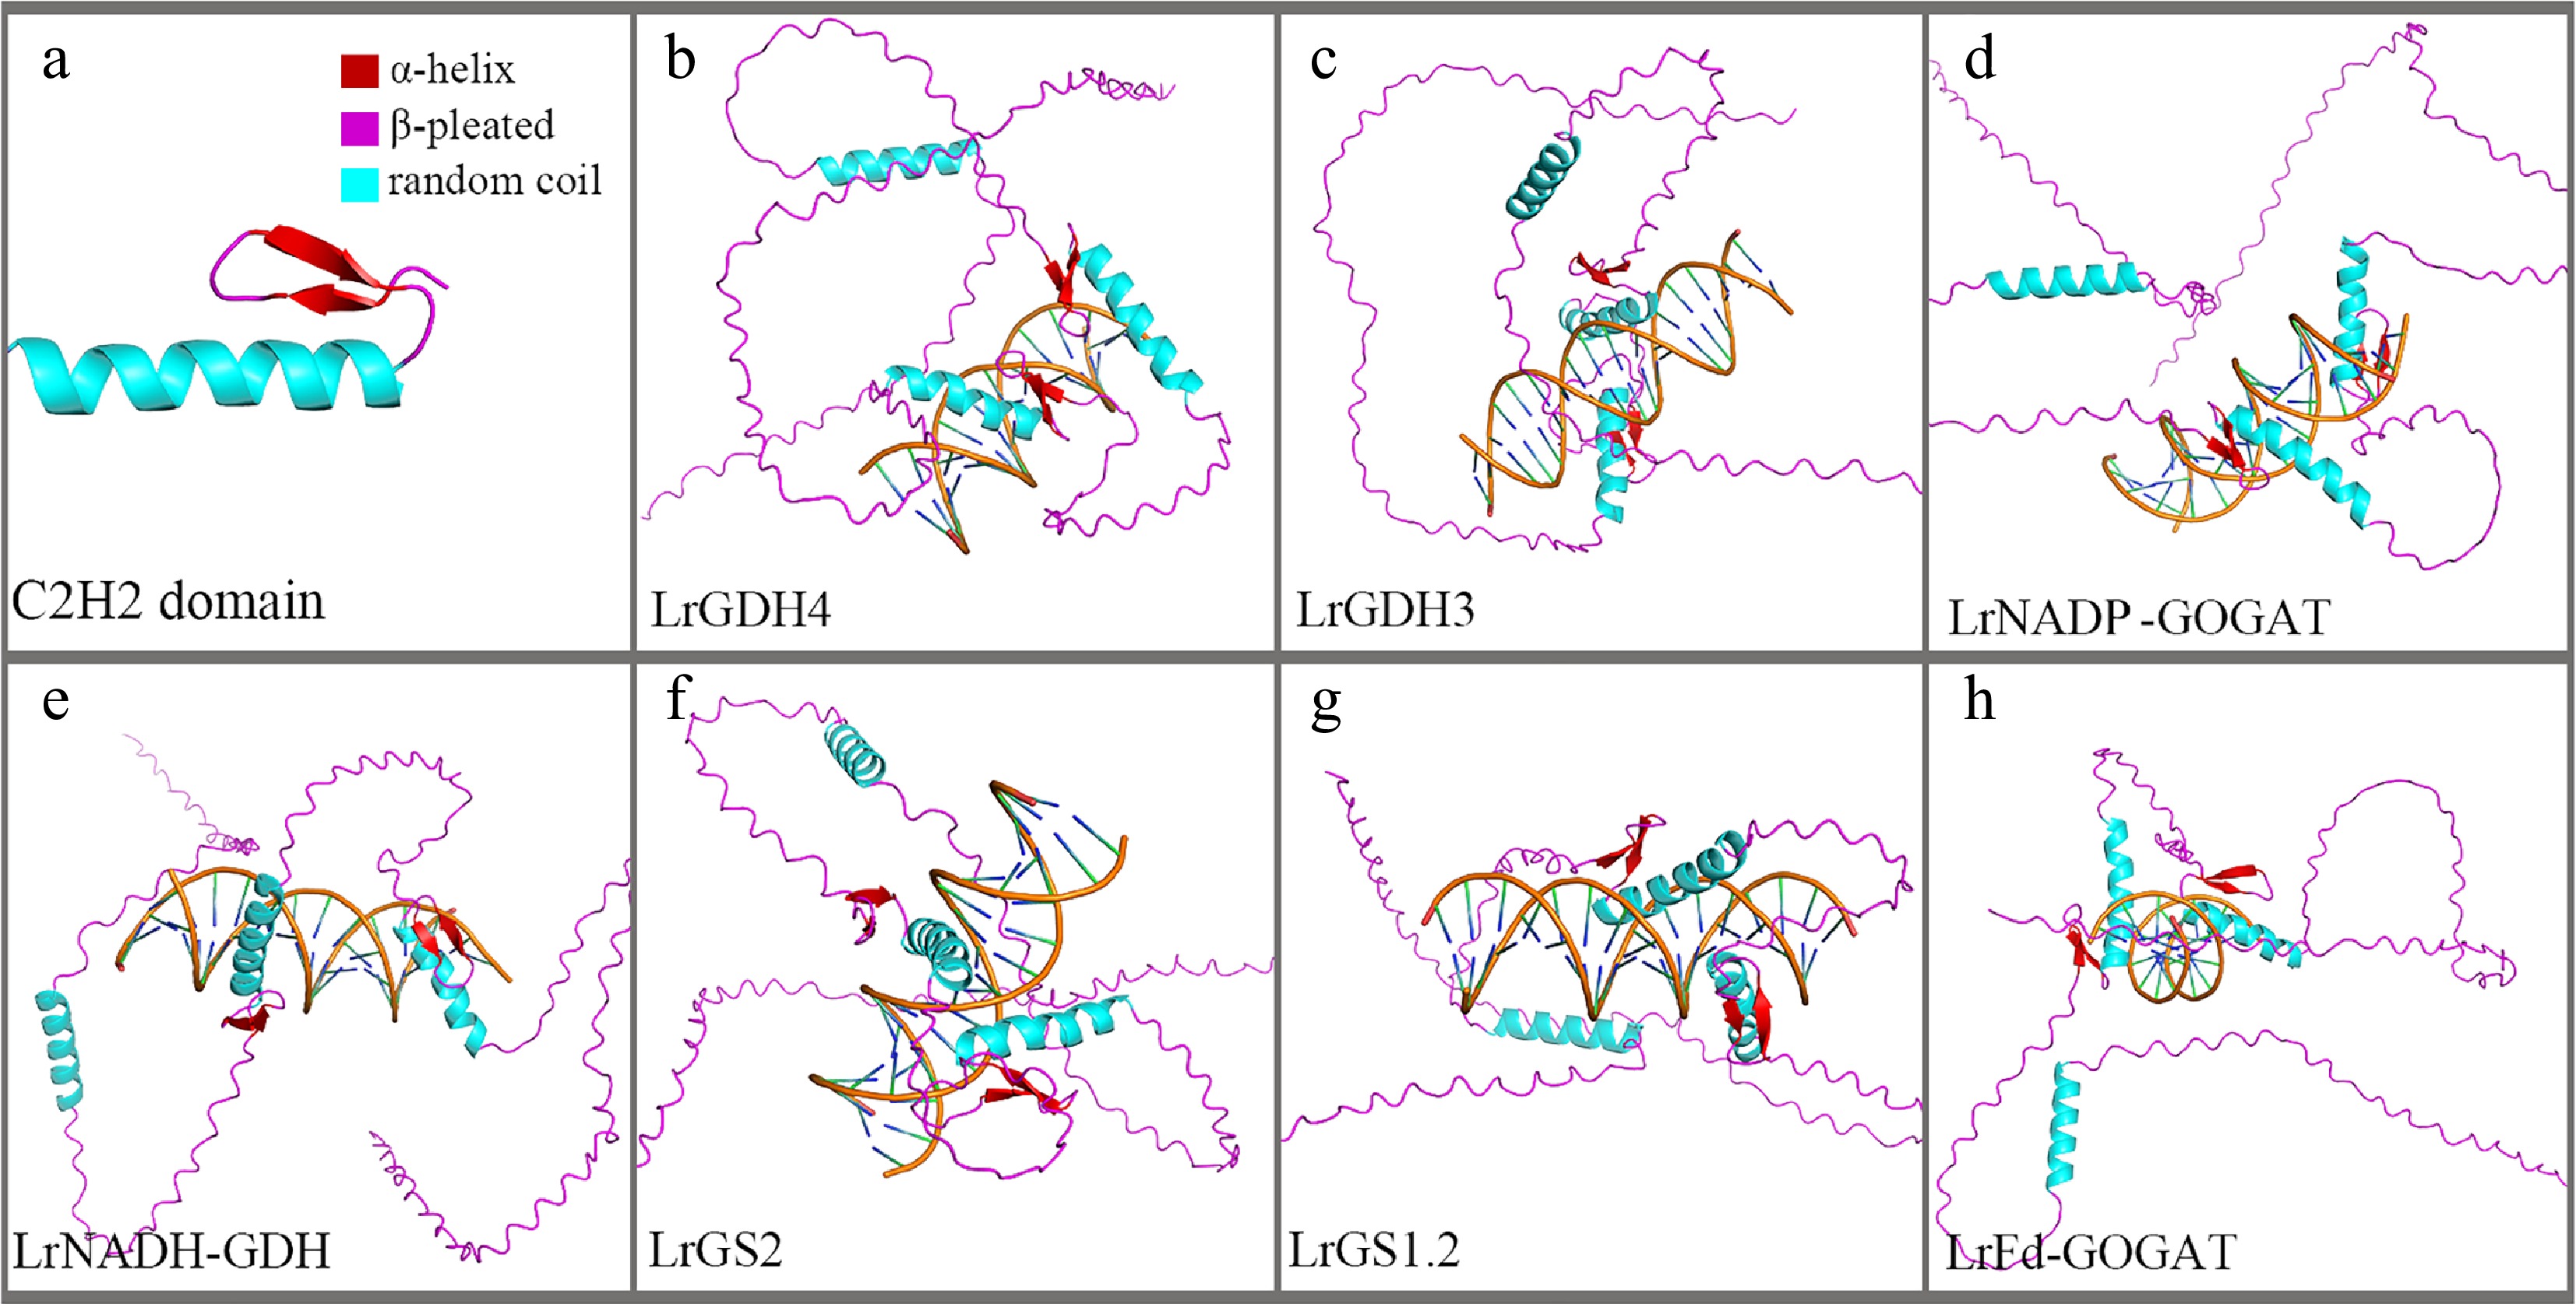
Figure 8.
TF-DNA docking diagram. (a) Tertiary structure of the C2H2 domain. (b)–(h) Binding conformations with promoter regions of different genes.
Molecular evolution analysis and comparative protein structure analysis
Selective pressure on GOGAT, GS, and GDH genes and sites of positive selection
-
To test whether the proteins encoded by the GOGAT, GS, and GDH genes in black wolfberry are subject to positive selection at specific amino acid sites, the branch-site model was employed for analysis. The results (Supplementary Fig. S1) revealed that the amino acid sites p.Glu223Ala, p.Ala391Phe, p.Ala883Thr, p.Ser924Leu, p.Leu1322Phe, p.Ser1353Ala, and p.Ser1573Cys in the Fd-GOGAT gene of black wolfberry are under strong positive selection. LRT results indicated a significant difference between Model A0 and Model A1 (p < 0.05) (Table 2).
Table 2. Molecular evolutionary analysis based on the branch-site model.
Gene Mode Estimates of parameters NP InL χ2 df p LrFd-GOGAT Model A0 Proportion 0.79 0.07 0.13 0.01 Background w 0.00 1.00 0.00 1.00 11 −6783.17 Model A0 vs Model A1 Foreground w 0.00 1.00 1.00 1.00 6.2 1 0.01 Model A1 Proportion 0.99 0.00 0.01 0.00 Background w 0.07 1.00 0.07 1.00 12 −6780.07 Foreground w 0.07 1.00 65.77 65.77 LrNADH-GOGAT Model A0 Proportion 0.90 0.10 0.00 0.00 Background w 0.00 1.00 0.00 1.00 15 −9501.4 Model A0 vs Model A1 Foreground w 0.00 1.00 1.00 1.00 0 1 1 Model A1 Proportion 0.90 0.10 0.00 0.00 Background w 0.00 1.00 0.00 1.00 16 −9501.4 Foreground w 0.00 1.00 1.00 1.00 LrGDH2 Model A0 Proportion 0.82 0.07 0.10 0.01 Background w 0.05 1.00 0.05 1.00 15 −2448.84 Model A0 vs Model A1 Foreground w 0.05 1.00 1.00 1.00 0 1 1 Model A1 Proportion 0.90 0.08 0.02 0.00 Background w 0.05 1.00 0.05 1.00 16 −2448.84 Foreground w 0.05 1.00 1.00 1.00 LrGDH3 Model A0 Proportion 0.92 0.08 0.00 0.00 Background w 0.05 1.00 0.05 1.00 15 −2,889.45 Model A0 vs Model A1 Foreground w 0.05 1.00 1.00 1.00 0 1 1 Model A1 Proportion 0.91 0.08 0.01 0.00 Background w 0.05 1.00 0.04 1.00 16 −2889.45 Foreground w 0.05 1.00 1.00 1.00 LrNADP-GDH Model A0 Proportion 0.85 0.15 0.00 0.00 Background w 0.00 1.00 0.00 1.00 11 −2755.77 Model A0 vs Model A1 Foreground w 0.00 1.00 1.00 1.00 0 1 1 Model A1 Proportion 0.85 0.15 0.00 0.00 Background w 0.00 1.00 0.00 1.00 12 −2755.77 Foreground w 0.00 1.00 1.00 1.00 LrGDH4 Model A0 Proportion 0.93 0.07 0.00 0.00 Background w 0.00 1.00 0.00 1.00 11 −1713.21 Model A0 vs Model A1 Foreground w 0.00 1.00 1.00 1.00 0 1 1 Model A1 Proportion 0.93 0.07 0.00 0.00 Background w 0.00 1.00 0.00 1.00 12 −1713.21 Foreground w 0.00 1.00 1.00 1.00 LrGS1.1 Model A0 Proportion 0.74 0.03 0.22 0.01 Background w 0.06 1.00 0.06 1.00 11 −2013.92 Model A0 vs Model A1 Foreground w 0.56 1.00 1.00 1.00 0 1 1 Model A1 Proportion 0.79 0.03 0.17 0.01 Background w 0.06 1.00 0.06 1.00 12 −2013.91 Foreground w 0.06 1.00 1.31 1.31 LrGS2 Model A0 Proportion 0.77 0.16 0.06 0.01 Background w 0.00 1.00 0.00 1.00 11 −1870.56 Model A0 vs Model A1 Foreground w 0.00 1.00 1.00 1.00 0 1 1 Model A1 Proportion 0.77 0.16 0.06 0.01 Background w 0.00 1.00 0.00 1.00 12 −1870.56 Foreground w 0.00 1.00 1.00 1.00 LrGS1.2 Model A0 Proportion 0.89 0.07 0.04 0.00 Background w 0.04 1.00 0.04 1.00 15 −2473.48 Model A0 vs Model A1 Foreground w 0.04 1.00 1.00 1.00 0 1 1 Model A1 Proportion 0.89 0.07 0.04 0.00 Background w 0.04 1.00 0.04 1.00 16 −2473.48 Foreground w 0.04 1.00 1.00 1.00 LrGS1.3 Model A0 Proportion 0.92 0.07 0.00 0.00 Background w 0.04 1.00 0.04 1.00 15 −2474.1 Model A0 vs Model A1 Foreground w 0.04 1.00 1.00 1.00 0 1 1 Model A1 Proportion 0.93 0.07 0.00 0.00 Background w 0.04 1.00 0.04 1.00 16 −2474.1 Foreground w 0.04 1.00 1.00 1.00 Construction and quality assessment of protein structure models
-
To investigate whether mutation sites affect the structure and function of the LrFd-GOGAT protein, this study constructed the three-dimensional structures of LrFd-GOGAT and LbFd-GOGAT proteins. The results, as illustrated in Fig. 9a, reveal that both LrFd-GOGAT and LbFd-GOGAT are monomeric proteins composed of four distinct domains and two ligands. The domains include the FMN-binding domain, C-terminal domain, central domain, and N-terminal amidotransferase domain. The ligands are 3Fe-4S and FMN. In the LrFd-GOGAT protein, seven mutation sites were identified: p.Ser924Leu and p.Leu1322Phe are located within the FMN-binding domain; p.Ser1353Ala and p.Ser1573Cys reside in the C-terminal domain; p.Glu223Ala and p.Ala391Phe are found in the amidotransferase domain; and p.Ala880Thr is situated in the central domain (Fig. 9b). The Ramachandran plot shows that 91.2% and 92.6% of the amino acid residues of LrFd-GOGAT and LbFd-GOGAT (Supplementary Fig. S2), respectively, fall within the red regions, indicating a high quality of the protein models, which allows for reliable structural comparison and analysis.
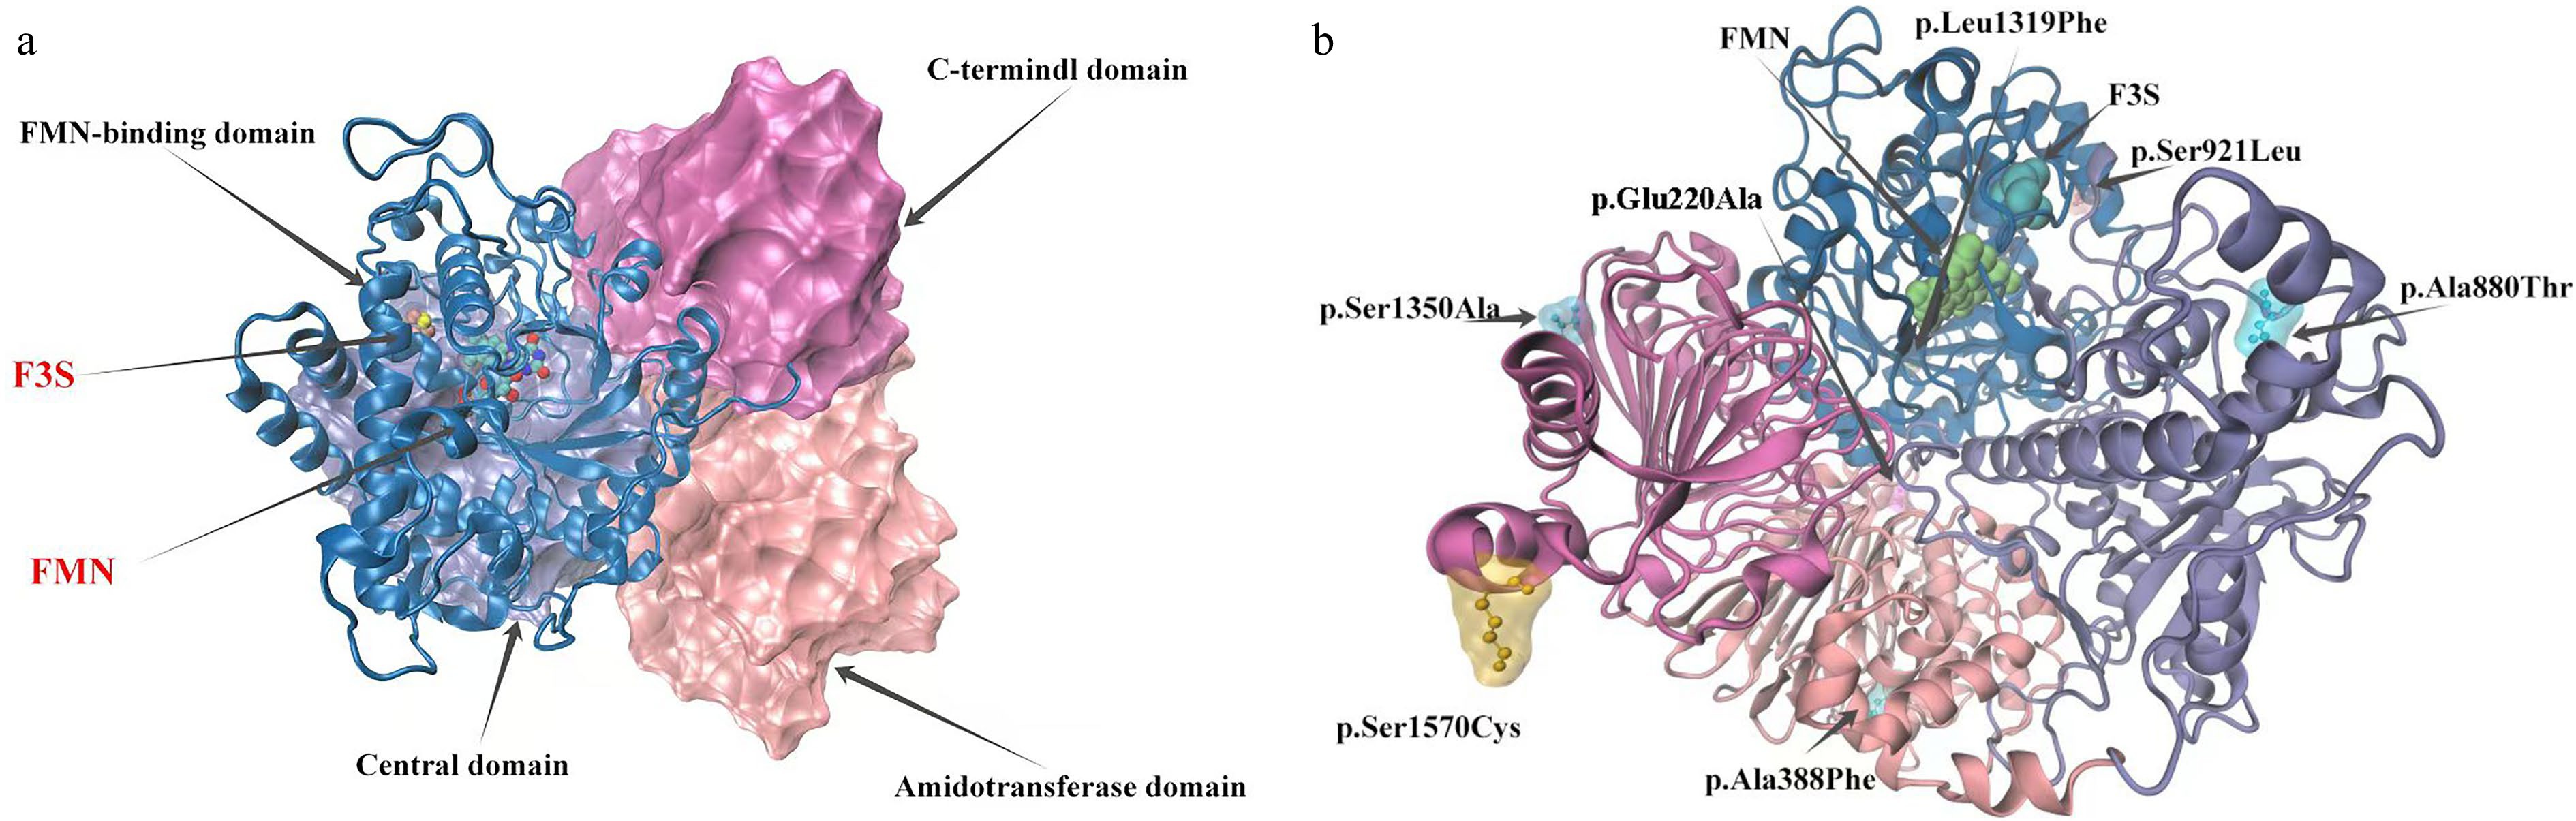
Figure 9.
Model of LrFd-GOGAT protein structure and distribution of mutation sites. (a) Structural model of the LrFd-GOGAT protein. (b) Distribution of amino acid mutation sites in the LrFd-GOGAT protein.
Comparative analysis of protein structures
-
To explore the differences in structure and function between LrFd-GOGAT and LbFd-GOGAT, this study conducted a point mutation analysis of LbFd-GOGAT, specifically targeting the positively selected sites of LrFd-GOGAT. The results showed that the Root Mean Square Deviation (RMSD) between LrFd-GOGAT and LbFd-GOGAT was 0.121, indicating that the mutation sites did not cause significant changes in the overall protein structure of LrFd-GOGAT. Further analysis revealed that the mutation p.Leu1322Phe altered the original unstructured coil region, introducing an additional helical structure between Phe1322 and Ser1327 in the LrFd-GOGAT protein (Fig. 10). No other structural changes caused by mutation sites were observed.
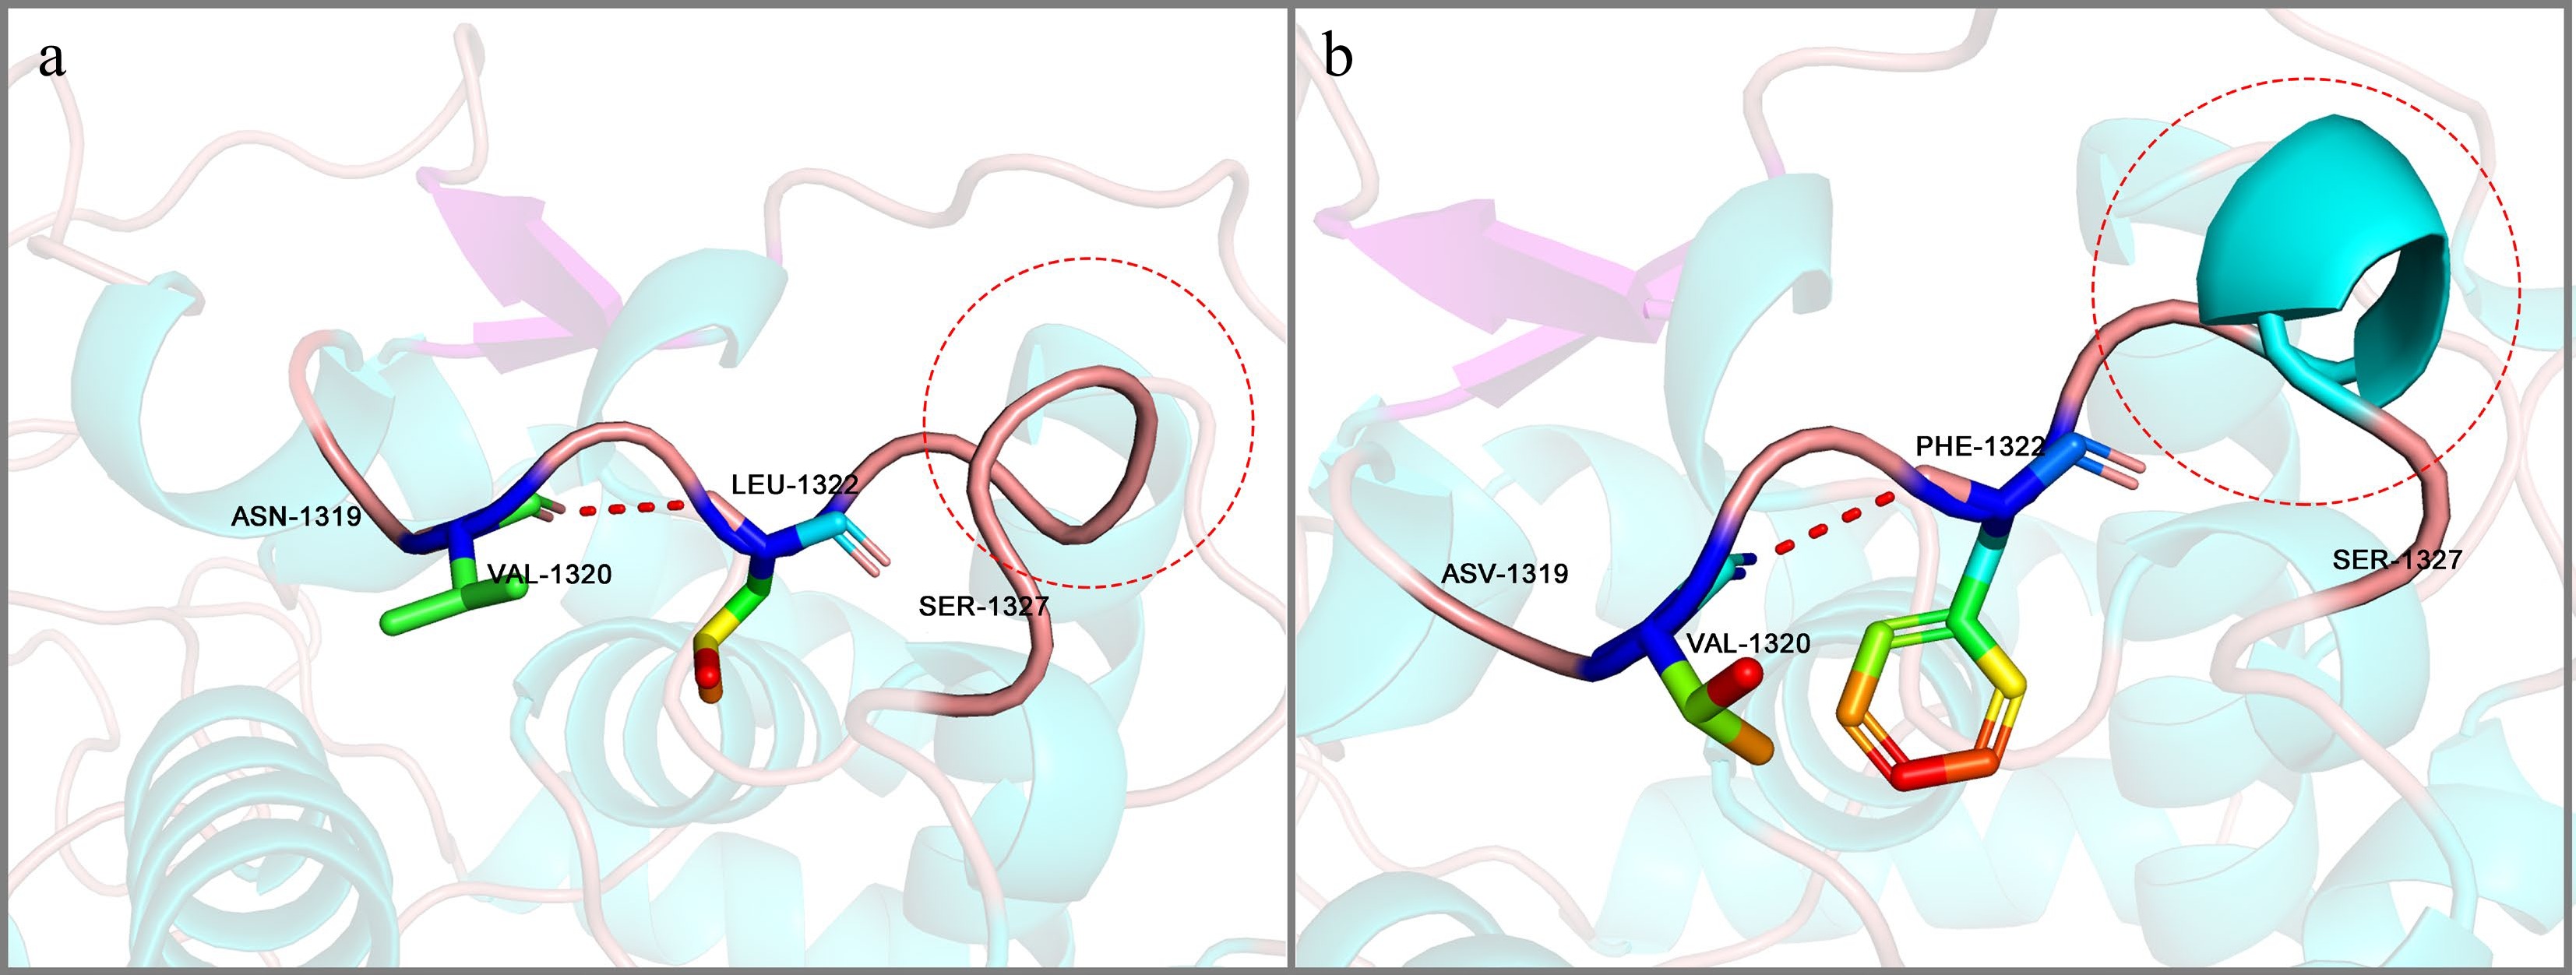
Figure 10.
Protein conformation at the p.Leu1322Phe position. (a) Conformational structure of the Leu 1322 region in LbFd-GOGAT. (b) Corresponding Phe1322 region conformation in LrFd-GOGAT.
However, it is noteworthy that both p.Glu223Ala and p.Ala391Phe are located in the amidotransferase domain. The analysis indicated that these two mutations increased the electrostatic potential in the corresponding regions (on the protein surface), while other mutation sites did not alter the electrostatic potential of their respective regions (Fig. 11).
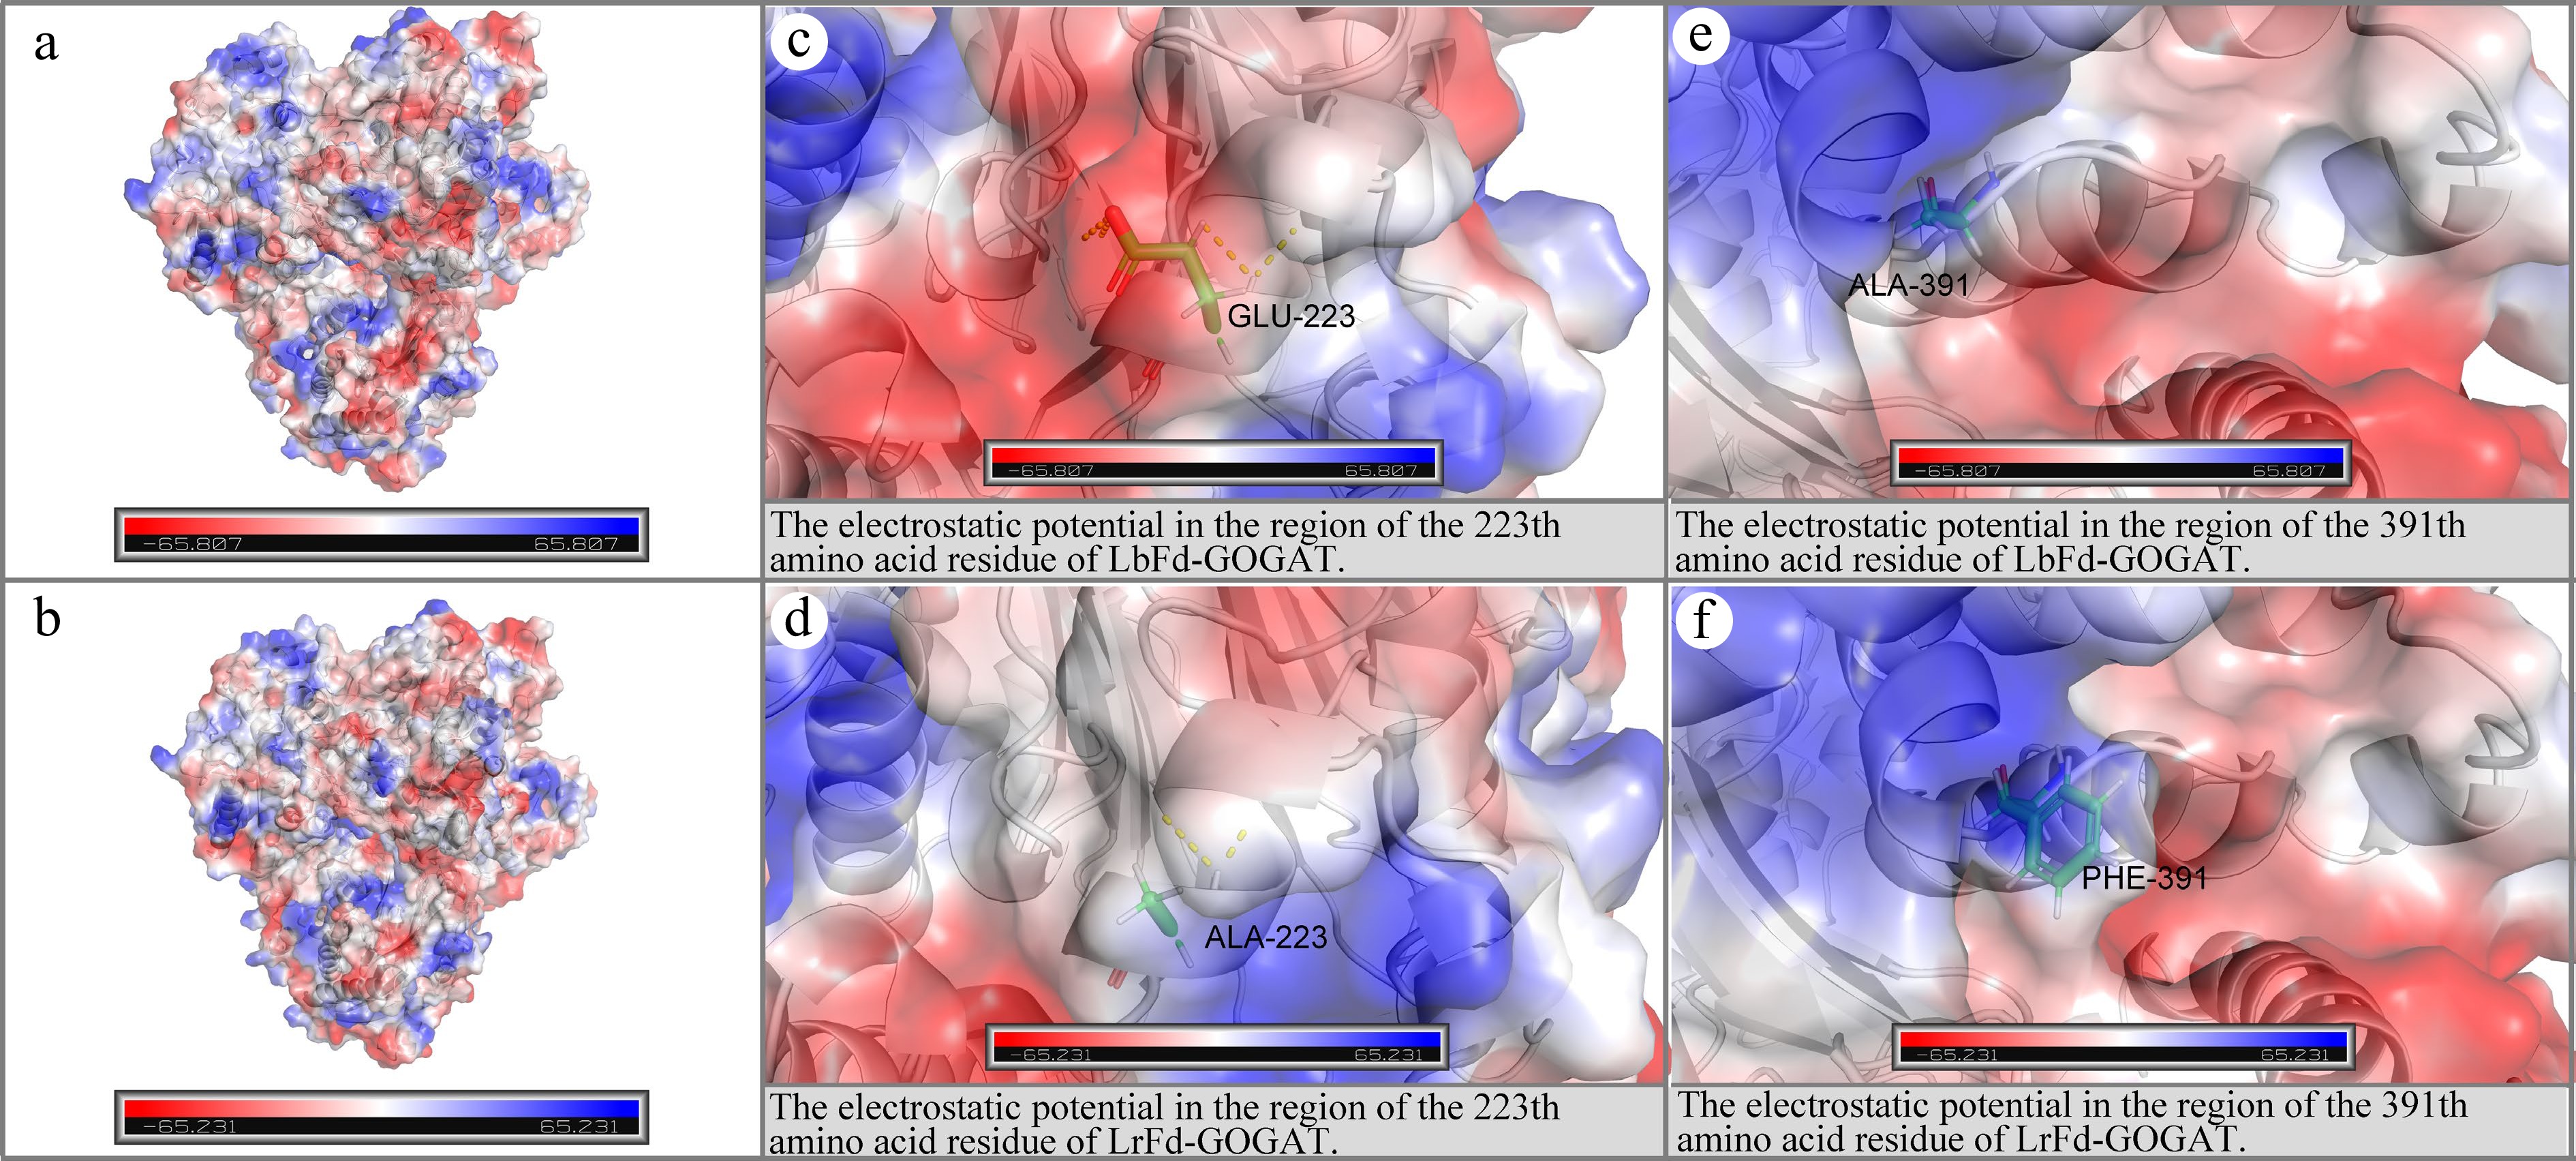
Figure 11.
Electrostatic potential distribution in the regions of p.Glu223Ala and p.Ala391Phe. (a) and (b) depict the electrostatic potential distributions on the molecular surfaces of LbFd-GOGAT and LrFd-GOGAT proteins, respectively; (c) and (d) present the localized electrostatic potential distributions surrounding residue 223 in LbFd-GOGAT and LrFd-GOGAT proteins; (e) and (f) illustrate the electrostatic potential profiles near residue 391 in LbFd-GOGAT and LrFd-GOGAT proteins.
Additionally, the impact of mutation sites on protein hydrophilicity was analyzed. The mutations p.Ala883Thr and p.Leu1322Phe led to an increase in hydrophilicity in the respective regions, whereas p.Glu223Ala, p.Ala391Phe, p.Ser924Leu, p.Ser1353Ala, and p.Ser1573Cys resulted in increased hydrophobicity in their corresponding regions (Fig. 12). Notably, p.Ala883Thr and p.Leu1322Phe are both located in unstructured coil regions, while p.Glu223Ala, p.Ala391Phe, p.Ser924Leu, p.Ser1353Ala, and p.Ser1573Cys are all situated in helical structures.
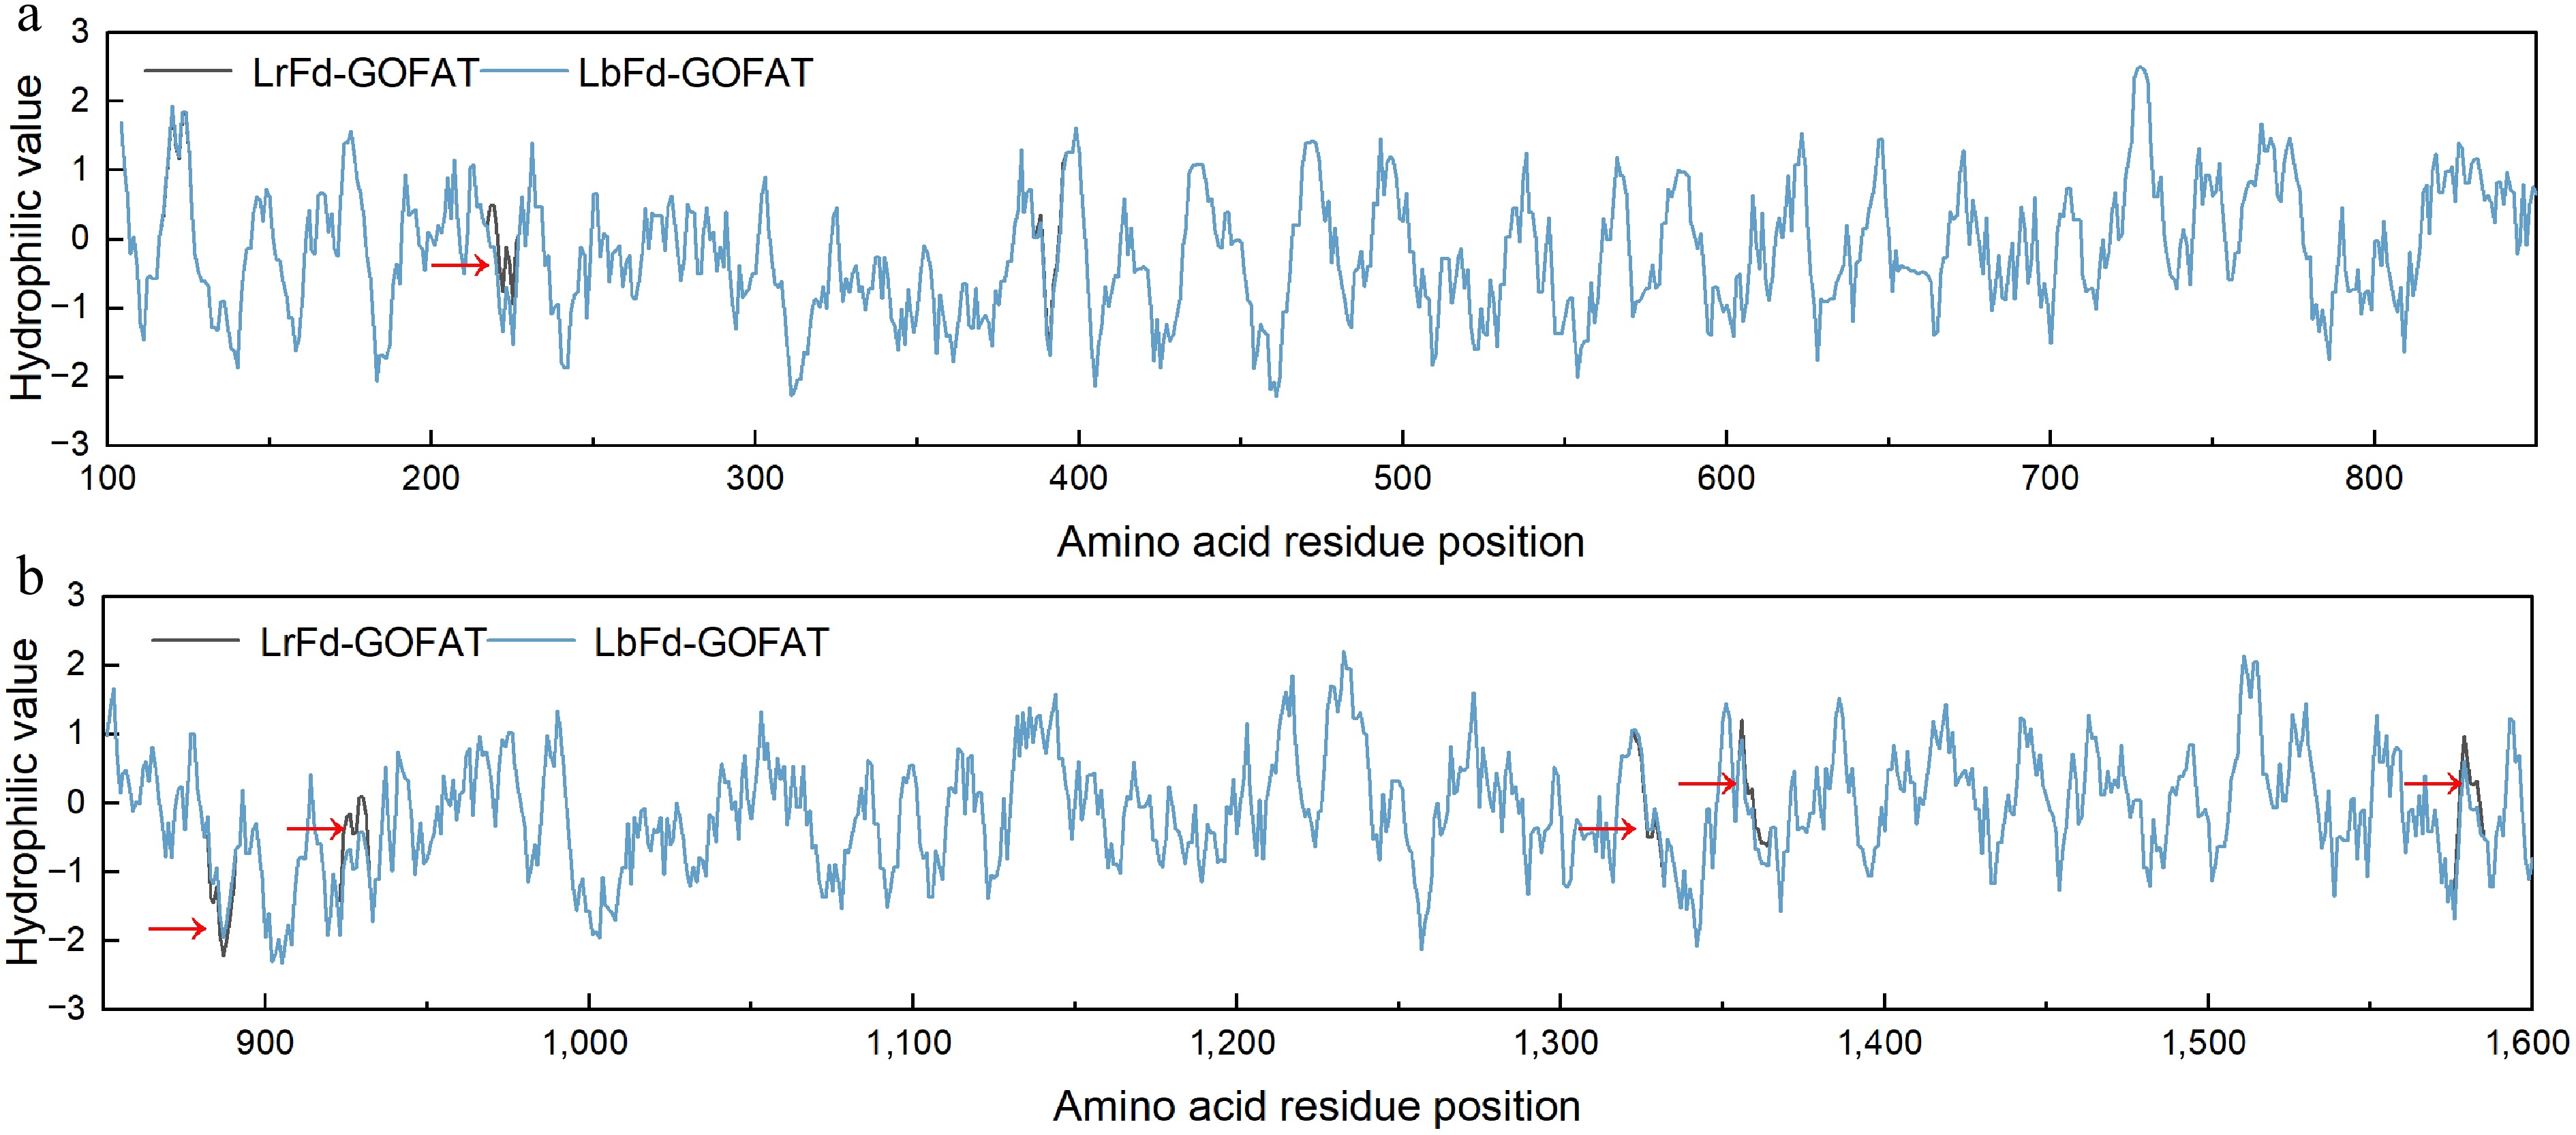
Figure 12.
Hydrophilicity distribution of amino acid residues in LrFd-GOGAT and LbFd-GOGAT proteins. (a) and (b) display the hydrophilicity profiles of amino acid residues 100–850 and 851–1,600, respectively.
Molecular docking
-
To analyze whether the mutation sites would lead to a change in the binding affinity of LrFd-GOGAT with its substrate, this study conducted molecular docking simulations between LrFd-GOGAT and LbFd-GOGAT with the substrate L-glutamine. After performing 50 rounds of docking simulations, it was found that both LrFd-GOGAT and LbFd-GOGAT had ten potential binding sites with L-glutamine, among which two sites exhibited binding energies greater than |–2 kJ/mol| in both LrFd-GOGAT and LbFd-GOGAT (Fig. 13). A comparative analysis revealed that the binding energies of LrFd-GOGAT with L-glutamine were –2.99 kJ/mol and –2.96 kJ/mol, respectively, while the binding energies of LbFd-GOGAT with L-glutamine were −2.90 kJ/mol and −2.36 kJ/mol, respectively. This indicates that LrFd-GOGAT has a higher affinity for the substrate L-glutamine.
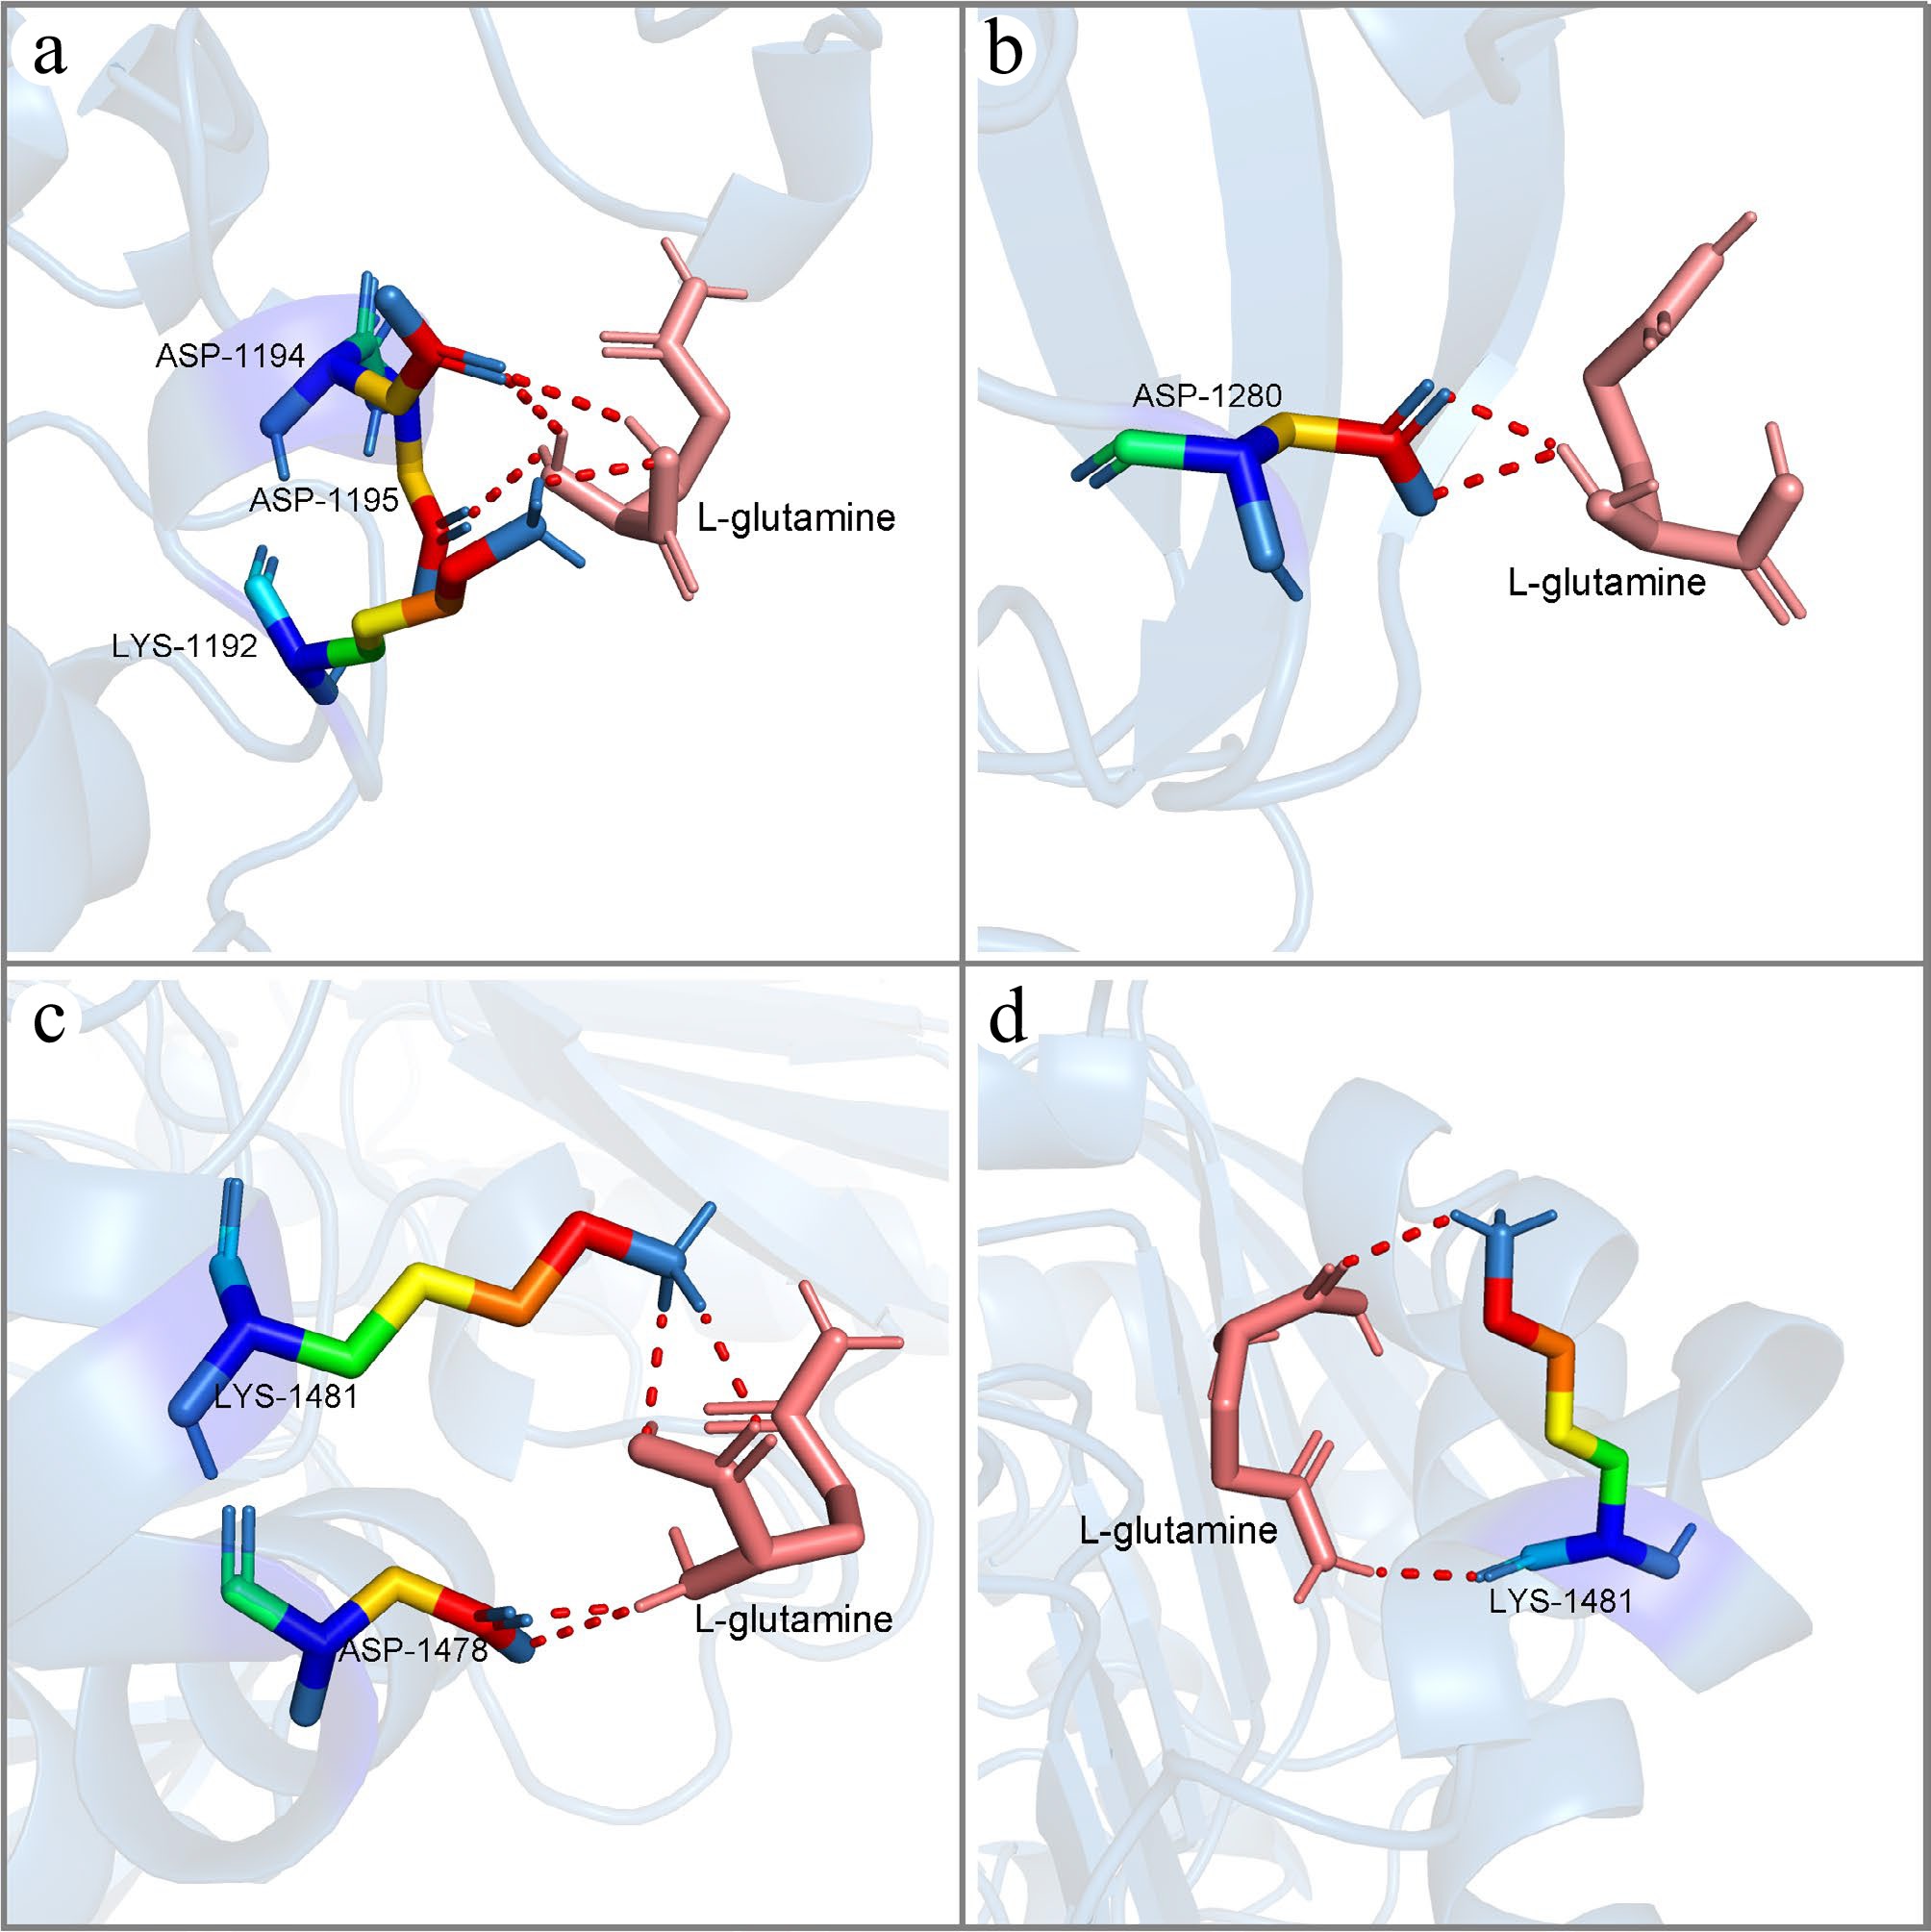
Figure 13.
The molecular conformations of LrFd-GOGAT and LbFd-GOGAT in docking with L-glutamine. (a) and (b) show the two lowest binding energy conformations of LbFd-GOGAT docked with L-glutamine, respectively; (c) and (d) show the two lowest binding energy conformations of LrFd-GOGAT docked with L-glutamine, respectively.
-
Given the crucial role of nitrogen assimilation in plant growth, GS, GOGAT, and GDH genes from numerous species have been identified and functionally characterized. Currently, two types of GOGAT proteins, Fd-GOGAT and NADH-GOGAT, have been found in most higher plants[45−48]. However, the number of GOGAT-encoding genes varies significantly across different plant lineages. For instance, the genomes of tomato[49] and pine (Pinus taeda)[50] each contain one Fd-GOGAT gene and one NADH-GOGAT gene; the rice genome[51] has two genes encoding NADH-GOGAT proteins and one gene encoding Fd-GOGAT; the genomes of Populus trichocarpa[52] and Carya illinoinensis[53] each contain four GOGAT genes, with two encoding Fd-GOGAT proteins and two encoding NADH-GOGAT proteins; and the wheat genome contains six GOGAT genes, with three encoding Fd-GOGAT proteins and three encoding NADH-GOGAT proteins[54]. This study identified two GOGAT genes in both L. ruthenicum and tomato genomes, each encoding one Fd-GOGAT and one NADH-GOGAT protein. These findings suggest that GOGAT genes may have undergone duplication, loss, or functional divergence during the evolution of different plant lineages. However, the evolution of GOGAT genes in Lycium species or Solanaceae appears to be relatively stable, potentially indicating a consistent key role in nitrogen assimilation. Tomato and pine Fd-GOGAT genes contain 33 exons[49,50]. The results in this study are consistent with this, as Lycium species' Fd-GOGAT genes also contain 33 exons. However, the intron lengths in Lycium species' Fd-GOGAT genes are significantly longer than those in tomato, a phenomenon also observed in other woody plants, such as pine, where the longest Fd-GOGAT intron reaches 50 kb. The gene structure of NADH-GOGAT varies considerably between species. This study found that Lycium species' NADH-GOGAT contains 23 exons, consistent with the structure in tomato. However, NADH-GOGAT in other species has been found to have 22 (pine)[50] or 20 (rice, Carya illinoinensis)[51] exons. Notably, the intron lengths of the NADH-GOGAT gene are relatively conserved across most species. These results indicate that the coding regions of plant Fd-GOGAT genes are evolutionarily conserved, but the non-coding regions are longer in woody plants, suggesting more complex regulatory mechanisms in woody plants compared to herbaceous plants. The evolutionary strategy of NADH-GOGAT differs from that of Fd-GOGAT, mainly manifesting in significant variation in the coding regions of NADH-GOGAT across different lineages, which may reflect differences in protein function.
In higher plants, GS proteins are encoded by multiple genes, including two isoforms: GS1 and GS2. However, there is considerable variation in the number of genes encoding GS1 and GS2 proteins among different plant lineages. In angiosperms, the number of genes encoding the GS2 isoform is typically only one, whereas the number of genes encoding the GS1 isoform usually ranges from two to five[55−57]. In this study, it was observed that there is one gene encoding GS2 in Lycium species, which is consistent with previous findings, indicating that GS2 has evolved in a highly conserved manner in plants. Unexpectedly, one to three GS1 genes in Lycium species were identified, with only one GS1 gene found in the transcriptome of white fruit of L. ruthenicum. This discrepancy might be related to false negatives in de novo transcriptome assembly[58], as three GS1 genes were identified in the genomes of both L. ferocissimum, L. ruthenicum and L. barbarum. Therefore, this study speculates that the Lycium species genome contains three GS1 genes, and their evolution is highly conserved, as they maintain a high degree of consistency in the number of family members, gene structure, and motifs. GDH is present in various tissues of plants and is responsible for catalyzing the formation of Glu from α-ketoglutarate and NH4+[59]. Plants possess unique GDH isoenzymes that are specific to either NAD or NADP[60]. NAD-specific GDH is located in the mitochondria[61], while NADP-utilizing GDH is found in the chloroplasts[62]. In plants, GDH enzymes are usually homo- or heteromultimers composed of four or six subunits; thus, plants generally contain at least two GDH genes encoding two GDH polypeptide subunits. In Arabidopsis, there are three NAD-specific GDH genes and one NADP-specific GDH, namely AtGDH1, AtGDH2, AtGDH3, and NADP-GDH[63]. Five GDH genes have been identified in tomato[64], including four NAD-specific GDH genes and one NADP-specific GDH, which is consistent with the results identified in this study. In this study, four GDH genes in Lycium species were discovered, including one NADP-GDH and three NAD-specific GDH genes. The NADP-GDH and GDH4 are highly conserved, but GDH2 and GDH3 may have been lost in some species during evolution.
The response patterns of GS, GOGAT, and GDH to salt stress in L. ruthenicum
-
The GS/GOGAT cycle is the primary ammonium assimilation pathway in plants. Previous studies have reported that the GS/GOGAT cycle accounts for approximately 95% of total ammonium assimilation, whereas the GDH assimilation pathway contributes only about 5% to total ammonium assimilation. Therefore, changes in the expression levels of GS and GOGAT are crucial for NH4+ assimilation in plants under salt stress. Studies have found that, compared to salt-sensitive strains, salt-tolerant strains exhibit higher transcriptional levels and enzyme activity of GOGAT, as reported in various species such as soybean and wheat[17,65]. Hence, variations in GOGAT enzyme activity are often used to assess plant tolerance to salt stress in subsequent research. Numerous studies have shown that Fd-GOGAT is primarily expressed in photosynthetic tissues and is mainly responsible for assimilating NH4+ produced by photorespiration and NO3− reduction[8]. This study revealed that the Fd-GOGAT gene in black wolfberry is predominantly expressed in leaves, and its expression tends to be downregulated as NaCl concentrations increase and stress duration lengthens. It is well known that salt stress inhibits chlorophyll production and reduces the photosynthetic rate in green plants, leading to a significant decrease in NH4+ content generated by photosynthesis[66]. Since NH4+ is the substrate for the GS/GOGAT cycle, the reduction in its levels slows down the cycle, which may primarily account for the decreased expression of LrFd-GOGAT in leaves. Additionally, LrNADH-GOGAT is also expressed in leaves, although at much lower levels compared to LrFd-GOGAT, consistent with previous findings, where NADH-GOGAT activity constitutes only 3% of total GOGAT activity in leaves[67]. Similarly, the expression of LrNADH-GOGAT is significantly downregulated under salt stress, and compared to LrFd-GOGAT, the downregulation of LrNADH-GOGAT is more pronounced, continuously decreasing with higher salt concentrations and prolonged stress durations. Research on rice has shown that NADH-GOGAT is mainly distributed in leaf phloem tissues and plays a significant role in the transport of nitrogen compounds[68], further supporting the notion that the reduction in leaf GOGAT activity is likely due to substrate depletion. In roots, GOGAT primarily assimilates NO3− and NH4+ absorbed by the root system[69]. Excessive salinity can competitively inhibit the uptake of NO3− and NH4+ by Cl− and Na+, leading to reduced nitrogen uptake and decreased expression of nitrogen assimilation genes in the roots[70]. In this study, both LrNADH-GOGAT and LrFd-GOGAT were expressed in the roots, and their expression levels were significantly upregulated under severe salt stress and after 12 h of stress. This finding is inconsistent with previous studies. Apart from the GS/GOGAT pathway for inorganic nitrogen assimilation, plants also possess the GDH pathway, which has a lower affinity for NH4+[69,70]. Typically, under salt stress, the reduction in NH4+ levels and the decline in assimilation enzyme activity prompt plants to activate the GDH pathway for NH4+ assimilation. However, this study found that the expression of GOGAT genes in the roots of black wolfberry did not decrease but instead was upregulated. This suggests that under salt stress, the roots of black wolfberry may accelerate NH4+ assimilation via the GS/GOGAT pathway, an evolutionary strategy that helps maintain a substantial nitrogen supply in the roots even under extreme salt stress.
The high expression of GS genes is one of the primary strategies for plants to maintain NUE under salt stress. Studies in rice have shown that overexpression of OsGS2 can significantly enhance the photosynthesis and salt tolerance of transgenic rice plants[71]. GS2 is mainly expressed in photosynthetic tissues, assimilating NH4+ from nitrate reduction and photorespiration in leaves, whereas GS1 assimilates NH4+ from other metabolic processes[72]. This is consistent with the findings of this study, where we found that LrGS2 is the predominantly expressed gene in leaves, and LrGS1.1 is the predominantly expressed gene in roots. Research on most plants has shown that salt stress reduces the expression levels and enzymatic activity of GS genes, primarily related to nitrogen uptake under salt stress. Similar to GOGAT, salt stress leads to a decrease in the substrates available for GS activity. This study found that the expression levels of most LrGS genes were downregulated under salt stress, but the upregulation of LrGS2 in leaves and LrGS1.1 in roots was not coincidental. We observed that the upregulation of LrGS occurred 1 h after salt stress, while the upregulation of LrGOGATs occurred 12 h after exposure to 2.5% NaCl. This suggests that under salt stress, Lycium ruthenicum may maintain high NUE by highly expressing its major genes to alleviate the nutrient uptake deficiency caused by salt stress. Although the contribution of GDH to nitrogen assimilation in plants is minimal, it is considered to be a primary backup pathway for nitrogen assimilation under environmental stress. This is supported by multiple experiments showing that the expression levels and enzymatic activity of GDH are upregulated under salt stress[73]. In this study, it was found that the expression of LrGDHs was mostly downregulated under salt stress, especially in leaves, where all four GDH genes were downregulated. Notably, the expression of NADP-GDH and LrGDH2 in roots was continuously upregulated with increasing salt concentration and duration of stress. These findings suggest that GDH is not the main nitrogen assimilation pathway in the leaves of Lycium ruthenicum under salt stress. GDH directly catalyzes the production of Glu from ammonium and 2-oxoglutarate (2-OG), and this reaction is reversible. An increase in GDH enzymatic activity may, on one hand, lead to an increase in 2-OG, which can enter the tricarboxylic acid (TCA) cycle to provide energy for plant metabolic activities[74]. On the other hand, proline, as an osmotic regulator, plays a major protective role in plants under osmotic stress. The synthesis of proline from Glu is a primary pathway selected by plants under salt stress[75]. Previous studies have shown that the proline content in the leaves and roots of L. ruthenicum significantly increases under salt stress, and the content in roots is significantly higher than in leaves. Therefore, the upregulation of NADP-GDH and LrGDH2 in roots may be associated with increased proline synthesis in root tissues.
Transcription factors regulate the transcription of nitrogen transporters, assimilation enzymes, and signaling molecules to ensure plant nitrogen availability under adverse conditions[68]. Gaudinier et al. constructed a transcriptional regulatory network involving 21 transcription factors associated with plant nitrogen metabolism pathways and found that transcription factors from families such as C2H2(ZFP), ERF, and DOF play crucial regulatory roles in nitrogen metabolism. Specifically, ZFP7, ERF070, and DOF1.5 are all involved in the NH4+ assimilation process[76]. Under nitrogen-deficient conditions, wheat can alleviate stress damage caused by low nitrogen by upregulating TaZFP593. Transgenic TaZFP593 overexpressing tobacco plants exhibit increased nitrogen accumulation under nitrogen deficiency and can upregulate GS activity to enhance nitrogen assimilation[77]. In nitrogen-deficient environments, the overexpression of Dof1 in maize, a transcriptional activator involved in organic acid metabolism, can improve plant growth and amino acid levels (Gln and Glu), reduce glucose levels, enhance nitrogen assimilation, and increase the nitrogen content in Arabidopsis[78]. Overexpression of ZmDof1 enhances nitrogen uptake, assimilation, and N and C levels in transgenic rice, leading to increased photosynthesis rates and biomass in the transgenic plants[79]. These findings demonstrate that Dof transcription factors are involved in regulating the nitrogen assimilation process in plants. This study found that 19 TF families may be involved in the regulation of the seven nitrogen assimilation-related genes in L. ruthenicum, with C2H2, Dof, GRAS, AP2, and BBR-BPC being the TF families with the most binding sites. Expression analysis and molecular docking suggest that C2H2-63 likely plays a key role in maintaining nitrogen assimilation in L. ruthenicum under salt stress, likely by promoting this process through its upregulated exxpression.
The adaptive evolutionary mechanism of LrFd-GOGAT
-
With the advancement of gene editing technologies, base editing techniques can rapidly and precisely improve specific genetic traits in crops[80]. Therefore, discovering loci associated with beneficial agronomic traits is of great importance in crop breeding. Black wolfberry, having long survived in desert saline-alkaline regions, exhibits strong adaptability to saline-alkaline environments[81]. This study found that the protein encoded by LrFd-GOGAT has seven amino acid sites under strong positive selection pressure. The p.Leu1322Phe mutation results in an additional helical structure between Phe1322 and Ser1327 in the LrFd-GOGAT protein, which may increase the stability of the FMN domain. In the Fd-GOGAT protein, there is an amino channel between the N-terminal amidotransferase domain and the FMN domain. The N-terminal amidotransferase domain marks the beginning of the amino channel and contains the binding site for L-glutamine. L-glutamine enters the amino channel via the N-terminal amidotransferase domain[82]. Under saline-alkaline conditions, protons are continuously pumped into the thylakoid lumen, but the alkaline conditions may inhibit the function of ATP synthase, preventing protons from effectively returning to the stroma through ATP synthase. This leads to a decrease in proton concentration in the chloroplast stroma and an increase in pH[83]. The isoelectric point of L-glutamine is 5.65, and as the pH of the chloroplast stroma increases, L-glutamine acquires more positive charges. The p.Glu223Ala and p.Ala391Phe mutations increase the electrostatic potential of the N-terminal amidotransferase domain, which may enhance the electrostatic attraction for L-glutamine under alkaline conditions[84], allowing L-glutamine to rapidly bind to the N-terminal amidotransferase, thereby improving the catalytic efficiency of LrFd-GOGAT. This is consistent with the results of molecular docking, which show that LrFd-GOGAT has a higher affinity for L-glutamine compared to LbFd-GOGAT.
Additionally, this study found that p.Ala883Thr and p.Leu1322Phe are located in unstructured loops, and their mutations increase the hydrophilicity of the corresponding regions. Meanwhile, p.Glu223Ala, p.Ala391Phe, p.Ser924Leu, p.Ser1353Ala, and p.Ser1573Cys are located in helical structures, and their mutations increase the hydrophobicity of the respective regions. Hydrophilic amino acids can typically form hydrogen bonds with water molecules and other polar molecules, thereby enhancing the solubility and stability of proteins under alkaline conditions[85]. In alkaline environments, the higher pH may affect the charge distribution and hydrogen bonding network of proteins, leading to the disruption of helical structures[86]. Mutations that increase hydrophobicity can enhance hydrophobic interactions within the helical core, thereby stabilizing the helical structure and preventing it from unwinding or unfolding under alkaline conditions[87]. Therefore, the mutations at these sites may also increase the hydrophilicity and stability of LrFd-GOGAT, which is beneficial for maintaining functional stability under alkaline conditions.
-
Through the identification and functional analysis of GS, GOGAT, and GDH genes in Lycium species, this study revealed the transcriptional regulatory patterns and evolutionary mechanisms of black wolfberry under salt stress. The genomes or transcriptomes of Lycium species contain two to four GS genes, two GOGAT genes, and three to four GDH genes. Under salt stress, the predominantly expressed GS genes in the black wolfberry family, LrGS2 and LrGS1.1, were significantly upregulated after salt stress, and the expression of GOGAT genes was upregulated under severe salt stress. These results indicate that black wolfberry may accelerate the assimilation of NH4+ through the GS/GOGAT pathway to maintain nitrogen supply in both roots and leaves. In addition, the transcription factor C2H2-63 positively regulates the expression of nitrogen assimilation genes in black wolfberry, thereby participating in the regulation of nitrogen metabolism under salt stress. The study also identified mutations in the LrFd-GOGAT protein at specific amino acid sites, which may enhance the protein's stability and catalytic efficiency under alkaline conditions. These findings provide new insights for breeding crops with enhanced salt tolerance.
This work was supported by grants from the Gansu Provincial Higher Education Support Program (Grant No. 2023CYZC-46), the Natural Science Foundation of Gansu Province (Grant No. 24JRRG016), the National Natural Science Foundation of China (Grant No. 32460055), the Scientific Research Startup Fund for Talent Introduction at Gansu Agricultural University (Grant No. GAU-KYQD-2021-36), and the Outstanding Doctoral Project of Gansu Provincial Science and Technology Program (25JRRA387).
-
The authors confirm their contributions to the paper as follows: study conception and design: Qi J, Zhao J, Lu S, Ma Y, Du W, Zhang X; data collection: Qi J, Zhao J; analysis and interpretation of results: Qi J, Zhao J, Lu S, Ma Y, Zhou X, Song Q, Xing L; draft manuscript preparation: Qi J, Zhao J. All authors reviewed the results and approved the final version of the manuscript.
-
All data generated or analyzed during this study are included in this published article and its supplementary information files.
-
The authors declare that they have no conflict of interest.
-
# Authors contributed equally: Jianwei Qi, Jun Zhao
- Supplementary Fig. S1 Alignment of Fd-GOGAT sequences in Lycium species.
- Supplementary Fig. S2 Ramachandran plot of protein structure. (a) belongs to LrFd-GOGAT; (b) belongs to LbFd-GOGAT.
- Copyright: © 2025 by the author(s). Published by Maximum Academic Press, Fayetteville, GA. This article is an open access article distributed under Creative Commons Attribution License (CC BY 4.0), visit https://creativecommons.org/licenses/by/4.0/.
-
About this article
Cite this article
Qi J, Zhao J, Lu S, Song Q, Xing L, et al. 2025. Molecular evolutionary analysis and expression patterns of nitrogen assimilation-related gene families in Lycium ruthenicum under salt stress. Fruit Research 5: e033 doi: 10.48130/frures-0025-0025 

Molecular evolutionary analysis and expression patterns of nitrogen assimilation-related gene families in Lycium ruthenicum under salt stress
- Received: 07 January 2025
- Revised: 09 June 2025
- Accepted: 16 June 2025
- Published online: 26 August 2025
Abstract: Nitrogen assimilation plays a critical role in the response of plants to salt stress. In this study, bioinformatics and computational biology methods were employed to identify members of the Lycium GS, GOGAT, and GDH gene families, and analyzed their expression patterns and transcriptional regulatory networks under salt stress in black wolfberry (Lycium ruthenicum). In addition, the adaptive evolutionary mechanisms of the black wolfberry Fd-GOGAT gene were explored. The results showed that the genomes or transcriptomes of Lycium species contain two to four GS genes, two GOGAT genes, and three to four GDH genes. Following NaCl stress, the expression of Fd-GOGAT and NADH-GOGAT in the leaves of black wolfberry was downregulated with increasing time and NaCl concentration; in the roots, Fd-GOGAT and NADH-GOGAT were upregulated by 1.79-fold and 1.40-fold, respectively, 12 h after severe NaCl stress. GS2 and GS1.1 are highly expressed in leaves and roots, respectively, and their expression is significantly upregulated under NaCl stress. The expression of GDH in leaves is downregulated under salt stress, whereas in roots, the expression of NADP-GDH and GDH2 is upregulated under NaCl stress. C2H2-63, a key transcription factor regulating nitrogen assimilation in black wolfberry under salt stress, is likely to promote nitrogen assimilation through its upregulated expression. Additionally, seven positively selected sites (p.Glu220, p.Ala388, p.Ala880, p.Ser921, p.Leu1319, p.Ser1350, and p.Ser1570) were found in the Fd-GOGAT protein of black wolfberry. Compared to Ningxia wolfberry (L. barbarum), these mutation sites enhance the affinity of Fd-GOGAT for its substrate Glu, which helps to increase the catalytic efficiency of Fd-GOGAT in black wolfberry under salt stress. In conclusion, the adaptation of salt stress-related nitrogen assimilation genes in black wolfberry involves both gene expression regulation and adaptive evolution. Enhancing the GS/GOGAT pathway under salt stress is a primary strategic choice for nitrogen assimilation in black wolfberry.
-
Key words:
- Black wolfberry /
- Nitrogen assimilation /
- Salt stress /
- Molecular evolution /
- Protein structure