


-
Lucerne (Medicago sativa L.) is one of the world's most important legume forage crops, and it is known for its high protein content (18%−22%), perennial nature, longevity, and strong adaptability to varied climatic conditions[1]. It can continuously produce high-quality green fodder from the same field for three to four years[2]. It also fixes atmospheric nitrogen and, therefore, plays a significant role in the ecosystem's nitrogen cycle[3].
Exploring genetic variation more precisely and independently of the environment is made possible by DNA-based molecular markers. In lucerne, various DNA-based markers employed to study genetic diversity, such as Random Amplified Polymorphic DNA (RAPD)[4], Amplified Fragment Length Polymorphism (AFLP)[5], Restriction Fragment Length Polymorphism (RFLP)[6], Simple Sequence Repeat (SSR)[7] and Sequence Related Amplified Polymorphisms (SRAP)[8]. Inter Simple Sequence Repeat markers (ISSRs) were demonstrated as simple, quick, reliable, and highly polymorphic marker systems. Therefore, ISSRs have been successfully utilized to estimate genetic diversity in lucerne[2,9,10].
Lucerne is known to be moderately tolerant to salinity, but its productivity has been hampered due to salinity in different parts of the world. Lucerne has significant variability for salt tolerance, which is advantageous for the selection and breeding of developing tolerant genotypes to salinity[11,12].
The production of high-value crops is drastically reduced under abiotic stresses. Among the abiotic stresses, salinity is a major environmental problem that hampers plant growth and productivity[13−15]. In the world, approximately 230 million ha of irrigated land was affected by salinity[16]. In India, 23 million ha were affected by salinity[17]. Salts are present in all types of soil and irrigation water, and essential components of soil, such as nitrates and potassium, are essential nutrients for plants. The soil salinization is accelerated mainly by crop irrigation and other factors such as weathering, soil amendments, inorganic fertilizers, water, pesticides, herbicides, etc.[18]. Saline soil contains high concentrations of soluble salts, mostly NaCl, and also Na2SO4, CaSO4, and KCl. Salinity affects almost all phases of plant development, including seed germination, seedling growth, vegetative phase, flowering, fruiting, plant physiology, metabolism, photosynthetic efficiency, nutrient uptake and transport, inhibition of enzyme activities, etc.[13,19]. In the case of legumes, salinity also affects the symbiotic nitrogen fixation capacity[14]. Additionally, it was noted that there is a greater prevalence of salinity susceptibility during the germination and seedling stages of legume crops[15].
In a plant's life cycle, seed germination is the critical stage. Salinity is one of the major limiting factors that affect seed germination. The germination stage became vital because it could regulate the growth and adaptability of the crop in saline environments[20]. Sodium chloride in soil or irrigation reduces the rate and ability of germination. The ingestion of poisonous Na+ and Cl− ions or the creation of low osmotic potential by blocking water uptake both impact germination. These ions inhibit the hydrolysis of reserves from stored tissues and their translocation from storage tissues to growing embryos, as well as changing specific enzymatic or hormonal activities of seeds[11,21,22]. The selection criteria of salt tolerance genotypes at early developmental stages can provide more efficient knowledge about the tolerance mechanism[13]. In alfalfa, genotypes are mainly responsible for abiotic stress tolerance, such as tolerance response expressed at the early growth stage[20]. For the selection of genotypes suitable for cultivation under saline soil, it is necessary to evaluate available genetic resources for salt tolerance and study the mechanism for the tolerance[23].
In the present study, to understand the adaptability of lucerne to salt stress during germination, we evaluated the salt tolerance of ten different genotypes of lucerne under five different salt concentrations (0 to 342 mM NaCl) at germination and the early seedling growth stage.
-
The study was conducted at Central Research Station, BAIF Development Research Foundation, Pune, Maharashtra, India. Freshly harvested seeds of ten genotypes of lucerne viz; Krishna, Alamdar-51, Anand-2, AL-3, Kutchi Selection, RL-88, BAL-08-01, CO-1, CO-4, BAIF Lucerne-4 were used for the present study.
DNA extraction and ISSR amplification
-
Each lucerne genotype's leaves were ground to fine powder in liquid nitrogen, and 100 mg of the leaf powder was used to extract DNA using a modified CTAB method[24]. The quality and quantity of the genomic DNA were checked by 1% Agarose gel electrophoresis and Nanodrop (Thermo, India). A total of 32 ISSR (Inter Simple Sequence Repeats) primers were screened previously[2] based on polymorphism and reproducibility; nine primers were selected in this study (Table 1). PCR was performed for a 20 µL final volume containing 2× Go Taq green master mix (Promega, India), one mM ISSR primer, and 20 ng genomic DNA. PCR water was used to adjust the final volume. PCR amplification was carried out in a thermo-cycler (MJ research PTC-200) with an initial denaturation at 94 °C for 5 min, followed by 45 cycles at 94 °C for 30 sec, annealing at 50 °C for 45 sec. Extension at 72 °C for 60 sec and the final extension step at 72 °C for 5 min[25]. The amplified products were separated on a 2.0% agarose gel in 1.0× TAE buffer, and bands were detected by Ethidium-Bromide staining. Stained gels were documented using a gel documentation system (BIO-RAD, India). All well-resolved, distinct bands were scored manually for the presence (1) or absence (0) of bands.
Table 1. Comparison of primers, number of fragments scored, number of polymorphic bands, and percentage polymorphism.
Primer repeat Total no.
of bandsNo. of polymorphic bands % Polymorphic bands PIC SPI (AG)8Y*T 12 12 100.00 0.37 3.72 (AC)8G 8 5 62.50 0.47 4.72 (AC)8Y*T 20 18 90.00 0.43 4.27 (AT)8G 11 11 100.00 0.40 4.00 (CA)8R*C 13 12 92.31 0.42 4.19 (CA)8R*G 11 9 81.82 0.45 4.46 (AG)8Y*A 14 9 64.29 0.47 4.66 (CA)8A 6 4 66.67 0.34 3.39 (AG)8C 8 6 75.00 0.45 4.47 Total 103 86 83.50 * Y = C or T (Pyrimidine), and R = A or G (Purine). Salinity conditions
-
Natural salt NaCl was used to create salinity conditions. Control and four treatment groups were selected with gradually increasing salt concentration labeled as T1 (0 mM NaCl Control), T2 (85.55 mM = 0.5% NaCl), T3 (171 mM = 1% NaCl), T4 (256 mM = 1.5% NaCl) and T5 (342 mM = 2% NaCl). The NaCl concentration had electrical conductivity (EC) values of 0.0024, 8.71, 17.18, 25.61, and 34.15 dS/m, respectively.
Preparation of salt concentration
-
0.5, 1, 1.5, and 2% NaCl solutions were prepared by dissolving 0.5, 1, 1.5, and 2 g of NaCl (ACS 99.9%, SRL, India), respectively, in 100 mL of distilled water.
Seed germination test
-
The germination paper was soaked in a solution with the desired NaCl concentration; it was soaked in distilled water for control. One hundred homogeneous-sized seeds of each genotype were placed on a double-layered pre-soaked germination paper and rolled. The rolled papers with seeds were covered with butter paper to avoid moisture loss. The seeds were allowed to germinate at 25 ± 1 °C in a seed incubator[26]. The experiment was repeated twice in a Completely Randomized Design (CRD) with four replicates of each treatment. The germination of seeds was recorded when the radical growth was at least 2 mm long. The germinated seeds were counted every 24 h for 10 d. At the end of the germination period, the following germination indices for each genotype were calculated based on the following formula[27]:
$ \rm{G}\mathrm{ermination\; percentage}\; (\text{%}) :\rm{\ GP}=\mathrm{\dfrac{S eed\; germinated}{Total\ seeds}}\times100 $ MGT: The mean germination time is a measure of the rate of germination[28].
$\rm MGT=\dfrac{{\text Ʃ}(n \times d)}{N}\;({\rm{day}}) $ Where n = number of seeds germinated on each day; d = incubation period in days; and N = total number of seeds germinated.
CVG: The velocity coefficient of germination, which measures the rate and acceleration of seed germination, was computed using the formula below[19].
$\rm CVG=\dfrac{{\text Ʃ}Ni}{NiTi}\times 100 \;({\rm{Seed/Day}})$ Where N= Number of seeds germinated on day i, T = number of days from sowing corresponding to N.
AGR: Abnormal germination rate indicated the effect of salinity on the development of normal seedlings, was calculated using the formula
$ \mathrm{AGR=\dfrac{Number\; of\; abnormal\; germinated\; seeds}{Total\; number\; of\; seeds}}\times100 $ Other germination indices, such as germination rate (GR), germinability (Ga), germination index (GI), speed of germination (SG), and promptness index (PI), were also recorded (data was not provided). Similarly, plumule length and radical length were measured. Furthermore, the fresh weights of seedlings were recorded and kept in an oven at 80 °C. Dry weight was recorded using a digital weighing balance, and the fresh weight/dry weight ratio was calculated.
To confirm the toxic effect of salt solution on germination, the non-germinated seeds in each salt treatment were washed and transferred to distilled water and kept for germination. The germination was recorded after 4 d. The recovery percentage was estimated using a formula described below[21].
$ \text{%}\mathrm{Recovery}=\mathrm{a}-\mathrm{b/c-b}\times100 $ Where a = total number of seeds germinated after being transferred to distilled water; b = total number of seeds germinated in saline solution; c = total number of seeds.
Data analysis
-
The genetic variability was estimated by the rate of polymorphism (%) and Polymorphism Information Content (PIC)[29]. By adding the PIC values of each locus amplified by the given primer, the ISSR Primer Index (SPI) was determined. The genetic relationships among genotypes were analyzed using binary data of ISSR markers. Unweighted Pair Group Method with Arithmetic Means (UPGMA) cluster analysis with 1,000 bootstrap values, and a dendrogram was constructed using PAST 4.16 software[30].
The experimental data were statistically analyzed by two-way analysis of variance (ANOVA) to study the effect of salinity and genotypes. Then, Tukey's post hoc test (p < 0.05) was carried out to compare means to observe differences between salinity treatments using PAST 4.16 software[30]. Principal component analysis (PCA) was carried out on the germination and seedling parameters by using PAST 4.16 software[30]. A Mantel test was performed to correlate genetic distance from ISSR data with germination and seedling parameters using the same software. Regression analysis was done using MS Excel to determine the relationship between salt treatment and the parameters studied in the experiment.
A one-way ANOVA was conducted to determine the difference between the control and treatment groups for germination recovery percentage.
-
Genetic diversity among ten genotypes of lucerne was studied using ISSR markers. Nine dinucleotide primers produced a total of 103 bands, out of which 86 bands were polymorphic. Polymorphic bands ranged from 4 to 18 (Table 1). PIC value ranged from 0.34 (CA)8A to 0.47 (AG)8YA and (AC)8G. The efficiency of the maker system demonstrated by ISSR primer indeed (SPI) ranged from 3.39 (CA)8A to 4.72 (AC)8G (Supplementary Fig. S1). The dendrogram revealed that Kutchi selection out-grouped other genotypes with 100 bootstrap values (Fig. 1), and all genotypes were separated into two groups. Group I comprises five genotypes of lucerne, namely CO-1, RL-88, AL-3, BAIF Lucerne-4, and Anand-2, distinct from each other, with very low bootstrap values (values not shown). Group-II contains Alamdar-51, BAL-08-1, Krishan, and CO-4. The genotypes Alamdar-51 and BAL-08-1 were found to be distinct by 57 bootstrap values. In contrast, the genotypes Krishna and CO-4 were found to be distinct from each other by 76 bootstrap values.
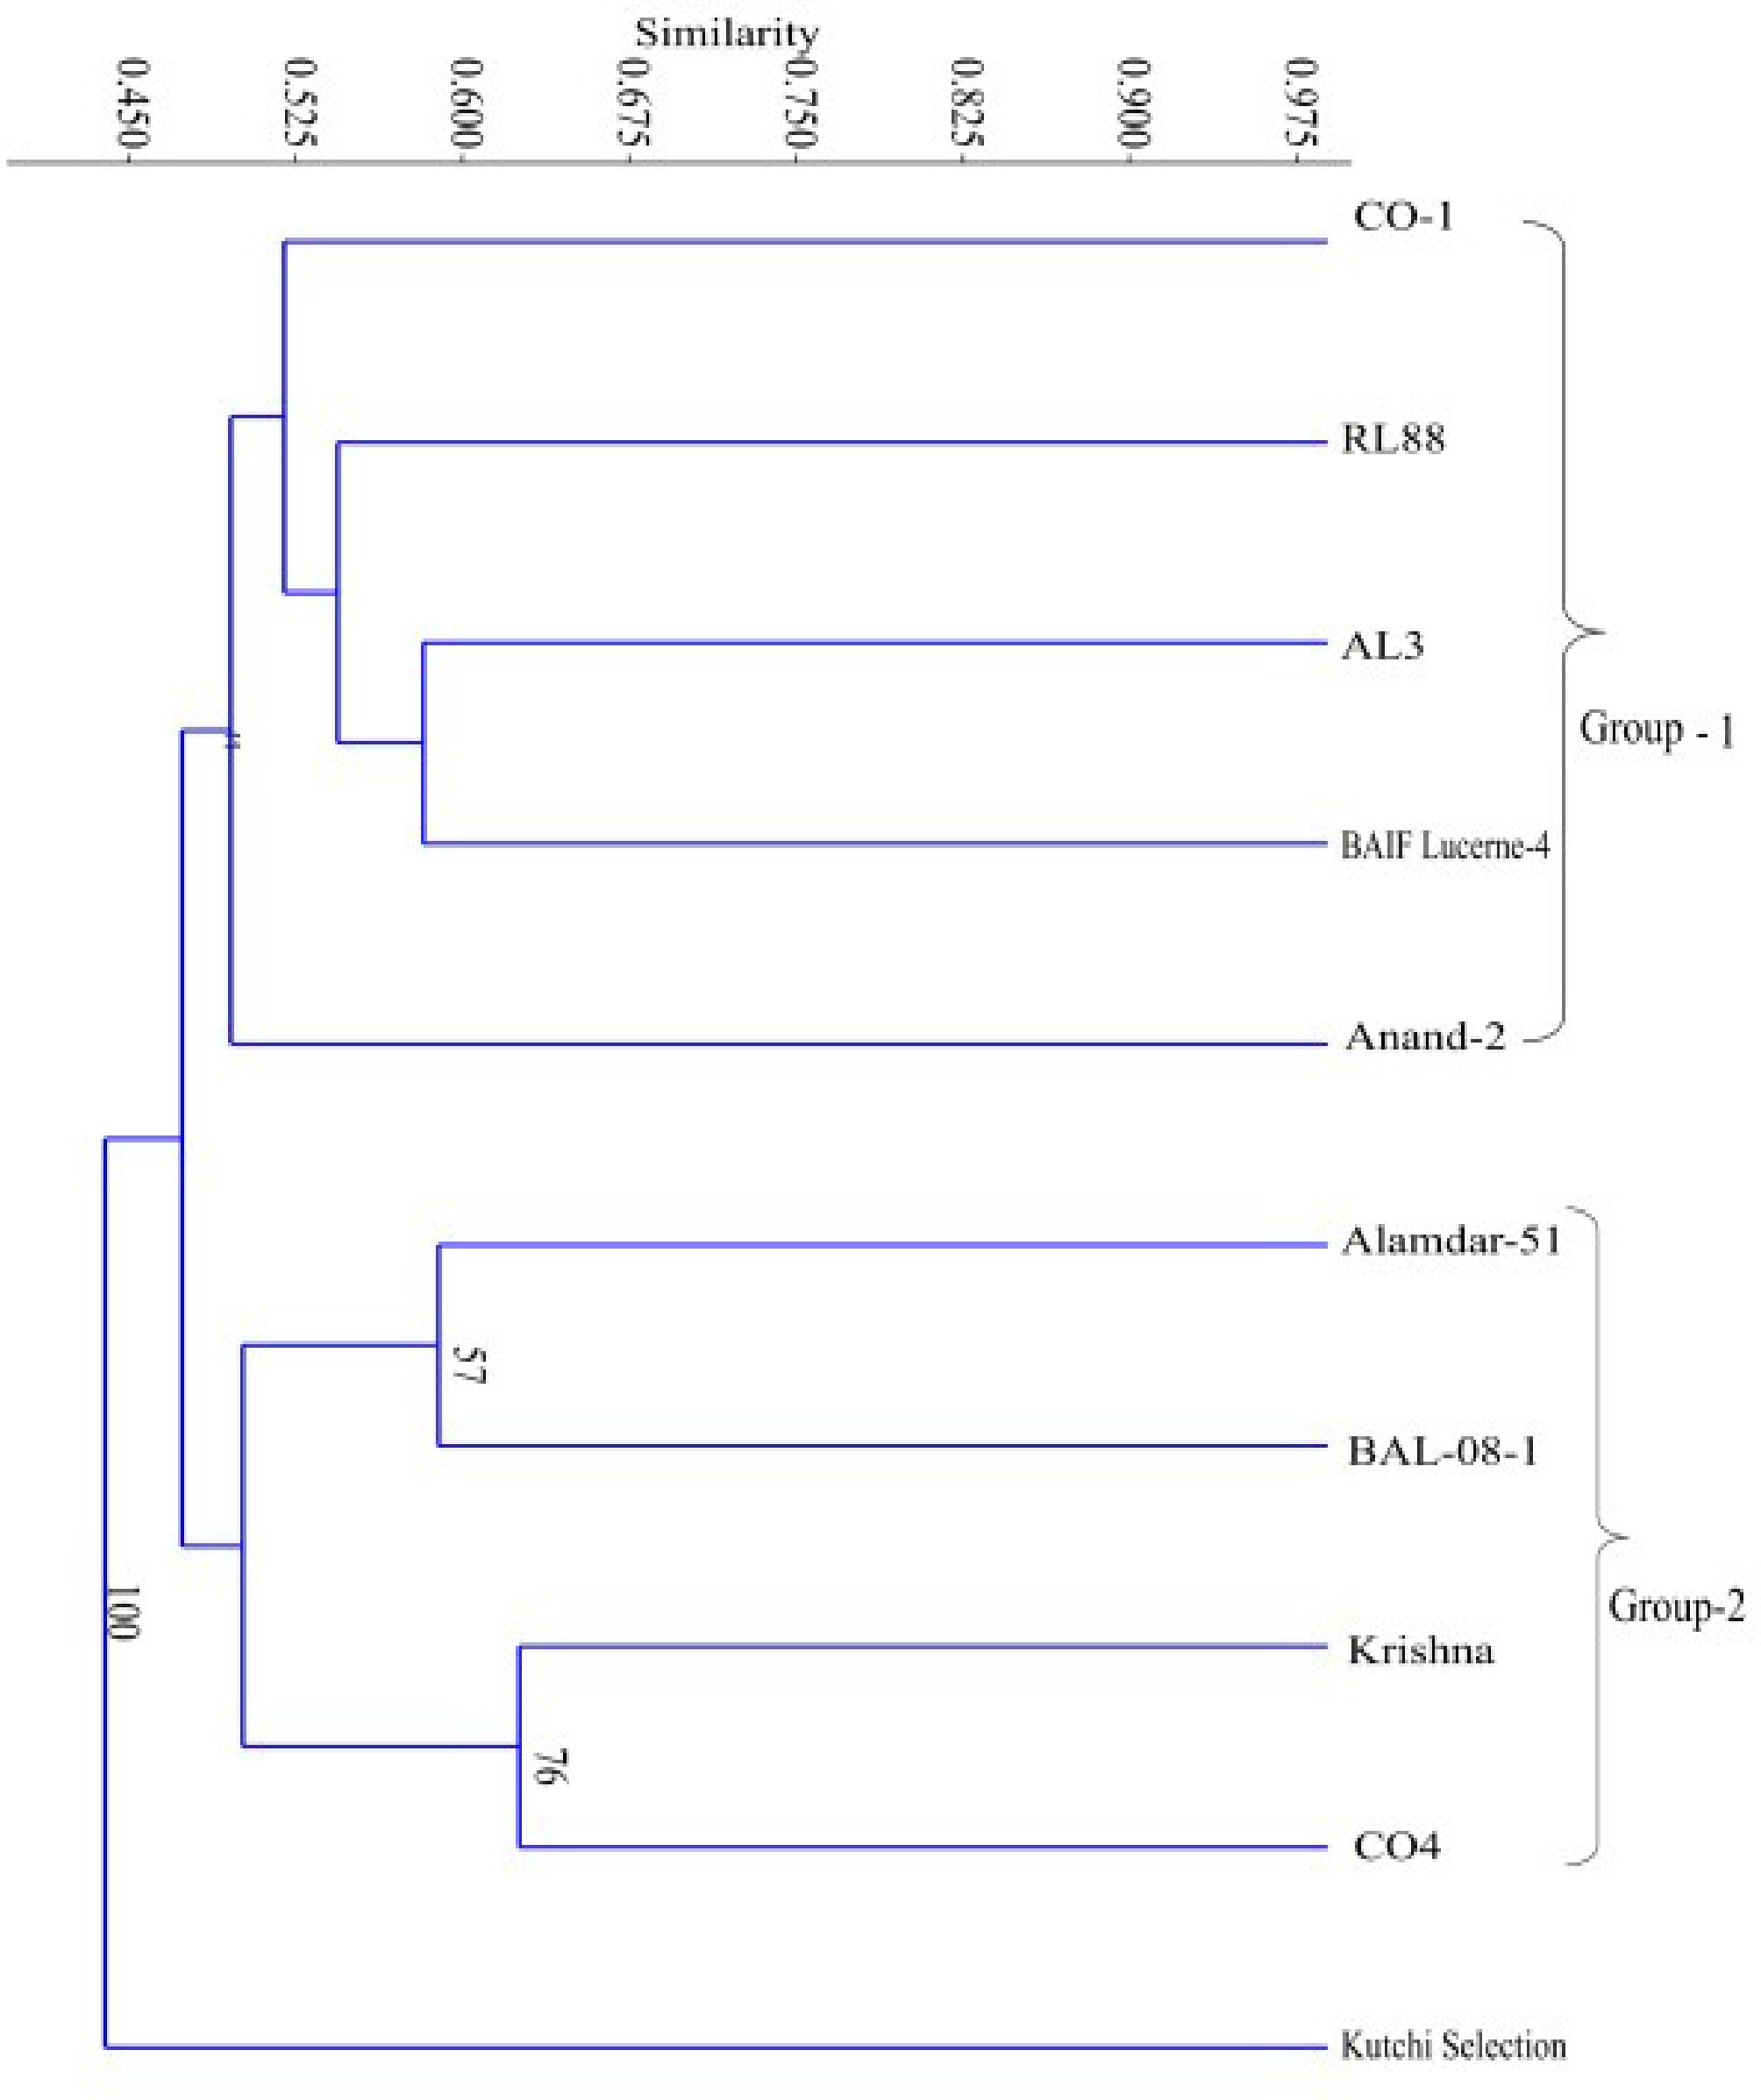
Figure 1.
Dendrogram constructed by UPGMA analysis using Jaccard coefficient of ten genotypes of lucerne using ISSR primers.
Germination indices
-
The comparison of the mean at different salinity levels with control indicated a decrease in germination performance with an increase in salinity levels (Fig. 2). The two-way ANOVA demonstrated significant differences in the genotypes, salinity treatments, and their interaction for all germination parameters except abnormal germination rate (Tables 2 & 3).
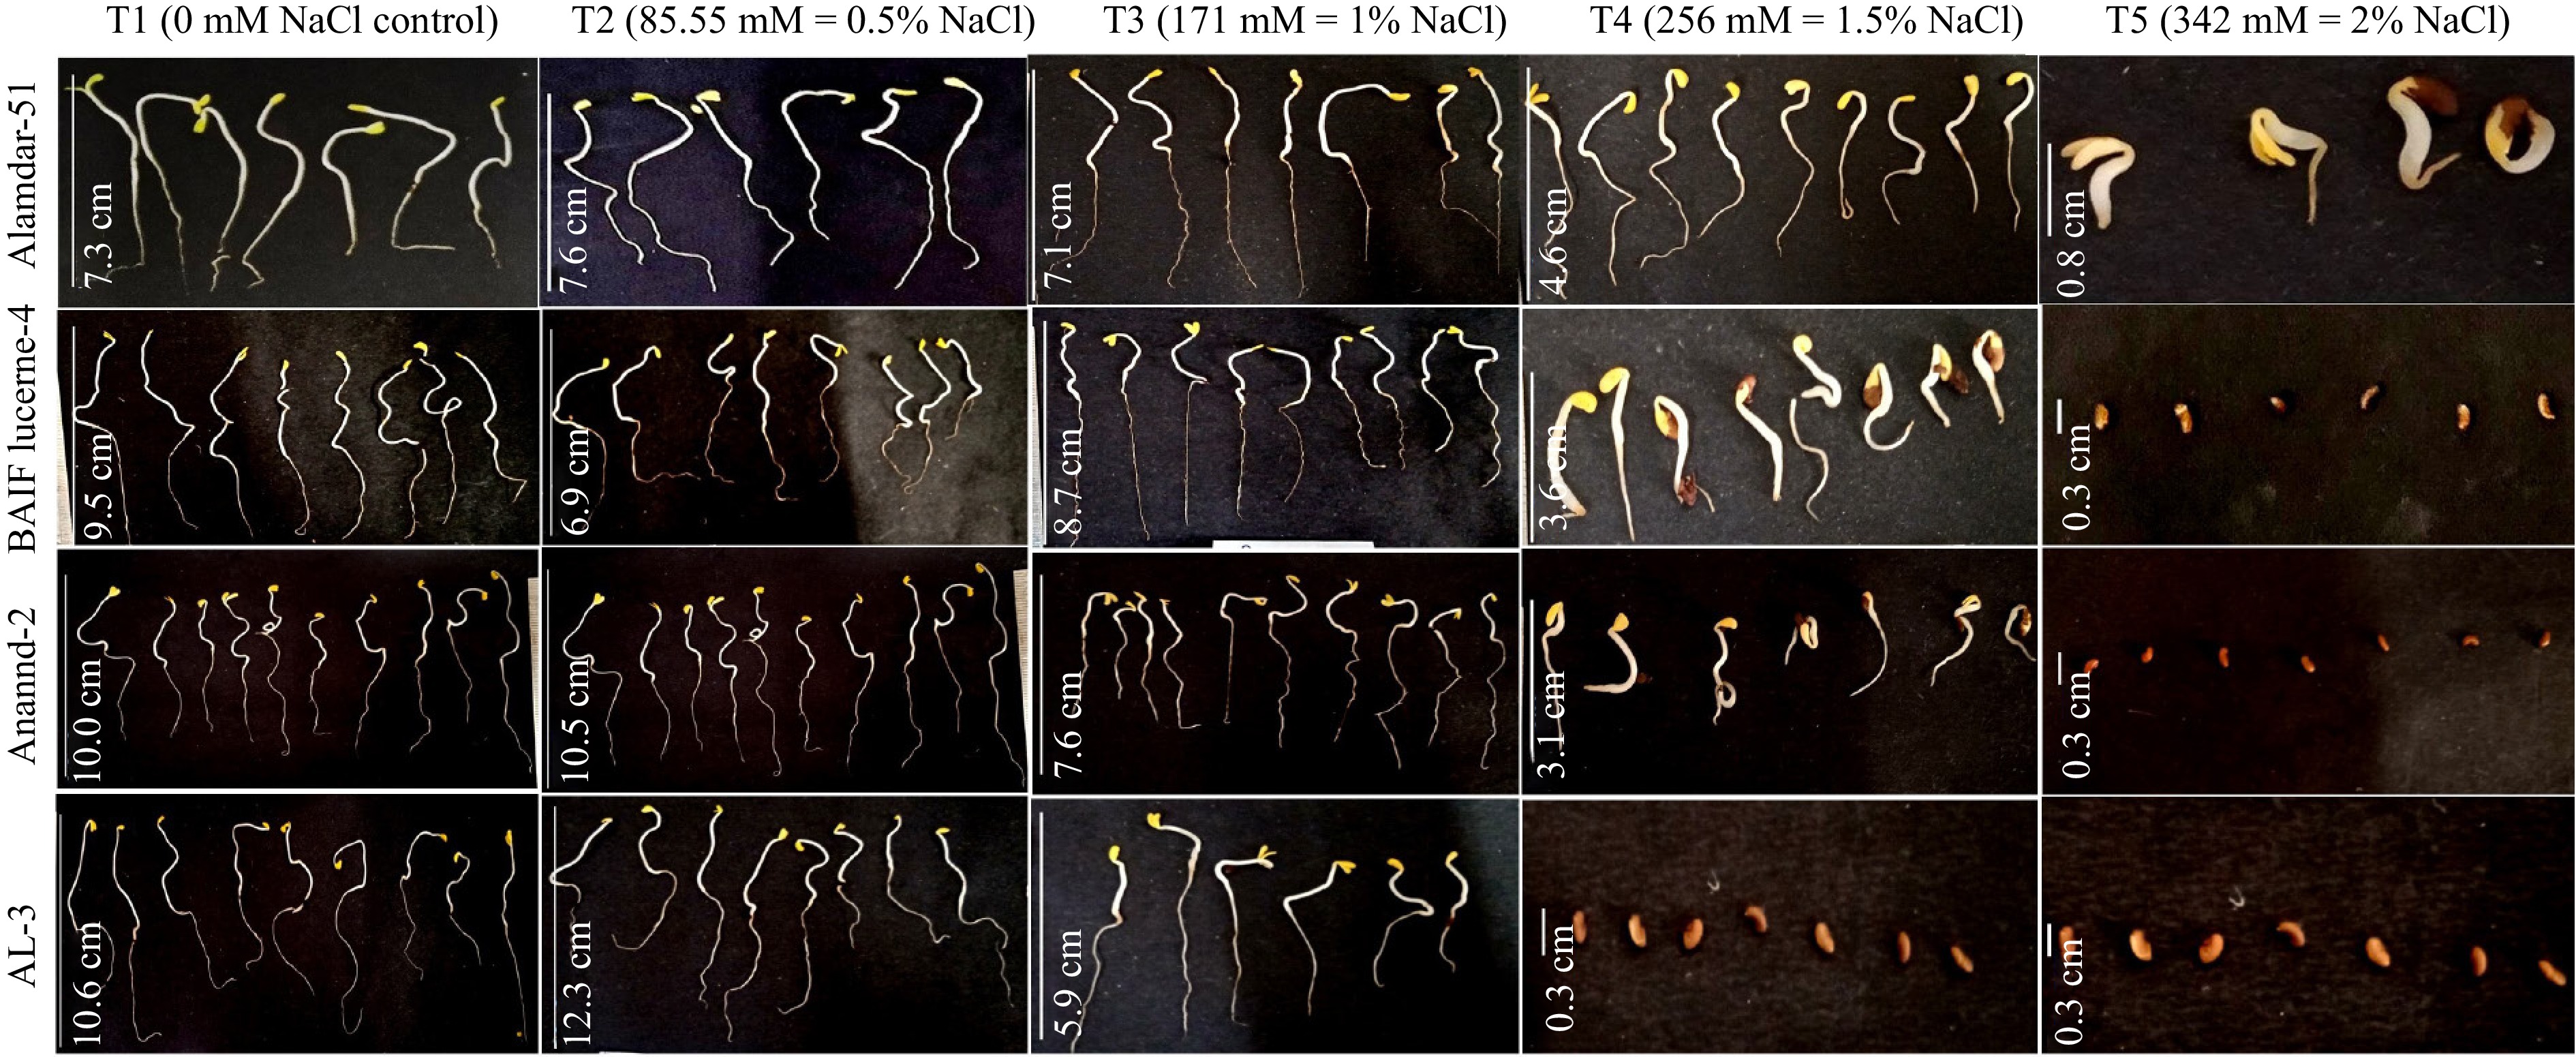
Figure 2.
The effect of various salt concentrations on seed germination and radicle elongation of selected genotypes.
Table 2. Two-way ANOVA of the effect of genotypes and salinity treatments, their interaction on the germination percentage, mean germination time, coefficient of velocity of germination, and abnormal germination rate.
Source of variance Df Germination percentage Mean germination time Coefficient of velocity of germination Abnormal germination rate MC F P MC F P MC F P MC F P Genotypes 9 2,122.63*** 20.91 1.54E-22 4.877*** 3.537 0.00053 944.705*** 12.17 2.54E-14 735.164*** 10.36 2.54E-12 Treatments 4 71,011.3*** 699.5 7.06E-96 55.88*** 40.52 5.47E-23 11,997.1*** 256.9 5.07E-66 1,979.5*** 27.9 2.52E-17 Genotypes × treatments 36 503.738*** 4.962 1.55E-12 3.92*** 2.842 5.17E-06 150.515** 1.938 0.00316 94.698NS 1.335 0.1186 df: Degree of freedom; MC: Mean square; F: ratio of variances at 0.05 level; P: p-value; *** < 0.001, ** < 0.01, NS: non-significant. Table 3. Effect of genotypes and salinity treatments and their interaction on the plumule length, radical length, and vigor index.
Source of variance Df Plumule length Radical length Vigor index MC F P MC F P MC F P Genotypes 9 3.2683*** 15.61 8.44E-18 18.87*** 18.87 8.70E-21 190,890*** 26.59 5.6E-27 Treatments 4 89.2529*** 426.4 8.20E-81 371.4*** 371.4 1.05E-76 4.88E+06*** 679.9 5.34E-95 Genotypes × treatments 36 0.505971*** 2.417 0.000112 4.221*** 4.221 2.49 E-10 42,130.6*** 5.868 4.29E-15 df: Degree of freedom; MC: Mean square; F: ratio of variances at 0.05 level; P: p-value; *** < 0.001, NS: non-significant. Germination percentage (GP)
-
Germination percentage in T1 varied from 79.5 ± 1.80% in CO-1 to 99.5 ± 0.58% in AL-3, indicating variability among the genotypes. In treatment T2, GP ranged from 68.33 ± 4.41% in BAL-08-1 to 97.50 ± 1.67% in Alamdar-51 and RL-88. The higher variability was observed in treatment T3; germination ranged from 24.7 ± 4.01% in Krishna to 81.50 ± 5.99% in Alamdar-51. In contrast, genotypes Alamdar-51 (81.50 ± 5.99%) and CO-4 (75.50 ± 1.97%) recorded the highest germination percentage. Under high salinity level treatment, T4 Alamdar-51 showed the highest GP, 51.25 ± 7.78%, followed by BAIF Lucerne-4 (17.75 ± 3.87%). The salinity level, T5, greatly affected the germination; all the genotypes failed to germinate, whereas only the genotype Alamdar-51 showed only 1 ± 0.8% germination in treatment T5 (Fig. 3a). GP was decreased significantly with an increase in salinity level.
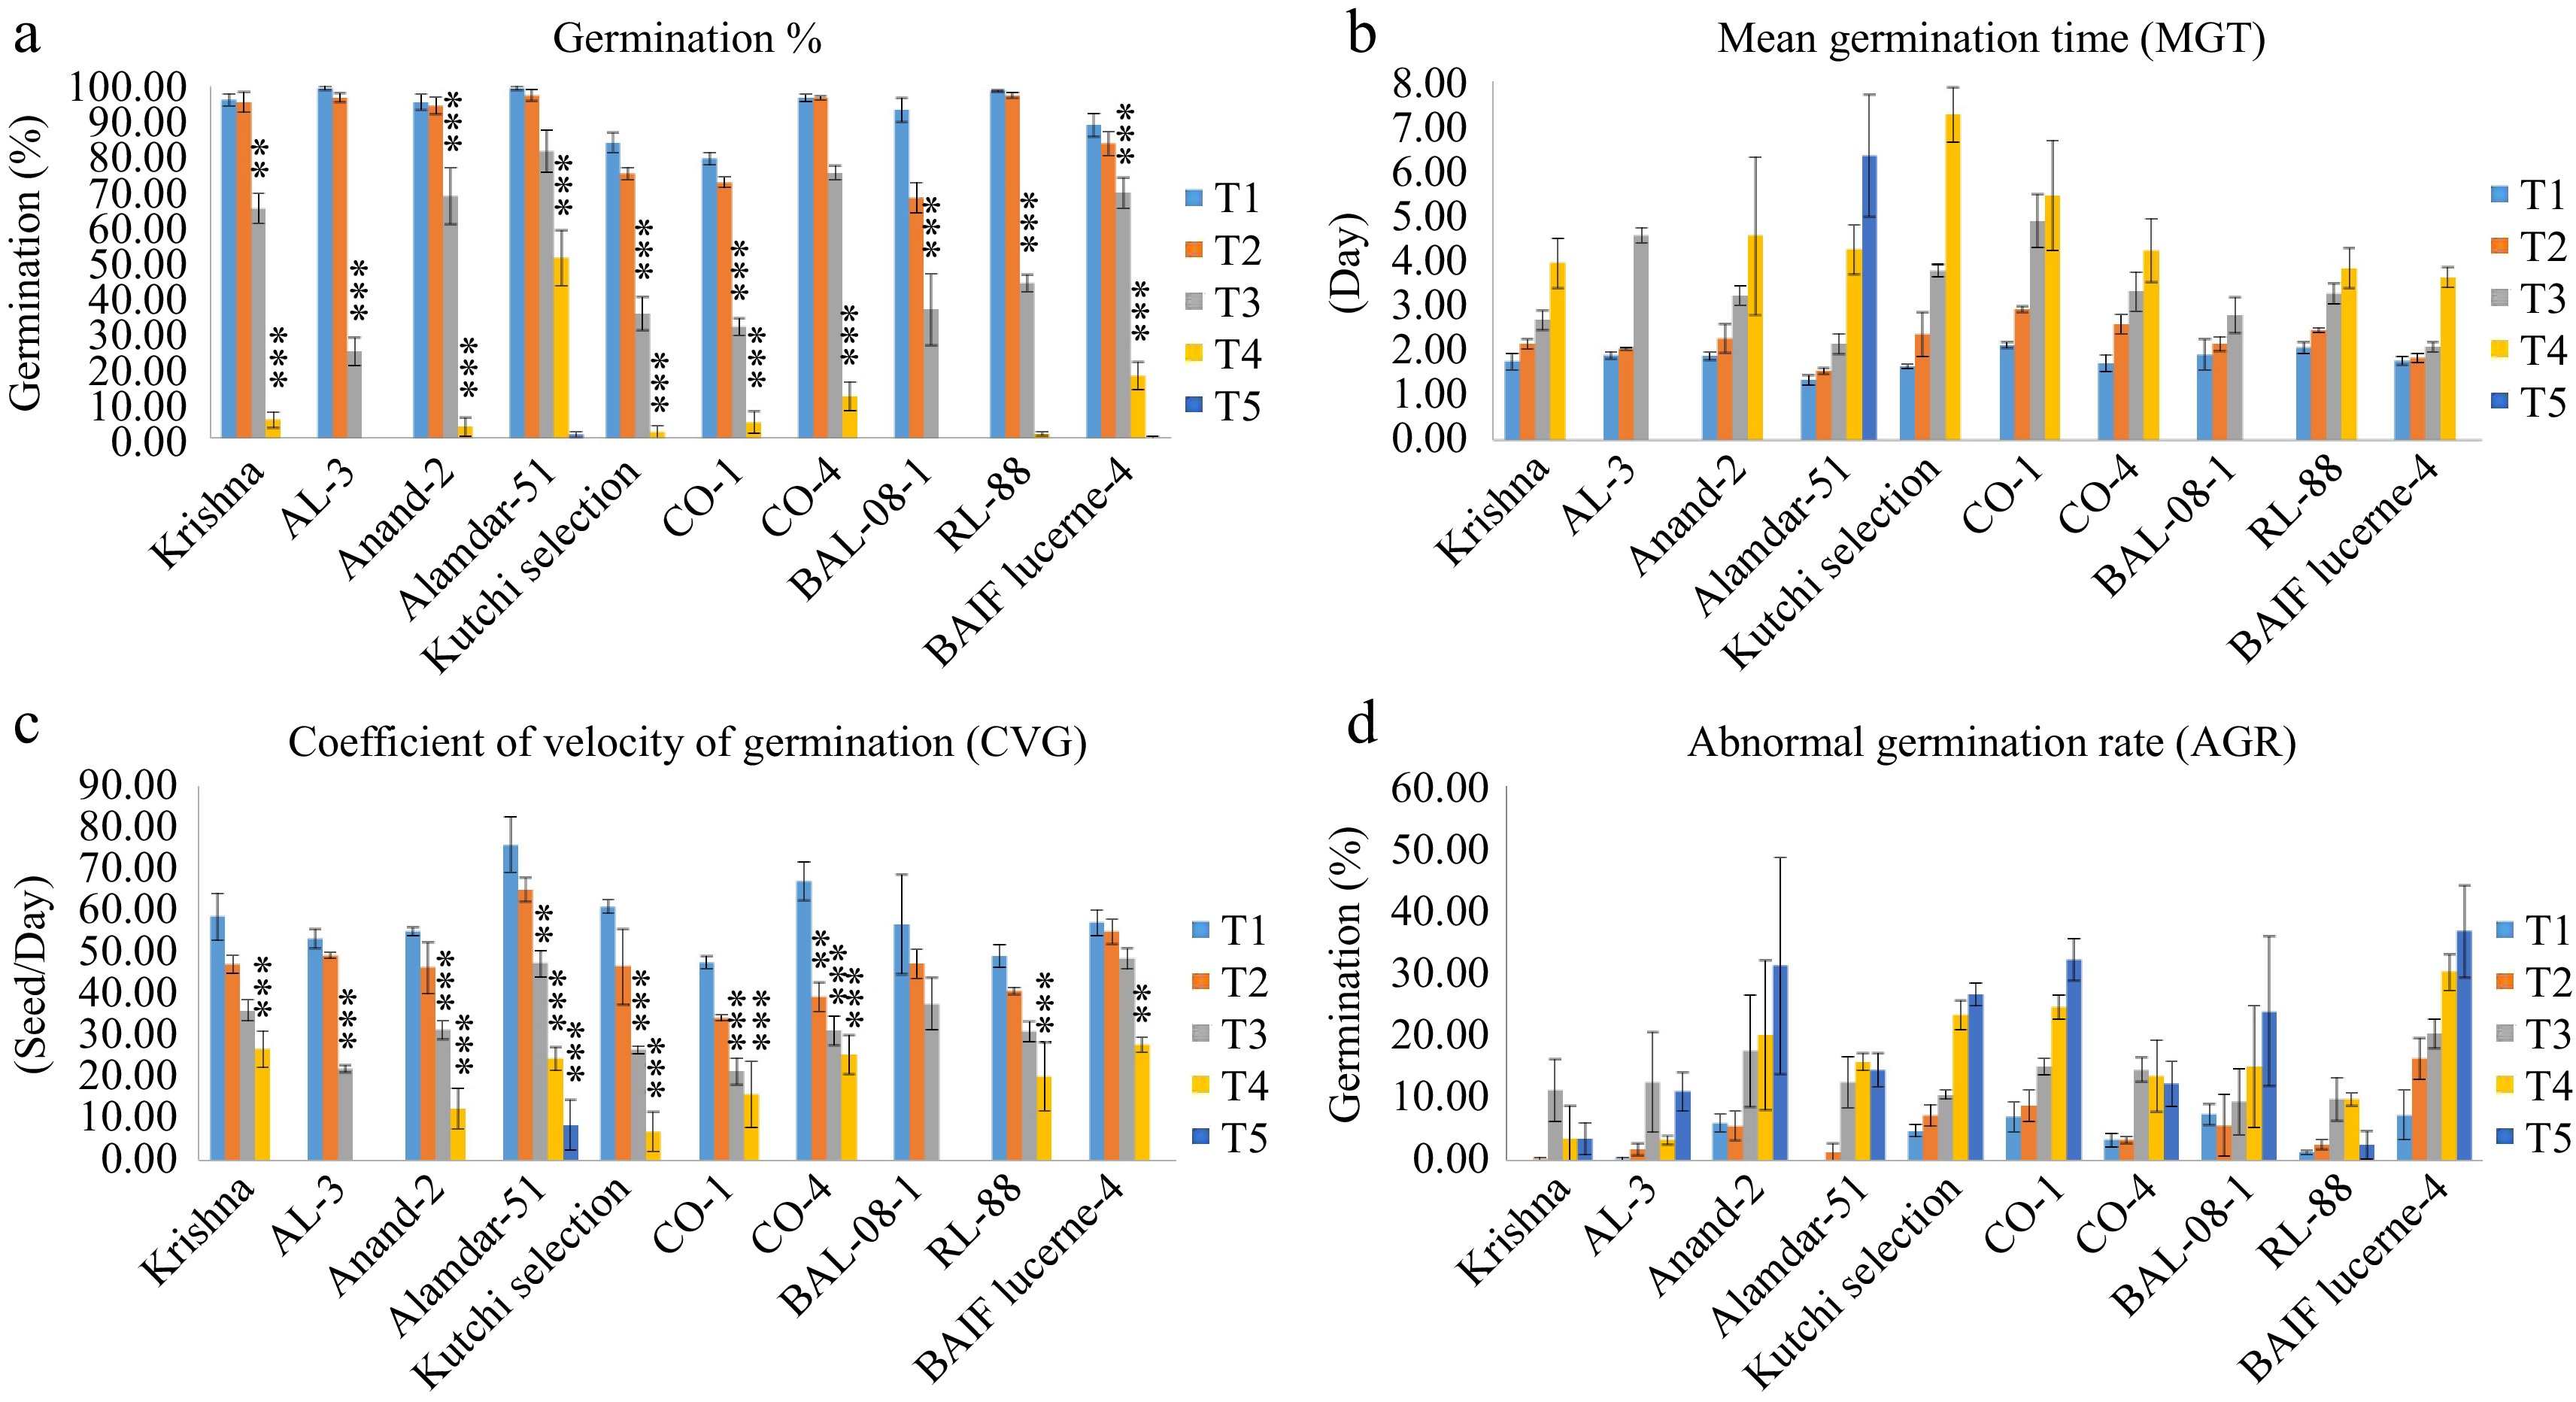
Figure 3.
Effect of five different concentrations of salt stress (T1 - 0 mM, T2 - 85.55 mM, T3 - 171 mM, T4 - 256 mM, and T5 - 342 mM NaCl) on germination indices of ten different genotypes of lucerne. The means are averages of 100 seeds with four replications. The significant differences at < 0.05, Tukey's post hoc test (*** < 0.001, ** < 0.01, NS - non-significant). (a) Germination percentage. (b) Mean germination time. (c) Coefficient of velocity of germination. (d) Abnormal germination rate.
Mean germination time (MGT)
-
MGT was increased with increased salt concentrations. The lowest MGT recorded for control T1 ranged from 1.34 ± 0.11 d in Alamdar-51 to 2.12 ± 0.07 d in CO-1. In low salinity treatment and T2, these two genotypes ranged from 1.55 ± 0.07 d to 2.93 ± 0.06 d. Treatment T3 ranged from the lowest MGT recorded for BAIF Lucerne-4 (2.09 ± 0.11 d) to the highest MGT for CO-1 (4.88 ± 0.59 d). In higher salt concentration treatment, T4 MGT was found to be higher, ranging from 3.64 ± 0.23 d in BAIF Lucerne-4 to 7.25 ± 0.61 d in Kutchi selection, whereas in treatment T5, the highest MGT (6.33 ± 1.36 d) recorded only for Alamdar-51 (Fig. 3b).
Coefficient of the velocity of germination (CVG)
-
The highest CVG (75.68 ± 6.74 seed/d) was recorded in T1 for Alamdar-5, and a non-significant difference was observed between T1 and T2, whereas CVG significantly decreased in salinity treatment T3 and T4. In treatment T4, the CVG ranged from 6.97 ± 4.70 seed/d in Kutchi selection to 27.74 ± 1.68 seed/d in BAIF Lucerne-4. Whereas in T5, the CVG (8.48 ± 6.03 seed/d) was recorded only for genotype Alamdar-51 (Fig. 3c).
Abnormal germination rate (AGR)
-
AGR increases with an increase in the salinity treatment. Minimum AGR was observed under the T1 and T2, as a significant rise in AGR was recorded for salinity levels T3 to T5 (Fig. 3d). The genotype BAIF Lucerene-4 and Anand-2 showed maximum AGR value (20.25 ± 2.37% and 17.50 ± 8.93%), respectively, under salinity treatment T3. The genotypes AL-3 (3.25 ± 0.73%) and Krishna (3.50 ± 2.60%) showed minimum AGR values under T4. Among the genotypes, the genotypes RL-88 (2.50 ± 2.26%) and Krishna (3.50 ± 2.60%) showed the lowest AGR values under the highest salinity treatment T5. The two-way analysis of variance showed significant differences between genotypes and salinity treatments, but their interaction was non-significant (Table 2).
Seedling parameters
-
All seedling parameters, viz. plumule length, radical length, and vigor index, were decreased with increasing salinity levels in all genotypes. The two-way ANOVA revealed significant differences in the interaction effect of salinity level, genotypes, and their interaction for all seedling parameters (Table 3). The comparison of the mean at different salinity levels with the control without salt treatment indicated that a decrease in seedling parameters occurred with an increase in salinity level.
Plumule and radical length
-
A negative correlation was recorded for all genotypes under high salinity levels. A reduction in the radical and plumule length and an increase in salinity levels were observed. In treatment T1, the plumule length ranged from 3.18 ± 0.08 cm in Kutchi selection to 4.34 ± 0.41 cm in AL-3, and the radical length ranged from 2.88 ± 0.28 cm in Kutchi selection to 6.03 ± 0.23 cm in Anand-2. In Treatment T2, plumule length ranged from 2.54 ± 0.24 cm in BAL-08-01 to 3.40 ± 0.20 cm in BAIF Lucerne-4, and radical length ranged from 3.76 ± 0.33 cm in CO-1 to 6.34 ± 0.7 cm in RL-88. Whereas, in treatment, T3 plumule length ranged from 1.60 ± 0.14 cm in BAL-08-1 cm to 2.63 ± 0.25 cm in Alamdar-51, and radical length ranged from 2.07 ± 0.08 cm to 4.48 ± 0.30 cm in RL-88. In response to treatment, T4 two genotypes Alamdar-51 showed the longest plumule length, 1.82 ± 0.04 cm, and the longest radicle length (2.45 ± 0.04 and 2.18 ± 0.37 cm) recorded for Alamdar-51 and BAIF Lucerne-4, respectively; these two genotypes indicated tolerance at salinity level T4 (Fig. 4a, b). Two-way ANOVA resulted in significant differences between genotypes, salinity treatments, and their interaction (Table 3).
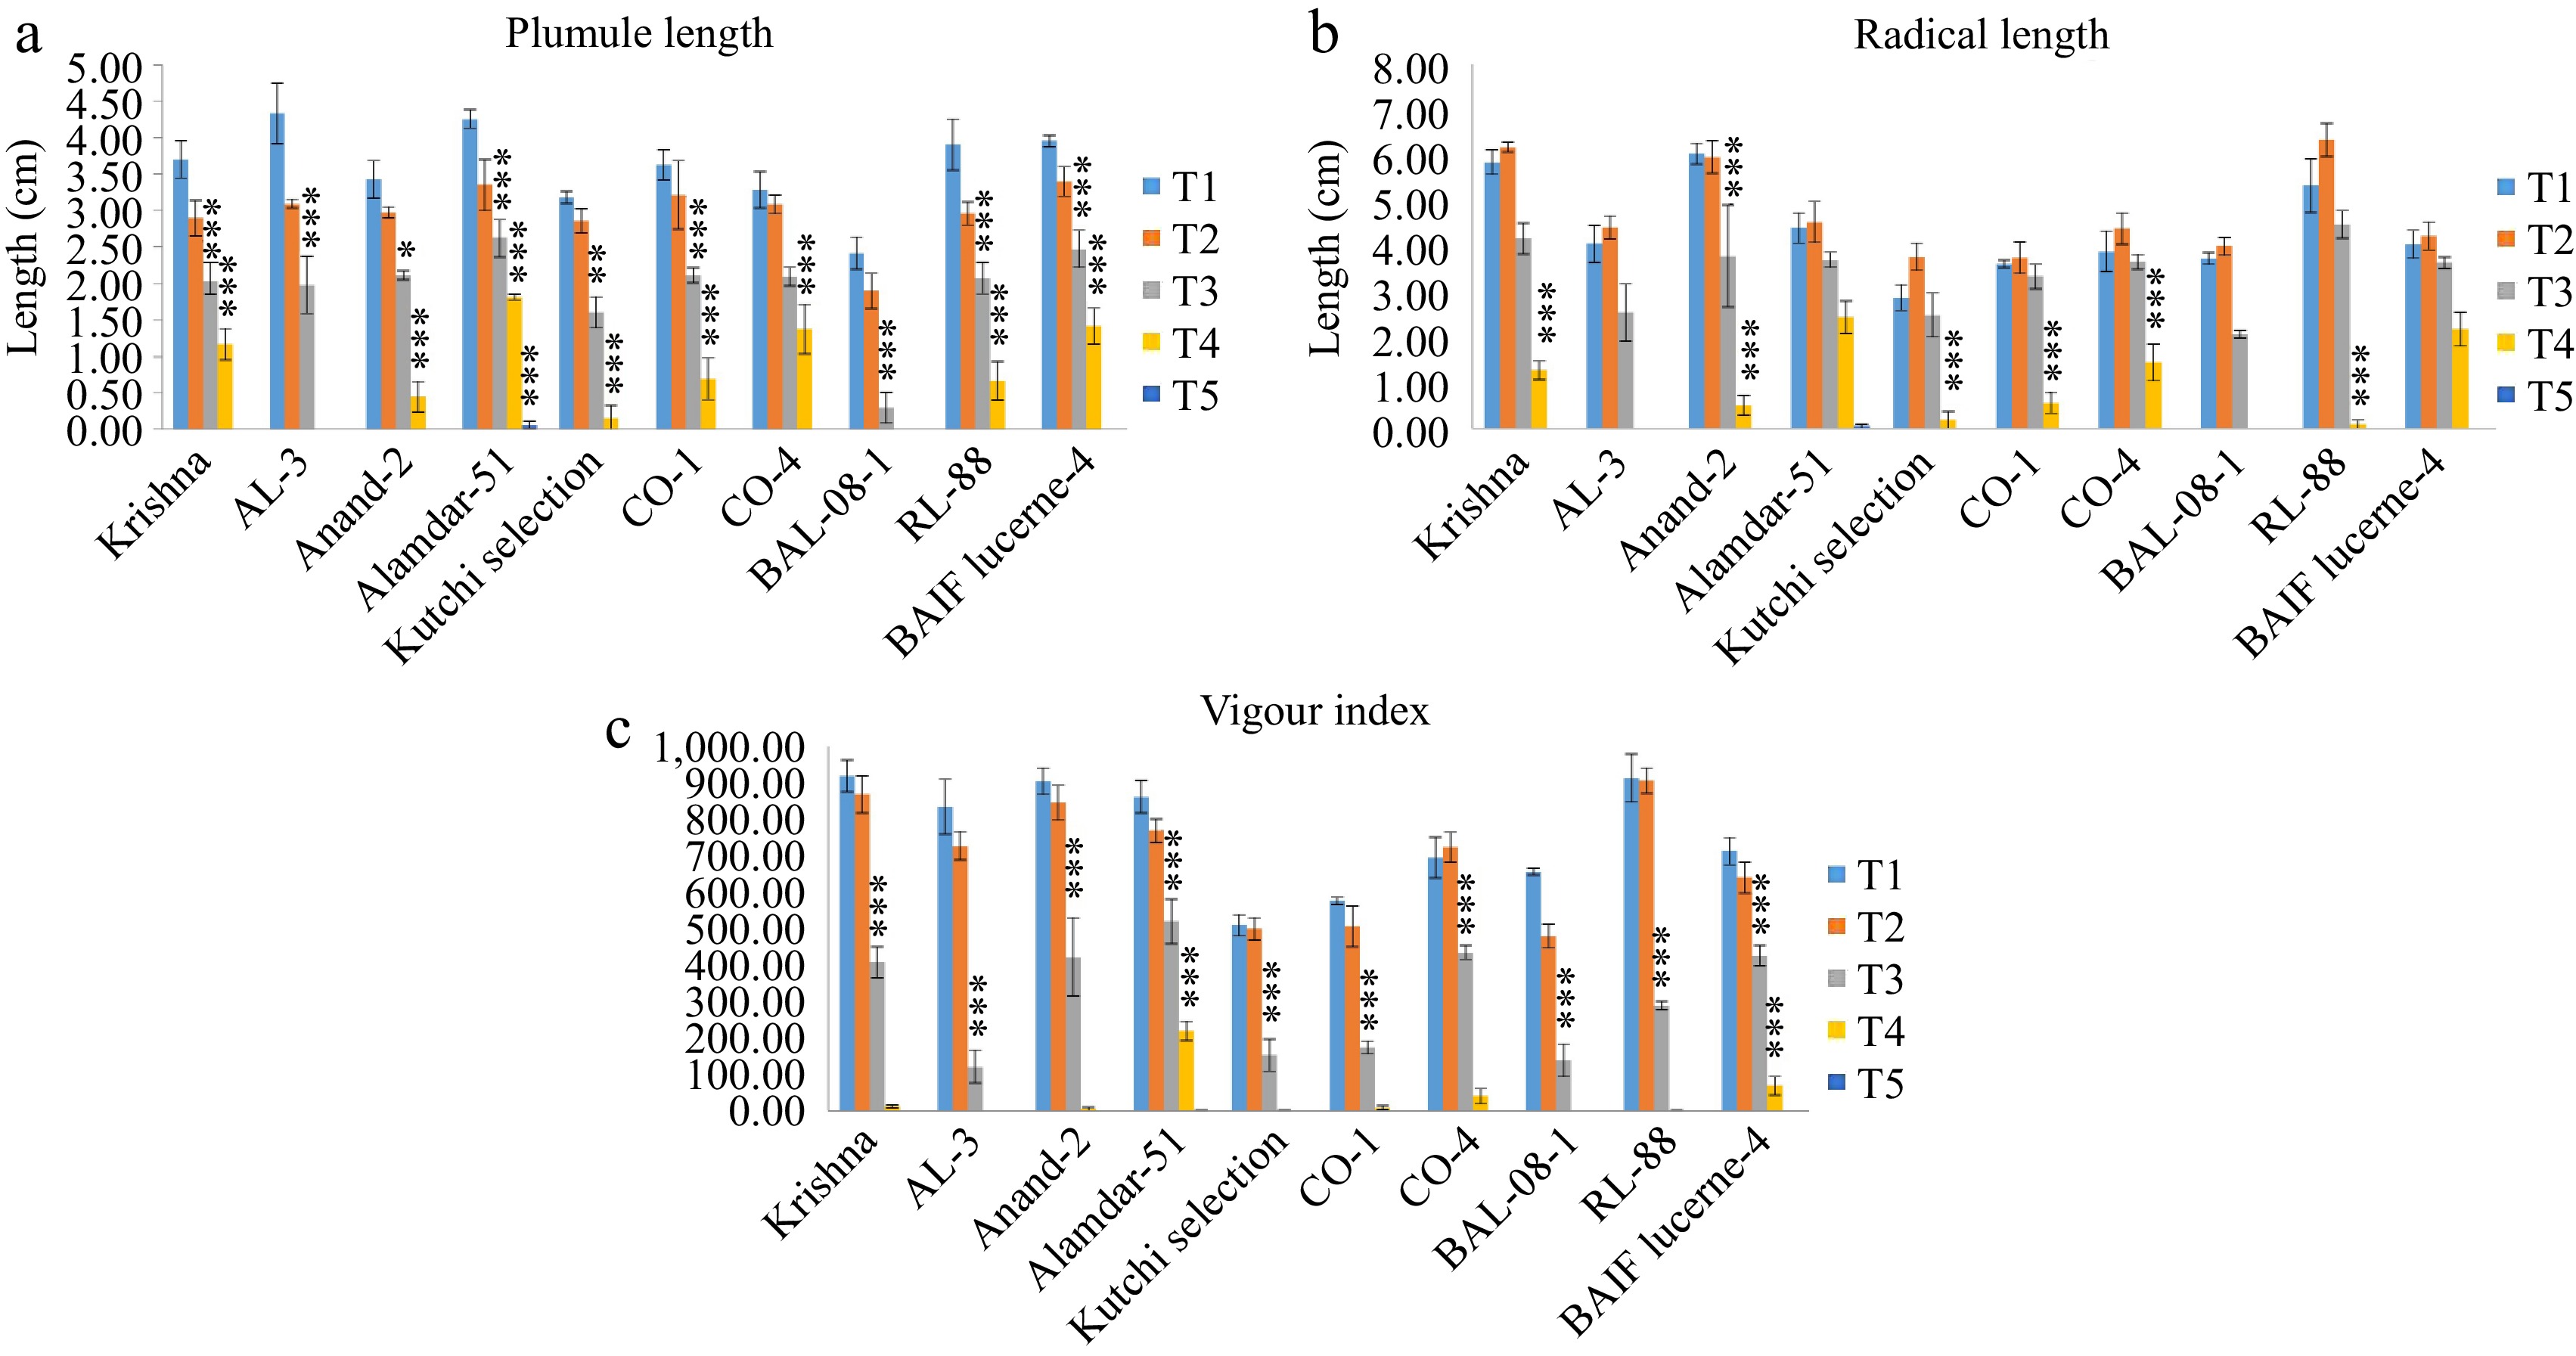
Figure 4.
Effect of five different concentrations of salt stress (T1 - 0 mM, T2 - 85.55 mM, T3 - 171 mM, T4 - 256 mM, and T5 - 342 mM NaCl) on seedling parameters of ten different genotypes of lucerne. The means are averages of 100 seeds with four replications. The significant differences at < 0.05, Tukey's post hoc test (*** < 0.001, * < 0.05, NS - non-significant). (a) Plumule length. (b) Radical length. (c) Vigor index.
Vigor index
-
The vigor index decreases with increasing salinity levels. Compared with the control, a drastic reduction was observed in the high salinity levels T4 and T5. In control treatment T1, genotype Krishna (919.10 ± 44.14) showed the highest vigor index. In treatment, T2 and T3 genotype RL-88 showed a 905.89 ± 34.48 vigor index. Whereas, in treatment, T3, T4, and T5, the genotype Alamdar-51 recorded the highest vigor index of 519.62 ± 60.62, 219.61 ± 26.28, and 0.27 ± 0.28, respectively (Fig. 4c). A two-way ANOVA indicated the significant difference between genotypes, salinity treatments, and their interaction (Table 3).
Fresh and dry weight
-
The fresh weight significantly decreases with increased salinity. Under control treatment T1, the average fresh weight ranged from 0.22 ± 0.03 g in CO-1 to 0.41 ± 0.01 g in BAL-08-1 (Fig. 5a). In treatment T2, fresh weight ranged from 0.15 ± 0.03 g in BAIF Lucerne-4 to 0.31 ± 0.02 g in RL-88 and BAL-08-1. In T3, it ranged from 0.3 ± 0.03 gm in BAIF Lucerne-4 to 0.25 ± 0.02gm in AL-3. In salinity treatments T4, highly significant variation was observed among all genotypes. The highest fresh weight (0.16 ± 0.06 g) was recorded for Anand-2. A two-way variance analysis indicated a significant difference between genotypes, salinity treatments, and their interaction (Table 4). In the case of dry weight, no significant differences were found between the T1, T2, and T3 treatments. Whereas, under high salinity treatments, T4 dry weight significantly decreased (Fig. 5b). Most of the genotypes failed to germinate under T4, so dry weight was found to be very low or absent.
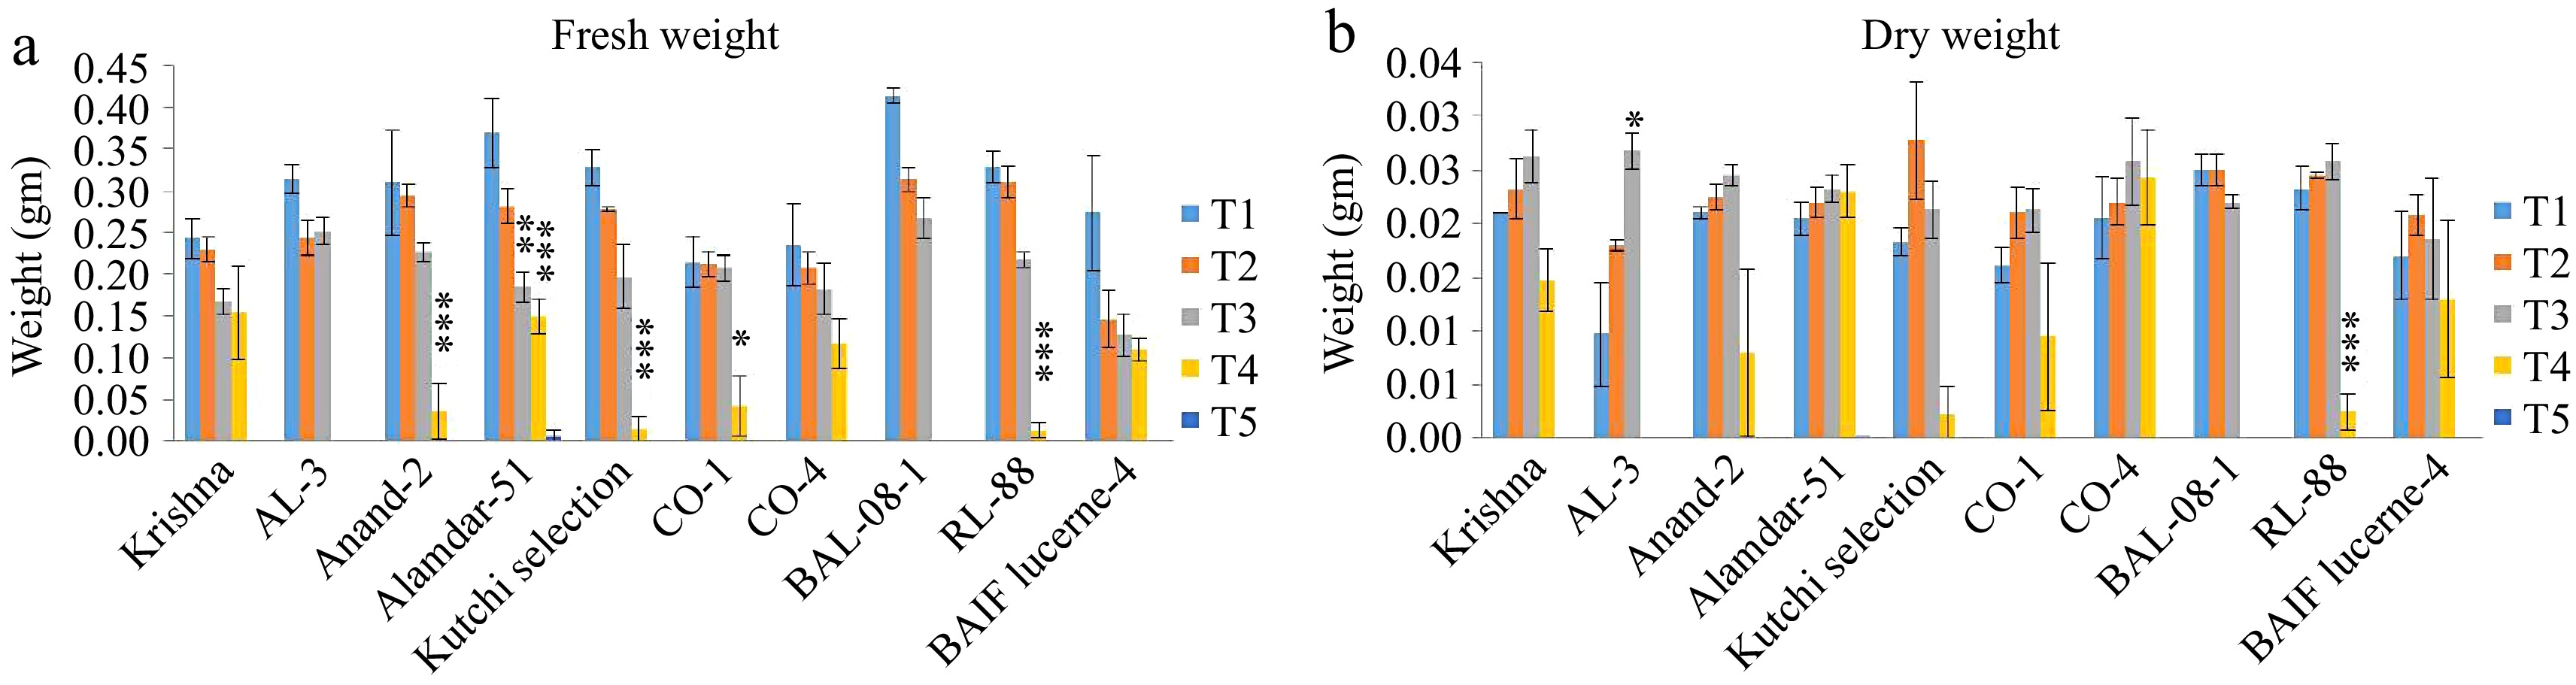
Figure 5.
Effect of five different concentrations of salt stress (T1 - 0 mM, T2 - 85.55 mM, T3 - 171 mM, T4 - 256 mM, and T5 - 342 mM NaCl) on fresh weight and dry weight of seedlings of ten different genotypes of lucerne. The means are averages of 100 seeds with four replications. The significant differences at < 0.05, Tukey's post hoc test (*** < 0.001, ** < 0.01, * < 0.05, NS- non-significant). (a) Fresh weight. (b) Dry weight.
Table 4. Effect of genotypes and salinity treatments and their interaction on the fresh, dry weight and its ratio.
Source of variance Df Fresh weight Dry weight MC F P MC F P Genotypes 9 0.00773* 2.169 0.02722 0.0001*** 4.17 8.04E-05 Treatments 4 0.60435*** 169.5 1.40E-54 0.0038*** 114.4 1.58E-44 Genotypes × treatments 36 0.00789*** 5.22 0.000478 7.98E-05*** 2.414 0.000115 df: Degree of freedom; MC: Mean square; F: ratio of variances at 0.05 level; P: p-value; *** < 0.001, * < 0.05, NS: non-significant. Percent recovery
-
Non-germinated seeds from NaCl treatments regained most germination when placed in distilled water. Among all the genotypes, the highest recovery was recorded for RL-88 (91.00 ± 2.05 and 82.07 ± 3.81%), followed by Kutchi selection (88.25 ± 0.73 and 77.62 ± 1.60%) in treatments T4 and T5. The genotypes Alamdar-51 (−36.64 ± 10.7) and BAIF Lucerne-4 (−3.23 ± 4.12) revealed a negative recovery percentage in treatment T4 (Fig. 6). The result of one-way ANOVA demonstrated a significant difference between the germination in the T1 and recovery percentage from T4 and T5 (Table 5).
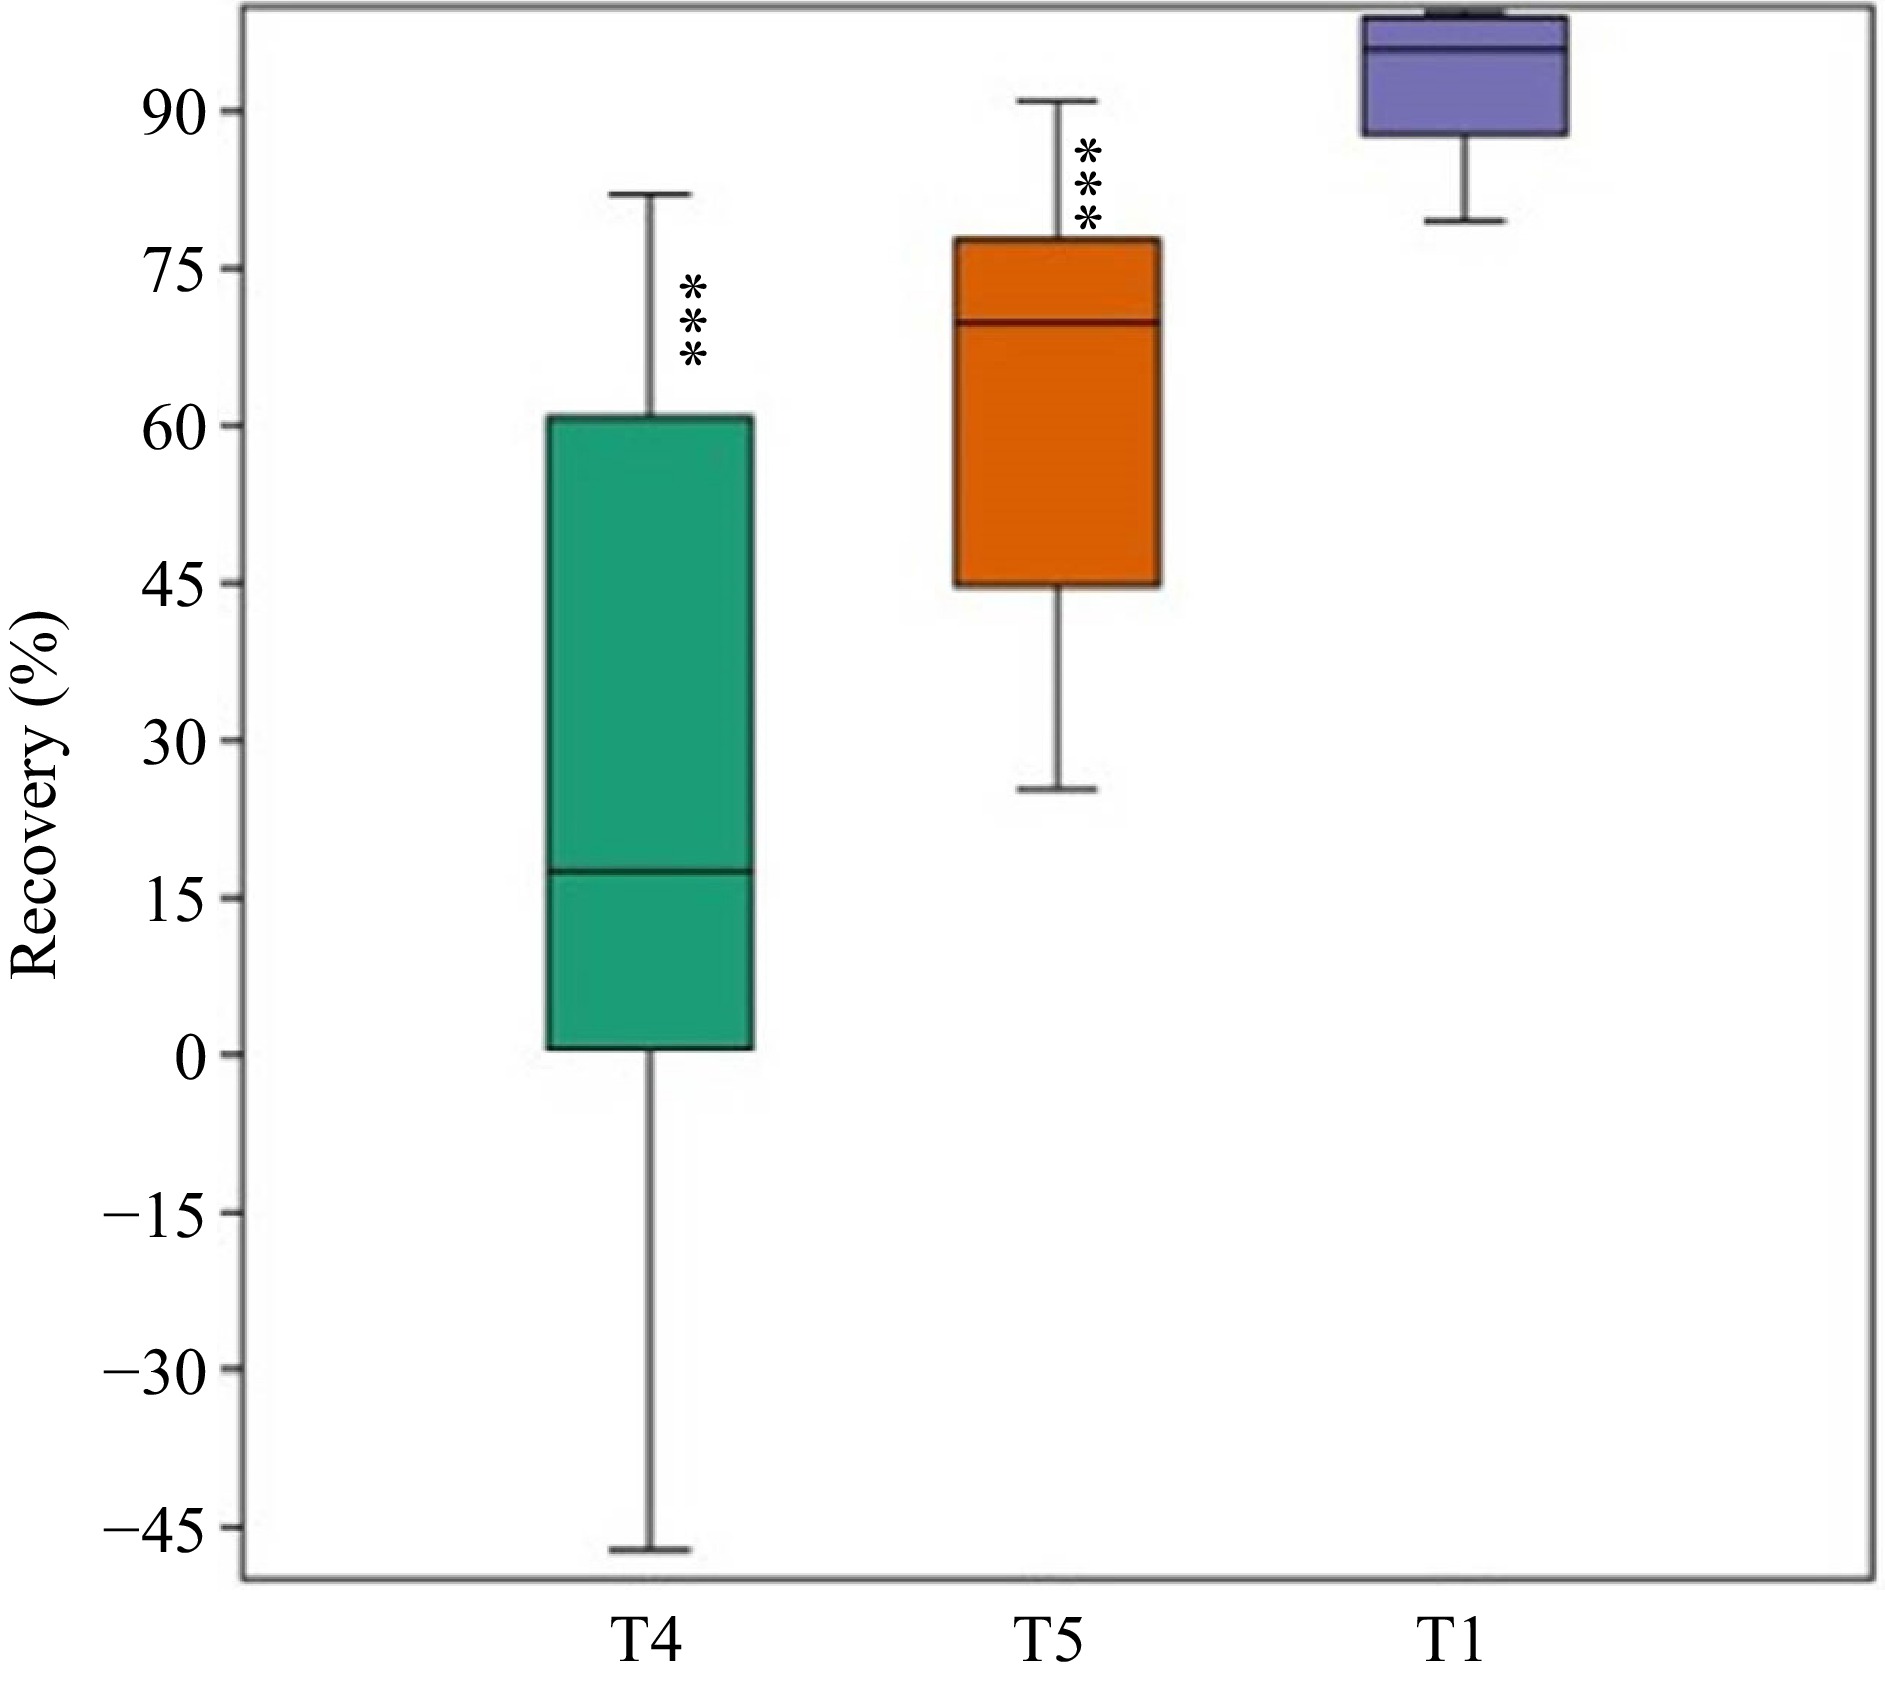
Figure 6.
Percentage recovery of non-germinated seeds from higher salt concentrations T4 and T5 recorded. The germination percentage from the T1 control treatment was included for comparison (*** p < 0.001).
Table 5. ANOVA of ten lucerne genotypes for recovery percentage.
Source of variation SS df MS F P F crit Between Groups 45,123.1 11 4,102.1*** 4.720137 7.02E-06 1.878388 Within Groups 93,858.89 108 869.0638 Total 138,982 119 df: Degree of freedom; MS: Mean square; F: ratio of variances at 0.05 level; P: p-value; *** < 0.001, NS: non-significant. Mantel test correlation
-
The possibilities of linkage between DNA marker data and germination indices and seedling parameters were tested using the Mantel test. No correlation was detected.
PCA analysis
-
The PCA was carried out to understand the effect of salinity levels on the studied parameters. The grouping of genotypes in PCA was roughly associated with the salinity treatments. The first two PCs elucidated 99.78% of the total variance among the genotypes (Fig. 7). The salinity treatment T2 grouped with T1 on the lower right side of the score plot, indicating an association with vector vigor index, a less abnormal germination rate, indicating a minimum effect of salinity level 85.55 mM. At the upper right side of the score plot, most of the genotypes responded positively to treatment T1 and T2 and were associated with vector GP, CVP, and Plumule length; similarly, the genotypes Alamdar-51, CO-4, BAIF Lucerne-4, Anand-2, and Krishna from treatment T3 were also associated with the same group. All other genotypes from treatment T3 were grouped at the upper left side of the score plot, indicating the moderate effect of salinity. The genotypes Alamdar-51, BAIF Lucerne-4, and CO-4 from treatment T4 grouped with treatment T3, indicating their salinity tolerance at the germination stage. All other genotypes from high salinity treatments, T4 and T5, were grouped at the lower left of the score plot. This indicates a negative response for the studied parameter as well as a severe effect of salinity.
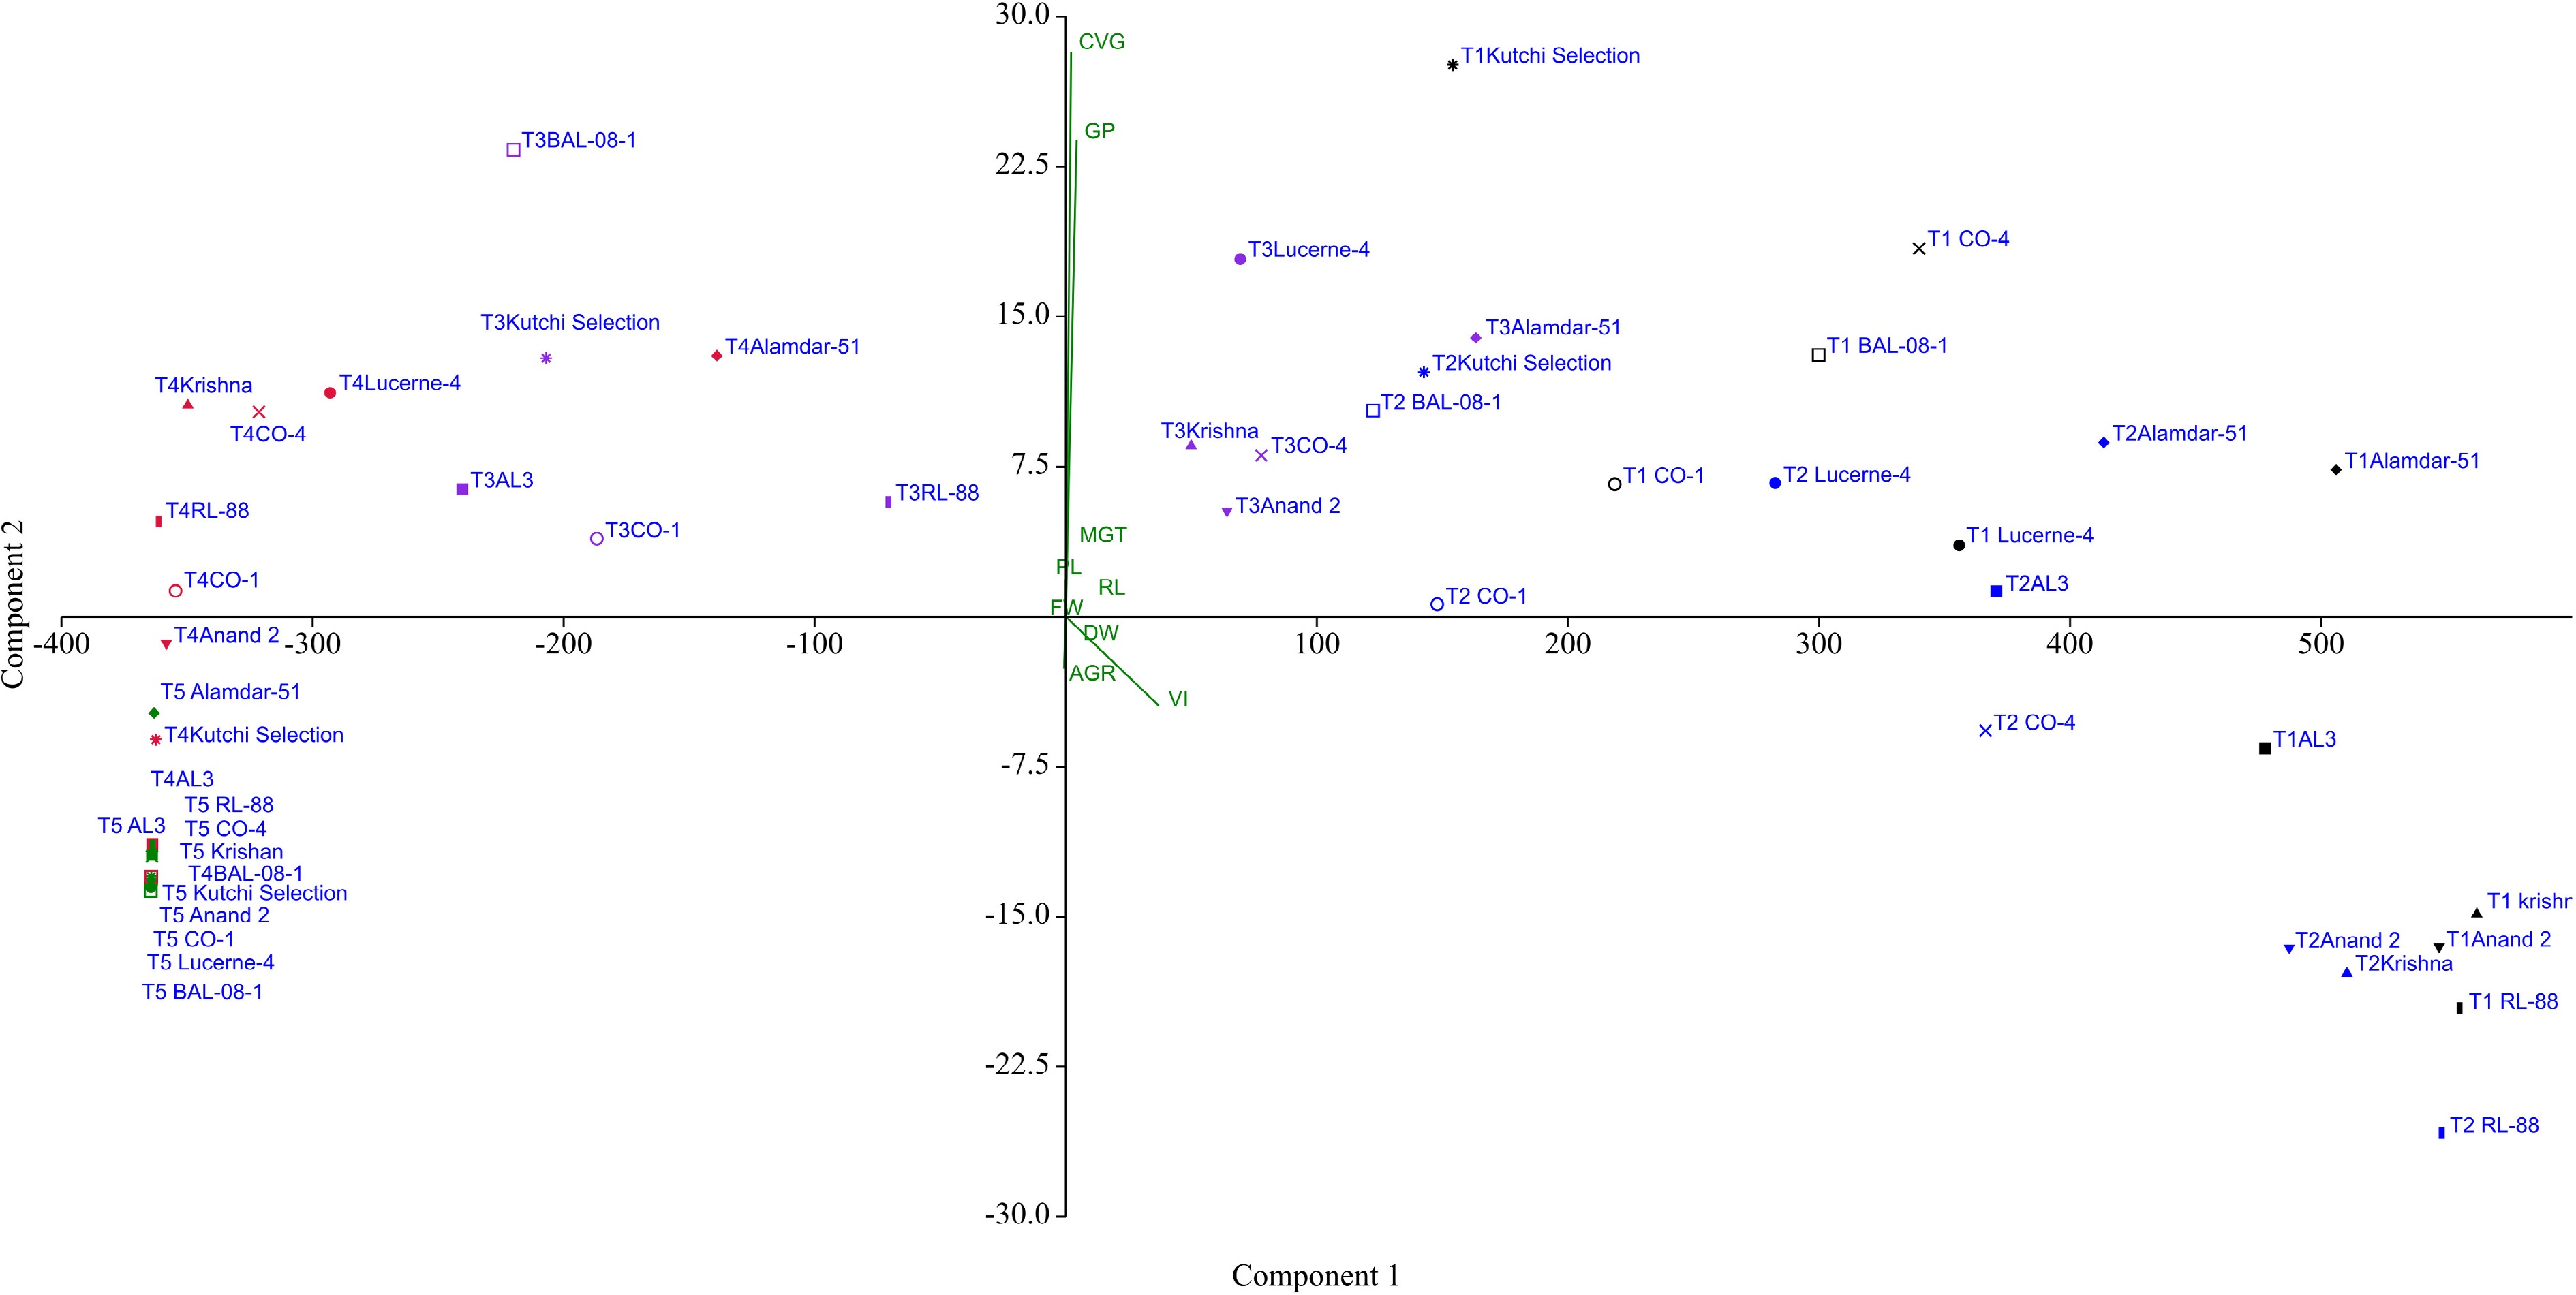
Figure 7.
Principal Component Analysis (PCA) showing the effect of salinity treatments on ten lucerne genotypes for studied nine germination and six seedling parameters.
Regression analysis
-
All Lucerne genotypes were graphed with salinity treatments, including control, to compare linear regression equations for all studied characters. R² values were highly significant for parameters like GP, ranging from 0.866 to 0.948, CVG (0.865 to 0989), plumule length (0.858 to 0.994), and fresh weight (0.894 to 0.995), and vigor index (0.852 to 0.977). Similarly significant but moderate R2 values were recorded for radical length, ranging from 0.768 to 0.917. Conversely, some genotypes showed non-significant R² values for certain traits. Specifically, Krishna, AL-3, CO-4, and RL-88 exhibited non-significant R² values for AGR. Similarly, Krishna, Anand-2, Alamdar-51, CO-1, CO-4, and RL-88 showed non-significant R² values for dry weight (Table 6).
Table 6. Linear regressions between the salinity levels (0, 85.55, 171, 256, 342 mM NaCl) and various parameters measured.
Genotype Krishna AL-3 Anand-2 Alamdar-51 Kutchi selection Y R2 X Model R2 X Model R2 X Model R2 X Model R2 X Model Germination percentage 0.897** 1.832 y = −28.27x + 137.2 0.866* 1.647 y = −29.57x + 132.9 0.879* 1.816 y = −28.22x + 137.0 0.871* 2.18 y = −24.32x + 139.1 0.932** 1.76 y = −24.15x + 111.7 Mean germination time 0.035NS 1.218 y = −0.171x + 2.620 0.241NS 1.351 y = −0.583x + 3.452 0.019NS 1.155 y = −0.147x + 2.828 0.885* −0.09 y = 1.267x − 0.678 0.008NS 0.92 y = 0.158x + 2.535 Coefficient of velocity of germination 0.9499** 2.167 y = −13.65x + 74.49 0.917** 1.734 y = −15.48x + 71.22 0.987*** 1.997 y = −14.29x + 71.74 0.989*** 2.25 y = −17.47x + 96.48 0.981*** 1.86 y = −16.05x + 76.26 Abnormal germination rate 0.127NS 0.771 y = 1.025x + 0.625 0.421NS 0.474 y = 2.3x − 1.15 0.917* −0.138 y = 6.45x − 3.35 0.827* 0.16 y = 4.35x − 4.25 0.922** −0.12 y = 5.95x − 3.4 Plumule length 0.994*** 2.069 y = −0.912x + 4.700 0.949*** 1.759 y = −1.176x + 5.411 0.957** 1.915 y = −0.938x + 4.610 0.9645** 2.18 y = −0.993x + 5.402 0.941** 1.81 y = −0.906x + 4.278 Radical length 0.908** 1.939 y = −1.658x + 8.468 0.864* 1.761 y = −1.251x + 5.956 0.917* 1.853 y = −1.751x + 8.512 0.841* 2.18 y = −1.076x + 6.258 0.768* 1.77 y = −0.935x + 4.673 Fresh weight 0.960*** 2.040 y = −0.118x + 0.612 0.995*** 2.049 y = −0.089x + 0.458 0.936** 1.861 y = −0.088x + 0.429 0.956*** 2.41 y = −0.083x + 0.496 0.907* 1.80 y = −0.068x + 0.325 Dry weight 0.409NS 1.781 y = −0.003x + 0.025 0.750* 1.750 y = −0.006x + 0.031 0.633NS 1.753 y = −0.006x + 0.032 0.403NS 2.04 y = −0.002x + 0.022 0.839* 1.76 y = −0.005x + 0.024 Vigor index 0.918** 299.43 y = −269.3x + 1249 0.852* 273.14 y = −239.4x + 1054 0.919** 300.01 y = −264.8x + 1229 0.977*** 2.02 y = −227.1x + 1155 8.790** 1.67 y = −151.6x + 687.3 Genotype CO-1 CO-4 BAL-08-1 RL-88 BAIF Lucerne-4 Y R2 X Model R2 X Model R2 X Model R2 X Model R2 X Model Germination Percentage 0.933** 1.77 y = −22.72x + 105.8 0.882** 1.89 y = −27.82x + 139.6 0.948** 1.74 y = −25.5x + 116.1 0.906** 1.75 y = −29.37x + 136.4 0.906** 1.97 y = −24.35x + 125.1 Mean germination time 0.015NS 1.14 y = −0.172x + 3.592 0.031NS 1.20 y = −0.180x + 2.912 0.534NS 1.61 y = −0.598x + 3.168 0.088NS 1.37 y = −0.276x + 3.154 0.046NS 1.25 y = −0.175x + 2.393 Coefficient of velocity of germination 0.985*** 2.03 y = −11.28x + 57.59 0.933** 2.03 y = −14.73x + 76.67 0.904** 1.80 y = −15.98x + 76.13 0.964* 2.15 y = −11.81x + 63.53 0.865* 2.15 y = −14.04x + 79.59 Abnormal germination rate 0.956** −0.27 y = 6.575x − 2.275 0.631NS −0.04 y = 2.825x + 0.875 0.823* −0.19 y = 4.212x − 0.412 0.133NS 0.65 y = 0.975x + 2.225 0.989* −0.51 y = 7.225x + 0.375 Plumule length 0.973*** 1.96 y = −0.977x + 4.862 0.949** 2.13 y = −0.827x + 4.450 0.858* 1.59 y = −0.674x + 2.945 0.990*** 1.94 y = −1.010x + 4.952 0.975** 2.11 y = −0.989x + 5.217 Radical length 0.821* 1.89 y = −1.043x + 5.388 0.818* 2.02 y = −1.072x + 5.896 0.877** 1.75 y = −1.147x + 5.405 0.796* 1.76 y = −1.691x + 8.323 0.820* 2.14 y = −1.013x + 5.863 Fresh weight 0.900** 1.76 y = −0.019x + 0.089 0.894** 1.66 y = −0.031x + 0.139 0.910** 1.79 y = −0.114x + 0.540 0.930** 1.79 y = −0.106x + 0.500 0.972*** 1.86 y = −0.101x + 0.481 Dry weight 0.505NS 1.53 y = −0.001x + 0.005 0.736NS 1.70 y = −0.003x + 0.015 0.807* 1.77 y = −0.007x + 0.036 0.694NS 1.72 y = −0.007x + 0.036 0.785* 1.84 y = −0.007x + 0.037 Vigor index 0.912** 1.70 y = −164.8x + 747.2 0.895** 1.82 y = −207.1x + 1000 0.905** 1.64 y = −179.0x + 791.9 0.879** 1.68 y = −272.9x + 1240 0.946** 1.88 y = −199.5x + 967.8 X = standardize regression coefficients corresponding salinity, * p < 0.05, ** p < 0.01 (Significance at 5%), NS: non-significant. R2: square of total correlation coefficient. Most regression models show negative slopes, indicating a decline in trait performance with increasing salinity levels. However, AGR showed positive linear slopes across all genotypes, reflecting an increase in germination abnormalities with increasing salinity levels. In contrast, positive regression slopes for MGT were recorded in Alamdar-51 and Kutchi Selection, suggesting that these genotypes germinated faster under higher salinity levels compared to others.
-
In India, about 5% of the net cultivated land is affected by salinity, apart from the decrease in net cultivable area. Soil salinization has detrimental effects on agricultural production and quality, cultivable crop selection, and biodiversity[17].
In the present study, nine ISSR markers revealed an average higher polymorphism. Similarly, 60% to 86% of average polymorphism was recorded in different studies using ISSRs[2,10,31,32]. PIC and SPI values comment on the usefulness of the marker system[29,33], and the informative range of molecular markers based on PIC is 0.3−0.59[34]. In this study, PIC and SPI values fall in the range, suggesting the usefulness of ISSR markers for detecting genetic diversity among the lucerne genotypes.
The dendrogram indicated that genotypes CO-1, RL-88, AL-3, BAIF Lucerne-4, and Anand-2 had formed a group with low bootstrap values, indicating lower support for the genetic separation. Other genotypes were found to be genetically distinct from each other. Such genetically distinct genotypes can be further used for breeding purposes to develop disease-resistant and stress-tolerant varieties[35].
Higher seed germination and seedling emergence are important steps in establishing any crop. In general, salt stress mainly affects germination percentage and its rate and also hampers crop vigor, root, shoot, and seedling growth[36]. Therefore, this study focused on the salinity tolerance of commonly used lucerne genotypes in India, using seed germination and seedling growth indicators. Generally, lucerne is known for being moderately tolerant to salt stress at the seed germination stage[37]. Accordingly, in this study, the germination process and seedling parameters of the ten genotypes studied were less affected by the salt concentration of 85.55 mM NaCl. It was also reported that the salt concentration, particularly above 100 mM, reduces seed germination and affects seedling development in M. sativa, M. ciliaris, and M. polymorpha. As the salt concentration rises, seed germination is severely affected. At high salinity concentrations of 240, 270, and 300 mM, seed germination was reported to be either very low or non-existent[38,39]. Similarly, in this study, the detrimental impact of increasing NaCl concentrations 171, 256, and 342 mM was observed regarding germination percent, coefficient of velocity, and extended mean germination time. The high salinity prevents normal germination and seedling development, leading to relatively more significant abnormal germination[19]. At a salinity concentration of 256 mM NaCl, the genotype Alamdar-51 showed the highest germination percentage. At a salt concentration of 250 mM NaCl, the alfalfa varieties Ifrane (73%) and Marocaine (64%) showed higher germination[40]. However, the alfalfa variety Cuf-101C recorded 86 % germination at 200 mM NaCl concentration[41].
In addition to the germination indices, salinity also affects the growth of the seedlings. Similarly, as demonstrated in seed germination indices, seedling parameters were also severely affected at or above 225 mM NaCl concentration[11,21,39]. This might be due to the toxic effect of ions on the distraction in nutrient uptake and osmotic shock on water absorption, which would limit the biosynthesis of enzymes and hormones required for growth[39,42]. A similar present study also showed seedling parameters affected by the increase in salinity, particularly above 85.55 mM NaCl concentration. Further, it is also reported that NaCl can inhibit physiological activities such as the proper functioning of antioxidant enzymes, including superoxide dismutase (DOS), peroxidase (POD), ascorbate peroxidase (APX), and catalase (CAT)[42−44].
In the case of percent recovery, the result revealed that different genotypes respond differently to salt stress. RL-88 and Kutchi selection genotypes showed the highest recovery of seed germination from the highest salt concentration of 256 mM NaCl and 342 mM NaCl. On the other hand, two genotypes, Alamdar-51 and BAIF Lucerne-4, in treatment T4, showed a negative recovery percentage. This may be because both genotypes show a higher normal and abnormal germination percentage. Higher salt concentration might be responsible for reversible osmotic actions, leading to conditional seed dormancy and retaining the ability to germinate when transferred to a non-saline solution[38]. These two genotypes indicated the ability to withstand prolonged exposure to unfavorable saline environments. It has been found that recovery is feasible when salinity stress is removed, and seeds retain their ability to germinate, suggesting the ionic influence of salt on seed germination[21,37,38]. Although germination recovery is not a criterion for salt tolerance, the germination recovery demonstrated the ability to induce conditional seed dormancy and maintain seed viability[38]. In our previous report, the Mantel test showed no linkage observed for ISSR maker data and morphology and yield parameters[2]. Similarly, in the present study, there is no correlation between genetic distance by ISSR and germination indices, as well as seedling parameters. This suggests salt tolerance may be influenced by environmental and epigenetic factors or that salt tolerance is a polygenic or quantitative character[45,46].
The PCA analysis is a data reduction method to identify potential factors[47]. The PCA analysis, multivariate analysis, and multiple regression analysis were applied to understand the salt tolerance at the seedling stage using morphological, biochemical, and physiological traits in rice[48], sunflower[49], and alfalfa[13,23,50]. Here, PCA displayed a minimum effect of less salinity level (85.55 mM). On the other hand, higher salinity (256 and 342 mM NaCl) severely affects the germination and seedling parameters.
The regression analysis demonstrated a significant impact of salinity on germination percentage, coefficient of the velocity of germination, plumule length, radical length, fresh weight, and vigor index, and results are in line with previous reports[11,19,21]. However, contrary to this[20], it was reported that salinity and alkalinity stress significantly affect germination parameters but not plumule length, radical length, and fresh weight.
-
ISSRs showed that the genotype Kutchi selection was genetically distinct from all other genotypes but was found susceptible to salinity at the germination stage. The germination and seedling parameters of the studied genotypes were less affected at a salt concentration of 85.55 mM NaCl. As the salt concentration rises, the severity also increases. With a salinity concentration of 256 mM, the genotype Alamdar-51 showed the highest germination, longest plumule, and radical length, indicating its ability to withstand high salinity for initial germination and growth. At salinity concentrations of 342 mM NaCl, seed germination was severely affected. Increasing salinity levels affect seed germination, but once salt stress is removed, recovery in seed germination is possible.
The authors are grateful to BAIF Development Research Foundation, Urulikanchan, Pune, Maharashtra, India, for the laboratory facility and utilization of seed material. This work was supported by the BAIF Development Research Foundation (BAIF), Pune, India.
-
The authors confirm contributions to the paper as follows: conceptualization of research: Bahulikar RA, Jade SS, Takawale PS; designing of the experiments: Bahulikar RA, Jade SS; contribution of experimental materials: Takawale PS; execution of lab experiments and data collection: Jade SS, Shitole SY, Khedkar PA; analysis of data and interpretation: Bahulikar RA, Jade SS; preparation of manuscript: Jade SS, Bahulikar RA, Takawale PS, Shitole SY, Khedkar PA. All authors reviewed the results and approved the final version of the manuscript.
-
The datasets generated during and/or analyzed during the current study are available from the corresponding author on reasonable request.
-
The authors declare that they have no conflict of interest.
- Supplementary Fig. S1 Fingerprinting patterns generated by using ISSR markers. (M = 1 kb ladder, 1 = BAIF Lucerne-5, 2 = AL-3, 3 = Anand-2, 4 = Alamdar-51, 5 = Kutchi Selection, 6 = CO-1, 7 = BAL-08-1, 8 = RL-88, 9 = Krishna, 10 = CO-4, 11 = Non template control).
- Copyright: © 2025 by the author(s). Published by Maximum Academic Press, Fayetteville, GA. This article is an open access article distributed under Creative Commons Attribution License (CC BY 4.0), visit https://creativecommons.org/licenses/by/4.0/.
-
About this article
Cite this article
Jade SS, Khedkar PA, Shitole SY, Takawale PS, Bahulikar RA. 2025. Higher salt concentration severely affects seed germination of ten Indian genotypes of lucerne (Medicago sativa L.). Grass Research 5: e020 doi: 10.48130/grares-0025-0017 

Higher salt concentration severely affects seed germination of ten Indian genotypes of lucerne (Medicago sativa L.)
- Received: 18 October 2024
- Revised: 25 April 2025
- Accepted: 07 May 2025
- Published online: 05 August 2025
Abstract: Lucerne (Medicago sativa L.) is the world's most important and ancient legume forage crop. It is moderately tolerant to salinity, but crop productivity is hampered. Salinity affects plant development, starting from seed germination to the reproductive stage. ISSR markers were employed to assess the genetic diversity among India's ten most common lucerne genotypes; the nine ISSR primers showed 83.50% polymorphism. The dendrogram revealed lower bootstrap support for group I; genotypes from group II were genetically distinct. Seed germination performance among the genotypes was studied at 0 (control), 85.55, 171, 256, and 342 mM NaCl concentrations. Higher germination was observed under control conditions. At a salt concentration of 85.55 mM NaCl, the genotypes under study showed less variation for germination and seedling characters. All germination indices and seedling parameters decrease with an increase in salt concentrations. Among the ten genotypes, Alamdar-51 showed high germination indices and seedling parameters under a high salinity level of 256 mM NaCl, indicating its ability for germination and initial growth under high saline conditions. At salinity concentrations of 342 mM NaCl, seed germination of all genotypes was severely affected. RL-88 and Kutchi selection showed the highest recovery of seed germination when seeds were transferred from a saline concentration to distilled water. These two genotypes demonstrated resistance to prolonged exposure to unfavorable salinized environments. This evaluation approach was found to be effective in identifying genotypes based on seed germination and early seedling growth stage under salinity stress.
-
Key words:
- Genetic diversity /
- ISSRs /
- Lucerne /
- Salinity /
- Germination indices /
- Seedling parameters /
- PCA analysis