


-
The emission of particulate matter has numerous negative effects on the environment[1], and human health[2]. Several steps are involved in the lifetime of soot, including fuel pyrolysis, polycyclic aromatic hydrocarbons (PAHs) growth, particle inception, coagulation, surface growth, carbonization, agglomeration, and oxidation[3]. Considering the complexity of formation mechanisms, soot can be briefly divided into early-stage and mature soot according to the time scale. Compared to mature soot, early-stage soot has a shorter residence time in flames. As soot matures, these young particles grow further by coalescence and surface addition reactions to become aggregates, the C/H ratio is reported to increase from 1.4−2.5 to about 10−20[4]. Oxidation may also occur simultaneously with formation both in premixed and diffusion flames. The largest contributor in general is OH under fuel-rich conditions and O2 under fuel-lean conditions[5]. The oxidation-based elimination methods are also proven to be efficient in diesel particulate filters[6]. Therefore, a comprehensive understanding of soot oxidation kinetics under various evolution stages is of great significance for revealing nucleation mechanisms, controlling growth rates, and improving removal efficiency.
To date, relevant research has established relationships between soot physicochemical structure and oxidation reactivity for mature soot. Soot physicochemical structure refer to the pore structure[7], distributions of surface functional groups (SFGs)[8], and the atomic level organization of in-plane lamella sheets, such as dimensions, tortuosity, and interplanar separation distance[9]. Soot oxidation reactivity refers to the tendency to be oxidized, which can be characterized by thermogravimetric analysis (TGA)[10]. In summary, PAHs comprising soot particles with higher curvature or reduced sizes, increased concentration of aliphatic and oxygenated groups are more susceptible to heated and decomposed into CO and CO2[11]. The activation energy is employed to describe oxidation reactivity quantitatively. For example, Raj et al. adapted multiple heating rate programs to reveal the effects of fuel types[12,13], and heat-treatment temperature[14] on activation energy variations. Chemical simulations by density functional theory reveal that preferred pathways for the oxidation of six and five-membered rings present on curved PAHs can be attributed to the low activation barriers than that of planar ones[11]. It has also been found that, although the rates for O2 addition and O-O bond breakage in the peroxyl group are higher for zigzag sites, and the rates for CO removal are higher in the case of free-edge sites as compared to the zigzag sites[15,16].
However, relevant research has also thrown light on the evolution of physicochemical structure during mature soot oxidation. Ishiguro et al.[17] captured the nanostructure changes during diesel soot oxidation at the conversion rates of 25%, 50%, and 75%. In the early oxidation stage, the release of soluble organic fractions makes soot particles porous, accompanied by reduced O-containing functional groups. In the late stage, particle sizes decrease due to the stripping of small crystallites from the outer surface. Song et al.[18] adapted a similar method to analyze the variations in oxidation rates and lamella length for diesel soot derived from biodiesel and Fischer-Tropsch diesel, but they failed to take tortuosity into consideration. Diesel soot derived from neat biodiesel presents much higher reactivity during oxidation than soot from neat Fischer-Tropsch diesel fuel due to structural changes in the outer surface and a subsequent hollowing core. The differences in soot properties are inevitably affected by fuel type. Therefore, it is hard to correctly correlate soot oxidation kinetics and burning mode with their maturity. In recent years, environmental Transmission Electron Microscopy is normally employed in soot oxidation with a high spatial resolution[19−22]. The real-time reactions can be directly observed at the atomic scale. As a representative study, Sediako et al.[19] conclude that only surface oxidation is observed for soot sampled from 1-decene diffusion flame at 60 mm above the burner. In contrast, the combination of surface and internal oxidation has been verified for soot sampled from ethylene diffusion flames at 40 mm above the burner. However, the degree of soot maturity cannot be directly related to the sampling position for flames fueled by ethylene and 1-decene.
Compared with mature soot, early-stage soot presents distinct physicochemical structure, such as higher H/C ratios, disordered nanostructure, and abundant oxygenated species[4]. These structural variations are bound to affect oxidation kinetics. Experimental evidence for early-stage soot is concentrated on particle morphology[9,23,24], size distribution[25−28], organic and elemental carbon content[29], and number density[30−32]. However, the oxidation kinetics and nanostructure evolution are rarely studied. The formation rate of early-stage soot is limited to upstream flames, and thermophoretic sampling[33,34] is unsuitable to satisfy the mass-consuming test for thermogravimetric analysis. For traditional microprobe sampling[35,36], the sampled soot goes through a long narrow channel, which can lead to remarkable particle-particle and particle-wall collisions. These secondary reactions will modify sample properties to a large extent. The limitations of the sampling method make it hard to adequately understand the early-stage soot oxidation kinetics and restrict the detailed comparisons between soot properties at different evolution stages.
To overcome these difficulties, a vacuum-based capillary-nozzle-hybrid sampling method was developed in our recent work to extract soot from an ethylene laminar coflow diffusion flame, which can help reveal the evolution of soot oxidation reactivity and soot nanostructures with residence time in the flame[37]. Moreover, the kinetic parameters of early-stage soot are analyzed according to the distributed activation energy model (DAEM). This model decouples the overall oxidation reaction into numerous independent processes with different activation energies. Compared with multiple heating rate programs[12−14], DAEM only requires conversion data at a single heating rate to rapidly calculate the activation energy. However, the obtained results are distributed over a wide range and lack detailed trends.
Unlike ethylene, which is commonly used in previous studies, propane is not only the main component of liquefied petroleum gas (LPG), but also a model compound for large alkane components in practical fuels such as gasoline, diesel, and kerosene[38]. This work samples early-stage and mature soot from the centerline of a propane laminar coflow diffusion flame using our recently developed capillary-nozzle-hybrid sampling method. Multiple heating rate programs are adapted to quantitatively analyze oxidation kinetic parameters. Furthermore, the evolution of soot nanostructure is monitored at different oxidation stages to correlate soot oxidation mechanisms with soot maturity.
-
As shown in Fig. 1a, the burner consists of two concentric stainless-steel tubes with inner diameters of 10 mm and 86 mm, respectively. In the inner tube, propane (> 99.9% purity) is diluted with nitrogen (> 99.9995% purity) at a certain ratio, while coflow air is fed through the outer tube. In this work, the flow rates of propane and nitrogen in the fuel pipe are set as 0.094 SLM and 0.118 SLM. The gas velocities at the outlets of the inner and outer tubes are 5 and 41 cm/s, respectively. The generated propane flame in Fig. 1b has a visible height (hf) of 59 mm.
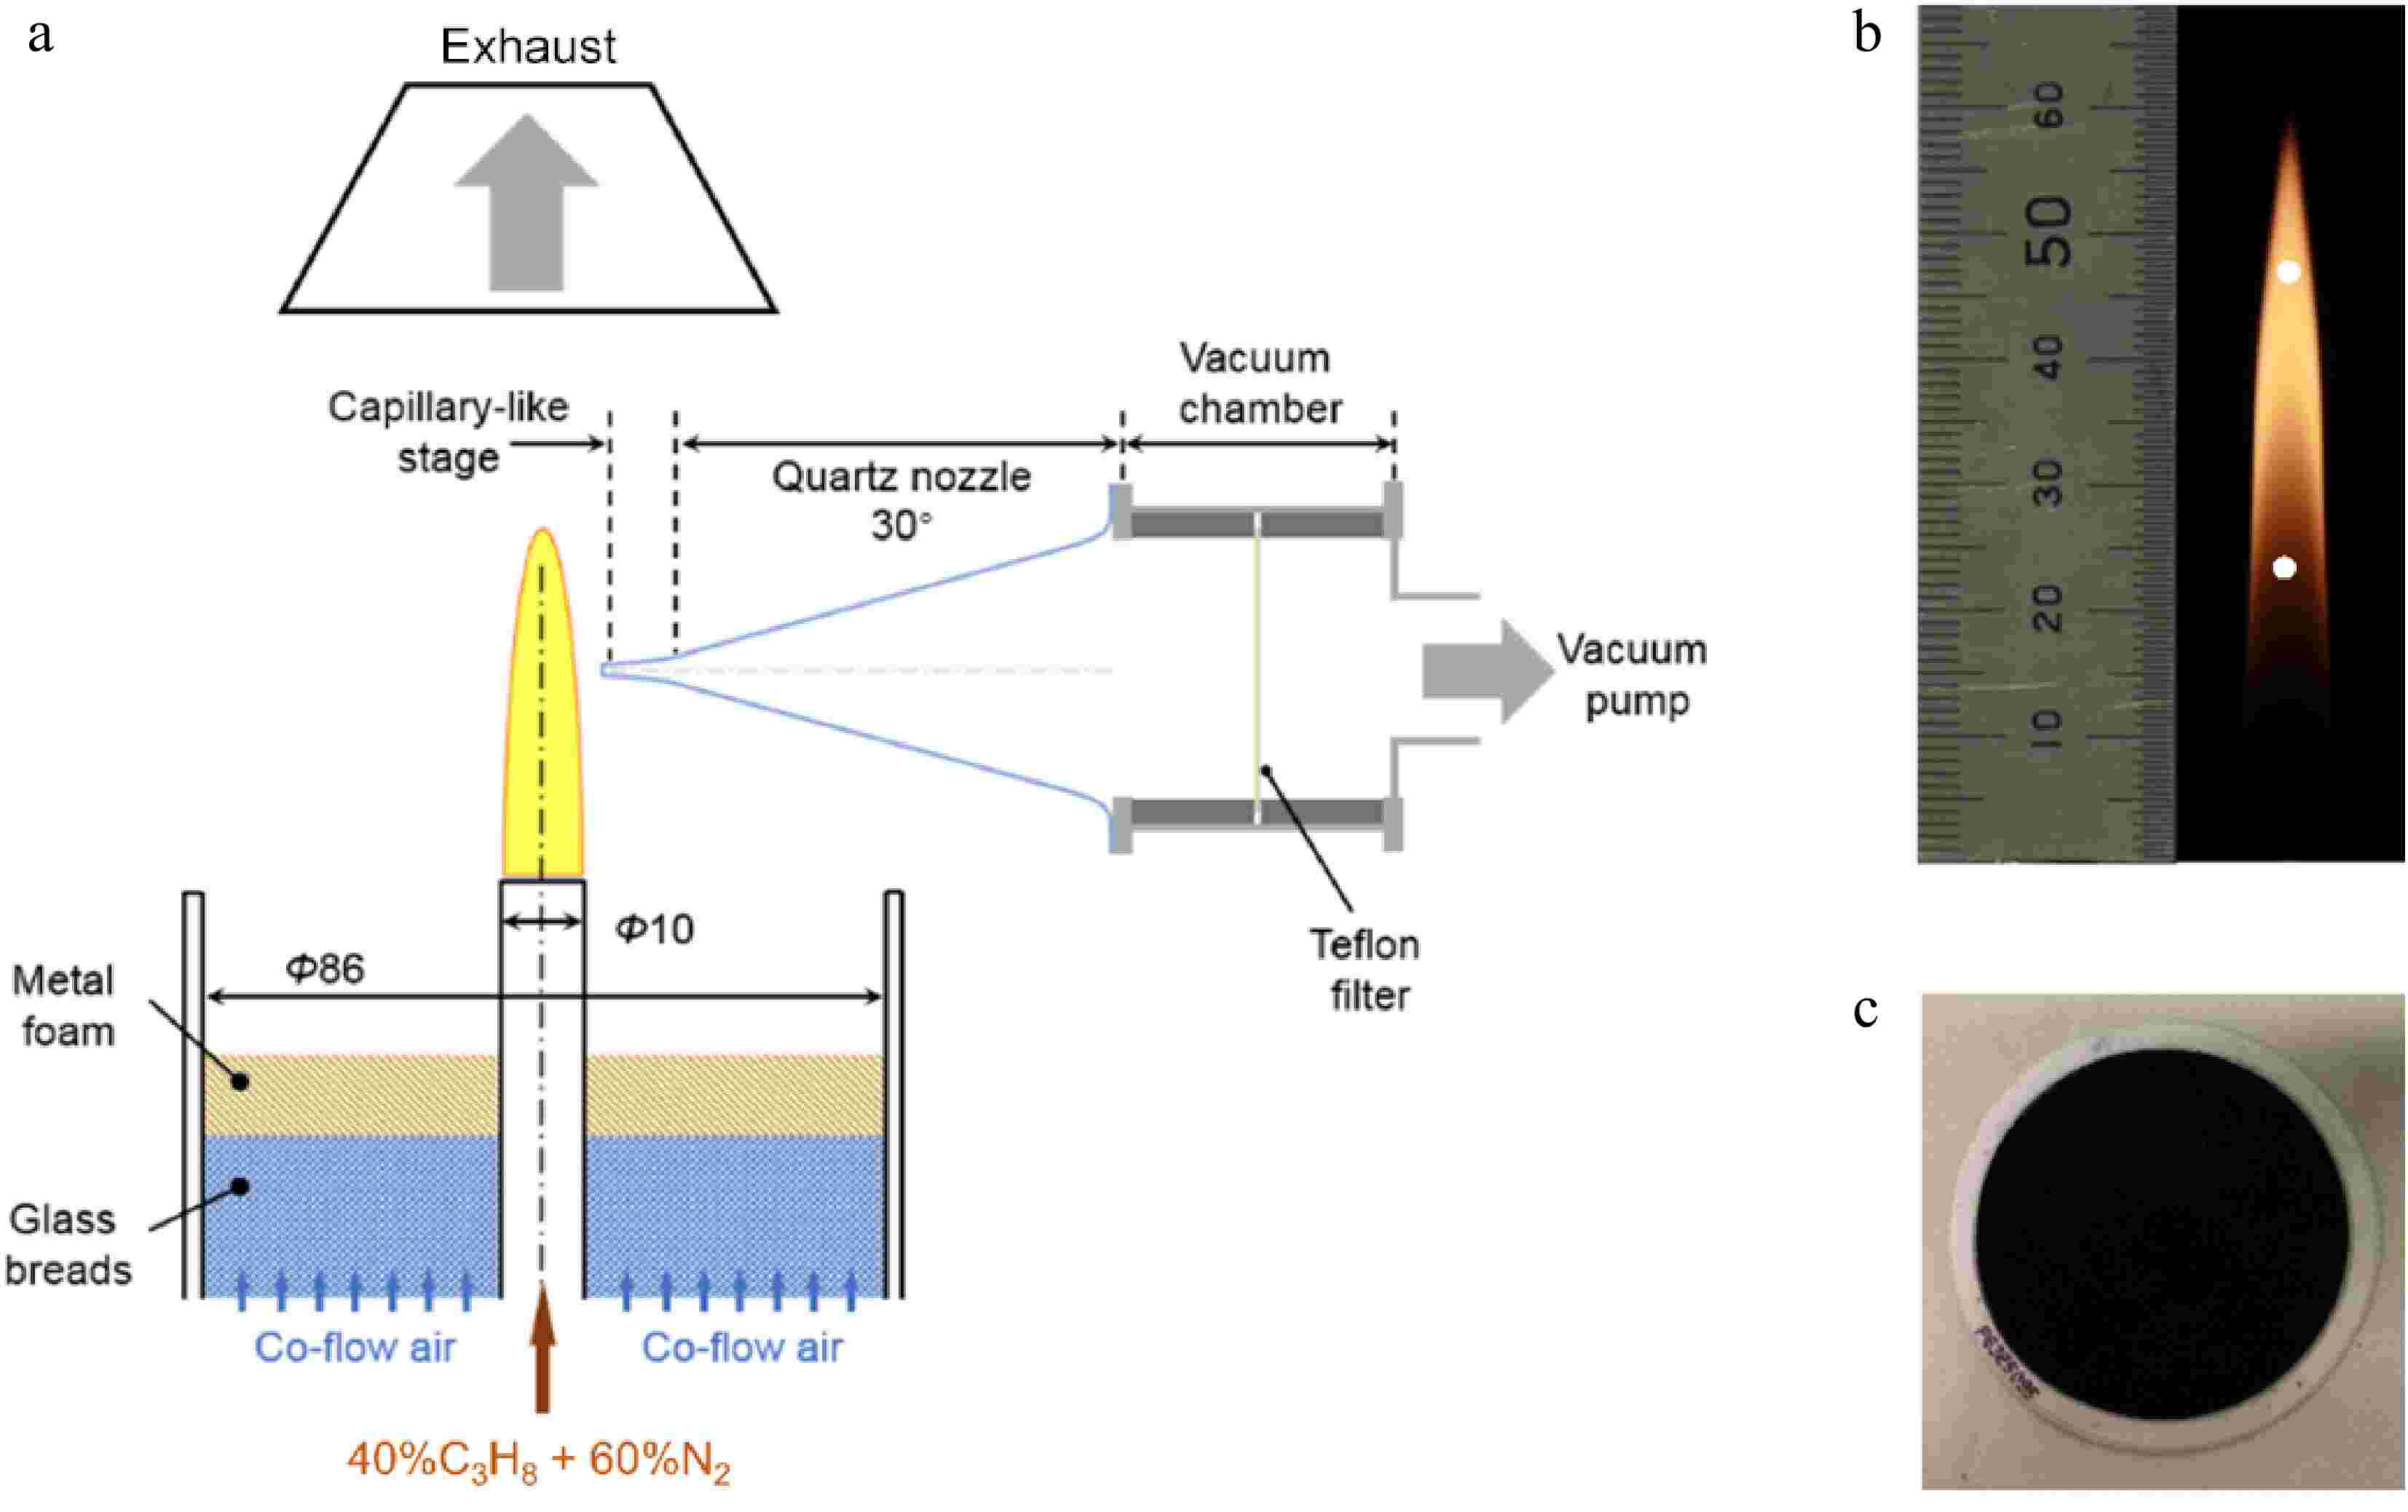
Figure 1.
(a) Schematic diagram of the experimental apparatus. (b) The propane co-flow diffusion flame with the sampling positions hinted by white circles. (c) Teflon filter (white) after sampling, showing that the cross-section area is completely covered by soot (black).
Capillary-nozzle-hybrid sampling method
-
The vacuum-based capillary-nozzle-hybrid sampling method has been reported in our recent work[37]. In brief, the sampling system in Fig. 1a comprises a quartz nozzle, a chamber with a filter mounted, and a vacuum pump. The main body of the quartz nozzle appears to be conical with a cone angle of 30°. Its tip is sharpened like a capillary (~8 mm × 1.2 mm) with an orifice diameter of about 300 μm, which can effectively reduce the perturbation to the flame structure. During sampling, initiated from the orifice, high-temperature soot particles flow through the capillary-like stage, then enter the nozzle region where a rapid expansion happens to decrease collisions and secondary reactions of samples, are finally deposited on a Teflon-based filter (7592-104, Whatman) mounted on the cross-section of the chamber (Fig. 1c). The accumulated soot should also be removed periodically to keep the nozzle tip unclogged. The burner is programmed to make reciprocating movements, controlled by an x-z translation stage. There are relative motions between the nozzle and the burner. After sampling at the target position for 5 s, the nozzle is moved toward the flame surface and stays for another 3 s to oxidize the deposits thoroughly.
Compared with ethylene diffusion flame under similar conditions[37], the propane flame presents great discrepancies in luminosity with the increasing height above the burner exit. Upstream of the flame, early-stage soot formation rates are rather limited. At a height above 30 mm, luminosity intensifies, accompanied by the accumulation of mature soot. Although the carbon flow rate and fuel exit velocity remain constant with the ethylene flame[37], the dark zone is elongated in the propane flame upstream, which is more suitable for collecting soot with a shorter residence time. Considering soot evolution and experimental efficiency, two sampling positions at 23.6 and 47.2 mm, corresponding to 0.4 hf and 0.8 hf respectively, are selected in this work. The positions are illustrated by white circles inFig. 1b. The degree of soot maturity can be directly evaluated according to their residence time in the flame, termed early-stage and mature soot, respectively. During each experiment, the collection times for early-stage and mature soot are 4 and 1 h, respectively. Sampling is repeated three times at each position to guarantee reliability and reproducibility. The collected soot sample is carefully scraped from filters and preserved for further characterization.
High-resolution transmission electron microscopy (HRTEM)
-
Before TEM analysis, soot is deposited on a C/Cu grid by depositing a drop of the soot suspension created by sonication in ethanol. A FEI Talos F200X G2 high-resolution transmission electron microscopy with a point resolution of 0.25 nm operating at 200 kV is used to obtain images at magnification of 120,000 and 1,050,000 for measuring the primary particle diameter (Dpp) and fringe. About 200−300 primary particles with distinguished boundaries are randomly selected and averaged for the determination of Dpp by ImageJ software. The fringe length (La) and tortuosity (Tf) are calculated with a MATLAB code following the method proposed by Yehliu et al.[39]. Specifically, La is a measurement of the physical extent of the carbon layers, and Tf is derived from the incorporation of five-membered rings or other sp3 hybridization within the aromatic frameworks[9].
Fourier Transform Infrared spectroscopy (FTIR)
-
A Nicolet 6700 FTIR spectrometer is employed to characterize the SFGs. The measured samples are prepared by mixing soot with KBr at a ratio of 1:1200. Then, the mixture is well-ground and pressed into a pellet. Finally, FTIR spectra are recorded in the range of 400−4,000 cm−1 with a resolution of 4 cm−1, and each spectrum results from 16 scan accumulations. A background spectrum is obtained from a pure KBr pellet to ensure that obtained signals are only attributable to soot chemical structure. Three measurements are repeated for each sample to ensure reliability.
Thermogravimetric analysis
Burn out
-
A thermogravimetric analyzer is employed to characterize the soot oxidation reactivity. About 2 mg of soot sample is placed in a ceramic crucible for each test. The particles are uniformly distributed to a thin layer for better mass and heat transfer. The International Confederation for Thermal Analysis and Calorimetry (ICTAC) Kinetics Committee recommends that multiple heating rate programs are more reliable than a single one concerning the computation of kinetic parameters[40]. Furthermore, slower heating rates are more beneficial in diminishing the derivations of sample temperature from the reference temperature. In this work, soot samples are oxidized under an air atmosphere (100 SCCM) from 50 to 750 °C with heating rates of 3, 5, 7, and 9 °C/min, respectively.
During non-isothermal experiments, all carbonaceous samples are converted into gaseous products below 750 °C without solid residuals. Finally, according to the mass loss history profiles, the differences in soot oxidation reactivity can be determined.
Partial oxidation
-
At the heating rate of 5 °C/min, soot is partially oxidized to various conversion rates (α). According to the mass loss history profiles obtained previously, the heating program stops after reaching the target temperature, and the residual sample is naturally cooled to room temperature. Meanwhile, the atmosphere is switched to N2 (100 SCCM) to terminate the oxidation reaction to preserve the properties at a certain conversion rate as far as possible. The maximum conversion rate is selected as 75%, with an interval of 25%. Although further oxidation is inevitable with the residual oxygen in TGA, the conversion interval is wide enough to overlap experimental interference. By this means, soot oxidation can be divided into early, middle, and late stages. Finally, samples with different conversion rates are characterized for monitoring changes in physicochemical structure during oxidation.
-
Considering the constant pressure throughout an experiment, the rate can be expressed in terms of temperature (T) and α,
dαdt=f(α)k(T) (1) where, f(α) is the reaction model, depending on the conversion mechanism; k(T) is the rate constant, following an Arrhenius-type dependence. With non-isothermal heating conditions in TGA, the rate is written as follows:
βdαdT=Aexp(−ERT)f(α) (2) where, E and A are the activation energy and pre-exponential factor, respectively, R is the universal gas constant, and β is the heating rate.
Integrating and using
x=ERT g(α)=∫α0dαg(α)=Aβ∫T0exp(−ERT)dT=AEβR∫∞xexp(−x)x2dx=AEβRp(x) (3) where, p(x) is temperature integral, approximately expressed as follows[41]:
logp(x)≈−2.315−0.457x (4) After combining and rearranging Eqns (3) and (4), the Flynn-Wall-Ozawa (FWO) equation (Eqn (5))[42,43] can be obtained:
logβ=logAERg(α)−2.315−0.457ERT (5) The activation energy can be determined from the slope of a plot of logβ against
1T Compensation effect
-
According to the Coats-Redfern method[44], temperature integral p(x) is expressed as follows:
p(x)=∫∞xexp(−x)x2dx=exp(−x)x2(1−2!x+3!x2−4!x3+⋯) (6) Excluding the high-order items, p(x) is simplified as:
p(x)≈exp(−x)x2(1−2!x)=R2T2E2(1−2RTE)exp(−ERT) (7) After combining and rearranging Eqns (3) and (4), the following equation can be obtained:
g(α)=AβRT2E(1−2RTE)exp(−ERT) (8) Due to
2RTE g(α)=AβRT2Eexp(−ERT) (9) lng(α)T2=lnARβE−ERT (10) The choice of reaction models refers to literature work[45]. Substituting heating rate and g(α) into Eqn (10), A and E can be estimated from the intercept and slope of a
lng(α)T2 1T -
Figure 2a, b presents TG and DTG curves for oxidation of early-stage soot (0.4 hf) and mature soot (0.8 hf) at different heating rates, respectively. Two characteristic temperatures derived from the TG curves, namely light-off temperature (T10) and burnout temperature (T90), are introduced to describe oxidation processes semi-quantitatively. T10 and T90 are oxidation temperatures at α = 10% and 90%, respectively. Generally, as the heating rate increases from 3 to 9 °C/min, TG curves gradually move to higher temperature zones. Lower heating rates can raise overall reaction time for a preset temperature range. The samples have sufficient time to undergo high-temperature treatment. In contrast, a higher heating rate can introduce the effects of thermal inertia, and soot samples cannot respond to the rapidly-changing temperature quickly.
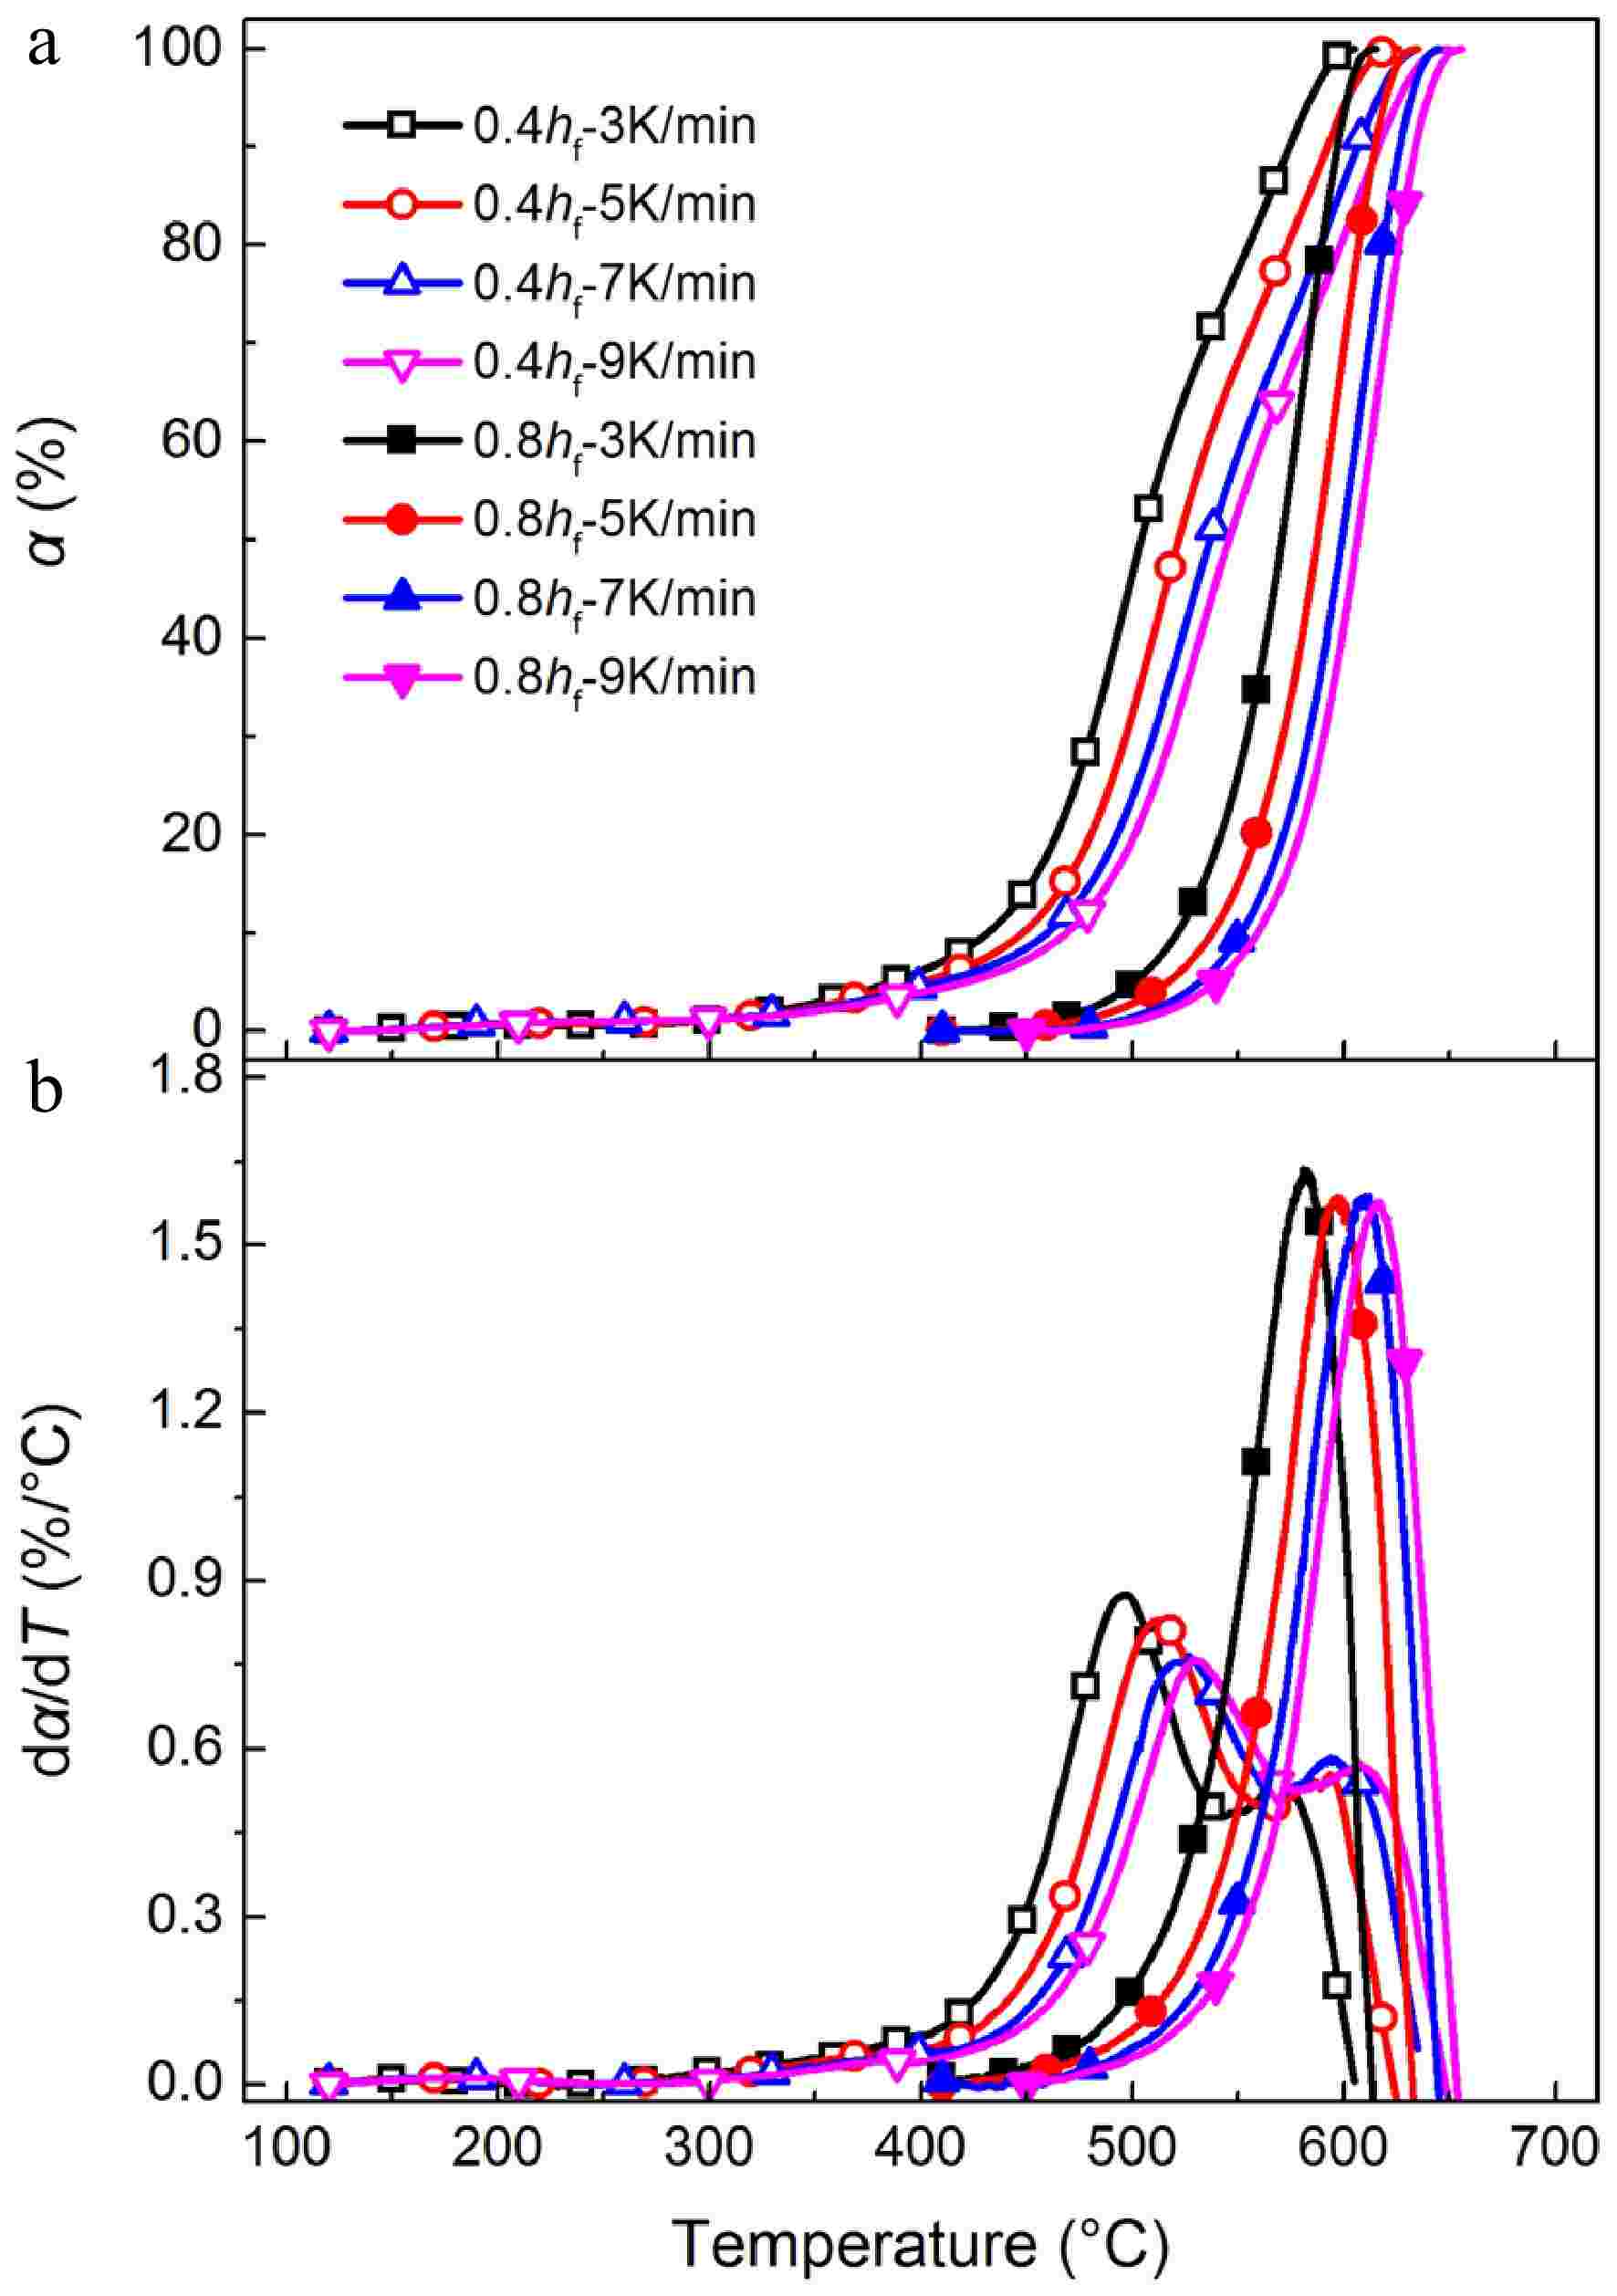
Figure 2.
(a) TG, and (b) DTG curves for soot sampled at 0.4 hf and 0.8 hf. Samples are heated from 50 to 750 °C with heating rates of 3, 5, 7, and 9 °C/min.
For example, for mature soot heated at 5 °C/min, mass loss behavior is triggered when the temperature is above 450 °C, accelerated at about 500 °C, and decelerated above 610 °C. In contrast, early-stage soot is more thermally unstable, presenting two-stage mass loss behavior. It is triggered at 300 °C, accelerated at about 450 °C, and decelerated above 530 °C. Judging from Table 1, T10 for mature soot is about 90 °C higher than that for early-stage soot under the same heating rate. Mature soot is primarily composed of stable PAHs, which have a much higher ratio of basal carbon atoms, about 100−1,000 times less reactive to oxidants than those present on the edge[10]. As a result, the oxidation of mature soot can only occur at a much higher temperature. While early-stage soot contains a higher ratio of thermal liable structure, such as hydrogen/oxygen-rich groups of randomly-oriented crystallites. The incorporation of heteroatoms can improve the H/C ratio[10], and the density of surface active sites[46], facilitating soot to be consumed by oxygen even at intermediate temperatures. In the late stage of oxidation, TG curves become close to each other, and the difference in T90 decreases to about 20 °C. It can be deduced that the carbon skeletons of early-stage soot and mature soot may share similar structure, which is in agreement with our previous observations[37].
Table 1. T10 and T90 measured from TG curves for soot samples at 0.4 hf and 0.8 hf.
Sample T10/°C T90/°C 0.4 hf - 3 °C/min 432 575 0.4 hf - 5 °C/min 448 592 0.4 hf - 7 °C/min 460 606 0.4 hf - 9 °C/min 469 616 0.8 hf - 3 °C/min 521 597 0.8 hf - 5 °C/min 538 615 0.8 hf - 7 °C/min 552 626 0.8 hf - 9 °C/min 559 634 Similar to ethylene flame[37], DTG curves (Fig. 2b) of early-stage soot from propane flames also present bimodal behaviors, indicating two local maximum oxidation rates, defined as low-T conversion process and carbonaceous substance oxidation processes. The former process is mainly involved with volatile organic fraction releasing and early oxidation reactions of thermal liable structure. However, in this work, the low-T conversion process prevails, indicating a higher content of reactive groups than ethylene-based soot. As representative components of alkene and alkane, C2H4 and C3H8 have considerable discrepancies in decomposition pathways and concentrations of main combustion products[38], directly determining soot physicochemical structure and oxidation reactivity. Acetylene is much richer in ethylene flames[47], while propane flames could be rich in methyl and methylene radicals[48], actively participating in the formation of aliphatic side chains or bridges to connect PAH networks[49]. Soot with a higher H/C ratio is more easily consumed by oxygen, generating an intensified low-T conversion process at about 500 °C.
Variation of kinetic parameters with conversion rate
-
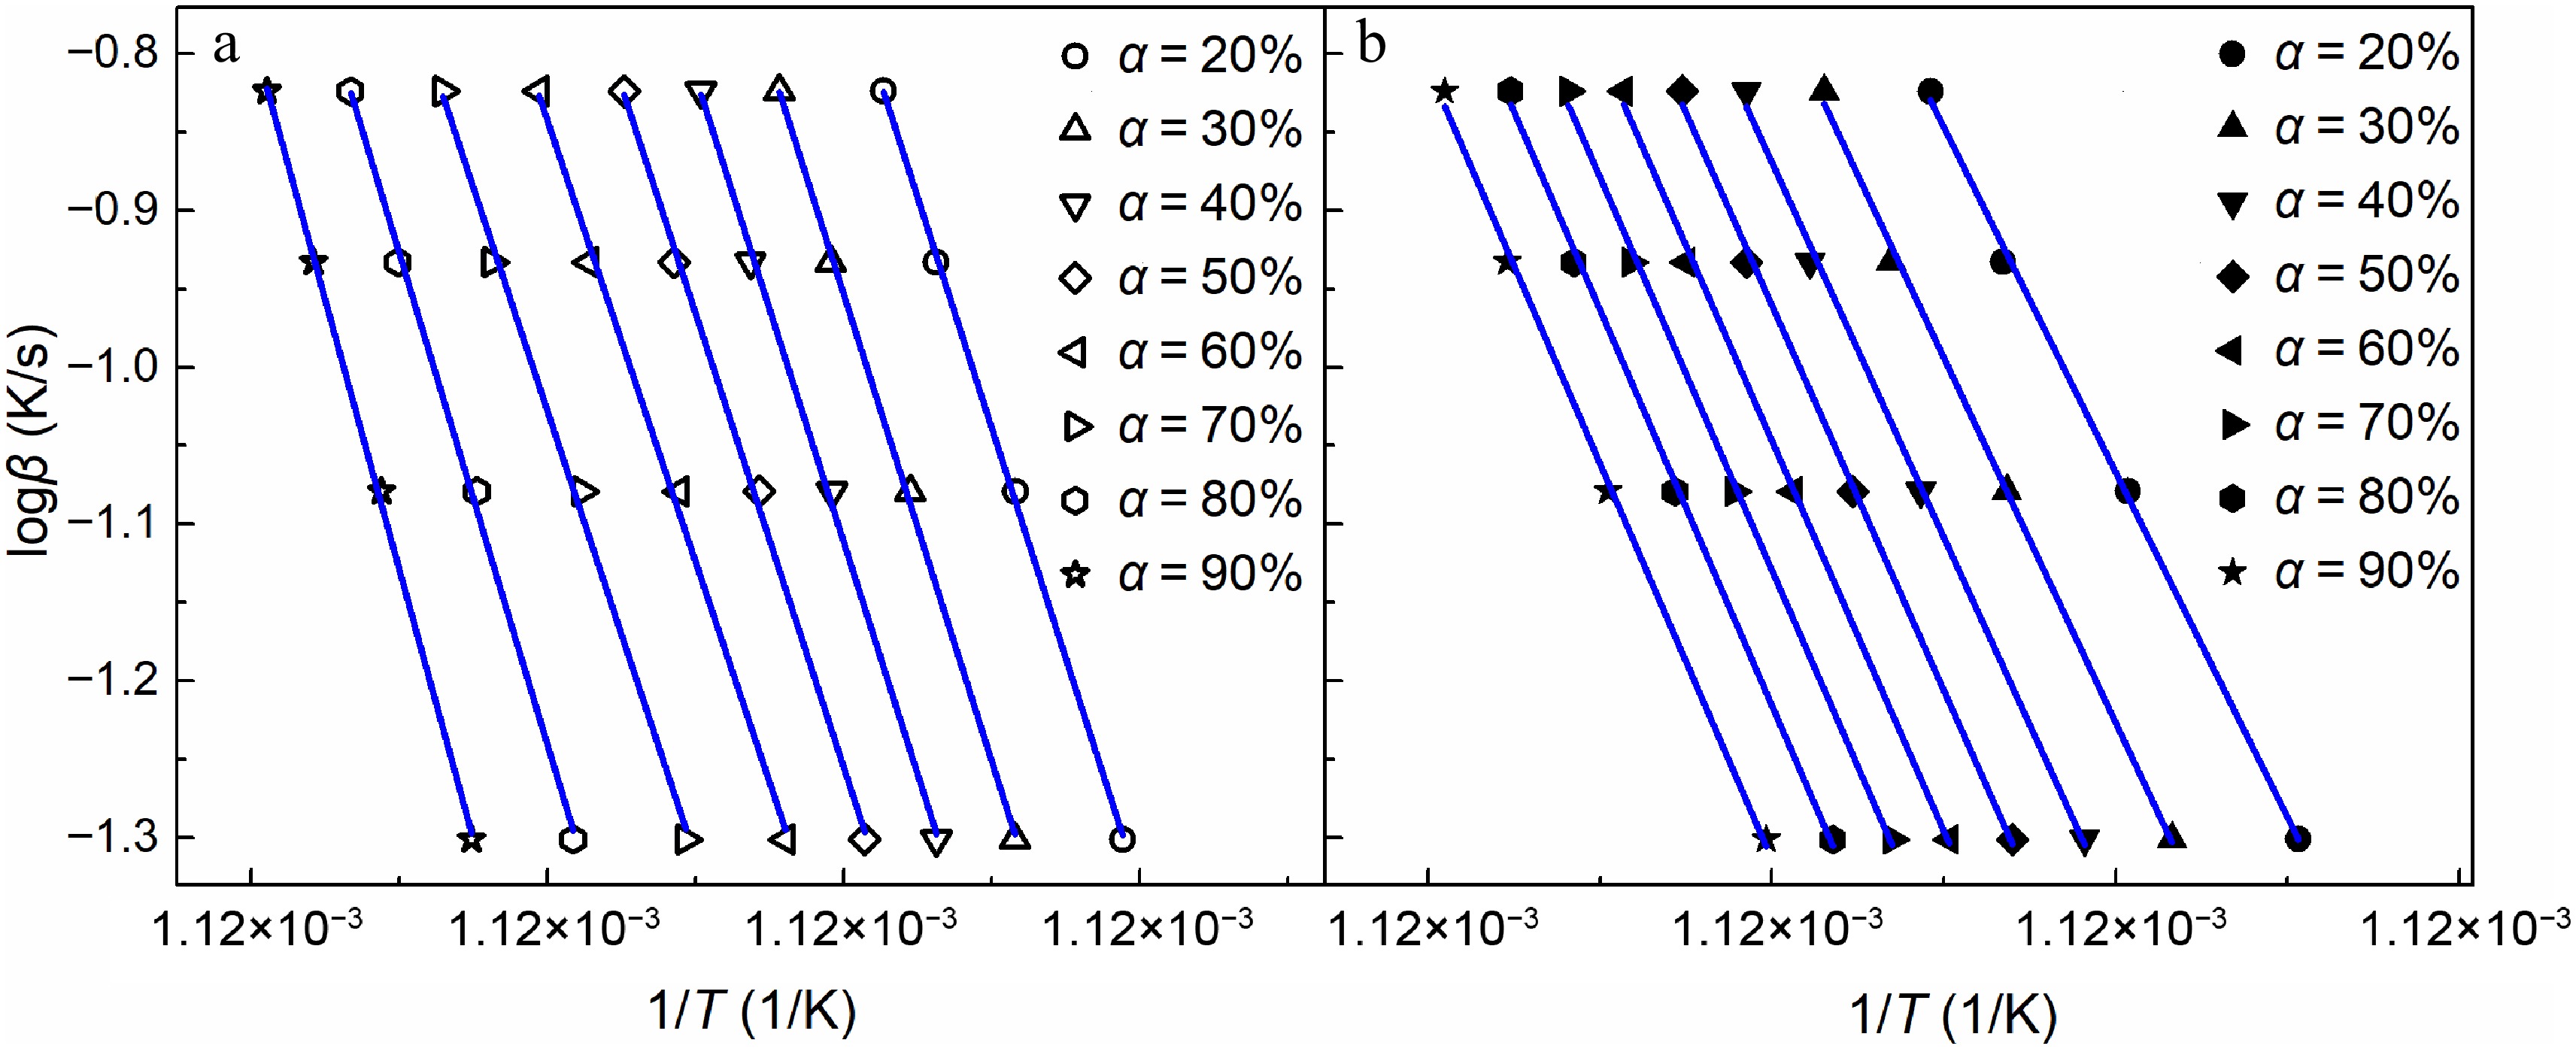
The slopes of iso-conversional plots (Fig. 3) determine the activation energy at various conversion rates based on Eqn (5). Due to the relatively slower oxidation rate of early-stage soot at a 10% conversion rate shown in Fig. 2, it can lead to substantial errors for the fitting of iso-conversional plots. Therefore, the activation energy is analyzed at conversion rates above 20%.

Figure 3.
Isoconversional plots under various conversions (α = 20%−90%) for soot sampled at (a) 0.4 hf, and (b) 0.8 hf. Symbols are the experimental results, while lines are the fitted results.
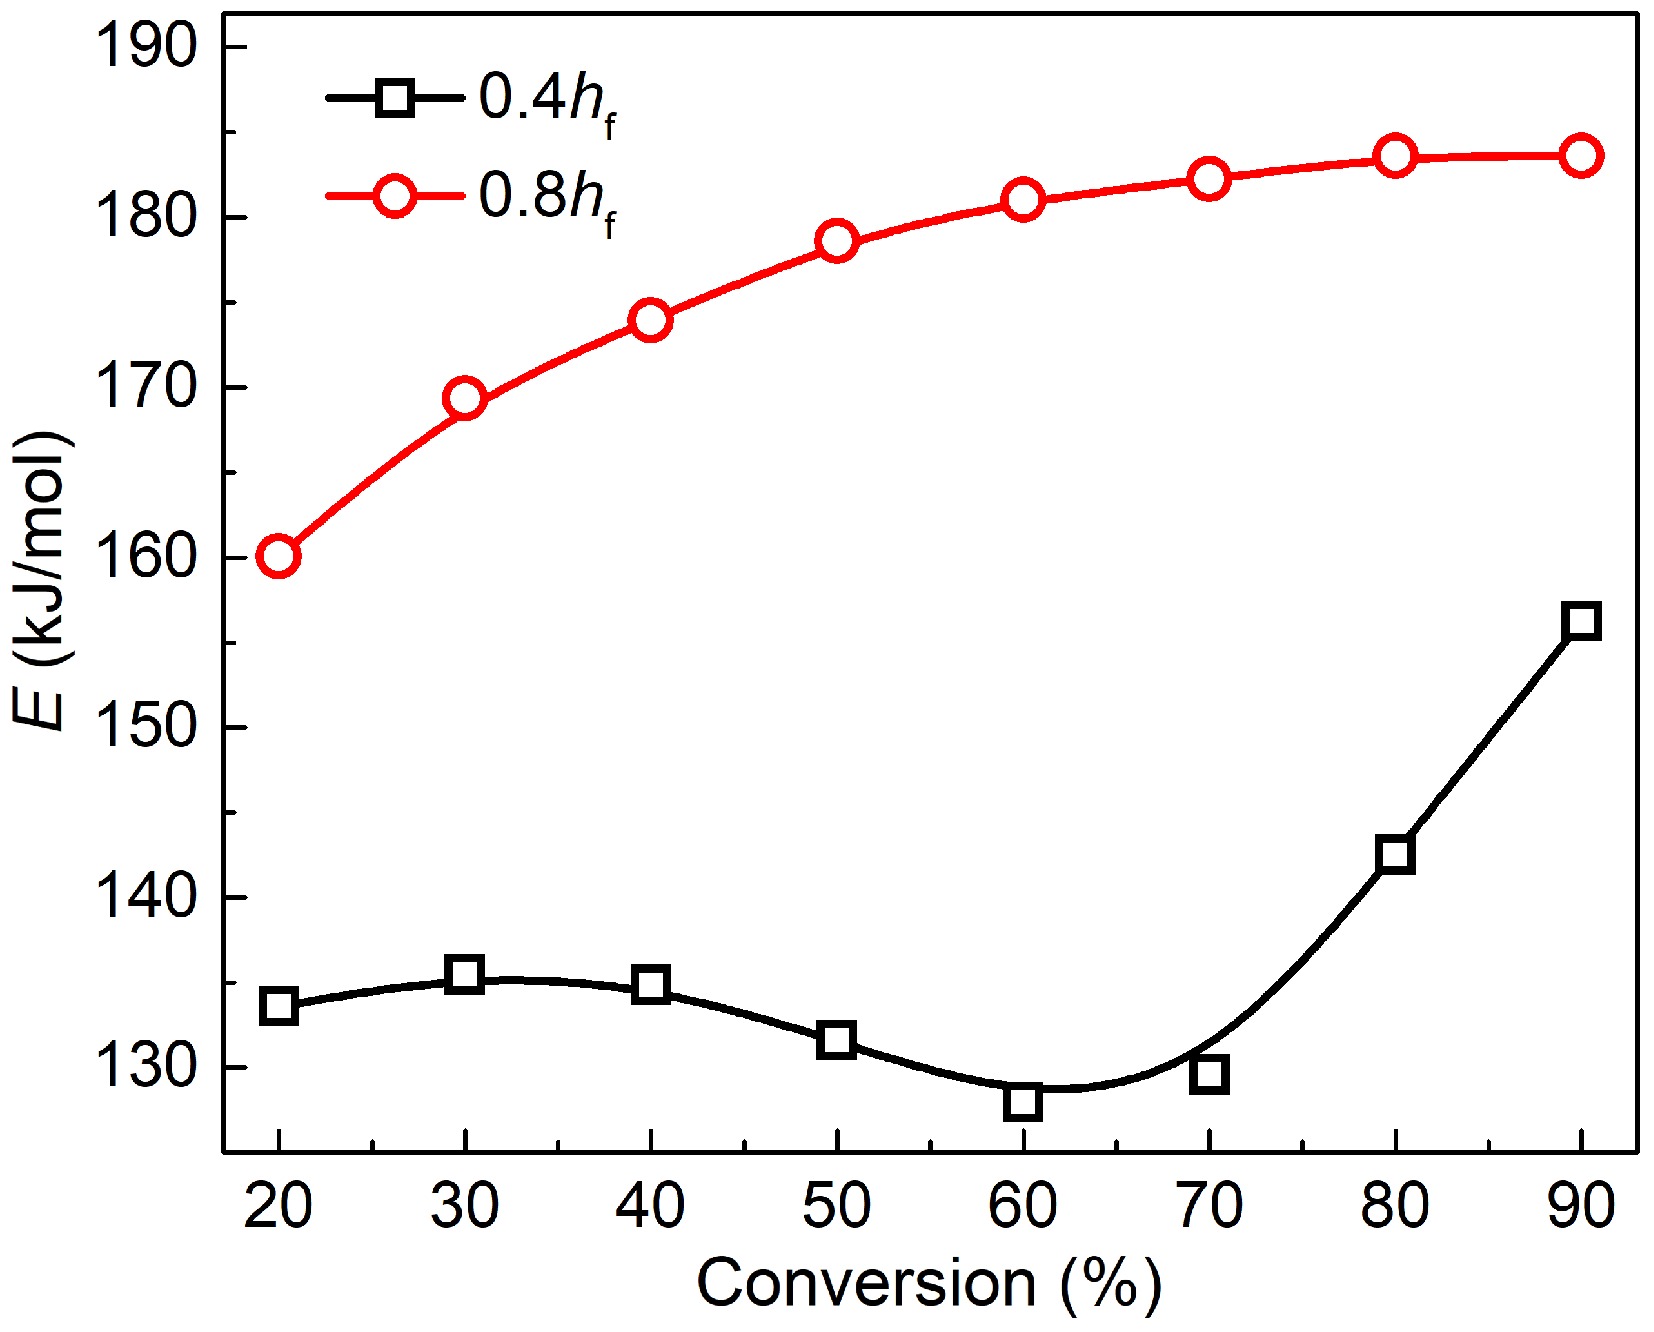
Variations in activation energy within the conversion rates of 20%−90% are plotted in Fig. 4. For mature soot, the activation energy grows monotonically with the conversion rate and has a slower and slower growth rate. The value distributes in the range of 160 to 185 kJ/mol, similar to the reported results for samples from diesel engine exhaust[14,50], and flame tips[12,13], but lower than graphite and some commercial carbon blacks[51]. Reactions of dehydrogenation, recombination, and cyclization in the flame high-temperature zone make mature soot structure more compact[52]. However, the formed core-shell configuration is far from an ideal lamellar structure, unable to survive at temperatures as high as graphite.
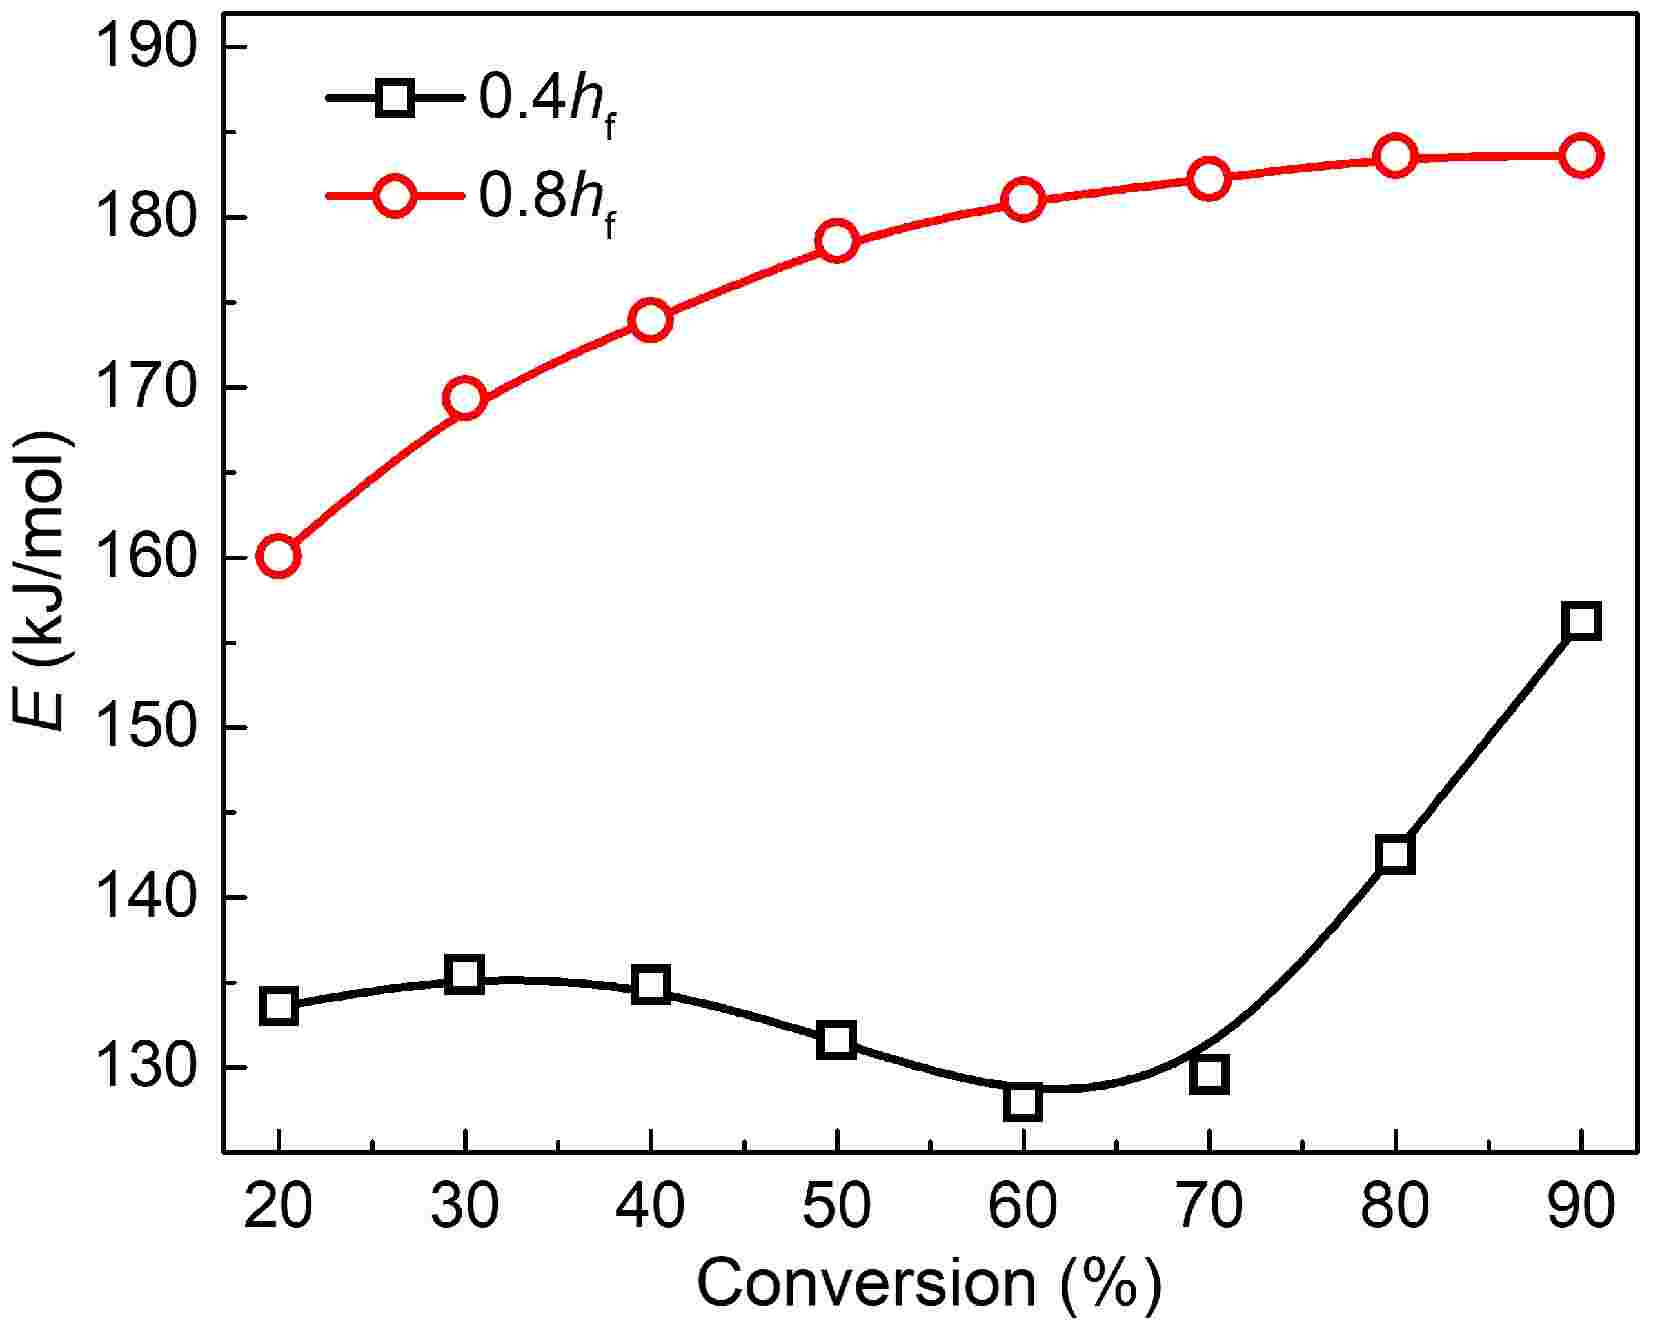
Figure 4.
Plots of activation energy vs conversion rate for soot sampled at 0.4 hf (square) and 0.8 hf (circle).
For soot sampled from 0.4 hf, activation energy is distributed in the range of 128 to 156 kJ/mol, remarkably lower than mature soot at the same conversion rate. Notably, activation energy's dependence on conversion rate appears to be multi-staged. Before the 70% conversion rate, activation energy slowly falls. Subsequently, it presents an abrupt increase, more than 150 kJ/mol.
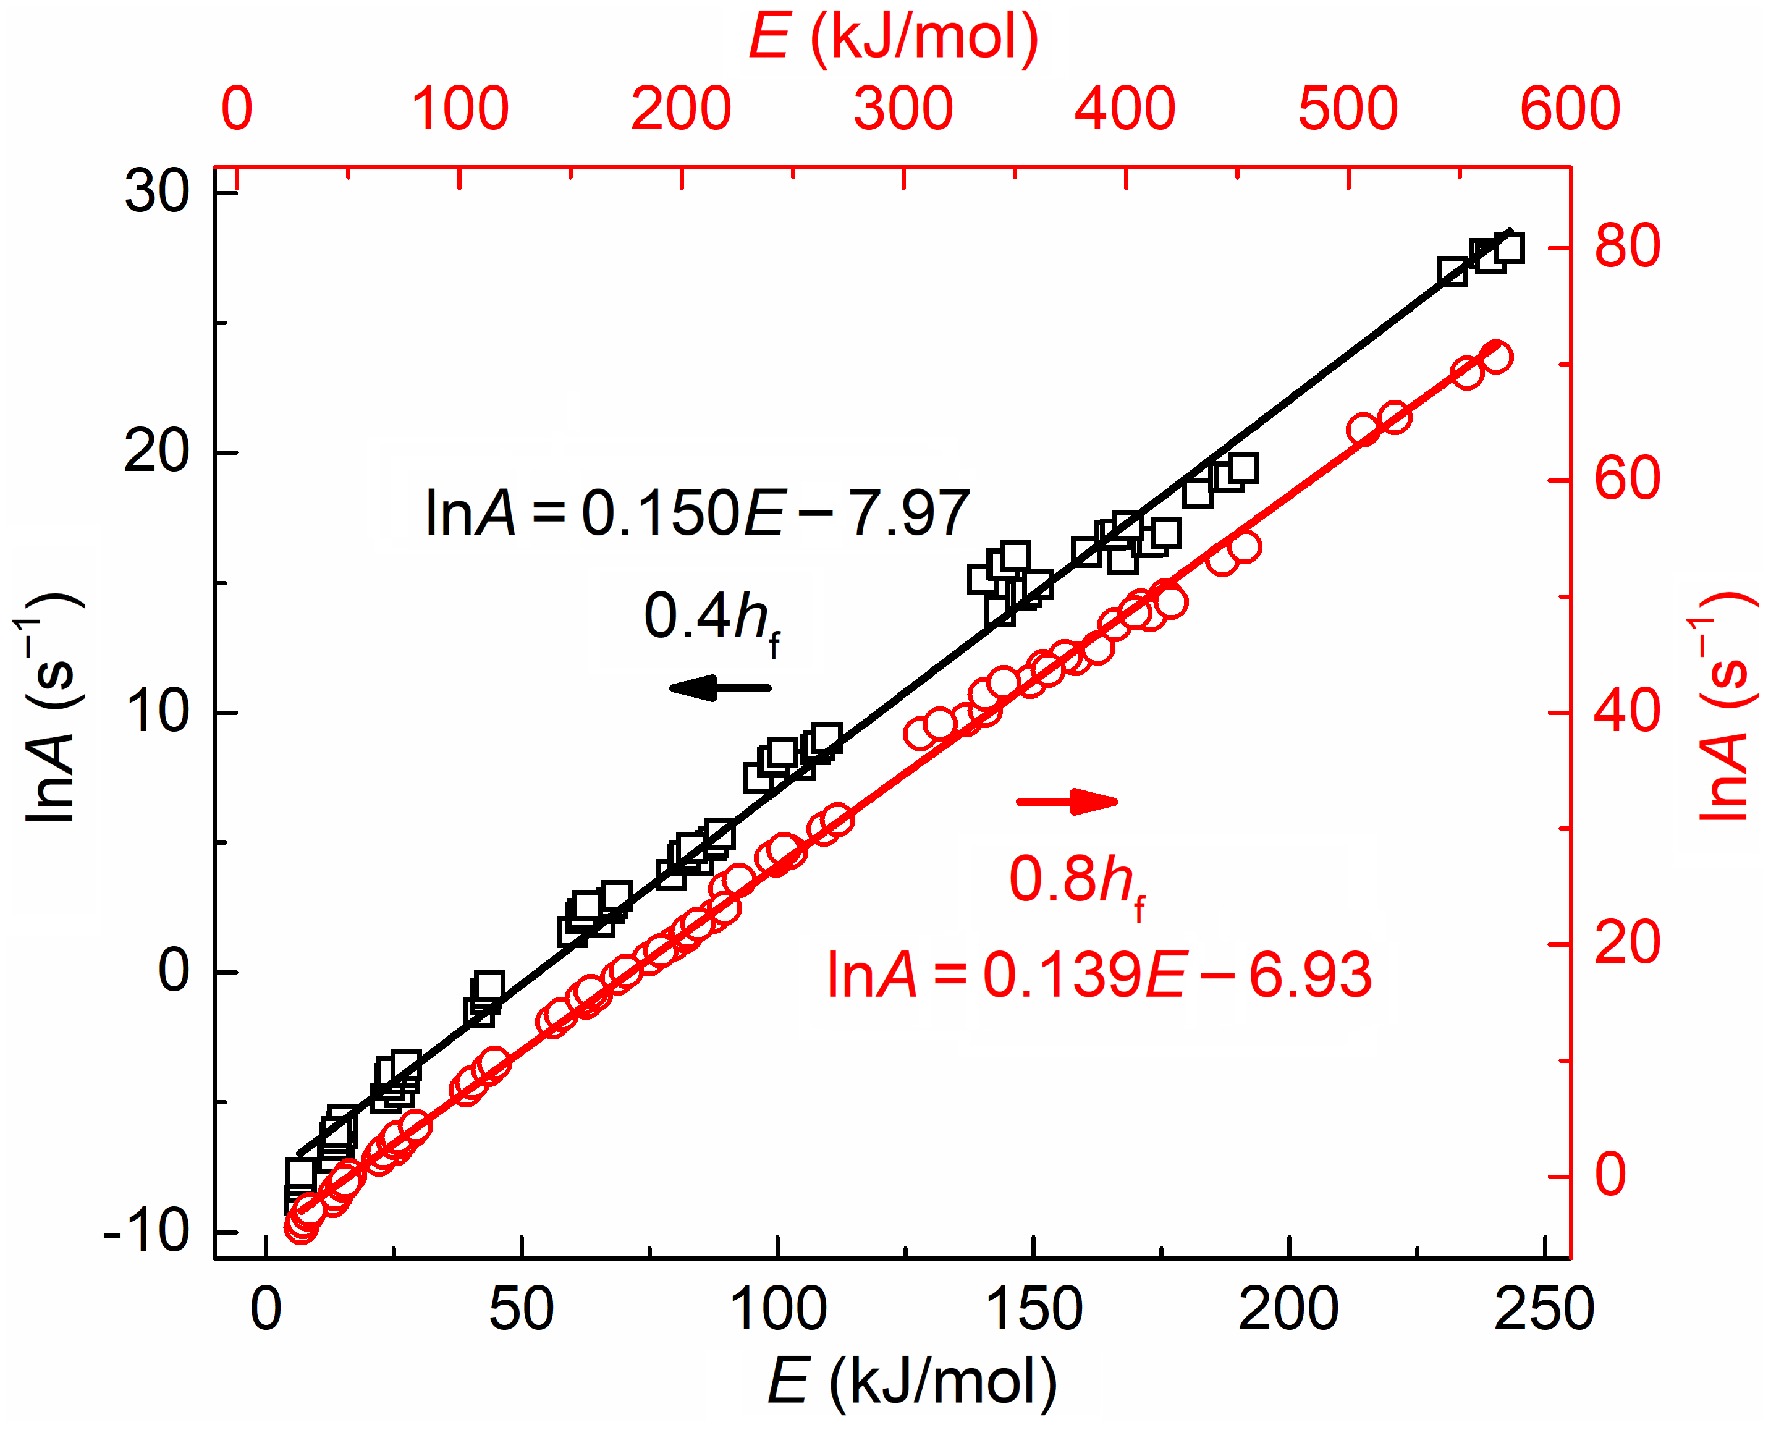
Figure 5 plots the variations in activation energy with pre-exponential factor for two soot samples. The coefficient of determination R2 is higher than 0.99, indicating an apparent linear relationship between lnA and E. The higher activation energy indicates higher reaction resistance; as a compensation, more reaction sites on the soot surface are activated to elevate the collision efficiencies with oxygen[11], which helps maintain oxidation rates at a remarkable level. Hence, activation energy and pre-exponential factors increase simultaneously, which is in accordance with previous results[45,51].
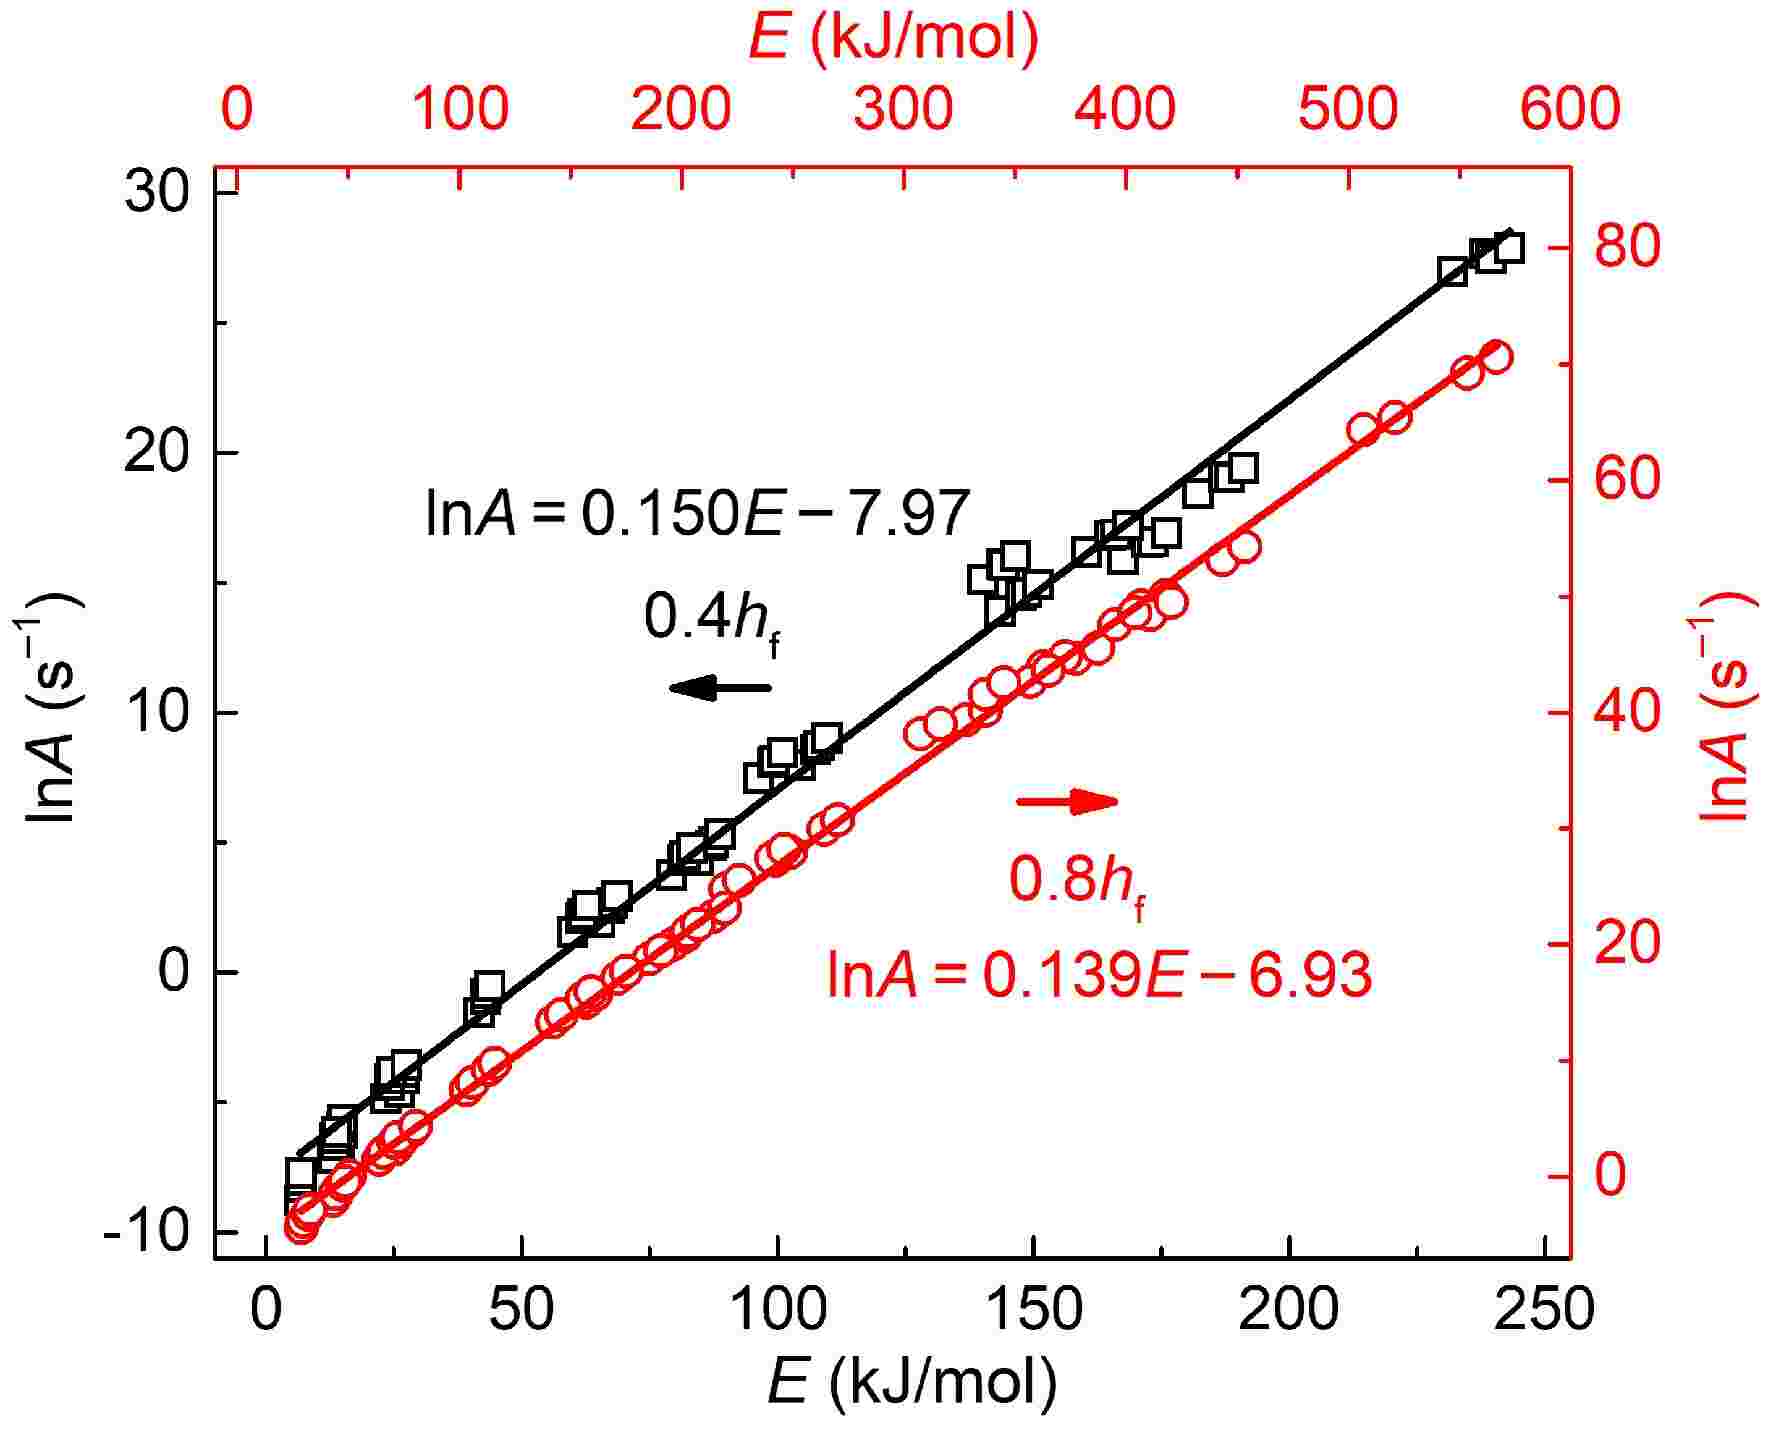
Figure 5.
Variations in activation energy with pre-exponential factors for soot sampled at 0.4 hf (square) and 0.8 hf (circle).
Structural evolution analysis
-
The analysis above reveals the oxidation kinetics of early-stage soot and mature soot. In this section, physicochemical structural evolutions are monitored at 5 °C/min to explain intrinsic oxidation mechanisms. The activation energy is derived from curve fitting at four heating rates. Considering that the conversion rate at 5 °C/min is slightly higher than that at the average heating rate, the rapid increase of activation energy reasonably occurs at a 75% conversion rate. The amount of residuals is insufficient for structural characterizations at higher conversion rates, so conversion rates are selected as 0%, 25%, 50%, and 75% for following soot structure evolution during oxidation.
Physical structure
-
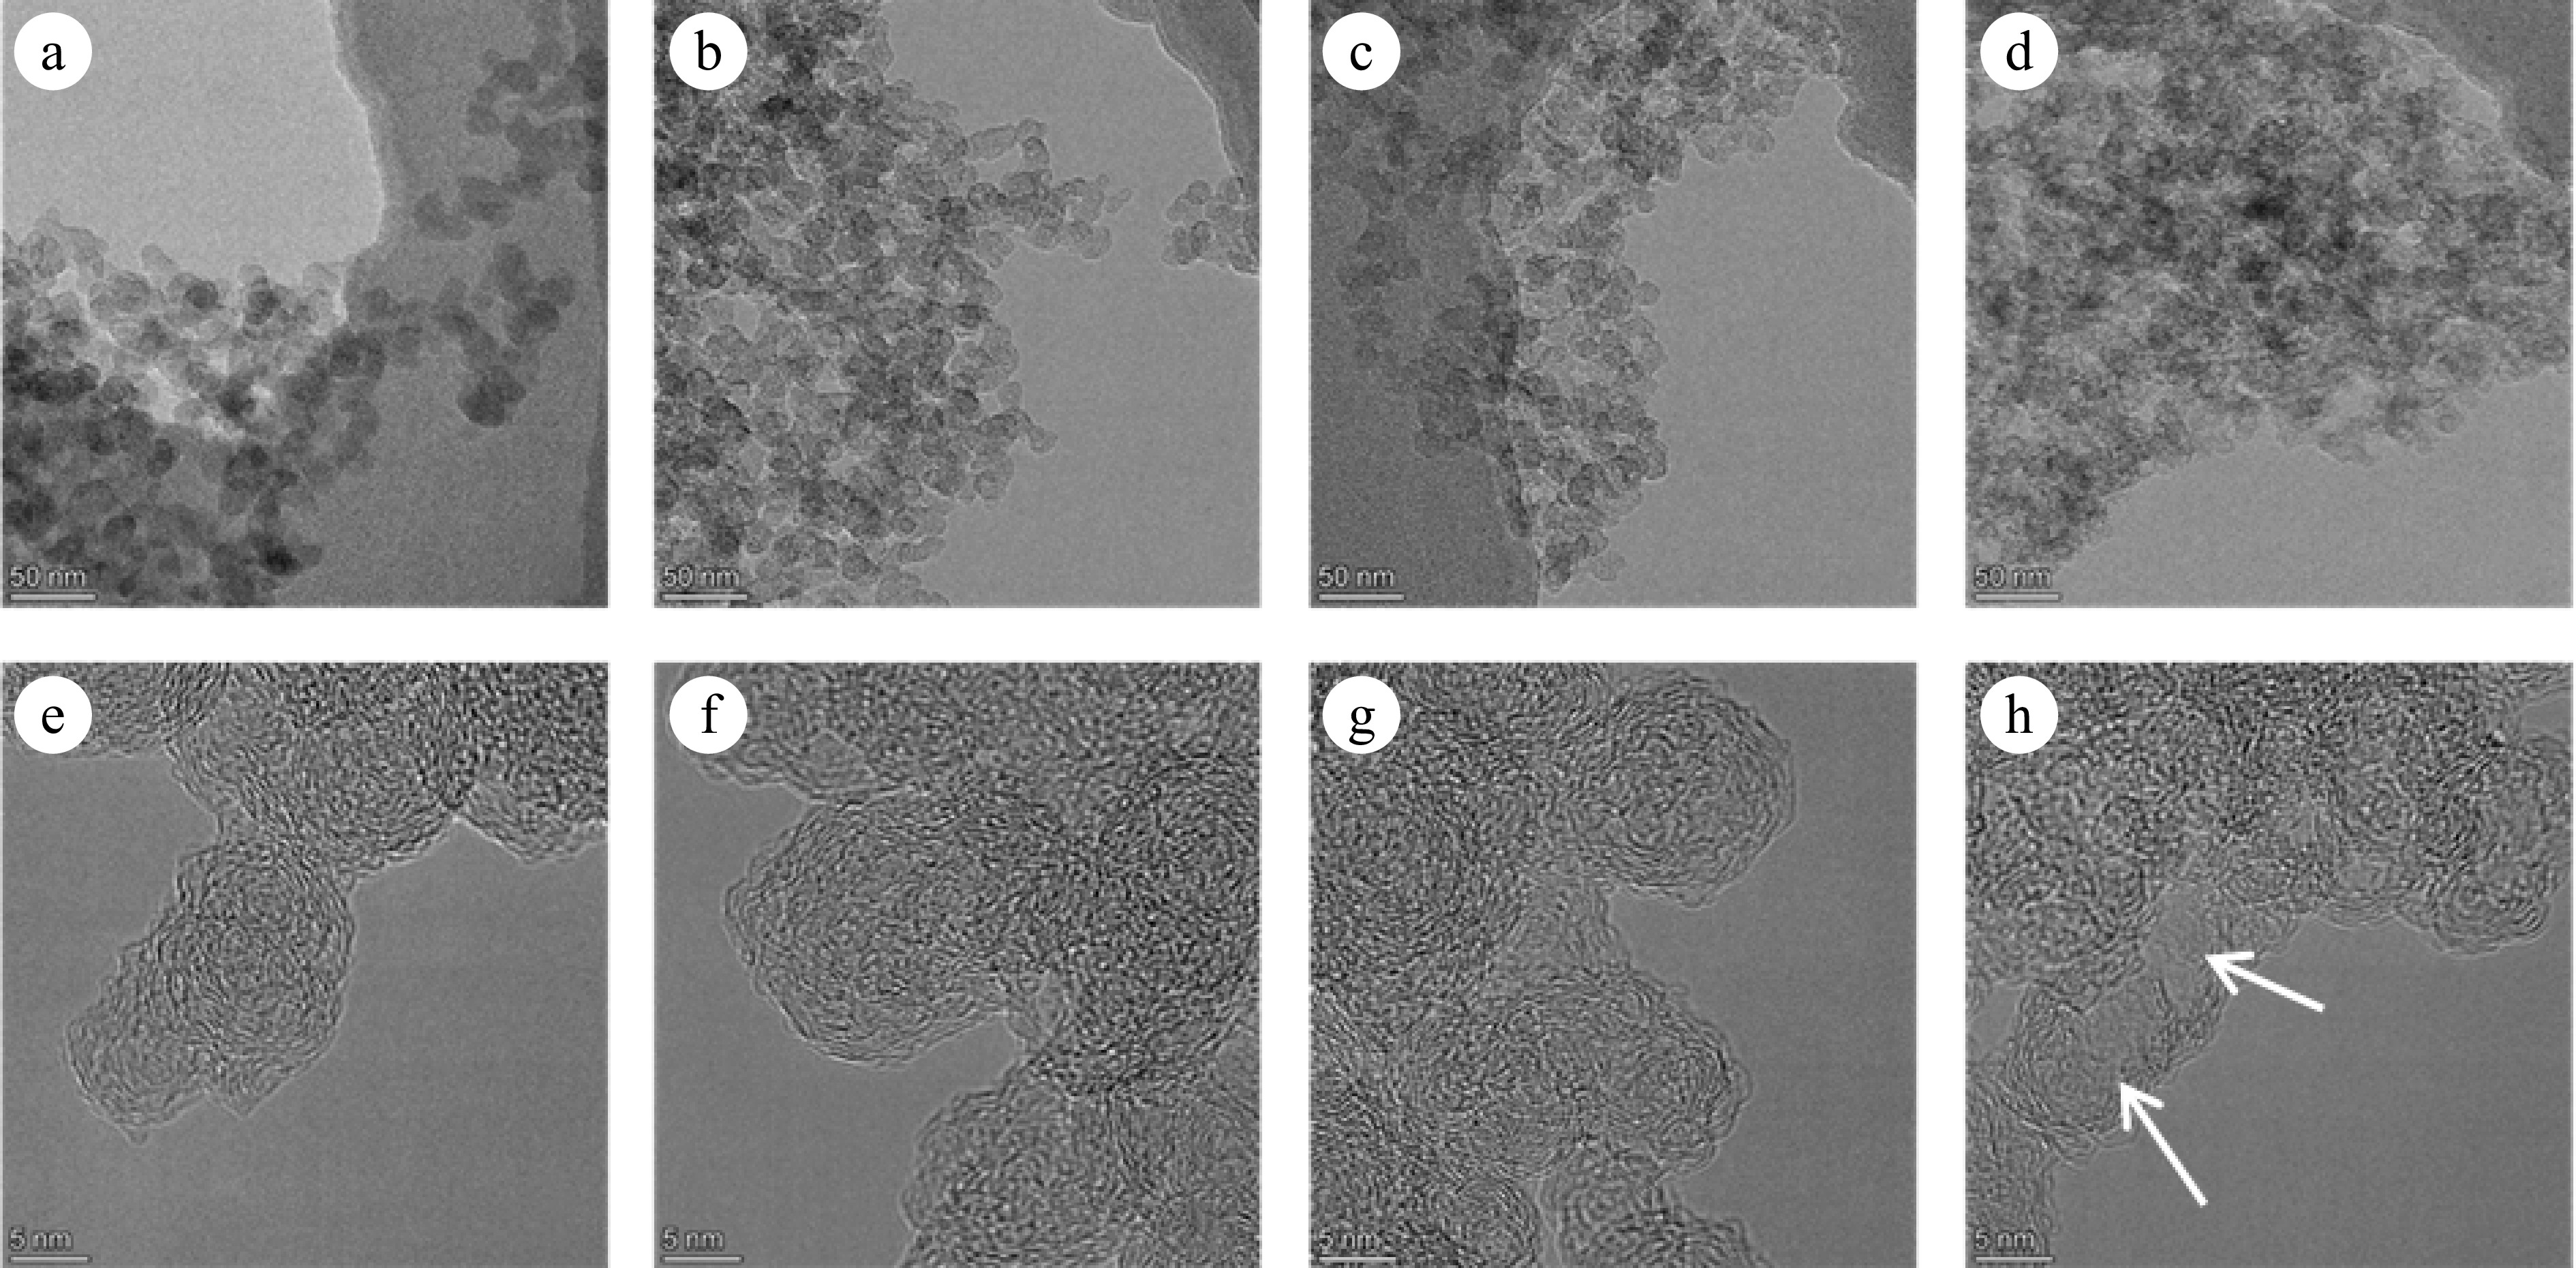
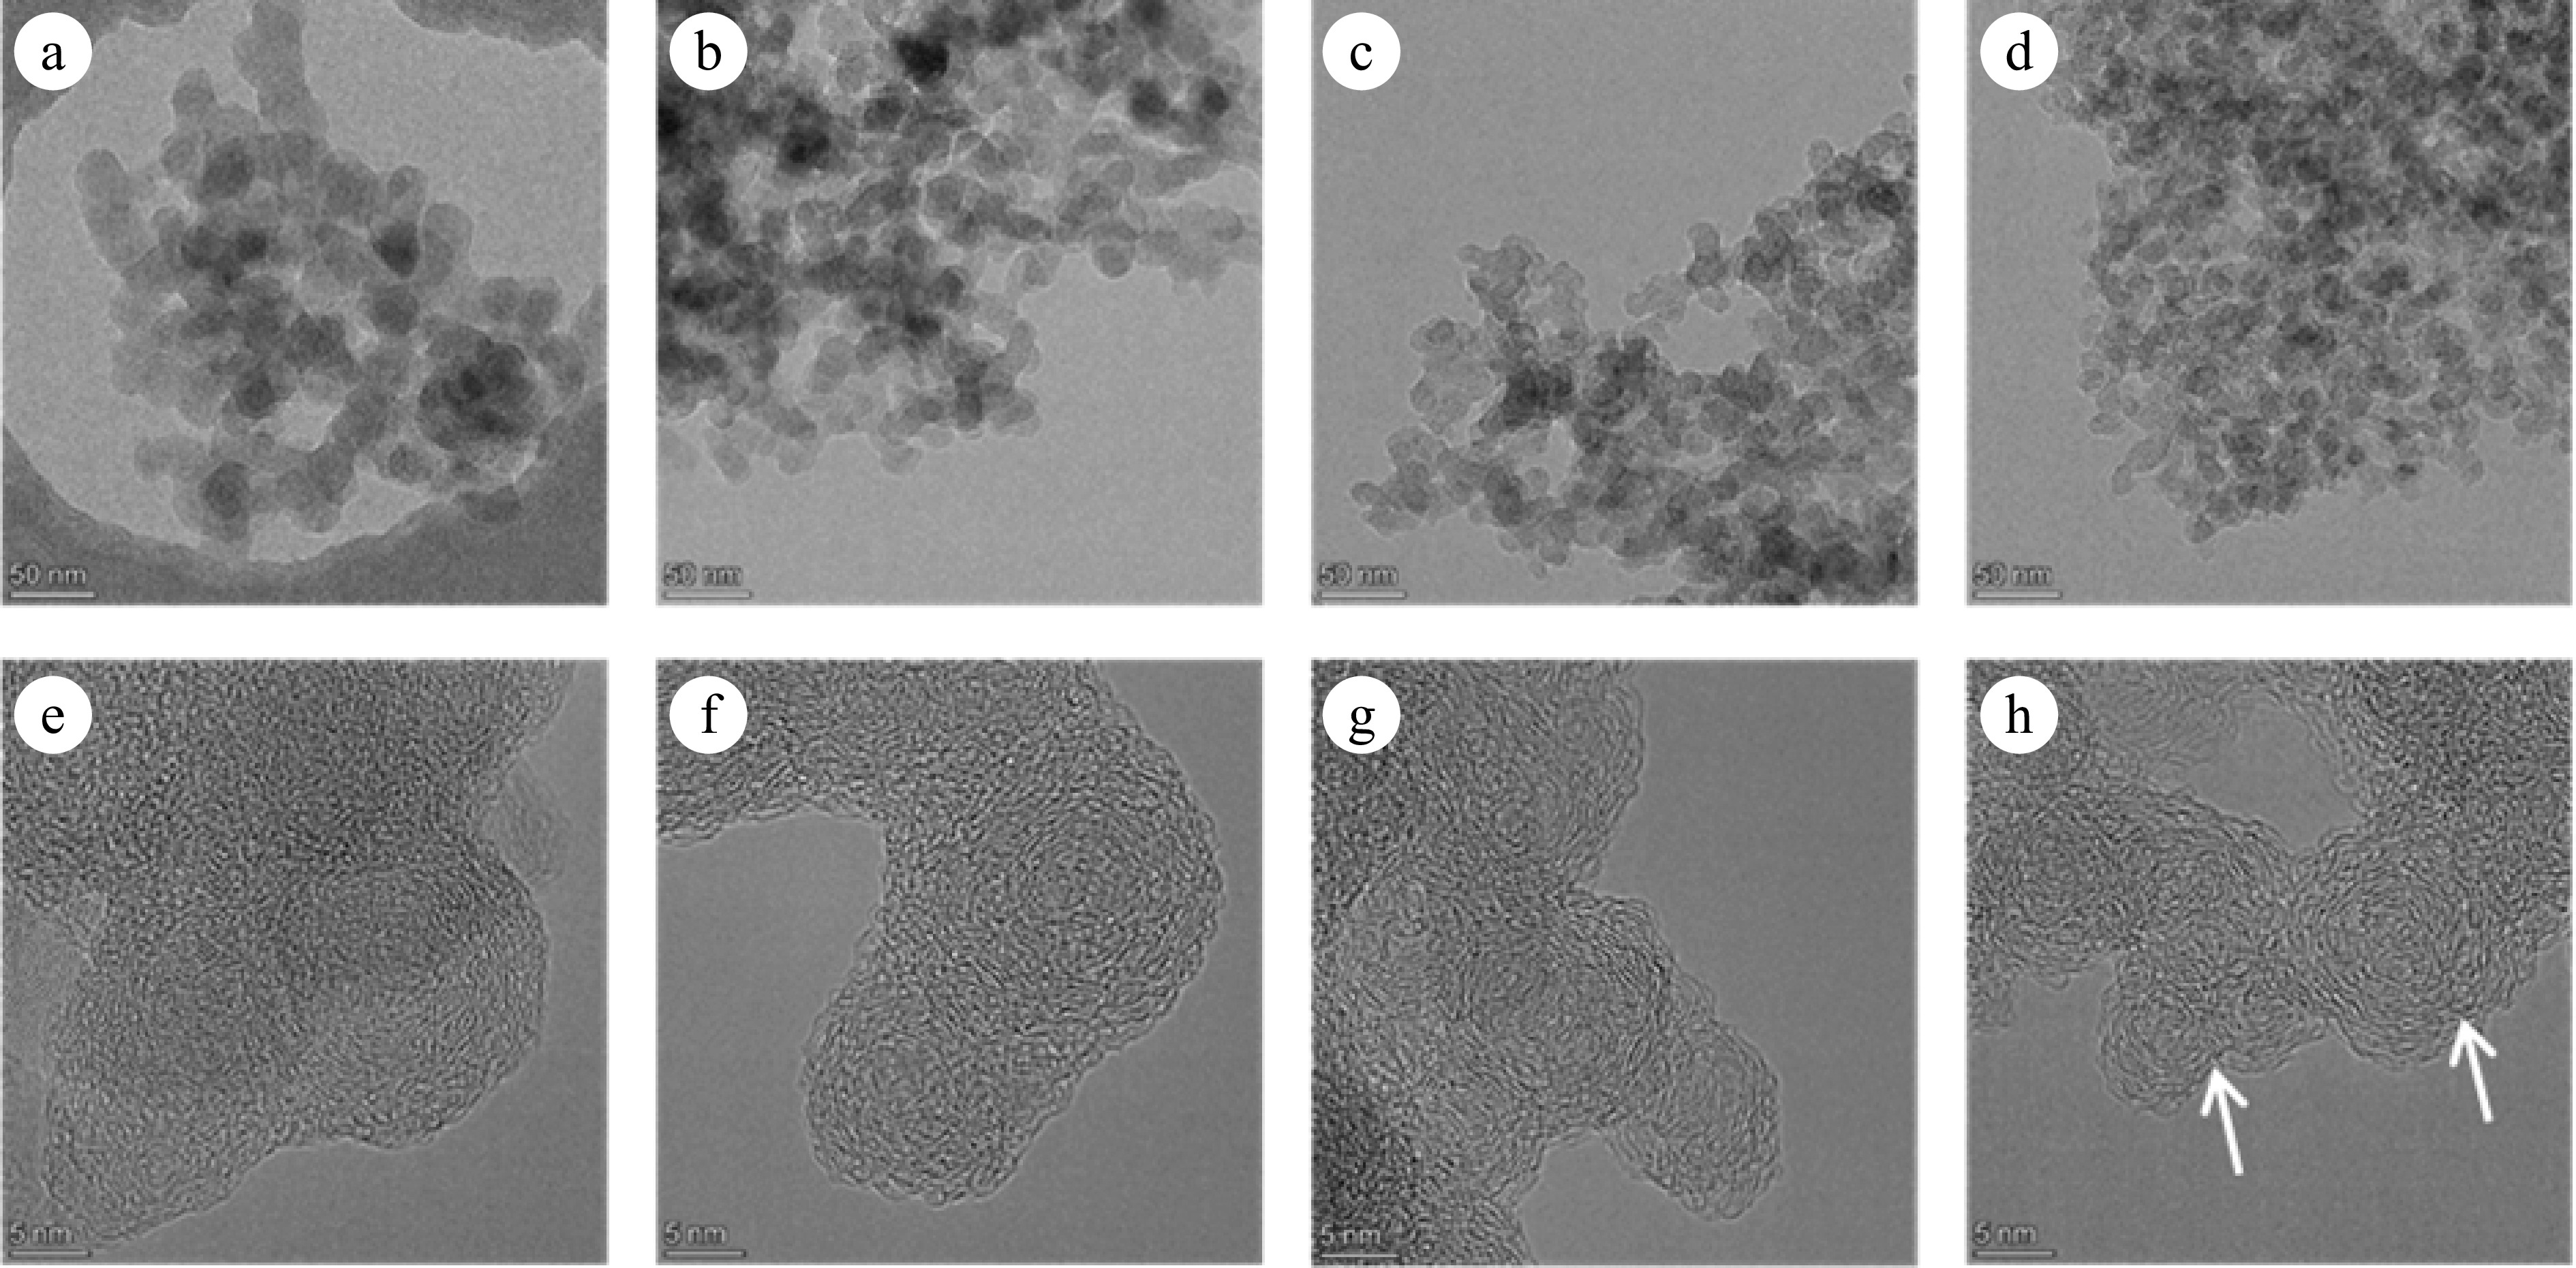
Figures 6 and 7 present TEM and HRTEM images of mature and early-stage soot at different conversion rates, respectively. In TEM images, soot aggregates are composed of near-spherical primary particles, presenting open chain-like structure. In HRTEM images, PAHs with different sizes exist in the form of fringes[10]. The evolution of Dpp is shown in Fig. 8. For mature soot, the particle diameter is slightly decreased from 17.98 to 14.60 nm. The decline of particle diameter is more obvious for early-stage soot, from 22.06 to 14.84 nm. After nucleation, soot mass is determined by surface addition reactions, while particle size is determined by the coagulation processes[53]. In the post-flame zone, surface growth is suppressed due to the depletion of soot precursors and lower collision efficiencies[28]. As a consequence, oxidation prevails over mass growth, resulting in the declined diameters and worse degree of sphericity of mature soot. On the other hand, for both soot samples, the gradually reduced particle diameter with the increasing conversion rate indicates an external oxidation mode[54]. The gas-solid reactions preferentially and uniformly occur in the vicinity of external surface, resulting in an increased surface area[55].

Figure 6.
(a)−(d) TEM, and (e)−(h) HRTEM images of soot sampled at 0.8 hf with different conversion rates: (a), (e) α = 0; (b), (f) α = 25%; (c), (g) α = 50%; (d), (h) α = 75%. The arrows indicate the hollow formed in the particle interior.
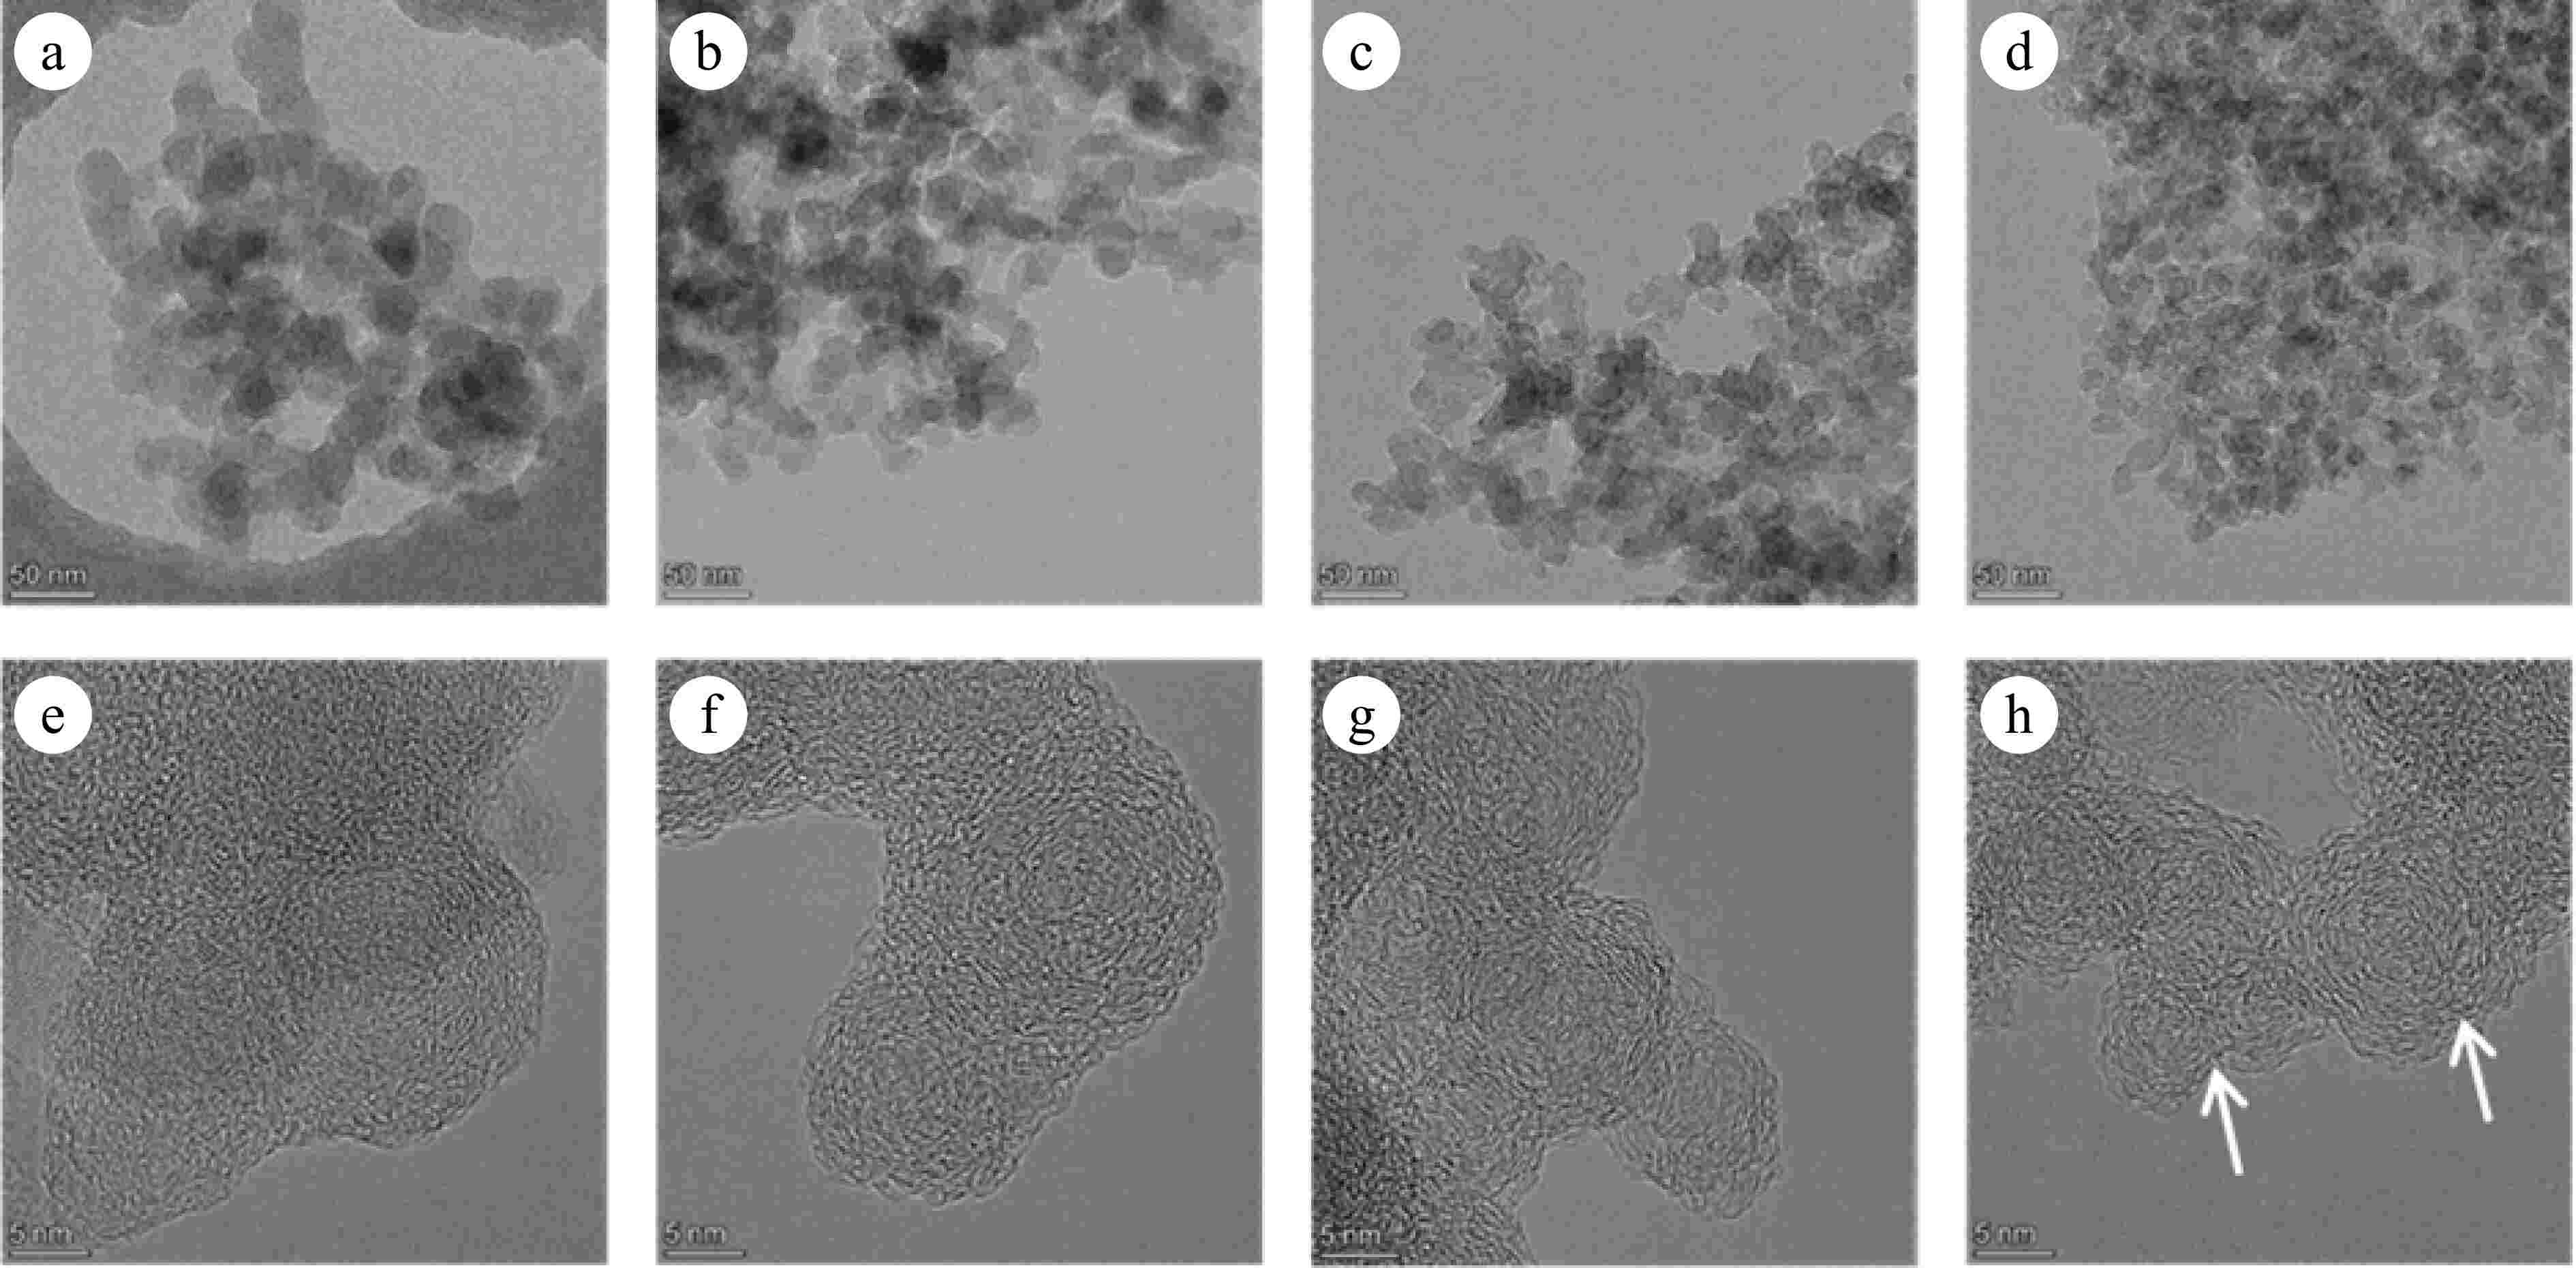
Figure 7.
(a)−(d) TEM, and (e)−(h) HRTEM images of soot sampled at 0.4 hf with different conversion rates: (a), (e) α = 0; (b), (f) α = 25%; (c), (g) α = 50%; (d), (h) α = 75%. The arrows indicate the onion structure formed in the particle interior.
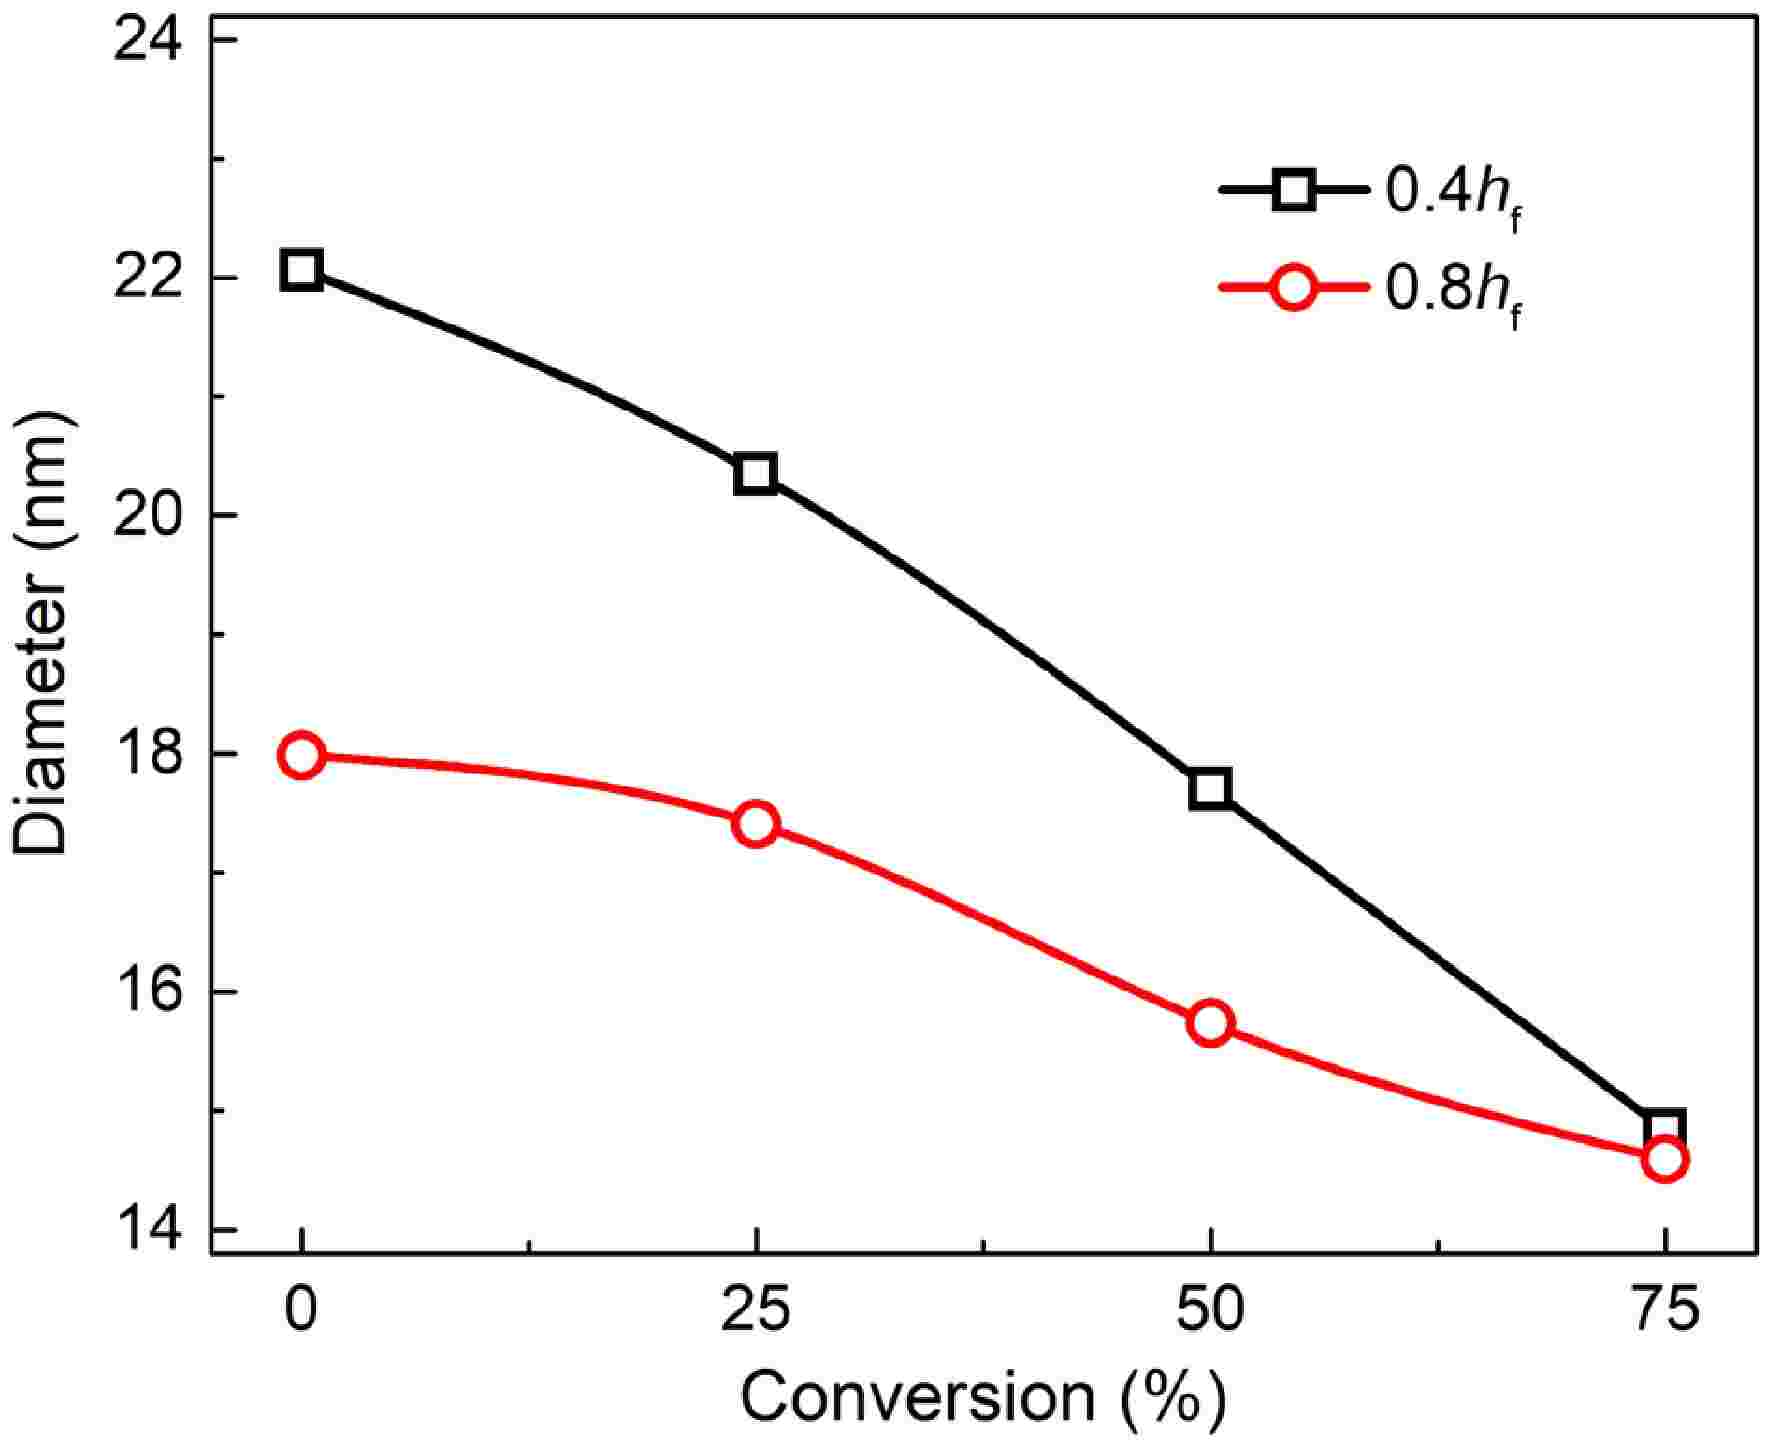
Figure 8.
Primary particle diameter of soot sampled at 0.4 hf (square) and 0.8 hf (circle) as a function of conversion rate.
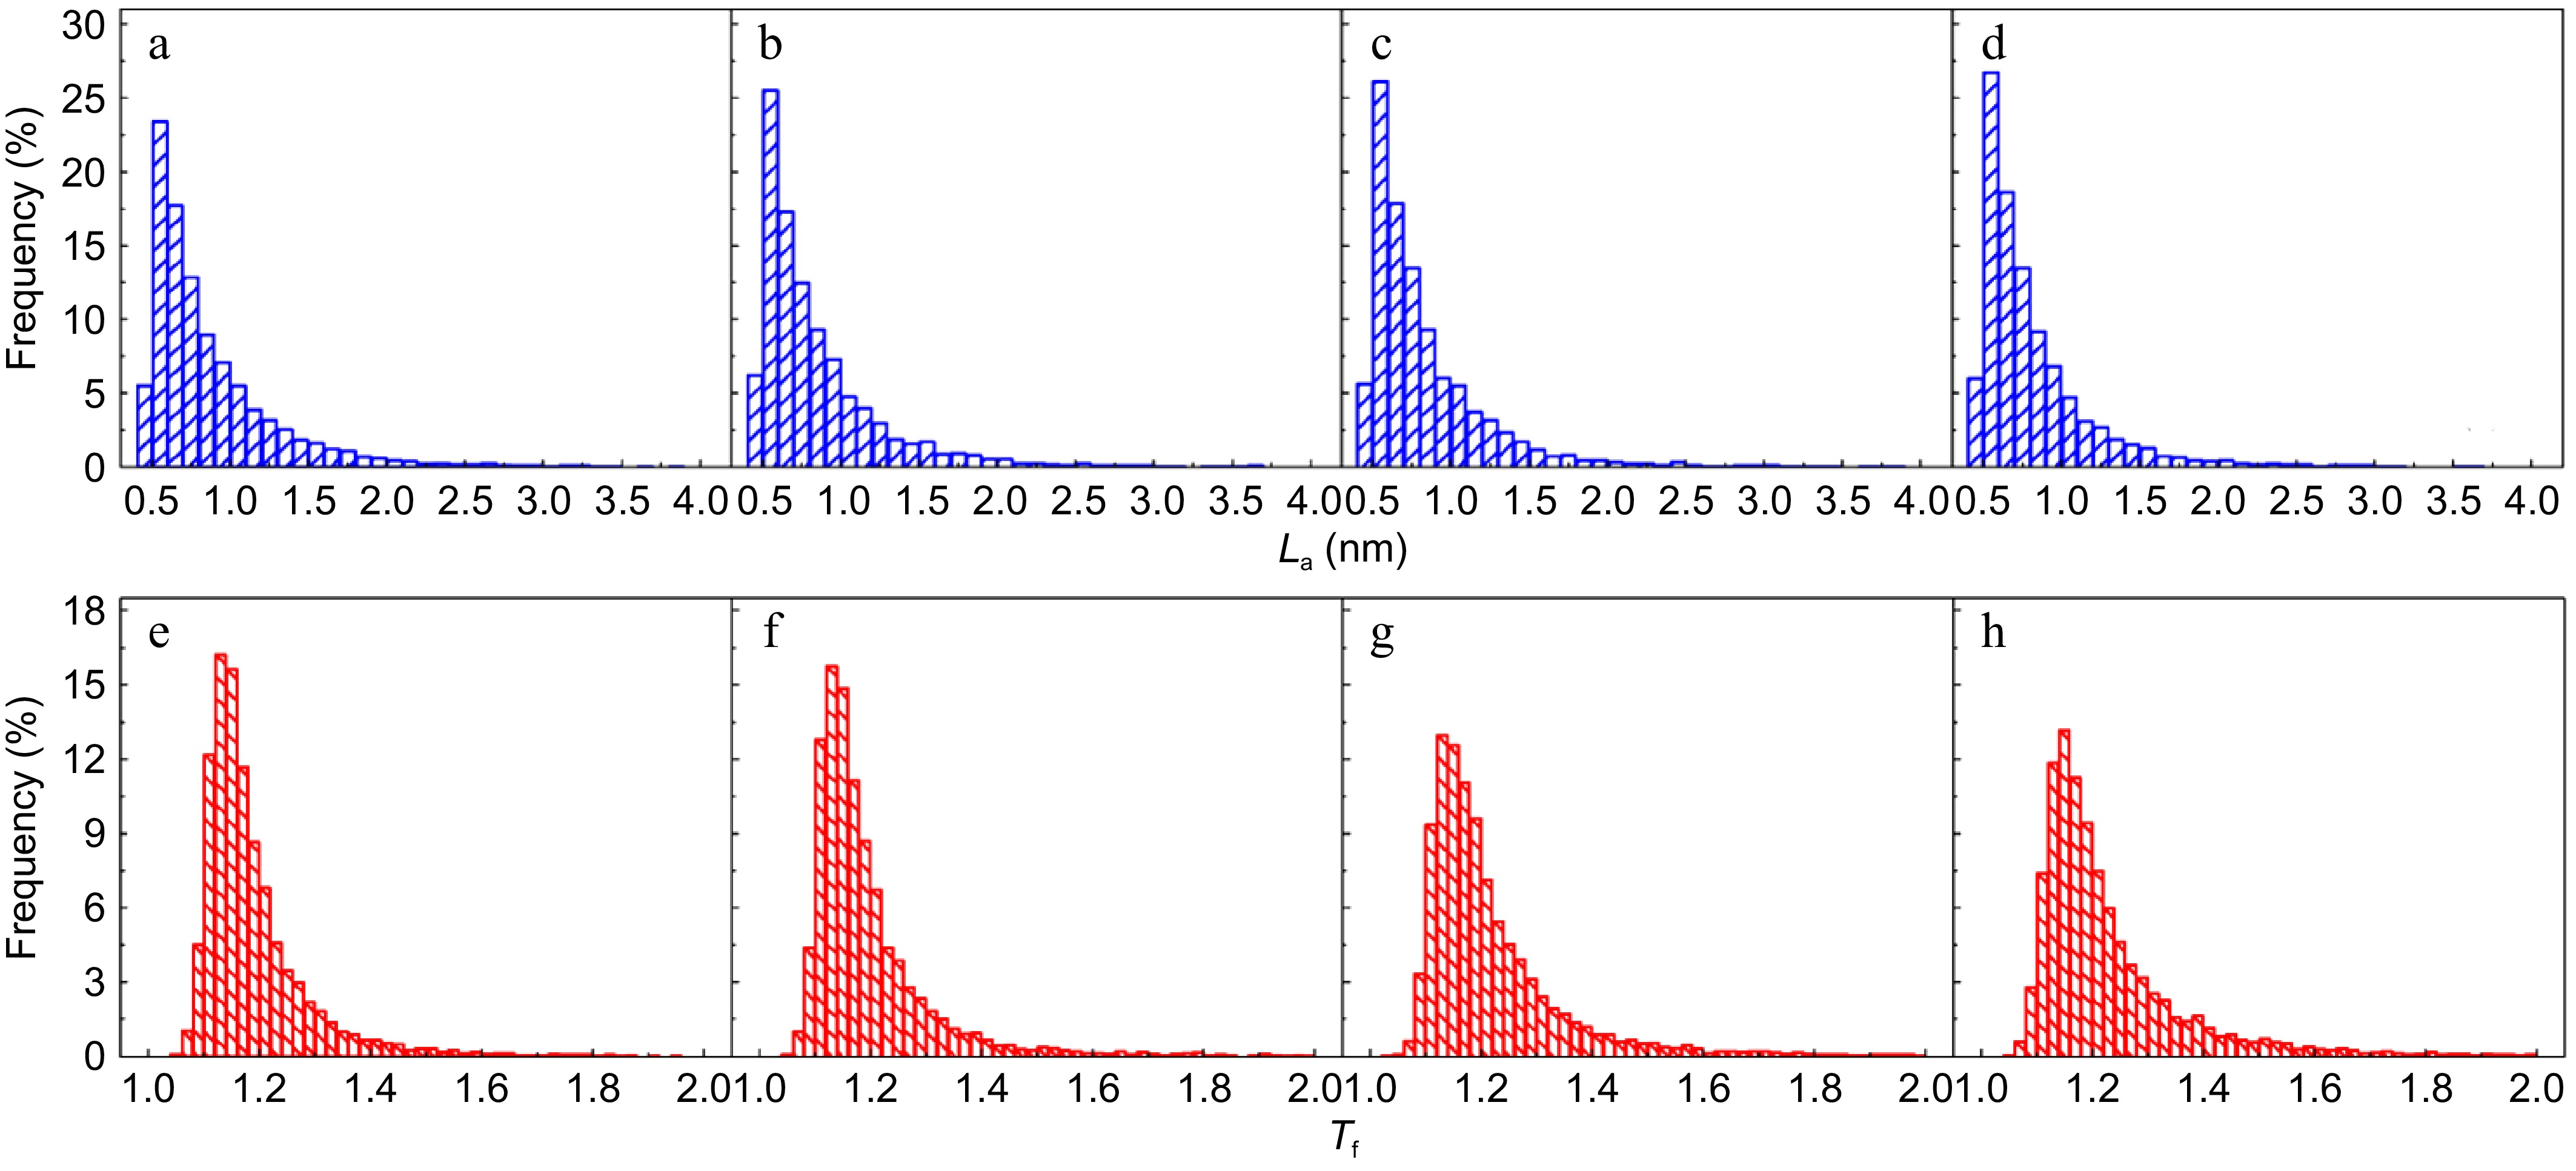
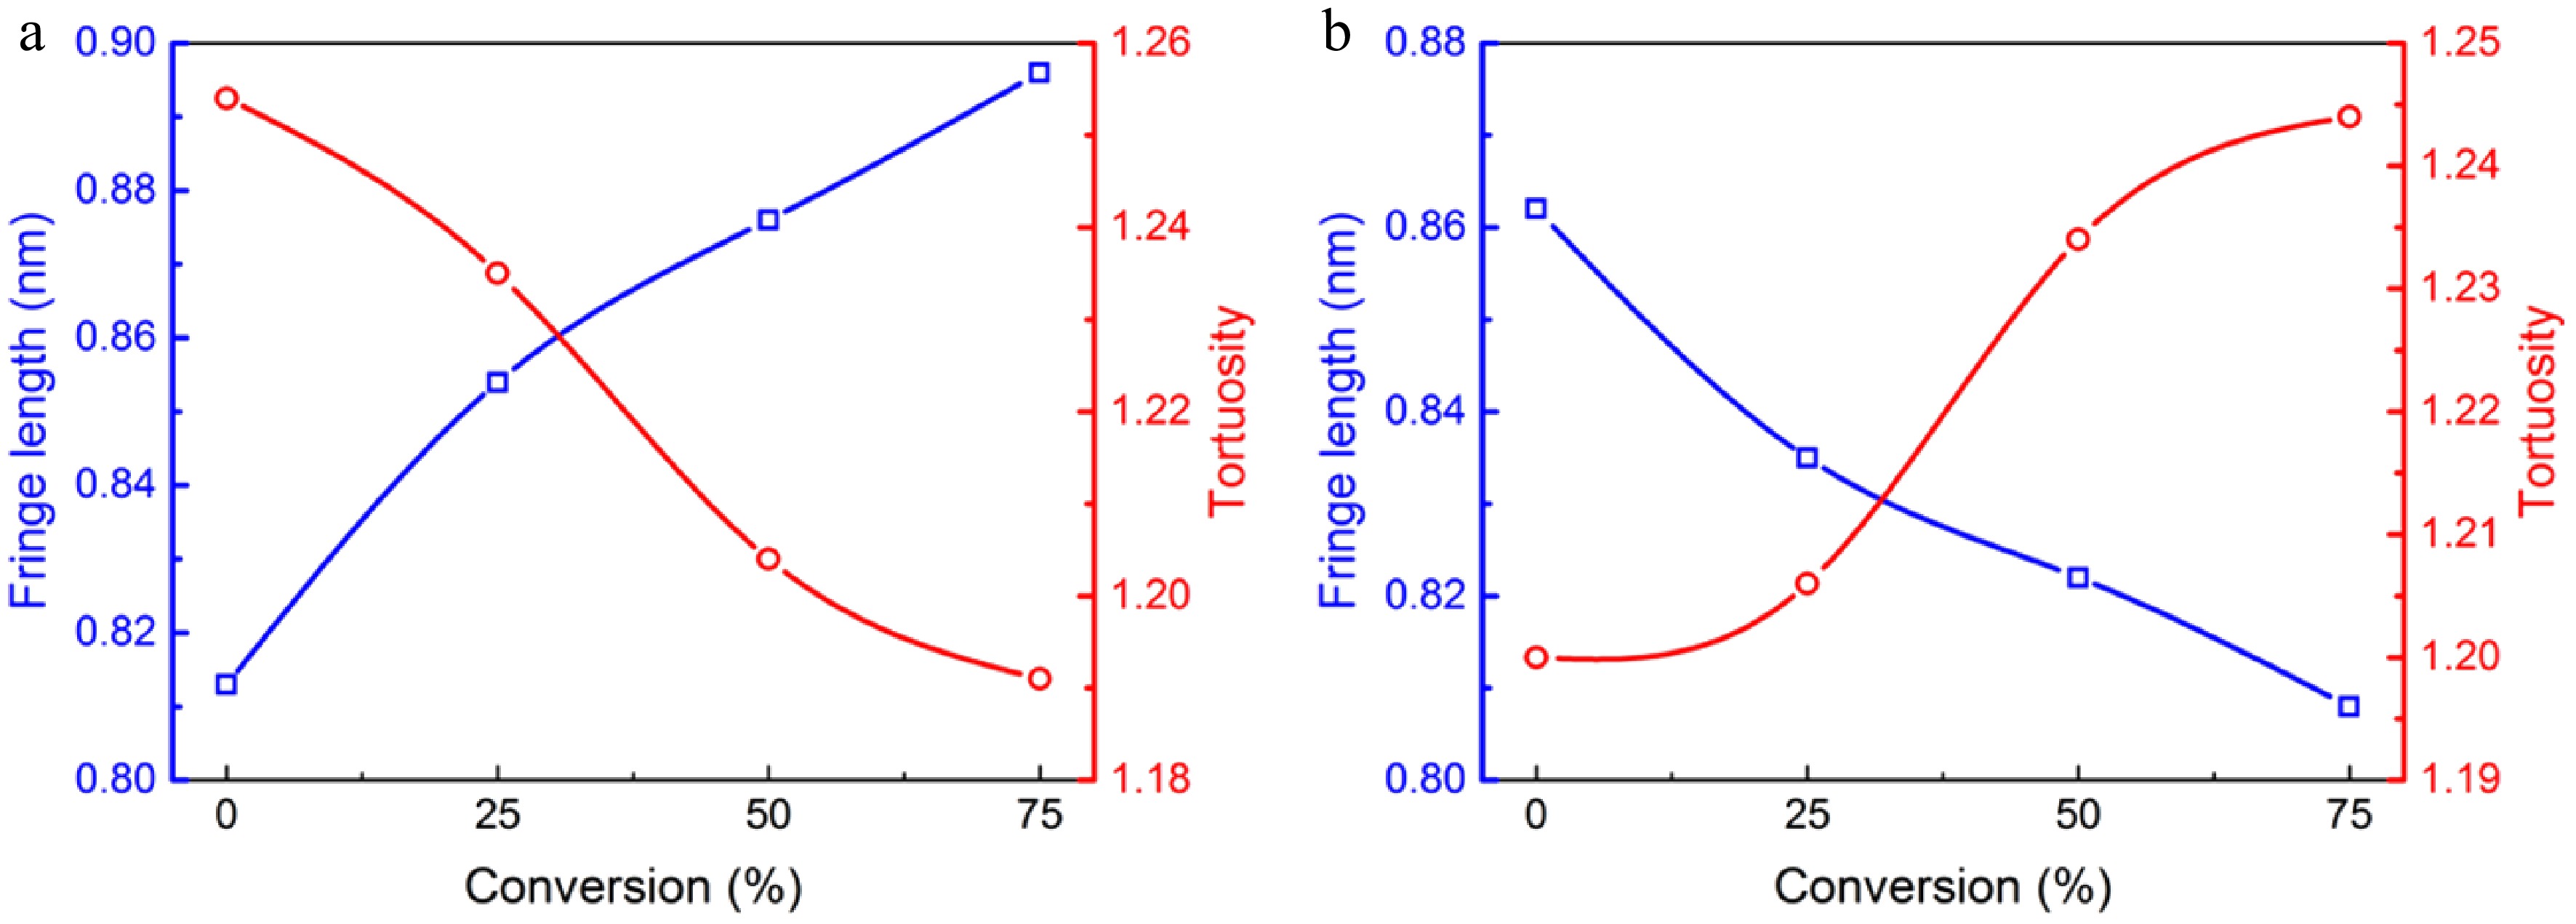
The detailed fringe analysis is provided in Figs 9 and 10 to demonstrate the evolution of nanostructure. La is mainly distributed in the range of 0.5 to 2.5 nm, reaching a peak at about 0.55 nm. While Tf is mainly distributed in the range of 1.05 to 1.6, reaching a peak at about 1.1. For mature soot, as shown in Fig. 11b, with the reaction advancing, La is reduced from 0.862 to 0.808 nm, while Tf is increased from 1.200 to 1.244. At a 75% conversion rate, mature soot particles are hollow interiors with thick boundaries (Fig. 6h), verifying the existence of internal oxidation modes. The small-sized PAHs in mature soot randomly align with each other and present higher ratios of edge carbon atoms and specific surface areas. Once penetrating particles, chemisorbed oxidizer has a higher affinity to form bonds with the amorphous carbon, accelerating the internal reactions[56]. With the combined surface and internal oxidation consumption, soot particles lose sphericity and show blurred boundaries (Fig. 6d). Moreover, the outer layer planes are wavy instead of flat at an advanced stage of reaction (Fig. 6g, h), raising the curvature of poly-aromatic networks (Fig. 11b). When La is reduced to a certain level, the interlayer bonding force is less than the interatomic bonding force, and the small crystallites are gradually stripped from the outermost shell, also leading to the shrinkage of primary particles[17].
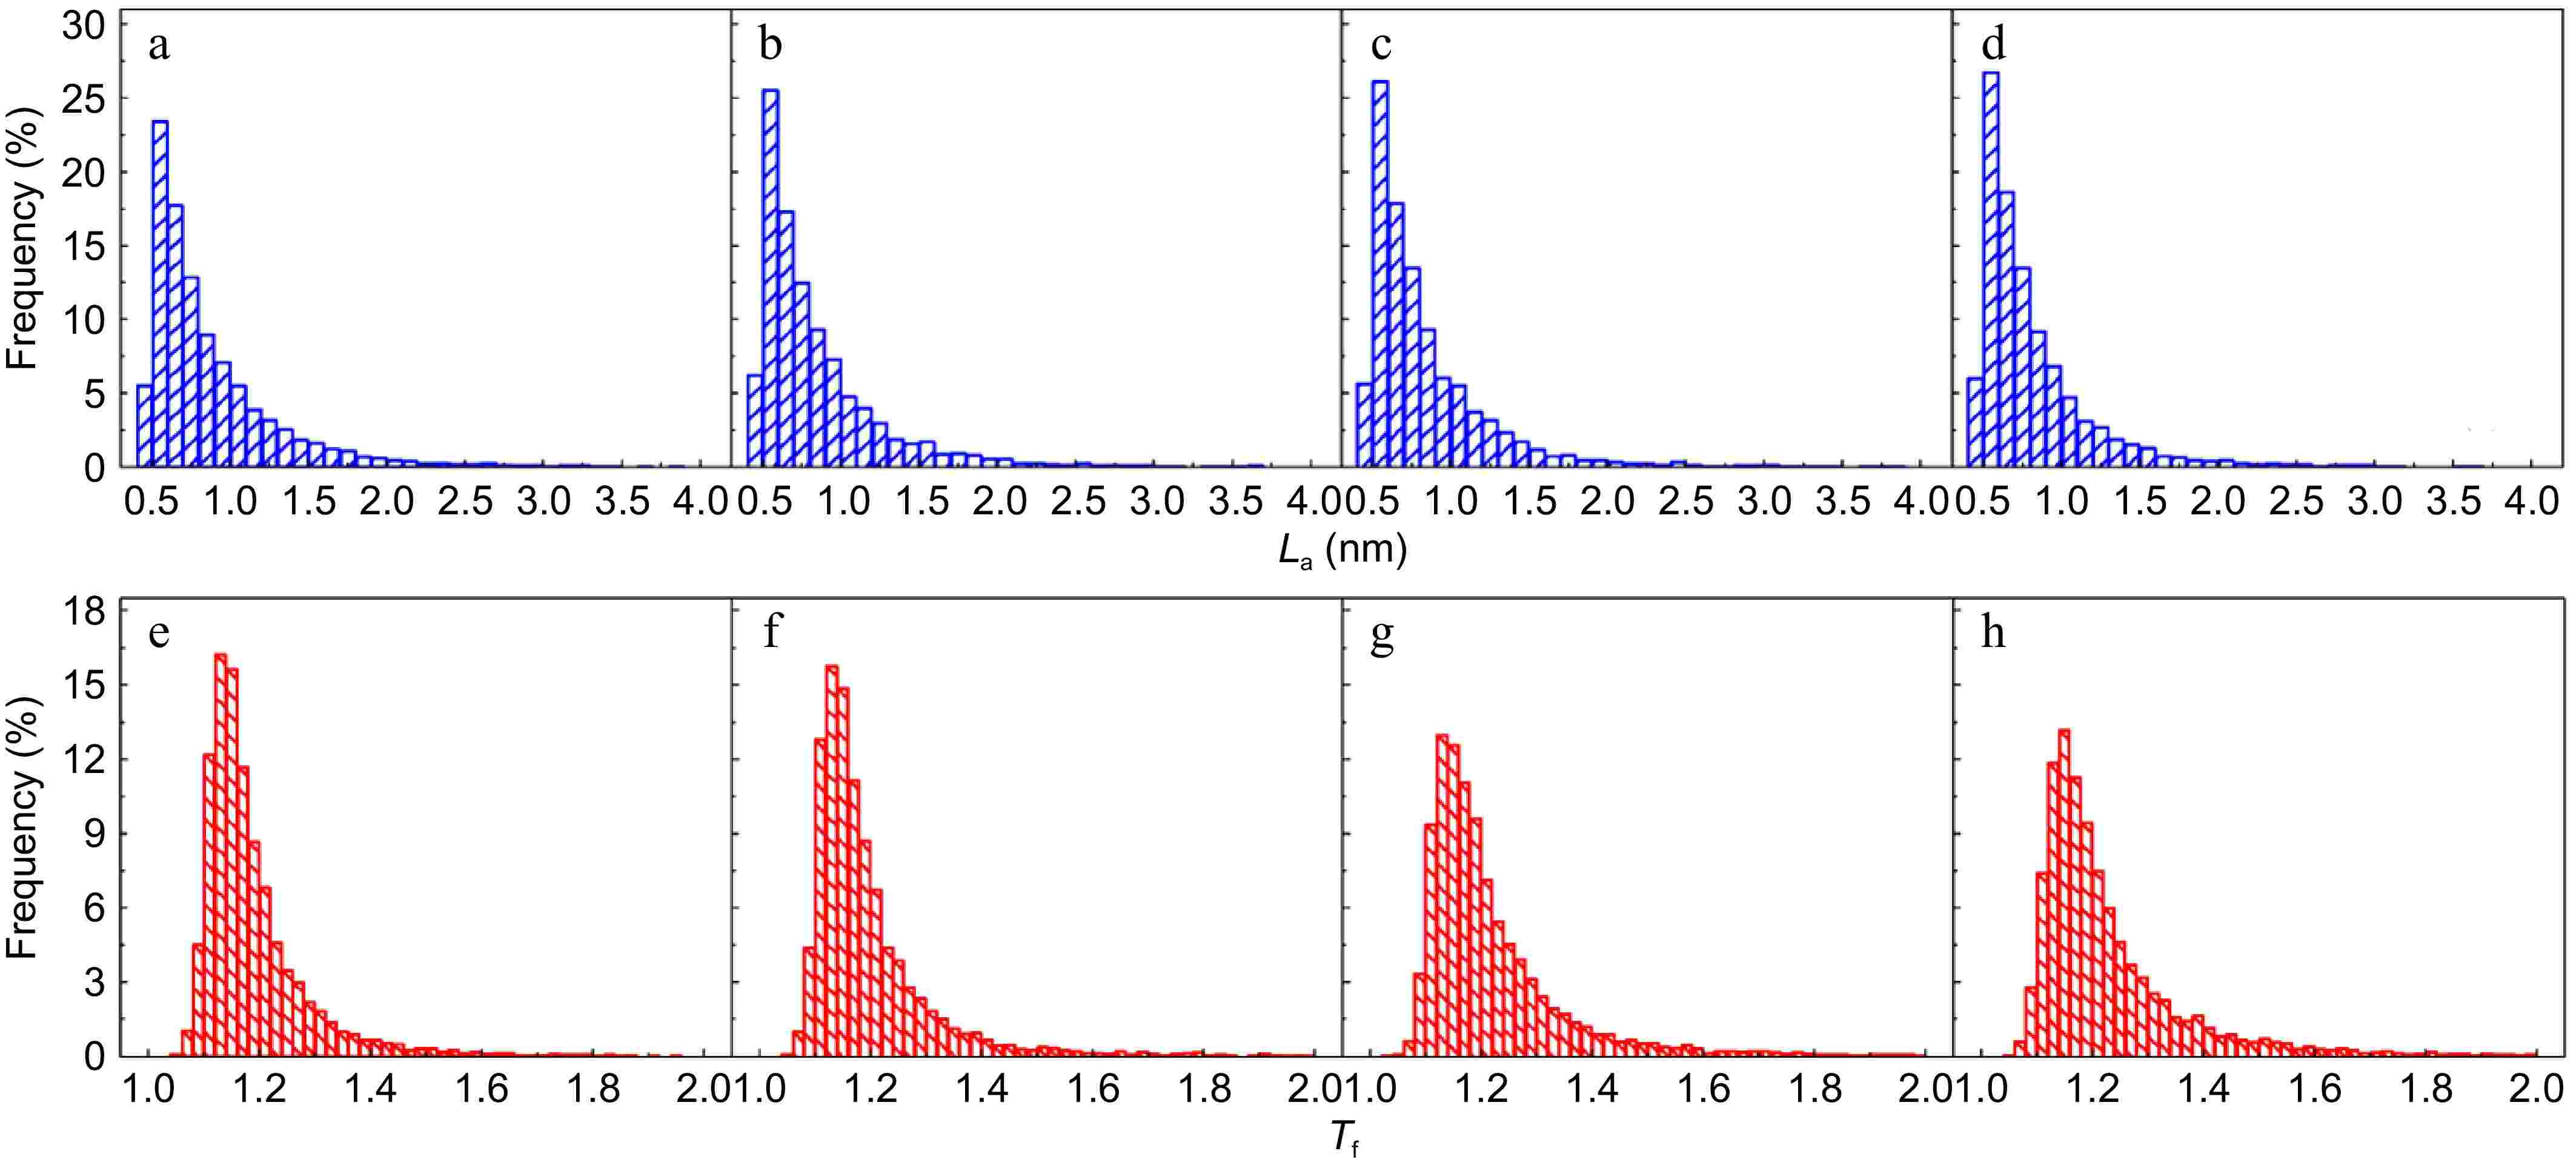
Figure 9.
(a)−(d) Fringe length, and (e)−(h) tortuosity distribution of soot sampled at 0.8 hf with different conversion rates: (a), (e) α = 0; (b), (f) α = 25%; (c), (g) α = 50%; (d), (h) α = 75%.
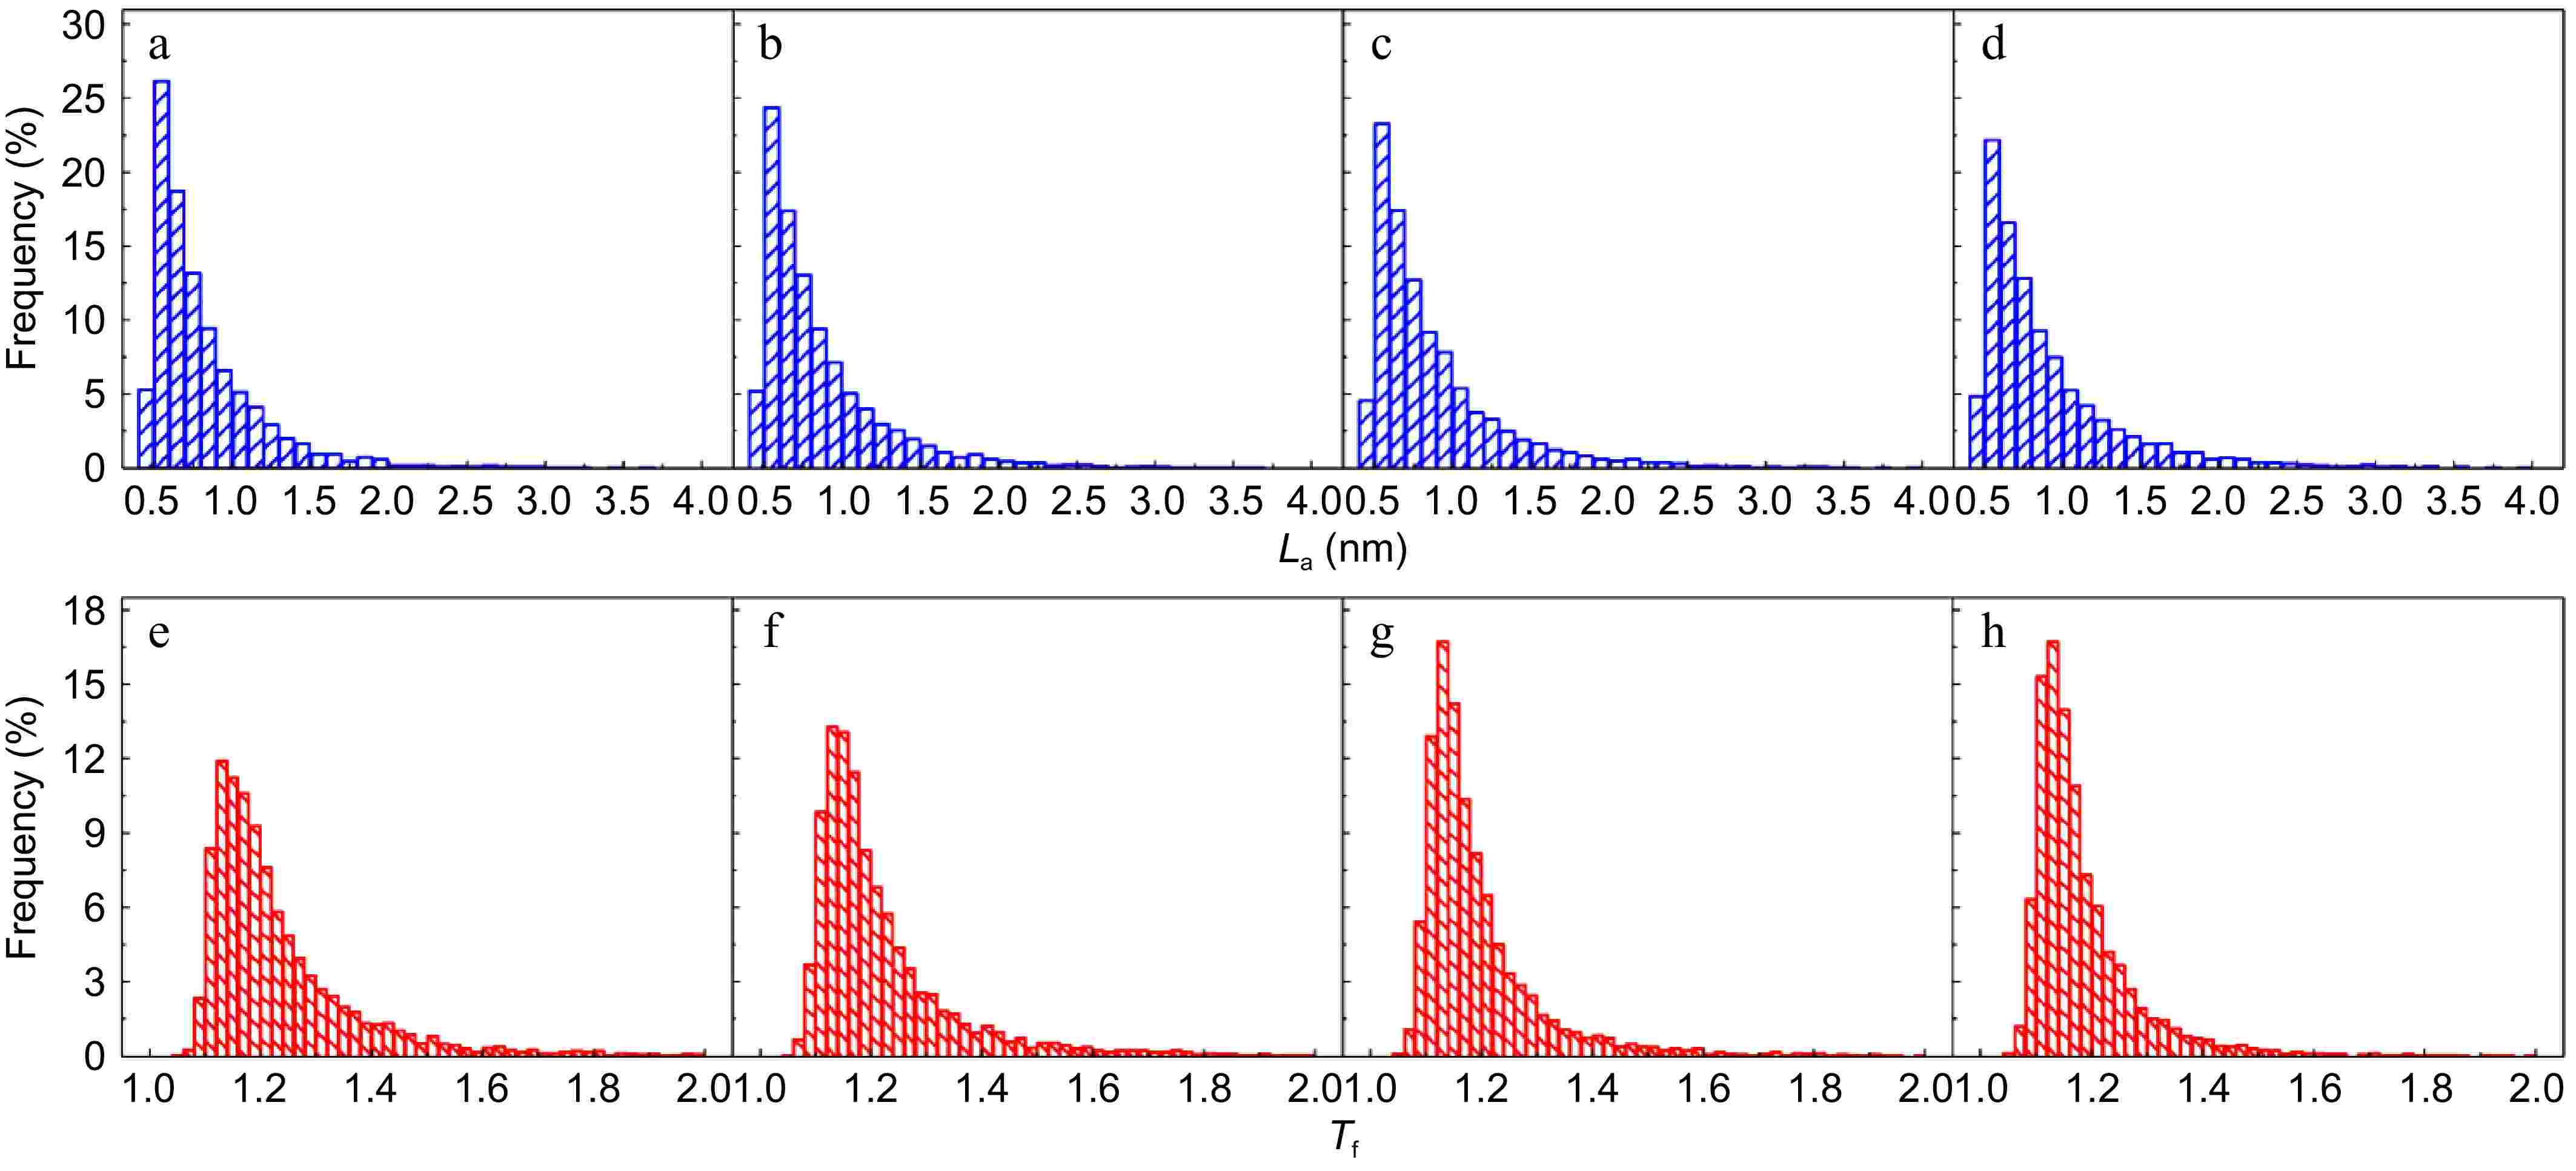
Figure 10.
(a)−(d) Fringe length, and (e)−(h) tortuosity distribution of soot sampled at 0.4 hf with different conversion rates: (a), (e) α = 0; (b), (f) α = 25%; (c), (g) α = 50%; (d), (h) α = 75%.
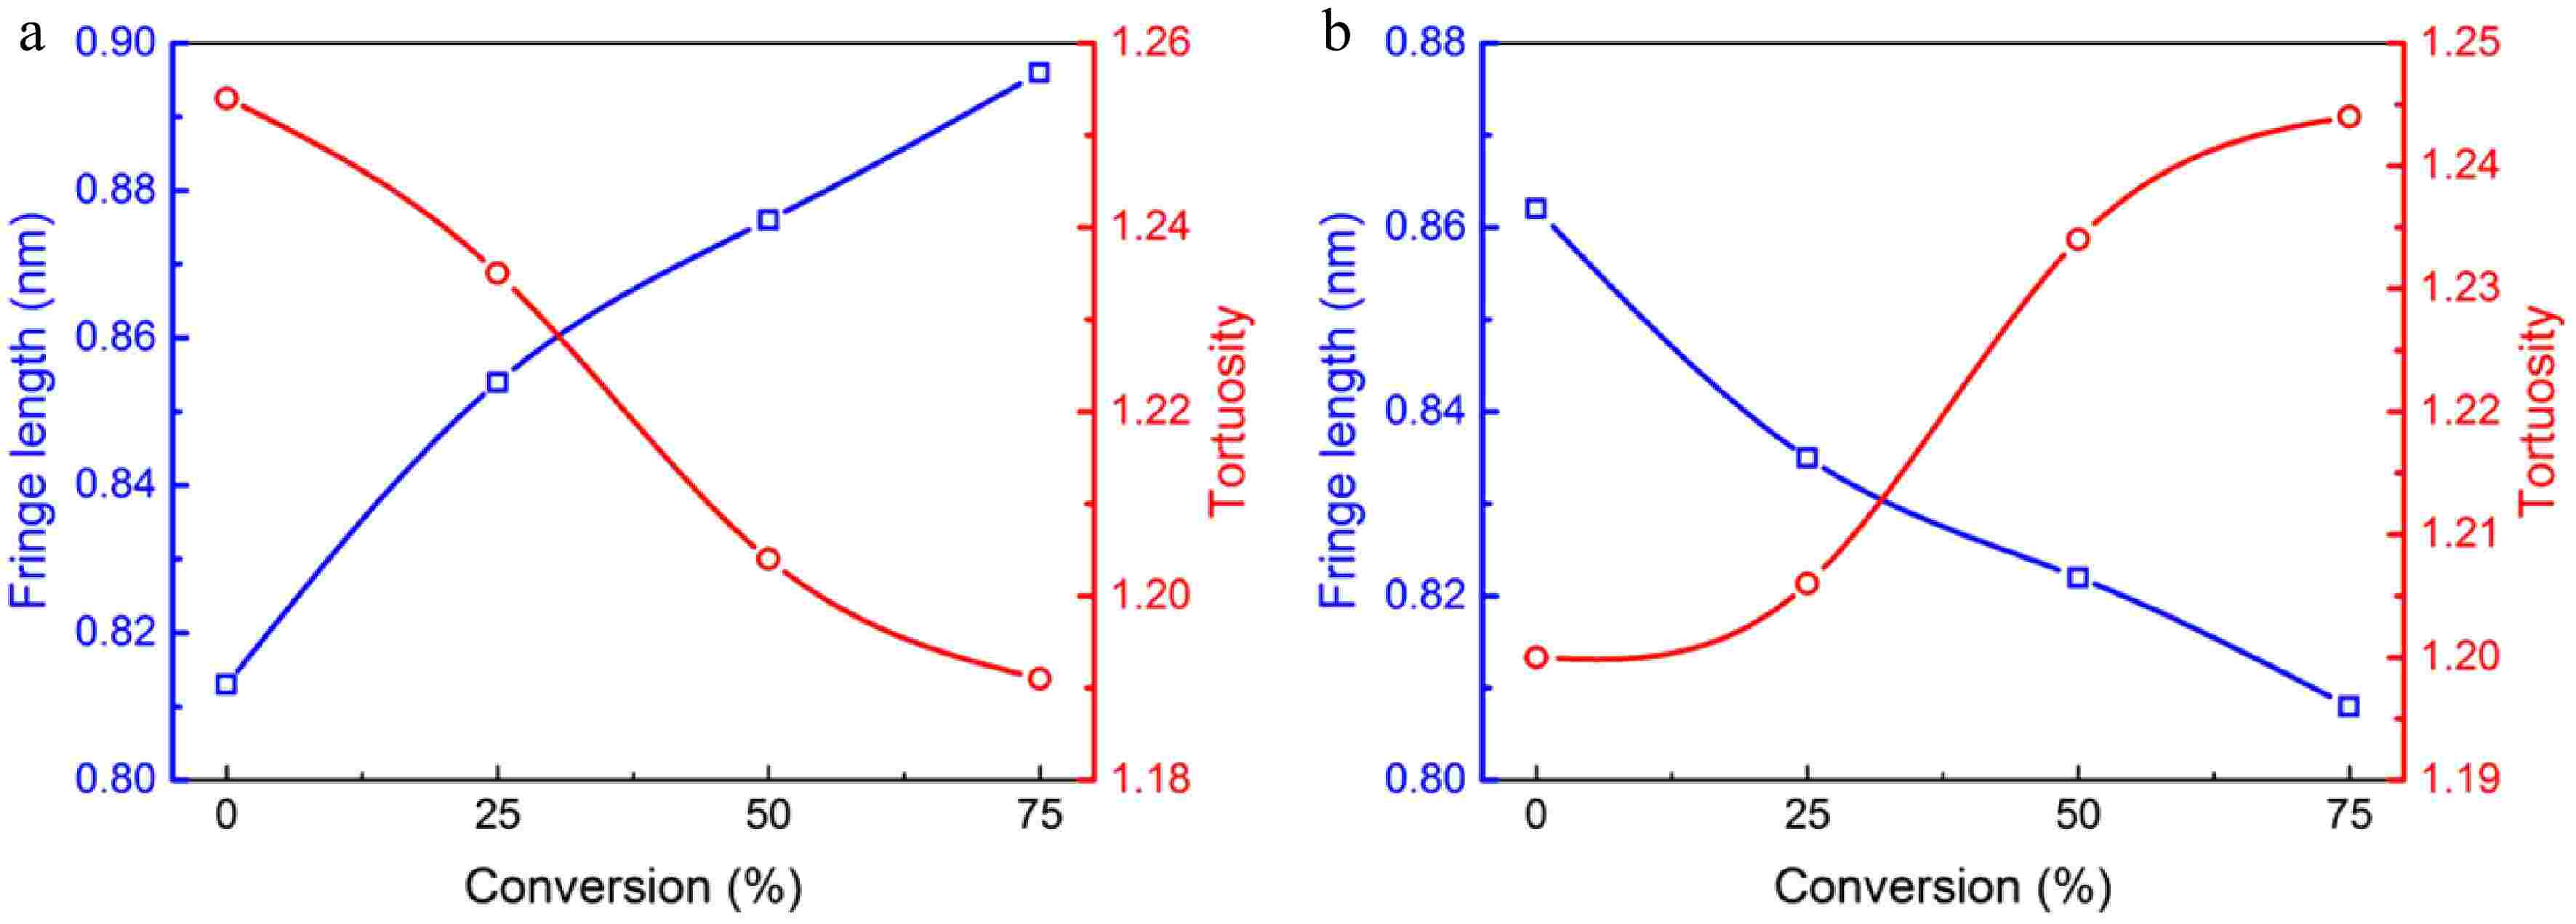
Figure 11.
Average fringe length (square), and tortuosity (circle) of soot sampled at (a) 0.4 hf and (b) 0.8 hf as functions of conversion rate.
In contrast, early-stage soot merely presents surface oxidation mode. Accompanied by the decreased diameters, soot particles maintain complete and distinguishable morphology. Moreover, their nanostructure tends to be more and more organized. As shown in Fig. 11a, La increases from 0.813 to 0.896 nm, while Tf decreases from 1.254 to 1.191. Especially at a 75% conversion rate (Fig. 7h), the particle interior is composed of compact onion structure, and the content of disordered segments is relatively limited.
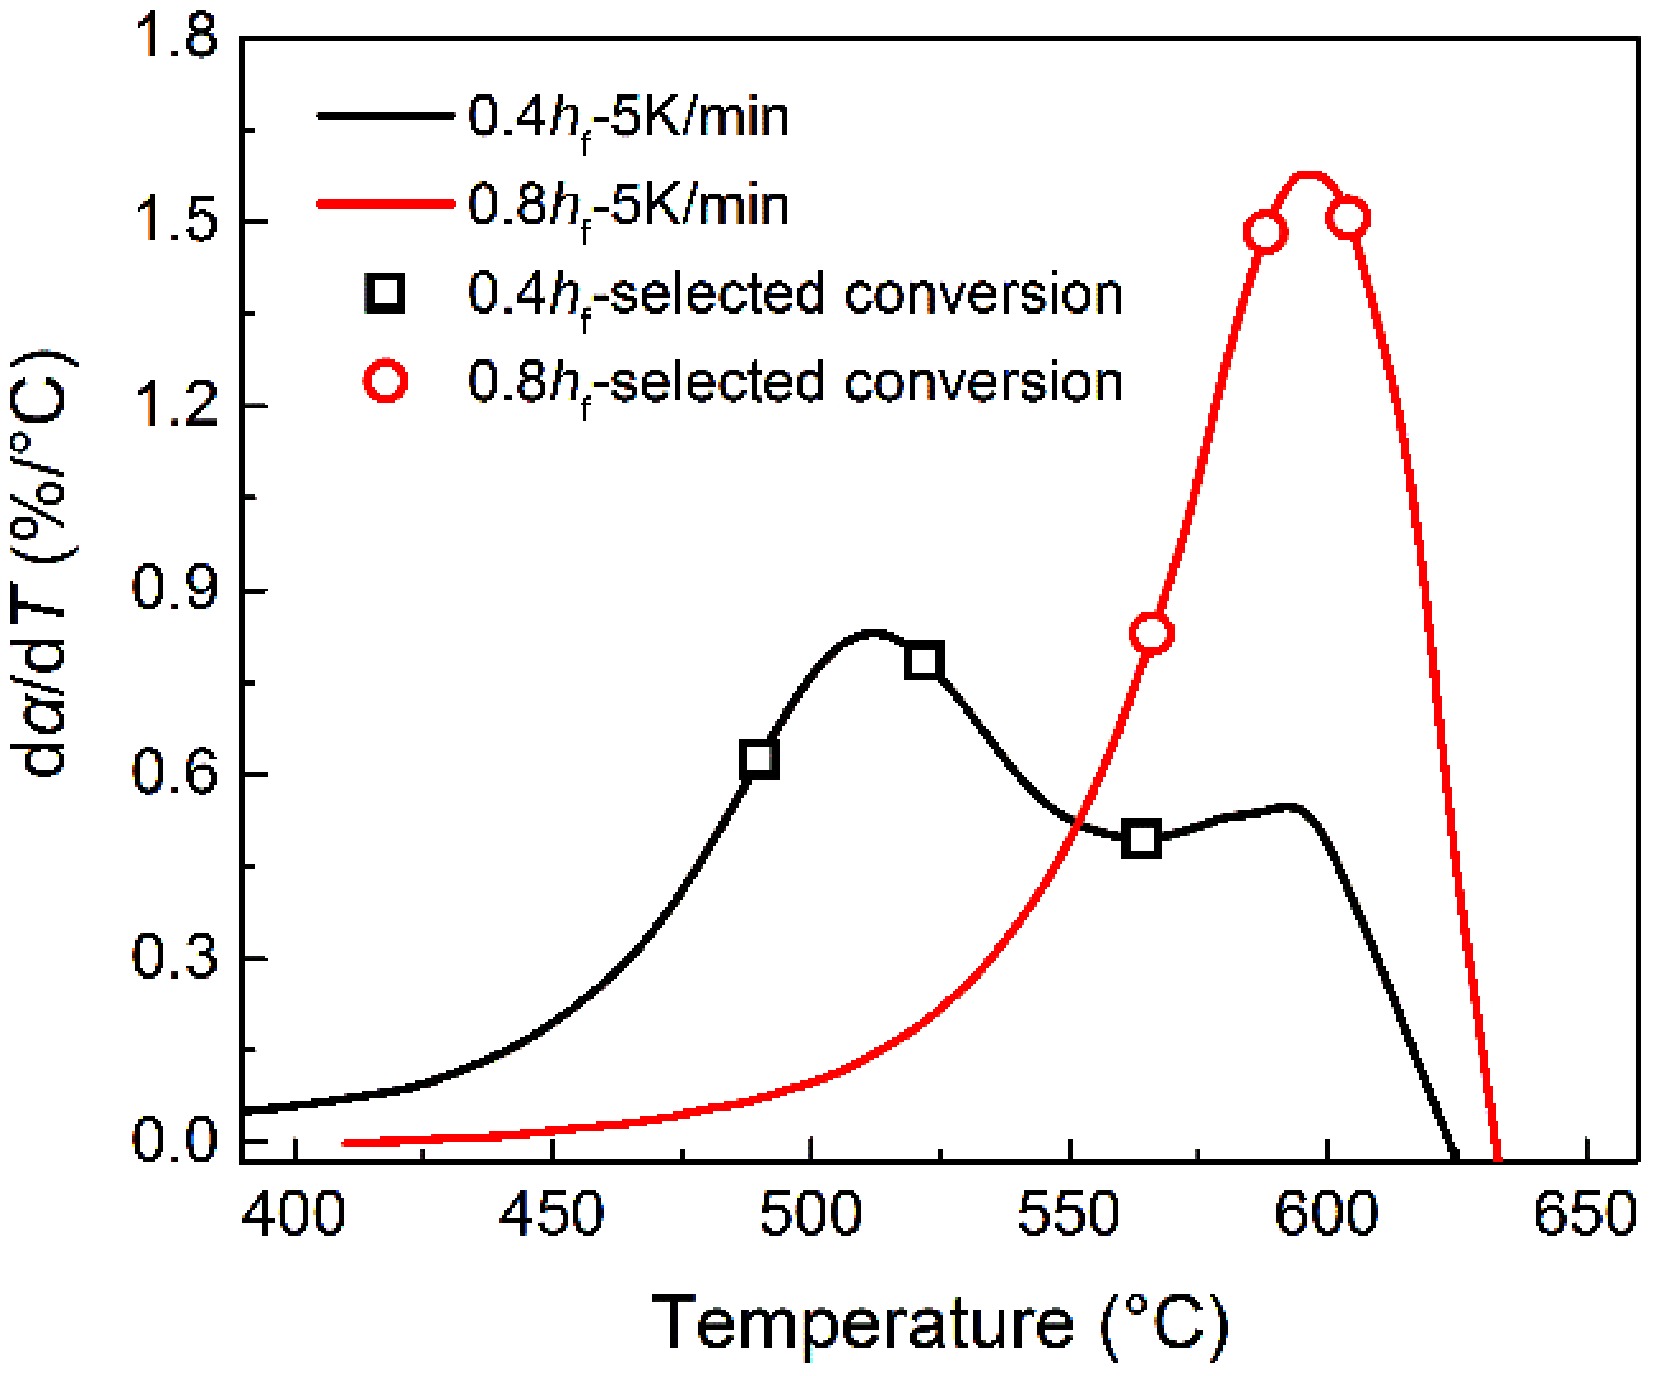
To explain the distinct oxidation mode for early-stage soot and mature soot, Fig. 12 presents the relationships between soot conversion rate and oxidation rates. The three conversion rates investigated for early-stage soot overlap with the low-T conversion process. The virgin samples have a higher ratio of aliphatic and oxygenated groups. After eliminating these thermal liable structure with the increased temperature, the partially-oxidized soot particles have developed a thermodynamically stable lattice framework. The early oxidation reactions are not mainly involved with breaking covalent bonds, so changes in activation energy (Fig. 4) are mild before the 70% conversion rate. Thereafter, soot oxidation is dominated by the oxidation process of remaining carbonaceous substances. The activation energy rapidly increases and approaches mature soot values in the early oxidation stage. Foreseeably, if the conversion rate further increases above 75%, internal burning is destined not to be absent for early-stage soot. As with mature soot demonstrated above, the stable aromatic configurations are consumed by dual oxidation modes, until particles collapse.
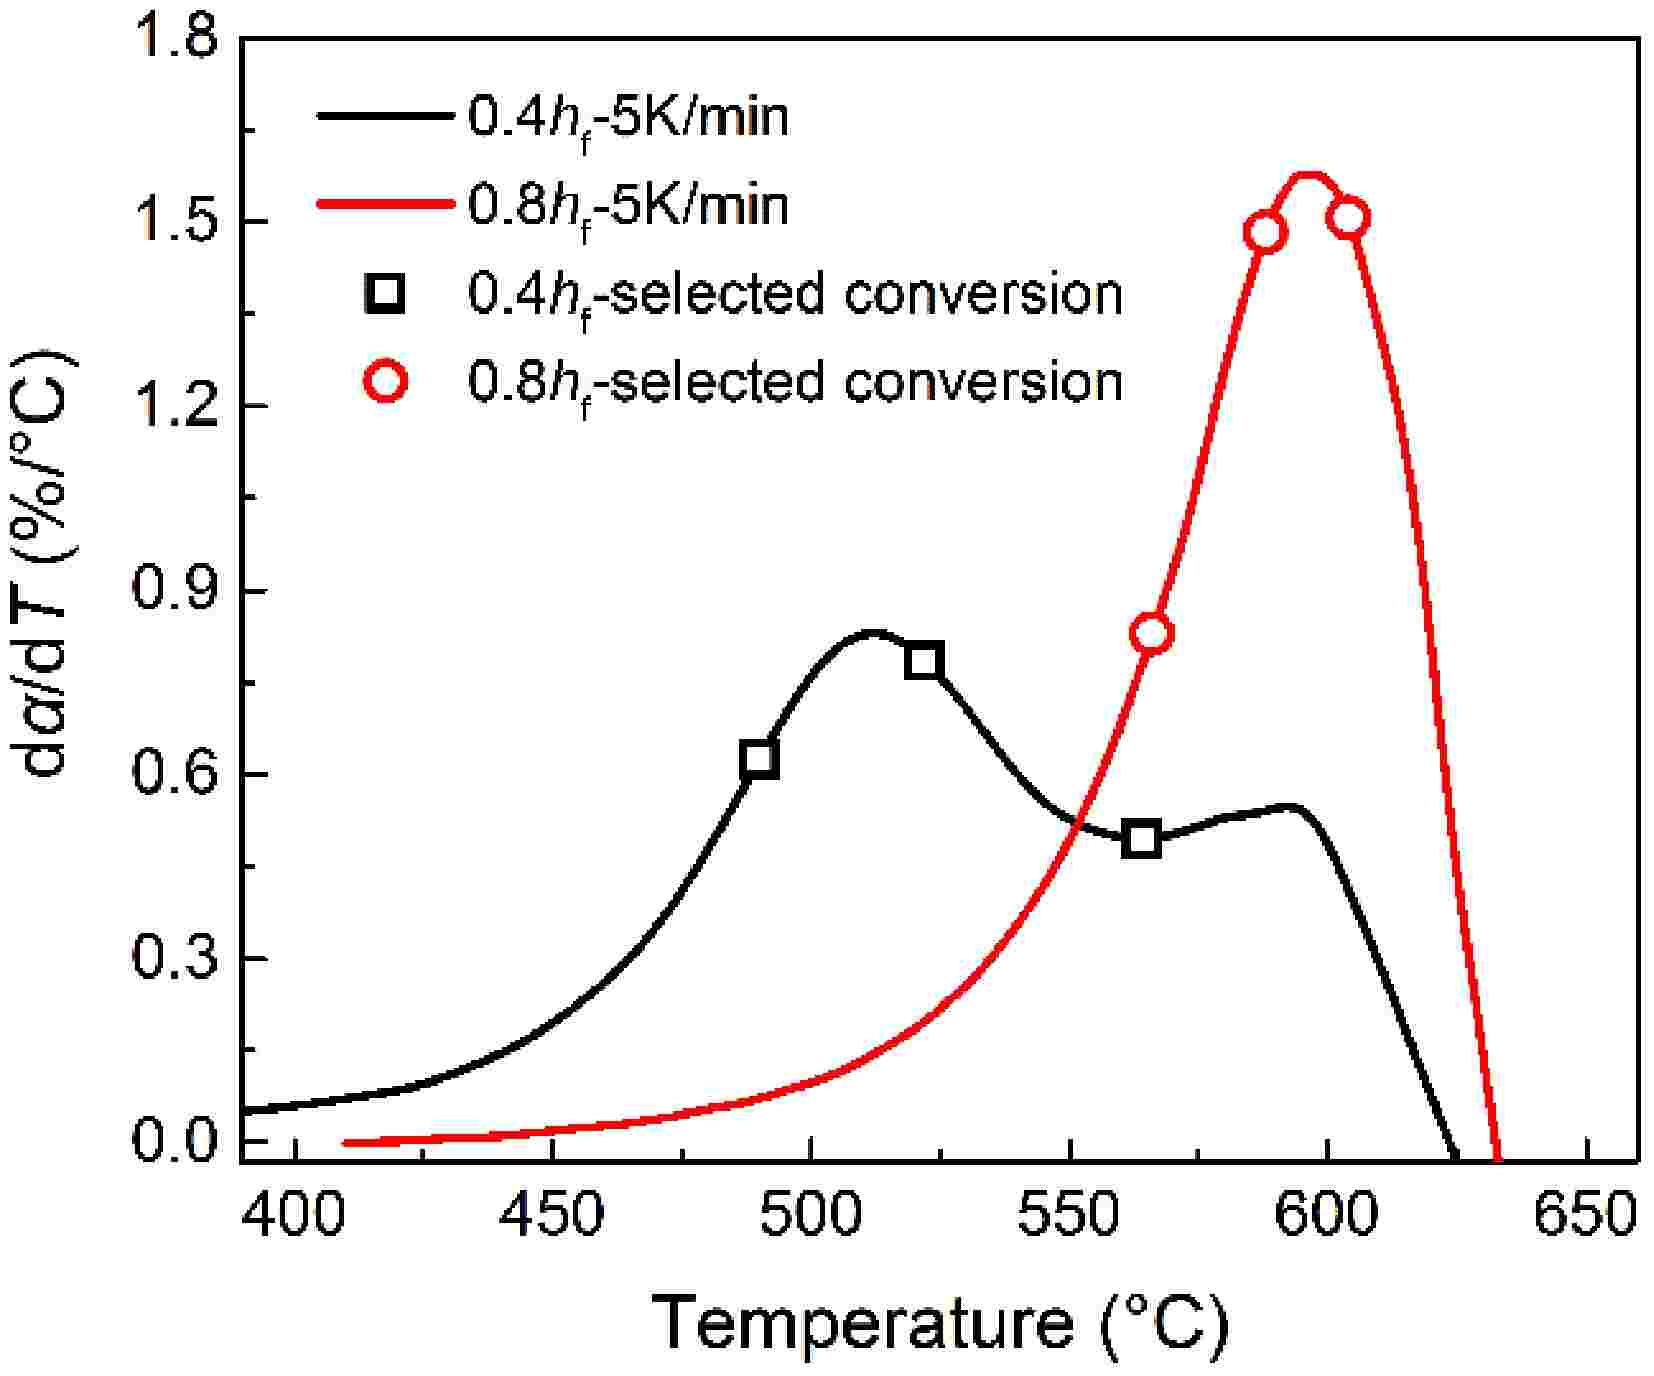
Figure 12.
Relationships between selected three conversion rates (symbols), and oxidation rates (curves).
Chemical structure
-
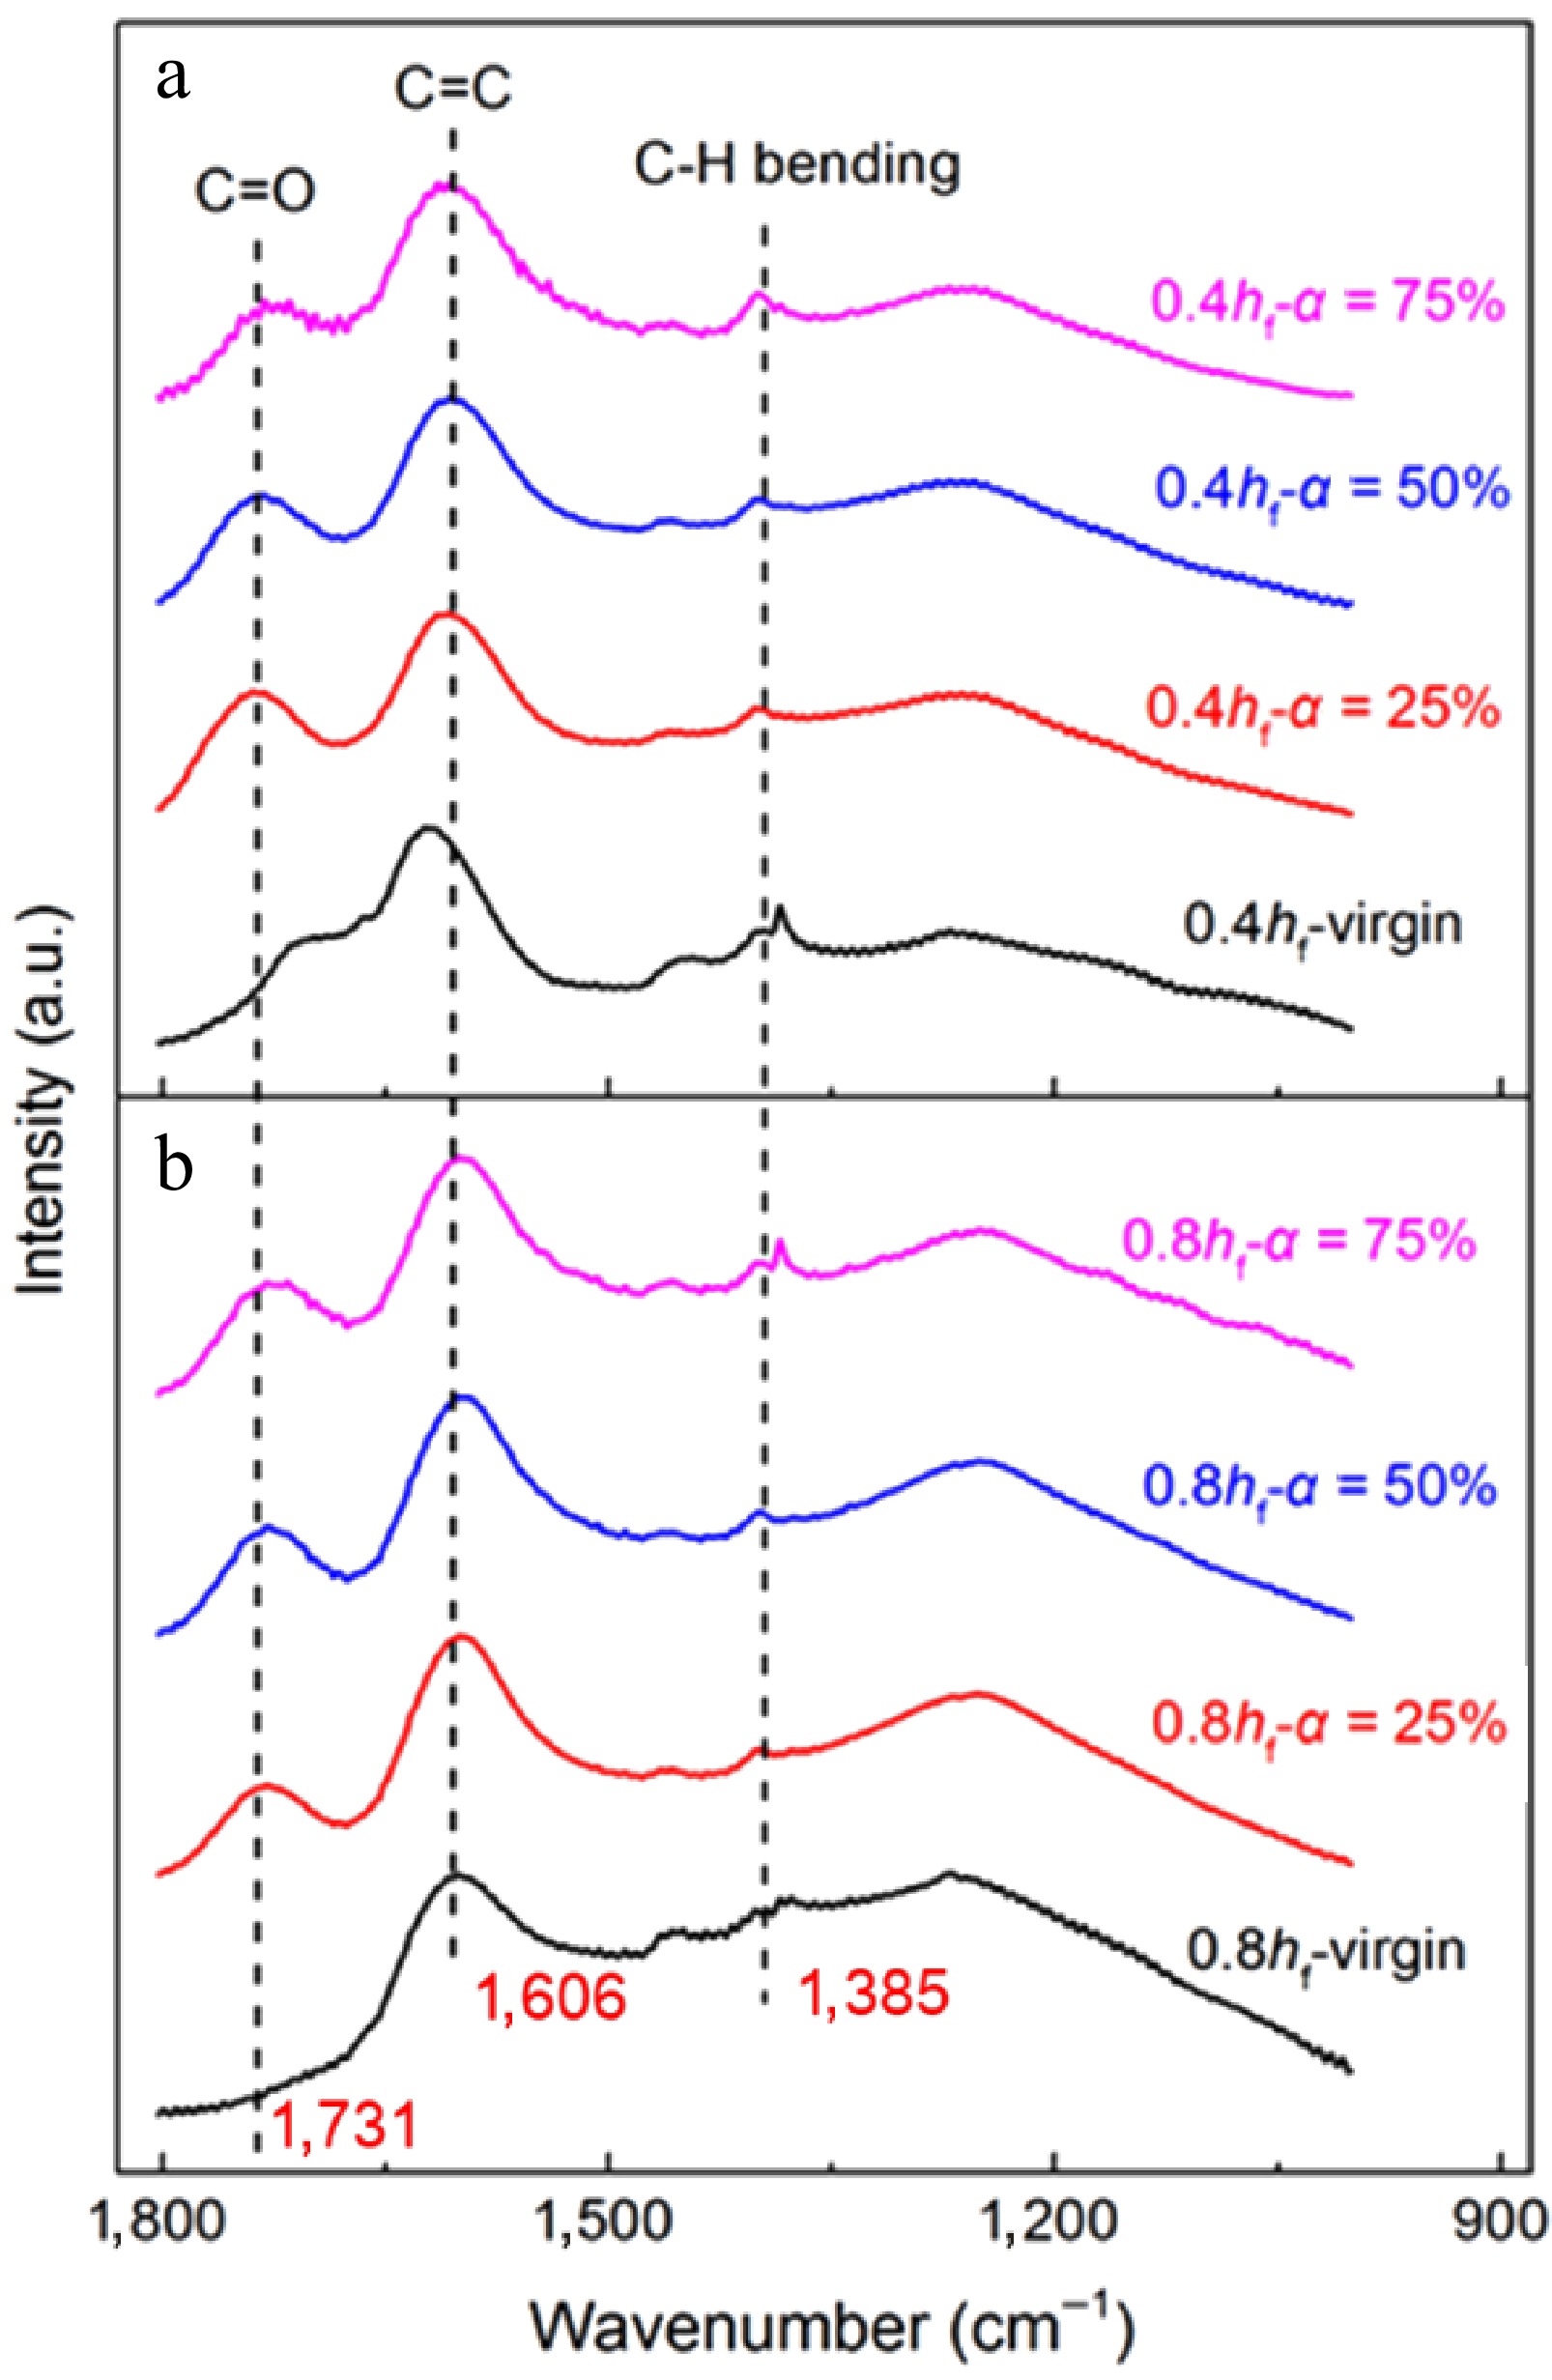
Except the reasons mentioned above, the evolution of surface functional groups also determines soot oxidation rates. Figure 13 shows the FTIR spectra for early-stage soot and mature soot as functions of conversion rate. The peaks in soot spectra indicate various functional groups present in them. The peak at about 1,610 cm−1 is attributed to aromatic C=C stretching vibration, shouldered by a peak at about 1,730 cm−1[49]. The peak at about 1,380 cm−1 is attributed to C-H plane deformations of CH2/CH3 groups[35]. These aliphatic groups may be derived from methyl and methylene groups on the periphery of carbon or methylene bridges to connect PAH networks[13].
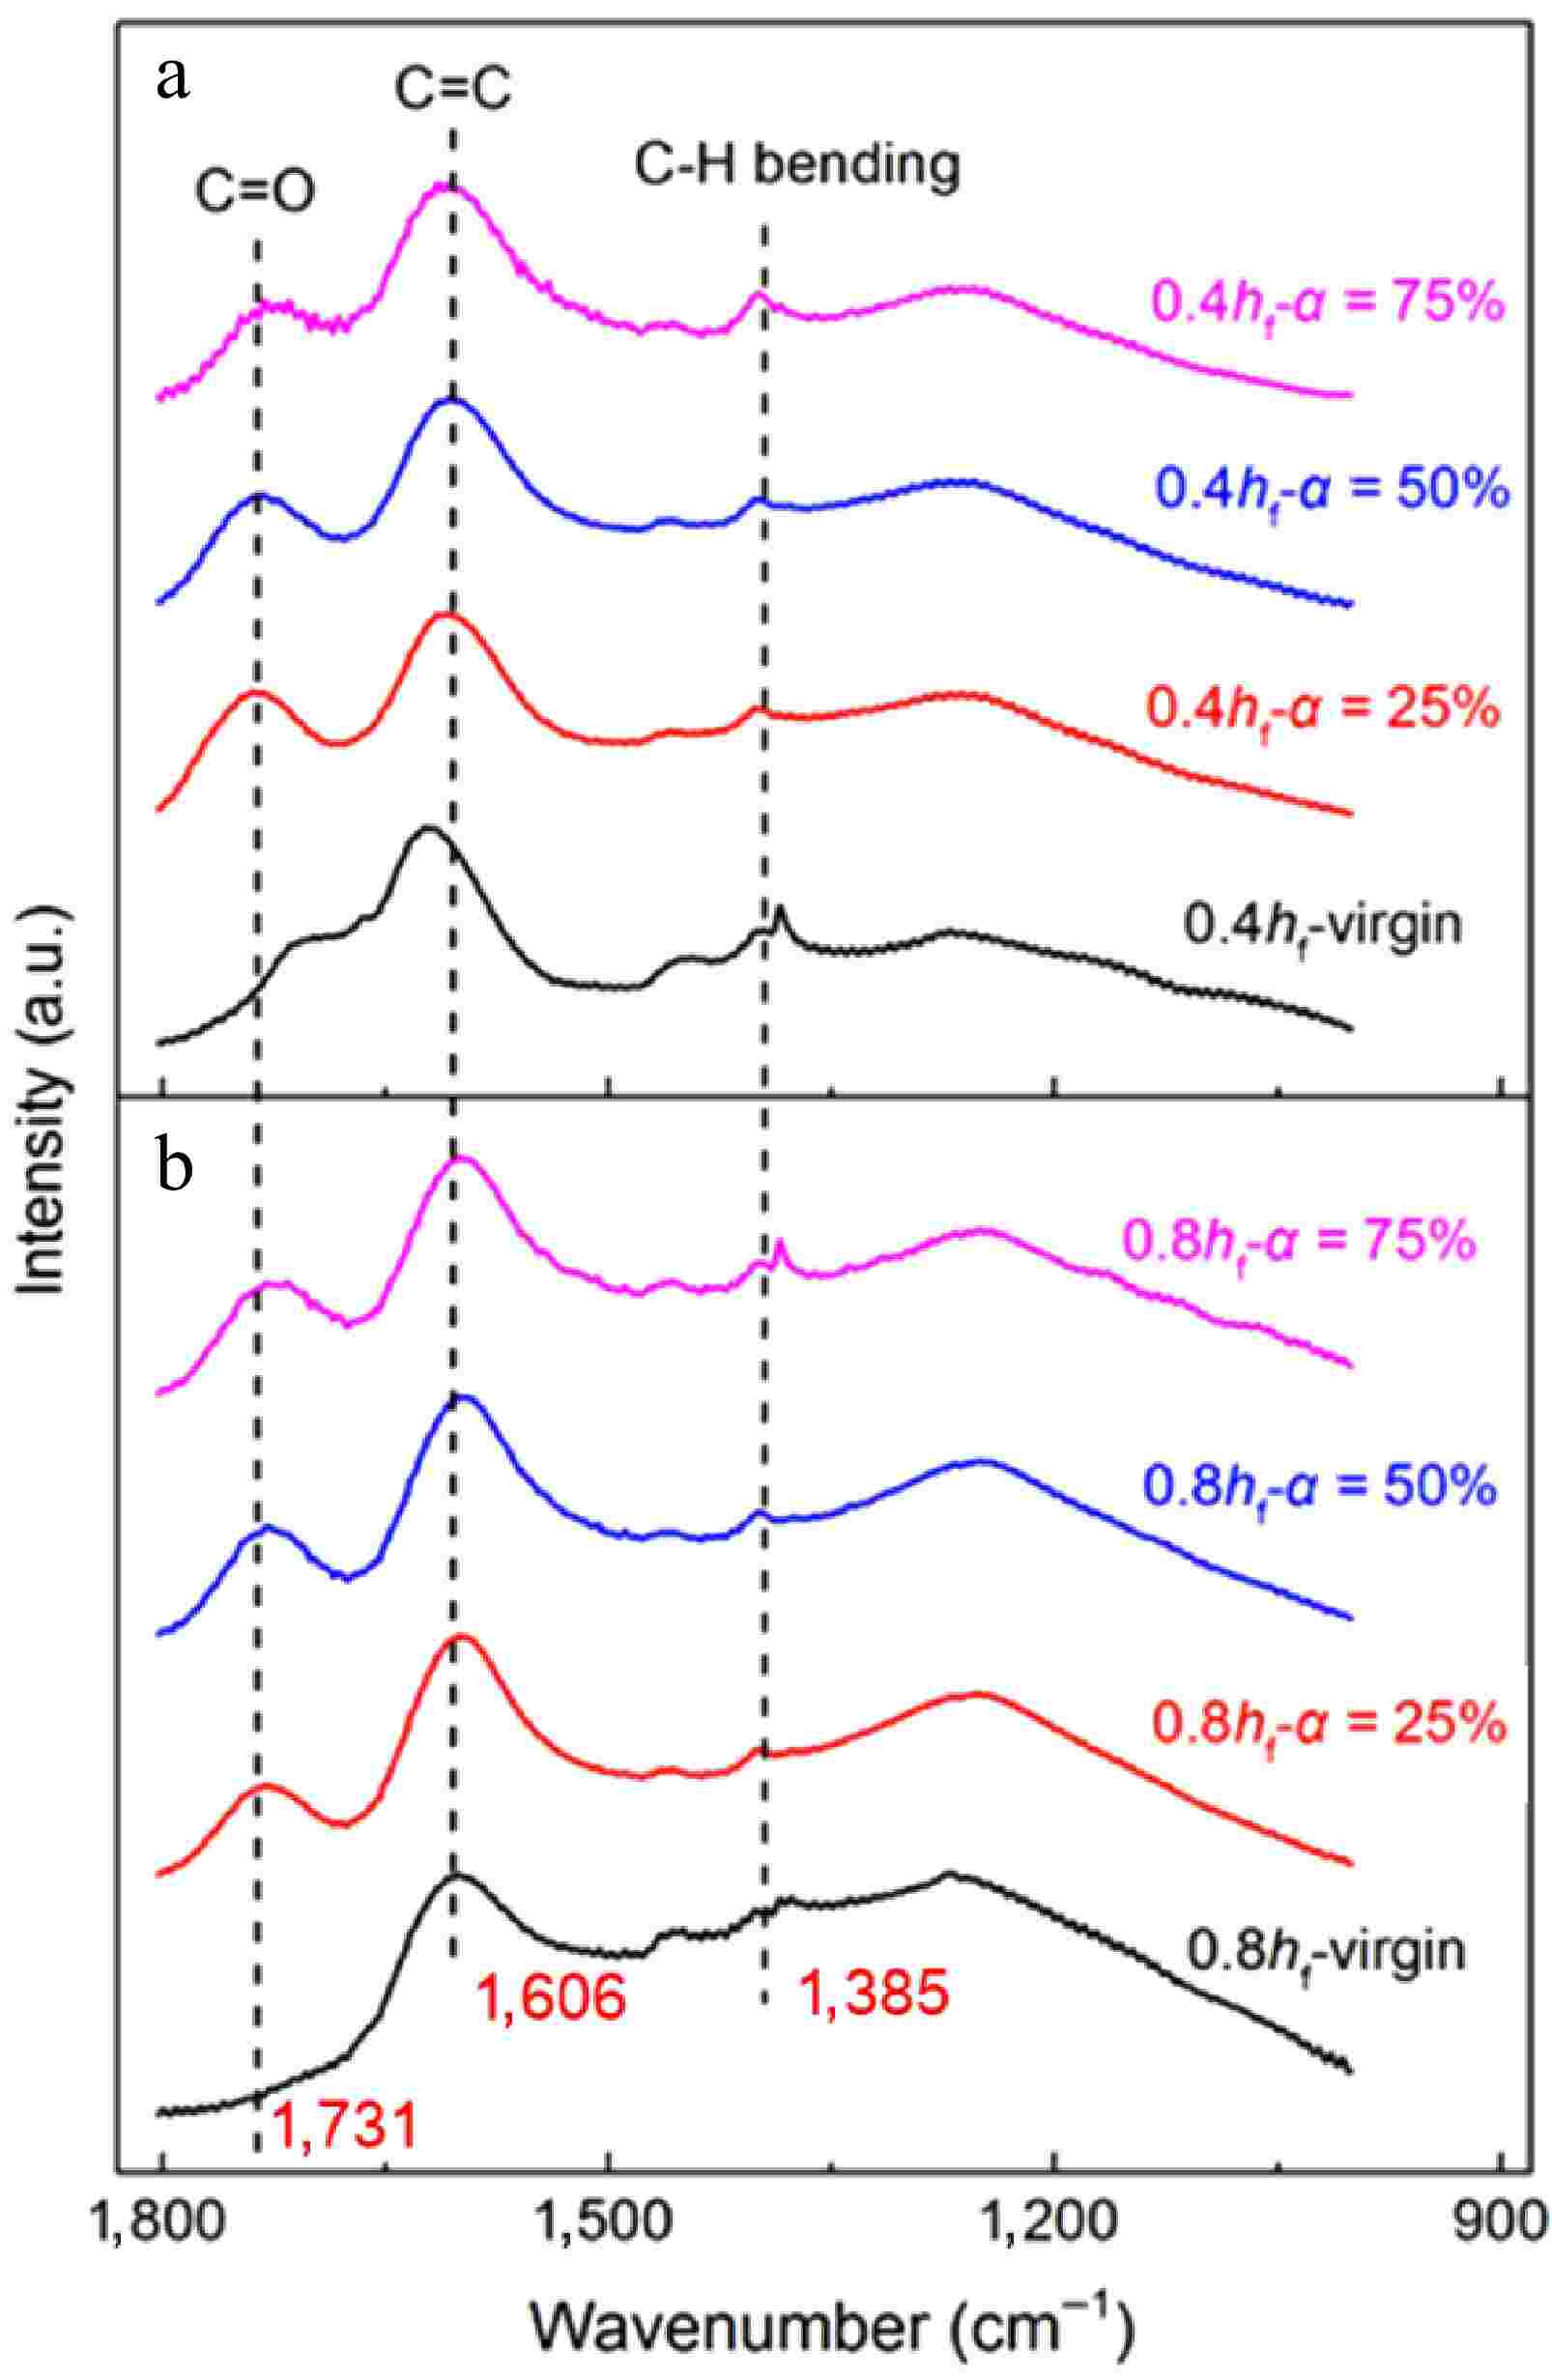
Figure 13.
FTIR spectra of soot sampled at (a) 0.4 hf, and (b) 0.8 hf as functions of conversion rate.
During oxidation, O2 and OH are continuously added to surface active sites, forming semiquinone intermediates with edge carbon atoms. The presence of surface oxygen complexes can alter the electron density of adjacent carbon atoms, elevating their reactivity towards the electronegative oxygen. The neighboring C-C bond strength is weakened and released as CO with chemisorbed oxygen atoms[57,58]. The desorption of surface complexes also generates nascent active sites. In this dynamic process, the net result is the enrichment of oxygen. To make more straight and quantitative comparisons, Table 2 lists variations in the relative intensity of C=O normalized by the C=C signal[35], defined as I1730/I1610. Similar to physical structures, the content of O-containing groups is also associated with sample maturity. I1730/I1610 for mature soot increases monotonically with the conversion rate. The generated oxygenated compounds can anchor on the soot surface at high temperatures. For early-stage soot, the low-T conversion process plays a major role in mass consumption. Elimination reactions prevail over oxygen addition, leading to the release of oxygenated structure. Besides, the location of the C=C band gradually shifts towards lower wavenumbers, indicating a higher degree of aromaticity[59].
Table 2. I1730/I1610 of soot sampled at 0.4 hf and 0.8 hf as a function of conversion.
Sample I1730/I1610 Sample I1730/I1610 0.4 hf−virgin 0.482 0.8 hf−virgin − 0.4 hf−α = 25% 0.640 0.8 hf−α = 25% 0.373 0.4 hf−α = 50% 0.553 0.8 hf−α = 50% 0.455 0.4 hf−α = 75% 0.459 0.8 hf−α = 75% 0.477 At a 75% conversion rate, the signal at about 1,380 cm−1 becomes intensified for mature soot (Fig. 13b) compared to lower conversion rates, while almost keeping constant for early-stage soot (Fig. 13a). This phenomenon proves that the content of aliphatic groups is increased for mature soot in the later stage of oxidation. The O-containing aromatic radicals represented by phenolic radicals are prone to form five-member rings through decarbonylation during oxidation[60,61]. The formation of five-member rings also reasonably explains the higher tortuosity with the increased conversion rate in Fig. 11b. Although the nanostructure is more disordered, the oxidation rate of mature soot begins to decline when the conversion rate exceeds 65%, as shown in Fig. 14. Correspondingly, A and E still gradually increase to maintain the rate constant k at a certain level according to the Arrhenius relationship. Therefore, the decreased oxidation rate should be attributed to the continuous consumption of solid reactants in the late oxidation stage instead of changes in the physicochemical structure.

Figure 14.
Relationships between activation energy (symbols) and oxidation rates (curves) for soot sampled at 0.8 hf.
-
This work collected early-stage soot and mature soot from the axis of a propane coflow diffusion flame by a capillary-nozzle-hybrid sampling method, which can achieve high sampling efficiency and reduced perturbance to flame simultaneously. Kinetic parameters are evaluated from non-isothermal experimental data at various heating rates. Furthermore, combined with TEM and FTIR, changes in soot structure are monitored within a 75% conversion rate at 5 °C/min to reveal the relationship between soot oxidation kinetics and soot maturity. The main conclusions are listed as follows:
(1) There exist great discrepancies in oxidation reactivity for early-stage soot and mature soot. Mature soot is dominant by the carbonaceous substances oxidation process, presenting negligible mass loss below 450 °C. In contrast, early-stage soot presents mass loss at as low as 300 °C. Early-stage soot oxidation can be divided into a low-T conversion process and carbonaceous substances oxidation process, generating two local maximum rates. The intensity of the former is much more prevailing.
(2) Within the conversion rates of 20%−90%, the oxidation activation energy of mature soot distributes from 160 to 185 kJ/mol, which grows monotonically with the conversion rate and has a slower and slower growth rate. The value is much lower for early-stage soot, distributed from 128 to 156 kJ/mol. Moreover, its dependence on conversion rates appears to be multi-staged. Before a 70% conversion rate, activation energy is slow to fall. Afterward, oxidation is dominated by the carbonaceous substances oxidation process. The activation energy rapidly increases and approaches the values of mature soot in the early stage of oxidation. There also exists a compensation effect between activation energy and pre-exponential factor for both soot samples.
(3) Mature soot presents the combined modes of surface and internal oxidation. Accompanied by the declined particle diameters, nanostructure become more disordered. Especially at a 75% conversion rate, soot particles become hollow interiors and rich in H- and O-containing functional groups. Correspondingly, early-stage soot merely presents surface oxidation mode. Their nanostructure tend to be more and more organized.
This work was supported by the AECC innovation funds (ZZCX-2021-003). The authors also appreciate the Instrumental Analysis Center, Shanghai Jiao Tong University for sample characterization services.
-
The authors confirm contribution to the paper as follows: study conception and design: Liu P, Li S; data collection: Liu P; analysis and interpretation of results: Liu P; draft manuscript preparation: Liu P, Li S. Both authors reviewed the results and approved the final version of the manuscript.
-
The datasets generated during and/or analyzed during the current study are available from the corresponding author on reasonable request.
-
The authors declare that they have no conflict of interest.
- Copyright: © 2025 by the author(s). Published by Maximum Academic Press, Fayetteville, GA. This article is an open access article distributed under Creative Commons Attribution License (CC BY 4.0), visit https://creativecommons.org/licenses/by/4.0/.
-
About this article
Cite this article
Liu P, Li S. 2025. Influence of maturity on the oxidation kinetics and nanostructure evolution of soot sampled from a propane coflow diffusion flame. Progress in Reaction Kinetics and Mechanism 50: e001 doi: 10.48130/prkm-0025-0001 

Figure 1.
(a) Schematic diagram of the experimental apparatus. (b) The propane co-flow diffusion flame with the sampling positions hinted by white circles. (c) Teflon filter (white) after sampling, showing that the cross-section area is completely covered by soot (black).