


-
A large portion of the global population is affected by malnutrition. For example, 30% of the population in South Asia, particularly children and pregnant and lactating women in India, Pakistan, Bangladesh, Sri Lanka, and Nepal, are at risk of zinc (Zn) deficiency[1,2]. Insufficient Zn intake is linked to 20% of global child mortality[3]. Similarly, 24.8% of the global population (1.62 billion people) suffers from anemia, a human disease caused by iron (Fe) deficiency[4]. This deficiency primarily affects infants aged 4 to 24 months, school-age children, and pregnant and lactating mothers[5]. Although rare, copper (Cu) deficiency has been observed in preterm infants, infants fed cow's milk, and those recovering from malnutrition with accompanying diarrhea. The Cu requirement for infants is usually approximately 0.2 mg/d, and for lactating mothers, it is 1.3 mg/d[6]. Cu deficiency can result in growth impairment, glucose and cholesterol metabolism abnormalities, and increased infection rates[7]. These micronutrient deficiencies in humans occur due to low concentrations of these nutrients in the edible part of the plant.
In deficit soil, the supply of these micronutrients is insufficient for plant needs, leading to widespread micronutrient deficiency and poor grain quality[8]. Zn deficiency is widespread in agricultural soils. Approximately 50% of cereal-growing soils in India are low in plant-available Zn[9]. Similarly, 19.2% and 11.4% of the soil are low in Fe and Cu, respectively[10]. Cu deficiency is common in cereals grown in calcareous or alkaline soils due to the low availability of Cu[11]. Unfortunately, these nutrient deficiencies are common in soils that are rich in these nutrients because the deficiency of one essential element may impair the absorption of another (e.g., potassium (K) deficiency may impair Fe absorption). All the processes, such as root and foliar uptake, assimilation, translocation, and remobilization of nutrients, are complex and governed by several interconnected environmental and genetic factors[12]. The concentrations of Fe, Zn, and Cu in the grain are influenced by several factors, including fertilizer management, weather, soil fertility, organic matter, and variety[13]. Among these factors, fertilizer management is the most important. Even the best variety will fail to produce nutritionally superior grains if fertilizer management is not optimal. Therefore, it is crucial to fertilize crops with an alternate nutrient management strategy to ensure a balanced proportion of all the essential elements. One such strategy is 4R nutrient stewardship[14,15].
Increasing cationic micronutrient concentrations in staple food crops such as rice, wheat, maize, cassava, pearl millet, beans, and sweet potato have gained importance with increasing awareness about nutritional security. 'HarvestPlus' is a global movement that started in 2004 to rapidly scale up the production and consumption of biofortified staple crops[16]. Biofortification initiatives increase Fe and Zn concentrations and bioavailability by altering the molecular and physiological processes involved in absorption, distribution, and accumulation[11]. Similarly, agronomic biofortification has been proven to increase the nutritional value of grain[8,17]. The interaction between nutrients plays a major role in determining the efficacy of agronomic biofortification[18]. Almost all essential nutrients, including primary, secondary, and micronutrients, are known to interact with K[19]. The nature of the interaction (synergistic/antagonistic/neutral) between K and micronutrients is still not clear in cereals.
Nutrient interaction studies will help in understanding the effect of one nutrient on another nutrient[19]. The efficiency of applied K fertilizer depends on the rate, time, method, and source of K fertilizer. Knowing the right time, the right method, the right rate, and the right fertilizer source combination (4R stewardship) will help increase nutrient use efficiency, grain yield, and grain quality[14,15]. Nutrient interactions are generally measured in terms of changes in the concentration of nutrients[20]. Among the various indices used to study nutrient interactions, the nutrient harvest index (NHI) is extensively used by researchers to identify best management practices that provide maximum nutrient remobilization to improve crop nutritional value while minimizing the environmental impact of agriculture[21,22]. The NHI is a concept that has been around for a long time in agricultural research. The NHI measures the amount of nutrients that are transported to the economically valuable part of the crop, which is typically the grain, relative to the total amount of nutrients taken up by the plant[22]. This is calculated by dividing the amount of nutrients stored in the grain by the total amount of nutrients taken up during growth[23,24].
K is a macronutrient taken up by a wheat crop in large quantities during its life cycle, and K plays a major role in many of the physiological and biochemical processes of the plant[25]. Intensive agriculture with imbalanced fertilization results in significant K mining and diminished use efficiency of other nutrients[26,27]. In the last two decades, many researchers have reported positive responses of wheat crops to K fertilization in the rice-wheat cropping system (RWCS) of the Indo-Gangetic Plain (IGP)[28,29]. The majority of K research on RWCSs has mostly concentrated on determining the optimum rate and the optimum time of application. Very few studies have evaluated the impact of different sources and methods of K fertilization, and there is a notable lack of investigations into the relationship between K fertilization and micronutrient uptake. A better understanding of K interactions with micronutrients is crucial, as plant growth and development are heavily influenced by the combination and concentration of mineral nutrients in the soil[20]. Knowledge about the impact of the rate, method, time, and source of K fertilizer on yield, quality, and use efficiency is essential for maximizing the benefits of K fertilization[22]. It is important to evaluate these effects collectively rather than separately in a single experiment to gain a comprehensive understanding of the interactions.
To address the above knowledge gap, two-year field trials were conducted with the following hypothesis. Fertilizing wheat crops with potassium via 4R stewardship may result in higher yields and better grain quality when all the essential nutrients are present in sufficient quantities. Potassium might interact synergistically with cationic micronutrients both in the soil and in plants and facilitate the translocation of micronutrients to grain.
-
The field trials were conducted during the rabi (November−April) seasons of 2015−2016 and 2016−2017 at the research farm of the ICAR-Indian Agricultural Research Institute (IARI), New Delhi (India), which is situated at a latitude of 28°40'N, a longitude of 77°12'E, and an altitude of 228.6 m above mean sea level (Fig. 1). The soil texture is sandy loamy (typic haplustept) with a pH of 7.5, an EC of 0.32 dSm, an OC of 0.55%, an available N (alkaline potassium permanganate method) of 201 kg/hectare (ha), an available P (Olsen method) of 12.8 kg/ha and an available K (flame photometry method) of 213.8 kg/ha in the topsoil layer (15 cm)[30]. The DTPA-extractable Fe, Zn, and Cu concentrations in the experimental soil were 6.3, 0.8, and 1.1 mg/kg, respectively. The detailed soil physical and chemical properties of the experimental site are given in Supplemental Table S1.
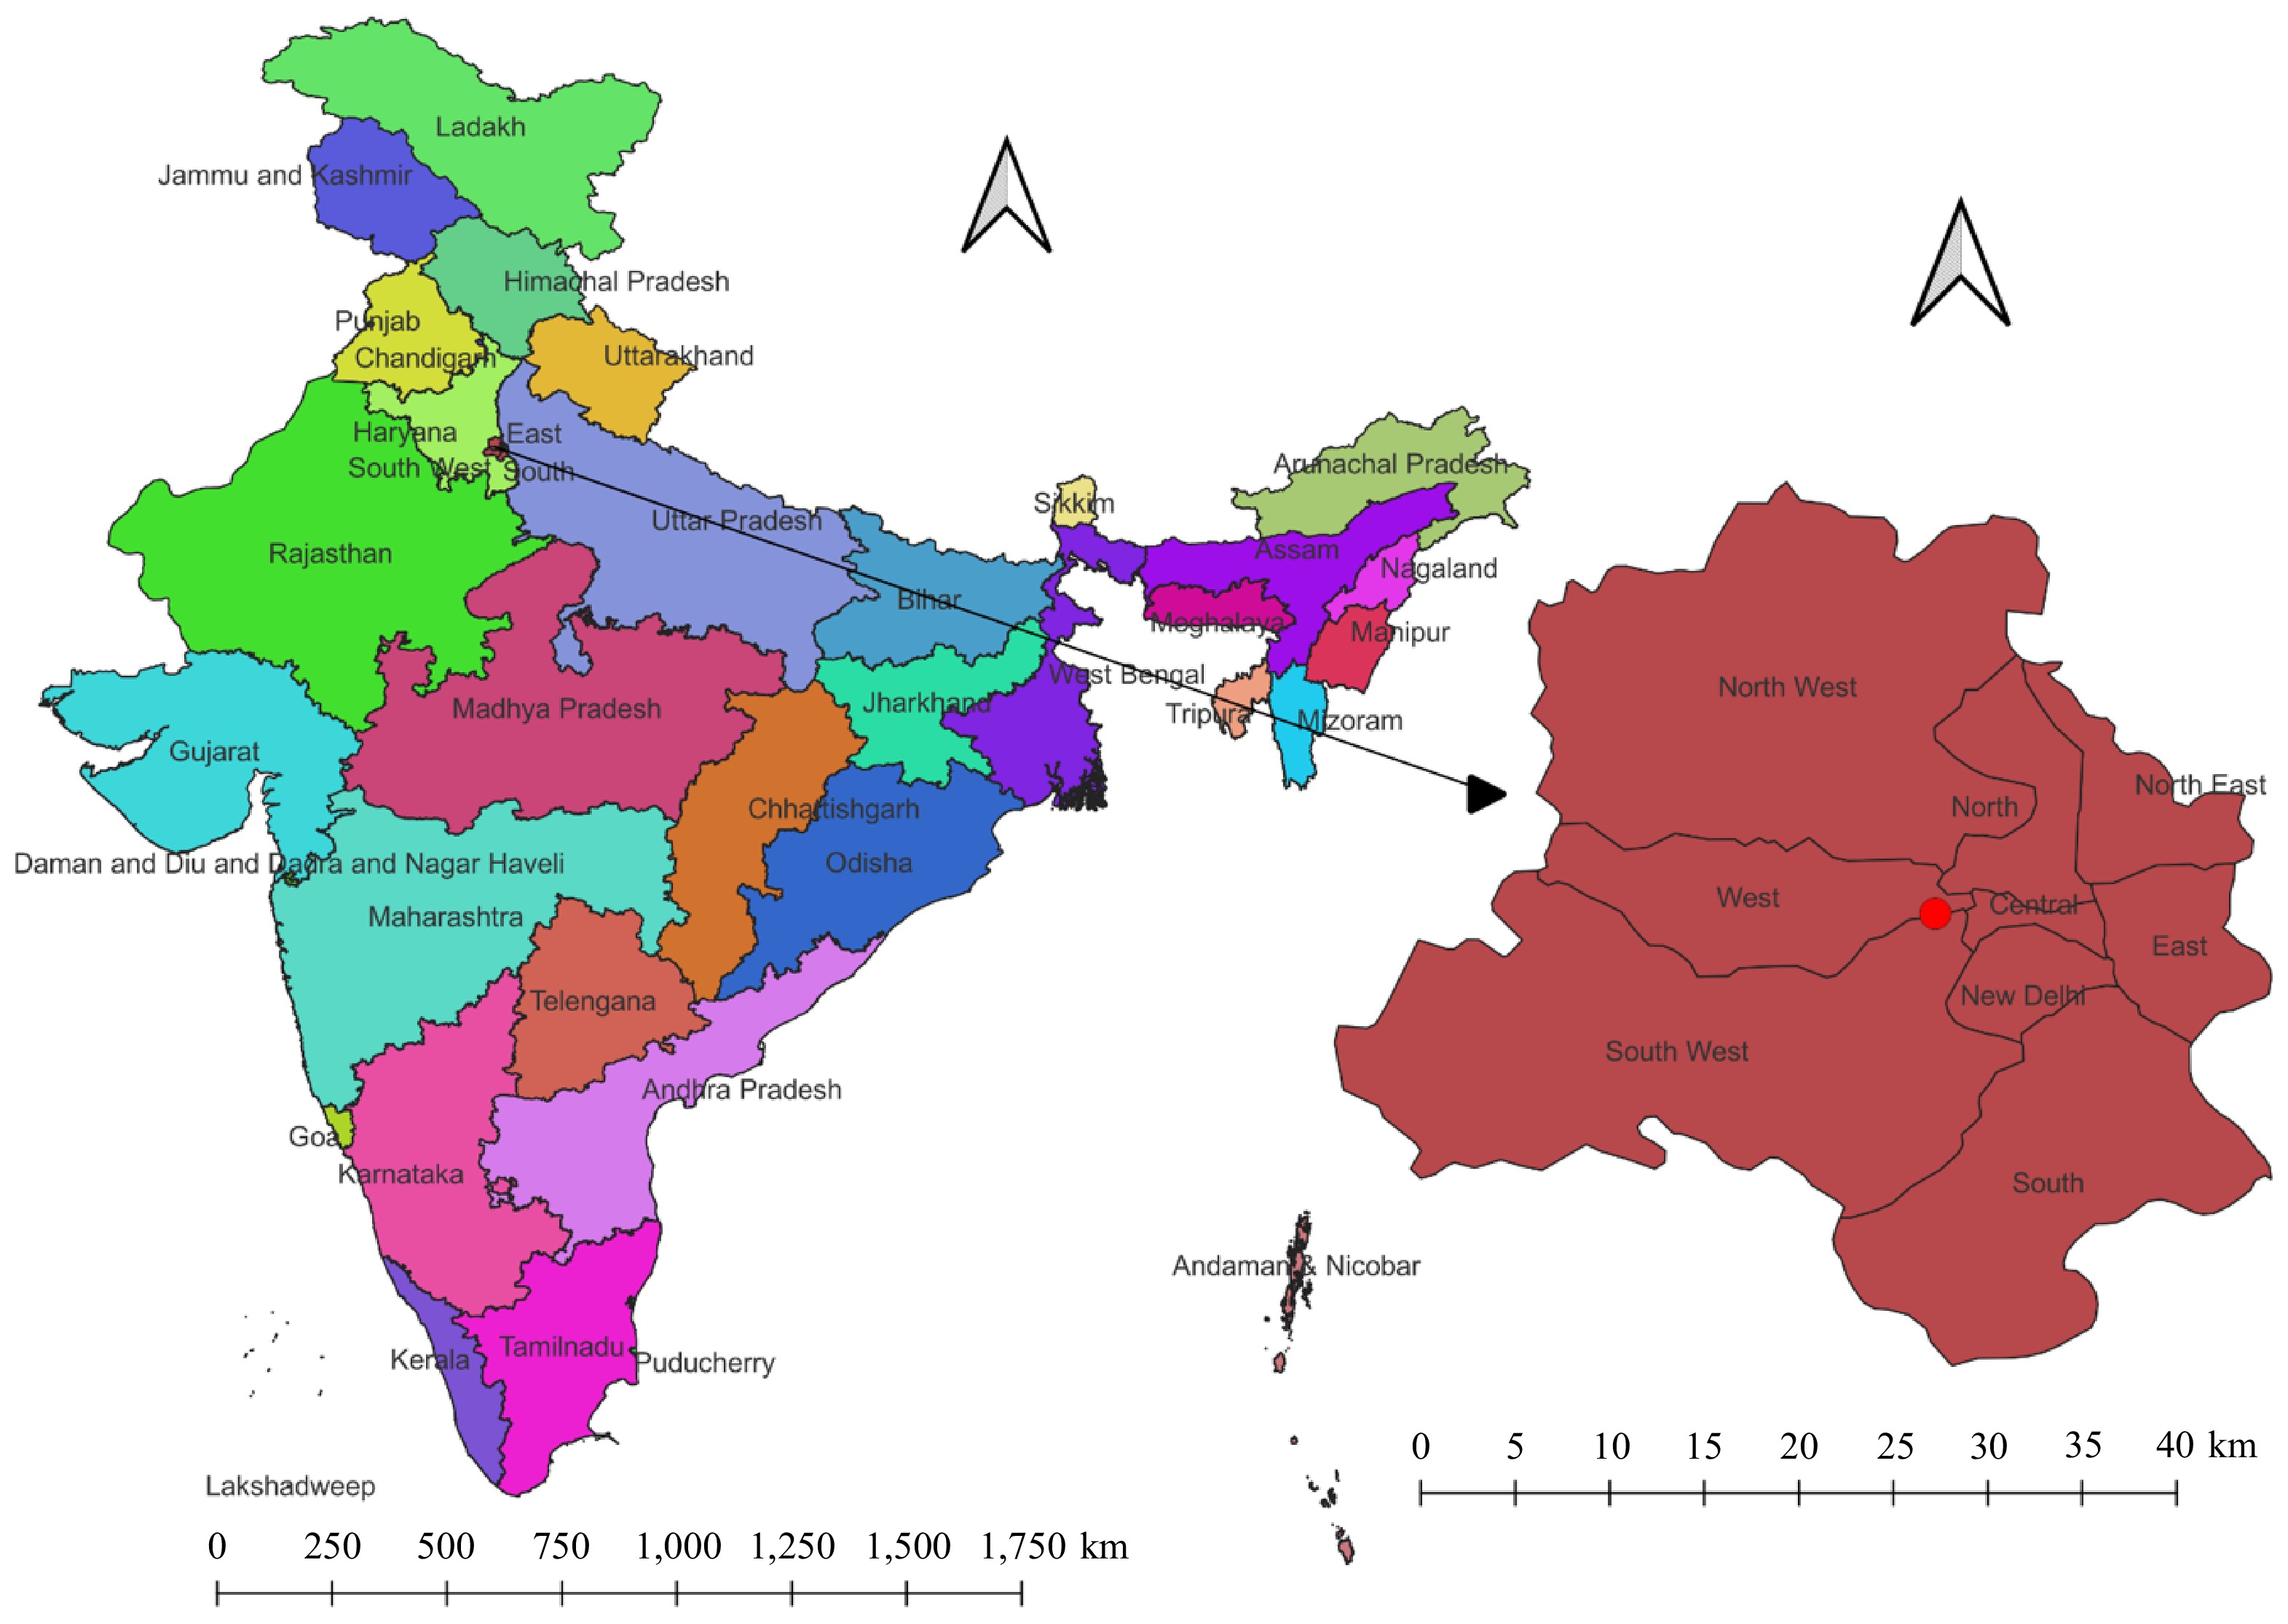
Figure 1.
Map showing the study area.
Weather profile of the experimental site
-
The experimental site features a subtropical semiarid environment characterized by hot, dry summers and cold winters, falling within the agroclimatic zone of the Trans-Gangetic Plains. The hottest months are May and June, with maximum temperatures ranging from 41 to 46 °C, while temperatures begin to decline from September onward. January is the coldest month, with minimum temperatures ranging from 5 to 7 °C. The average annual rainfall is 650 mm, with July to August being the wettest months. The average evaporation is approximately 850 mm annually. Detailed daily weather information for the experimental plot during the crop season can be found in Supplemental Figs S1 & S2.
Treatments and experimental design
-
A two-year field study was conducted with 12 treatments, which included varying rates, methods, sources, and times of K application, using a randomized block design. The experiment was replicated three times. The specifics of each treatment are outlined in Table 1. The gross plot size of each treatment was 4.5 m × 4.0 m. The layout of the experimental plots can be found in Supplemental Fig. S3. In both years, the wheat crop was sown in the middle of November using a seed drill with a row spacing of 0.22 m and a seed rate of 100 kg/ha. Harvesting took place in April. HD 2967 (Pusa Sindhu Ganga) is a double dwarf wheat variety suitable for timely irrigation in the Northwestern Plain Zone (NWPZ) and Northeastern Plain Zone (NEPZ). Given that the study area is in the NWPZ, the commonly grown cultivar of the region was selected for this trial. One week before wheat sowing, the field was disked and planked twice, and leveling was achieved with a land leveler.
Table 1. Treatment details.
Trt No. Details Kg K/ha T1 No application of K (control) 0 T2 Basal application of 49.8 kg K/ha through muriate of potash (MOP) 49.8 T3 Basal application of 24.9 kg K/ha through MOP 24.9 T4 Basal application of 24.9 kg K/ha followed by 24.9 kg K/ha at spike initiation (SI) through MOP 49.8 T5 Basal application of 37.4 kg K/ha followed by 12.45 kg K/ha at spike initiation (SI) through MOP 49.8 T6 2 foliar sprays (1st active tillering, 2nd SI) of 2.5% KNO3 8.8 T7 Basal application of 49.8 kg K/ha through MOP followed by 2 foliar sprays (1st active tillering, 2nd SI) of 2.5% KNO3 58.6 T8 Basal application of 24.9 kg K/ha through MOP followed by 2 foliar sprays (1st active tillering, 2nd SI) of 2.5% KNO3 33.7 T9 Basal application of 37.4 kg K/ha followed by 2 foliar sprays (1st active tillering, 2nd SI) of 2.5% KNO3 46.2 T10 Basal application of 24.9 kg K/ha plus 24.9 kg K/ha at SI through MOP followed by 2 foliar sprays (1st active tillering, 2nd SI) of 2.5% KNO3 58.6 T11 Basal application of 37.4 kg K/ha plus 12.45 kg K/ha at PI through MOP followed by 2 foliar sprays (1st active tillering, 2nd PI) of 2.5% KNO3 58.6 T12 Basal application of 74.7 kg K/ha through MOP 74.7 A blanket rate of 120 kg nitrogen (N)/ha was applied in three splits by applying 1/3 at 10 days after sowing (DAS), 1/3 at tillering (50 DAS), and the remaining 1/3 at the spike initiation stage (80 DAS) through urea fertilizer. Similarly, the recommended rate of 26.2 kg P/ha was applied through single super phosphate just before sowing and incorporated into the soil while sowing by seed drill. K was applied according to the treatments. A foliar spray (FS) of 2.5% potassium nitrate was applied at active tillering (45−50 DAS) followed by the spike initiation (SI) stage (75−80 DAS) only in the selected treatments (Table 1). The N supplied through K foliar spray was neutralized by applying an equivalent amount of N in the treatments without K foliar spray. The wheat crop received a total of six irrigations each year, which were applied based on the soil moisture conditions and wheat growth stages. Details of the irrigation schedule can be found in Supplemental Table S2. To prevent competition between weeds and crops for growth resources, weeds in the experimental plots were manually removed at 30 and 50 d after sowing (DAS). The calendar outlining various operations performed on the wheat crop is also presented in Supplemental Table S3.
Nutrient concentration analysis
-
At the time of harvest, both grain and straw samples were collected from each treatment for nutrient concentration analysis. From each treatment, 0.5 g grain and straw samples were taken to analyze the concentrations of K, Zn, Cu, and Fe. The collected samples were shade-dried for approximately 5 d, followed by additional drying in a hot air oven at 70 °C for 24 h before being ground to pass through 40 mesh sieves. The concentrations of DTPA-extractable Zn, Cu, and Fe in both the straw and grain of the wheat crop were determined using ground samples following the procedure described by Prasad et al.[30]. The total uptake of Zn, Cu, and Fe in wheat was calculated by multiplying the grain and straw yields by their respective concentrations and expressed in g/ha.
$ \rm Total\;zinc\;uptake\;(g/ha)=\dfrac{(SY\,\times\, ZnC_S)}{1,000}\,+\,\dfrac{(GY\,\times\, ZnC_G)}{1,000} $ $ \rm Total\;iron\;uptake\;\left({g}/{ha}\right)=\dfrac{(SY\,\times\, FeC_S)}{1,000}\,+\,\dfrac{GY\,\times\, FeC_G}{1,000} $ $ \rm Total\;copper\;uptake\;\left({g}/{ha}\right)=\dfrac{(SY\,\times \, CuC_S)}{1,000}\,+\,\dfrac{(GY\,\times\,CuC_G)}{1,000}$ where SY is the straw yield (kg/ha), GY is the grain yield (kg/ha), ZnCS is the zinc concentration in straw (mg/kg), ZnCG is the zinc concentration in grain (mg/kg), FeCS is the iron concentration in straw (mg/kg), FeCG is the iron concentration in grain (mg/kg), CuCS is the copper concentration in straw (mg/kg), and CuCG is the copper concentration in grain (mg/kg).
The potassium concentration in the grain and straw was determined through the flame photometer method as per the procedure described by Prasad et al.[30].
$ \rm K\;in\;plant\;material\;(ppm)=\dfrac{Flame\;photometer\;reading\,\times\,100\,\times\,25}{5\,\times\,sample\;weight\;(g)}$ $ \rm K\;in\;plant\;material\;({\text{%}})=K\;in\;plant\;material\;(ppm)\,\times\,10^{-4} $ Nutrient harvest index
-
The zinc harvesting index (ZnHI), iron harvesting index (FeHI) and copper harvesting index (CuHI) were calculated using the following formulas and are expressed as percentages[22]:
$ \rm Zinc\;harvest\;index\;(ZnHI)=\dfrac{Zn_g}{Zn_t}\,\times\,100$ $ \rm Iron\;harvest\;index\;(FeHI)=\dfrac{Fe_g}{Fe_t}\,\times\,100$ $ \rm Copper\;harvest\;index\;(CuHI)=\dfrac{Cu_g}{Cu_t}\,\times\,100 $ where Zng = total Zn uptake in grain (g), Znt = total Zn uptake in whole plant (grain + straw) (g), Feg = total Fe uptake in grain (g), Fet = total Fe uptake in the whole plant (grain + straw) (g), Cug = total Cu uptake in grain (g), and Cut = total Cu uptake in whole plant (grain + straw) (g).
Statistical analysis
-
The acquired data were subjected to statistical significance analysis using Statistical Analysis System (SAS) software. One-way analysis of variance (ANOVA) and an F test were used to determine the significant effects of K fertilization on the uptake of Fe, Zn, and Cu in both straw and grain, as well as on their respective harvest indices. Mean comparisons were conducted using the least significant difference (LSD) test. The correlation between nutrient concentrations in the grain and straw was calculated using the Pearson correlation coefficient in RStudio version 4.3.0. A correlation heatmap was generated using the corrplot package version 0.92 to visualize correlation. Statistical significance levels are represented by asterisks (*), indicating the strength and significance of the observed correlations. Specifically, significance levels of 95% (p < 0.05), 99% (p < 0.01), and 99.9% (p < 0.001) are denoted by *, **, and ***, respectively.
-
Throughout both years of the study, treatments T10 and T11 consistently exhibited the highest K concentrations in both the grain and straw (Table 2). The highest grain K concentrations were on par with those in T4 and T7 in the first year and with those in T4, T5, T7, and T12 in the second year. Conversely, the highest straw K concentration was on par with most of the treatments, excluding T1, T3, T6, and T8, across both experimental years. The K concentrations in the wheat grain and straw ranged from 0.33% to 0.54% and from 1.24% to 1.59%, respectively. In treatments T10 and T11, the straw K concentration was three times that of the grain K concentration, while in T1, the straw K concentration was 3.8 times that of the grain K concentration. The grain K concentration in wheat was greater in treatments where a higher dose of K (49.8–58.6 kg/ha) was applied in two splits, and basal K application (37.4 kg K/ha) was supplemented with two foliar sprays (FS) of 2.5% K.
Table 2. Effect of different rates, time, methods and sources of K application on grain & straw K concentration and total K uptake.
Treatments K concentration in grain (%) K concentration in straw (%) K uptake by grain
(kg/ha)K uptake by straw
(kg/ha)Total K uptake
(kg/ha)1st year 2nd year 1st year 2nd year 1st year 2nd year 1st year 2nd year 1st year 2nd year T1 0.33H 0.33F 1.24F 1.30E 14.3E 14.3F 70.4E 73.5D 84.7G 87.8D T2 0.46DE 0.44BCD 1.49ABC 1.50ABC 23.9C 22.5C 95.0AB 96.4AB 118.9CD 118.9AB T3 0.41FG 0.41DE 1.37DE 1.43CD 19.5D 19.2DE 84.3CD 87.1BC 103.7EF 106.3BC T4 0.50ABCD 0.46ABC 1.53ABC 1.55AB 28.0A 25.4AB 97.9AB 98.7A 125.9ABC 124.1A T5 0.49BCD 0.47AB 1.52ABC 1.54AB 27.7AB 25.8AB 97.2AB 98.1AB 124.8ABC 123.9A T6 0.38G 0.38E 1.29EF 1.36DE 17.4D 17.0EF 75.8DE 79.0CD 93.3FG 96.0CD T7 0.51ABC 0.48AB 1.54AB 1.56AB 29.0A 26.6A 99.1A 99.7A 128.1ABC 126.3A T8 0.44EF 0.42CD 1.43CD 1.47BC 23.0C 21.7CD 89.2BC 94.9AB 112.2DE 116.6AB T9 0.49BCD 0.47AB 1.47BCD 1.54AB 27.8A 25.8AB 95.3AB 98.0AB 123.1ABCD 123.7A T10 0.54A 0.49A 1.57A 1.58A 30.4A 27.1A 101.5A 101.8A 131.9AB 128.9A T11 0.53A 0.49A 1.58A 1.59A 30.2A 27.0A 103.1A 102.3A 133.2A 129.4A T12 0.47CDE 0.45ABC 1.53ABC 1.55AB 24.7BC 23.2BC 97.6AB 99.4A 122.3BCD 122.6A SE(d) 0.02 0.02 0.05 0.05 1.44 1.35 4.56 5.40 5.24 6.21 LSD at 5% 0.04 0.04 0.11 0.10 2.99 2.80 9.47 11.20 10.87 12.87 Means followed by a superscripted similar letter within a column are not significantly different (at p < 0.05) according to LSD test. T1 = No K (control), T2 = 49.8 kg K/ha at basal, T3 = 24.9 kg K/ha at basal, T4 = 24.9 kg K/ha at basal + 24.9 kg K/ha at spike initiation, T5 = 37.4 kg K/ha at basal + 12.5 kg K/ha at spike initiation, T6 = 2 foliar sprays (1st active tillering, 2nd SI) of 2.5% KNO3, T7 = 49.8 kg K/ha at basal + 2 foliar sprays of 2.5% KNO3, T8 = 24.9 kg K/ha at basal + 2 foliar sprays of 2.5% KNO3, T9 = 37.4 kg K/ha at basal + 2 foliar sprays of 2.5% KNO3, T10 = 24.9 kg K/ha at basal + 24.9 kg K/ha at spike initiation + 2 foliar sprays of 2.5% KNO3, T11 = 37.4 kg K/ha at basal + 12.5 kg K/ha at spike initiation + 2 foliar sprays of 2.5% KNO3, T12 = 74.7 kg K/ha at basal. Applying all the K (49.8 kg K/ha) at the time of sowing (basal application) resulted in lower translocation of K to the grain. However, applying the same amount of K in two equal splits (T4) or basal K application supplemented with foliar K sprays (T9) significantly increased the grain K concentration. K supplementation during the ear head initiation stage, either through foliar spray or soil application (top dressing), is crucial for increasing the K concentration in grain. K uptake in grain ranged from 14.3 to 30.4 kg/ha, and in straw, it ranged from 70.4 to 103.1 kg/ha. The total K uptake (grain + straw) ranged from 84.7 to 133.2 kg/ha. Higher K uptake was observed in T10 and T11 due to higher K concentrations and yields. No significant difference in K uptake in the grain was observed with the combined application of K (49.8 kg K/ha) through split applications and foliar sprays (T10, T11). In contrast, applying 75% of the recommended K (37.4 kg K/ha) at the base with two foliar sprays of 2.5% K at maximum tillering and spike initiation (T9) and two equal split applications of 49.8 kg K/ha (T4) provided the maximum K concentration in the grain.
Zinc concentration, uptake, and harvest index
-
The Zn concentration and its uptake by wheat were significantly influenced by potassium application during both years of the study (Table 3). The highest Zn concentration (38–39 mg/kg) was recorded in T11, and it remained on par with the other treatments except for T6 and T1. A significant decrease in the Zn concentration in the grain was observed when external K application was absent (T1), with the lowest grain Zn concentration (34–35 mg/kg) recorded in T1. A similar trend was observed for the straw Zn concentration, with higher concentrations in the K-fertilized plots and the lowest in the T1 plots. Interestingly, the concentration of Zn in the grain was higher than that in the straw at all levels of K fertilization, indicating that a substantial portion of the Zn taken up by the wheat crop is remobilized to the grain. Compared to basal K application, the split and foliar application of K did not significantly affect the concentration of Zn in the grain or straw. Similarly, the basal application of 150% of the recommended dose of K (74.7 kg K/ha) did not significantly increase the Zn concentration in grain compared to the basal application of 100% of the recommended dose of K (49.8 kg K/ha). Notably, the supplementation of K through two foliar sprays in addition to basal K application (24.9 kg K/ha) resulted in 3.0% and 3.2% increases in the grain Zn concentration during the first and second years of the experiment, respectively, compared to the basal application of 50% of the recommended dose of K (24.9 kg K/ha). Similarly, compared with the control (T1), two foliar sprays of 2.5% K (T6) increased the grain Zn concentration by 2.0% and 1.7% during the first and second years of the experiment, respectively.
Table 3. Effects of different rates, time, methods and sources of K fertilization on total zinc uptake, grain zinc concentration, and straw zinc concentration in wheat.
Treatments Zn concentration in grain (mg/kg) Zn concentration in straw (mg/kg) Zn uptake by grain (g/ha) Zn uptake by straw (g/ha) Total Zn uptake (g/ha) 1st year 2nd year 1st year 2nd year 1st year 2nd year 1st year 2nd year 1st year 2nd year T1 34.2B 35.0D 22.7C 21.9 147D 150E 129D 124C 276D 274C T2 37.2A 38.0AB 26.2AB 25.4 194B 194C 167AB 163A 360B 357A T3 36.3AB 36.6BCD 25.6AB 24.1 173C 172D 157BC 147AB 331C 318B T4 37.8A 38.5AB 26.8A 25.1 214A 213A 172AB 160A 385AB 373A T5 37.7A 38.3AB 26.7A 24.8 212A 212AB 170AB 158A 382AB 370A T6 34.9B 35.6CD 24.2BC 23.1 160CD 161DE 143CD 134BC 302D 295BC T7 38.0A 38.4AB 27.2A 25.6 216A 213A 175AB 164A 391A 377A T8 37.4A 37.8ABC 26.6AB 24.8 194B 194C 166AB 160A 360B 354A T9 37.6A 38.0AB 26.8A 24.7 213A 209ABC 173AB 158A 386AB 366A T10 37.5A 39.1A 26.5AB 25.1 213A 217A 172AB 162A 385AB 378A T11 38.3A 39.7A 27.3A 25.5 218A 220A 178A 164A 396A 384A T12 37.3A 38.1AB 26.3AB 24.5 195B 195BC 168AB 158A 363B 353A SE(d) 1.07 1.04 1.15 1.12 6.67 8.13 8.90 10.0 13.15 16.6 LSD at 5% 2.22 2.15 2.38 NS 13.82 16.87 18.45 20.74 27.27 34.3 Means followed by a superscripted similar letter within a column are not significantly different (at p < 0.05) according to LSD test. T1 = No K (control), T2 = 49.8 kg K/ha at basal, T3 = 24.9 kg K/ha at basal, T4 = 24.9 kg K/ha at basal + 24.9 kg K/ha at spike initiation, T5 = 37.4 kg K/ha at basal + 12.5 kg K/ha at spike initiation, T6 = 2 foliar sprays (1st active tillering, 2nd SI) of 2.5% KNO3, T7 = 49.8 kg K/ha at basal + 2 foliar sprays of 2.5% KNO3, T8 = 24.9 kg K/ha at basal + 2 foliar sprays of 2.5% KNO3, T9 = 37.4 kg K/ha at basal + 2 foliar sprays of 2.5% KNO3, T10 = 24.9 kg K/ha at basal + 24.9 kg K/ha at spike initiation + 2 foliar sprays of 2.5% KNO3, T11 = 37.4 kg K/ha at basal + 12.5 kg K/ha at spike initiation + 2 foliar sprays of 2.5% KNO3, T12 = 74.7 kg K/ha at basal. The Zn concentration in the wheat straw ranged from 21.9 to 27.3 mg/kg. Significant differences in the Zn concentration in straw were observed only in the first year of the experiment, with no significant effect observed in the second year. During the first year, the Zn concentration in the straw was significantly on par with that in all the treatments except for T1 and T6. The lowest Zn concentration was observed in T1, in comparison to all the other K treatments, which provides clear evidence of the significant role of K in Zn uptake. In contrast to the straw Zn concentration, Zn uptake in straw was significant in both years of the study, ranging from 124 to 178 g/ha. T11 had the highest Zn uptake in straw, which remained statistically on par with all other treatments except T1 and T6 during both years of the experiment.
The uptake of Zn in grain and straw was higher in the K-fertilized plots due to elevated Zn concentrations and higher yields (grain and straw) in the K-fertilized treatments. Compared to T2 (basal application of 49.8 kg K/ha), in T4 (two split applications of 49.8 kg K/ha), the Zn uptake in grain increased by 10% and 9.8% during the first and second years of the experiment, respectively. Similarly, in T8 (24.9 kg K/ha basal + 2 foliar spray), the grain Zn uptake increased by 12.1% and 12.7% during the first and second years of the experiment, respectively, compared to that in T3 (24.9 kg K/ha basal). This shows that in the absence of K top dressing, the two foliar sprays of K increase the Zn uptake in grain by enhancing the grain Zn concentration and grain yield.
The total Zn uptake in the wheat crop ranged from 276–396 g/ha and 274–384 g/ha during the first and second years of the experiment, respectively. The lowest total Zn uptake (grain + straw) was recorded in the control treatment (T1) during both years of the study, indicating the significant role of K fertilization in wheat crop uptake. The external application of K up to 58.6 kg K/ha increased Zn uptake in the wheat crop, beyond which increasing the K application rate did not result in a significant increase in Zn uptake. The total Zn uptake in T4 was 39.4% and 36.1% greater than that in the control during the first and second years, respectively (T1). Similarly, the total Zn uptake was 16.3% and 17.3% greater in T4 than in T3 during the first and second years, respectively (24.9 kg K/ha at basal). The nonsignificant difference in total Zn uptake between T4 and T12 during both years of the experiment indicates that the basal application of a higher rate of K (74.7 kg K/ha) or two split applications (50:50 ratio) of 49.8 kg K/ha provides equal benefits. The basal application of a relatively high amount of K (74.7 kg K/ha) only increased the production cost without improving the nutritional quality of the wheat grain. The benefits of split applications, such as yield and quality improvement, along with minimal environmental impact, outweigh the additional labor cost incurred for split applications.
The zinc harvest index (Zn HI) HI of the wheat crop ranged from 52.3%–55.5% and 53.9%–57.4% during the first and second years of the experiment, respectively. Approximately half of the Zn absorbed by the wheat crop is remobilized to the grain. The Zn HI was not significant during the first year but was significant during the second year of the experiment (Fig. 2). The higher Zn HI in the K-fertilized plots indicates the remobilization of Zn inside the plant from straw to grain. The application of 49.8 kg K/ha into two splits (24.9 kg K/ha at basal fertilization and 24.9 kg K/ha at spike initiation) resulted in a 5.9% increase in Zn HI during both years of the study compared to T3, which received 24.9 kg K/ha at basal fertilization. Similarly, during the first and second years of the experiment, T4 (24.9 kg K/ha at basal fertilization followed by 24.9 kg K/ha at spike initiation) increased the Zn HI by 3.0% and 5.2%, respectively, compared to T2, which received 49.8 kg K/ha at basal fertilization alone. These findings suggest that an inadequate K supply could lead to a reduction in the Zn HI in wheat. Applying K at the ear head initiation stage promotes the uptake of Zn from the soil and facilitates its movement from the roots, stem, and leaves to the grains. Thus, ensuring an adequate supply of K at the right growth stage is important for ensuring higher Zn HI in wheat.
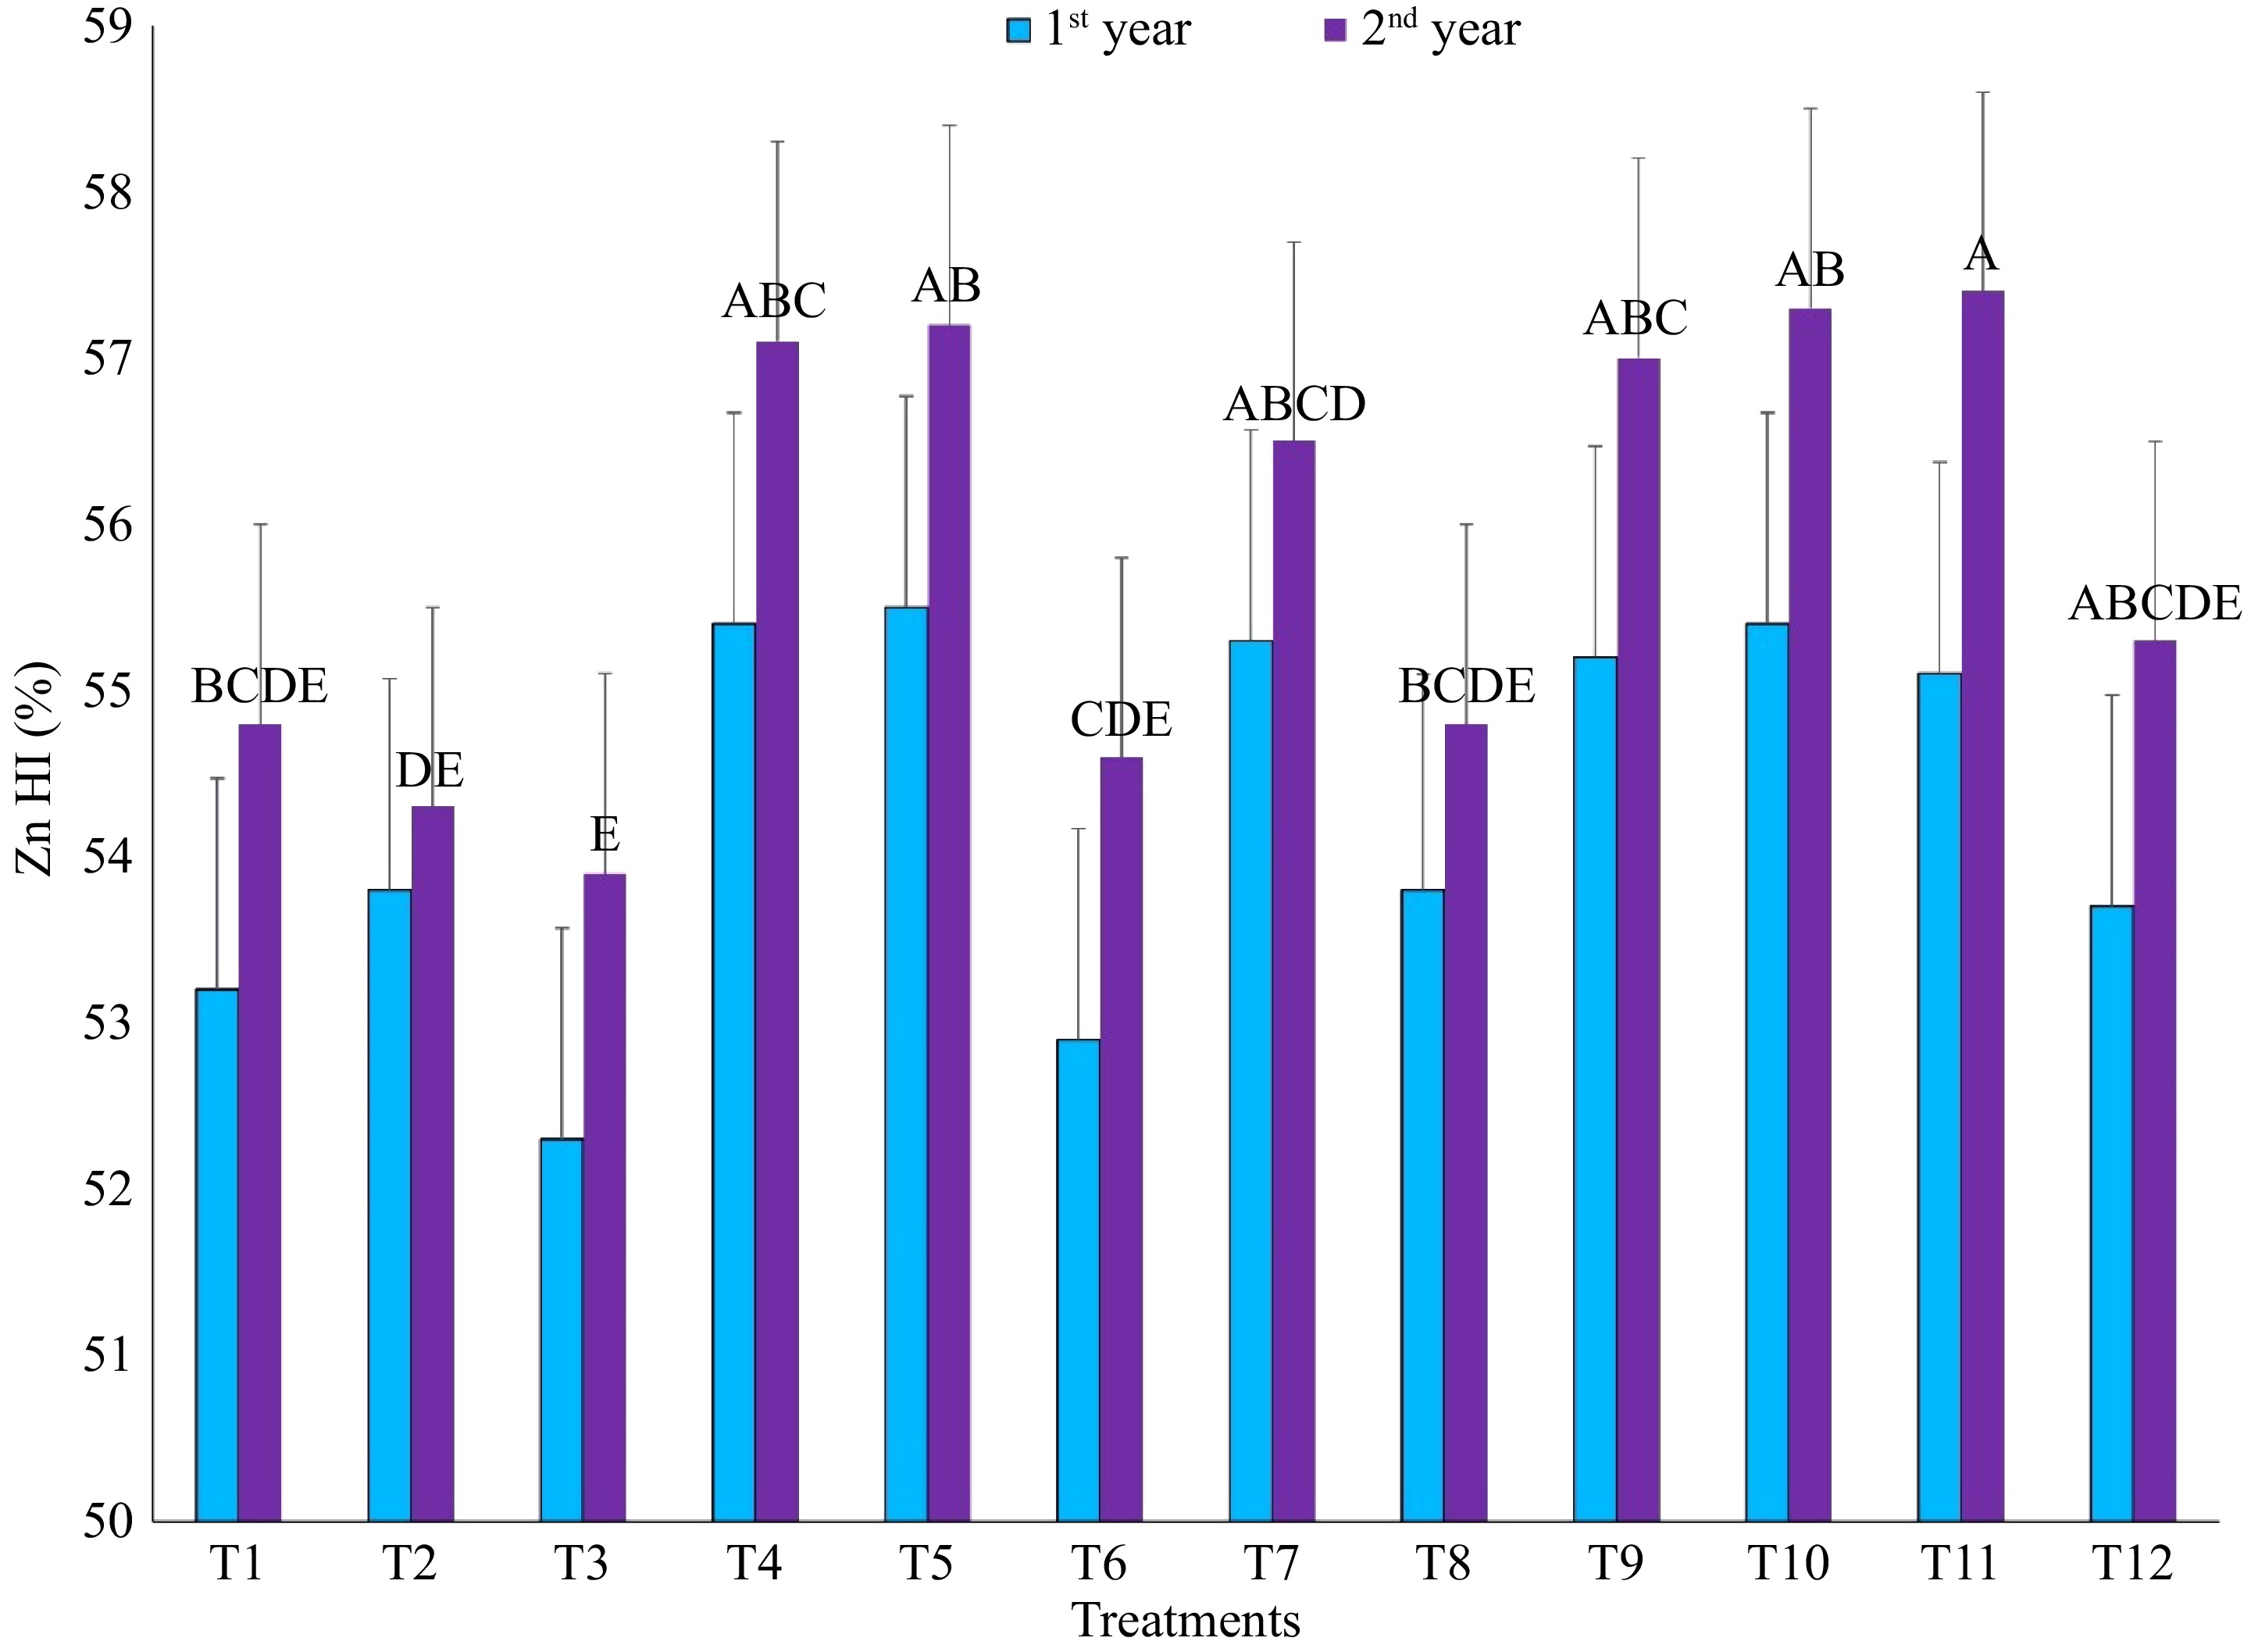
Figure 2.
Effect of different rates, time, methods, and sources of potassium fertilization on zinc harvest index. T1 = No K (control), T2 = 49.8 kg K/ha at basal, T3 = 24.9 kg K/ha at basal, T4 = 24.9 kg K/ha at basal + 24.9 kg K/ha at spike initiation, T5 = 37.4 kg K/ha at basal + 12.5 kg K/ha at spike initiation, T6 = 2 foliar sprays (1st active tillering, 2nd SI) of 2.5% KNO3, T7 = 49.8 kg K/ha at basal + 2 foliar sprays of 2.5% KNO3, T8 = 24.9 kg K/ha at basal + 2 foliar sprays of 2.5% KNO3, T9 = 37.4 kg K/ha at basal + 2 foliar sprays of 2.5% KNO3, T10 = 24.9 kg K/ha at basal + 24.9 kg K/ha at spike initiation + 2 foliar sprays of 2.5% KNO3, T11 = 37.4 kg K/ha at basal + 12.5 kg K/ha at spike initiation + 2 foliar sprays of 2.5% KNO3, T12 = 74.7 kg K/ha at basal.
Iron concentration, uptake, and harvest index
-
The application of K fertilizer significantly impacted the concentration and uptake of Fe by wheat during both years of the study (Table 4). The treatments with the highest Fe concentrations (110–115 mg/kg) were T7 and T11, which were significantly different from the other treatments except for T1, T3, and T6. This trend demonstrated that the absence or insufficient supply of K fertilizer caused a significant decrease in the Fe concentration in the wheat grain. Compared with T1, the basal application of 49.8 kg K/ha (T2) increased the Fe concentration in the grain by 13.4% and 12.3% during the first and second years of the experiment, respectively, revealing that increasing rates of K application can increase the Fe concentration in the grain. Furthermore, the application of the recommended rate of K (49.8 kg K/ha) and foliar K sprays (2.5% K) increased the concentration of Fe in the grain, although it remained on par with that in T2. Compared with those of T1, the two foliar sprays of K increased the Fe concentration in the grain by 5.6% and 3.1% during the first and second years of the experiment, respectively. This indicates that soil application of K is more effective than foliar application in increasing the Fe concentration. The lowest Fe concentration in the grain (89 mg/kg – 1st year, 97 mg/kg – 2nd year) was recorded in the control treatment (no K application). Similar to that in the grain, the Fe concentration in the straw increased with increasing rates of K fertilization, and the lowest straw Fe concentration was recorded in T1 (no K application). However, the split and foliar application of K did not significantly affect the straw Fe concentration compared to the basal application of a recommended rate of K. The Fe concentration in wheat straw ranged between 249 and 292 mg/kg. In general, the straw Fe concentration was 2.5 times greater than the grain Fe concentration. The application of 49.8 kg K/ha in two splits increased the straw Fe concentration by 6.8% and 5.8% compared to that in T1 (no K applied).
Table 4. Effects of different rates, time, methods and sources of K fertilization on total iron uptake, grain iron concentration, and straw iron concentration in wheat.
Treatments Fe concentration in grain (mg/kg) Fe concentration in straw (mg/kg) Fe uptake by grain (g/ha) Fe uptake by straw (g/ha) Total Fe uptake (g/ha) 1st year 2nd year 1st year 2nd year 1st year 2nd year 1st year 2nd year 1st year 2nd year T1 89E 97 249C 275C 381D 413E 1416D 1558D 1797E 1971C T2 101CD 109ABC 263AB 288AB 522B 555BC 1672AB 1849AB 2194CD 2404A T3 98D 103CDE 260AB 284ABC 466C 485D 1601BC 1729BC 2067D 2214B T4 108ABC 112AB 266A 291A 607A 619A 1703AB 1854AB 2311ABC 2473A T5 109ABC 113AB 267A 292A 610A 621A 1705AB 1861AB 2315ABC 2482A T6 94DE 100DE 254BC 280BC 431CD 452DE 1493CD 1630CD 1924E 2081BC T7 110A 115A 270A 292A 625A 631A 1737AB 1870A 2361A 2501A T8 101BCD 107BCD 265AB 286AB 524B 548C 1659AB 1847AB 2183CD 2394A T9 109AB 111AB 267A 288AB 618A 611AB 1728AB 1834AB 2346AB 2445A T10 108ABC 114AB 271A 291A 613A 629A 1755A 1878A 2369A 2507A T11 110A 115A 271A 292A 627A 636A 1766A 1878A 2392A 2514A T12 102ABCD 110ABC 265A 288AB 533B 562BC 1690AB 1852AB 2223BC 2414A SE(d) 4.03 3.78 5.36 4.75 27.06 27.54 65.70 63.53 66.3 70.24 LSD at 5% 8.35 7.83 11.11 9.86 56.12 57.12 136.26 131.75 137.5 145.67 Means followed by a superscripted similar letter within a column are not significantly different (at p < 0.05) according to LSD test. T1 = No K (control), T2 = 49.8 kg K/ha at basal, T3 = 24.9 kg K/ha at basal, T4 = 24.9 kg K/ha at basal + 24.9 kg K/ha at spike initiation, T5 = 37.4 kg K/ha at basal + 12.5 kg K/ha at spike initiation, T6 = 2 foliar sprays (1st active tillering, 2nd SI) of 2.5% KNO3, T7 = 49.8 kg K/ha at basal + 2 foliar sprays of 2.5% KNO3, T8 = 24.9 kg K/ha at basal + 2 foliar sprays of 2.5% KNO3, T9 = 37.4 kg K/ha at basal + 2 foliar sprays of 2.5% KNO3, T10 = 24.9 kg K/ha at basal + 24.9 kg K/ha at spike initiation + 2 foliar sprays of 2.5% KNO3, T11 = 37.4 kg K/ha at basal + 12.5 kg K/ha at spike initiation + 2 foliar sprays of 2.5% KNO3, T12 = 74.7 kg K/ha at basal. The Fe uptake in grain and straw and total Fe uptake (grain + straw) were greater in the K-fertilized plot due to the greater Fe concentration and grain yield. The total Fe uptake in T4 (application of 49.8 kg K/ha in two splits) was 11.8% and 11.6% greater than that in T3 (24.9 kg K/ha at basal) during the first and second years of the experiment, respectively. The difference in total Fe uptake between T2 (49.8 kg K/ha at basal) and T4 (application of 49.8 kg K/ha in two splits) was not statistically significant. Similarly, the basal application of 74.7 K/ha and 49.8 kg K/ha did not result in a significant difference in total Fe uptake. The Fe harvest index (Fe HI) was significant during both years of the experiment (Fig. 3). The Fe HI of the wheat crop ranged between 21.2%–26.5% and 21%–25.3% during the first and second years of the experiment, respectively. Only 1/4 of the total Fe taken by the wheat crop is translocated to the grain. The significantly greater Fe HI in T7 and T11 emphasizes the beneficial effect of K foliar sprays and the split application of K on Fe remobilization from straw to grain. The two-split application of 49.8 kg K/ha (T4) and basal application of 37.4 kg K/ha followed by 2 foliar sprays (T9) increased the Fe HI by 10.5% and 8.2% during the first and second years of the experiment, respectively, over T2 (48.9 kg K/ha at basal). These results demonstrate the advantage of using K at the ear head initiation stage either through soil application or foliar spray. A sufficient and timely supply of K during the crucial growth stage (ear head initiation) is vital for efficient iron uptake and remobilization in wheat.
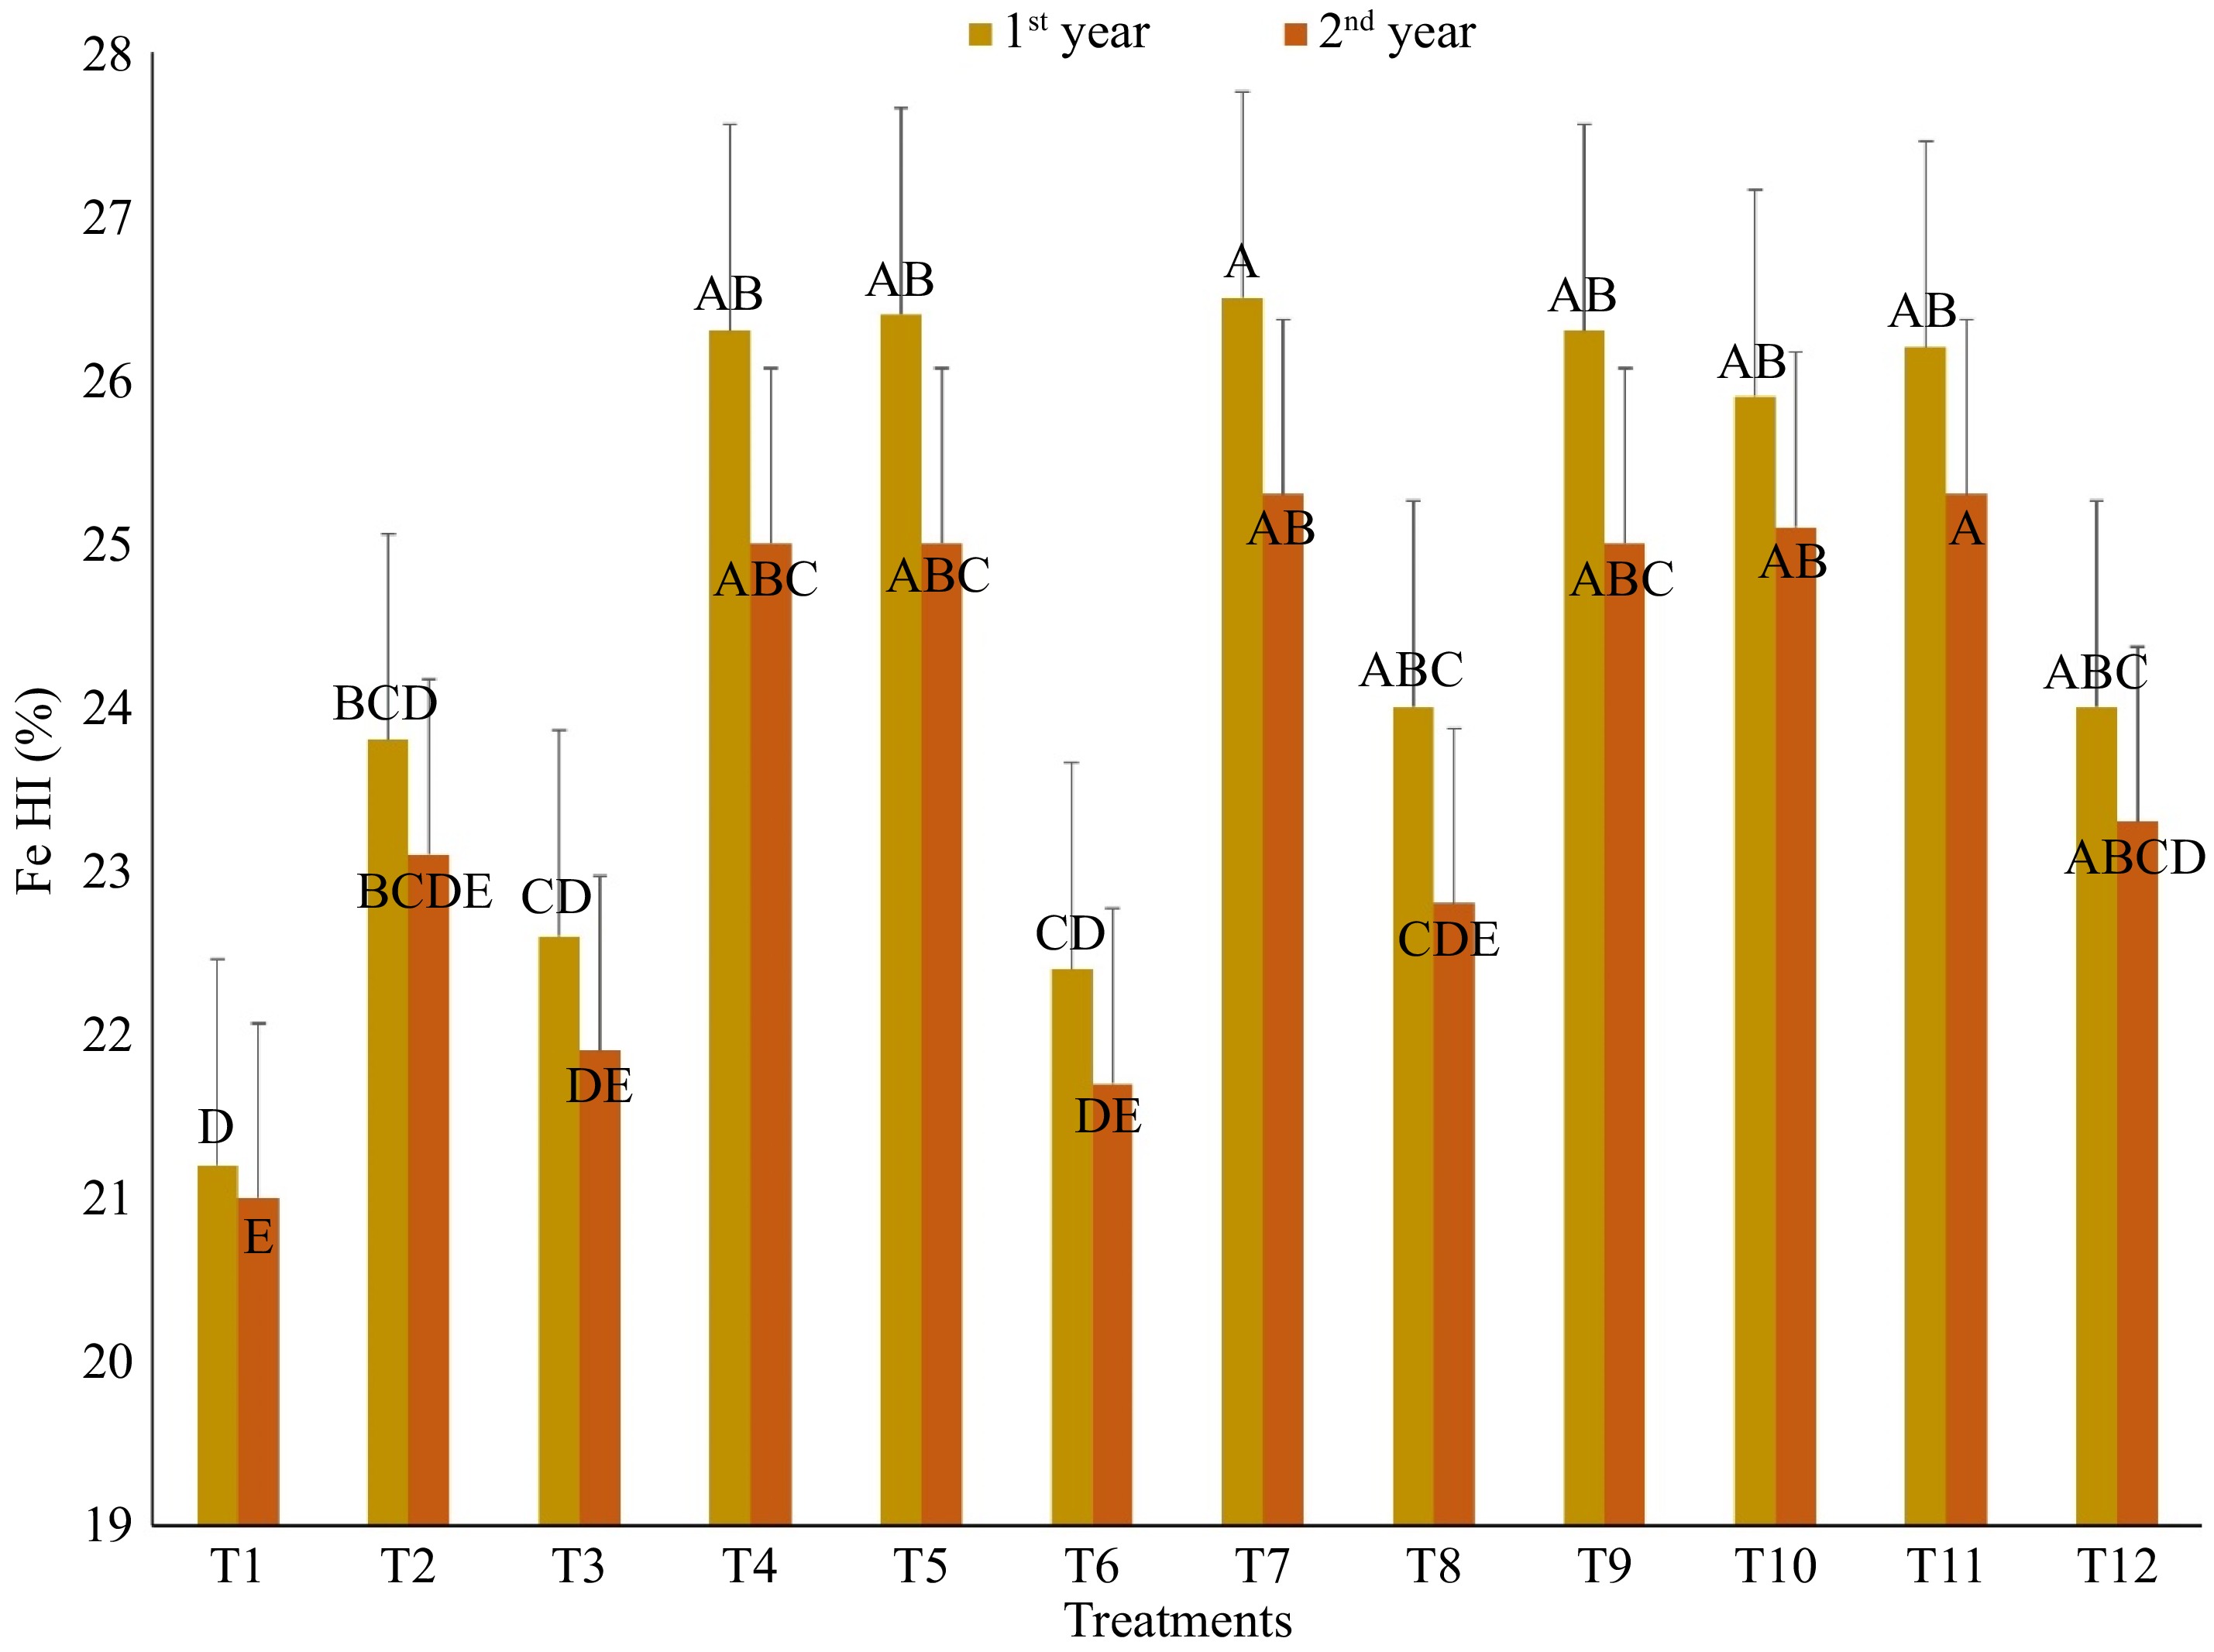
Figure 3.
Effect of different rate, time, method and source of potassium fertilization on iron harvest index. T1 = No K (control), T2 = 49.8 kg K/ha at basal, T3 = 24.9 kg K/ha at basal, T4 = 24.9 kg K/ha at basal + 24.9 kg K/ha at spike initiation, T5 = 37.4 kg K/ha at basal + 12.5 kg K/ha at spike initiation, T6 = 2 foliar sprays (1st active tillering, 2nd SI) of 2.5% KNO3, T7 = 49.8 kg K/ha at basal + 2 foliar sprays of 2.5% KNO3, T8 = 24.9 kg K/ha at basal + 2 foliar sprays of 2.5% KNO3, T9 = 37.4 kg K/ha at basal + 2 foliar sprays of 2.5% KNO3, T10 = 24.9 kg K/ha at basal + 24.9 kg K/ha at spike initiation + 2 foliar sprays of 2.5% KNO3, T11 = 37.4 kg K/ha at basal + 12.5 kg K/ha at spike initiation + 2 foliar sprays of 2.5% KNO3, T12 = 74.7 kg K/ha at basal.
Copper concentration, uptake, and harvest index
-
The concentrations of Cu in both wheat grain and straw were significantly influenced by the rates, methods, and times of K application during both years of the study (Table 5). The Cu concentration in the grain and straw increased with increasing K application rate up to 49.8 kg/ha, but after that, the effect became nonsignificant. However, the split application of 49.8 kg K/ha did not have a significant effect on Cu uptake in either the grain or straw. On the other hand, the basal application of 24.9 kg K/ha followed by two foliar sprays of 2.5% K (1st spray at maximum tillering and 2nd spray at spike initiation stage) resulted in grain and straw Cu concentrations that were statistically equivalent to those achieved by two split applications of 49.8 kg K/ha. The straw Cu concentration of wheat was found to be almost twice that of the grain Cu concentration. Similar to the grain Cu concentration, the highest straw Cu concentration (18.1 mg/kg – 1st year, 18.3 mg/kg – 2nd year) was recorded in T11, and it remained statistically on par with the other treatments except for T1 and T6. Due to the relatively high Cu concentration and grain yield in the K-fertilized plot, the grain Cu uptake, straw Cu uptake, and total Cu uptake were greatest in the K-fertilized plot. The two split applications of 49.8 kg K/ha followed by two foliar sprays of 2.5% K (T10, T11) resulted in the highest Cu uptake which was on par with that of the other treatments except for T1, T3, and T6.
Table 5. Effect of different rates, time, methods and sources of K application on copper concentration and uptake by wheat.
Treatment Cu concentration in grain (mg/kg) Cu concentration in straw (mg/kg) Cu uptake by grain (g/ha) Cu uptake by straw (g/ha) Total Cu uptake (g/ha) 1st year 2nd year 1st year 2nd year 1st year 2nd year 1st year 2nd year 1st year 2nd year T1 7.26C 7.49C 14.37C 14.97D 31.1E 32.0D 81.7D 84.7D 113D 117C T2 8.65AB 8.92A 16.83AB 17.43AB 45.1BC 45.5AB 107.1AB 111.9AB 152AB 157A T3 8.13ABC 8.57AB 16.10ABC 16.68BC 38.8CD 40.3BC 99.1BC 101.5BC 138BC 142B T4 8.89A 9.00A 17.21AB 17.79AB 50.2AB 49.8A 110.3AB 113.6A 160A 164A T5 8.92A 9.13A 17.26AB 17.86AB 50.2AB 50.5A 110.4AB 113.8A 161A 164A T6 7.63BC 8.00BC 15.11BC 15.72CD 34.9DE 36.1CD 89.0CD 91.4CD 124CD 128BC T7 9.06A 9.19A 17.93A 18.13A 51.4AB 50.9A 115.3A 116.0A 167A 167A T8 8.73AB 9.04A 17.28A 17.43AB 45.5AB 46.3AB 108.3AB 112.4AB 154AB 159A T9 9.10A 9.10A 18.01A 18.21A 51.6AB 49.9A 116.4A 116.1A 168A 166A T10 8.96A 9.20A 17.94A 18.14A 50.8AB 51.0A 115.9A 117.0A 167A 168A T11 9.16A 9.13A 18.14A 18.34A 52.2A 50.8A 118.1A 117.7A 170A 169A T12 8.73AB 9.03A 17.29A 17.87AB 45.4BC 46.3AB 110.1AB 115.1A 156AB 161A SE(d) 0.55 0.40 1.04 0.63 3.24 2.95 7.60 5.53 10.49 7.44 LSD at 5% 1.14 0.84 2.15 1.30 6.73 6.11 15.75 11.46 21.75 15.43 Means followed by a superscripted similar letter within a column are not significantly different (at p < 0.05) according to LSD test. T1 = No K (control), T2 = 49.8 kg K/ha at basal, T3 = 24.9 kg K/ha at basal, T4 = 24.9 kg K/ha at basal + 24.9 kg K/ha at spike initiation, T5 = 37.4 kg K/ha at basal + 12.5 kg K/ha at spike initiation, T6 = 2 foliar sprays (1st active tillering, 2nd SI) of 2.5% KNO3, T7 = 49.8 kg K/ha at basal + 2 foliar sprays of 2.5% KNO3, T8 = 24.9 kg K/ha at basal + 2 foliar sprays of 2.5% KNO3, T9 = 37.4 kg K/ha at basal + 2 foliar sprays of 2.5% KNO3, T10 = 24.9 kg K/ha at basal + 24.9 kg K/ha at spike initiation + 2 foliar sprays of 2.5% KNO3, T11 = 37.4 kg K/ha at basal + 12.5 kg K/ha at spike initiation + 2 foliar sprays of 2.5% KNO3, T12 = 74.7 kg K/ha at basal. The Cu harvest index (Cu HI) of the wheat crop was found to be statistically significant only during the first year, ranging between 27.5% and 31.3% (Fig. 4). During the second year of the experiment, there was no significant difference in the Cu HI, which varied between 27.5% and 30.4%. This indicates that approximately 1/3 of the Cu absorbed by the wheat crop is remobilized to the grain. The two-split application of 49.8 kg K/ha (T4) and basal application of 37.4 kg K/ha followed by 2 foliar sprays (T9) increased the Cu HI by 5.7% and 3.7%, respectively, over T2 (48.9 kg K/ha at basal). Similarly, compared with T3 (24.9 kg K/ha at basal), T9 (37.4 kg K/ha at basal followed by 2 foliar sprays) increased the Cu HI by 9.2% and 6.0% during the first and second years of the experiment, respectively.
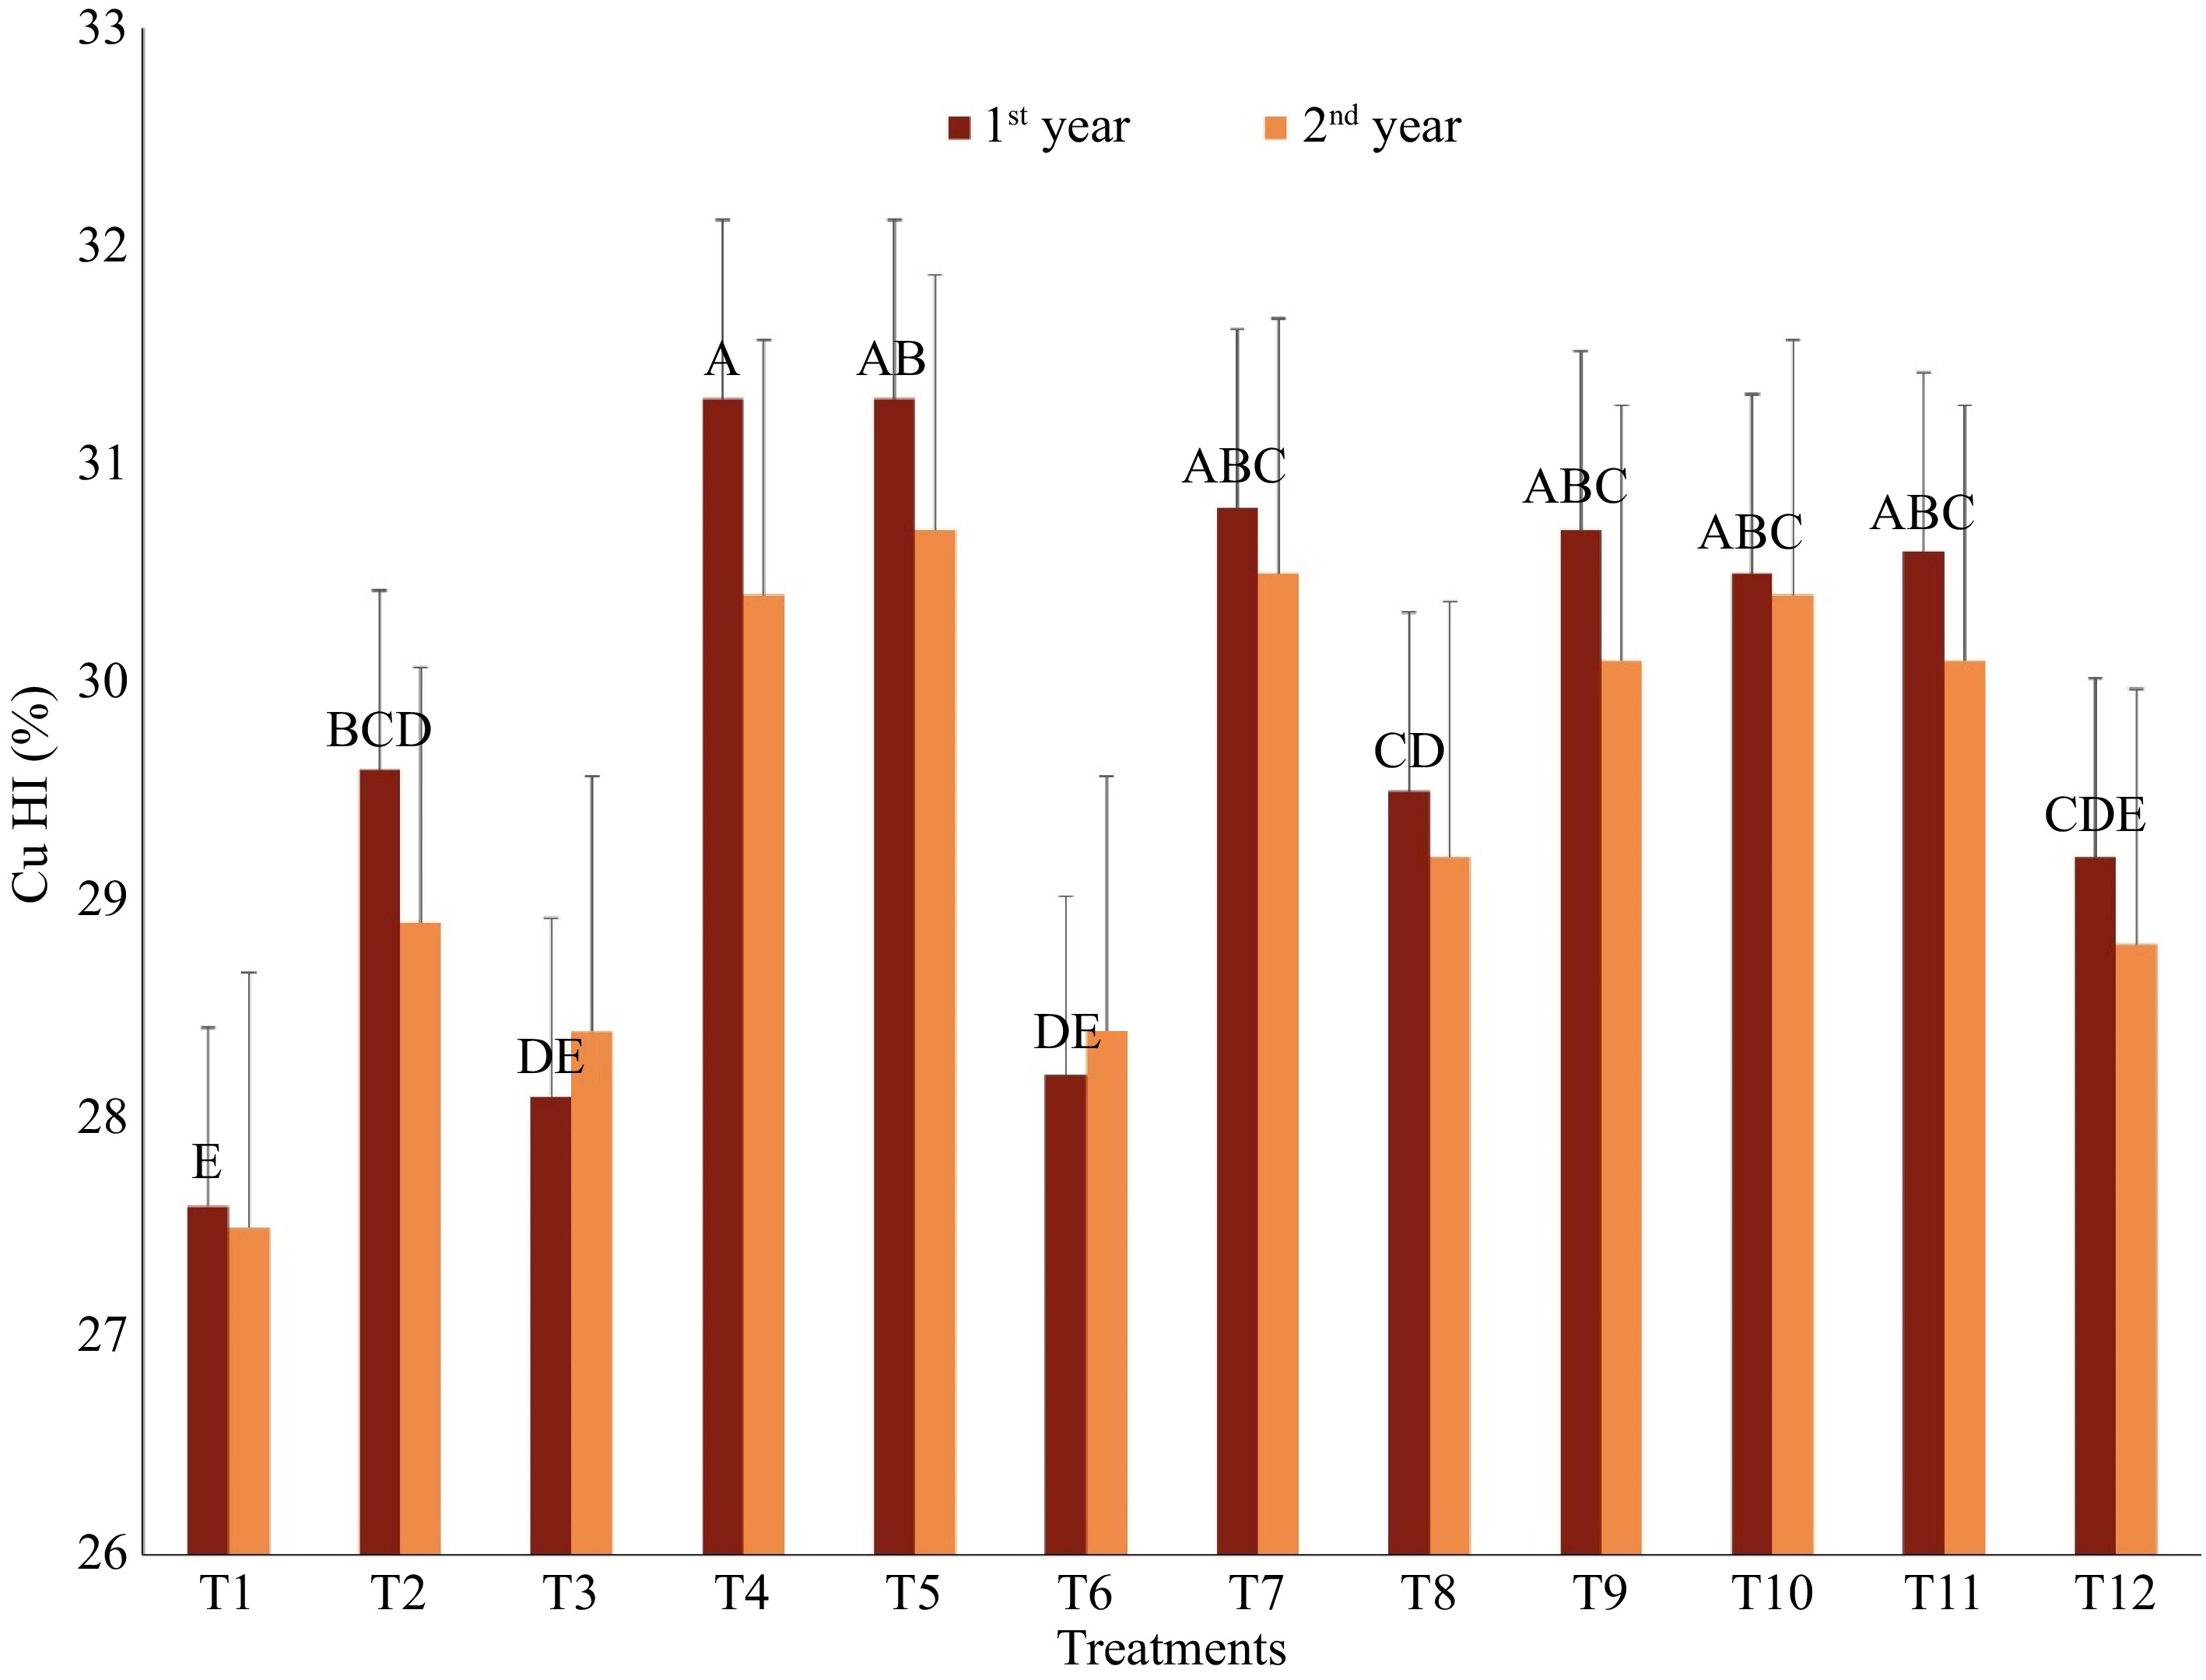
Figure 4.
Effect of different rate, time, method and source of potassium fertilization on copper harvest index. T1 = No K (control), T2 = 49.8 kg K/ha at basal, T3 = 24.9 kg K/ha at basal, T4 = 24.9 kg K/ha at basal + 24.9 kg K/ha at spike initiation, T5 = 37.4 kg K/ha at basal + 12.5 kg K/ha at spike initiation, T6 = 2 foliar sprays (1st active tillering, 2nd SI) of 2.5% KNO3, T7 = 49.8 kg K/ha at basal + 2 foliar sprays of 2.5% KNO3, T8 = 24.9 kg K/ha at basal + 2 foliar sprays of 2.5% KNO3, T9 = 37.4 kg K/ha at basal + 2 foliar sprays of 2.5% KNO3, T10 = 24.9 kg K/ha at basal + 24.9 kg K/ha at spike initiation + 2 foliar sprays of 2.5% KNO3, T11 = 37.4 kg K/ha at basal + 12.5 kg K/ha at spike initiation + 2 foliar sprays of 2.5% KNO3, T12 = 74.7 kg K/ha at basal.
-
The results of this study demonstrate that the application of K fertilizer has a significant impact on the concentration and uptake of micronutrients such as Cu, Zn, and Fe in wheat grain and straw. The most effective treatment, resulting in the highest nutrient concentration and uptake of Cu, Zn, and Fe in grain and straw, was the two-split application of 49.8 kg K/ha (T4). Consistent with our study results, Ojha et al. recommended applying 48 kg K/ha to achieve maximum yield, economic return and reduced K mining. However, their study did not examine the effect of this application on micronutrient uptake[31]. The basal application of 74.7 kg K/ha (T12) was not found to be superior to treatments where 49.8 kg K/ha was applied in a split manner (T4). This may be due to greater K fixation in the soil and increased loss through leaching at higher rates of K application compared to the split application of 49.8 kg K/ha. In contrast to this result, Lu et al. recommended applying 100 kg K/ha for wheat crops in China. This higher K recommendation compared to India aims to maintain a positive K balance in the system[32]. In wheat, the demand for K is low during the seedling stage (germination to tillering), as its slow growth allows the supply of native soil K to meet the meager demand during this stage. However, the native soil K supply falls short from the tillering to spike initiation stage, especially when external K fertilizer is absent. During this period, wheat crops exhibit a greater demand for K, and an inadequate supply can result in irreversible yield loss.
The control plot (no K applied) in our trial had the lowest plant height, dry matter production, and concentrations of Cu, Zn, and Fe in the grain and straw, indicating the potential for inadequate K supply (for grain and straw yield data, refer to Vijayakumar et al.)[28]. In contrast, treatments T4 and T10, in which 50% of K was applied during the peak demand period (spike initiation stage), exhibited better plant growth and yield attributes and enhanced nutrient uptake in grain and straw. Therefore, ensuring an adequate supply of K during the tillering stage leads to the production of a significantly greater number of tillers per hill, better plant growth, and nutrient uptake. During the spike initiation stage, an external K supply (25 kg K/ha) contributes to better spike expression and increased translocation of photosynthates and nutrients to the grain. Hence, providing sufficient K to wheat crops in the IGP is crucial for obtaining higher yields and nutritional quality. Farmers in the IGP often skip K fertilization due to a lack of knowledge about its benefits, and even when they use it, they tend to apply lower amounts than the recommended rate. It is increasingly recognized that declining soil K levels and lower supplies are major reasons for the stagnation of wheat yield in the IGP region.
Time of K application
-
The study results indicate that the split application of K is more effective than applying the recommended dose of K (49.8 kg K/ha) as a basal application. Applying K during the active tillering and spike initiation stages of the wheat crop, either through foliar spray or soil application, enhances the uptake of micronutrients such as Fe, Zn, and Cu and increases grain yield. This approach synchronizes the K demand of the crop with external application, leading to better plant growth, improved yield attributes, and enhanced nutrient uptake in both grain and straw. Providing sufficient K during the later stages of crop growth is essential, as the demand for K increases with crop age, reaching its maximum during the ear head initiation stage followed by the active tillering stage. An adequate K supply during these later stages promotes micronutrient uptake and overall plant growth. Similar to the present study results, Brar & Imas found that applying K in 2 to 3 splits increased N use efficiency by 26% compared to a single basal application. However, their study did not quantify the impact of split application of K on micronutrient uptake[33].
Supplying K during the active tillering stage increases the production of productive tillers, while K application during the ear head initiation stage enhances yield attributes. In situations where K fertilizers are not available or are too expensive during the tillering or ear head initiation stage of the wheat crop, farmers can opt for two foliar sprays of K (2.5%) in addition to a basal application of 25 kg K/ha. This approach provides benefits equivalent to applying 49.8 kg K/ha in two splits. Educating farmers in the IGP region about the benefits of split K application to wheat is crucial for realizing the maximum benefit of fertilizer use. Organizing farmers' field days, front-line demonstrations, and other training programs through various government organizations can facilitate the rapid transfer of technology to farmers. The government should also take necessary actions to ensure the sufficient availability of K fertilizers during the critical period of crop growth.
Method of K-appellation
-
Soil application of K is generally preferred over foliar application due to its cost-effectiveness. Almost all studies on wheat and K fertilizer have focused exclusively on soil application methods[31−33]. Given that K is a macronutrient needed in large quantities for wheat, soil application is generally recommended over foliar application. Foliar application entails additional labor and the use of spraying equipment, contributing to increased fertilization costs. Moreover, preparing a 2.5% K solution for foliar spray requires knowledge and expertise to ensure that the correct K concentration is applied. Excessive concentrations of K through foliar sprays can potentially cause a scorching effect on crop plants, leading to yield loss. While foliar spray helps avoid K fixation in the soil, it is important to note that two foliar applications of 2.5% K might not be sufficient to meet the crop's K demand. Therefore, foliar sprays should be used as a supplementary method in addition to basal application. Applying a high rate of K (75 kg K/ha) to the soil may decrease its efficiency due to K fixation and leaching. Hence, utilizing the appropriate amount of K fertilizer at the appropriate time enhances its effectiveness while minimizing its negative impact on the environment.
Zinc concentration, uptake, and harvest index
-
Zn is highly mobile within the plant system[34]. It is evident from the present results that more than 50% of the Zn absorbed by the wheat crop is transported to the grain. A better supply of K in T4 and T10 enhanced Zn translocation to the grain, possibly due to the synergistic interaction of K with Fe[35,36]. The combined use of split and foliar applications of K did not lead to any further remobilization of Zn to the grain, although the split application of K alone increased the remobilization of Zn to the grain. This suggests that K supplementation through either foliar spray or soil application during the spike initiation stage is sufficient rather than a combined application. The correlation between the grain K concentration and grain Zn concentration were found to be positive, with r values of 0.55*** and 0.63**** during the first and second years of the experiment, respectively (Figs 5 & 6). The increase in grain Zn concentration induced by K is attributed to K-driven higher post anthesis Zn uptake and the remobilization of preanthesis straw Zn to grains[37]. This might be due to the application of KCl, which could have decreased the soil pH through an acid-forming effect near the root vicinity, thereby increasing the solubility and uptake of Zn. By releasing more Zn from soil exchangeable sites, K increases Zn availability, leading to increased Zn uptake and reduced Zn deficiency[38,39].
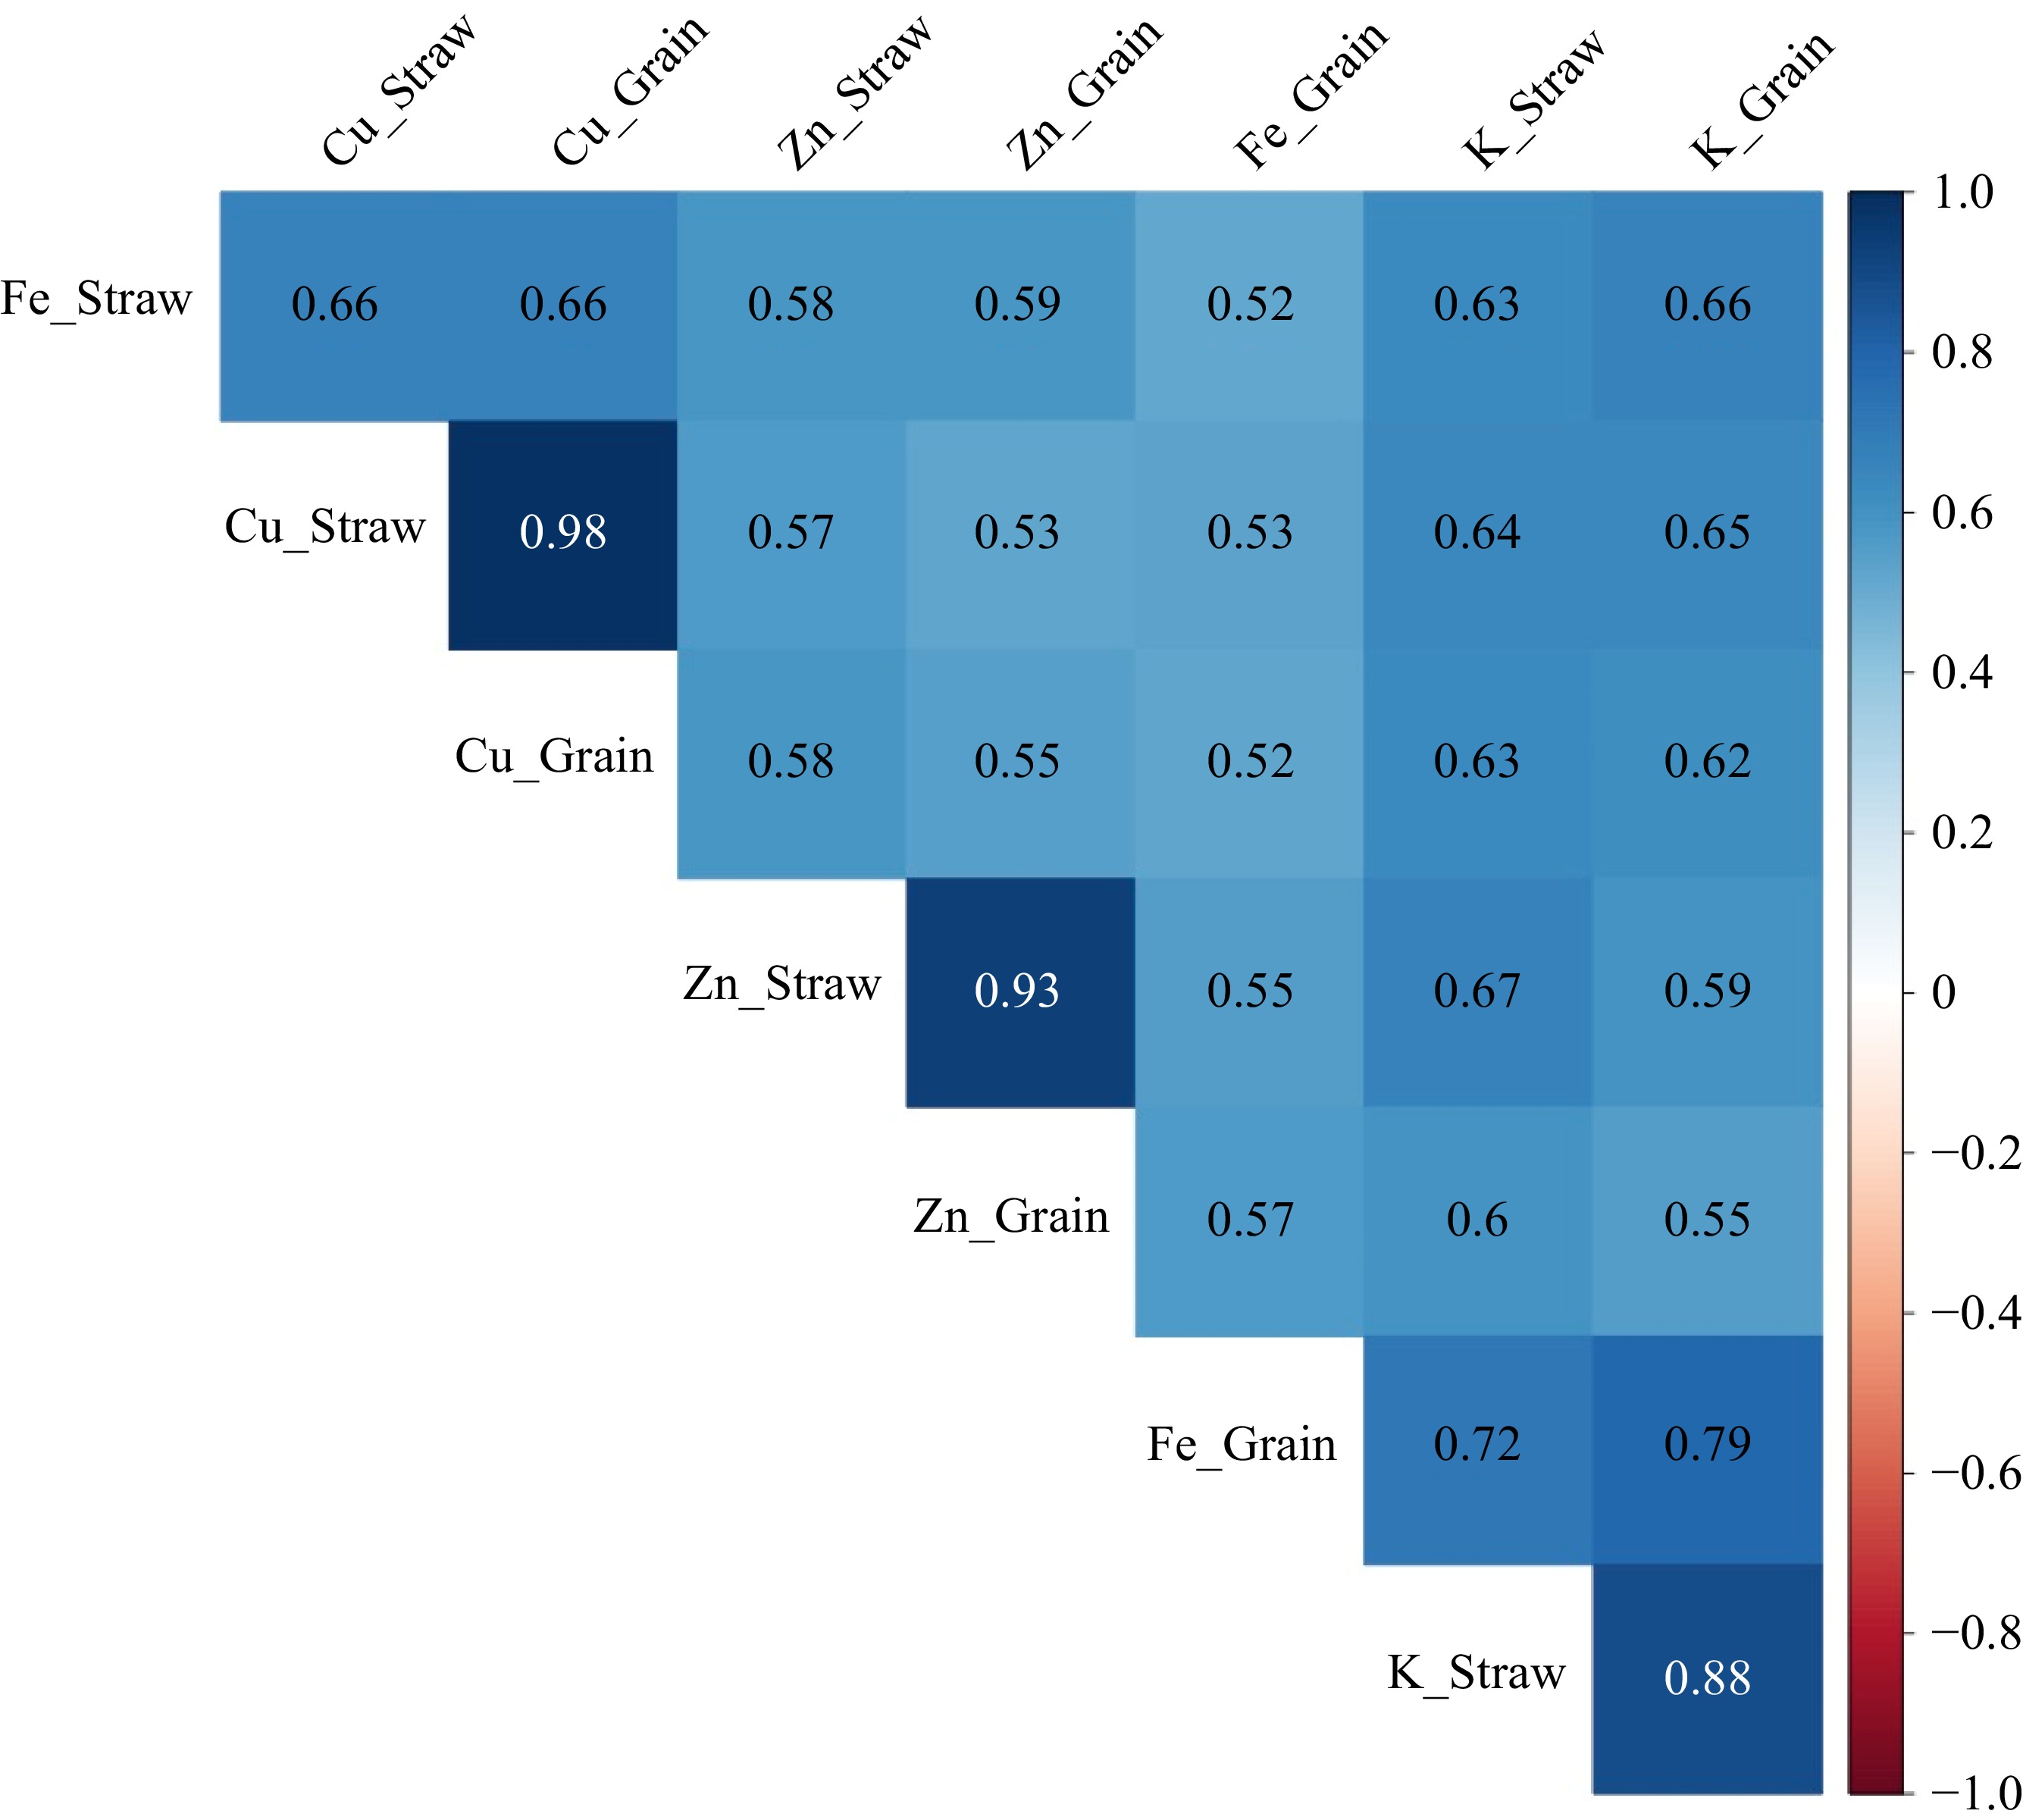
Figure 5.
Correlation between the nutrients in grain and straw (first year of the experiment).
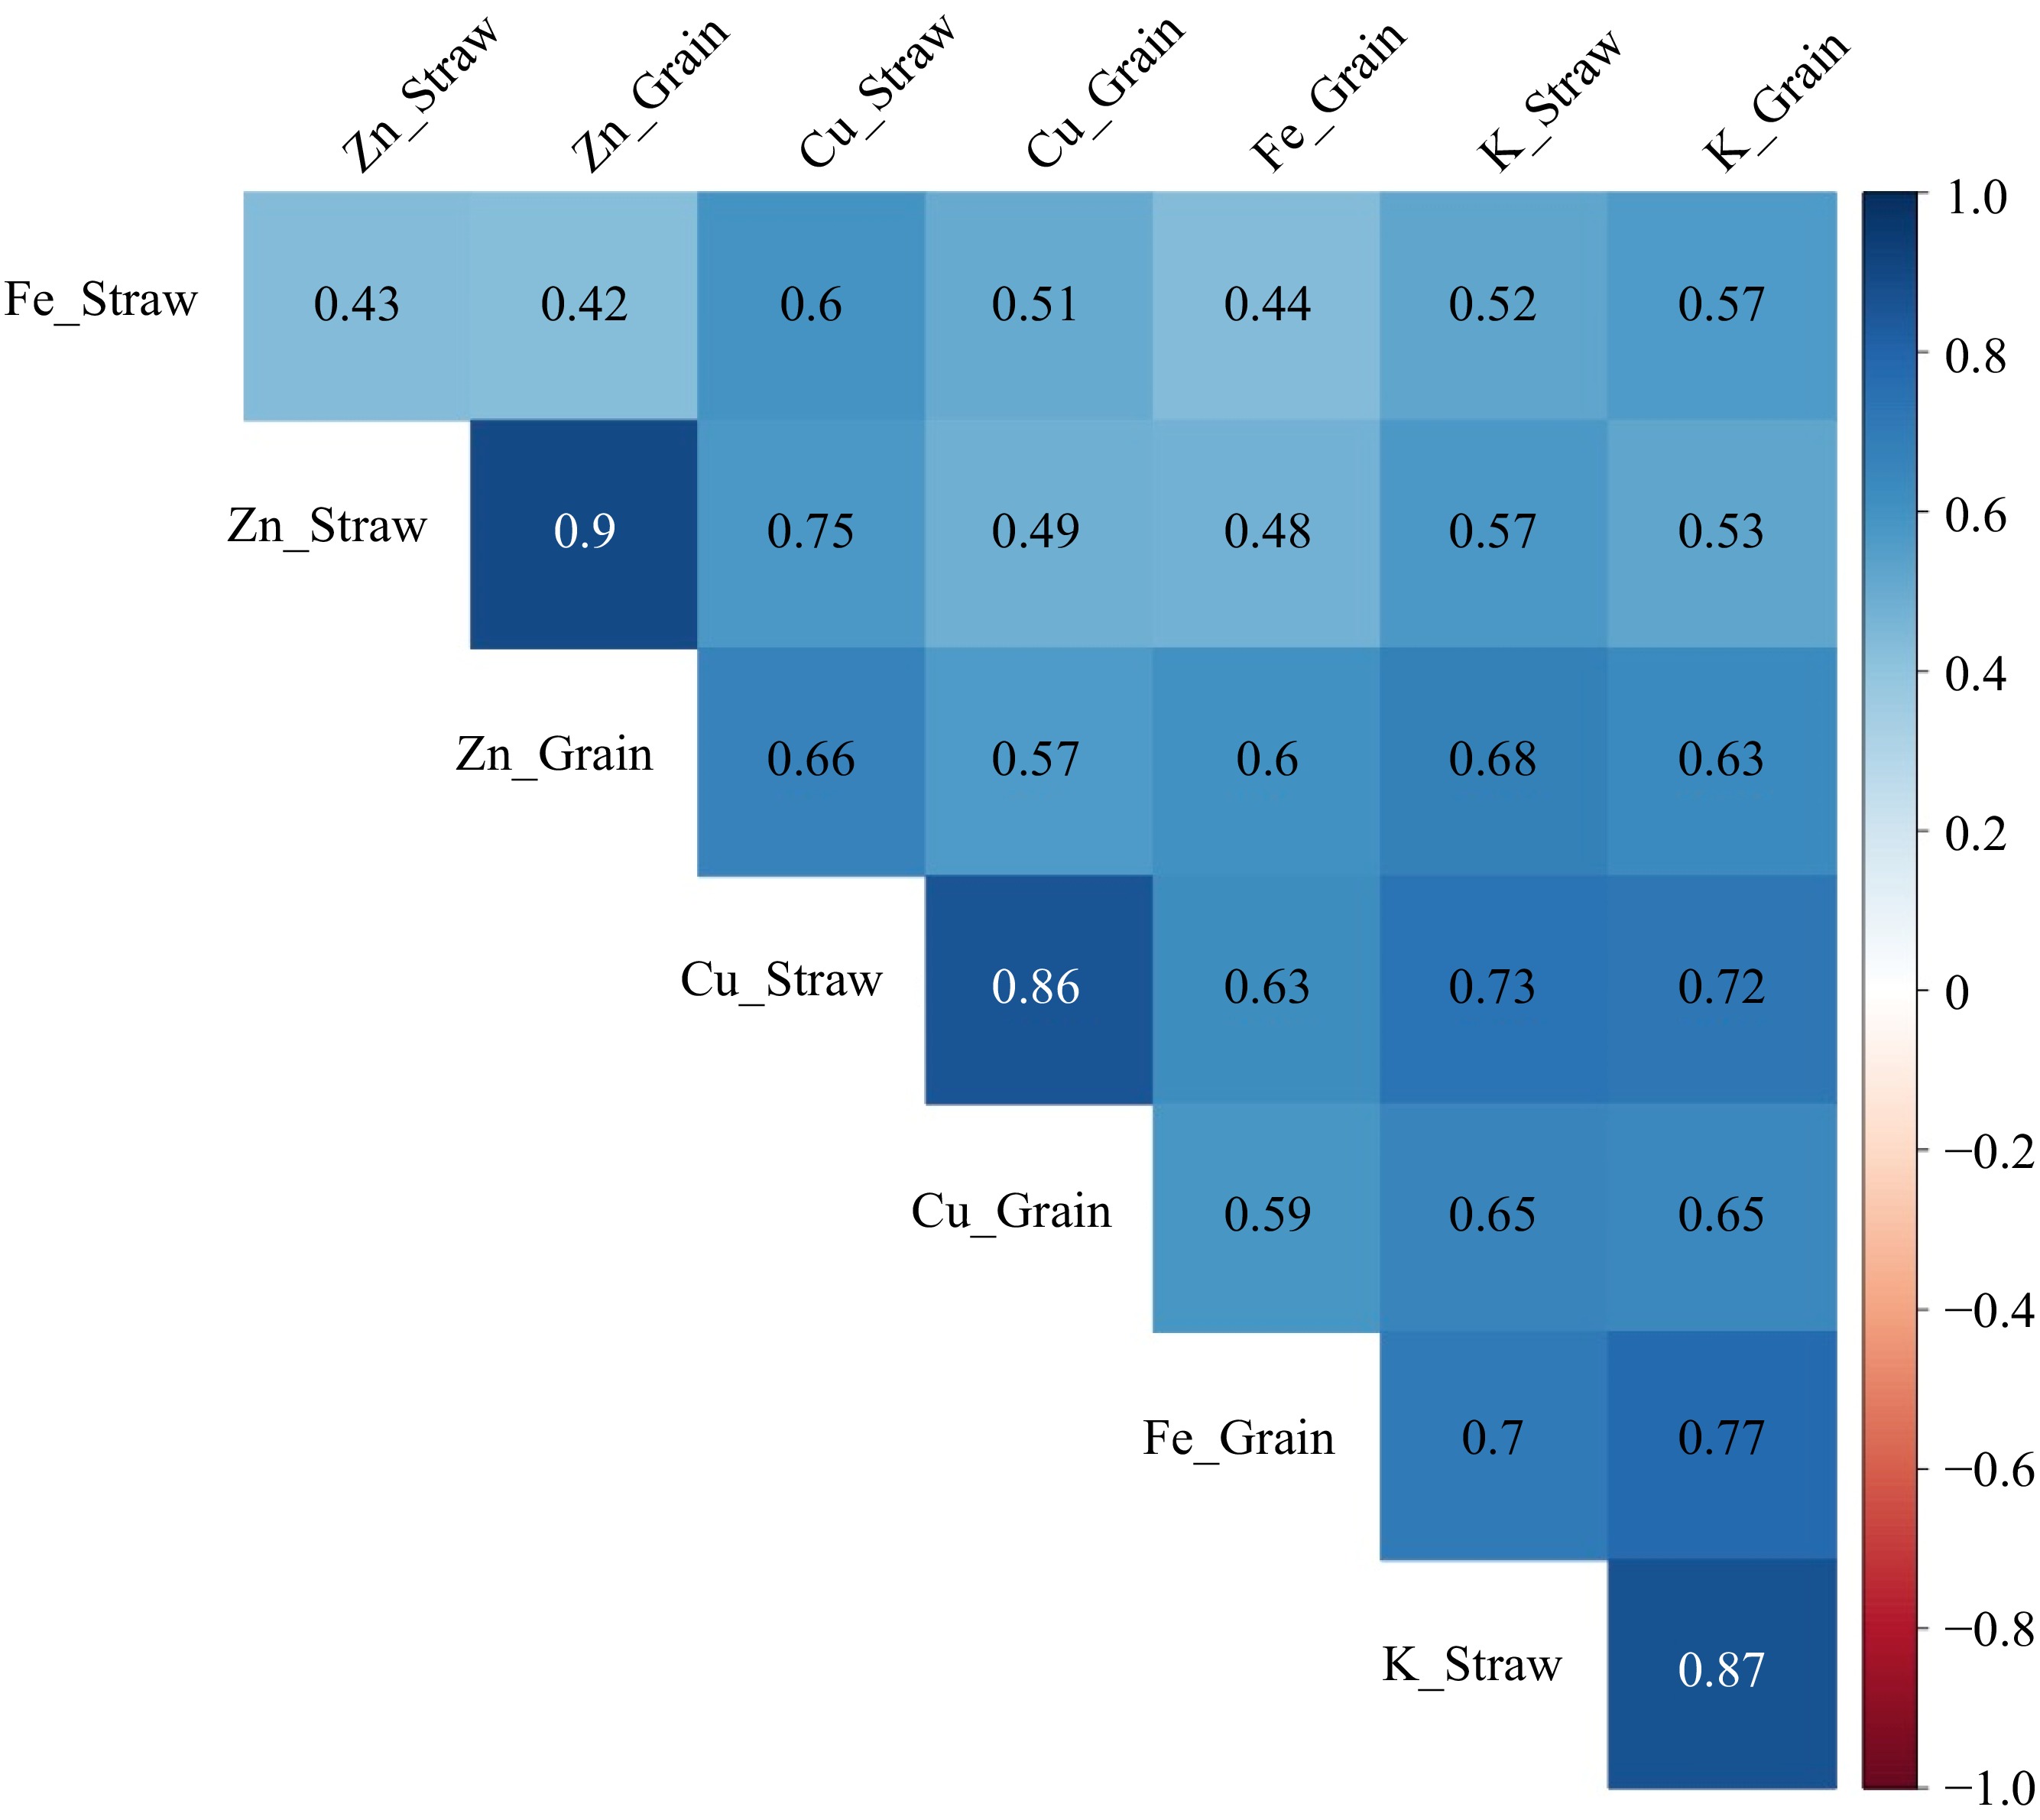
Figure 6.
Correlation between the nutrients in grain and straw (second year of the experiment).
The sufficient supply of K throughout the crop period in T4 and T10 might have increased the secretion of phytosiderophores (nicotinamine, mugenic acid, avenic acid, etc.) in the rhizosphere. Zn phyto-siderophores (ZnPS) have a better capacity to complex Zn and increase its mobility in the rhizosphere and root apoplast[40,41]. Additionally, the improved root growth in T4 and T10 might have led to greater Zn uptake from the soil, allowing for the foraging of Zn from a larger soil volume compared to that in the control. An insufficient potassium supply can result in shorter roots, fewer root hairs, and a reduced number of roots[42]. K fertilizer promotes mycorrhizal associations by promoting the formation of fungal spores, which could be another reason for improved Zn uptake[43,44].
Iron concentration, uptake, and harvest index
-
Despite being the fourth most abundant element in the Earth's crust, iron is often a limiting nutrient for plants because it forms insoluble compounds in aerobic soils with neutral to basic pH[45]. Fe deficiency is a major yield-limiting factor, particularly in calcareous soils[46]. Interestingly, foliar spraying or top-dressing of K during the crop ear head initiation stage increased the Fe concentration in the grain. The increased Fe uptake in the K-fertilized plot might be due to the acidification effect of KCl, as the availability of Fe is greater at pH 6.5 and below. The results indicate that only 1/4 of the Fe taken up by the wheat crop is transported to the grain. Awad-Allah & Elsokkary reported that K has the potential to stimulate Fe uptake by plants and facilitate Fe biofortification in crops[47]. An adequate supply of K can alleviate Fe deficiency-induced chlorosis in plants[48], while excessive K can cause competition with iron[49].
K supplementation increased phenolic compound secretion and pectin methylation levels while decreasing pectin and hemicellulose contents, enabling Fe reutilization from root cell walls[48]. Additionally, optimum K fertilization in T4 and T10 might have increased the secretion of Phyto siderophores in the rhizosphere, where they bind tightly to ferric iron and are transported into root cells by PS-Fe(III) transporters[20]. Furthermore, K supplementation improved Fe reutilization from vacuoles by increasing AtNRAMP3 expression. Moreover, K supplementation increased the expression of numerous genes involved in long-distance Fe transport, including AtFRD3, AtYSL2, and AtNAS1, implying that an adequate K supply can promote Fe transport from roots to leaves[48]. A positive correlation between the grain K concentration and grain Fe concentration was found, with r values of 0.79**** and 0.77**** during the first and second years of the experiment, respectively (Figs 5 & 6).
Copper concentration, uptake, and harvest index
-
K influences the uptake of Cu and its translocation inside plants. The Cu remobilization to grain from straw significantly increased with a split application of K. However, only 30% of the total Cu taken up by the wheat crop was translocated to grain, and the majority (70%) was stored in the straw. The two split applications of 49.8 kg K/ha significantly increased (5.7%) the Cu remobilization to the grain compared to the basal application of 49.8 kg K/ha. However, the two split applications of 49.8 kg K/ha followed by two foliar sprays of 2.5% K had a nonsignificant effect on Cu HI in comparison to the two split applications of 49.8 kg K/ha. The correlation between the grain K concentration and grain Cu concentration was positive, with r values of 0.62**** and 0.65**** during the first and second years of the experiment, respectively (Figs 5 & 6). The interaction of K with Cu is less conspicuous in science fiction. In general, the interaction of K with Cu is positive in cereal crops. Cu uptake pathways in crops have not been fully explored; however, there appears to be considerable overlap between the Fe uptake and Cu uptake pathways[50].
Year wise comparison
-
A comparison of the two years revealed that there was a consistent trend in the Cu, Zn, and Fe harvest indices, albeit with a slight variation in nutrient concentration between the years. Specifically, the Fe and Cu harvest indices were greater in the first year than in the second year, whereas the opposite trend was observed for the Zn harvest index. However, the difference was not statistically significant. Differences in nutrient concentrations between years can likely be attributed to various factors, such as environmental conditions, crop management practices, and other factors that influence nutrient uptake.
-
In conclusion, the results of this study affirm that optimizing the K supply, aligned with the principles of 4R stewardship, is an effective strategy for enhancing the concentrations of Fe (18.3%), Zn (10.1%), and Cu (21.3%) in wheat grain in comparison to those in the control. The net remobilization of Zn, Fe, and Cu from straw to grain increased by 2.3%, 2%, and 1.3%, respectively, under the two split applications of 48 kg K/ha over a single application of the entire K at the base. The source of potassium (K) fertilizer had no significant impact on micronutrient uptake, but the method of application did. Farmers can use both MOP and KNO3 as K fertilizers. Foliar spraying of K has shown benefits and can be recommended as a supplementary approach to correct K deficiency. However, it should not replace soil application, as the quantity of K required by wheat is substantial. Meeting all K needs through foliar application would necessitate multiple applications, which is not economically feasible. Therefore, foliar K spray is highly recommended under two specific conditions: a) when the crop is experiencing acute K deficiency and requires immediate recovery and b) when K fertilizers for basal and top dressings are unavailable on the market.
The utilization of 4R stewardship represents a novel approach that has the potential to contribute to the development of staple crops with high micronutrient contents. The large-scale adoption of this approach by farmers in the IGP region could improve wheat grain quality, indirectly supporting agronomic biofortification. The consumption of wheat grains enriched with Fe, Zn, and Cu can prevent micronutrient deficiencies, particularly in children and pregnant women, given that wheat is a staple food crop in India. This enrichment also helps alleviate existing deficiencies, enhancing overall resistance to illness. It represents a sustainable and cost-effective strategy for improving grain quality and addressing malnutrition, as it only requires the application of potassium fertilizer, incurring no additional costs. Thus, this approach offers a win-win solution. However, further research is needed to understand the physiological and biochemical mechanisms underlying the increased uptake and translocation of Fe, Cu, and Zn within plants. Furthermore, these findings must be evaluated across other crops and agroecological conditions.
-
The authors confirm contribution to the paper as follows: conceptualization, review & editing, supervision: Kumar D, Shivay YS, Sharma DK; investigation, data collection, formal analysis, writing – original draft: Vijayakumar S, Varatharajan T. All authors reviewed the results and approved the final version of the manuscript.
-
The dataset generated during and/or analyzed during the current study are available from the corresponding author on reasonable request.
-
The authors duly acknowledge the Division of Agronomy, ICAR–Indian Agricultural Research Institute, New Delhi, India, for providing the facilities required for the field experiments and lab analysis. All the expenditures that occurred during the time of experimentation were met by the nonplanned research fund of the ICAR–Indian Agricultural Research Institute, New Delhi, India. We did not receive any grants or funding from any organization for this experiment.
-
The authors declare that they have no conflict of interest.
- Supplemental Table S1 Soil physical and chemical properties of the experimental site.
- Supplemental Table S2 Details of irrigation in wheat.
- Supplemental Table S3 Calendar of operation in wheat.
- Supplemental Fig. S1 The daily weather of the experimental plot during 2015-2016.
- Supplemental Fig. S2 The daily weather of the experimental plot during 2016-2017.
- Supplemental Fig. S3 The layout of the experimental plot.
- Copyright: © 2024 by the author(s). Published by Maximum Academic Press, Fayetteville, GA. This article is an open access article distributed under Creative Commons Attribution License (CC BY 4.0), visit https://creativecommons.org/licenses/by/4.0/.
-
About this article
Cite this article
Vijayakumar S, Kumar D, Shivay YS, Sharma DK, Varatharajan T. 2024. 4R stewardship-based potassium application to enhance iron, zinc, and copper nutrient levels in wheat (Triticum aestivum L.). Technology in Agronomy 4: e024 doi: 10.48130/tia-0024-0021 

4R stewardship-based potassium application to enhance iron, zinc, and copper nutrient levels in wheat (Triticum aestivum L.)
- Received: 28 May 2024
- Revised: 24 June 2024
- Accepted: 28 June 2024
- Published online: 02 September 2024
Abstract: Micronutrient deficiencies like iron (Fe), zinc (Zn), and copper (Cu) are widespread in humans. Unfortunately, these micronutrients are also deficient in major parts of Indian soil. As wheat is a staple food for more than 50% of India's population, enriching wheat grain with these micronutrients can help alleviate these deficiencies in humans. Therefore, two-year field experiments were conducted at the ICAR–Indian Agricultural Research Institute, New Delhi, to evaluate the impact of 4R stewardship-based potassium (K) fertilization on wheat uptake and translocation of Zn, Fe, and Cu. The results revealed that the K application rate, method, and timing significantly influenced Zn, Fe, and Cu uptake and translocation. In contrast, the source of K fertilizer had a nonsignificant effect. The concentrations of Fe, Cu, and Zn in the grain improved with increasing K application rates up to 48 kg K/ha, after which a nonsignificant effect was detected. Two split applications of 48 kg K/ha resulted in higher grain nutrient concentrations (Zn: 38.2 mg/kg, Fe: 110 mg/kg, Cu: 9.0 mg/kg) than did basal application (Zn: 37.6 mg/kg, Fe: 105 mg/kg, Cu: 8.8 mg/kg). The Zn (52.3%−57.4%), Fe (21%−26.5%), and Cu (27.5%−31.3%) harvest indices under two split applications of 48 kg K/ha revealed that more than 50%, 25%, and 33%, respectively, of the absorbed Zn, Fe, and Cu was remobilized to the grain. However, the basal application of 48 kg K/ha and no K application significantly reduced the translocation of Zn, Fe, and Cu to the grain.
-
Key words:
- Copper /
- Iron /
- Micronutrients /
- Nutrient interaction /
- Potassium /
- Wheat /
- Zinc