

-
The invention of machines such as calculators and computers helped scientists to determine the relationships among the different system components. With the very first revolutionary studies by Brouwer & De Wit and de Wit et al.[1,2], crop modeling has been in existence as a research activity, for almost 50 years. However, in the last two decades, its application in the agricultural system has been appreciable[3−8]. According to a previous study[3], with the invention of the mainframe computers during the 1960s crop simulation modeling progressed to a puerile stage in the 1970s, reached an adolescent stage in the 1980s, and gained development stage in the 1990s. Descriptive and mathematical modeling grew during the late 1950s. Around one decade later, in 1960, concepts of systems dynamics began which enabled the time-related demonstrations of flow processes and their interactions with different system components[3].
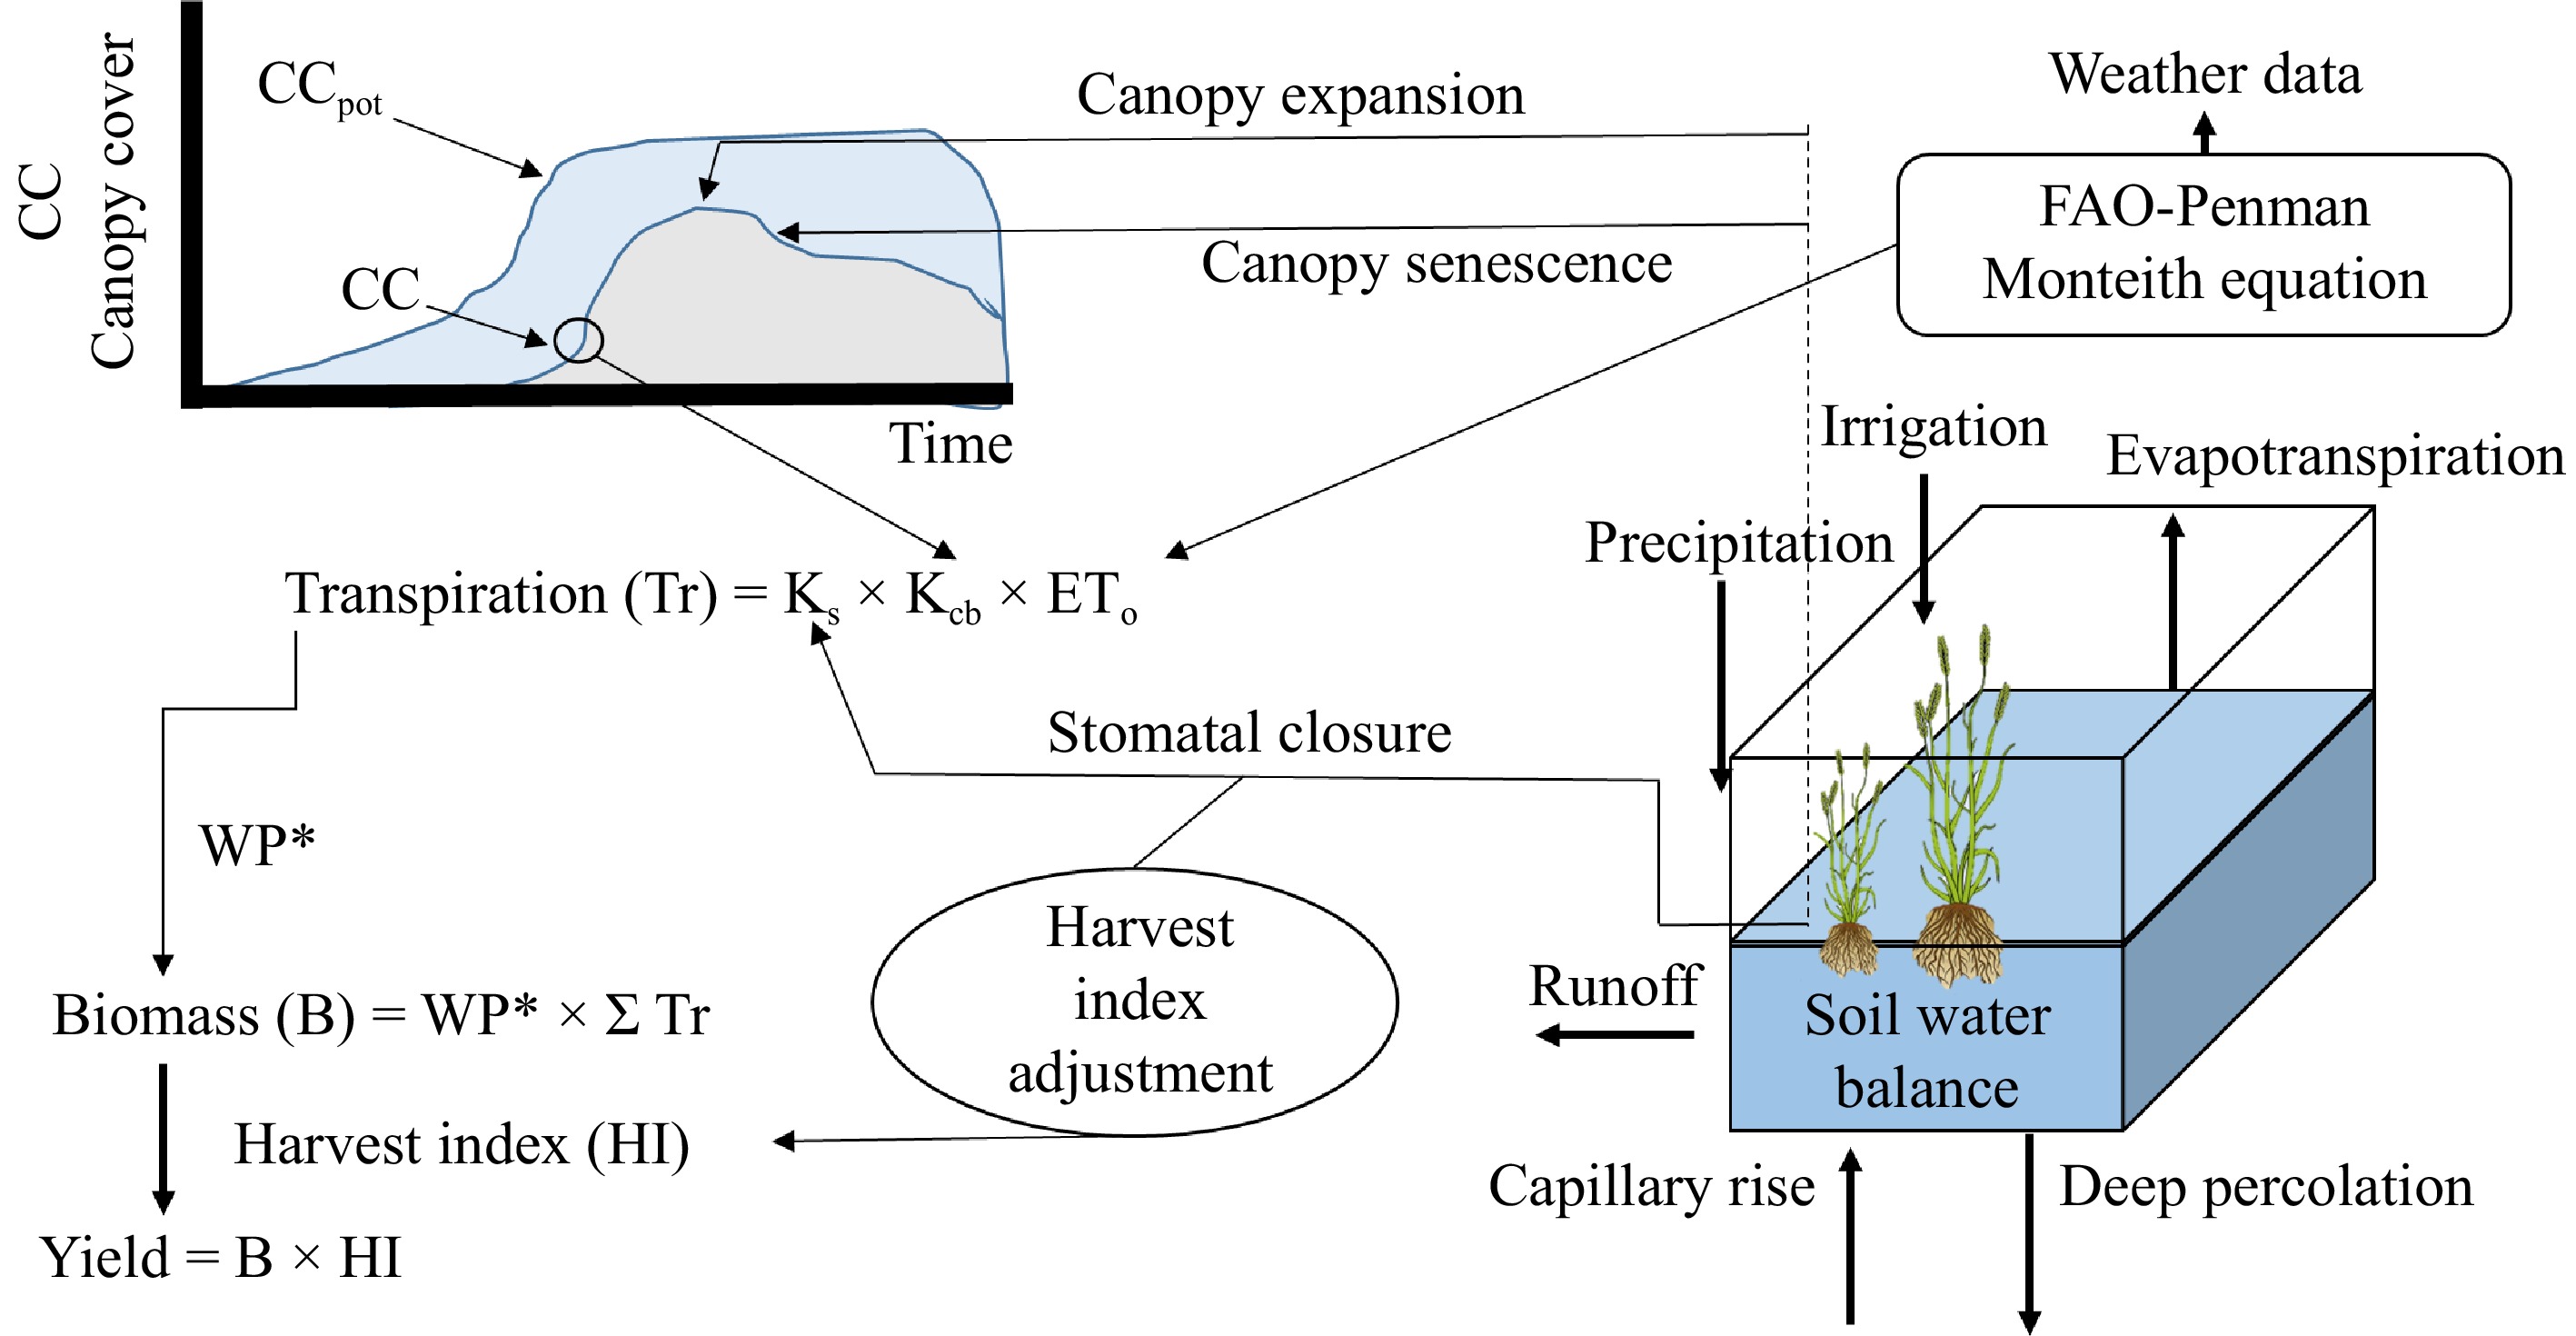
In the infancy and juvenile stages, many expectations grew around the crop model that it would answer the queries of crop science in many areas that would help further develop a comprehensive model. During 1970, concepts of system dynamics became formalized, and their improvement continued through 1980 by computer programming techniques, model calibration, verification, and validation[5]. In the 1980s, initial efforts were focused on finding a complete characterization of crop behavior in an extensive range of environmental situations[6]. However, during the 1990s, the attention was geared in the direction of applications of modeling in agronomic practices and policy decision-making[6]. During the 1990s, crop models established their use on farm and regional scales. Simultaneously and more importantly, in 1990, the world saw the rise of the era of information technology[7]. Agriculture and industry are an integral part of agricultural science, thus improved knowledge of ecosystem interaction, which is influenced by environmental and management systems, has significantly extended the perspective for a decision support system. Linking the cavity between simulations (which mimic agricultural processes) and the application of the simulation outputs in decision support by crop managers is challenging and thought-provoking[7]. The flow of information to managers encompasses interfacing between computer output and the people who are the information users (Fig. 1a). During the early period of the 21st century, the functions of crop growth models were improved, and the progress strategy shifted to applications of models in policy support[9].
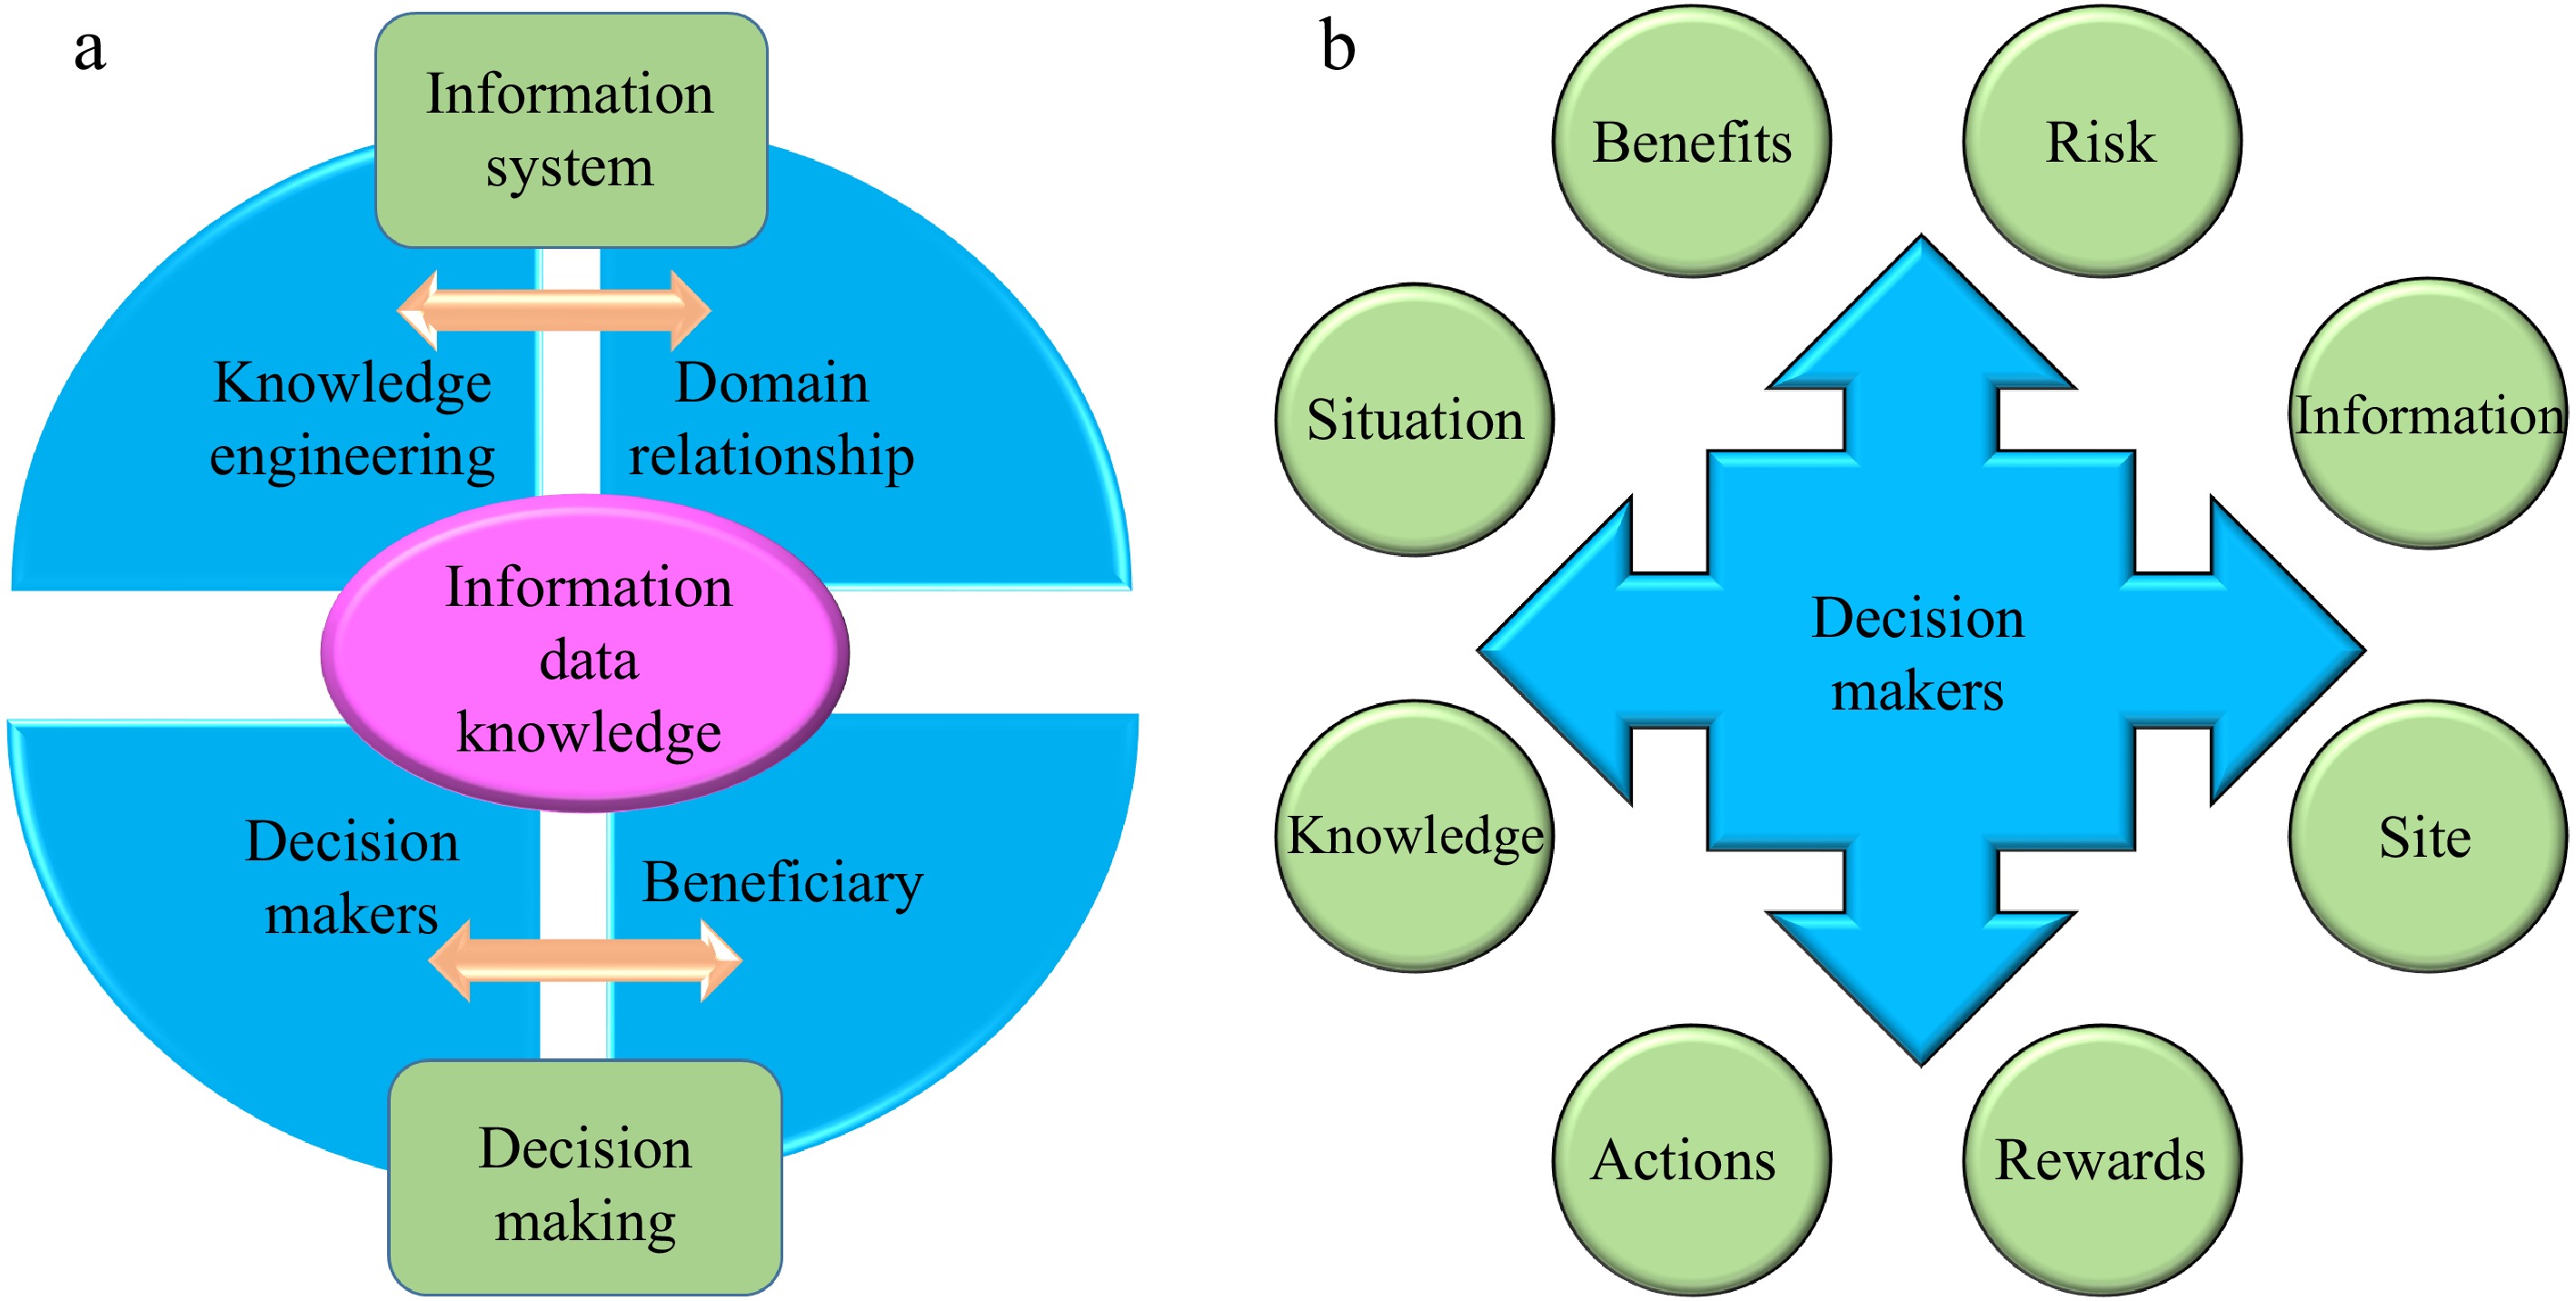
Figure 1.
(a) Information system and decision-making interconnection, and (b) decision makers - where decisions are made (adapted from Barrett & Jones[14]).
Modeling is a valuable tool for conceptualizing and comprehending systems, projecting future scenarios, and testing hypotheses regarding the effects of disruption on a system's overall behavior concerning changes to its constituent parts. In general, models may be classified in two ways: (1) by their method, or how the internal process operates; and (2) by their thematic application or the thematic topic they are being utilized for[10,11]. For modeling processes to be effective, the choice of methodologies concerning the theme topics is essential. There are many distinct modeling techniques, and they are not all equally effective for system conceptualization, analysis, prediction, and/or prospection. Each technique has a different level of complexity, calls for different data and requires various application skill levels. The crop simulation models, initially developed as research tools, had their utmost practicality and utility in the scientific research program. The benefits of assimilating crop simulation modeling into a scientific research program were summarized[12] as (1) to identify the gaps in knowledge; (2) to create and test hypotheses, to support the design of experiments; (3) to identify the most critical variables through sensitivity analysis; (4) to facilitate improved communication among inter-disciplinary researchers; and (5) bringing different people like investigators, academics, experimenters, and manufacturers together to unravel common problems.
Efforts have been made from the beginning, to promote the use of crop models as a research tool in decision-making processes[10]. DSSs have advanced through the centuries from fundamental single-decision rules to multi-criteria standardization software. In its simple type, a DSS can be developed for a pest management threshold, designed using empirical relationships and ground data on a calculator. More sophistically, DSS can be on a communicating computer system that makes use of databases, simulation models, and decision-based algorithms in an integrated manner[13]. Characteristically, a DSS must have a measurable output and should give importance to the final users for problem-solving and decision-making.
While crop modeling is an emerging area of agricultural systems, it requires a thorough understanding of the fundamental simulation process and multidisciplinary research data and a methodical pipeline to develop it. However, a knowledge gap exists in developing an independent crop simulation model to understand complex BIG-DATA structure, interactions between variables, extricating agricultural systems, and how models operate and function. Hence, it is necessary to review the various agricultural simulation models and their utility, simulation process, datasets, predictability, advantages, and disadvantages, etc. This article reviews the current state-of-art agricultural systems models and their implications on crop management, crop growth forecasting, nutrient management, and yield prediction, unraveling complex interactions between agro-meteorology, soil, and crop, etc. for different crops at a local to global scale. Future difficulties for agricultural system models and the need for additional research are also covered. The review should improve the existing understanding of agricultural system modeling to help stakeholders with appropriate model selection and future model development.
-
Humans make all decisions, either directly or indirectly, through his/her mind. Decisions also envisaged as to whether to carry on doing things as they are being done or to modify the process for getting a gainful outcome. In reality, decisions are altered by the authority who controls the resources as inputs. Human memory is everything that observes and learns through experience like right or wrong and good or bad. All these are put in storage as information in the mind and knowledge is built up for making future decisions. When an individual faces a problem, the content stored in the memory are reviewed. Some attention arises almost immediately whereas some are more delayed. Generally, decisions are selections to stay on a course of action or to choose a different path[13]. Naturally, when an individual meets with new circumstances where the intuition is to take more effective measures, an effort will be made to investigate the condition. Consequently, a renewed aspect may be adapted to reconsider and lessen the risks for that existing condition. These complex processes, which go on in a human's mind, are programmed in the computer as it is mimicking the decision-making ability of a human. Here several problems are ordered in chorus and processing goes on every time (day or night, consciously or unintentionally, etc.) till the situations are fixed to the point where risk is lowered sufficiently, and safe action can be taken[13]. All these are necessary to understand how simulations could be a potentially excellent platform for decision support systems (Fig. 1b).
Computer programs comprising spreadsheets, expert systems, simulations, and relevant items can be an excellent foundation of information for DSS[14]. Recently, progress has been made in the field of computer programming e.g., through language development, machine learning, information storage, retrieval, deep learning, and other computer-related development, to uphold the acceptability and interest of simulation-based decision support for managing the system. Simulation is the art of mimicking the system and tracking the dynamic changes in the system over time. Strictly, models are mathematical equations with specific guidelines that define and delineate a system. Simulation comprises running the model equations or algorithm for calculating values over time in a dynamic manner[15]. All the real-world phenomena in an agricultural system can be, focused on system interaction to some accuracy. Thus, simulation models are resources that can be used to supply data, information, and knowledge to decision-makers in agriculture.
Biological systems are much more complex, where several components interact with each other simultaneously in a non-linear fashion. This nonlinearity should be taken into consideration for prediction to understand model performance. In most cases, the understanding of these interactions is inadequate and frequently directed by experimental confirmation of full system performance instead of empirical evidence on the mechanism that leads to the overall system performance[16,17]. Due to these inherent limitations, mathematical modeling is only advocated for nonliving physical and chemical processes[10]. On the other hand, the simulation model constructed on quantitative biological processes along with their interactions can afford a solid understanding of the behavior of biological systems and thus aid in managing the operations to attain specific targets. Through the last few decades, computer simulation has demonstrated itself to be a promising tool in basic and applied biological research[13]. In many primary and applied sciences, incredible progress has been made in simulation modeling to become an integral part of biological research.
-
A system is a well-defined part of the real world, which is an assembly of several components, and their interrelationships are integrated purposefully to understand some part of the real world. System components are selected based on the objective of the study. Thus in another way, systems can be defined as assemblies of mutually interacting items that are influenced by external forces[17,18]. For example, classical crop models describe the crop and its root zone inside the soil as components that cooperate in multifaceted ways and are also influenced by the ambient conditions (weather pattern) and management practices adopted for their growth.
Environment
-
The system environment consists of everything, excluding the system's components. Similarly, a system boundary is a concept of the restrictions of the system components, separating them from the environment. In a simulation model, the environment may influence or affect the system and its components in many ways, but the reverse is not valid, e.g., the influence of the environment by the system. Thus the environment does not have to be modeled where the system should be. It can be exemplified as in a crop simulation model, the crop is influenced or sometimes affected by the ambient air temperature, humidity, vapor pressure, and insolation but does not itself influence back these environmental conditions. The influence of the latter event happens only minutely and is thus considered negligible in many cases.
Models
-
A model, as described above, is a mathematical depiction of a system, and modeling is the procedure of building that representation[17]. Theoretically, the process of building a model of a system is unlike and a requirement for computer simulation.
Simulation
-
This consists of the sequential processes essential for mobilizing or resolving a model to simulate the real system behavior. The simulation process is computerized by developing logic and diagrams, computer coding, or writing the program and applying the written code on a computer to harvest anticipated outputs[17]. In general, modeling and computer simulation are not so widely different and in fact, they have strong interrelation.
Inputs and outputs
-
Inputs are factors like exogenous variables, driving variables, or forcing functions within the environment that impact the performance of the system but are not influenced by the system as described earlier. Inputs in a crop system model like rainfall, air temperature, and solar radiation vary with time and numerical values and affect soil water and crop dynamics. Similarly, the outputs from the system signify the different behavior of the system, which is of concern to the crop modeler. For example, the outputs from a cropping system simulation model would give crop biomass, crop yield, water content of the soil component, etc.[18].
Parameters and constants
-
Generally, constants are measures with consistent and precise values that persist the same when experimental circumstances are diverse or when modeled to simulate different genotypes or organisms[19]. The molecular weight of water and Earth's gravitational constant are some typical examples of constants. On the other hand, model parameters are the amounts whose values are less confident but are expected to be identical during a simulation process. The functional role of light in plant photosynthesis, the resistance to soil water flow, temperature rise and respiration loss are suitable examples for defining model parameters.
State variables
-
State variables are those that define the conditions of system components[17]. These variables adjust themselves with time in a dynamic simulation model as the system components interact simultaneously with each other and with the surrounding environment. Soil water content and crop yield are examples of state variables.
Process model
-
The interconnection between system components, more specifically, between state variables in the system happens because of several processes[13]. We occasionally advocate the term process-oriented, to define models that designate the movement and storage of mass, momentum, energy, or other substances. For instance, the state variable, i.e., crop biomass varies due to photosynthesis and respiration processes. Similarly, the soil water (another state variable) fluctuates due to rainfall, runoff, percolation, and evapotranspiration processes occurring in the field.
Calibration
-
When a model is developed, it needs calibration which entails making modifications or adjustments to model parameters to give the best-simulated prediction as obtained in the real-world observation[17]. The main model structure can be kept the same, and only the state variables are adjusted to get a reliable output.
Validation
-
The calibrated model output should be compared to real system data that has not been used before in model calibration or parameter estimation[17]. Validation is performed with a completely new data set to define if the model is satisfactorily precise for its application as defined by the objectives of the simulation study.
Model sensitization
-
Sensitivity analysis encompasses discovering a model behavior for different values of model parameters[10]. Sensitivity analysis is conducted to define how much a change in the value of a parameter affects the model outputs. By this, the sensitivity analysis also detects critical model subsystems, relationships, and essential model parameters.
-
When crops are grown under field conditions, crop simulation models using soil (e.g., rooting characteristics, moisture holding capacity, nitrogen mineralization ability, etc.), agronomic traits (e.g., date of sowing, plant density, application of fertilizer, irrigation scheduling, etc.), and weather variables (e.g., insolation, air temperature, humidity, vapor pressure precipitation, etc.) can be used to understand crop growth patterns and development, nutrient management, and yield estimation[6,20]. All the different crop simulation models have varying complexities, and most of them simulate crop growth and development daily/weekly/fortnightly, and eventually predict grain yield[7]. Air temperature and daily photoperiod mainly govern crop phenological development[10]. Crop canopy develops based on water that is transpired and radiation intercepted to produce the crop biomass. The segregation of this produced biomass into different organs causes grain development (Fig. 2). Soil water and nutrient modeling, differ between models. While a simple approach doesn't describe the soil, multiple approaches are required to describe each soil layer with its associated characteristics[21]. Details on some crop models can be found in previous studies[21,22].
For a varied range of crops like cotton, sorghum, wheat, corn, soybeans, alfalfa, and others[26], dynamic crop growth and yield models have been developed. These models use plenty of applications including managing irrigation[27,28], nutrients[20,29,30], pests and disease[31−33], land use planning[34], identifying suitable crop sequencing[35], assessment of climate change impacts on crop productivity[36−38], and crop yield forecasting[28]. However, the inherent limitations of these models are the non-inclusion of all the factors that occur in reality and the empiricism of the model that frequently requires calibration, testing, and site-specific application[11]. Over the decades, efforts have been made to improve the model's performance and its applicability through minimizing these shortcomings.
Initially, the crop models were characterized and established for their potentiality at the field scale[4,39]. Primarily, four stages of crop development were identified in crop simulation (0 = pre-emergence; 1 = vegetative; 2 = reproductive; 3 = ripening), which was reduced to three levels at a later stage[4]. The underlying assumption for level one, i.e., potential yield level is that the normal weather parameters (e.g., air temperature, insolation, CO2 concentration, and relative day length) and the genetic aspects of the crop and control the crop growth[32].
All the elementary crop development processes, like photosynthesis, respiration, tissue growth, and development are included in level one[26]. The core aim of this level is to acquire an understanding of how these parameters influence the potential production of a crop when other crop growth factors, i.e., water and fertilizers are optimum, and there is no pest damage incidence. In the second tier of the model, nitrogen, and water limitations that affect crop growth and development are considered and give the attainable crop yield[26]. Various crop models have proficiency in defining crop growth and yield with these conventions[40]. At level three, the effects of pests and disease on crop yield loss and crop growth are considered to make the model prediction more realistic. Thus, the actual yield characterization and yield gap are quantified by including pest damage and mismanagement factors. This detailed representation has been valuable in supporting model development and making a theoretical framework for model applications.
There are many choices for selecting state variables for model development. While a simple model contains few state variables (one or two e.g., leaf area index, leaf/canopy dry weight, canopy cover, etc.), a complex model supports hundreds of state variables like leaf weight, area, water content, numbers, stem-weight, length, numbers, panicle-weight, number, stage-wise crop biomass, etc[26]. Thus, a complex model provides a more realistic prediction, however, it needs to go through complex methodical processes to build on it. Therefore, it requires multidisciplinary expertise and more time for the development of a model framework, training, and testing to build an independent model that can be applied to a field to regional to national scales by feeding the datasets. However, in some cases, a model with fewer state variables may also provide acceptable results and considered to be useful.
A simple crop model for potential yield level with its sensitivity to light and air temperature is depicted in Fig. 3. The relational diagram of the model includes three state variables namely: crop developmental stage (N, No. of vegetative nodes), crop canopy biomass (Wc, g/m2), and crop root biomass (Wr, g/m2). Crop development indicates the advancement of the crop through its different phenological phases. This may be observed by the appearance of different vegetative and reproductive plant characteristics, such as leaf-to-canopy development, first flowering, fruiting, and finally harvestable crop yield. The development rate is generally an inverse of the time that takes to complete one stage to another during the developmental life cycle. The rate of plant development is regarded as sensitive to air temperature and occasionally to the length of the day. Nonetheless, this rate is generally unresponsive to light, the concentration of CO2, and other growth factors, such as water and nutrient stress unless they are severe[37]. Many crop models have been developed primarily based on air temperature and day length for predicting crop development[5,8,37]. In a previous study[41] a model was developed for planning field operations, which effectively predicted crop emergence, flowering, and harvest dates for tomatoes within 3−5 d of actual time.
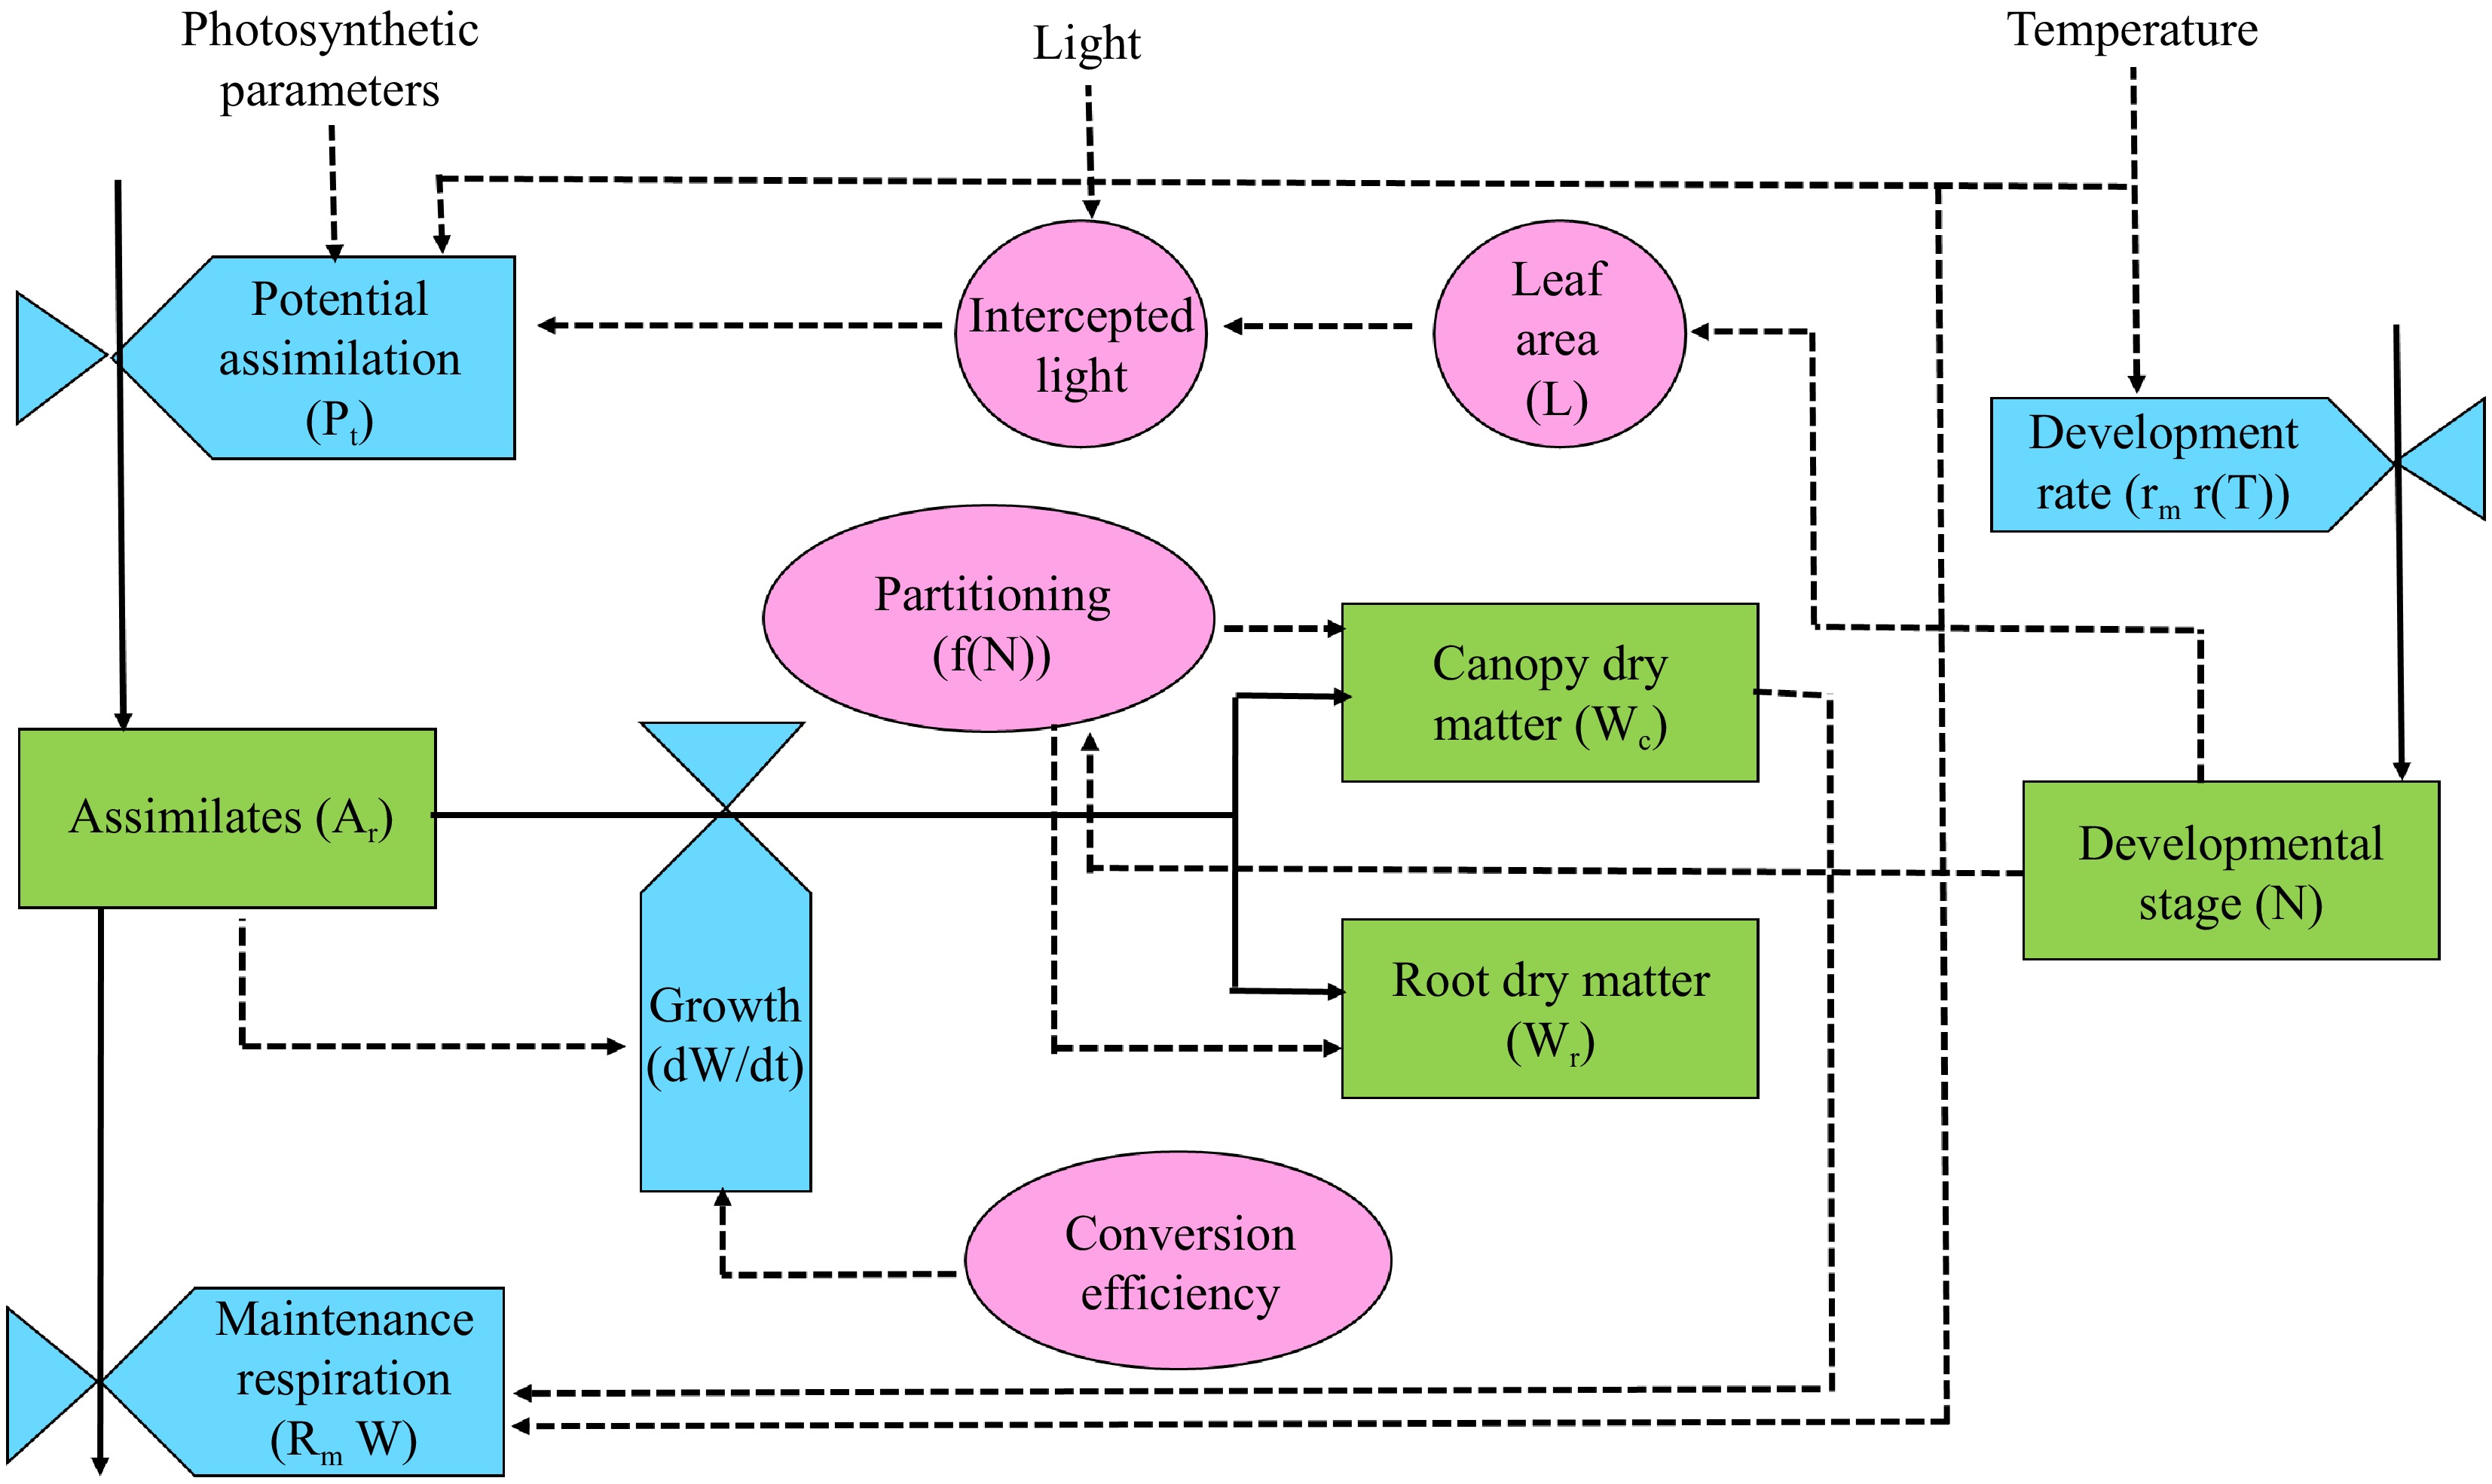
Figure 3.
A crop model with a potential production level framework is depicted with three auxiliary variables, state variables (green), rate variables (cyan), and intermediate product (pink). The solid arrow tells the pathway of material flow, dashed arrow - tells the pathway of information flow (modified from Jones et al.[26]).
The rate of crop dry matter growth mainly dependent on canopy photosynthesis, is considered to be an important parameter in defining crop yield, fruit weight, and vegetative growth. Photosynthesis is a biochemical process that translates ambient carbon dioxide into sucrose (CH2O) in plant leaves. Some of the converted carbon in this sucrose again united with other major nutrient elements (N, P, K, and S) and reserved in plant tissue and provide energy for producing new plant tissues. This rate of tissue production according to the canopy photosynthesis and the composition of tissue is computed quantitatively[42]. Further, they have calculated the net product weights as well as the energy of different synthesized biochemical components like protein, carbohydrate, lipid, lignin, organic acid, or mineral content manufactured from 1 g of sucrose (CH2O). Based on the contents of plant tissue, a conversion efficiency (E), can be computed[8]. Further, E converts plant photosynthesis rate into total dry matter increase rate. This conversion efficiency ranges between 0.65−0.75 (g tissue)/(g CH2O).
-
Agricultural production activities at any given place mainly depend on the potentialities and limitations of the agro-technologies and also the socio-economic conditions of the producers[21]. The superiority of the natural resources, the physicochemical characteristics of the soil, and the prevailing climatic conditions mainly decide the agro-technical potentials for any area. The regionally developed agricultural system has a strong relationship with environmental characteristics. Nevertheless, within similar natural conditions, the capability of different farming systems is controlled by socio-economic factors[21]. Decision-making in agricultural production systems can be categorized into three levels[43]. The first level is called strategic management, where planned or strategic decisions are made on an agricultural system based on the predictable long-lasting behavior of these systems. This is decided by the availability of natural resources and the socio-economic boundary circumstances, but this is not dependent on the present condition of the system. Strategic management is mainly focused on the direction of long-lasting planning and deals with the proper choice of agricultural systems or mixed agrarian activities, involving the farm household (e.g., animal husbandry, dryland farming, horticultural activities) and the related investment decisions. Therefore, the time range for strategic decisions is more than one year to 10−20 years[8].
When the strategic decisions have managed the assortment of a particular cropping system, the farmer, at the field level is confronted with the task of applying a certain number of cropping systems[44]. A visible feature of agricultural production systems is that they function in scarcely expected and extremely variable natural environments[45]. Though the climate for a given location is delineated based on the long-term average, it barely assists the farmers in real-time decision-making. The real performance of an agricultural system depends primarily on weather conditions which fluctuate from year to year rather than on climate[46]. That is why, in most agricultural systems, the value of the tactical decision-making procedure, which deals with the reaction to these variables and changeable environments is the main issue in achieving their success. Thus the time limit for tactical management (i.e., seasonal decision-making) is one year, for handling issues like the choice of a particular crop variety, mixed cultivation practice, and the distribution of land (how much and where) for various crops[44].
Lastly, some decisions are to be made on a day-to-day basis, these include farm activities like the best sowing date for a particular crop, irrigation scheduling (timing and requirement), fertilizer application, pest and disease management (pesticide spraying), and final crop harvesting. These decisions coming under the operational level are mainly concerned with daily activities[32].
Strategic management
-
Strategic management mainly emphasizes enabling and assisting the dialogue with several stakeholders, rather than aiming at answering management to experts[47]. This has directed the progress of the 'discussion' support software system[48], which aims to facilitate negotiation about management strategy that is pertinent and important to the decision-makers. Substantial choices exist for the current situation in cropping systems investigation and modeling, which can contribute to enhanced negotiations about long-lasting economic and ecological issues related to today's agricultural production systems[49,50]. A number of these prospects have been discovered through the 1990s and cropping system simulation models, like APSIM (Agricultural Production system SIMulator[51], CropSyst[52], STICS[53], and DSSAT (Decision Support System for Agrotechnology Transfer[22], was developed with these goals in mind.
Gradually, crop simulation models are used to discover and project opportunities for farm and regional land use systems. Research within a farm or on a regional scale using a crop model needs proper attention to the system's physical circumstances and the agroecological production choices[49,50]. As soon as adequate information on different components of agricultural production systems, i.e., soils and climate are available, crop models are valuable tools for evaluating their efficiency that is, enumerating the inputs and outputs of a new production system. The use of crop and soil models to study at the farm and regional scale in two different approaches are established and explained[9]. In the first strategy, a range of well-defined data points regarding soil and climate in a region are used to simulate crop yields, simultaneously, a geographical information system (GIS) is used to intercalate input data and cumulative outcomes for the whole region[54]. For example, a study employed earth observation data integrated with a GIS-based decision support approach to evaluate soil salinity and land capability for rice cultivation in selected regions of eastern coastal India[55]. These different approaches are promising to investigate a small number of land uses with lesser spatial interaction but with substantial physiological detail. Instances of such tactics are the delineation of an agro-ecological zone for potato production at the global scale[50] and an evaluation of probable global food supply for several situations with reverence to food demand, employing low and high external input production systems[56]. In the second strategy, crop models, along with accompanied empirical relations and skilled knowledge, are united in so-called technical coefficient generators (TCGs) for production activities[49]. Here, in this approach, a wide range of land use systems in terms of inputs and outputs are assessed by crop models and consequently grouped to a farm or regional scale using bio-economic standardized models[9,44,57−59]. Examples of such TCGs are PASTOR, LUCTOR[60], and TechnoGIN[61]. The combined use of TCGs with optimization models is predominantly supportive in circumstances where different substitute crops and production knowledge must be assessed concomitantly and where spatial or temporal interfaces are inadequate or less pertinent for the type of queries to be resolved.
Tactical management
-
Tactical management fundamentally deals with decisions taken once (e.g., medium-term decisions) during the growing season. Decisions are taken here mainly concerned with the selection of crop or variety, distribution of land to various crop cultivations, and choosing the most suitable sowing or planting date. Through the program called TACT, an attempt was made for a tactical decision support system that mainly targets farm advisers and consultants that could be enthusiastically operational by farmers[62]. It comprises a wheat simulation model (which includes wheat crop development, biomass accumulation, and yield) through an understandable interface[62] that computes probability distributions of yield and gross margin, using locational data, soil type, and its characteristics, wheat varietal information, the adjustment in wheat sowing time and weather conditions to date and past rainfall accounts. Apart from computing crop physiological and yield performances, TACT is also useful in climatological studies[62]. This influences the judgment on the break of season conditions, with principles narrated by the operator along with the past day-to-day rainfall, frost occurrence, and air temperature records. This particular type of information supports tactical decision-making by approximating the threats of replantation when crops are sown early and the consequences of losing an early sowing chance.
Considerable attention has been obtained in the previous decade regarding computer-aided tactical decision support systems[63]. It is now feasible to quantify in-season rainfall variability for semi-arid areas based on the occurrence of global phenomena like El Niño/Southern Oscillation (ENSO) phenomenon[64]. This practice has been reasonably effective in the north-eastern part of Australia due to three probable factors: (i) an extremely variable weather condition that intensified insecurity in farming decisions[65]; (ii) the capability to foretell threats by using seasonal climate forecasting[66,67]; and (iii) research environments that bring up close associations amid investigators and decision-makers[63].
The CropARM software tool (formerly known as WhopperCropper) was developed using 115 years of climate records and the APSIM model to predict the potential year-to-year variability in yields, rainfall, temperature effects, and crop growth to help make decisions in effective crop management at farmer's field[68]. Another previous study[66] cited one of the worthy applications obtained using the Whopper Cropper approach. This application pertained to addressing a critical issue containing seasonal climate forecasting in planning summer cropping options in farmer fields in the Callide Valley of Central Queensland, Australia. For this, the positive SOI phase (Southern Oscillation Phase) for September–October was considered. When the SOI was positive during this period, it indicated an increased chance of above-average seasonal rainfall, prompting farmers to sow sorghum earlier than usual. Thus, it was recommended to sow medium-duration hybrid sorghum on November 15. Using a 100-year historical climate record, they conducted simulations that generated a 100-year time series of yield outcomes, with variations linked primarily to different seasonal climate conditions. Their analysis revealed annual fluctuations in sorghum yields under this scenario compared to the long-term average, with a particular focus on years where the SOI was positive during September–October. These positive SOI phases were often associated with higher-than-median sorghum yields, demonstrating how seasonal climate forecasting during such phases helped mitigate the risk of low crop yields.
Operational management
-
Operational management states the day-to-day management strategy of agricultural production systems[69]. It mainly focuses on decisions, made by individual farmers, on timing and the amount of interferences needed in their crops. From time immemorial, the capability of crop growth simulation models in the operational management of the field crop has been acknowledged[70]. As a part of operational decision support systems, the possibility, and utility of crop growth simulation models have been extended from the last decade due to the amalgamation of mechanistic or process-based crop growth simulation models with ground observation practices[5]. A combination of both remote sensing and crop simulation modeling approaches can lead to further enhancements in environmentally comprehensive agricultural production through the improved decision support system[69−71].
Water management
-
Water, a freely available natural resource is overexploited in most of the countries of the world and agriculture has frequently been sorted out as one of the areas where it is mostly misused. Studies have demonstrated the usefulness of providing timely irrigation that can significantly improve water use efficiency and crop-water productivity[72−74]. In addition, the development of a software-based decision support system (DSS) is necessary to aid in the more efficient use of irrigation water by farmers[75−77].
To assess an efficient management strategy for increasing rice productivity, the ORYZA-W model[78] was used in light of farmers' approaches to risk. Furthermore, a modified version of the CERES (Crop Environment Resource Synthesis) - Wheat model, i.e., WIRROPT7, an interactive computer program, was proposed[79] to discover its potentialities in intra-seasonal irrigation regime management that enhances total gross margin for a particular soil, weather, and crop management combinations. Likewise, irrigation management of cotton and maize crops in South Texas was also evaluated using the Environmental Policy Integrated Climate (EPIC) model[80]. The model was particularly developed to estimate crop yield, crop water uptake, crop evapotranspiration (ETc), and water use efficiency (WUE). The following two parameters, i.e., ETc and WUE were estimated to find the interactions between the yield and crop water uptake. Further, the authors stated that the EPIC model works well for both under full and deficit irrigation conditions in Southern Texas and is useful in developing a DSS for irrigation scheduling. In a study,[81] reported the applicability of the HydroLOGIC software tool for managing irrigation in the cotton industry in Australia. The main aim of developing this tool was to optimize water use and irrigation management with information produced by computerized decision support. Another cotton growth model and a DSS software tool is OZCOT[82] which also proved the capability to improve the estimation of yield and water use efficiency by augmenting strategic and tactical irrigation judgments in the Australian furrow irrigation cotton production systems.
All information given above comes under a strategic water management system. However, to improve the whole farm production, the availability of within-farm irrigation water is essential, particularly, during the in-season growth of crops (e.g., rice) on which the crop yield is heavily reliant. Therefore, an accurate estimation of yield using any crop simulation model also requires quantification of daily water use by crops, especially from close to flowering to maturity stages. In this context, water management under the operational head is also important to be considered. Numerous irrigation scheduling models were constructed for water production and use purposes by FAO[83]. It is a space where the models have been used widely as DSSs. However, as these models do not directly consider the process of crop growth dynamics across the season, they may not accurately predict or forecast the water stress impacts on crop growth and development[74,77].
On the other hand, in the process-based mechanistic crop simulation models, like CERES-Maize[84], EPIC[85], and CROPSYST[52], the impacts of soil water reduction in the progression of the crop development cycle are considered. Thus, their capability to forecast water stress effects on crop development is more effective[86]. One of the early works using the EPIC-PHASE simulation model for irrigation scheduling[86] can be illustrated as an example case. The model was used as a real-time crop simulation and expected to give the necessary answers regarding irrigation scheduling of a crop, for example when to irrigate? How much to irrigate daily? etc. Their outcomes exhibited the prospective development that a farmer could use for scheduling irrigation giving the estimated water stress within the plant and soil[9]. Nevertheless, the effectiveness of the model in helping make decisions on irrigation scheduling is also somewhat reliant on the precise weather forecast, and perhaps for that reason, the study observed there is a range of variance in the simulation outcome for operational irrigation due to an improper input of weather forecast data.
From an agronomic perspective, it is also essential to consider additional components, such as updating daily weather forecasts, defining the risk factors in crop yield, and the magnitude of potential climatic errors rendering to the crop stage, etc. in a crop simulation model[7]. To study the effectiveness of the use of daily weather data in estimating soil water content, which in turn, will be useful for scheduling irrigation, a pilot irrigation scheduling mission was conducted in Northern Zululand in South Africa[87]. Weekly meteorological data were measured from an Automatic Weather Station (AWS) and communicated by electronic means to the experimental site. The model was used to quantify soil water availability daily, which subsequently helped in generating prevailing soil water status and helped in deciding the next possible time to irrigate.
Further, more advanced approaches by integrating remote sensing imagery and crop simulation models[54,71] were considered to be promising to provide insights into real-time water management options over a wide geographical area. The strategy encompasses two modules: (i) at first, using remote sensing data, system characterization was done through a probabilistic data assimilation process, where the irrigation system features and operational management practices were predicted using the space-based tool, and subsequently; (ii) this was used in optimizing water management, discovering water management selections under diverse levels of water accessibility[47]. For regional scale modeling, a soil–water–atmosphere–plant model (SWAP) was used as a deterministic-stochastic model[88]. The input data to develop a regional scale crop simulation model for water management may include satellite imagery (e.g., Landsat 7 ETM+, Landsat 8 OLI, etc.), crop sowing dates, irrigation scheduling, soil physicochemical properties, depth to the groundwater table, and quality of water crop evapotranspiration (ET), etc. and all can be simulated within a model interface, e.g., using a SWAP model and/or a surface energy balance of land (SEBEL)[89]. The calculated dispersed information was consequently used as input data for discovering water management choices.
Studies report that crop productivity can be significantly enhanced by following effective water and crop management practices under water-limiting conditions[84,85,90,91]. Changing the date of sowing and their allocation in the irrigated fields were found to influence crop yield considerably[7]. Likewise, the management decisions may supplement the use of deficit irrigation practices. In general, the farmers may allow their crops to be moisture-stressed by about 27% before applying the irrigation water based on the existing circumstances within a farm. Under water-limiting conditions, high equity in the water supply might affect the healthier performance of the irrigation system[74]. An early crop sowing may also accompany this during the growing period with widespread dispersal. However, the above is also realistic during the profuse availability of water, but the growers have higher degrees of independence in crop sowing. There exists an ideal stage where the advantage would explain the extra usage of irrigation water; outside this point, water must be saved[52]. In a further practical approach, if a regular climate projection is accessible, the method can be useful to discover water management decisions much earlier during the wheat-growing period[52].
CropSyst[52], EPIC[26], CROPWAT[92], APSIM[51], and CERES[93] are some of the decision-support-based crop simulation models for irrigation management. Nevertheless, most of these models need exhaustive input parameters or information (which is rather hard to acquire) that defines crop growth performance, yield, water use, etc. (e.g., APSIM, CERES). In order to get a reliable estimation, the models should be sufficiently calibrated, validated, and adequately vigorous. Due to this reason, detailed information-requiring models might be less useful than simple and robust models[3], such as the newly available FAO water productivity model[94], and/or AquaCrop[94]. The AquaCrop model is mainly dedicated to simulating achievable yield according to the availability of water. This is supposed to have a most favorable balance in precision, easiness, and robustness[94] that may help estimate the optimal level of irrigation requirement that maximizes the farm profitability even in water-limited environments[23]. In addition, the AquaCrop[94] provides a good symphony between accuracy and straightforwardness and has been parametrized for more than 15 different cultivated crops grown at diverse locations. Several researchers report the usefulness of the AquaCrop model to estimate, with judicious accuracy, both total crop biomass and harvest yield under different irrigation treatments i.e., from no water stress to mild (or sometimes severe) water stress[23,77,90,95,96]. The model includes different soil-based parameters (like water balance), crop parameters (crop growth, development, and yield), and atmospheric parameters including the thermal regime, rainfall, evapotranspiration, and atmospheric carbon dioxide concentration, etc. SWASALT simulation model was used to evaluate farm irrigation water management options using a one-dimensional in the Haryana district in India[97]. The study, further showed that in many circumstances, saline water of up to 7.5 dS/m can be applied without any harm to crop production on a long-term basis. The simulation experiment further prescribed that the use of the canal and saline water alternatively had an advantage over combination use.
Due to these underlying advantages, AquaCrop has been explored by several researchers for preparing irrigation strategies. For example, in Bolivia,[24] ideal rates of irrigation application were derived (that include time intervals of applying the depth of water) from evading moisture stress and assuring maximum water productivity using historical climate data. Further, they inferred their findings in simple charts that were advantageous to policymakers, extension consultants, and farmers. However, apart from extensive usage of irrigation scheduling based on agronomic practices, it still has a problem with optimization. Thus, Geerts et al.[24] resolved this optimization problem for three different field crops simulated by the AquaCrop model. They established an optimization system for producing suboptimal irrigation schedules that indirectly includes the crop water stress response, and subsequently used these as preliminary predictions for complete optimization of day-to-day irrigation. Execution of this optimization with several standards of water quotas as a function that articulates the association between water quota and yield. Another study[98] verified the potentiality of the AquaCrop model (V 4.0, developed by FAO) for simulating winter wheat canopy cover (CC), actual crop evapotranspiration (ETcact), total soil moisture content (TMC) and wheat grain yield (GY) for in flood irrigation conditions in the semi-arid region of central Morocco. Model calibration was done using those parameters affecting CC, ETcact, TMC, and GY through comparison between observed and simulated results. Effectiveness of the model in simulating CC, ETcact, TMC, and GY with average values of the Mean Bias Error (MBE) between measured and estimated values varied between −4.6%, −0.23 mm/d, 17.56 mm, and 0.05 t/ha for the calibration, and 7.89%, −0.01 mm/d, 0.5 mm, and 0.06 t/ha for the validation respectively for two successive growing periods. The results from the several simulations (irrigation scenarios) showed the model recommended early crop sowing as compared to later in saving water and gaining adequate harvested yield. Furthermore, a study investigated the capability of HYDRUS-1D in simulating irrigation water for three different field crops[99]. To configure water and salt movement procedures, they combined HYDRUS-1D with FAO-56 (dual Kc approach). Field experimentations were done in the command area of a conventional irrigation canal system in Hetao Irrigation District in 2012 and 2013 using maize, sunflower, and watermelon crops. Two experimental year observations were used for model calibration and validation and simulation of moisture, salinity, and crop yield gave comparable results with the observed data. The study depicted that due to over-irrigation, a bulk quantity of irrigation water was percolated, which again was reused mainly by the crop during its upward movement through the capillary rise. They concluded that, for applying water-saving measures, enough consideration should be given to the distribution of cropping patterns and controlling groundwater along with technical improvement in irrigation scheduling.
Yield prediction
-
The DSSAT-CSM-CERES, conventionally known as DSSAT-CSM[22,100], is a cereal crop simulation model that simulates crop growth and development using crop physiological traits and management practices under normal weather conditions[93]. The model also offers the opportunity to evaluate the impacts of an under-optimal irrigation management strategy on biomass accumulation, grain yield, and WUE of winter wheat[100]. It has already been demonstrated that the capability of the DSSAT-CSM-Wheat model for optimizing crop management practices can lessen the economic ambiguity for agricultural production[22,100]. The efficacious application of the DSSAT-CERES model in simulating crop growth and yield in response to crop management and ecological factors has been described under diversified soil and climatic conditions in different regions across the world[88,93,101−103].
DSSAT-CERES model for a precise estimation of winter wheat grain yield, biomass, and WUE that efficiently guided in making decisions on irrigation management in the Texas High Plains[104]. The model was calibrated with ground observations of winter wheat grown under nine irrigation treatments varying from dryland to full irrigation. The model gave an accurate prediction for crop phenological observations, crop biomass, grain yield, and crop evapotranspiration with many similarities with observed data. Simulated biomass yield exhibited a significant benefit of applying 100 mm irrigation water at the jointing or booting stage rather than using 140 mm water at the anthesis or grain filling stage. Keeping deficit irrigation at the grain filling stage remarkably augmented WUE compared to full irrigation (400 mm)[104]. Furthermore, the web-based InfoCrop wheat model[7] estimated yield and crop biomass significantly with R2 of 0.958 and 0.947 and RMSE of 0.054 and 1.318, respectively under different irrigation and nitrogen management conditions. This opens a state-of-the-art tool for developing a crop simulation model to be used as a DSS tool in the crop production system.
Another previous study[105] reported the applicability of the CSM-CERES maize model in predicting maize biomass and grain yield and in optimizing irrigation conditions in Pakistan. The crop was grown both under water limiting, and non-water-limiting conditions, and four growth stage-based and two potential water deficit-based irrigation treatments were given in arid regions. The calibrated model output showed a consistent result with 10% variability as compared to the observed value. However, the model showed more variability in terms of predicting LAI, crop biomass, and crop yield of –17.9% to 20.0%, –9.2% to 14.3%, and –19.6% to19.9%, respectively during validation for two different maize hybrids Monsanto-919 and Pioneer-30Y87. Further, the study concluded the usefulness of CERES-Maize in delivering decision-making under different irrigation regimes at the farm level. In another study,[106] used a DSSAT model for the maize crop simulation. The maize was grown in long-term trials with different tillage and residue management practices in Zambia. They reported that an agronomic analysis of the location-specific factors is required for simulating yield impacts of conservation agriculture. A few of these factors, like the difference in soil structure between conservation plots versus tillage practice, can have an impact on crop yield but are not simulated by DSSAT. These may be merged in the simulation model through a proper parameterization of relevant parameters. Sensitivity analysis of maize yield simulation to three critical parameters under CA practice showed that the DSSAT responds to mulching, specifically when rooting depth is constrained, i.e., when water is an important limiting factor for crop growth. Earlier, the efficacy of the Aqua-crop model for predicting wheat yield under saline irrigation conditions (4, 8, and 12 dS/m) using both salt-tolerant and sensitive varieties was evaluated[25]. The validated AquaCrop model showed a significant prediction accuracy of yield and above-ground biomass.
Despite the considerable success rates of the above-mentioned different crop simulation models, precise crop growth, and yield modeling over vast geographical areas by a single-crop model is owing to diverse possibilities of ambiguity. To improve this, a Bayesian model averaging (BMA) method using several crop-growth simulation models ensemble to deliver more reliable estimates of maize yields in China, covering a geographical area of 148,000 km2 where maize is grown over 2,200,000 ha[60]. To accomplish their objectives, different crop simulation models, such as the WOFOST (WOrld FOod STudy) model for studying photosynthesis, the AquaCrop model for studying water dynamics, and the nitrogen-oriented DNDC (DeNitrification and DeComposition) model were used and compared in their ability to accurately estimate maize yield at a county-level scale. From this individual assessment, an integrated estimation was attained using a direct association of the three ensemble members employing BMA weights[99]. This unified scheme gave more specific predictions than any single crop model does. This happened because a BMA structure meticulously considers the uncertainty of each simulation model while predicting crop yield. Additionally, an understanding of the BMA weights is also crucial for comparing regional rainfall, fertilization use, and radiation use data. They found these values sufficiently correspond with the provincial limiting factors as the high weightage was obtained in counties with recurrent droughts using an AquaCrop model. In contrast, WOFOST was found to be more appropriate in regions with limiting radiation receipt.
Nutrient management
-
For quantifying the crop nitrogen requirements for rice, the ORYZA model was developed[107]. The ORYZA is a 'parsimonious' model that is mainly reliant on insolation, bulk leaf nitrogen content, and a location calibration feature. Further, the model was rigorously tested to categorize some irrigated rice soils in India for their N supply to meet the crop demand up to the flowering stage than those where a basal dose was needed to achieve that stage[108]. The results obtained from the model were found to be useful in N recommendation in terms of selecting the ideal timing of N application for the different soil N supply regimes. The same model was also applied by a team of researchers in China, where the simulation result achieved considerably higher yields as attained by following the model recommendations as compared to the local recommendations[109]. A constraint of using the ORYZA model is that it needs to be calibrated for each location with site-specific conditions. Some important decision tools and their use in managing crop nutrients are summarized in Table 1.
Table 1. Summary of some of the decision tools widely used in crop nutrient management.
Decision tools Application Ref. Amaize-N Forecasting crop yield and N-fertilizer requirements, and planning N-fertilizer and irrigation applications for site-specific maize crops nitrogen recommendation for maize [110] NuDSS Software for Irrigated Rice Nutrient management as well as a tool for SSNM for rice [111] Nutrient
ExpertSoftware for formulation of fertilizer recommendations as well as SSNM tool for maize and rice [112] QUEFTS Nutrient management for rice and wheat as well as SSNM tool for rice and wheat [112] Adapt-N Nitrogen management for maize and assessing the environmental fate of applied nitrogen [113] Expert-N Nitrogen management for wheat and annual crops [114] In another study[45], an APSIM simulation was used for simulating wheat crop production and drainage passing through the crop root zone of wheat and canola crops in response to nitrogen application rates from 0 to 300 kg N ha−1 per year. The model was simultaneously trained with historical climatic data from 1889 to 2002 (rainfall, temperature, etc.) and stored soil moisture during crop sowing time (SSMS) in southern Australia. The results exhibited the ideal N recommendations rates as 100, 150, and 200 kg N ha−1 per year in the years during April/May with SOI phases as negative or decreasing, near zero, and increasing or positive, respectively. Comparable results were obtained for an associated canola cropping system using the APSIM model[51].
Under the operational management head, nutrient management is essential. In the Netherlands, simulation results based on the nitrogen fertilizer recommendation are prescribed through an interdisciplinary plan[115]. Based on the measurements of crop biomass and mineral nitrogen contents in the wheat cropping soil root zone, the simulation was conducted in early spring[115]. A quantitative approach to calculating fertilizer application through modeling may help in better yield and nutrient use efficiency in rice. For this, an assessment of soil supply efficacy of nutrients along with the requirement and internal efficiency of N, P, K, and Zn in rice from field experiments conducted in 20 different sites in Eastern India was made[112]. Site-specific balanced fertilizer recommendations were achieved using the quantitative evaluation of the Fertility of Tropical Soils (QUEFTS) model in their study. The calibrated QUEFTS model with experiential field data from diverse locations with variable amounts of N, P, K, and Zn resulted in a good fit between measured and calculated yields and showed a high and significant correlation with N, P, K, and Zn with rice yields. The EPIC (Environmental Policy Integrated Climate model) was used to simulate the response of crop yield and SOC (Soil organic carbon) to various fertilization regimes[116]. The model showed promise in simulating both the variability of crop yield (NRMSE = 32% and 31%) and SOC (NRMSE = 13% and 19%) during the calibration and validation stage under diverse fertilization practices in China. The study showed the usability of the EPIC model in predicting the impact of different fertilizer regimes on crop growth and yield.
Another location-specific decision support system model for nitrogen fertilizer recommendation for maize growers is 'Amaize N'[110]. It is specialized in advising maize crop yields, and rate of N-fertilizer use for getting potential crop yield and premium economic benefits. Simultaneously, it also forecasts the importance of operator management decisions. It also predicts maize production and indicates possible ecological impacts on maize. Simultaneously, the system also provides insights into the leaching loss of nitrogen throughout the cropping period and estimates the residual soil mineral-N at the termination of the growing season.
Pest management
-
The InfoCrop, a generic crop growth simulation model[117], was used for simulating rice planthopper damage on rice genotype Pusa Basmati 1[118]. The model used for simulating economic injury levels (EILs) of the plant caused by the pest, and an iso-loss curve were prepared that depicted yield loss at different crop growth stages along with the planthopper[118]. Thus, the study showed the usefulness of amalgamating EILs and iso-loss curves in monitoring planthopper populations, which in turn, provided a decision support system for applying pesticides to check disease spread. Hence, the simulation model that was built on large crop bio-physiological and mechanistic processes along with pest injury mechanisms, can aid in location-specific decision support tools and assure pest management decisions which further helps in increasing agricultural systems productivity. However, pest management decisions are also useful under operational crop management for increasing crop productivity. Due to the existence of complex interactions among crops, pests, and diseases and because of their dynamic nature, a system investigation approach is essential to comprehend the probable timing of the rise of pest and disease problems and their management options[32].
To have a supervised control of disease and pests, and to reduce the chemicals used in pest control in winter wheat[119], the system EPIPRE (EPIdemic PREvention) was designed between 1977 and 1981 in the Netherlands. A foremost benefit of the EPIPRE system was that the growers were capable of picking up as they went along and were continuously conscious of what way the system performed. The system EPIPRE mainly gives three choices: (1) treat, (2) do not treat, and (3) do another field observation. As the crop season ends, each farmer gets a record of his activities and the recommendations along with a monetary explanation of the crop protection actions. Then in the future, the results are discussed with other farmers as well as among themselves in regional assemblies. The same expertise, in 1981, covered 6% of Dutch winter wheat[120] and saved an average of CHF£15 ha−1[119]. In 1992, the EPIPRE was used to advise on disease control in 500 fields in Belgium and northern France[30]. However, the researchers in Sweden (1982 to 1985) found that even if EPIPRE were a fascinating and beneficial decision support system, it would need adjustment if it were to be applied to the farmer's field for repetitive practice. As the model recommends needless spraying, the inclusion of weather parameters and adjustment of plant growth factors into the model to make it more useful to Swedish agro-environmental conditions was suggested in a previous study[2].
In another study, it was observed that EPIPRE-recommended plots yielded 3% less than conventionally treated plots (0.5% of gross return)[121]. However, the growers were capable of lessening the spray application frequency by 20%–100%. The inference was that even though the growers failed to earn more revenue, the new method was environmentally useful and aided in lessening the pesticide resistance issue[121]. Likewise, a decision support system has been developed in Australia called SIRATAC[122]. This is a dial-up crop management system that supports irrigated cotton cultivators in making the right tactical decisions in using insecticides daily[122]. It is comprised of several simulation models along with a decision model that aid the farmer to decide whether to spray insecticide or not and if yes, which type of insecticide should be sprayed. Therefore, both the SIRATAC and EPIPRE contributed significantly and successfully by helping in disease interpretation and pest management in the crop field more effectively.
Varietal evaluation
-
For the plant breeders, the main focus is to bring novel crop genotypes with enhanced characteristics like higher grain yield and superior quality, which will be suitable for a wide range of climatic conditions. When a newly developed genotype is cultivated which is more ecologically diverse than its native region, it is imperative to evaluate genotype-by-environment (G × E) interactions. The G × E interactions mainly define the unique variations, in terms of performances, which a newly developed genotype could show while they are evaluated in new environments[123]. Such interactions possibly will be significant for some crops and/or varieties of a crop e.g., sunflower crop due to their influence on total yield variance may range from 5% to 20%[123,124]. Information regarding the interaction between genotypes and the environment is also essential for understanding the stress tolerance abilities of the crop[32,96] and for evaluating the relative performance of a board population. New breeding lines and/or genotypes produced by breeders are frequently exposed to multi-environment trials (MET)[125]. Nowadays, these trials continue to play a crucial role in varietal assessment through breeding programs, in addition to providing recommendations to growers by extension people.
The systems involved in the authorized varietal assessment for the field crops vary from one country to another. In Europe, there is a general feature, where authorized varietal assessment is conducted by committed organizations for testing the value for cultivation and use (VCU)[126]. The VCU method targets following real-world farming circumstances in regions appropriate for each crop[126]. These trials usually take 3−6 years, depending on the types of crop and country, to bring a list of recommended varieties for cultivation which is either published in regional bulletins or national summaries. Similarly, in France, it needs 2−3 consecutive years of successful field verification conducted by GEVES (Groupe d'Etude et de Contrôle des Variétés et des Semences – an official seed and variety testing agency) using multi-environment trials for registering a new crop variety in the Official Catalog of Plant Varieties[47]. Subsequently, to check their regional production efficiency, the newly developed varieties are examined over a broader area and with an additional number of trials by technical institutes[47]. In varying agro-environments in India, the impact of projected climate change for 2080 on Indian mustard (Brassica juncea) was evaluated using the InfoCrop model[127]. The crop was found sensitive to changes in CO2 concentration and temperature. Additionally, analysis of future climate change situation displayed that mustard yields are expected to decrease under both irrigated (67% in Eastern India, 48% in central India, and 40.3% in northern India) and rain-fed (57% in Eastern India, 14% in central India, and 21.4% in northern India) field conditions. Nevertheless, these decreases have latitudinal discrepancies across the mustard-growing areas of India[47].
Nonetheless, these multi-environment trials are expensive, and there is a possibility to make better and quicker usage of the information supplied by these plentiful trials for the registration of new varieties and further recommendations for cultivation. A previous study[128] reported issues regarding the existing varietal evaluation process, which may intensify the risk of taking the wrong management or misallocation to a variety. Thus, they[128] have developed a unified structure (existing method plus modeling approach) for variety assessment for sunflowers using a crop modeling approach. A process-oriented methodical pipeline was developed to support variety assessment and to intensify the ecological and agronomic circumstances where the crop varieties are regularly verified[47]. Three steps were proposed and united in the existing procedure of pre- and post-registration followed in France by GEVES, aiming the extension activities and seed corporations to describe the appropriate usage of freshly developed genotypes (Fig. 4). Details of the framework as done for sunflower crop is also given in Fig. 5.
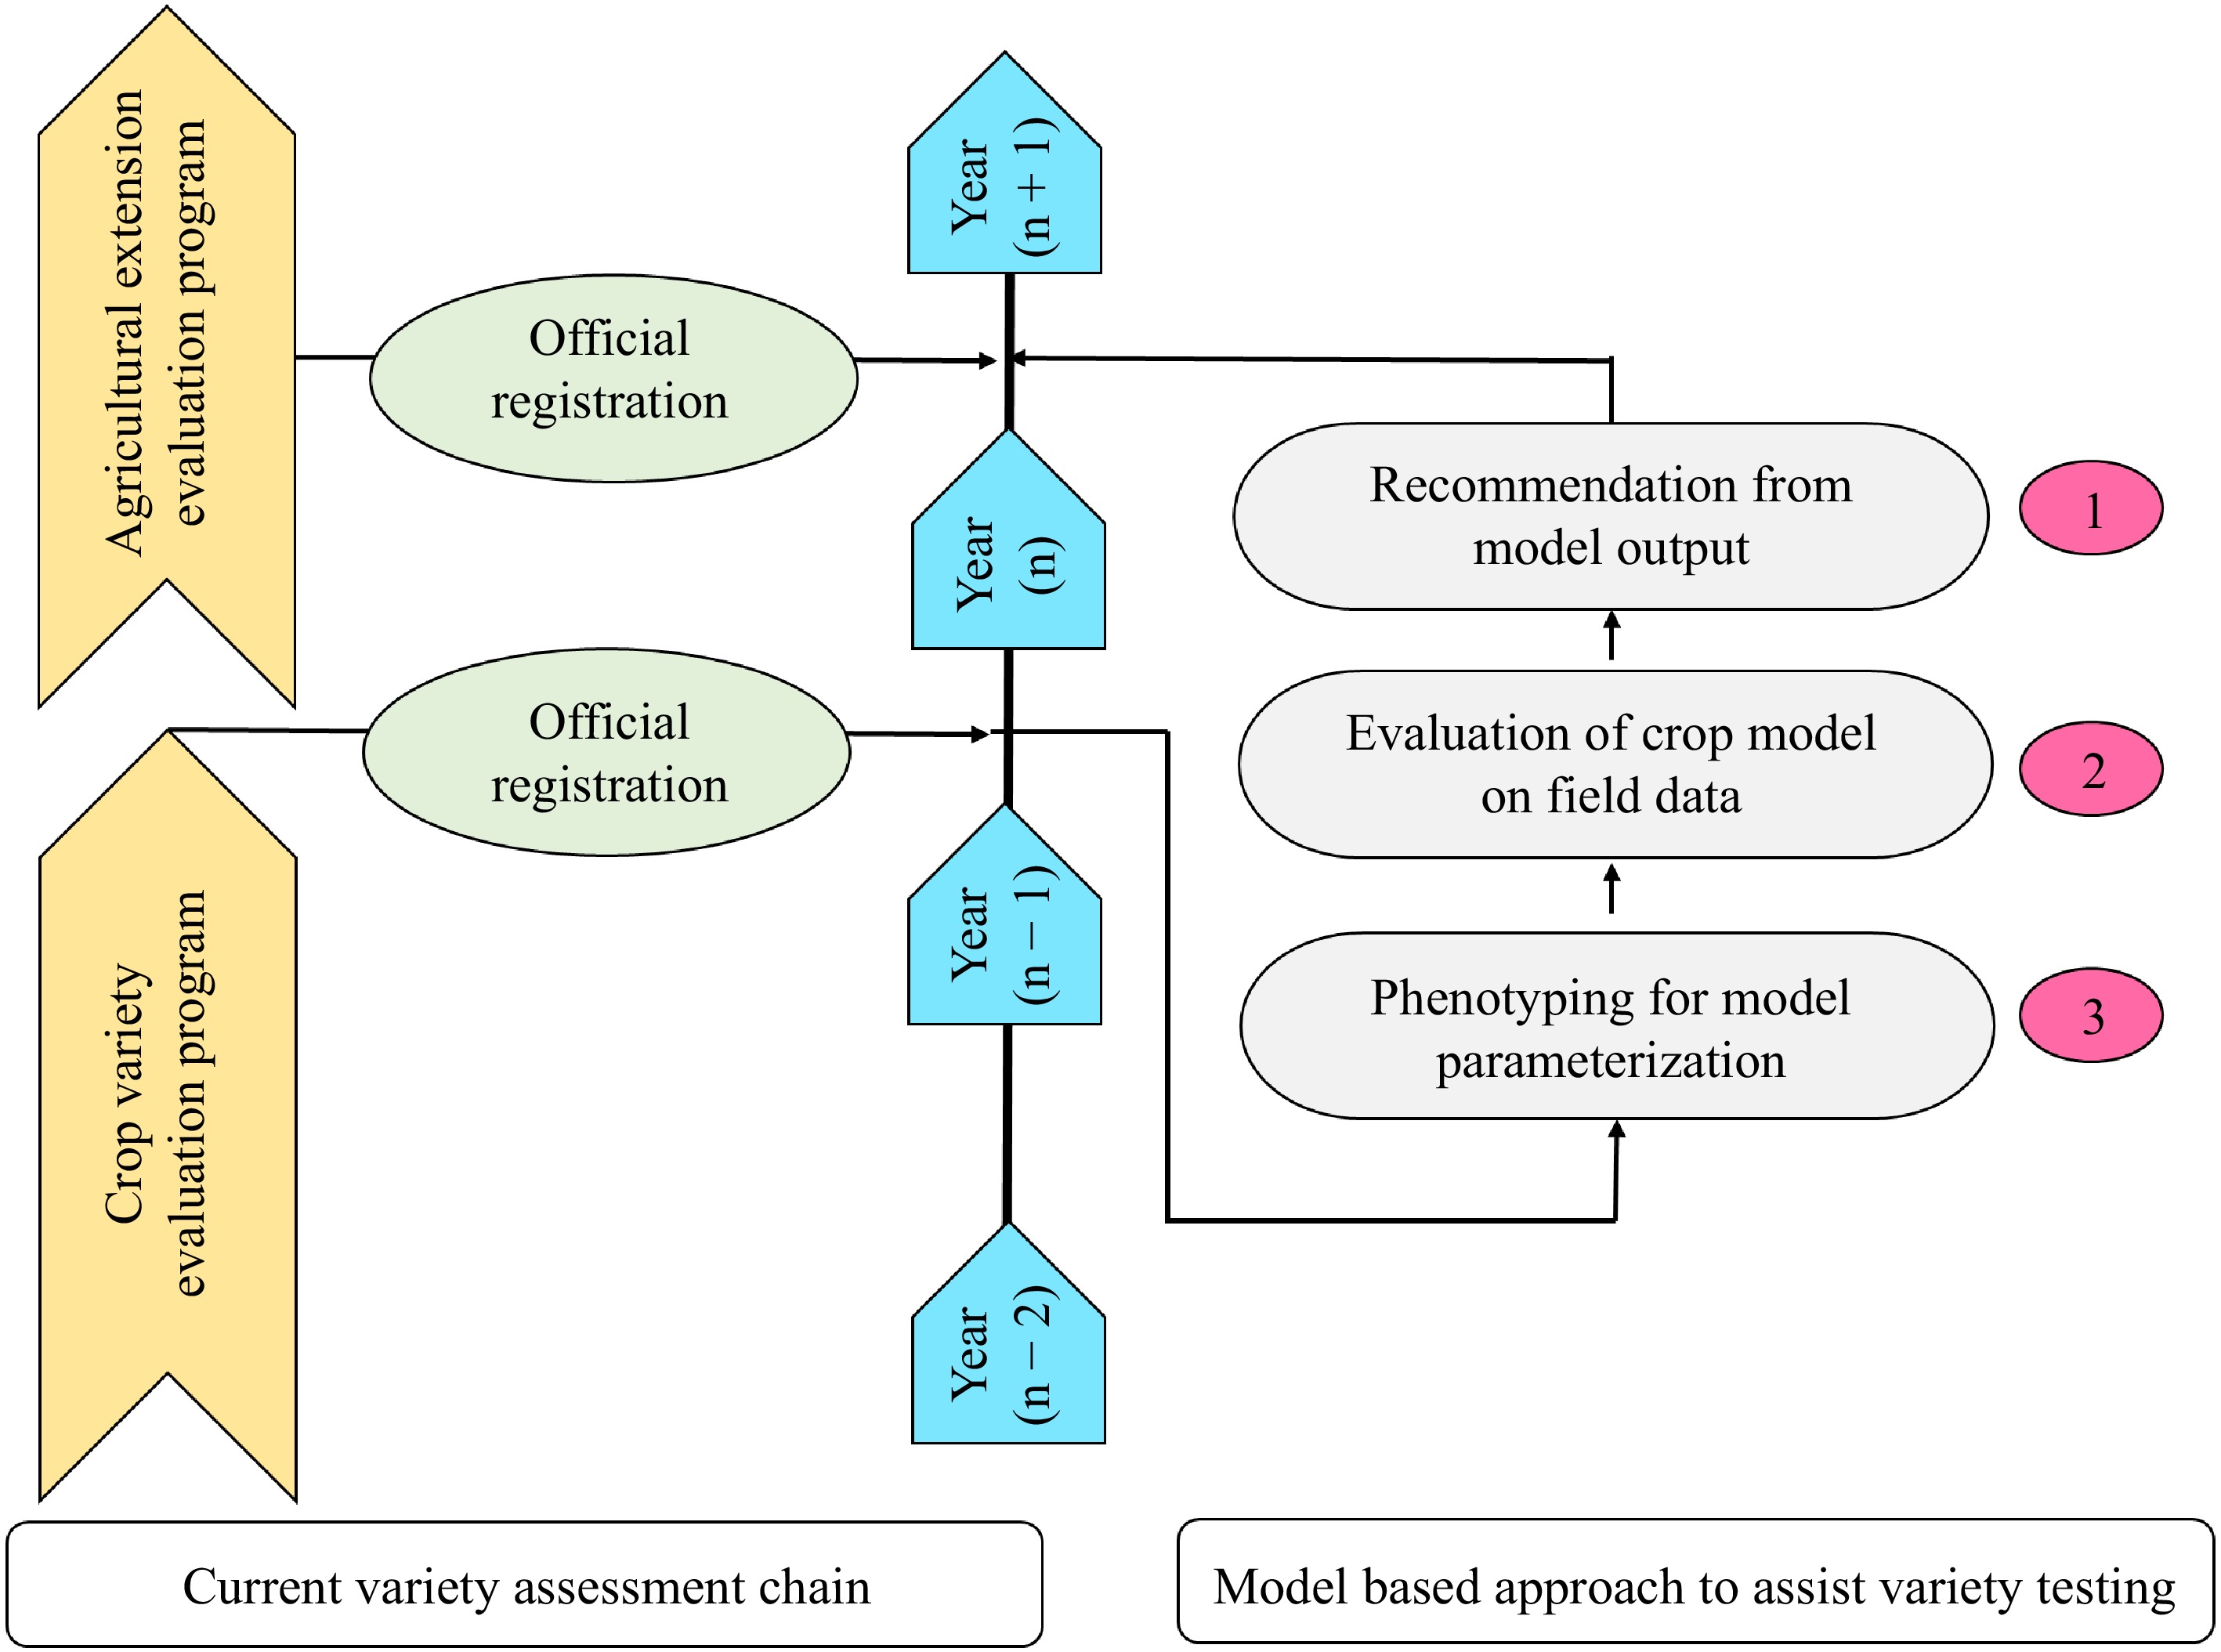
Figure 4.
Framework to include crop modeling in the variety evaluation process (modified from Casadebaig et al.[128]).
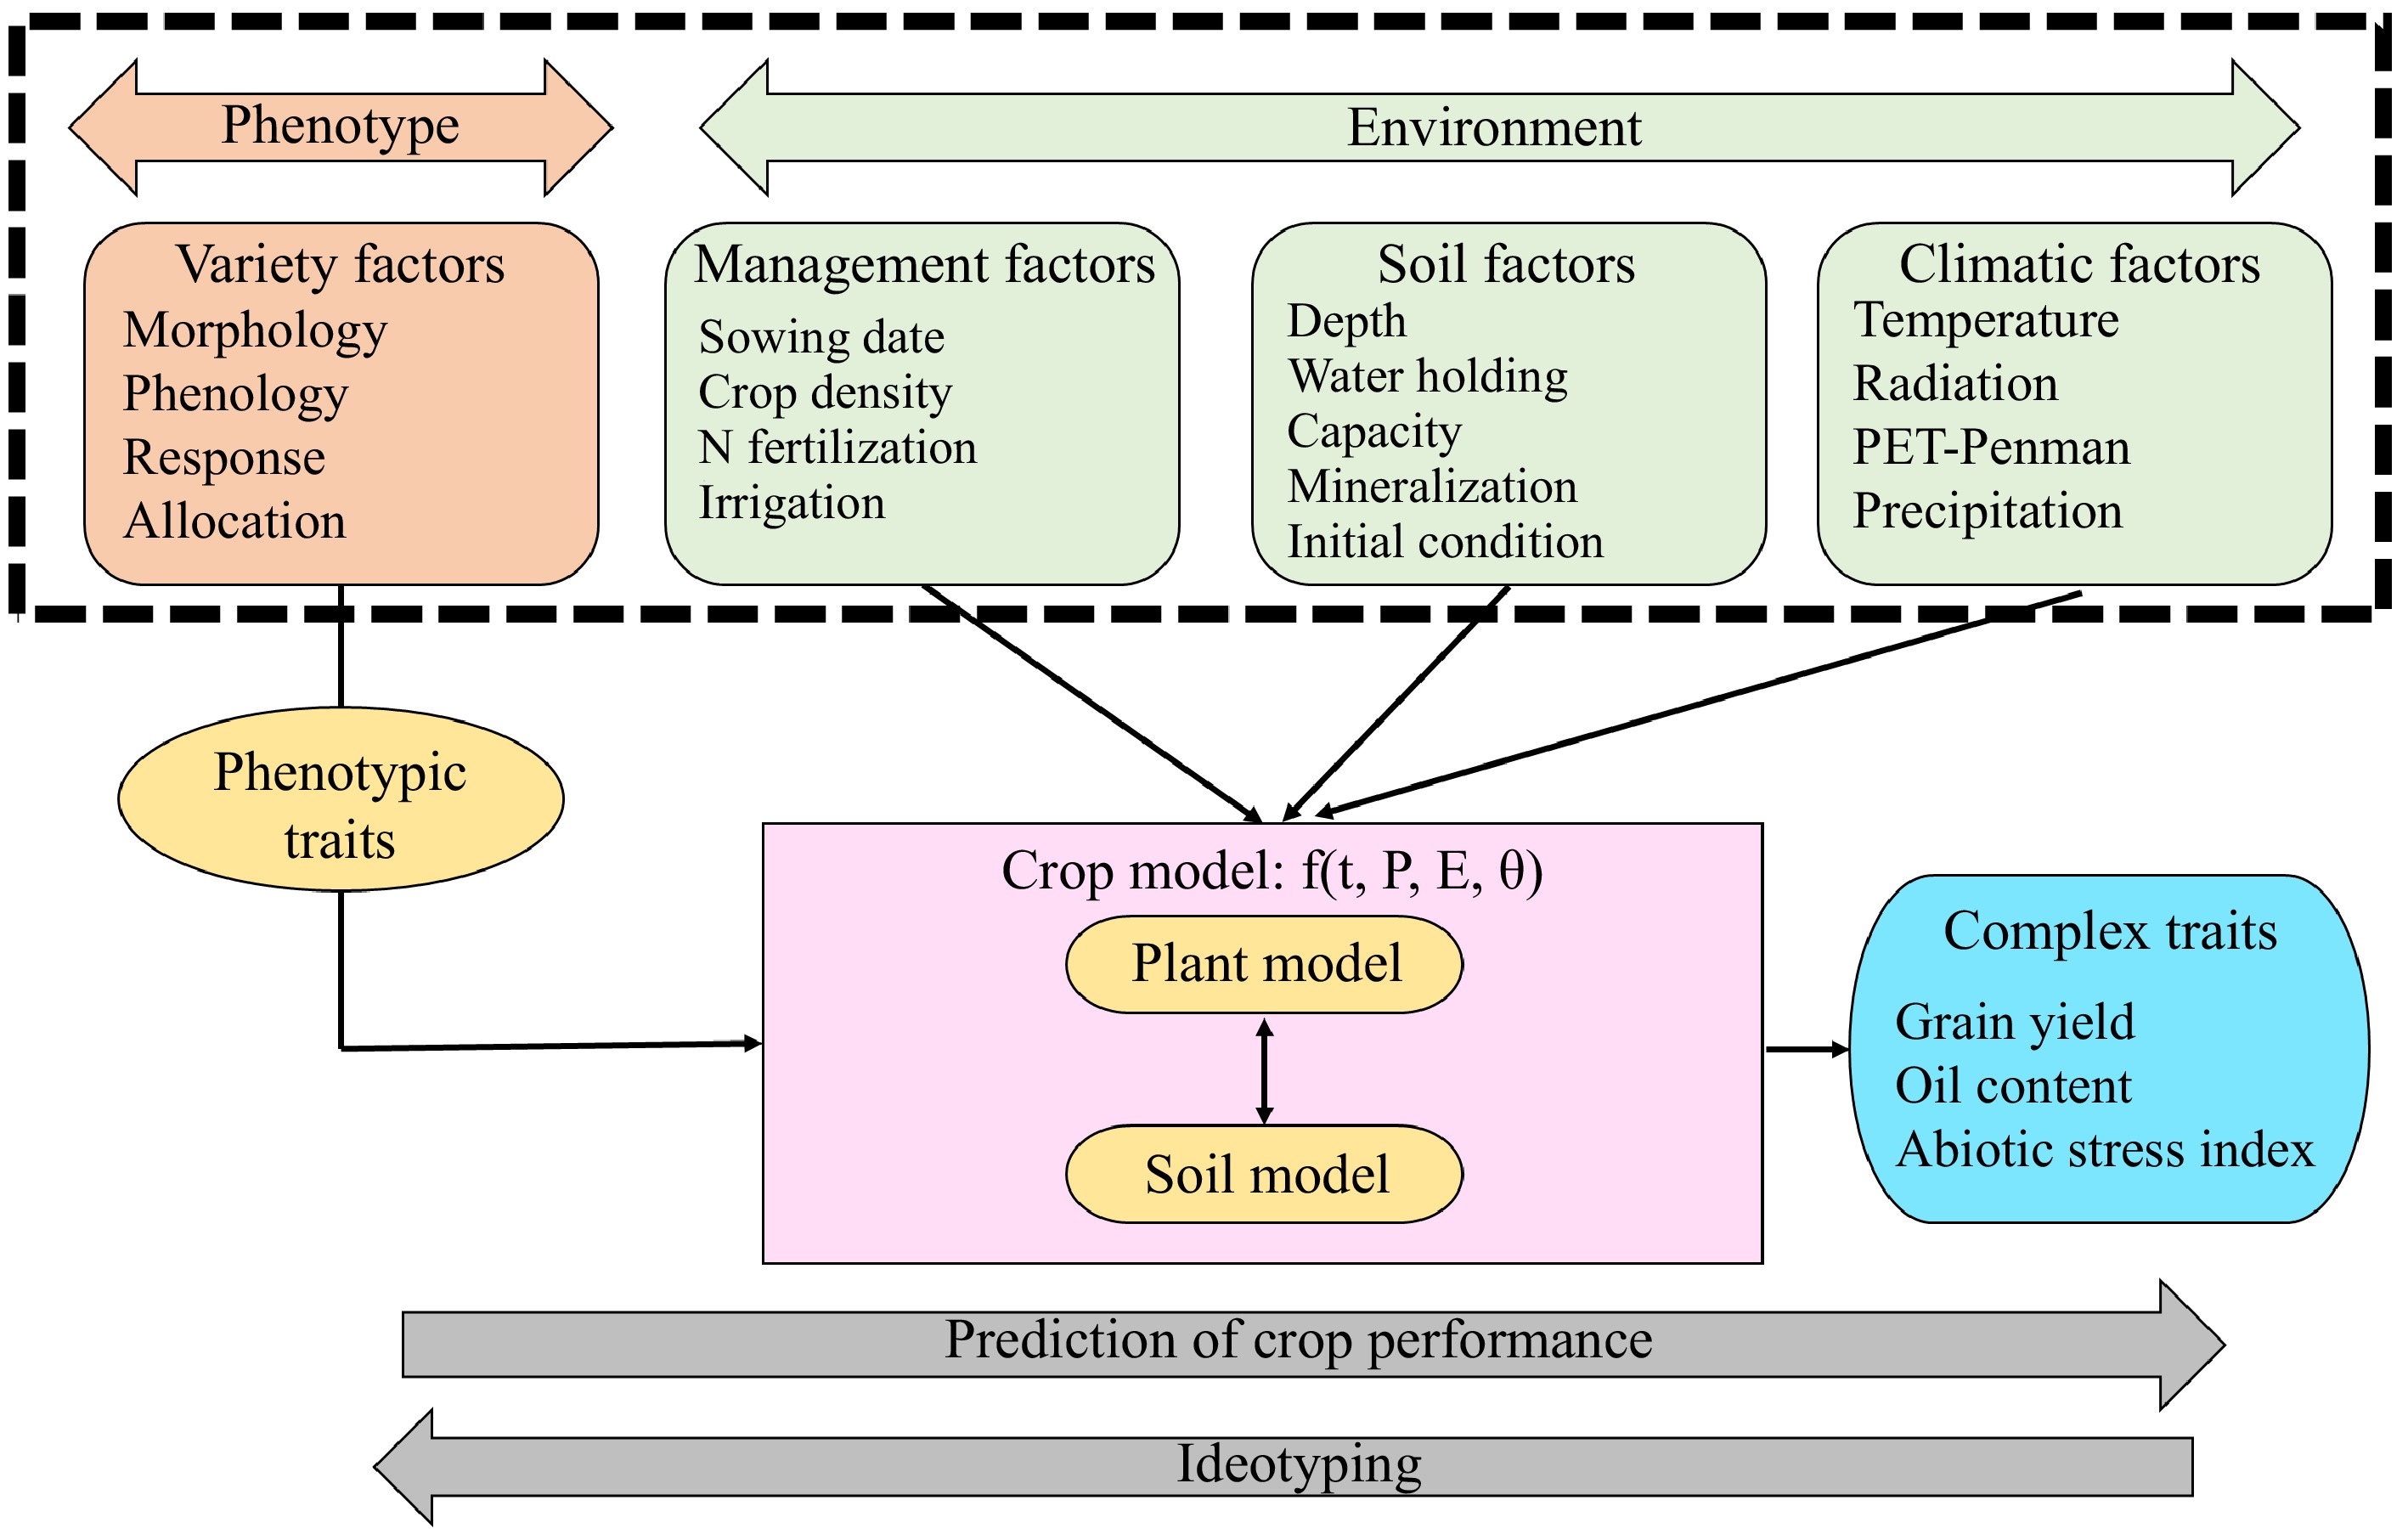
Figure 5.
Schematic representation of the SUNFLO crop model (modified from Casadebaig et al.[128]).
Step 1: parameter value estimation through plant phenotyping
-
The usual phenotyping was carried out using five agronomic variables, such as flowering date, crop height, moisture content at harvest, sunflower oil concentration, and grain yield[46,128]. The newly developed genotypes were tested in two selected fields for measuring ten out of twelve variety-dependent parameters of the SUNFLO crop model. These rigorous trials aim at crop phenology, construction, and yield build-up (Fig. 5).
Step 2: evaluation of the SUNFLO crop model through variety assessment networks
-
After the parameterization of the newly developed varieties, the SUNFLO model was then assessed on the GEVES systems to decide its predictive efficiency for this new genetic material[128]. Based on the predictive efficiency, the model categorized the variety as valid or not suitable for commercial crop varieties. If correct, numerical experimentations can be done in the next step using the model.
Step 3: proposal of numerical experiments for providing varietal recommendation
-
The numerical experimentation layout was made by the stakeholders by merging crop varieties, target environments, and crop management strategies[124]. Further, to deal with climatic ambiguities, the SUNFLO model was run with 30 years of weather data, which provide simulated rankings (mean and standard deviation) on sunflower grain and oil yields for separate grouping of soil, climate, and crop management. From this, advisers could select the best crop varieties and associated crop management strategies and broadcast their recommendations over standard media[124].
Using the above methodology, a previous study[128] carried out a variety of testing and implemented this methodology on sunflower crops using the SUNFLO simulation model. After the estimation of the parameters with plant phenotyping for new genetic material, model estimation capacity was evaluated on multi-environment trials. The result showed the comparative root mean square error (RMSE) of oil yield was 16.4% with a model accuracy of 54.4%. The model further ranked the commercial hybrids with a relative RMSE of 11% and Kendall's Ʈ = 0.41 (p < 0.01), which confirmed the model's performance in ranking ability. For identifying the best crop variety-associated management practices, the numerical experiment was designed by unifying earlier confirmed genetic material and unknown cropping conditions in French production counties[124]. Finally, they improved the variety-environment-management choice and suggested the effectiveness of their approach in finding operational outcomes to endorse crop varieties rendering to environmental conditions. This spatially managed genetic property might enhance crop performance by decreasing the genotype-phenotype discrepancy in the farming community.
-
Today, the earth is warmer than anticipated because of the enhancement of greenhouse gases (GHGs) in the atmosphere[127]. The increasing concentrations of CO2 and other GHGs are predicted to escalate the ambient temperature of the earth[127]. As crop production in the field is heavily reliant on climatic conditions (precipitation, air temperature, humidity, vapor pressure, etc.), seasonal variabilities in climatic patterns adversely affect crop production[45,129]. Hence, the consistent change in global climate greatly impacts crop yield productivity[46]. Crop physiological processes like photosynthesis, respiration, plant growth and development, plant reproduction, root water uptake, etc., are jointly affected by elevated temperature and carbon dioxide[74,129]. However, in the tropics and sometimes in sub-tropics, where radiation and rainfall availability are more profound across the year, the probable rise in the air temperature can reduce the positive effects of elevated carbon dioxide concentration and cause substantial yield losses and water consumption[47]. Therefore, an improved understanding of the impacts of global climate change on agricultural production is required to assist farmers, breeders, and policymakers in making suitable management decisions like crop cultivar selection, scheduling irrigation, and crop sowing to curtail the associated risks. Agricultural adaptation to global climate change includes careful consideration of factors like changing farming practices, cropping patterns, and the application of innovative technologies that should be included together to help make decisions[47].
A previous study[46] reports that it is of utmost importance to understand the possible impacts of climate change and its variability on agricultural production on a site and region-specific basis while using crop simulation modeling and a straight interaction should be established among simulation models, agro-meteorology, and the social concerns. Thus, a robust scientific approach is required by combining General Circulation Models (GCMs)[127] and crop simulation models to investigate their performance in forecasting agricultural productivity. The CROPGRO (DSSAT) is one of the well-known crop simulation models that adapted weather simulation generators to assess model performance under climate change scenarios[38,117]. In the future, it is anticipated to be more useful for the world farming community, if DSSAT modelers look at GCMs for integrating more precise and satisfactory weather generators in its framework. This effort will be helpful, specifically in underdeveloped countries, in discovering answers to many questions related to crop production under climate change situations[38,117]. To adapt crop modeling that can improve forecasting of agricultural production in the face of climate change and other increasing environmental constraints, the following considerations should be taken into account.
Understanding genotype × environment interactions
-
Beeding new crop genotypes is a complex and time-consuming process that needs at least 5−15 years for its development. In contrast, an alternative and more effective approach is to test a wide range of genotypes in a site and/or region-specific environments and identify their suitability for drought/water stress tolerance, specific disease tolerance, higher water and nutrient use efficiency, and yield production[130−133], where remote sensing imagery, soil and agronomic traits, and weather variables can be integrated with crop simulation modeling approaches to provide useful tools and knowledge of genotype into environment interactions (G × E)[96,131,133,134]. Such methods can aid in lessening the number of locations or time needed for field assessment and thus, promoting the proficiency of the crop variety development process. Since, a crop simulation model uses a multitude of information and/or factors on agronomic traits, genotypic information, weather components, crop physiological changes in a specific environment, etc. to train with, it is important to characterize crop/genotype-specific information and to quantify G × E before simulation. Theoretical values could then be simulated by grouping the crop parameters deliberating the most benefit as a sign of appropriate characters and breeding targets[125]. A modeling approach can also offer the probability of yield prediction in a new region based on the G × E interactions[134,135]. Process-based crop growth simulation models have been verified to be the paramount useful tools for this perseverance, as they can explore G × E × management relations making them crucial modes for understanding the courses of the multifaceted interconnections in cropping systems[123]. Deficiency of soil moisture due to drought decreases transpiration rate due to reduction of stomatal conductance and crop turgor is hampered. Accordingly, CO2 flux into the intracellular space is decreased as well and restricts photosynthesis consequences in the lower green area for assimilation. Additionally, crop nutrient uptake is condensed. The crop simulation models have the potential to be used in climate change studies to understand the potential impacts of changing climate on the food system. Together, the timing and length of a dry spell of reduced soil moisture defines the extent of yield loss or crop damage[90]. For crops like wheat, maize, or barley, the time near flowering has been recognized to be most sensitive to drought stress[91,135]. Similarly, when the temperature surpasses the optimum range for a specific crop, the photosynthesis rate is restricted[85] and generally growth rate is enhanced while respiration[26], and evaporation rise[40,73], which consequences in decreased biomass production and yield. For cereals during the reproductive stage, temperature outside the optimal range, additionally, decreases grain number and grain filling rate and hastens leaf senescence[75,76]. Acute high-temperature thresholds[6,10] vary according to the crop genotypes and growth stages as revealed for rice[108], wheat[25], and maize[113].
Ideo-type design of future cultivars
-
Since the last decade, crop simulation modeling has played an important role in plant breeding, specifically, in designing crop ideotypes for various crops and agronomic environments[135]. However, forthcoming crop cultivation is likely to be vulnerable to frequent and severe weather-related phenomena, which include heat waves, drought, cold waves, etc., and are the main challenges to plant breeders and agricultural scientists to secure future food demand from agricultural products. Therefore, it is important to focus on new ideo-types that are tolerant to severe weather phenomena and can further be transferable to different agronomic environments of similar climatic impacts using crop simulation and prediction approaches. The interactions among the crop genotypes, environment, and management practices are generally simulated in process-oriented crop models that are developed to assess the impacts of climate and weather extremes on crop phenological progress, crop water use, heat/drought tolerance, yield potential, etc[135]. The main restrictions of crop simulation modeling for developing crop-ideotype breeding was discussed in a previous study and showed how the crop simulation model had reinforced the assessment and design of cereal cultivars for upcoming conditions[135]. The study also showed a success story where the potential of simulation modeling has been applied for ideotype breeding. They have combined the usual crop simulation model with new breeding, and genetic modeling, which holds promise to hasten the transfer of future cereal variety for different locations. The robustness of the simulated model-aided ideotype strategy can also be improved by the continued development of simulation models for capturing better impacts of extreme events and the usage of multi-model ensembles.
Adjustment of sowing dates
-
The sowing date is a crucial factor for estimating crop production[125]. However, the selection of appropriate sowing dates has been a longstanding challenge in agriculture under variable climate and other associated environmental constraints. While too early sowing may expose the crop to weather extremes like damage by frost during emergence in certain climatic conditions, too much delay in sowing may result in the occurrence of high temperatures and heat stress effects during reproductive stages[136,137]. The Gregorian calendar has customarily been used to monitor crop development[102]. In traditional field experiments, current weather and soil conditions can be used to find the optimum sowing date for crop cultivation, but it is not always possible to predict the futuristic sowing window to tackle the impacts of climate change. In such cases, the crop simulation models could play an important role in helping forecast appropriate sowing dates for specific crops/genotypes[137]. The range of optimum sowing dates is estimated from location and crop-specific field experiments that were performed systematically for a limited period using local varieties in a particular location. Further, crop simulation models can be extrapolated to other locations and environments[136]. Despite these efforts, the responses of yield of some specific grain crops e.g., wheat to different sowing dates rely on seasonal weather variability across the locations and years.
In this perspective, the crop simulation models that are evaluated with local experimental data could be a treasured tool for inferring the experimental results in other time scales (years) and locations[138]. Likewise, crop simulation models are used to explore the performance of different cultivars during different dates of sowing under varying soil conditions and climate scenarios[139−141]. Inferring the results from a limited number of environments in which the experimental data are not considered may not only be challenging but also misleading[102,136,141]. A comparison of simulation results with experimental data to identify the optimal sowing date of wheat for Mediterranean regions emphasized the importance of verifying the measured phenology and specifically, the observed anthesis dates for evaluating the general performance of the model instead of a single value per cultivar regardless of the sowing date. The use of a specific phyllochron for each sowing date as generally done in APSIM simulation, enhanced the anthesis predictions and other features of the model[139]. When crop simulation models integrate with web-based decision-support tools, high-performance computing (HPC), and Internet-of-Things (IoT), can be more effective in providing decision-support tools that syndicate freely accessible information into a user-friendly interface, such that real-time assessment of soil, plant, and weather information is made possible (Fig. 6). Monitoring of such tools before the crop-growing periods would help the farmers and breeders to minimize the effects of extreme weather events during the critical stages of crop development[138].
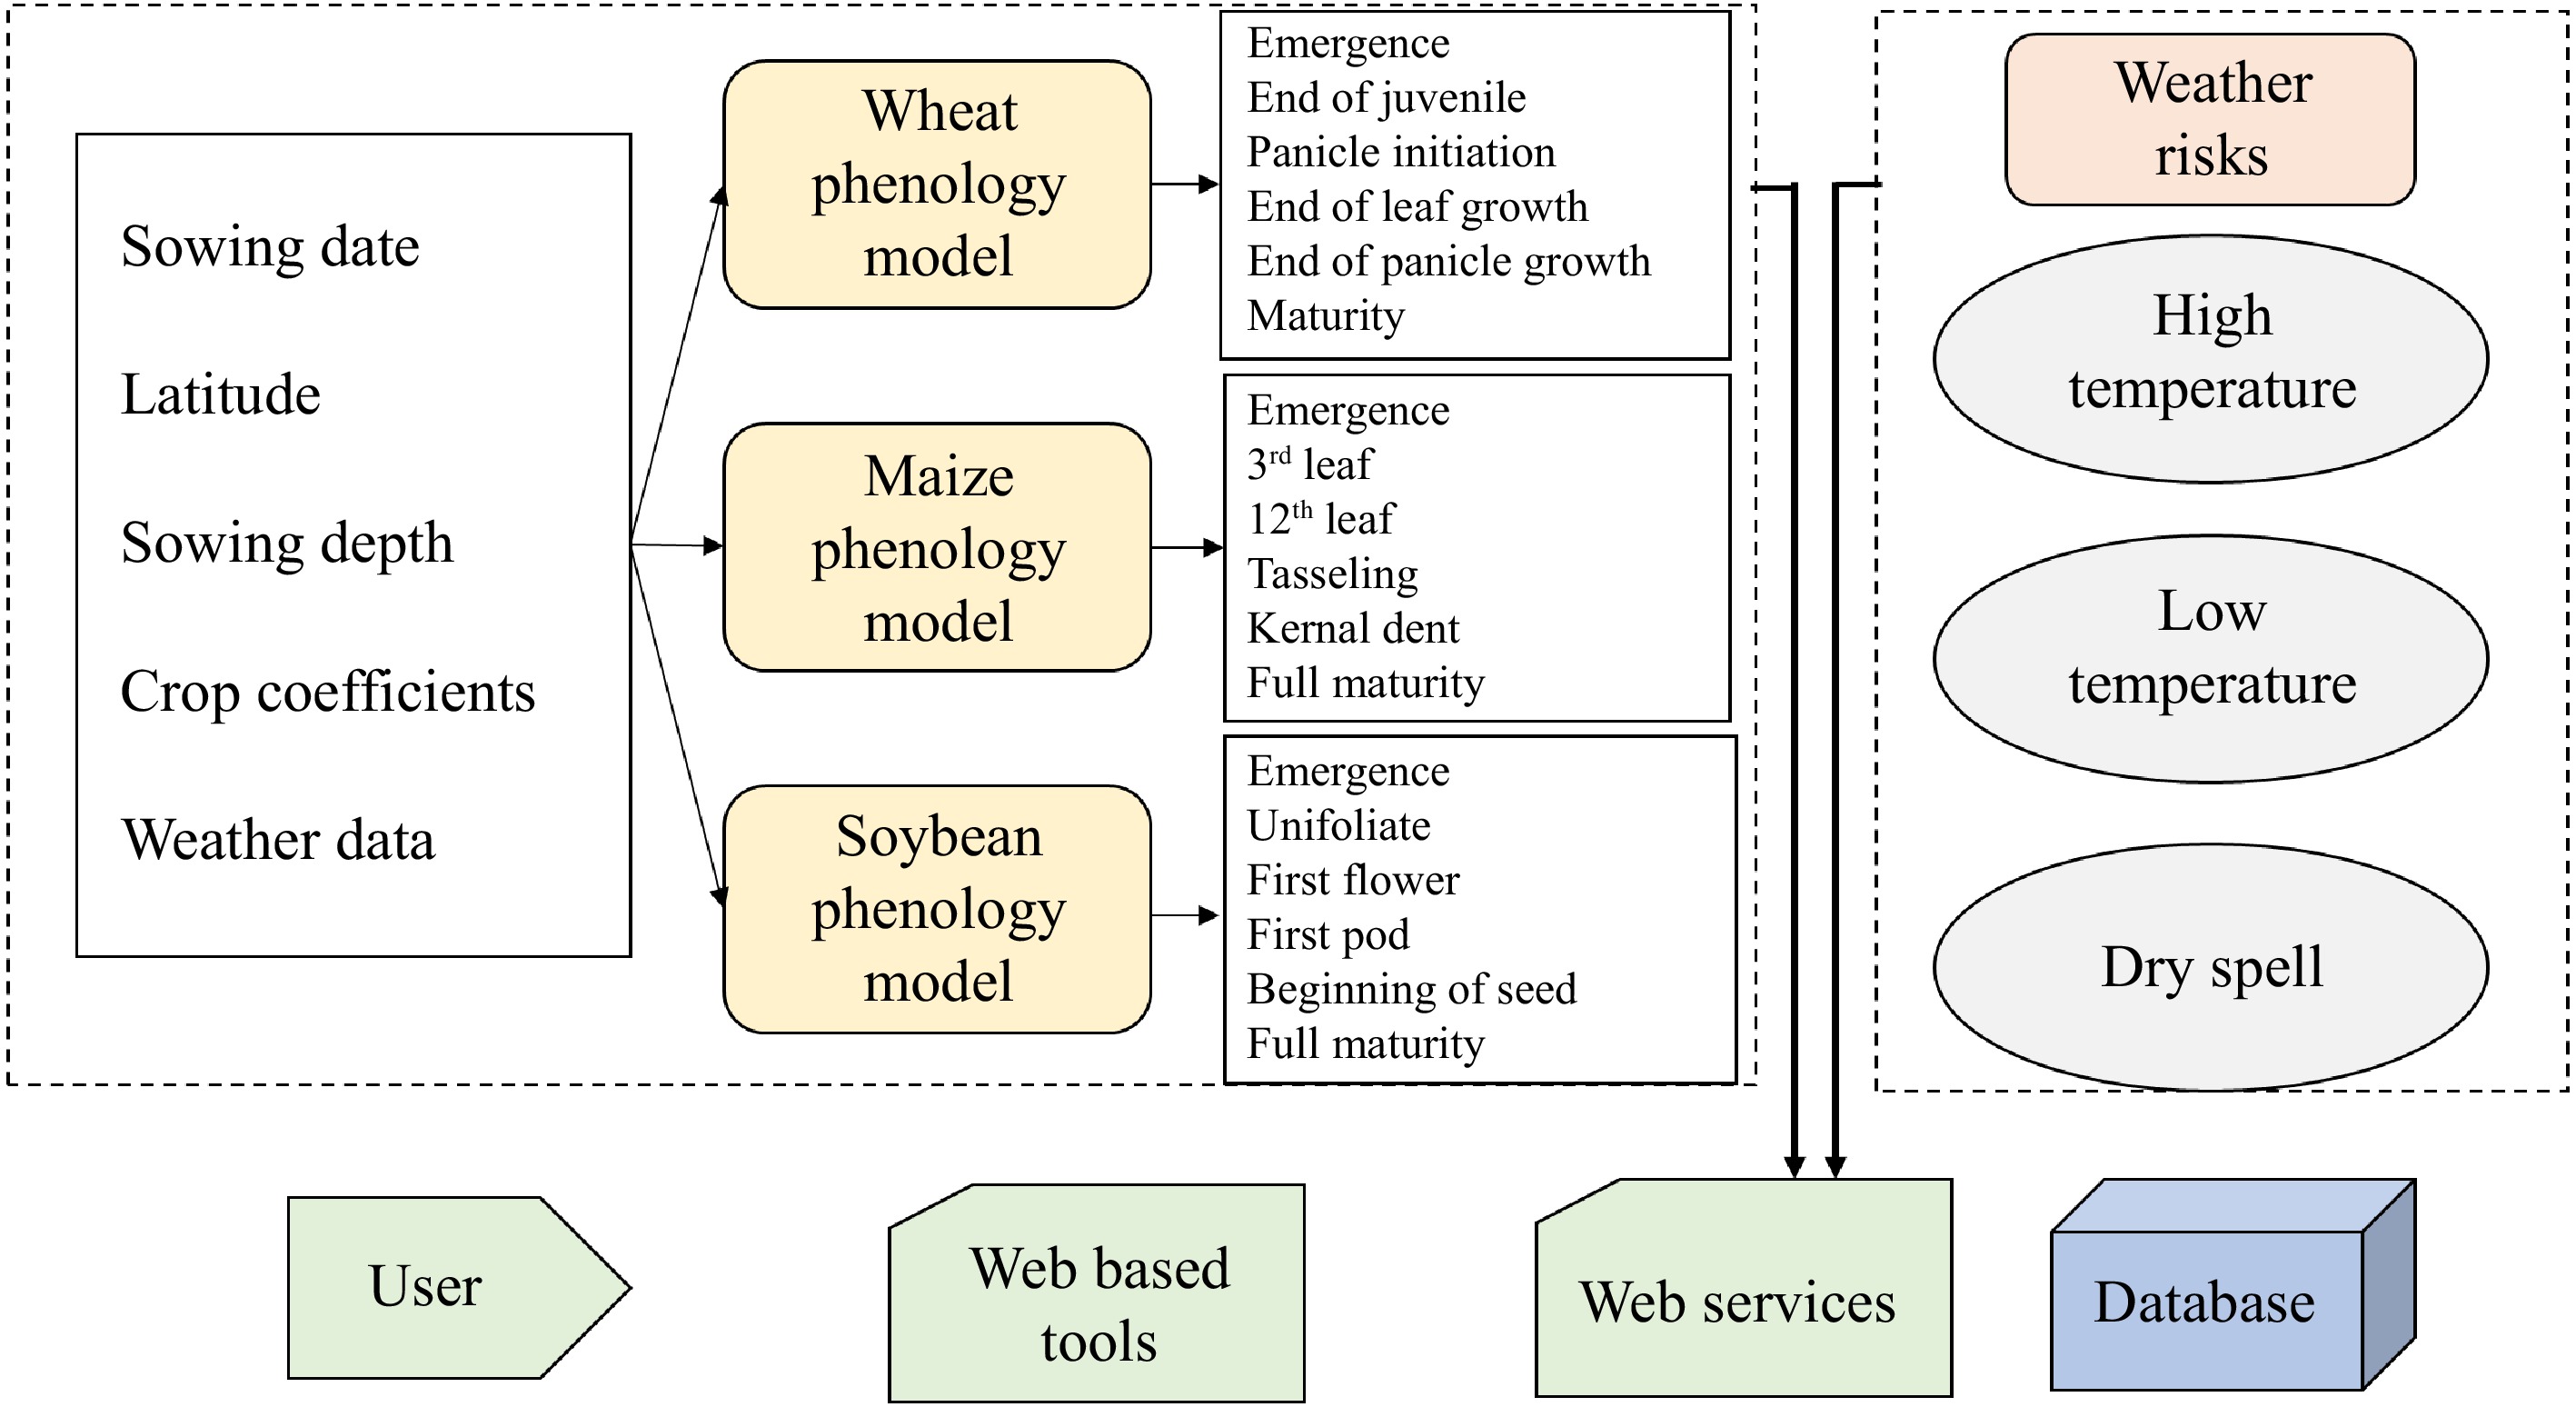
Figure 6.
The system structure for web services integrates a crop simulation model and web-based tools (adapted from Perondi et al.[138]).
-
Crop simulation modeling provides improved decision-making tools to enhance agricultural system productivity to meet the global food demand. For evaluating and forecasting crop growth and yield, a variety of models, including statistical, mechanistic, deterministic, stochastic, dynamic, static, and simulations are used. A particularly useful tool for estimating the effects of climate change on crop growth and production is the crop growth model. These models may be used for a variety of real-world agricultural issues. Globally valid simulation models must be created, and enough human resource capability must be enhanced. Independent model creation and its use can help identify knowledge gaps as a research tool, enabling more effective and targeted study planning. Models that are based on reliable physiological data can extrapolate to other cropping cycles and locales, allowing for the measurement of temporal and spatial variability.
However, producing locally appropriate and climate-informed crop simulation model outputs throughout a range of time frames, from seasonal to future climate change, is difficult. Effective adaptation strategies must be devised to create resilient and sustainable agricultural systems in the face of climate change and other associated increasing environmental constraints. To achieve this, a cross-scale and cross-disciplinary approach will be necessary. The outcomes of such measurements should be validated based on regional socio-cultural and agroecological circumstances. Agricultural adaptation methods, such as livelihood adjustments and farm management practices, should be suitable.
Sometimes, the lack of seasonal input data for crop simulation modeling serves as a hindrance to crop research advancements. While accurate input data for crop models are the most important component, it may be possible to get useful information about how and where crops should be planted in certain regions and to lower the margin of error in agronomic and field management practices. The appropriate tools and use of diverse data collection techniques may illustrate how gaps in our understanding of data gathering could be filled, assuring and enabling a more effective and targeted study design. The measurement of temporal and geographical variability is made possible by the extension of simulation results to alternative cropping cycles and locations when the appropriate climatic, agronomic, soil, and crop physiological data are employed. Because data are often unavailable and/or not available in the proper format, validation of crop models is often difficult to establish. Many researchers are concerned about this issue. Due to the complexity of the models, a lack of high-quality data, a lack of model testing, and the unavoidable errors that result from such testing, many academics are hesitant to engage in research involving crop simulation. Given the availability of meteorological data and crop calendar information, region-specific phenology parameters are frequently simple to predict. However, for characteristics relating to management and production, correction variables, such as planting density, fertilizer application, weeding, water management techniques, and information on their area specifics are typically lacking.
The present review offers a multitude of useful methodical tools and information on crop model parameters including cultivar features, management practices, and environmental variables common in a certain location by using currently available data sets from multiple sources to optimize simulation parameters. The various crop simulation models, their advantages, limitations, and applications in agriculture are discussed. The potential developments in crop simulation models in light of the rapidly developing technologies in agriculture are also discussed. The methods that concurrently integrate soil, plant, and climatic aspects in evaluating crop demand for projecting gain yield and future demands including crop simulation techniques are discussed. Crop simulation models for better agricultural decision-making will undoubtedly benefit from the use of remote sensing and geographic information systems. The availability of high-resolution satellite and/or low-altitude unmanned aerial vehicles (UAVs) data will aid crop models for better evaluation and forecasting. The adaptive and heuristic-based algorithm used in computational intelligence will help resolve difficult agricultural problems like crop management optimization.
Additionally, the potential of calibrating crop models for agricultural simulation utilizing a variety of data sources are emphasized, hence enabling calibration, validation, and simulation with crop models. It is therefore appropriate to test and compile the methodology for a variety of vegetables, field and fodder crops, orchards, etc. Further, it is recognized that more study has to be done to make it simpler to use the parameters that allow one crop model to be uploaded into databases, downloaded, and reformatted for use in another model. The problem areas related to several climates and hydro-meteorological modeling issues are discussed including parameter estimation, the temporal and spatial scale of application, validation, climate-scenario generation, data, and modeling tools, which will be addressed in part by addressing the aforementioned issues.
Finally, we conclude by stating that we have the possibilities and capabilities to integrate the best practices of decision supported by crop simulation and optimization to bridge the gap between research and practical implications of agricultural systems. In the future, it is anticipated that crop simulation models as a decision support tool will be the key to answering many complex questions related to agricultural systems productivity and sustainability.
-
The authors confirm contribution to the paper as follows: study conception and design: study conceptualization: Banerjee K, Dutta S, Das S; methodology and investigation: Banerjee K, Das S; visualization: Das S, Sadhukhan R; literature search, analysis: Banerjee K; supervision, resources, writing - review & editing: Das S; writing - original draft: Banerjee K, Das S, Sadhukhan R. All authors reviewed the results and approved the final version of the manuscript.
-
Data sharing not applicable to this article as no datasets were generated or analyzed during the current study.
-
The corresponding author would like to extend his sincere thanks to all the co-authors who contributed to preparing the manuscript.
-
The authors declare that they have no conflict of interest.
- Copyright: © 2025 by the author(s). Published by Maximum Academic Press, Fayetteville, GA. This article is an open access article distributed under Creative Commons Attribution License (CC BY 4.0), visit https://creativecommons.org/licenses/by/4.0/.
-
About this article
Cite this article
Banerjee K, Dutta S, Das S, Sadhukhan R. 2025. Crop simulation models as decision tools to enhance agricultural system productivity and sustainability – a critical review. Technology in Agronomy 5: e002 doi: 10.48130/tia-0024-0032 

Crop simulation models as decision tools to enhance agricultural system productivity and sustainability – a critical review
- Received: 02 August 2024
- Revised: 12 November 2024
- Accepted: 26 November 2024
- Published online: 06 January 2025
Abstract: Feeding the growing global population necessitates increased agricultural production, yet agriculture remains a vulnerable sector facing significant challenges from limited land resources, environment, and climatic constraints. To enhance agricultural productivity and farm profitability, it is crucial to quantify the interactions among soil, plant growth, environmental factors, and management practices. This aids policymakers and farmers in making informed decisions to mitigate risks associated with agricultural productivity. The advent of BIG-DATA in agriculture and various crop simulation modeling approaches at multiple spatiotemporal scales offers valuable insights into seasonal and in-field soil-crop variability, enabling accurate crop yield, and quality estimation. Agricultural models serve as essential tools for management and planning, facilitating the adaptation of new technologies to site-specific factors such as climate, soils, and cropping patterns. Despite their importance, there is a lack of comprehensive understanding regarding the principles, utility, and challenges of these crop models. This review critically evaluates the utility, simulation processes, datasets, predictability, advantages, and disadvantages of diverse crop simulation modeling approaches. It examines the current state-of-the-art agricultural systems models and their implications for crop management, growth forecasting, nutrient management, and yield prediction, highlighting complex interactions between agro-meteorology, soil, and crops across different scales. Furthermore, it addresses future challenges for agricultural system models in the context of climate change and environmental shifts, underscoring the necessity for additional research. The emergence of BIG-DATA and high-performance computing in agricultural simulation modeling presents new challenges that demand innovative solutions to improve forecasting and mitigate production risks caused by environmental constraints and associated stresses.