


-
Tea-oil Camellia refers to a group of plants within the Camellia genus of the Theaceae family, known for their high oil content in their fruits and their cultivation value[1]. Tea oil is rich in unsaturated fatty acids, comprising up to around 90%, which is higher than olive oil[2]. This makes it a premium edible oil with significant health and medicinal benefits. Besides that, it is collectively referred to as one of the world's four major woody oil crops, along with Elaeis guineensis, Olea europaea and Cocos nucifera[3]. In China, approximately 30 species within the Camellia genus are all referred to as tea-oil Camellia[4]. Due to its strong adaptability, long growth cycle, tolerance to infertile soils, suitability for cultivation in mountainous and hilly areas, tea-oil Camellia is a key woody oil crop actively promoted in China[5]. Currently, the cultivation area of tea-oil Camellia in China is approximately 5.3 million hectares. C. oleifera, followed by C. meiocarpa, represents the majority of this cultivation, primarily in the southern provinces such as Hunan, Jiangxi, Guangxi, Guangdong, Zhejiang and Fujian. In addition, Wang et al. found that C. oleifera and C. meiocarpa are distributed in the tropical regions of China (within Wuzhishan in Hainan, China)[6].
Due to the complexity of nuclear genomes, diverse ploidy levels, rich phenotypic variations, and the presence of interspecific hybridization, the phylogeny within Tea-oil Camellia presents significant challenges. To clarify the relationships among them, scholars have employed morphological and molecular classification methods to conduct phylogenetic analysis of tea-oil Camellia species[7−11]. However, the phylogenetic relationships among tea-oil Camellia remain controversial, for example, the relationships between C. meiocarpa and C. oleifera. Initially identified by Mr. Xiansu Hu, C. meiocarpa was considered as a separated species[12]. In the Taxonomy of Chang system, it was considered a variant of C. oleifera, and named C. oleifera var. monosperma[13]. But in the Taxonomy of Ming system[14] and Flora of China[15], C. meiocarpa was merely a cultivated species of C. oleifera, not a distinct taxonomic species. It shares many fundamental characteristics with C. oleifer, such as branches, leaves, flowers, and fruits, with the primary distinction being the smaller size of these features in C. meiocarpa. Moreover, Yao & Huang used microsatellite molecular markers to analyze the difference between C. oleifera and C. meiocarpa and indicated that there was low genetic differentiation between these two species, suggesting that frequent interspecific hybridization and gene introgression blur their low genetic distinctions, supporting the notion that C. meiocarpa is a variant of C. oleifera[16]. However, most producers and researchers still consider C. meiocarpa to have a significant difference in morphology and oil quality, compared to C. oleifera, affirming its status as a distinct species. These controversies have created inconveniences for the breeding and production of tea-oil Camellia. Moreover, the Camellia oil from C. meiocarpa is nutritionally superior to that from C. oleifera, and shoddy goods are often overdue[17]. The strategies of developing DNA markers can differentiate them effectively, based on comparative genomes[18].
The chloroplast genome is notably conserved and its uniparental (maternal) inheritance has been extensively utilized in classification and phylogenetic studies[19−22]. Its lack of recombination and maternal transmission render it an invaluable tool for tracing the phylogenetic relationships among the complexity of nuclear genomes[23−25]. Unlike limited genomic segments, the chloroplast genome contains a vast repository of genetic data, providing abundant variation loci information for the study of phylogeny and taxonomy[26]. Currently, despite their significance, there have been no reports on the chloroplast genome of C. meiocarpa, nor has there been a comparative chloroplast genomic analysis conducted between C. oleifera and C. meiocarpa[27−30].
In this study, we report the complete chloroplast genome sequences of C. oleifera and C. meiocarpa, and compared them with other tea-oil Camellia chloroplast genomes. Our objectives were to: 1) reconstruct the phylogenetic relationship between C. meiocarpa and C. oleifera; and 2) develop molecular markers to test the polymorphism within these species. The results are expected to provide a theoretical foundation for variety identification, breeding, and resource utilization.
-
Fresh leaves of C. oleifera (HZP) were collected from Tianyang in Guangxi province (107.073836° E, 24.007963° N, 554 m). In C. meiocarpa, XG was collected from Sanjiang in Guangxi province (109.422086° E, 25.710639° N, 139 m,) and CKX was from the germplasm garden of the Guangxi Forestry Research Institute. Quickly frozen in liquid nitrogen, and stored at ultra-low-temperature refrigerator at −80 °C until use. Total DNA extraction was carried out using the modified CTAB method[31]. Following the protocol provided by Illumina (San Diego, CA, USA), double-stranded (PE) libraries were constructed using sheared low-molecular-weight DNA fragments. The complete chloroplast genomes of the aforementioned materials were sequenced on the Illumina NovaSeq platform using the PE150 sequencing strategy and a 350 bp insert size.
Assembly and annotation
-
The raw reads were filtered for adapter sequences and low-quality reads using the NGSQC Toolkit software (v2.3.3) to obtain high-quality reads[32]. The chloroplast genome was assembled using SPAdes software v3.14[33], and annotation was performed using cpGAVAS2 with manual correction[34]. Subsequently, the sequencing reads were mapped to the reference genome C. luteoflora to validate the assembly results.
Comparative analysis of the chloroplast genomes
-
The eight tea-oil Camellia species from GeneBank (Supplemental Table S1) were used to perform the comparative analysis. mVISTA program (
https://genome.lbl.gov/vista/mvista/submit.shtml ) was used to visualize the chloroplast genome in Shuffle-LAGAN mode with C. luteoflora as a reference. Moreover, we compared events of IR expansion and contraction among these accessions, analyzing the junction regions between the IR, SSC, and LSC using the online tool CPjsdraw (https://github.com/xul962464/CPJSdraw ).To identify the mutational hotspot regions for HZP, XG and CKX, nucleotide diversity (Pi) was calculated using DnaSP v5[35]. MAFFT was employed for the alignment of the chloroplast genomes to identify the mutations[36].
Identification of sequence repeats
-
In the chloroplast genomes of HZP, XG, and CKX, the REPuter[37] software was used to assess and pinpoint forward (F), reverse (R), complemented (C), and palindromic (P) repeats. The repeat identification utilized the following settings: (1) a Hamming distance equal to 3; (2) a minimal repeat size set to 30 bp; (3) a sequence identity of 90% or greater. Simple Sequence Repeats (SSR) loci were identified using MISA[38], with the minimal repeat number set to 10, 6, 5, 5, 5, 5 for mononucleotide (mono-), dinucleotide (di-), trinucleotide (tri-), tetranucleotide (tetra-), pentanucleotide (penta-), and hexanucleotide (hexa-) nucleotide sequences, respectively.
Phylogenetic analysis
-
Phylogenetic analysis was carried out by utilizing the complete chloroplast genome sequences of HZP, XG, CKX, and other 26 Camellia species with one Polyspora species serving as outgroups (Supplemental Table S2). The nucleotide sequences were aligned using MAFFT version 7 software[39]. ModelFinder[40] was employed to determine the best-fit model with default settings, and the maximum likelihood (ML) analysis was conducted using RAxML[41] with 1,000 bootstrap replications. The Maximum Parsimony (MP) trees were inferred in MEGA7 with default parameters[42]. MrBayes v3.2.7 was used to infer the BI (Bayesian Inference) tree with Markov Chain Monte Carlo (MCMC) method[43]. One million generations and sample every 100 generations. The initial 25% of the phylogenetic tree was removed (burn-in), and the majority-rule consensus tree was finally obtained.
Development and validation of molecular markers
-
Based on SNPs and Indels in the chloroplast genome, polymorphic markers were designed to identify the difference of C. oleifera and C. meiocarpa. The PCR reaction had a total volume of 25 µL, consisting of 12.5 µL 2 × PCR Mix, 1 µL forward and reverse primers (10 pM each), 1 µL genomic DNA, and 9.5 µL ddH2O. The thermal cycling included an initial denaturation at 94 °C for 4 min, followed by 35 cycles of denaturation at 94 °C for 30 s, annealing temperature reference by 50−58 °C for 30 s, extension at 72 °C for 30 s, and a final extension at 72 °C for 7 min. The PCR products were sequenced for further verification. Based on the principle of improving detection efficiency and reducing sequencing costs, the size of sequences less than 800 bp were used for the Single-read sequencing, and paired-end sequencing for the sequences which were more than 800 bp in size.
-
The results (Table 1; Fig. 1) showed that the chloroplast genomes of C. meiocarpa (XG), C. meiocarpa (CKX) and C. oleifera (HZP) had a typical circular tetramerous structure like other related plants[44,45]. The genome sizes were 156,512 bp for XG and 156,549 bp for CKX, differing by only 37 bp between them. Compared to C. oleifera (157,009 bp, HZP), there were differences ranging between 460 and 490 bp. The three chloroplast genomes are divided into four distinctive regions: the LSC (86,263 bp in CKX, 86,224 bp in XG, and 86,637 bp in HZP), SSC (18,400 bp in CKX, 18,402 bp in XG, and 86,637 bp in HZP) and two IRs (25,943 bp in CKX, 25,943 bp in XG, and 26,041 bp in HZP). The overall GC content was nearly identical across the genomes: 37.32% in CKX, 37.33% in XG and 37.29% in HZP. Furthermore, the GC contents were unevenly distributed across regions of the chloroplast genome, with 35.33% in CKX, 35.34% in XG and 35.30% in HZP for the LSC; 30.58% in CKX, 30.57% in XG and 30.52% in HZP for the SSC; and 43.03% in CKX, 43.03% in XG and 42.99% in HZP for the IR regions, respectively (Table 2). These values indicated a conservative nature within the genomes of tea-oil Camellia. Additionally, each of the three genomes encoded the same set of 133 functional genes, including 87 protein-coding genes, eight rRNA genes and 37 tRNA genes. In Supplemental Table S3, a total of 18 genes were duplicated, featuring four rRNA genes (rrn16, rrn23, rrn4.5, and rrn5), two large subunit of ribosomal proteins genes (rpl2 and rpl23), seven tRNA genes (trnA-UGC, trnI-CAU, trnI-GAU, trnL-CAA, trnN-GUU, trnR-ACG, and trnV-GAC), one subunit of NADH dehydrogenes subunit gene(ndhB) and three other genes (ycf2, ycf15, and ycf1).
Table 1. Features of C. meiocarpa and C. oleifera chloroplast genomes.
Genome feature CKX XG HZP Genome size (bp) 156,549 156,512 157,009 LSC length (bp) 86,263 86,224 86,637 SSC length (bp) 18,400 18,402 18,290 IR length (bp) 25,943 25,943 26,041 Number of genes 133 133 133 Number of protien-coding genes 87 87 87 Number of pseudo 2 2 2 Number of tRNA genes 37 37 37 Number of rRNA genes 8 8 8 GC content in LSC (%) 35.33 35.34 35.30 GC content in SSC (%) 30.58 30.57 30.52 GC content in IR (%) 43.03 43.03 42.99 Total GC content (%) 37.32 37.33 37.29 GenBank number MZ151356 MZ151355 MZ151357 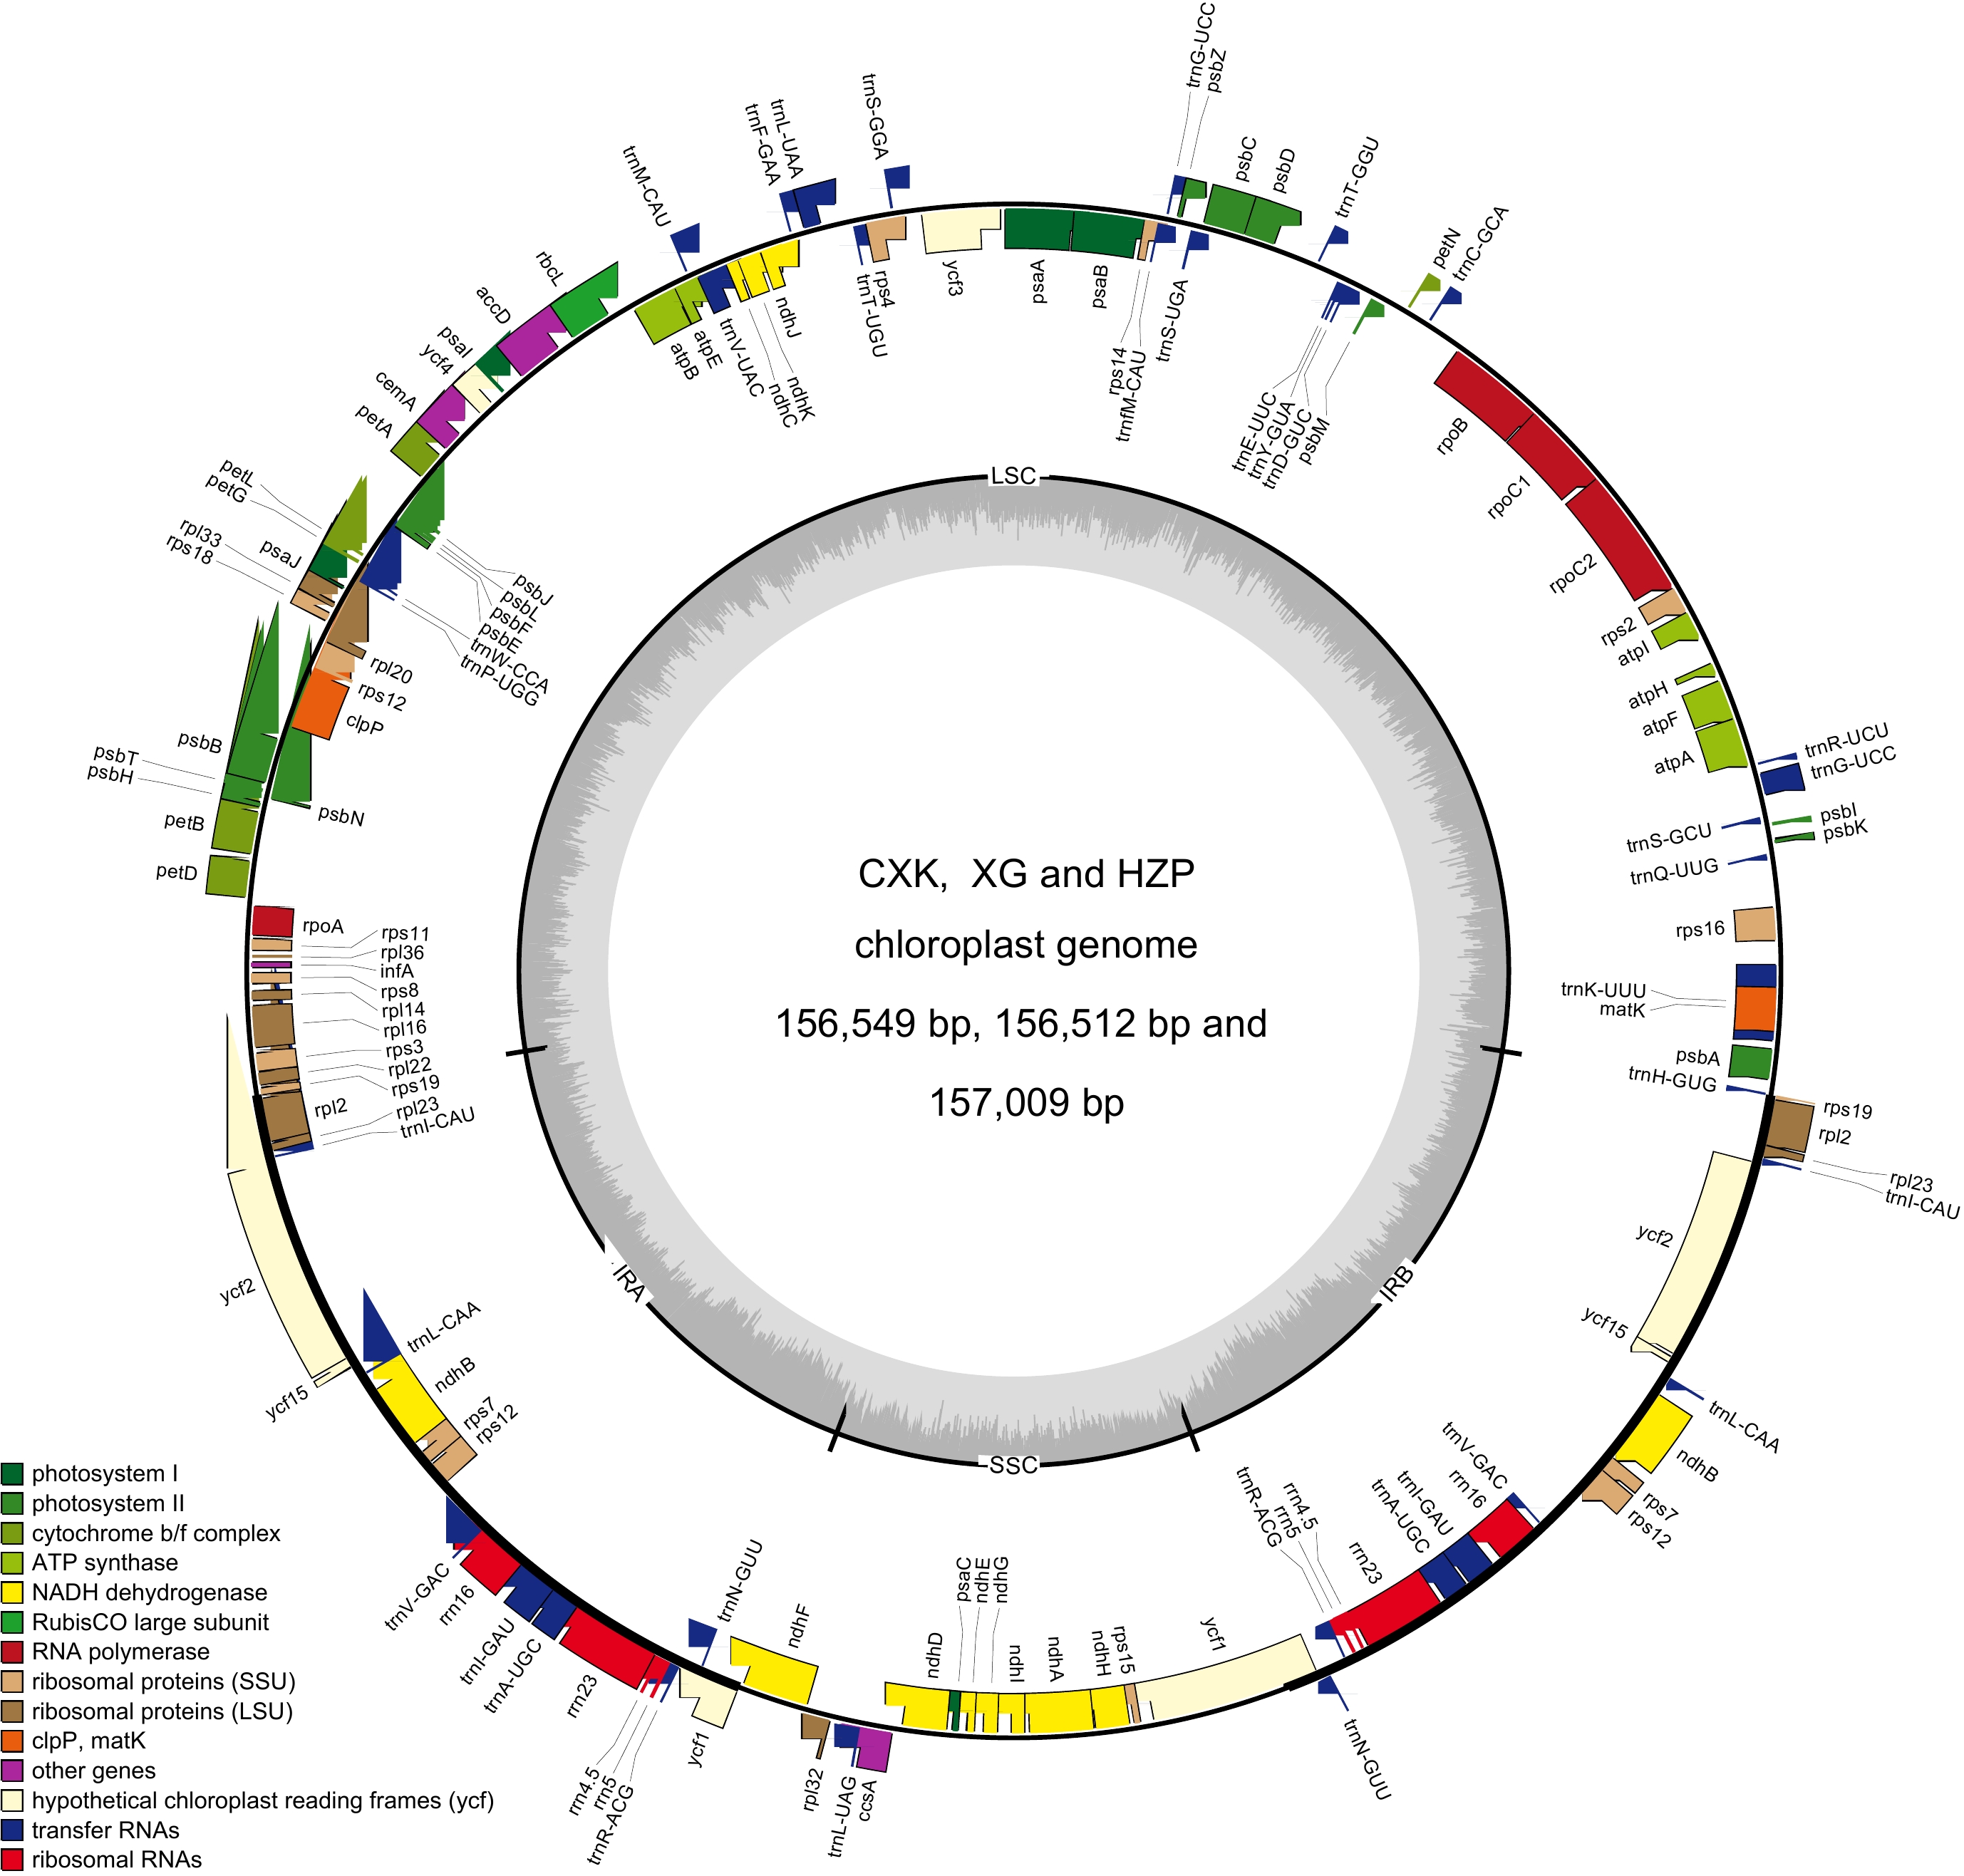
Figure 1.
Chloroplast genome map of C. meiocarpa and C. oleifera.
Table 2. Features of repetitive sequences in C. meiocarpa and C. oleifera.
ZHP XG CKX Total number 49 49 49 Forward 15 16 17 Palindrome 22 20 20 Reverse 9 9 9 Complementary 3 4 3 Gene N trnS-GCU, trnG-GCC, trnS-UGA, trnfM-CAU,
ndhC, trnV-UACa, petD, ycf2, ndhA, ycf1,
rpoC2b, rpoBc, trnA-UGCdSSR Loci (N) 52 48 49 P1 Loci (N) 51 47 49 Pc Loci (N) 1 1 0 LSC 40 35 36 IRA 2 2 2 SSC 8 9 9 IRB 2 2 2 a: special in ZHP; b, c: special in XG; d: special in CKX. Distribution of repetitive sequences in C. meiocarpa and C. oleifera
-
The REPuter software results showed that 49 scattered repetitive sequences were detected in HZP, XG, and CKX (Fig. 2a; Supplemental Table S4). In Fig. 2a, the repetitive sequences ranging from 15−19 bp were most prevalent, followed by those ranging from 20−24 bp. These two categories respectively constituted 77.55% for CKX and XG, and 75.51% for HZP. The LSC region had the highest distribution of long repetitive sequences, accounting for 59.18% in CKX, XG, and HZP. However, no repetitive sequences between 25−29 bp and 35−39 bp were observed, and the 30-34 bp sequences appeared exclusively in the LSC region. The IRA region followed in sequence distribution. Besides, the 25−29 bp and 35−39 bp repetitive sequences only be found in the IR region. We also identified four repeat types: Forward, Palindrome, Reverse, and Complementary in CKX, XG, and HZP (Table 2 & Supplemental Table S4). Among them, the palindrome type was the most common, comprising 40.82% in both CKX and XG and 44.90% in HZP, while complementary repeats were the least frequent. Some of the repetitive sequences were located in different genes, including trnS-GCU, trnG-GCC, trnS-UGA, trnfM-CAU, ndhC, trnV-UAC, petD, ycf2, ndhA, ycf1, rpoC2, rpoB, and trnA-UGC.
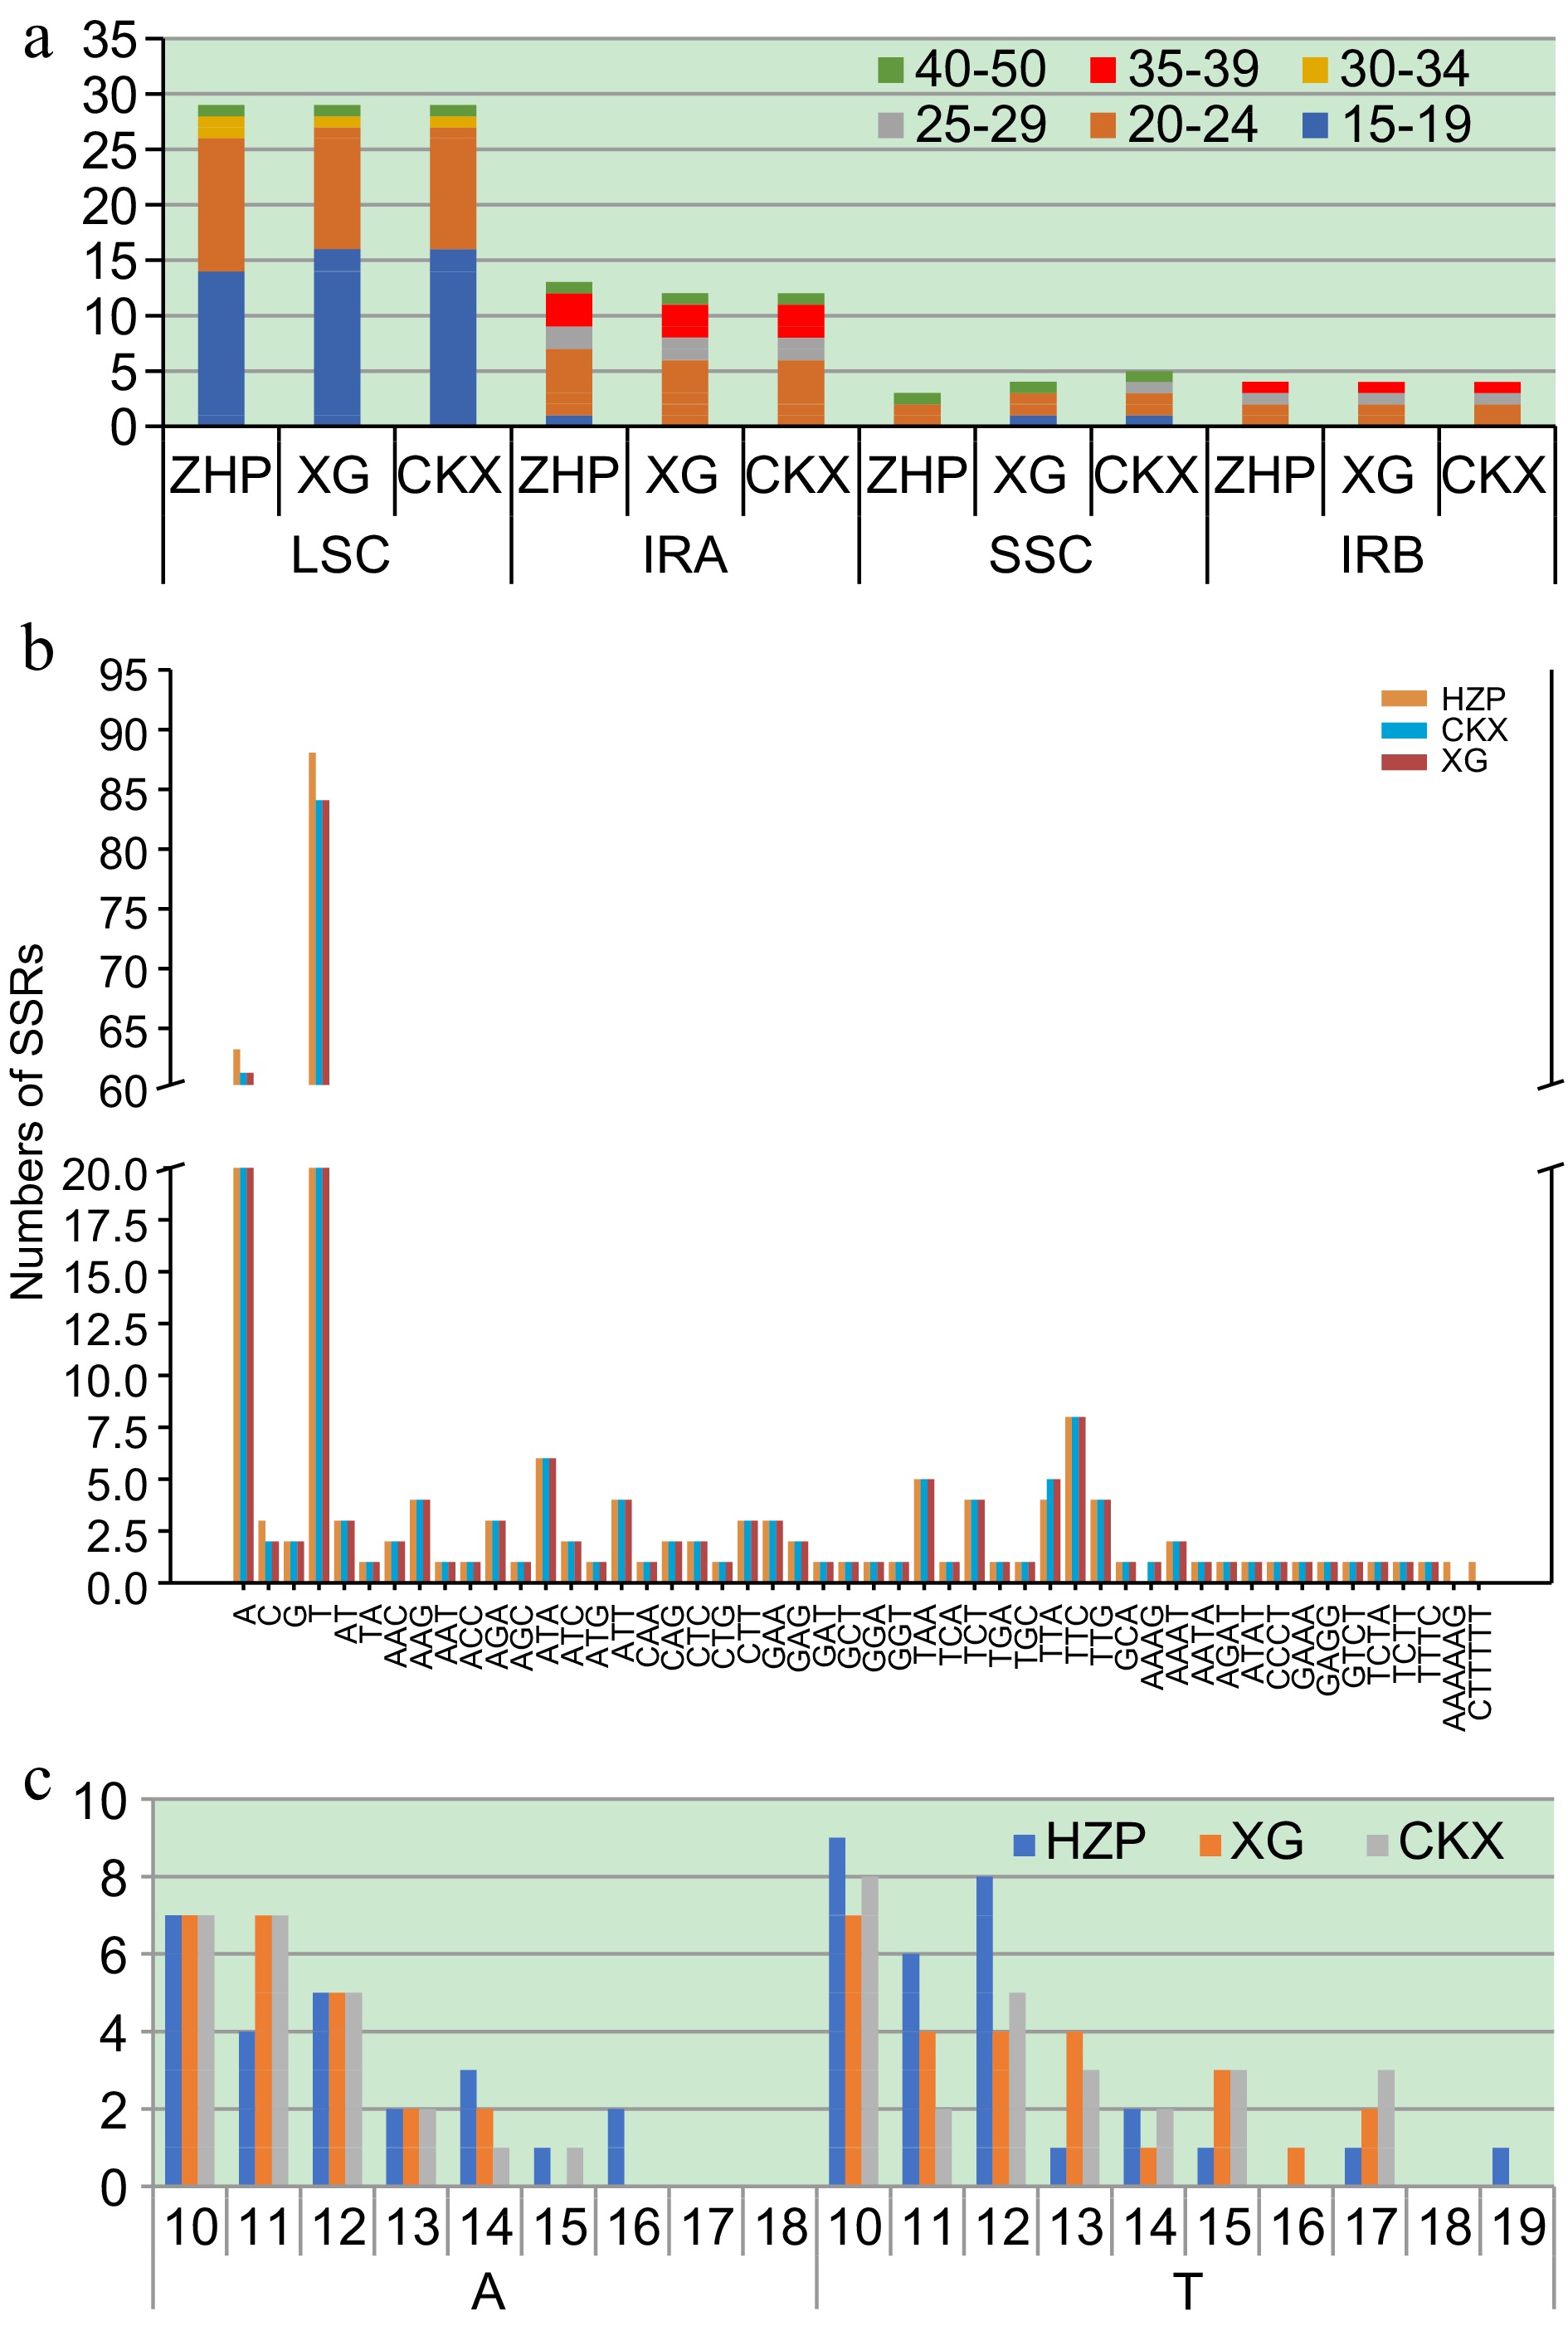
Figure 2.
Comparison of repetitive sequences in C. meiocarpa and C. oleifera. (a) Number of scattered repetitive by length in different regions. (b) The number and distribution of Simple Sequence Repeats (SSR)s. (c) Frequency of SSRs in A and T.
The number and distribution of SSRs were also identified as shown in Fig. 2b and Supplemental Table S5. In Fig. 2c, these SSRs, categorized into single-base repeats (repeating 10 or more times), double-base repeats (six or more times), and 3-6 base repeats (five or more times), were found as follows: 49 SSRs each in CKX and XG, and 53 in HZP. Predominantly, these were of the P1 type, with a single C1 type identified in both HZP and XG. The majority were located within the LSC region, representing 73.47% in CKX and XG, and 75.47% in HZP. The SSC region had fewer, with only four SSRs repeated in the IR region. All SSR loci were single-base and formed by A/T. In CK and XG, A and T accounted for 23 (46.94%) and 26 (53.06%), respectively. But in HZP, A and T accounted for 24 (45.28%) and 29 (54.72%), respectively. Notably, 10−12 single-base repeats were most predominant, with 34 in CKX and XG (69.39%), and less than 39 in HZP (73.58%). This data underscores distinct differences in the repetitive sequence patterns between HZP and the CKX/XG genomes.
IR region expansion and contraction
-
While chloroplast genomes exhibit high conservation in terms of genomic structure and size, the variations in their lengths are commonly attributed to changes in the position of the IR/SC junctions, caused by the expansion and contraction of these boundary regions[46,47]. The junction regions of the 11 tea-oil Camellia chloroplast genomes were examined for comparison. In Fig. 3, across these species, the arrangement of genes at each junction point within the IR regions remained consistent. Notably, the gene rps19 spanned the LSC/IRb region consistently with lengths of 233 bp in the LSC and 46 bp in the IRb across all species. Conversely, the gene rpl2 located in the IRb region showed contractions, with base number variations ranging from 100 to 106 bp across the species. Similarly, the gene ycf1 straddled the SSC/IRa boundary with varying lengths, 4,541 to 4,653 bp in the SSC and 963 to 1,069 bp in the IRa. The gene ndhF exhibited base contractions varying from 5 to 68 bp. Additionally, the gene trnN in the IRa region was consistently positioned 1,275−1,381bp from the SSC/IRa boundary. In particular, the distances of trnH to the SSC/IR junction were 1,275 bp for CKX and XG, and 1,381 bp for HZP, indicating that trnH is located at the edge of the LSC region, merely 1 bp from the SSC/IRa boundary. This analysis highlights that the variations in the expansion and contraction of the IR regions are more pronounced between HZP and CKX (or XG) than between CKX and XG, illustrate distinct genomic adaptations among these tea-oil Camellia species.
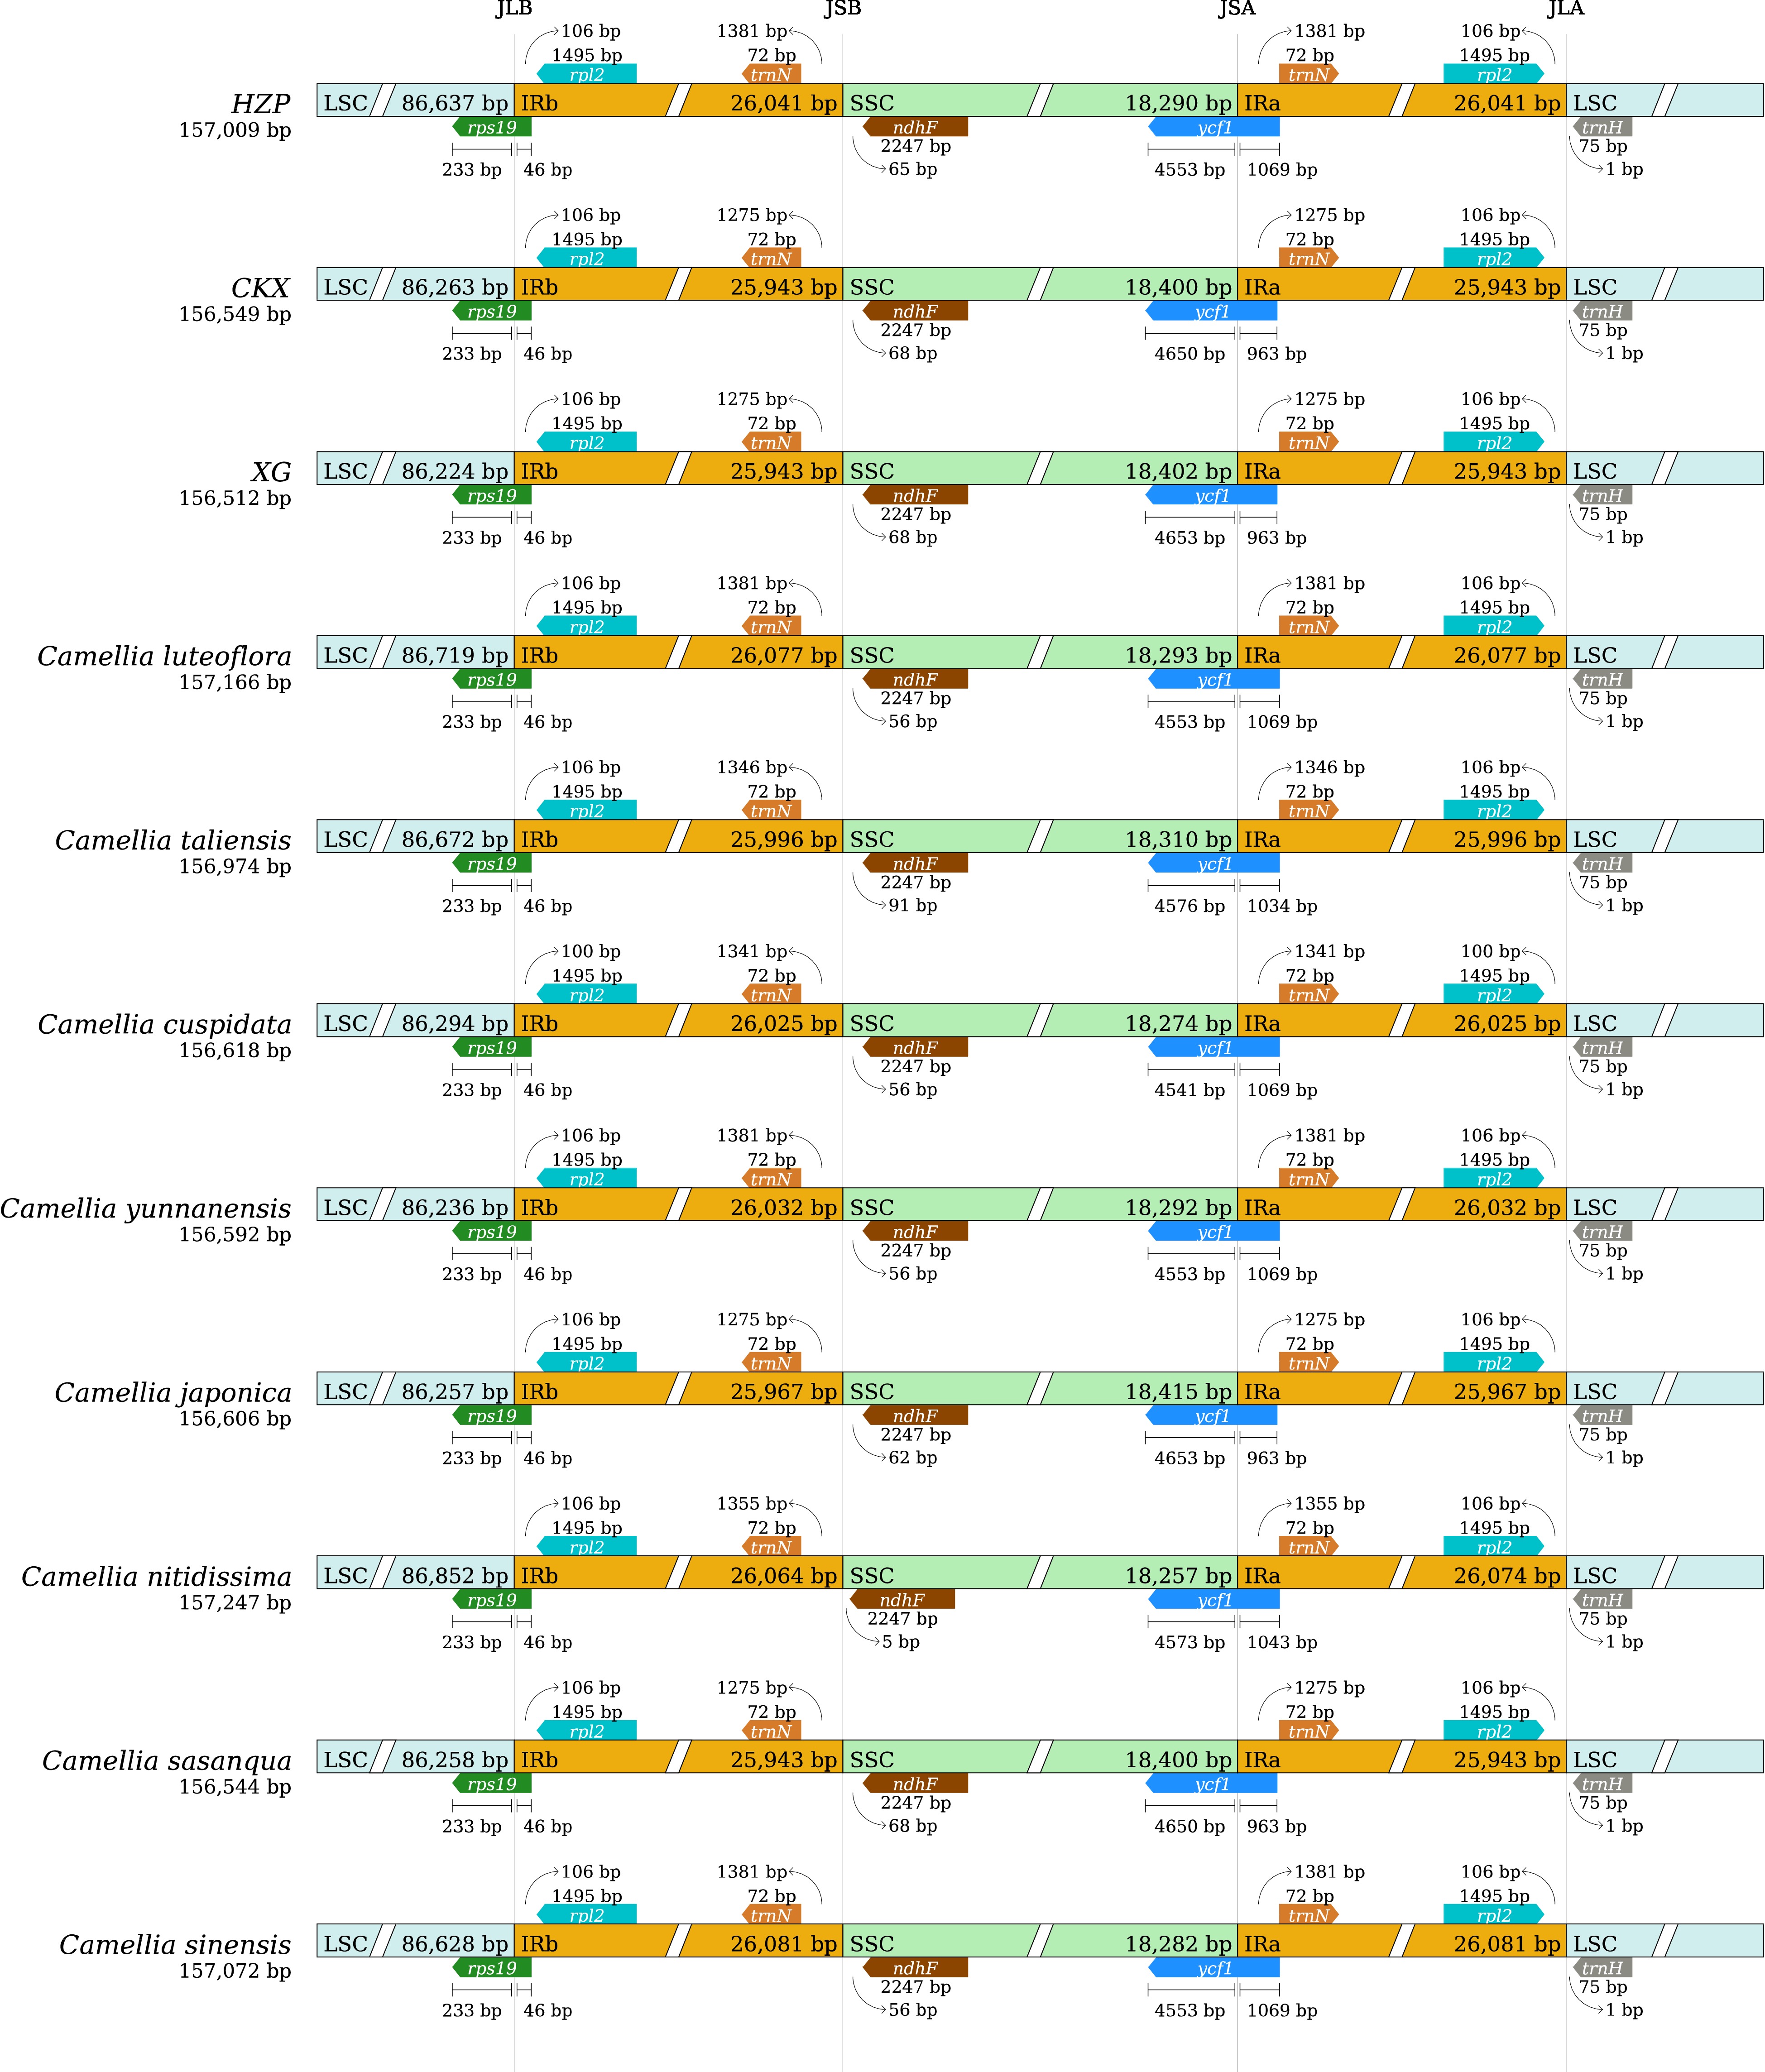
Figure 3.
Comparison of the Large single copy (LSC), Inverted repeat (IR), Small single copy (SSC) junction positions among 11 tea-oil Camellia species.
Comparative analysis of genome structure
-
To explore the interspecific variation in chloroplast genome sequences, the identity percentage was graphically represented for the 11 tea-oil Camellia accessions utilizing the mVISTA program with C. luteoflora as the reference. In Fig. 4, the divergence in the SSC region compared to the LSC and IR regions, with non-coding regions exhibiting greater divergence than coding regions. The overall alignment revealed a high degree of sequence similarity among the species. Compared to HZP, the variation of the chloroplast genome between CKX and XG was closer. To further understand the variation between C. meiocarpa (CKX and XG) and C. oleifera (HZP), we calculated nucleotide diversity (Pi) values within them. The results showed (Fig. 5a; Supplemental Table S6) that Pi values were low (ranging from 0 to 0.011, average value was 0.0006). Specifically, the SSC region indicated the highest level of variation (average Pi value of 0.00142), followed by LSC (average Pi value of 0.00060), and the lowest was in IRB (average Pi value of 0.00013). The ycf1 had the most mutation sites (72, with an average Pi value of 0.00294), and psbM had the highest level of average Pi. Interestingly, 50 genes exhibited zero nucleotide diversity (Fig. 5b; Supplemental Table S6). Furthermore, we also detected 210 variants, including 72 Indel sites and 138 SNP sites among the three chloroplast genomes (Table 3; Supplemental Table S7). Most Indels were 1 bp in length, constituting 38.89% of all Indel sites, followed by 2 bp lengths at 16.67%, and a single occurrence of a 9 bp Indel. Among the SNPs, transition from G to A were most frequent (26.09%), followed by C to T changes (23.19%), with C to G being the least common (3.62%). The majority of these variations occurred in intergenic regions (118 sites), with significant occurrences also noted in 21 genes, such as accD, atpB, atpF, ccsA, clpP, infA, matK, ndhA and ycf1 et al. In statistics, a total of 140 Indel and SNP sites were located in LSC, 49 sites in SSC, 13 sites in IRA and eight sites in IRB. The gene ycf1 had the highest number of variants (22), while the intergenic region between trnE-UUC and trnT-GGU, along with petN-psbM, contained the most variant sites. These findings underscore the genomic organizational differences and the variability between C. oleifera (HZP) and C. meiocarpa (CKX or XG), highlighting distinct evolutionary trajectories within these species.
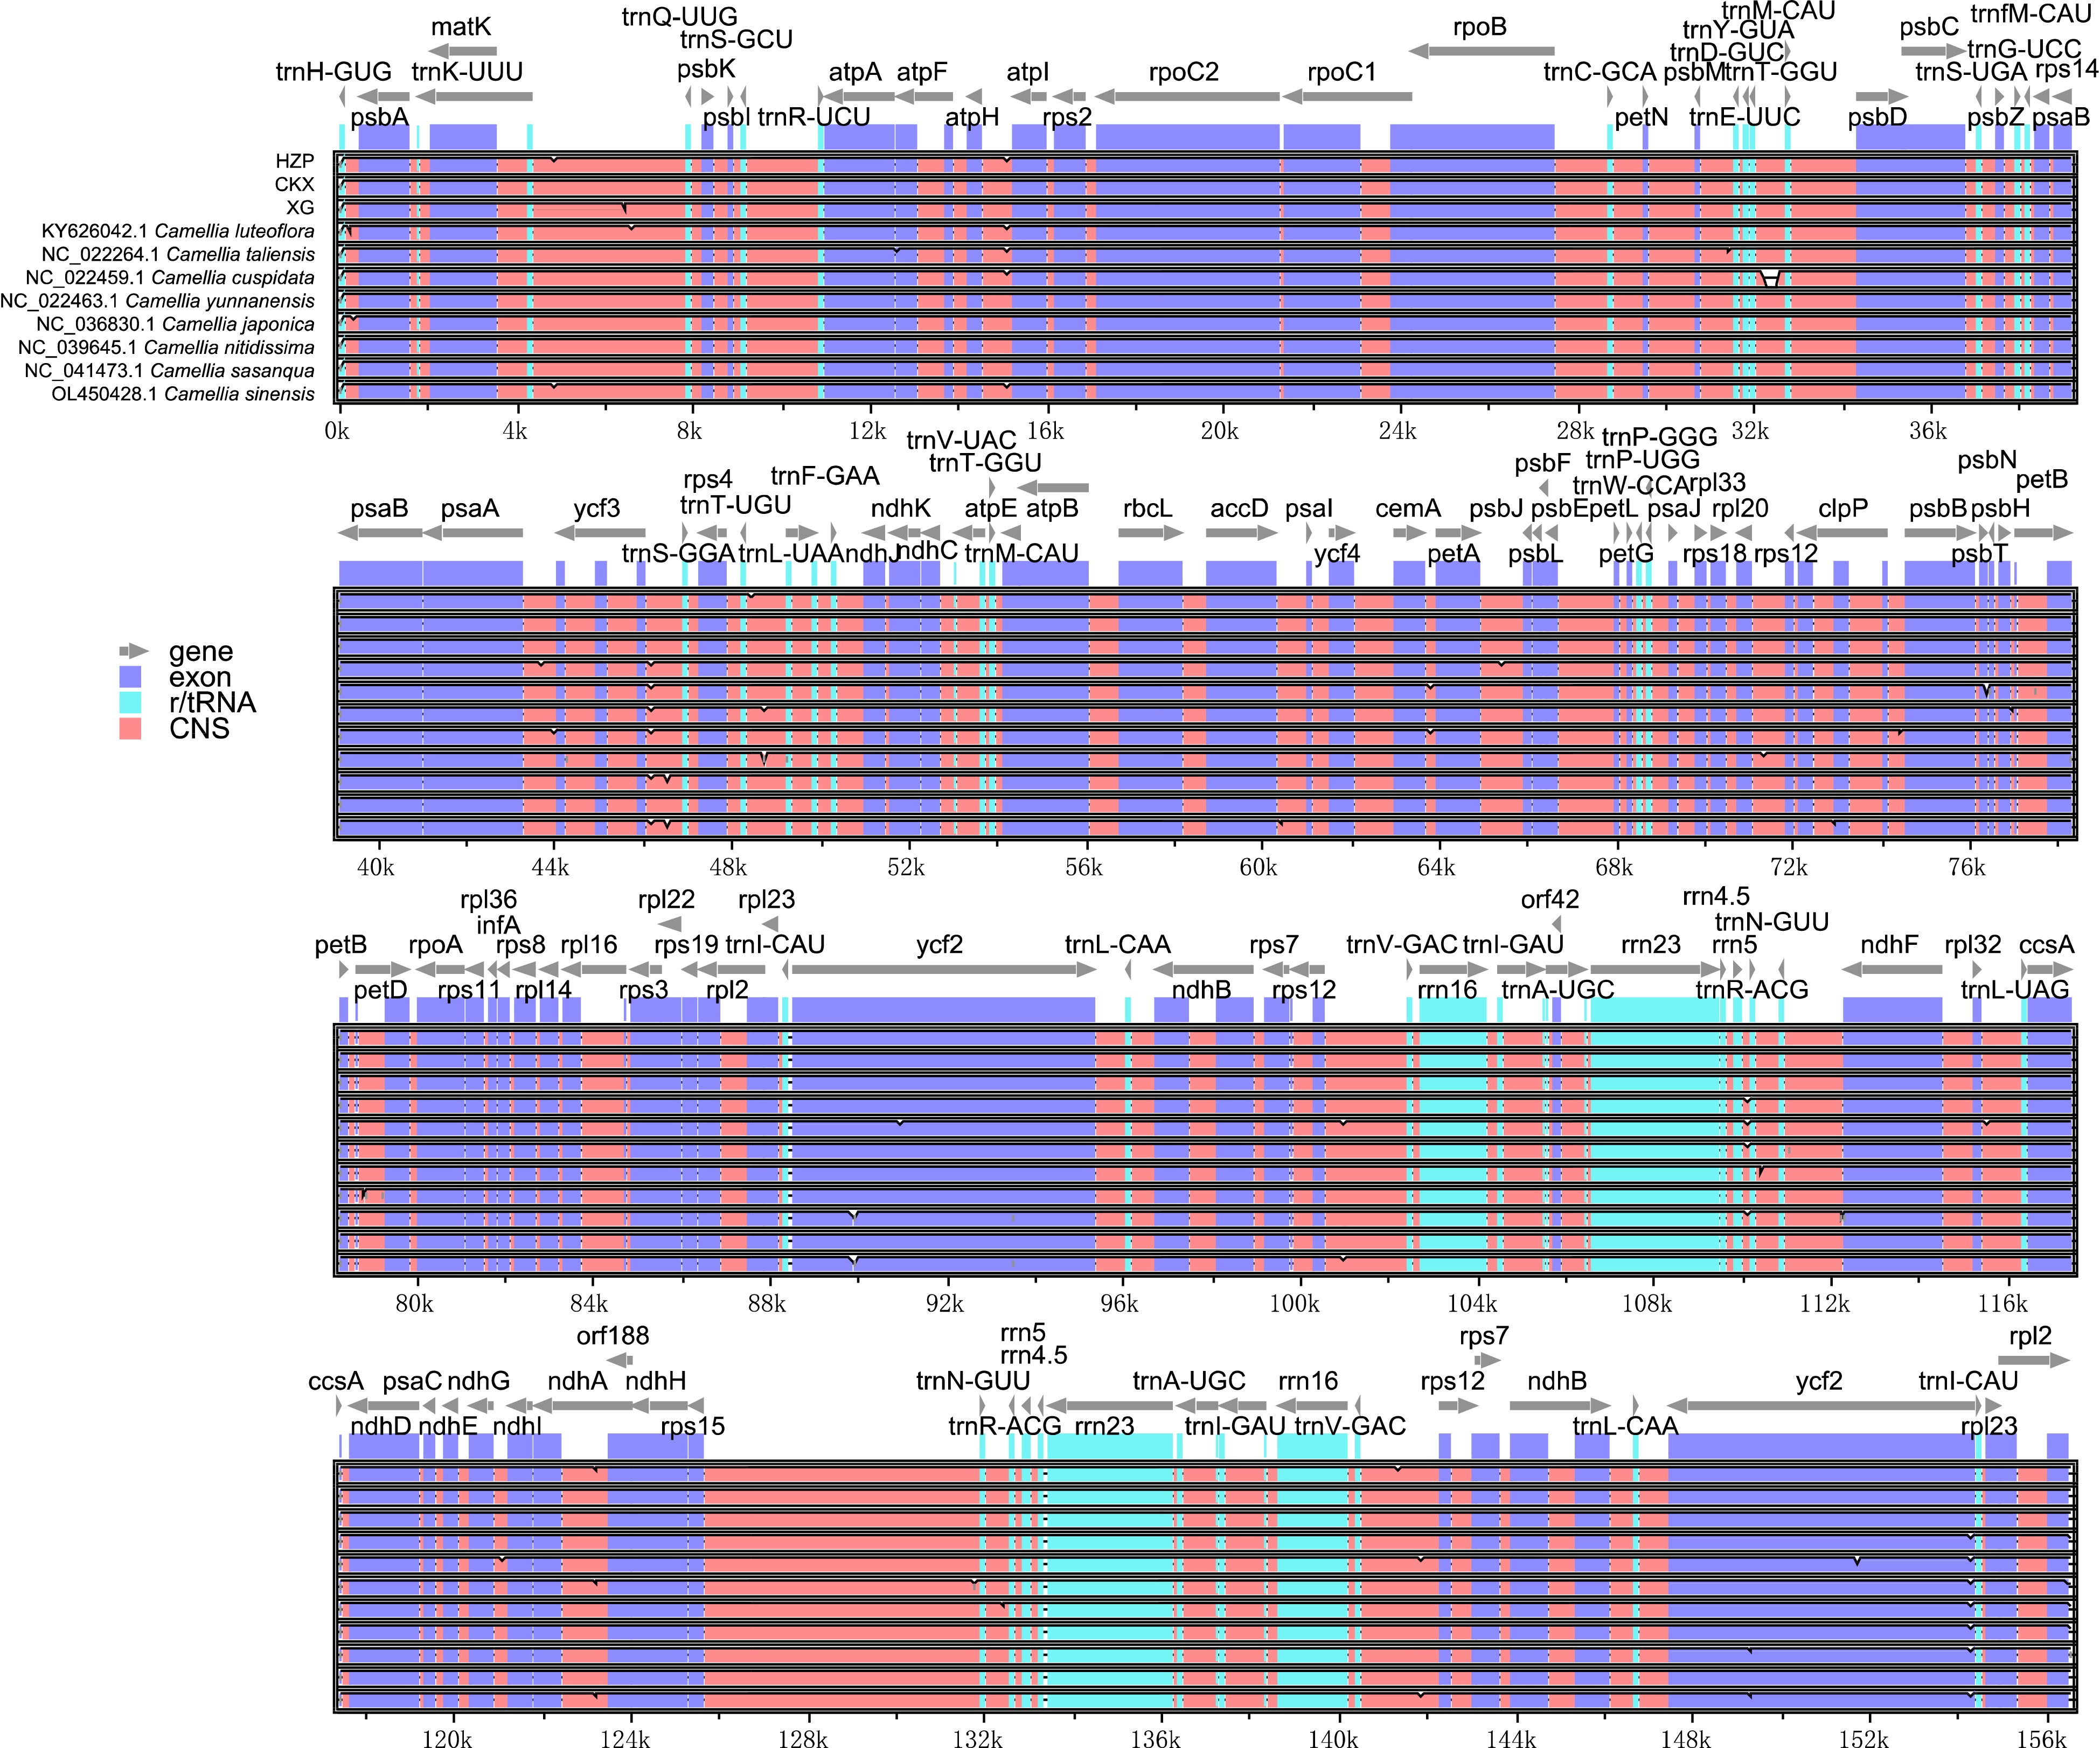
Figure 4.
Identity plots comparing the chloroplast genomes of 11 Camellia accessions. The vertical scale indicates the percentage of identity, ranging from 50 to 100%. The horizontal axis indicates the coordinates within the chloroplast genome. Genome regions are color coded, including protein-coding, rRNA, tRNA, intron, and conserved non-coding sequences (CNS).
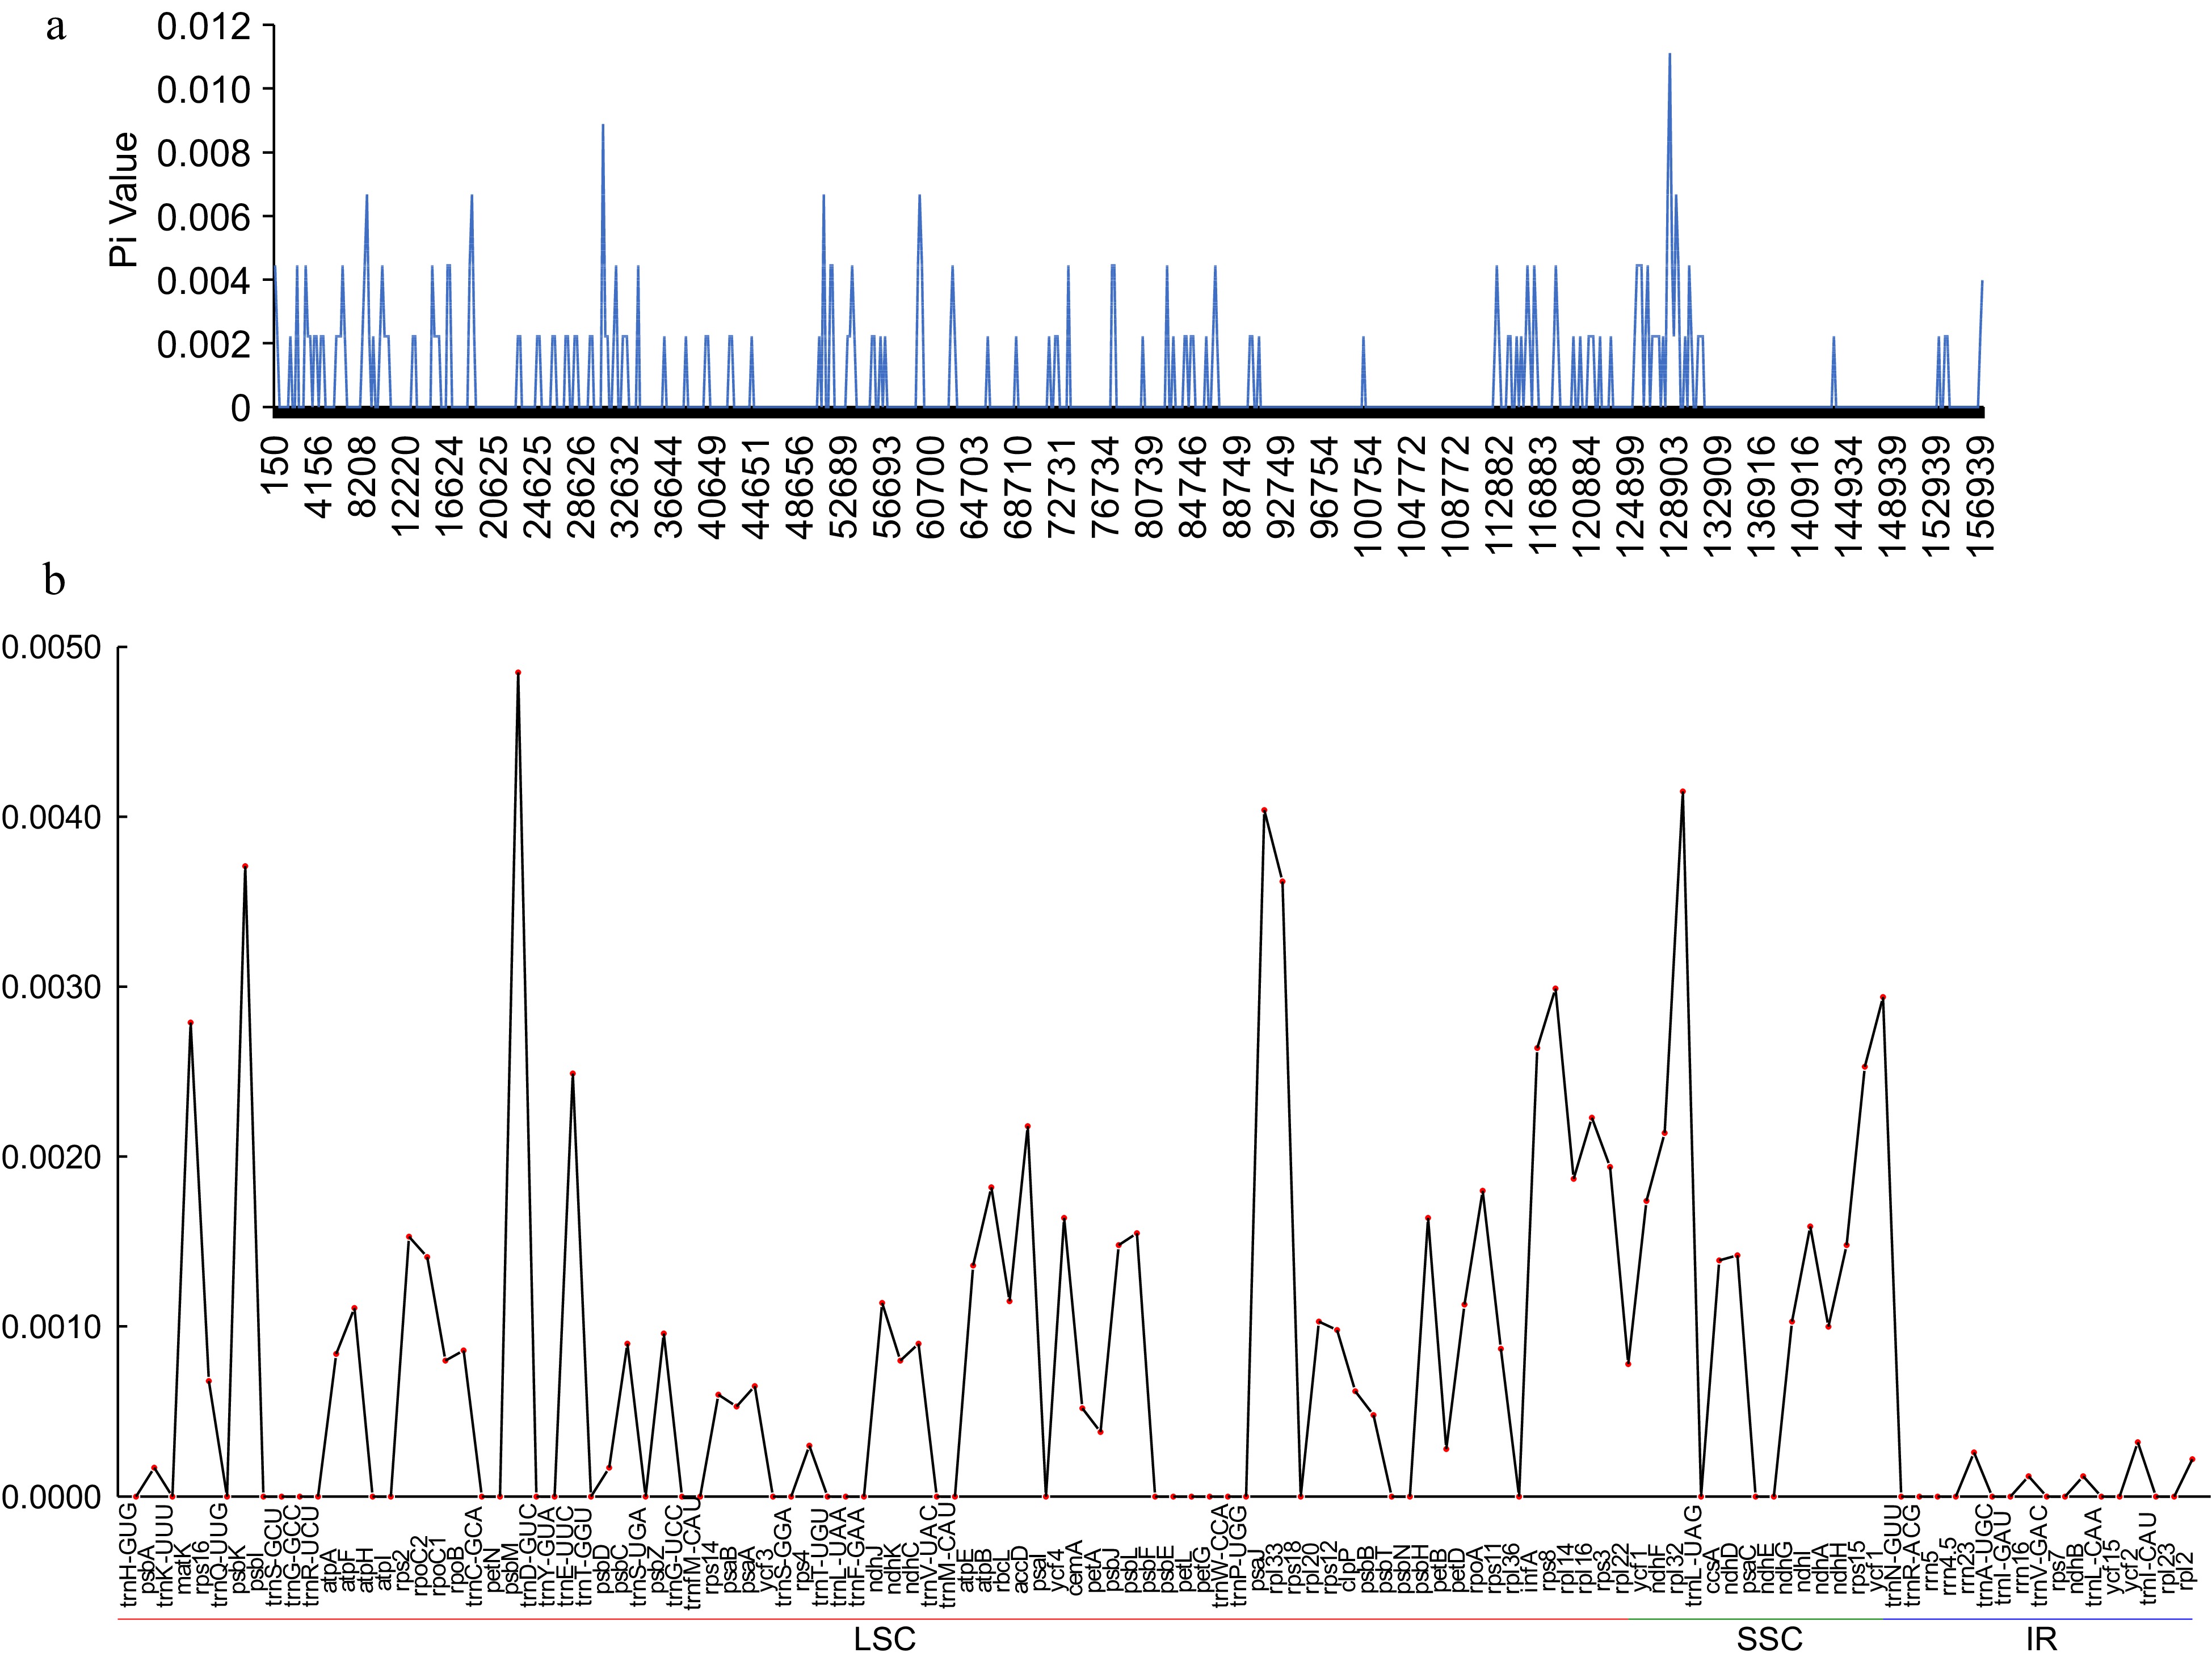
Figure 5.
The nuclear divergence in C. meiocarpa and C. oleifera chloroplast genomes by (a) sliding window analysis of the whole genomes; (b) gene regions.
Table 3. Indel and SNP types among three chloroplast genomes.
Indel (bp) 1 2 3 4 5 6 9 10−20 21− Total Number (N) 28 12 5 2 10 5 1 6 3 72 Proportion (%) 38.89 16.67 6.94 2.78 1.39 6.94 1.39 8.33 4.17 SNP type G/A C/T A/C G/T C/G T/A Number (N) 36 32 27 27 5 11 138 Proportion (%) 26.09 23.19 19.57 19.57 3.62 7.97 Phylogenetic analysis
-
In this study, the chloroplast genome information from 27 published species of the Camellia genus within the Theaceae family were combined to reconstruct a phylogenetic tree, thereby inferring the phylogenetic relationships among tea-oil Camellia with two Polyspora species serving as outgroup species (Fig. 6; Supplemental Fig. S1). In Fig. 6, CKX, XG, and HZP formed a cluster within one clade (PP = 1), aligning closely with C. japonica and C. chekiangobleosa in group I (PP = 0.74, Fig. 6a); and in Fig. 6b, CKX, and XG also clustered in one clade and then with C. japonica, C. chekiangobleosa and C. polyodonta (PP = 1), Group I and Group II were clustered in Clade A (PP = 1). Within Group II, C. oleifera (HZP) formed the basal clade, subsequently clustering with C. azalea, C. granthamiana, C. gauchowensis, C. vietnamensis, and C. suaveolens (PP = 1). Despite these classifications, the phylogenetic relationships within Camellia remained complex; for instance, C. crapnelliana was identified as the basal clade in Group I (PP = 1, as depicted in Fig. 6a), yet it appeared as a sister taxon to C. gigantocaroa in Fig. 6b (PP = 0.99). Nonetheless, MP and ML trees (Supplemental Figs S1 & S2) still consistently supported the notion that C. meiocarpa (CKX and XG) was not closely related to C. oleifera (HZP).
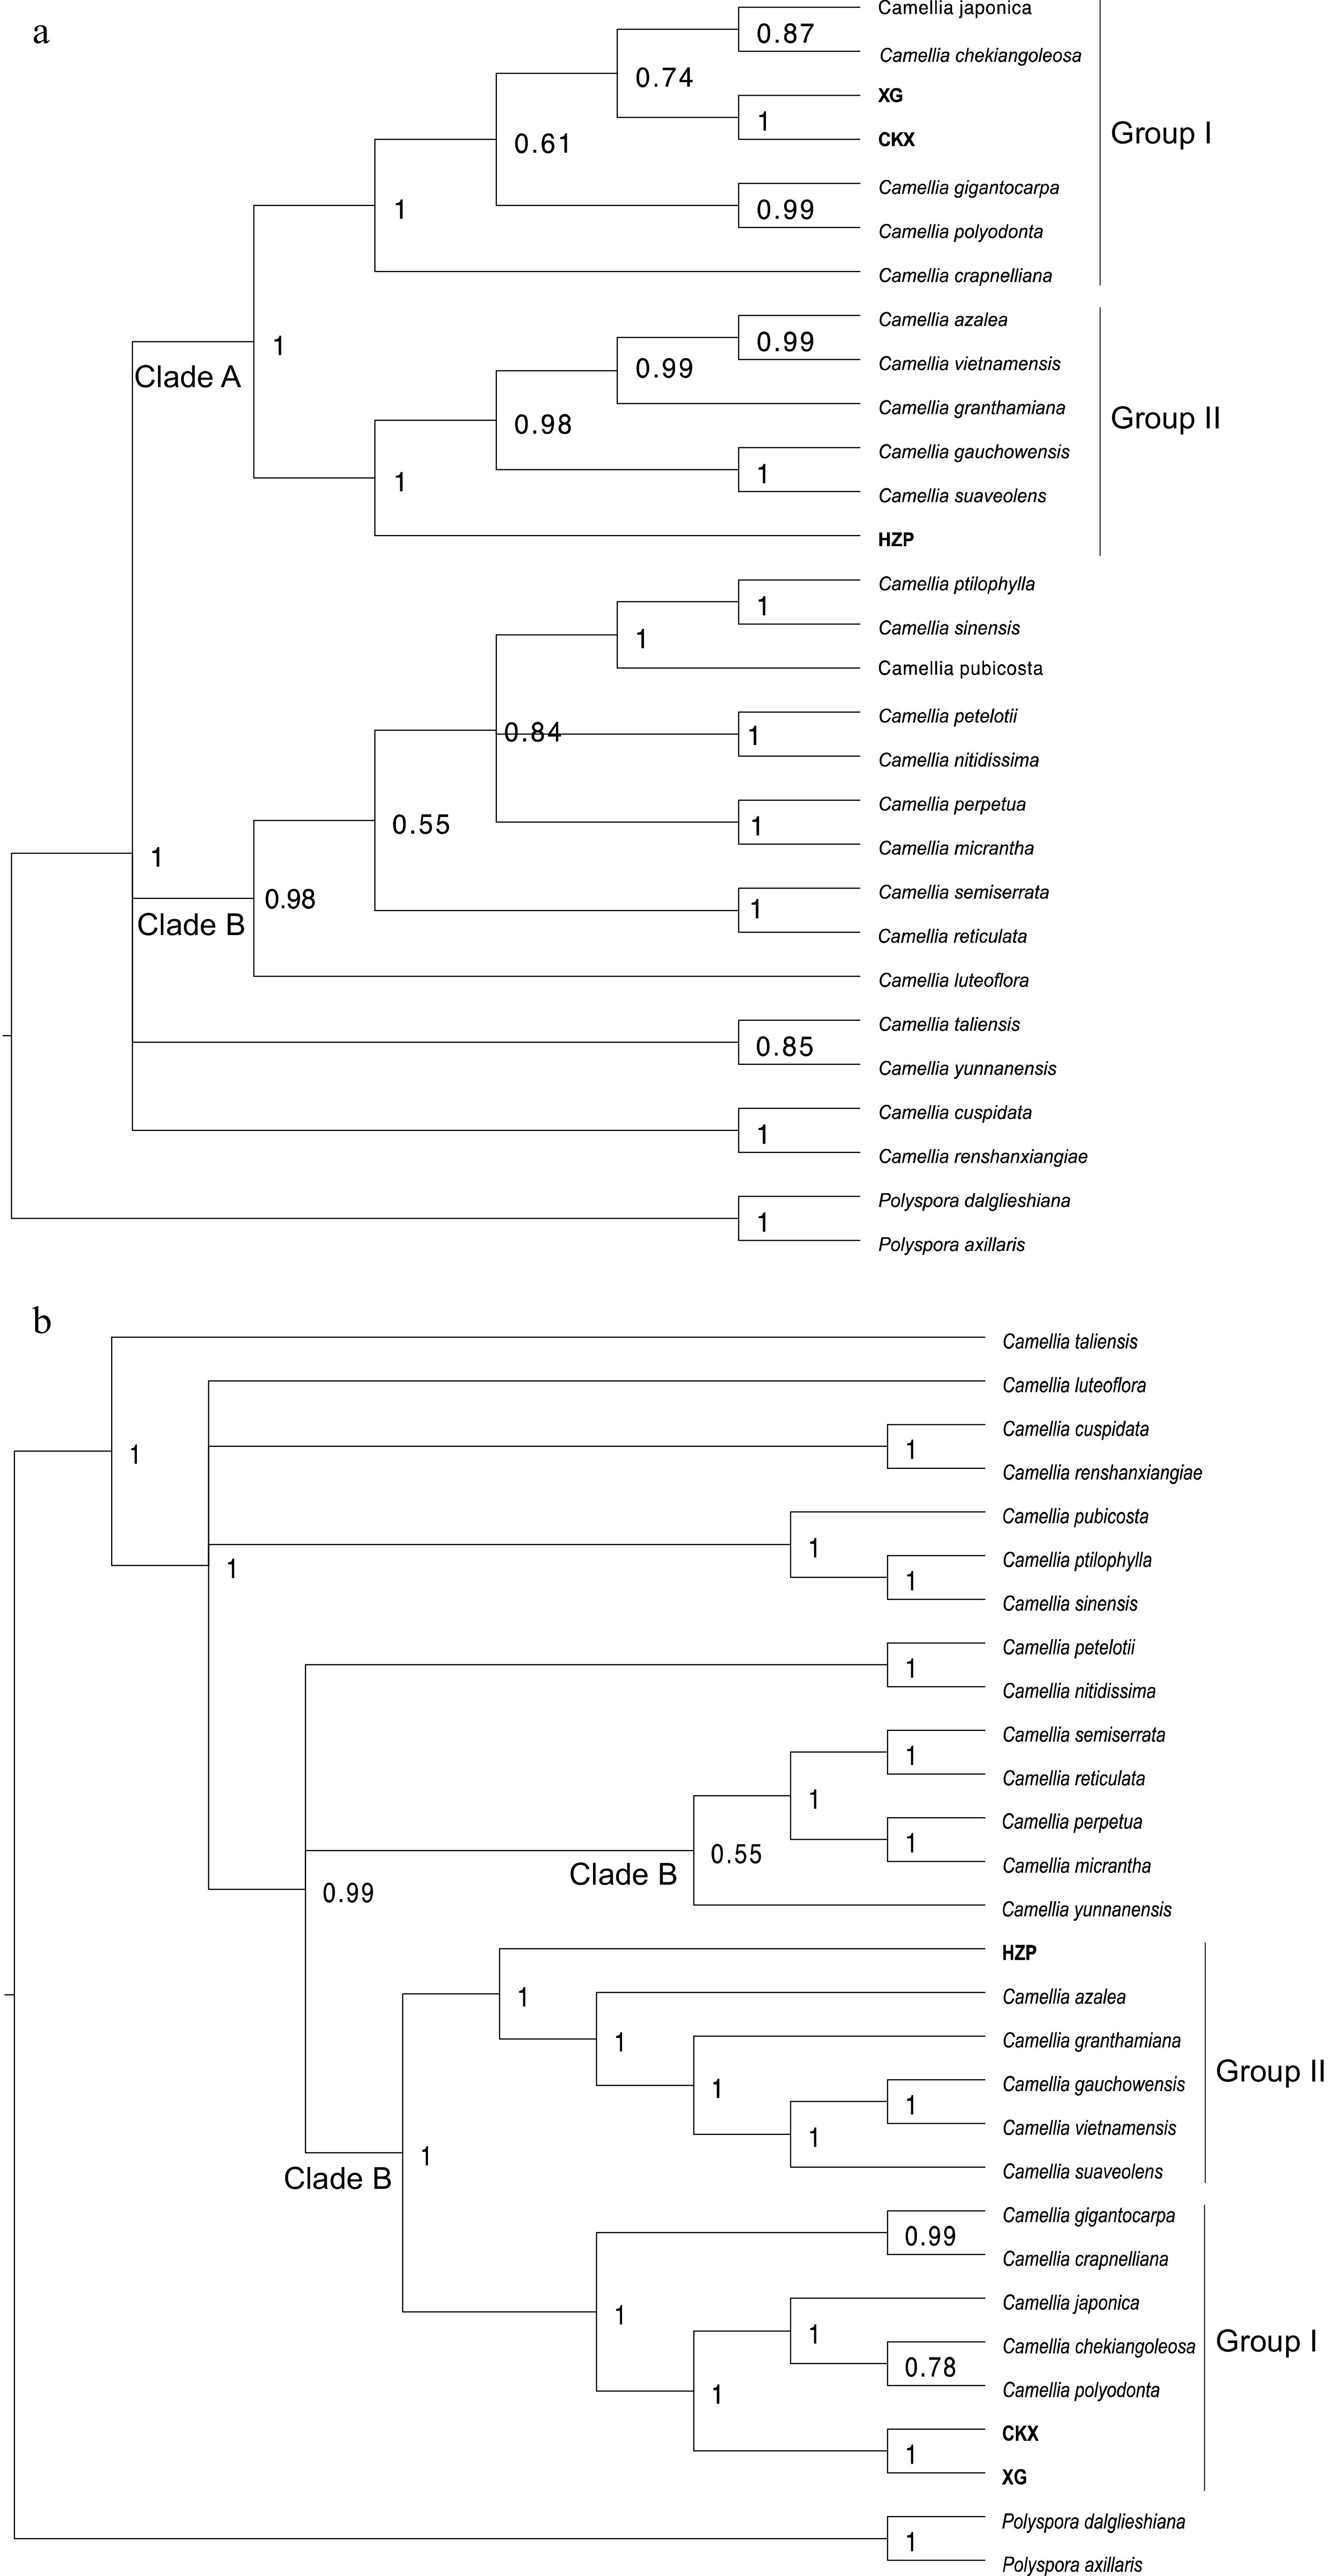
Figure 6.
Phylogenetic tree reconstruction of 27 Camellia species based on (a) protein-coding genes and (b) whole chloroplast genome sequences by the Bayesian method.
Development of a polymorphic marker
-
Based on the above results, 56 primers (Supplemental Table S8) were designed to include as many polymorphic sites as possible. The lengths of these target sequences ranged from 99 to 1,553 bp, covering 128 polymorphic sites, which included 89 SNPs and 39 Indels. Each primer pair was capable of detecting 1 to 9 polymorphic sites, with primer ZDJ78 identifying up to nine sites. Specifically, seven primers ZDJ05, ZDJ43, ZDJ64, ZDJ66, ZDJ67, ZDJ68, and ZDJ75 were each able to detect four polymorphic sites. A total of 20 pairs of primers (10 targeted regions in genes and 10 in intergenic regions) had only one mutation site, including 10 SNPs and 10 Indels. These 56 pairs of primers were distributed across 29 genes and 32 intergenic regions, with ycf1 having the highest number of markers (five markers). Sanger sequencing was employed to further verify these regions. We confirmed that 17 of these primers were effective for assessing the polymorphic sites. For example, ZDJ76 detected three polymorphic sites (two SNP sites and one Indel site), ZDJ01 detected two polymorphic sites (one SNP site and one Indel site), and a series of primers: ZDJ03, ZDJ15, ZDJ51, ZDJ54, ZDJ55, ZDJ59, ZDJ69, ZDJ72, ZDJ77, ZDJ80, ZDJ83 and ZDJ85, each detected one SNP site. Additionally, ZDJ45, ZDJ60 and ZDJ84 each identified one Indel site (see Table 4 for detailed results).
Table 4. The SNP and Indel in the targeted regions.
Primers Loci SNP Indel ZDJ01 TCCACTATTT[C/A]AATTATAAAA 1 0 ZDJ01 CAACCCATAA[C/-]CCATAAAAAT 0 1 ZDJ03 CCCAAAAAAT[G/A]GATTTTGGTT 1 0 ZDJ15 TCAATGGCCC[T/C]CCTACGTAGT 1 0 ZDJ45 TCCCATATAT[T/-]AAATATTAAA 0 1 ZDJ51 ATTGAAAGCT[A/G]GGATTTCTAG 1 0 ZDJ54 AATCCTTGTT[T/G]CGGAGTCGAT 1 0 ZDJ55 ACCAAAAAAT[A/C]TTTTTTGCTT 1 0 ZDJ59 TTCATCTATT[T/C]CATGACCGGA 1 0 ZDJ60 GACCAAGAAG[G/-]ATTCTCTTTC 0 1 ZDJ69 ATAAAAAATT[A/T]CCCCCTGCAA 1 0 ZDJ72 AAAATCATGT[G/A]TTGGTCCAGA 1 0 ZDJ76 TTCAAAATGG[C/-]TTTCAAATTA 0 1 ZDJ76 AAAGAATAGT[A/C]AATTTTTGCA 1 0 ZDJ76 AGAATAATTT[G/T]AATCTTAAAA 1 0 ZDJ77 GTATAACCCC[C/T]TTTTGCTTTC 1 0 ZDJ80 TAAGAATGGG[G/T]GACGGTATTC 1 0 ZDJ83 GAATTCTGTG[A/G]AAAGCCGTAT 1 0 ZDJ84 AAGAGAATCC[T/-]TCTTGGTCGT 0 1 ZDJ85 TCCGGTCATG[A/G]AATAGATGAA 1 0 In Loci, the variant in left side was C. oleifera and the right side was C. meiocarpa. -
The taxonomic status and phylogenetic relationships of C. meiocarpa and C. oleifera continue to be hotly debated, significantly affecting germplasm innovation, breeding of new varieties, and industrial development. In the production process of tea-oil Camellia, the fruits of C. meiocarpa are smaller and bear a single seed. Compared to C. oleifera, it exhibits advantages such as a thin fruit peel, high oil content, high seed extraction rate, strong adaptability, disease resistance, and a relatively stable yield. Currently, C. meiocarpa occupies the second largest cultivation area after C. oleifera, leading some researchers to recognize it as a distinct species[48,49]. In this study, a reference-quality chloroplast genome for both C. meiocarpa and C. oleifera was assembled and annotated, revealing a typical quadripartite structure similar in size, gene count, and GC content to other tea-oil Camellia[50,51]. This comparative genomic analysis provides new insights into the phylogeny of tea-oil Camellia, suggesting that despite complex morphological classifications, their chloroplast genomes are relatively conserved[52−54].
Whether C. meiocarpa should be considered as a variety of C. oleifera remains controversial in previous studies[48,55,56]. Here, we were committed to clarifying the relationship between C. meiocarpa and C. oleifera amid ongoing controversies. In morphology, the distinct morphological features such as the number of seeds per fruit and the size of flowers, fruits, and leaves differentiate the species, with C. meiocarpa generally having 1−3 seeds per fruit and smaller morphological features compared to C. oleifera's typically four or more seeds. In cytology, C. meiocarpa is tetraploid, while C. oleifera is hexaploidy[12]. Recent phylogenetic trees constructed from three nuclear regions placed C. meiocarpa with C. vietnamensis, distinct from C. oleifera, which forms the basal clade[57]. The present findings from the chloroplast genomes indicate significant genomic differences, with over 450 bp variation in size between C. meiocarpa (XG and CKX) and C. oleifera (HZP). The analysis of genomic structures and variant sites indicated that genetic divergence between XG and CKX is less pronounced than between either of these and HZP. The phylogenetic trees (Fig. 6; Supplemental Figs S1 & S2) showed C. meiocarpa and C. oleifera did not group together. Instead, XG and CKX clustered closely, distinctly separate from HZP. Combining the evidence of morphology and cytology, we supported the opinion that C. meiocarpa is an independent species[58]. It facilitates a better understanding and innovative utilization of C. meiocarpa and C. oleifera by taxonomists and breeders. This approach is also beneficial for the development of the Camellia oil industry.
Molecular marker development and application in C. meiocarpa and C. oleifera
-
In the production practice of Camellia oil, the seedlings of C. meiocarpa and C. oleifera are hard to distinguish. Many substitutes and fake seedlings will bring heavy losses in yield and quality of Camellia oil. The application of molecular markers can help to solve this problem by enabling the rapid and accurate identification of specific polymorphisms[59,60]. In contrast to classification systems based on morphological traits, molecular markers provide insights into genetic differences at the DNA level and prove effective in assessing genetic diversity within breeding programs[61]. Among these, chloroplast DNA markers have shown exceptional utility, emerging as a superior tool for the identification and classification of complex species[62]. The diversity of chloroplast genomes is the base for the polymorphic DNA marker development[63]. However, the markers have still not yet been developed for C. meiocarpa and C. oleifera, and that is seriously affecting the production of Tea-oil and appraisal of plasm resources of Tea-oil Camellia. Although the chloroplast genomes of these species show relative conservation, the presence of numerous variations, such as SNPs and Indels, provide a rich source for marker development. In this study, 56 pairs of primers were developed to test polymorphisms in both species. PCR and sequencing results showed that only 17 primers existed mutations, demonstrating their potential to aid in resource evaluation and differentiation between C. monosperma and C. oleifera. The above analysis results provided references for the classification and evaluation between these two species as well as for practical production.
-
The present study primarily investigated the chloroplast genomes of C. meiocarpa and C. oleifera as well as conducted a comparative analysis with other related species within tea-oil Camellia. The genomic size, gene structure, and organization were observed to be conservative and consistent with previous studies in Camellia. Based on the evidence of the chloroplast genome, we supported the idea proposed by Xiansu Hu, that C. meiocarpa is an independent species. The development of 17 primers could be used for the resource assessment of Camellia, facilitating molecular phylogenetic analysis, innovation, utilization of tea-oil Camellia germplasm resources, and their production practice. The present study provided high-quality chloroplast genomes and reliable molecular marker resources for future tea-oil Camellia research.
-
The authors confirm contribution to the paper as follows: study conception and design, project supervision: Zheng D; draft manuscript preparation: Liang H, Qi H; genomes analysis and annotation: Liang H; samples collection and experiments: Qi H, Sun X, Wang C, Xia T, Chen J; data analysis: Wang Y, Ye H, Feng X, Xie S, Gao Y; manuscript revision: Zheng D, Liang H. All authors reviewed the results and approved the final version of the manuscript.
-
The three chloroplast genome sequences of Camellia are deposited in the GenBank of the National Center for Biotechnology Information (NCBI) repository, accession numbers MZ151355 (XG), MZ151356 (CKX) and MZ151357 (HZP).
This study was supported by the Project of Sanya Yazhou Bay Science and Technology City (Grant No. SCKJ-JYRC-202258), Southern Breeding Project of Sanya National Southen Breeding Research Academy of Chinese Academy of Agricultural Sciences (Grant No. YYLH10), the National Natural Science Foundation of China (31860082), Hainan Province Science and Technology Special Fund (FW20230002), Scientific and technological innovation team of Hainan Academy of Agricultural Sciences (HAAS2023TDYD05), introduce talents to initiate scientific research projects of Hainan Academy of Agricultural Sciences (HAAS2023RCQD13).
-
The authors declare that they have no conflict of interest.
-
accompanies this paper at (https://www.maxapress.com/article/doi/10.48130/tp-0024-0022)
-
Received 21 March 2024; Accepted 26 April 2024; Published online 24 July 2024
-
Compared to C. oleifera (HZP), there were differences ranging between 460 bp (CKX) and 490 bp (XG) in C. meiocarpa.
C. meiocarpa was considered as a separated species.
The development of 17 primers could be used for the resource assessment of Camellia.
-
# Authors contributed equally: Heng Liang, Huasha Qi
- Supplemental Table S1 The GenBank accession numbers of 8 species using in comparative analysis.
- Supplemental Table S2 The GenBank accession numbers of 26 species using in phylogenetic analysis.
- Supplemental Table S3 Genes contained in the chloroplast genome sequence of XG, CKX and HZP.
- Supplemental Table S4 Scattered repetitive sequences in CKX, Scattered repetitive sequences in XG, Scattered repetitive sequences in HZP.
- Supplemental Table S5 Features of SSR in HZP, Features of SSR in XG, Features of SSR in CKX.
- Supplemental Table S6 The pi values in XG, CKX and HZP.
- Supplemental Table S7 The features of indel and snp in XG, CKX and HZP.
- Supplemental Table S8 PCR primers used for amplification of the candidate barcode regions.
- Supplemental Fig. S1 Phylogenetic tree reconstruction of 27 Camellia species based on protein-coding genes by (A) ML methods and (B) MP methods.
- Supplemental Fig. S2 Phylogenetic tree reconstruction of 27 Camellia species based on whole chloroplast genome sequences by (A) ML methods and (B) MP methods.
- Copyright: © 2024 by the author(s). Published by Maximum Academic Press on behalf of Hainan University. This article is an open access article distributed under Creative Commons Attribution License (CC BY 4.0), visit https://creativecommons.org/licenses/by/4.0/.
-
About this article
Cite this article
Liang H, Qi H, Wang Y, Sun X, Wang C, et al. 2024. Comparative chloroplast genome analysis of Camellia oleifera and C. meiocarpa: phylogenetic relationships, sequence variation and polymorphic markers. Tropical Plants 3: e023 doi: 10.48130/tp-0024-0022 

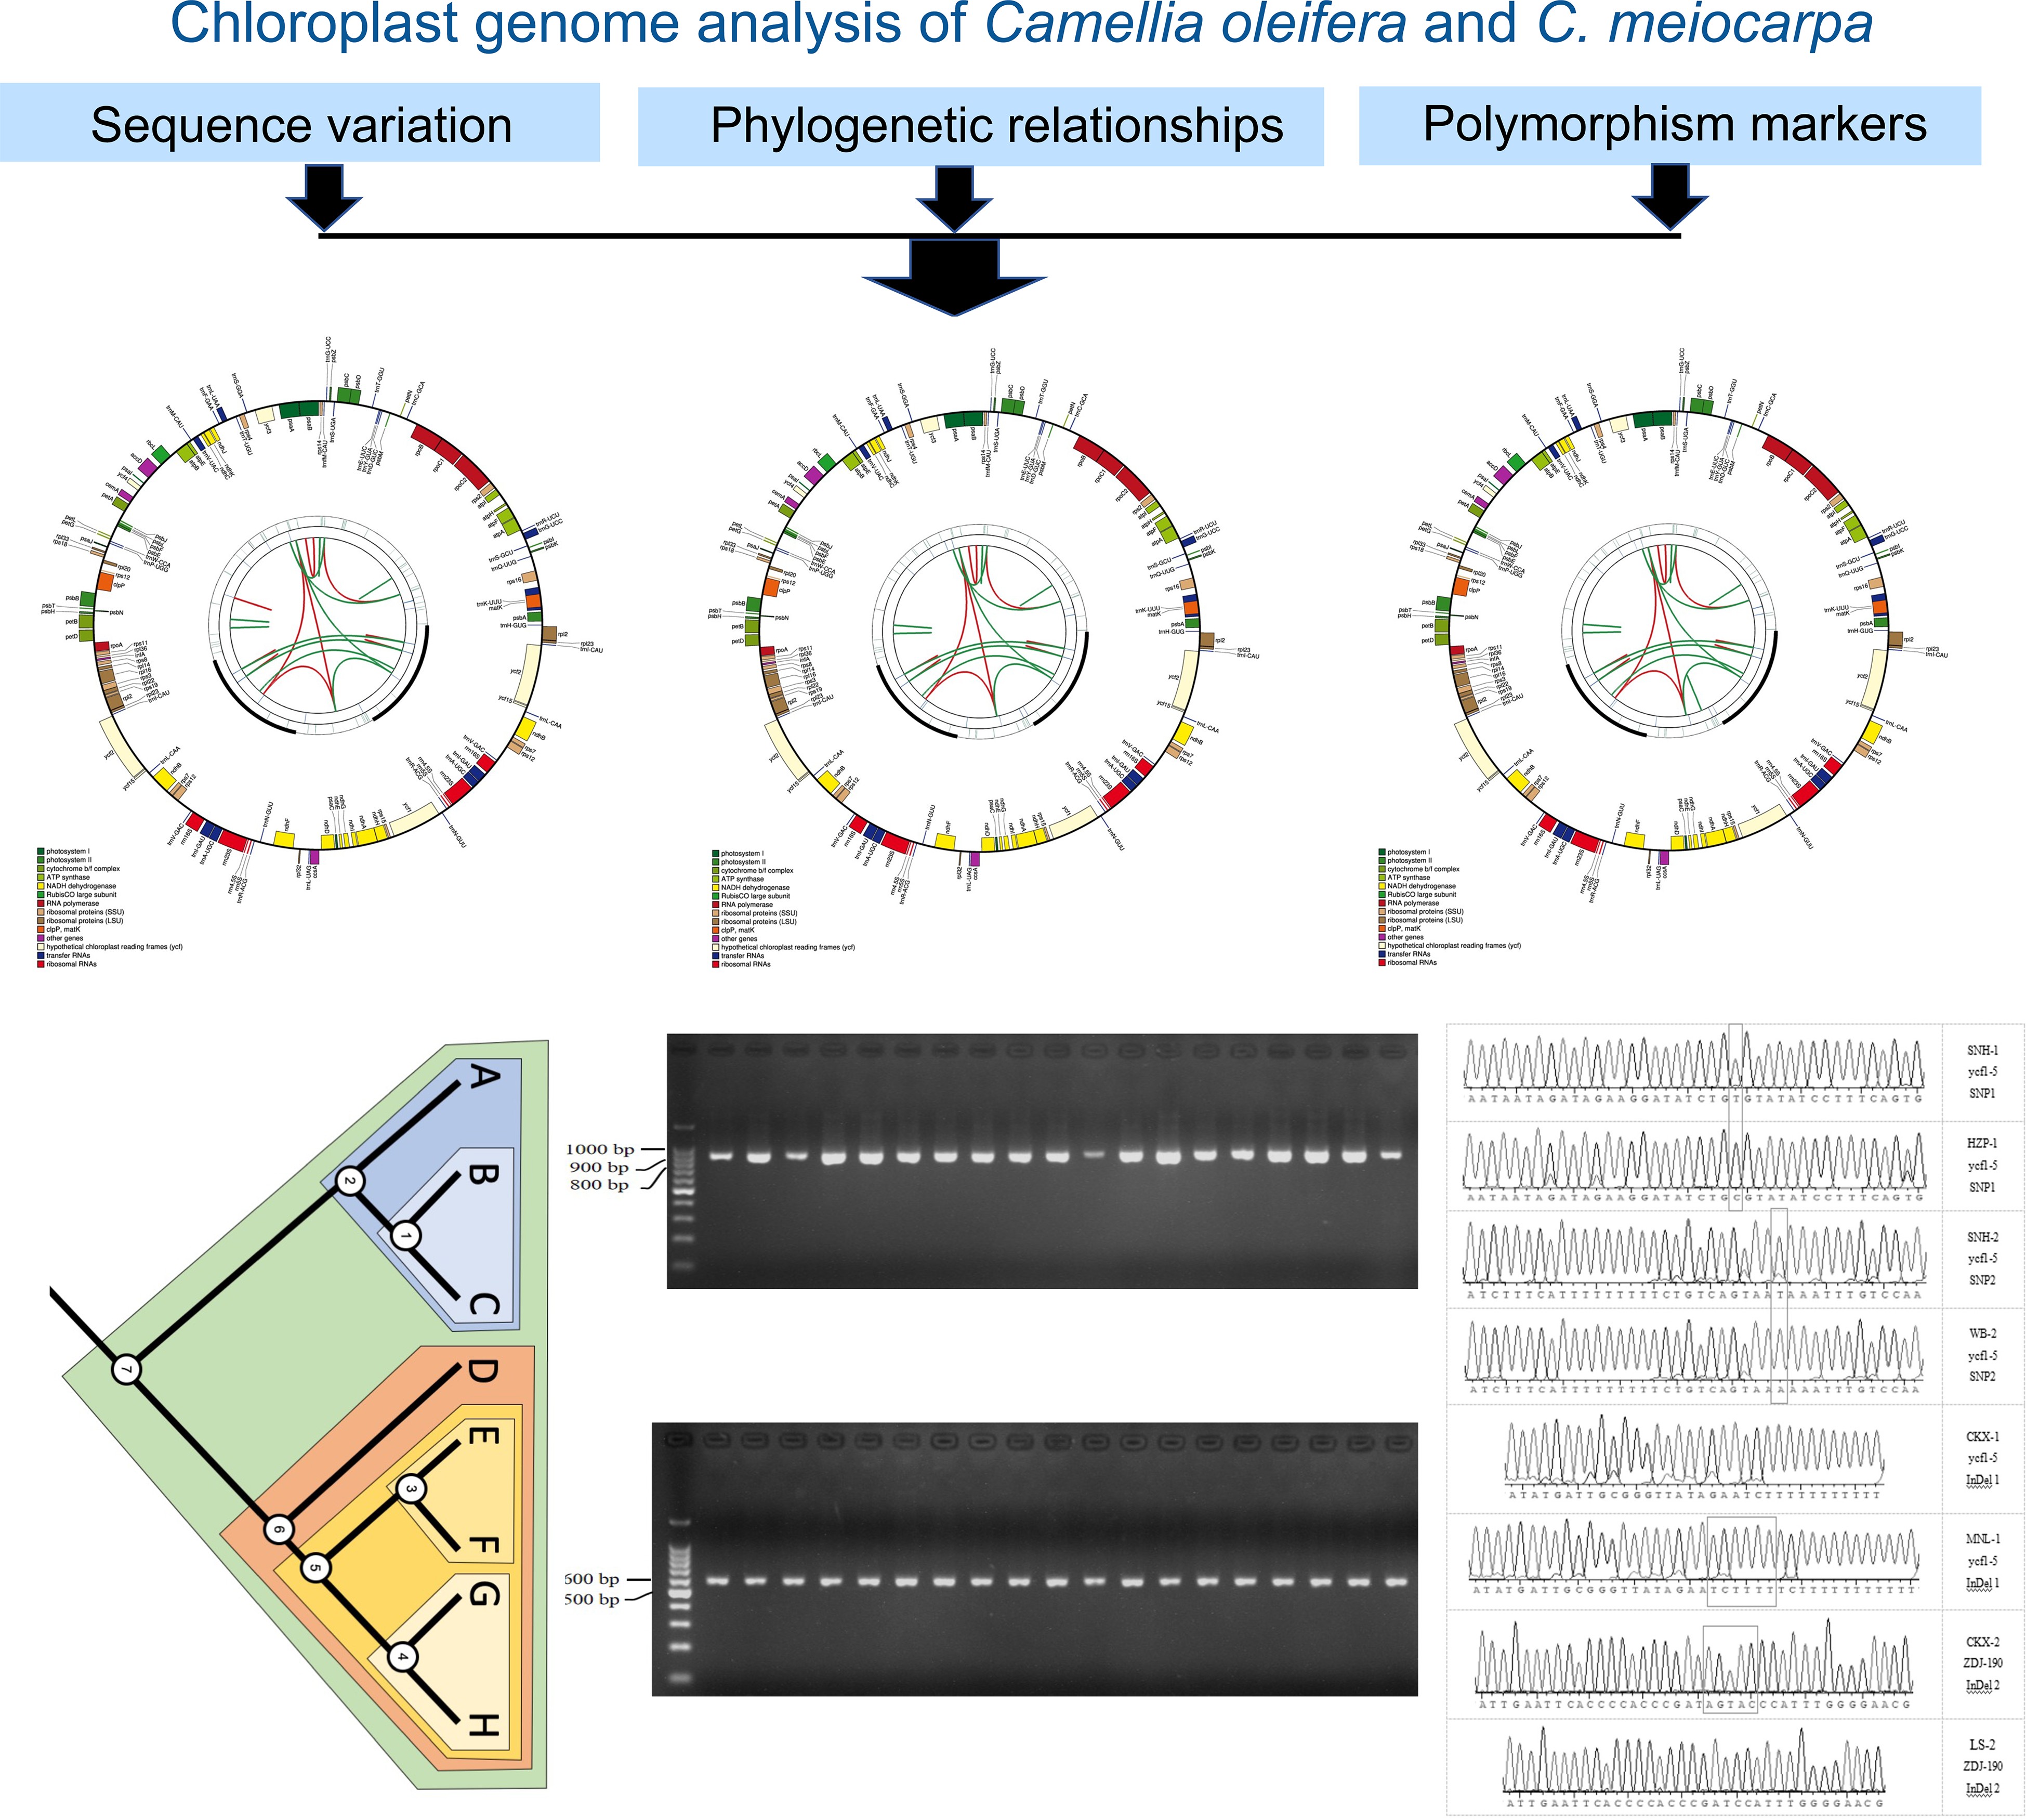
Comparative chloroplast genome analysis of Camellia oleifera and C. meiocarpa: phylogenetic relationships, sequence variation and polymorphic markers
- Received: 21 March 2024
- Revised: 22 April 2024
- Accepted: 26 April 2024
- Published online: 24 July 2024
Abstract: Tea-oil Camellia, a prominently woody oil crop, serves as a crucial source of edible oil, protein feed, and industrial raw materials. Notably, C. Oleifera and C. meiocarpa yield higher oil production and larger cultivation areas than other Tea-oil Camellia species. However, the taxonomy and phylogenetic relationship between these species remains elusive, complicating their commercial application. Here, we sequenced and analyzed the complete chloroplast genomes of these two species, compared them with related Camellia species, and developed chloroplast DNA markers to distinguish between them. The chloroplast genome of C. Oleifera was 157,009 bp (HZP) and C. meiocarpa was 156,549 bp (CKX) and 156,512 bp (XG) in length. Comparative analysis indicated that distinct differences in the chloroplast genome between HZP and CKX (or XG) than between CKX and XG. The repetitive sequences and interspecific variations among them showed that the differences in the number and distribution in CKX and XG were smaller than those in HZP. Phylogenetic analysis showed that C. meiocarpa was not closely related to C. oleifera. A total of 56 pairs of primers were developed to test the polymorphism among them. After PCR and sequencing verification, variations were detected in the target sequences of 17 primers. The data derived from the chloroplast genomes and the newly developed markers are invaluable for understanding the phylogenetic relationships and assessing the genetic diversity of tea-oil Camellia germplasm resources.
-
Key words:
- Chloroplast genome /
- Camellia /
- Phylogeny /
- Polymorphism markers