ARTICLE   Open Access    

Toxicity of indoxacarb to the population of Liriomyza trifolii (Diptera: Agromyzidae) in Sanya (China), and the effects of temperature and food on its biological characteristics

More Information
  • Received: 31 May 2024
    Revised: 08 July 2024
    Accepted: 15 July 2024
    Published online: 23 August 2024
    Tropical Plants  3 Article number: e028 (2024)  |  Cite this article
  • L. trifolii has developed high resistance to indoxacarb in Sanya.

    Detoxification enzymes of L. trifolii maybe involved in the detoxification metabolism of indoxacarb.

    Temperature and food have an effect on the growth and development of L. trifolii.

  • Liriomyza trifolii is mainly distributed in tropical and subtropical regions, and it is one of the important invasive pests in China, which can damage a variety of plants. L. trifolii has caused serious economic losses to agriculture in China. Morphological and molecular characterization results showed that the collected Sanya field strain was L. trifolii. Bioassay results showed that the sensitivity of the 2nd instar larvae of the Sanya field strain in 2022 to indoxacarb was reduced by 776.17 times. The correlation between the activities of GST and AChE and the resistance of indoxacarb was higher. Temperature affected the developmental period and survival rate of different stages of field strains of L. trifolii, with a greater effect on the survival rate of nymphs, but no effect on the body length and weight of pupae. At 16, 25, and 34 °C, the developmental periods of larvae were shortened with the increase in temperature. The developmental periods of adults fed with honey water were significantly longer than those fed with sterile water. Based of the temperature and developmental period, the development point temperatures of eggs, larvae, pupae, and adults of L. trifolii were 10.82, 2.75, 12.30, and 7.11 °C, respectively. The results of this study may provide important theoretical support for resistance monitoring, management, and control strategies for this insect.
    Graphical Abstract
  • Aquaporin’s (AQPs) are small (21–34 kD) channel-forming, water-transporting trans-membrane proteins which are known as membrane intrinsic proteins (MIPs) conspicuously present across all kingdoms of life. In addition to transporting water, plant AQPs act to transport other small molecules including ammonia, carbon dioxide, glycerol, formamide, hydrogen peroxide, nitric acid, and some metalloids such as boron and silicon from the soil to different parts of the plant[1]. AQPs are typically composed of six or fewer transmembrane helices (TMHs) coupled by five loops (A to E) and cytosolic N- and C-termini, which are highly conserved across taxa[2]. Asparagine-Proline-Alanine (NPA) boxes and makeup helices found in loops B (cytosolic) and E (non-cytosolic) fold back into the protein's core to form one of the pore's two primary constrictions, the NPA region[1]. A second filter zone exists at the pore's non-cytosolic end, where it is called the aromatic/arginine (ar/R) constriction. The substrate selectivity of AQPs is controlled by the amino acid residues of the NPA and ar/R filters as well as other elements of the channel[1].

    To date, the AQP gene families have been extensively explored in the model as well as crop plants[39]. In seed plants, AQP distributed into five subfamilies based on subcellular localization and sequence similarities: the plasma membrane intrinsic proteins (PIPs; subgroups PIP1 and PIP2), the tonoplast intrinsic proteins (TIPs; TIP1-TIP5), the nodulin26-like intrinsic proteins (NIPs; NIP1-NIP5), the small basic intrinsic proteins (SIPs; SIP1-SIP2) and the uncategorized intrinsic proteins (XIPs; XIP1-XIP3)[2,10]. Among them, TIPs and PIPs are the most abundant and play a central role in facilitating water transport. SIPs are mostly found in the endoplasmic reticulum (ER)[11], whereas NIPs homologous to GmNod26 are localized in the peribacteroid membrane[12].

    Several studies reported that the activity of AQPs is regulated by various developmental and environmental factors, through which water fluxes are controlled[13]. AQPs are found in all organs such as leaves, roots, stems, flowers, fruits, and seeds[14,15]. According to earlier studies, increased AQP expression in transgenic plants can improve the plants' tolerance to stresses[16,17]. Increased root water flow caused by upregulation of root aquaporin expression may prevent transpiration[18,19]. Overexpression of Tamarix hispida ThPIP2:5 improved osmotic stress tolerance in Arabidopsis and Tamarix plants[20]. Transgenic tomatoes having apple MdPIP1;3 ectopically expressed produced larger fruit and improved drought tolerance[21]. Plants over-expressing heterologous AQPs, on the other hand, showed negative effects on stress tolerance in many cases. Overexpression of GsTIP2;1 from G. soja in Arabidopsis plants exhibited lower resistance against salt and drought stress[22].

    A few recent studies have started to establish a link between AQPs and nanobiology, a research field that has been accelerating in the past decade due to the recognition that many nano-substances including carbon-based materials are valuable in a wide range of agricultural, industrial, and biomedical activities[23]. Carbon nanotubes (CNTs) were found to improve water absorption and retention and thus enhance seed germination in tomatoes[24,25]. Ali et al.[26] reported that Carbon nanoparticles (CTNs) and osmotic stress utilize separate processes for AQP gating. Despite lacking solid evidence, it is assumed that CNTs regulate the aquaporin (AQPs) in the seed coats[26]. Another highly noticed carbon-nano-molecule, the fullerenes, is a group of allotropic forms of carbon consisting of pure carbon atoms[27]. Fullerenes and their derivatives, in particular the water-soluble fullerols [C60(OH)20], are known to be powerful antioxidants, whose biological activity has been reduced to the accumulation of superoxide and hydroxyl[28,29]. Fullerene/fullerols at low concentrations were reported to enhance seed germination, photosynthesis, root growth, fruit yield, and salt tolerance in various plants such as bitter melon and barley[3032]. In contrast, some studies also reported the phytotoxic effect of fullerene/fullerols[33,34]. It remains unknown if exogenous fullerene/fullerol has any impact on the expression or activity of AQPs in the cell.

    Garden pea (P. sativum) is a cool-season crop grown worldwide; depending on the location, planting may occur from winter until early summer. Drought stress in garden pea mainly affects the flowering and pod filling which harm their yield. In the current study, we performed a genome-wide identification and characterization of the AQP genes in garden pea (P. sativum), the fourth largest legume crop worldwide with a large complex genome (~4.5 Gb) that was recently decoded[35]. In particular, we disclose, for the first time to our best knowledge, that the transcriptional regulations of AQPs by osmotic stress in imbibing pea seeds were altered by fullerol supplement, which provides novel insight into the interaction between plant AQPs, osmotic stress, and the carbon nano-substances.

    The whole-genome sequence of garden pea ('Caméor') was retrieved from the URGI Database (https://urgi.versailles.inra.fr/Species/Pisum). Protein sequences of AQPs from two model crops (Rice and Arabidopsis) and five other legumes (Soybean, Chickpea, Common bean, Medicago, and Peanut) were used to identify homologous AQPs from the garden pea genome (Supplemental Table S1). These protein sequences, built as a local database, were then BLASTp searched against the pea genome with an E-value cutoff of 10−5 and hit a score cutoff of 100 to identify AQP orthologs. The putative AQP sequences of pea were additionally validated to confirm the nature of MIP (Supplemental Table S2) and transmembrane helical domains through TMHMM (www.cbs.dtu.dk/services/TMHMM/).

    Further phylogenetic analysis was performed to categorize the AQPs into subfamilies. The pea AQP amino acid sequences, along with those from Medicago, a cool-season model legume phylogenetically close to pea, were aligned through ClustalW2 software (www.ebi.ac.uk/Tools/msa/clustalw2) to assign protein names. The unaligned AQP sequences to Medicago counterparts were once again aligned with the AQP sequences of Arabidopsis, rice, and soybean. Based on the LG model, unrooted phylogenetic trees were generated via MEGA7 and the neighbor-joining method[36], and the specific name of each AQP gene was assigned based on its position in the phylogenetic tree.

    By using the conserved domain database (CDD, www.ncbi.nlm.nih.gov/Structure/cdd/cdd.shtml), the NPA motifs were identified from the pea AQP protein sequences[37]. The software TMHMM (www.cbs. dtu.dk/services/TMHMM/)[38] was used to identify the protein transmembrane domains. To determine whether there were any alterations or total deletion, the transmembrane domains were carefully examined.

    Basic molecular properties including amino acid composition, relative molecular weight (MW), and instability index were investigated through the online tool ProtParam (https://web.expasy.org/protparam/). The isoelectric points (pI) were estimated by sequence Manipulation Suite version 2 (www.bioinformatics.org/sms2)[39]. The subcellular localization of AQP proteins was predicted using Plant-mPLoc[40] and WoLF PSORT (www.genscript.com/wolf-psort.html)[ 41] algorithms.

    The gene structure (intron-exon organization) of AQPs was examined through GSDS ver 2.0[42]. The chromosomal distribution of the AQP genes was illustrated by the software MapInspect (http://mapinspect.software.informer.com) in the form of a physical map.

    To explore the tissue expression patterns of pea AQP genes, existing NGS data from 18 different libraries covering a wide range of tissue, developmental stage, and growth condition of the variety ‘Caméor’ were downloaded from GenBank (www.ncbi.nlm.nih.gov/bioproject/267198). The expression levels of the AQP genes in each tissue and growth stage/condition were represented by the FPKM (Fragments Per Kilobase of transcript per Million fragments mapped) values. Heatmaps of AQPs gene were generated through Morpheus software (https://software.broadinstitute.org/morpheus/#).

    Different solutions, which were water (W), 0.3 M mannitol (M), and fullerol of different concentrations dissolved in 0.3 M mannitol (MF), were used in this study. MF solutions with the fullerol concentration of 10, 50, 100, and 500 mg/L were denoted as MF1, MF2, MF3, and MF4, respectively. Seeds of 'SQ-1', a Chinese landrace accession of a pea, were germinated in two layers of filter paper with 30 mL of each solution in Petri dishes (12 cm in diameter) each solution, and the visual phenotype and radicle lengths of 150 seeds for each treatment were analyzed 72 h after soaking. The radicle lengths were measured using a ruler. Multiple comparisons for each treatment were performed using the SSR-Test method with the software SPSS 20.0 (IBM SPSS Statistics, Armonk, NY, USA).

    Total RNA was extracted from imbibing embryos after 12 h of seed soaking in the W, M, and MF3 solution, respectively, by using Trizol reagent (Invitrogen, Carlsbad, CA, USA). The quality and quantity of the total RNA were measured through electrophoresis on 1% agarose gel and an Agilent 2100 Bioanalyzer respectively (Agilent Technologies, Santa Rosa, USA). The TruSeq RNA Sample Preparation Kit was utilized to construct an RNA-Seq library from 5 µg of total RNA from each sample according to the manufacturer's instruction (Illumina, San Diego, CA, USA). Next-generation sequencing of nine libraries were performed through Novaseq 6000 platform (Illumina, San Diego, CA, USA).

    First of all, by using SeqPrep (https://github.com/jstjohn/SeqPrep) and Sickle (https://github.com/najoshi/sickle) the raw RNA-Seq reads were filtered and trimmed with default parameters. After filtering, high-quality reads were mapped onto the pea reference genome (https://urgi.versailles.inra.fr/Species/Pisum) by using TopHat (V2.1.0)[43]. Using Cufflinks, the number of mapped reads from each sample was determined and normalised to FPKM for each predicted transcript (v2.2.1). Pairwise comparisons were made between W vs M and W vs M+F treatments. The DEGs with a fold change ≥ 1.5 and false discovery rate (FDR) adjusted p-values ≤ 0.05 were identified by using Cuffdiff[44].

    qPCR was performed by using TOROGGreen® qPCR Master Mix (Toroivd, Shanghai, China) on a qTOWER®3 Real-Time PCR detection system (Analytik Jena, Germany). The reactions were performed at 95 °C for 60 s, followed by 42 cycles of 95 °C for 10 s and 60 °C for 30 s. Quantification of relative expression level was achieved by normalization against the transcripts of the housekeeping genes β-tubulin according to Kreplak et al.[35]. The primer sequences for reference and target genes used are listed in Supplemental Table S3.

    The homology-based analysis identifies 41 putative AQPs in the garden pea genome. Among them, all but two genes (Psat0s3550g0040.1, Psat0s2987g0040.1) encode full-length aquaporin-like sequences (Table 1). The conserved protein domain analysis later validated all of the expected AQPs (Supplemental Table S2). To systematically classify these genes and elucidate their relationship with the AQPs from other plants' a phylogenetic tree was created. It clearly showed that the AQPs from pea and its close relative M. truncatula formed four distinct clusters, which represented the different subfamilies of AQPs i.e. TIPs, PIPs, NIPs, and SIPs (Fig. 1a). However, out of the 41 identified pea AQPs, 4 AQPs couldn't be tightly aligned with the Medicago AQPs and thus were put to a new phylogenetic tree constructed with AQPs from rice, Arabidopsis, and soybean. This additional analysis assigned one of the 4 AQPs to the XIP subfamily and the rest three to the TIP or NIP subfamilies (Fig. 1b). Therefore, it is concluded that the 41 PsAQPs comprise 11 PsTIPs, 15 PsNIPs, 9 PsPIPs, 5 PsSIPs, and 1 PsXIP (Table 2). The PsPIPs formed two major subgroups namely PIP1s and PIP2s, which comprise three and six members, respectively (Table 1). The PsTIPs formed two major subgroups TIPs 1 (PsTIP1-1, PsTIP1-3, PsTIP1-4, PsTIP1-7) and TIPs 2 (PsTIP2-1, PsTIP2-2, PsTIP2-3, PsTIP2-6) each having four members (Table 2). Detailed information such as gene/protein names, accession numbers, the length of deduced polypeptides, and protein structural features are presented in Tables 1 & 2

    Table 1.  Description and distribution of aquaporin genes identified in the garden pea genome.
    Chromosome
    S. NoGene NameGene IDGene length
    (bp)
    LocationStartEndTranscription length (bp)CDS length
    (bp)
    Protein length
    (aa)
    1PsPIP1-1Psat5g128840.32507chr5LG3231,127,859231,130,365675675225
    2PsPIP1-2Psat2g034560.11963chr2LG149,355,95849,357,920870870290
    3PsPIP1-4Psat2g182480.11211chr2LG1421,647,518421,648,728864864288
    4PsPIP2-1Psat6g183960.13314chr6LG2369,699,084369,702,397864864288
    5PsPIP2-2-1Psat4g051960.11223chr4LG486,037,44686,038,668585585195
    6PsPIP2-2-2Psat5g279360.22556chr5LG3543,477,849543,480,4042555789263
    7PsPIP2-3Psat7g228600.22331chr7LG7458,647,213458,649,5432330672224
    8PsPIP2-4Psat3g045080.11786chr3LG5100,017,377100,019,162864864288
    9PsPIP2-5Psat0s3550g0040.11709scaffold0355020,92922,63711911191397
    10PsTIP1-1Psat3g040640.12021chr3LG589,426,47389,428,493753753251
    11PsTIP1-3Psat3g184440.12003chr3LG5393,920,756393,922,758759759253
    12PsTIP1-4Psat7g219600.12083chr7LG7441,691,937441,694,019759759253
    13PsTIP1-7Psat6g236600.11880chr6LG2471,659,417471,661,296762762254
    14PsTIP2-1Psat1g005320.11598chr1LG67,864,8107,866,407750750250
    15PsTIP2-2Psat4g198360.11868chr4LG4407,970,525407,972,392750750250
    16PsTIP2-3Psat1g118120.12665chr1LG6230,725,833230,728,497768768256
    17PsTIP2-6Psat2g177040.11658chr2LG1416,640,482416,642,139750750250
    18PsTIP3-2Psat6g054400.11332chr6LG254,878,00354,879,334780780260
    19PsTIP4-1Psat6g037720.21689chr6LG230,753,62430,755,3121688624208
    20PsTIP5-1Psat7g157600.11695chr7LG7299,716,873299,718,567762762254
    21PsNIP1-1Psat1g195040.21864chr1LG6346,593,853346,595,7161863645215
    22PsNIP1-3Psat1g195800.11200chr1LG6347,120,121347,121,335819819273
    23PsNIP1-5Psat7g067480.12365chr7LG7109,420,633109,422,997828828276
    24PsNIP1-6Psat7g067360.12250chr7LG7109,270,462109,272,711813813271
    25PsNIP1-7Psat1g193240.11452chr1LG6344,622,606344,624,057831831277
    26PsNIP2-1-2Psat3g197520.1669chr3LG5420,092,382420,093,050345345115
    27PsNIP2-2-2Psat3g197560.1716chr3LG5420,103,168420,103,883486486162
    28PsNIP3-1Psat2g072000.11414chr2LG1133,902,470133,903,883798798266
    29PsNIP4-1Psat7g126440.11849chr7LG7209,087,362209,089,210828828276
    30PsNIP4-2Psat5g230920.11436chr5LG3463,340,575463,342,010825825275
    31PsNIP5-1Psat6g190560.11563chr6LG2383,057,323383,058,885867867289
    32PsNIP6-1Psat5g304760.45093chr5LG3573,714,868573,719,9605092486162
    33PsNIP6-2Psat7g036680.12186chr7LG761,445,34161,447,134762762254
    34PsNIP6-3Psat7g259640.12339chr7LG7488,047,315488,049,653918918306
    35PsNIP7-1Psat6g134160.24050chr6LG2260,615,019260,619,06840491509503
    36PsSIP1-1Psat3g091120.13513chr3LG5187,012,329187,015,841738738246
    37PsSIP1-2Psat1g096840.13609chr1LG6167,126,599167,130,207744744248
    38PsSIP1-3Psat7g203280.12069chr7LG7401,302,247401,304,315720720240
    39PsSIP2-1-1Psat0s2987g0040.1706scaffold02987177,538178,243621621207
    40PsSIP2-1-2Psat3g082760.13135chr3LG5173,720,100173,723,234720720240
    41PsXIP2-1Psat7g178080.12077chr7LG7335,167,251335,169,327942942314
    bp: base pair, aa: amino acid.
     | Show Table
    DownLoad: CSV
    Figure 1.  Phylogenetic analysis of the identified AQPs from pea genome. (a) The pea AQPs proteins aligned with those from the cool-season legume Medicago truncatual. (b) The four un-assigned pea AQPs in (a) (denoted as NA) were further aligned with the AQPs of rice, soybean, and Arabidopsis by using the Clustal W program implemented in MEGA 7 software. The nomenclature of PsAQPs was based on homology with the identified aquaporins that were clustered together.
    Table 2.  Protein information, conserved amino acid residues, trans-membrane domains, selectivity filter, and predicted subcellular localization of the 39 full-length pea aquaporins.
    S. NoAQPsGeneLengthTMHNPANPAar/R selectivity filterpIWoLF PSORTPlant-mPLoc
    LBLEH2H5LE1LE2
    Plasma membrane intrinsic proteins (PIPs)
    1PsPIP1-1Psat5g128840.32254NPA0F0008.11PlasPlas
    2PsPIP1-2Psat2g034560.12902NPANPAFHTR9.31PlasPlas
    3PsPIP1-4Psat2g182480.12886NPANPAFHTR9.29PlasPlas
    4PsPIP2-1Psat6g183960.12886NPANPAFHT08.74PlasPlas
    5PsPIP2-2-1Psat4g051960.1195300FHTR8.88PlasPlas
    6PsPIP2-2-2Psat5g279360.22635NPANPAFHTR5.71PlasPlas
    7PsPIP2-3Psat7g228600.22244NPA0FF006.92PlasPlas
    8PsPIP2-4Psat3g045080.12886NPANPAFHTR8.29PlasPlas
    Tonoplast intrinsic proteins (TIPs)
    1PsTIP1-1Psat3g040640.12517NPANPAHIAV6.34PlasVacu
    2PsTIP1-3Psat3g184440.12536NPANPAHIAV5.02Plas/VacuVacu
    3PsTIP1-4Psat7g219600.12537NPANPAHIAV4.72VacuVacu
    4PsTIP1-7Psat6g236600.12546NPANPAHIAV5.48Plas/VacuVacu
    5PsTIP2-1Psat1g005320.12506NPANPAHIGR8.08VacuVacu
    6PsTIP2-2Psat4g198360.12506NPANPAHIGR5.94Plas/VacuVacu
    7PsTIP2-3Psat1g118120.12566NPANPAHIAL6.86Plas/VacuVacu
    8PsTIP2-6Psat2g177040.12506NPANPAHIGR4.93VacuVacu
    9PsTIP3-2Psat6g054400.12606NPANPAHIAR7.27Plas/VacuVacu
    10PsTIP4-1Psat6g037720.22086NPANPAHIAR6.29Vac/ plasVacu
    11PsTIP5-1Psat7g157600.12547NPANPANVGC8.2Vacu /plasVacu/Plas
    Nodulin-26 like intrisic proteins (NIPs)
    1PsNIP1-1Psat1g195040.22155NPA0WVF06.71PlasPlas
    2PsNIP1-3Psat1g195800.12735NPANPVWVAR6.77PlasPlas
    3PsNIP1-5Psat7g067480.12766NPANPVWVAN8.98PlasPlas
    4PsNIP1-6Psat7g067360.12716NPANPAWVAR8.65Plas/VacuPlas
    5PsNIP1-7Psat1g193240.12776NPANPAWIAR6.5Plas/VacuPlas
    6PsNIP2-1-2Psat3g197520.11152NPAOG0009.64PlasPlas
    7PsNIP2-2-2Psat3g197560.116230NPA0SGR6.51PlasPlas
    8PsNIP3-1Psat2g072000.12665NPANPASIAR8.59Plas/VacuPlas
    9PsNIP4-1Psat7g126440.12766NPANPAWVAR6.67PlasPlas
    10PsNIP4-2Psat5g230920.12756NPANPAWLAR7.01PlasPlas
    11PsNIP5-1Psat6g190560.12895NPSNPVAIGR7.1PlasPlas
    12PsNIP6-1Psat5g304760.41622NPA0I0009.03PlasPlas
    13PsNIP6-2Psat7g036680.1254000G0005.27ChloPlas/Nucl
    14PsNIP6-3Psat7g259640.13066NPANPVTIGR8.32PlasPlas
    15PsNIP7-1Psat6g134160.25030NLK0WGQR8.5VacuChlo/Nucl
    Small basic intrinsic proteins (SIPs)
    1PsSIP1-1Psat3g091120.12466NPTNPAVLPN9.54PlasPlas/Vacu
    2PsSIP1-2Psat1g096840.12485NTPNPAIVPL9.24VacuPlas/Vacu
    3PsSIP1-3Psat7g203280.12406NPSNPANLPN10.32ChloPlas
    4PsSIP2-1-2Psat3g082760.12404NPLNPAYLGS10.28PlasPlas
    Uncharacterized X intrinsic proteins (XIPs)
    1PsXIP2-1Psat7g178080.13146SPVNPAVVRM7.89PlasPlas
    Length: protein length (aa); pI: Isoelectric point; Trans-membrane helicase (TMH) represents for the numbers of Trans-membrane helices predicted by TMHMM Server v.2.0 tool; WoLF PSORT and Plant-mPLoc: best possible cellualr localization predicted by the WoLF PSORT and Plant-mPLoc tool, respectively (Chlo Chloroplast, Plas Plasma membrane, Vacu Vacuolar membrane, Nucl Nucleus); LB: Loop B, L: Loop E; NPA: Asparagine-Proline-Alanine; H2 represents for Helix 2, H5 represents for Helix 5, LE1 represents for Loop E1, LE2 represents for Loop E2, Ar/R represents for Aromatic/Arginine.
     | Show Table
    DownLoad: CSV

    To understand the genome distribution of the 41 PsAQPs, we mapped these genes onto the seven chromosomes of a pea to retrieve their physical locations (Fig. 2). The greatest number (10) of AQPs were found on chromosome 7, whereas the least (2) on chromosome 4 (Fig. 2 and Table 1). Chromosomes 1 and 6 each contain six aquaporin genes, whereas chromosomes 2, 3, and 5 carry four, seven, and four aquaporin genes, respectively (Fig. 2). The trend of clustered distribution of AQPs was seen on specific chromosomes, particularly near the end of chromosome 7.

    Figure 2.  Chromosomal localization of the 41 PsAQPs on the seven chromosomes of pea. Chr1-7 represents the chromosomes 1 to 7. The numbers on the right of each chromosome show the physical map positions of the AQP genes (Mbp). Blue, green, orange, brown, and black colors represent TIPs, NIPs, PIPs, SIPs, and XIP, respectively.

    The 39 full-length PsAQP proteins have a length of amino acid ranging from 115 to 503 (Table 1) and Isoelectric point (pI) values ranging from 4.72 to 10.35 (Table 2). As a structural signature, transmembrane domains were predicted to exist in all PsAQPs, with the number in individual AQPs varying from 2 to 6. By subfamilies, TIPs harbor the greatest number of TM domains in total, followed by PIPs, NIPs, SIPs, and XIP (Table 2). Exon-intron structure analysis showed that most PsAQPs (16/39) having two introns, while ten members had three, seven members had four, and five members had only one intron (Fig. 3). Overall, PsAQPs exhibited a complex structure with varying intron numbers, positions, and lengths.

    Figure 3.  The exon-intron structures of the AQP genes in pea. Upstream/downstream region, exon, and intron are represented by a blue box, yellow box, and grey line, respectively.

    As aforementioned, generally highly conserved two NPA motifs generate an electrostatic repulsion of protons in AQPs to form the water channel, which is essential for the transport of substrate molecules[15]. In order to comprehend the potential physiological function and substrate specificity of pea aquaporins, NPA motifs (LB, LE) and residues at the ar/R selectivity filter (H2, H5, LE1, and LE2) were examined. (Table 2). We found that all PsTIPs and most PsPIPs had two conserved NPA motifs except for PsPIP1-1, PsPIP2-2-1, and PsPIP2-3, each having a single NPA motif. Among PsNIPs, PsNIP1-6, PsNIP1-6, PsNIP1-7, PsNIP3-1, PsNIP4-1 and PSNIP4-2 had two NPA domains, while PsNIP1-1, PsNIP2-1-2, PsNIP2-2-2 and PsNIP6-1 each had a single NPA motif. In the PsNIP sub-family, the first NPA motif showed an Alanine (A) to Valine (V) substitution in three PsNIPs (PsNIP1-3, PsNIP1-5, and PsNIP6-3) (Table 2). Furthermore, the NPA domains of all members of the XIP and SIP subfamilies were different. The second NPA motif was conserved in PsSIP aquaporins, however, all of the first NPA motifs had Alanine (A) replaced by Leucine (L) (PsSIP2-1-1, PsSIP2-1-2) or Threonine (T) (PsSIP1-1). In comparison to other subfamilies, this motif variation distinguishes water and solute-transporting aquaporins[45].

    Compared to NPA motifs, the ar/R positions were more variable and the amino acid composition appeared to be subfamily-dependent. The majority of PsPIPs had phenylalanine at H2, histidine at H5, threonine at LE1, and arginine at LE2 selective filter (Table 2). All of the PsTIP1 members had a Histidine-Isoleucine-Alanine-Valine structure at this position, while all PsTIP2 members but PsTIP2-3 harbored Histidine-Isoleucine-Glycine-Arginine. Similarly, PsNIPs, PsSIPs and PsXIP also showed subgroup-specific variation in ar/R selectivity filter (Table 2). Each of these substitutions partly determines the function of transporting water[46].

    Sequence-based subcellular localization analysis using WoLF PSORT predicted that all PsPIPs localized in the plasma membrane, which is consistent with their subfamily classification (Table 2). Around half (5/11) of the PsTIPs (PsTIP1-4, PsTIP2-1, PsTIP2-6, PsTIP4-1, and PsTIP5-1) were predicted to localize within vacuoles. However, several TIP members (PsTIP1-1, PsTIP1-3, PsTIP1-7, PsTIP2-2, PsTIP2-3 and PsTIP3-2) were predicted to localize in plasma membranes. We then further investigated their localizations by using another software (Plant-mPLoc, Table 2), which predicted that all the PsTIPs localize within vacuoles, thus supporting that they are tonoplast related. An overwhelming majority of PsNIPs (14/15) and PsXIP were predicted to be found only in plasma membranes., which was also expected (Table 2). Collectively, the versatility in subcellular localization of the pea AQPs is implicative of their distinct roles in controlling water and/or solute transport in the context of plant cell compartmentation.

    Tissue expression patterns of genes are indicative of their functions. Since there were rich resources of RNA-Seq data from various types of pea tissues in the public database, they were used for the extraction of expression information of PsAQP genes as represented by FPKM values. A heat map was generated to show the expression patterns of PsAQP genes in 18 different tissues/stages and their responses to nitrate levels (Fig. 4). According to the heat map, PsPIP1-2, PsPIP2-3 were highly expressed in root and nodule G (Low-nitrate), whereas PsTIP1-4, PsTIP2-6, and PsNIP1-7 were only expressed in roots in comparison to other tissues. The result also demonstrated that PsPIP1-1 and PsNIP3-1 expressed more abundantly in leaf, tendril, and peduncle, whereas PsPIP2-2-2 and PsTIP1-1 showed high to moderate expressions in all the samples except for a few. Interestingly, PsTIP1-1 expression in many green tissues seemed to be oppressed by low-nitrate. In contrast, some AQPs such as PsTIP1-3, PsTIP1-7, PsTIP5-1, PsNIP1-5, PsNIP4-1, PsNIP5-1, and PsSIP2-1-1 showed higher expression only in the flower tissue. There were interesting developmental stage-dependent regulations of some AQPs in seeds (Fig. 4). For example, PsPIP2-1, PsPIP2-2-1, PsNIP1-6, PsSIP1-1, and PsSIP1-2 were more abundantly expressed in the Seed_12 dap (days after pollination;) tissue than in the Seed_5 dai (days after imbibition) tissue; reversely, PsPIP2-2-2, PsPIP2-4, PsTIP2-3, and PsTIP3-2 showed higher expression in seed_5 dai in compare to seed_12 dap tissues (Fig. 4). The AQP genes may have particular functional roles in the growth and development of the pea based on their tissue-specific expression.

    Figure 4.  Heatmap analysis of the expression of pea AQP gene expressions in different tissues using RNA-seq data (PRJNA267198). Normalized expression of aquaporins in terms of reads per kilobase of transcript per million mapped reads (RPKM) showing higher levels of PIPs, NIPs, TIPs SIPs, and XIP expression across the different tissues analyzed. (Stage A represents 7-8 nodes; stage B represents the start of flowering; stage D represents germination, 5 d after imbibition; stage E represents 12 d after pollination; stage F represents 8 d after sowing; stage G represents 18 d after sowing, LN: Low-nitrate; HN: High-nitrate.

    Expressions of plant AQPs in vegetative tissues under normal and stressed conditions have been extensively studied[15]; however, little is known about the transcriptional regulation of AQP genes in seeds/embryos. To provide insights into this specific area, wet-bench RNA-Seq was performed on the germinating embryo samples isolated from water (W)-imbibed seeds and those treated with mannitol (M, an osmotic reagent), mannitol, and mannitol plus fullerol (F, a nano-antioxidant). The phenotypic evaluation showed that M treatment had a substantial inhibitory effect on radicle growth, whereas the supplement of F significantly mitigated this inhibition at all concentrations, in particular, 100 mg/mL in MF3, which increased the radicle length by ~33% as compared to that under solely M treatment (Fig. 5). The expression values of PsAQP genes were removed from the RNA-Seq data, and pairwise comparisons were made within the Group 1: W vs M, and Group 2: W vs MF3, where a total of ten and nince AQPs were identified as differentially expressed genes (DEGs), respectively (Fig. 6). In Group 1, six DEGs were up-regulated and four DEGs down-regulated, whereas in Group 2, six DEGs were up-regulated and three DEGs down-regulated. Four genes viz. PsPIPs2-5, PsNIP6-3, PsTIP2-3, and PsTIP3-2 were found to be similarly regulated by M or MF3 treatment (Fig. 6), indicating that their regulation by osmotic stress couldn't be mitigated by fullerol. Three genes, all being PsNIPs (1-1, 2-1-2, and 4-2), were up-regulated only under mannitol treatment without fullerol, suggesting that their perturbations by osmotic stress were migrated by the antioxidant activities. In contrast, four other genes namely PsTIP2-2, PsTIP4-1, PsNIP1-5, and PsSIP1-3 were only regulated under mannitol treatment when fullerol was present.

    Figure 5.  The visual phenotype and radicle length of pea seeds treated with water (W), 0.3 M mannitol (M), and fullerol of different concentrations dissolved in 0.3 M mannitol (MF). MF1, MF2, MF3, and MF4 indicated fullerol dissolved in 0.3 M mannitol at the concentration of 10, 50, 100, and 500 mg/L, respectively. (a) One hundred and fifty grains of pea seeds each were used for phenotype analysis at 72 h after treatment. Radicle lengths were measured using a ruler in three replicates R1, R2, and R3 in all the treatments. (b) Multiple comparison results determined using the SSR-Test method were shown with lowercase letters to indicate statistical significance (P < 0.05).
    Figure 6.  Venn diagram showing the shared and unique differentially expressed PsAQP genes in imbibing seeds under control (W), Mannitol (M) and Mannitol + Fullerol (MF3) treatments. Up-regulation (UG): PsPIP2-5, PsNIP1-1, PsNIP2-1-2, PsNIP4-2, PsNIP6-3, PsNIP1-5, PsTIP2-2, PsTIP4-1, PsSIP1-3, PsXIP2-1; Down-regulation (DG): PsTIP2-3, PsTIP3-2, PsNIP1-7, PsNIP5-1, PsXIP2-1.

    As a validation of the RNA-Seq data, eight genes showing differential expressions in imbibing seeds under M or M + F treatments were selected for qRT-PCR analysis, which was PsTIP4-1, PsTIP2-2, PsTIP2-3, PsTIP3-2, PsPIP2-5, PsXIP2-1, PsNIP6-3 and PsNIP1-5 shown in Fig 6, the expression modes of all the selected genes but PsXIP2-1 were well consistent between the RNA-Seq and the qRT-PCR data. PsXIP2-1, exhibiting slightly decreased expression under M treatment according to RNA-Seq, was found to be up-regulated under the same treatment by qRT-PCR (Fig. 7). This gene was therefore removed from further discussions.

    Figure 7.  The expression patterns of seven PsAQPs in imbibing seeds as revealed by RNA-Seq and qRT-PCR. The seeds were sampled after 12 h soaking in three different solutions, namely water (W), 0.3 M mannitol (M), and 100 mg/L fullerol dissolved in 0.3 M mannitol (MF3) solution. Error bars are standard errors calculated from three replicates.

    This study used the recently available garden pea genome to perform genome-wide identification of AQPs[35] to help understand their functions in plant growth and development. A total of 39 putative full-length AQPs were found in the garden pea genome, which is very similar to the number of AQPs identified in many other diploid legume crops such as 40 AQPs genes in pigeon pea, chickpea, common bean[7,47,48], and 44 AQPs in Medicago[49]. On the other hand, the number of AQP genes in pea is greater compared to diploid species like rice (34)[4], Arabidopsis thaliana (35)[3], and 32 and 36 in peanut A and B genomes, respectively[8]. Phylogenetic analysis assigned the pea AQPs into all five subfamilies known in plants, whereas the presence of only one XIP in this species seems less than the number in other diploid legumes which have two each in common bean and Medicago[5,48,49]. The functions of the XIP-type AQP will be of particular interest to explore in the future.

    The observed exon-intron structures in pea AQPs were found to be conserved and their phylogenetic distribution often correlated with these structures. Similar exon-intron patterns were seen in PIPs and TIPs subfamily of Arabidopsis, soybean, and tomato[3,6,50]. The two conserved NPA motifs and the four amino acids forming the ar/R SF mostly regulate solute specificity and transport of the substrate across AQPs[47,51]. According to our analysis, all the members of each AQP subfamilies in garden pea showed mostly conserved NPA motifs and a similar ar/R selective filter. Interestingly, most PsPIPs carry double NPA in LB and LE and a hydrophilic ar/R SF (F/H/T/R) as observed in three legumes i.e., common bean[48], soybean[5] chickpea[7], showing their affinity for water transport. All the TIPs of garden pea have double NPA in LB and LE and wide variation at selectivity filters. Most PsTIP1s (1-1, 1-3, 1-4, and 1-7) were found with H-I-A-V ar/R selectivity filter similar to other species such as Medicago, Arachis, and common bean, that are reported to transport water and other small molecules like boron, hydrogen peroxide, urea, and ammonia[52]. Compared with related species, the TIPs residues in the ar/R selectivity filter were very similar to those in common bean[48], Medicago[49], and Arachis[8]. In the present study, the NIPs, NIP1s (1-3, 1-5, 1-6, and1-7), and NIP2-2-2 genes have G-S-G-R selectivity. Interestingly, NIP2s with a G-S-G-R selectivity filter plays an important role in silicon influx (Si) in many plant species such as Soybean and Arachis[6,8]. It was reported that Si accumulation protects plants against various types of biotic and abiotic stresses[53].

    The subcellular localization investigation suggested that most of the PsAQPs were localized to the plasma membrane or vacuolar membrane. The members of the PsPIPs, PsNIPs, and PsXIP subfamilies were mostly located in the plasma membrane, whereas members of the PsTIPs subfamily were often predicted to localize in the vacuolar membrane. Similar situations were reported in many other legumes such as common bean, soybean, and chickpea[5,7,48]. Apart from that, PsSIPs subfamily were predicted to localize to the plasma membrane or vacuolar membrane, and some AQPs were likely to localize in broader subcellular positions such as the nucleus, cytosol, and chloroplast, which indicates that AQPs may be involved in various molecular transport functions.

    AQPs have versatile physiological functions in various plant organs. Analysis of RNA-Seq data showed a moderate to high expression of the PsPIPs in either root or green tissues except for PsPIP2-4, indicating their affinity to water transport. In several other species such as Arachis[8], common bean[48], and Medicago[49], PIPs also were reported to show high expressions and were considered to play an important role to maintain root and leaf hydraulics. Also interestingly, PsTIP2-3 and PsTIP3-2 showed high expressions exclusively in seeds at 5 d after imbibition, indicating their specific roles in seed germination. Earlier, a similar expression pattern for TIP3s was reported in Arabidopsis during the initial phase of seed germination and seed maturation[54], soybean[6], canola[55], and Medicago[49], suggesting that the main role of TIP3s in regulating seed development is conserved across species.

    Carbon nanoparticles such as fullerol have a wide range of potential applications as well as safety concerns in agriculture. Fullerol has been linked to plant protection from oxidative stress by influencing ROS accumulation and activating the antioxidant system in response to drought[56]. The current study revealed that fullerol at an adequate concentration (100 mg/L), had favorable effects on osmotic stress alleviation. In this study, the radical growth of germinating seeds was repressed by the mannitol treatment, and many similar observations have been found in previous studies[57]. Furthermore, mannitol induces ROS accumulation in plants, causing oxidative stress[58]. Our work further validated that the radical growth of germinating seeds were increased during fullerol treatment. Fullerol increased the length of roots and barley seeds, according to Panova et al.[32]. Fullerol resulted in ROS detoxification in seedlings subjected to water stress[32].

    Through transcriptomic profiling and qRT-PCR, several PsAQPs that responded to osmotic stress by mannitol and a combination of mannitol and fullerol were identified. Most of these differentially expressed AQPs belonged to the TIP and NIP subfamilies. (PsTIP2-2, PsTIP2-3, and PsTIP 3-2) showed higher expression by mannitol treatment, which is consistent with the fact that many TIPs in other species such as GmTIP2;3 and Eucalyptus grandis TIP2 (EgTIP2) also showed elevated expressions under osmotic stress[54,59]. The maturation of the vacuolar apparatus is known to be aided by the TIPs, which also enable the best possible water absorption throughout the growth of embryos and the germination of seeds[60]. Here, the higher expression of PsTIP (2-2, 2-3, and 3-2) might help combat water deficiency in imbibing seeds due to osmotic stress. The cellular signals triggering such transcriptional regulation seem to be independent of the antioxidant system because the addition of fullerol didn’t remove such regulation. On the other hand, the mannitol-induced regulation of most PsNIPs were eliminated when fullerol was added, suggesting either a response of these NIPs to the antioxidant signals or being due to the mitigated cellular stress. Based on our experimental data and previous knowledge, we propose that the fullerol-induced up- or down-regulation of specific AQPs belonging to different subfamilies and locating in different subcellular compartments, work coordinatedly with each other, to maintain the water balance and strengthen the tolerance to osmotic stress in germinating pea seeds through reduction of ROS accumulation and enhancement of antioxidant enzyme levels. Uncategorized X intrinsic proteins (XIPs) Aquaporins are multifunctional channels that are accessible to water, metalloids, and ROS.[32,56]. Due likely to PCR bias, the expression data of PsXIP2-1 from qRT-PCR and RNA-Seq analyses didn’t match well, hampering the drawing of a solid conclusion about this gene. Further studies are required to verify and more deeply dissect the functions of each of these PsAQPs in osmotic stress tolerance.

    A total of 39 full-length AQP genes belonging to five sub-families were identified from the pea genome and characterized for their sequences, phylogenetic relationships, gene structures, subcellular localization, and expression profiles. The number of AQP genes in pea is similar to that in related diploid legume species. The RNA-seq data revealed that PsTIP (2-3, 3-2) showed high expression in seeds for 5 d after imbibition, indicating their possible role during the initial phase of seed germination. Furthermore, gene expression profiles displayed that higher expression of PsTIP (2-3, 3-2) in germinating seeds might help maintain water balance under osmotic stress to confer tolerance. Our results suggests that the biological functions of fullerol in plant cells are exerted partly through the interaction with AQPs.

    Under Bio project ID PRJNA793376 at the National Center for Biotechnology Information, raw data of sequencing read has been submitted. The accession numbers for the RNA-seq raw data are stored in GenBank and are mentioned in Supplemental Table S4.

    This study is supported by the National Key Research & Development Program of China (2022YFE0198000) and the Key Research Program of Zhejiang Province (2021C02041).

  • Pei Xu is the Editorial Board member of journal Vegetable Research. He was blinded from reviewing or making decisions on the manuscript. The article was subject to the journal's standard procedures, with peer-review handled independently of this Editorial Board member and his research group.

  • [1]

    Michael PP, Clifford BK. 1984. Insect pest management: The lesson of Liriomyza. Bulletin of the Entomological Society of America 30:22−25

    doi: 10.1093/besa/30.2.22

    CrossRef   Google Scholar

    [2]

    Gao Y, Reitz S, Xing L, Ferguson S, Lei Z. 2017. A decade of leafminer invasion in China: lessons learned. Pest Management Science 73:1775−79

    doi: 10.1002/ps.4591

    CrossRef   Google Scholar

    [3]

    Chang YW, Chen JY, Lu MX, Gao Y, Tian ZH, et al. 2017. Cloning and expression of genes encoding heat shock proteins in Liriomyza trifolii and comparison with two congener leafminer species. PLoS One 12:e0181355

    doi: 10.1371/journal.pone.0181355

    CrossRef   Google Scholar

    [4]

    Lei Z, Liu TX, Greenberg SM. 2009. Feeding, oviposition and survival of Liriomyza trifolii (Diptera: Agromyzidae) on Bt and non-Bt cottons. Bulletin of Entomological Research 99:253−61

    doi: 10.1017/S0007485308006317

    CrossRef   Google Scholar

    [5]

    Chang Y, Shen Y, Dong C, Gong W, Tian Z, et al. 2016. Population dynamics of Liriomyza trifolii and Liriomyza sativae in Jiangsu. Chinese Journal of Applied Entomology 53:884−91

    Google Scholar

    [6]

    Luo F, Kong X, Wang S, Xiao C, Liu Y, et al. 2016. Investigation on the population distribution of the Liriomyza trifolii and Liriomyza sativae on cowpea. Chinese Journal of Tropical Agriculture 36:49−51

    doi: 10.12008/j.issn.1009-2196.2016.08.011

    CrossRef   Google Scholar

    [7]

    Li F, Gong X, Yuan L, Pan X, Jin H, et al. 2022. Indoxacarb resistance-associated mutation of Liriomyza trifolii in Hainan, China. Pesticide Biochemistry and Physiology 183:105054

    doi: 10.1016/j.pestbp.2022.105054

    CrossRef   Google Scholar

    [8]

    Sanderson JP, Parrella MP, Trumble JT. 1989. Monitoring Insecticide Resistance in Liriomyza trifolii (Diptera: Agromyzidae) with Yellow Sticky Cards. Journal of Economic Entomology 82:1011−18

    doi: 10.1093/jee/82.4.1011

    CrossRef   Google Scholar

    [9]

    Wang Y, Jin Y, Chang Y, Qian B, Gong W, et al. 2020. Techniques for controlling Liriomyza trifolii. Chinese Journal of Applied Entomology 57:1190−97

    doi: 10.7679/j.issn.2095-1353.2020.122

    CrossRef   Google Scholar

    [10]

    Xiang J. 2011. Preliminary studies on interspecific competition between the Liriomyza sativae, Liriomyza trifolii and Liriomyza huidobrensis. Thesis. Chinese Academy of Agricultural Sciences, Beijing, pp. 1−70.

    [11]

    Xiao T, Chen X, Yang H, Guo J, Yang J, et al. 2011. Study on the developmental zero and effective cumulative temperature of Liriomyza trifolii. Journal of Environmental Entomology 33:8−12

    doi: 10.3969/j.issn.1674-0858.2011.01.002

    CrossRef   Google Scholar

    [12]

    Folmer O, Black M, Hoeh W, Lutz R, Vrijenhoek R. 1994. DNA primers for amplification of mitochondrial cytochrome c oxidase subunit I from diverse metazoan invertebrates. Molecular marine biology biotechnology 3:294−99

    Google Scholar

    [13]

    Yu W, Lei Z, Kang Z, Gao Y. 2012. Susceptibility of the larvae of Liriomyza trifolii to abamectin, abamectin·monogram and cyromazine in Hainan. Plant Protection 38:194−96

    doi: 10.3969/j.issn.0529-1542.2012.05.042

    CrossRef   Google Scholar

    [14]

    Miller GW, Isger MB. 1985. Effects of temperature on the development of Liriomyza trifolii (Burgess) (Diptera: Agromyzidae). Bulletin of Entomological Research 75:321−28

    doi: 10.1017/s0007485300014413

    CrossRef   Google Scholar

    [15]

    Yin X, Fang X, Niu D, Liao M, Sheng C, et al. 2023. Toxicity and field efficacy of metaflumizone against the fall armyworm, Spodoptera frugiperda (Lepidoptera: Noctuidae). Acta Entomologica Sinica 66:63−70

    doi: 10.16380/j.kcxb.2023.01.008

    CrossRef   Google Scholar

    [16]

    Yang Z. 2000. A study on the effective accumulated temperature and threshold temperature for development of Chouioia cunea Yang (Hymenoptera: Eulophidae). Scientia Silvae Sinicae 36:119−22

    Google Scholar

    [17]

    Liu H, Beckenbach AT. 1992. Evolution of the mitochondrial cytochrome oxidase II gene among 10 orders of insects. Molecular Phylogenetics Evolution 1:41−52

    doi: 10.1016/1055-7903(92)90034-E

    CrossRef   Google Scholar

    [18]

    Chen J. 2020. Comparative study on morphological characters of five species of Liriomyza and genetic structure analysis of important species. Thesis. Yangzhou University, Yangzhou, China. pp. 1−139

    [19]

    Zhao JZ, Collins HL, Li YX, Mau RFL, Thompson GD. et al. 2006. Monitoring of Diamondback Moth (Lepidoptera: Plutellidae) resistance to spinosad, indoxacarb, and emamectin benzoate. Journal of Economic Entomology 99:176−81

    doi: 10.1093/jee/99.1.176

    CrossRef   Google Scholar

    [20]

    Sayyed AH, Ahmad M, Saleem MA. 2008. Cross-resistance and genetics of resistance to indoxacarb in Spodoptera litura (Lepidoptera: Noctuidae). Journal of Economic Entomology 101:472−79

    doi: 10.1603/0022-0493(2008)101[472:CAGORT]2.0.CO;2

    CrossRef   Google Scholar

    [21]

    Shono T, Zhang L, Scott JG. 2004. Indoxacarb resistance in the house fly, Musca domestica. Pesticide Biochemistry and Physiology 80:106−112

    doi: 10.1016/j.pestbp.2004.06.004

    CrossRef   Google Scholar

    [22]

    Wang J, Dong H, Yuan L. 2009. Effects of indoxacarb at sublethal concentrations on the development and activities of detoxification enzyme of Spodoptera litura. Journal of Yangzhou University (Natural Science Edition) 30:85−89

    doi: 10.16872/j.cnki.1671-4652.2009.04.020

    CrossRef   Google Scholar

    [23]

    Li F, Ai G, Li Y, Zhu C, Gao X. 2013. Progress on the mechanism of action and insectiside resistance of the oxadiazine indoxacarb in insects. Agrochemicals 52:558−560

    Google Scholar

    [24]

    Zheng J, Yi Y, Li B. 2010. A new scheme for climate regionalization in China. Acta Geographica Sinica 65:3−12

    doi: 10.11821/xb201001002

    CrossRef   Google Scholar

  • Cite this article

    Gong X, Chen Y, Dong W, Li F, Wu S. 2024. Toxicity of indoxacarb to the population of Liriomyza trifolii (Diptera: Agromyzidae) in Sanya (China), and the effects of temperature and food on its biological characteristics. Tropical Plants 3: e028 doi: 10.48130/tp-0024-0032
    Gong X, Chen Y, Dong W, Li F, Wu S. 2024. Toxicity of indoxacarb to the population of Liriomyza trifolii (Diptera: Agromyzidae) in Sanya (China), and the effects of temperature and food on its biological characteristics. Tropical Plants 3: e028 doi: 10.48130/tp-0024-0032

Figures(4)  /  Tables(6)

Article Metrics

Article views(1785) PDF downloads(368)

Other Articles By Authors

ARTICLE   Open Access    

Toxicity of indoxacarb to the population of Liriomyza trifolii (Diptera: Agromyzidae) in Sanya (China), and the effects of temperature and food on its biological characteristics

Tropical Plants  3 Article number: e028  (2024)  |  Cite this article

Abstract: Liriomyza trifolii is mainly distributed in tropical and subtropical regions, and it is one of the important invasive pests in China, which can damage a variety of plants. L. trifolii has caused serious economic losses to agriculture in China. Morphological and molecular characterization results showed that the collected Sanya field strain was L. trifolii. Bioassay results showed that the sensitivity of the 2nd instar larvae of the Sanya field strain in 2022 to indoxacarb was reduced by 776.17 times. The correlation between the activities of GST and AChE and the resistance of indoxacarb was higher. Temperature affected the developmental period and survival rate of different stages of field strains of L. trifolii, with a greater effect on the survival rate of nymphs, but no effect on the body length and weight of pupae. At 16, 25, and 34 °C, the developmental periods of larvae were shortened with the increase in temperature. The developmental periods of adults fed with honey water were significantly longer than those fed with sterile water. Based of the temperature and developmental period, the development point temperatures of eggs, larvae, pupae, and adults of L. trifolii were 10.82, 2.75, 12.30, and 7.11 °C, respectively. The results of this study may provide important theoretical support for resistance monitoring, management, and control strategies for this insect.

    • Liriomyza trifolii belongs to the genus Liriomyza of Agromyzidae, Diptera. It is one of the important quarantine pests in China[1]. It invaded into the Taiwan Province in 1988. In only 2 years, damage occurred on a variety of vegetable crops and ornamental horticultural plants[2]. It was discovered in many areas of Hainan Province in 2006, and it gradually spread to Guangxi, Fujian, Jiangsu, and Shandong[3,4]. L. trifolii is a polyvorous pest that can harm more than 300 species of plants in 25 families, including Asteraceae, legumes, Cruciferae, Solanaceae, and cucurbit[5]. The adult feed and lays eggs on the front of leaves and form nearly round puncture holes about the size of needle tips on the surface. Larvae feed on the upper layer of leaves and form irregular snaking worm channels, which changes from thin to coarse with the growth of larvae; they can seriously damage chloroplast cells in the leaves, reduce plant photosynthesis, and even cause plants to fall leaves and eventually die[1].

      Hainan has a tropical monsoon climate, and its unique climatic conditions are not only conducive to the growth and development of crops and the accumulation of nutrients but also provide a favorable growth and reproduction environment for L. trifolii[6]. The explosive occurrence of L. trifolii has seriously affected the yield and quality of cowpeas in Hainan Province thereby hindering the healthy development of the vegetable economy industry. At present, chemical control is mainly used in the field control of L. trifolii, in which indoxacarb, pyrethroids, and other pesticides are widely used[79]. Given that L. trifolii is prone to develop resistance to insecticides, and its resistance is higher than that of other species, it has replaced other species as the local dominant species in Hainan[5,10] Therefore, the problem of drug resistance has to be considered in the field control of L. trifolii. The biological characteristics of the clover spot loon must be further analyzed, chemical, physical, and biological control methods should be combined to delay its resistance to insecticides to achieve safe and effective field prevention and control[9].

      L. trifolii has strong reproduction ability and serious overlapping of generations. Hainan Province is located in the southern tip of China, and the suitable temperature in the region promotes the occurrence and spread of L. trifolii, which is becoming an increasingly serious concern. Whether the biological characteristics of L. trifolii change with the alterations in surrounding environmental factors also need to be further discovered[11]. In this study, the resistance levels of two detoxifying enzymes and acetylcholinesterase in the population of L. trifolii in a field in Sanya in 2022 were measured. On this basis, the activity levels of two detoxifying enzymes and their correlation with resistance were analyzed. The growth and development of L. trifolii at different temperatures were investigated, and the starting point temperature and effective accumulated temperature were calculated according to the effective accumulated temperature law. Finally, by feeding the samples with different foods, we studied the changes in the development period of L. trifolii under various temperatures. The results of this study will provide a scientific theoretical basis for predicting and forecasting the occurrence and damage of L. trifolii, strengthening quarantine control, and formulating green prevention and control strategies.

    • The sensitive strain was donated by Professor Du of Yangzhou University and has not been exposed to any chemical agents in the room for nearly 15 years. The field strain was collected from Yacheng Town, Yazhou District, Sanya City, Hainan Province (China) (18.373° N, 109.167° E) in 2022. The field and sensitive strains identified as L. trifolii were collected from the field and fed in the laboratory with live Vigna pea plants (Holland Green Stick Four Seasons Green. Hongliang Seed Co., Ltd., Shouguang City, Shandong Province, China), which had not been exposed to any insecticides for a long time, and then propagated and expanded for the experiment.

    • The adults were collected from the field, placed on 75% alcohol absorbent cotton with the back side up, and placed on a slide. The head, abdomen, and wings were observed and photographed with Olympus microscope SZ61 (Olympus Corporation, Japan). Four 1–3 days of L. trifolii after pupation were randomly placed into a 1.5 mL centrifuge tube, and KAPA DNA rapid extraction kit (Beijing Pukerui Biotechnology Co., LTD.) was used to extract their genomic DNA according to the manufacturer's instructions. The DNA barcode fragment of the COI gene was amplified using universal primers LCO1490 (5'-GGTCAACAAATCATAAAGATATTGG-3') and HCO2198 (5'-TAAACTTCAGGGTGACCAAAAAATCA-3'); PCR (Phanta® Max Super-Fidelity DNA Polymerase, Nanjing Nuovizan Biotechnology Co, LTD) was performed thereafter[12]. PCR was conducted as follows: predenaturation at 95 °C for 3 min, denaturation at 95 °C for 15 s, annealing at 56 °C for 15 s, and extension at 72 °C for 45 s for a total of 35 cycles; and elongation at 72 °C for 8 min. PCR purification and recovery kit (American Omega BioTek) were used for purification and recovery, and the products were sent to Haikou Nanshan Gene Biotechnology Co for sequencing. The resulting sequences were obtained using a Basic Local Alignment Search tool in the NCBI database (https://blast.ncbi.nlm.nih.gov/Blast.cgi) to compare the homology in the COI gene sequences of the clover spot hidden fly. DNAstar8.1 software (DNASTAR, USA) was used for sequence analysis.

    • The bioassay method of L. trifolii was slightly modified according to Yu et al.[13]. About 95% of the original indoxacarb was purchased from Beijing Yingtaijiahe Biotechnology Co., LTD. The original drug was diluted into 100,000 mg/L mother liquor with acetone and treated with 0.1, 1, 10, 100, and 1,000 mg/L field strains by 0.1% Triton H2O. Subsequently, 0.1% Triton H2O was diluted into 0.01, 0.1, 1, 10, and 100 mg/L, and 0.1% Triton H2O was set as the control group in both treatments. The leaves of cowpea with the second-stage larvae of L. trifolii were selected, immersed in different concentrations of insecticide, removed for 5 s, and left to dry naturally at room temperature. The petiole was moistened with absorbent cotton soaked in sterile water, placed in a petri dish (90 mm × 20 mm), and covered with wet filter paper to prevent the escape of L. trifolii. The total number of larvae treated with each concentration was 10−20, and the treatment was repeated three times. If the pupae did not normalize at 72 h, then it was considered dead.

    • The second-instar larvae of the indoor sensitive strain and the Sanya field strain were 0.01 g (about 50 larvae). The LC50 of the sensitive strain and the field population was used as the respective treatment concentration, and the leaves were soaked for 5 s and left for 30 min. An enzyme marker (Hangzhou Aosheng Instrument Co., Ltd, Hangzhou, China) was used to measure the absorption at 340, 450, and 412 nm, as described in the manual of the AChE activity detection kit (Beijing Solaibao Technology Co., Ltd, Beijing, China) for the detection of glutathione S-transferase (GST), carboxylesterase enzyme (CarE), and acetylcholinesterase enzyme (AChE). The enzyme activity before and after treatment with indoxacarb was calculated.

    • In the intelligent artificial climate incubator (Ningbo Yanghui Instrument Co., Ltd, Ningbo, China), the constant temperature was set to 16, 25, and 34 °C; the photoperiod was 16-light/8-dark; and the humidity was 60% ± 5%. Male and female adults of the newly emerged Sanya field strains were paired (1:1), fed into a cage with cowpea seedlings (50 cm long, width, and height), and allowed to mate and lay eggs. After 1 h, the cowpea seedlings with eggs were moved to incubate at constant temperatures of 16, 25, and 34 °C. The developmental periods and survival of eggs and larvae at different temperatures were directly observed on the plant, and the developmental periods and survival of pupae and adults were observed in finger tubes (2.4 cm in diameter and 9.5 cm in height). The length and weight of pupae during the development were recorded. Survival rate, developmental starting point temperature (T0), and effective accumulated temperature (K) were calculated at each developmental stage[14]. At least 30 insects were recorded under each temperature treatment, and each treatment group was independently repeated three times, where survival rate = number of surviving insects/total number of insects × 100%.

    • The male and female adults of the one-day-old L. trifolii were transferred into individual finger-shaped tubes. Ten groups were established, with each tube being treated and sealed with a breathable cotton plug. Sampling capillary tubes (φ = 0.09 cm, h = 11 cm; sold in Shanghai Great Wall Scientific Instrument Mall) dipped in sterile water or 10% honey water (1 g of honey +10 mL of sterile water) were fed in finger tubes, and adult insects were prevented from escaping. L. trifolii fed with different foods was placed in three constant-temperature intelligent artificial climate incubators set at 16, 25, and 34 °C, with a photoperiod of 16-light/8-dark and humidity of 60% ± 5%. Food was added once every 24 h, and the development of male and female adults was observed and recorded. This experiment was independently repeated three times.

    • Virulence was determined using POLO Plus software (LeOra Software Company, USA) to calculate LC50, resistance multiple, 95% confidence interval, slope, and chi-square value[15]. Resistance ratio = LC50 of field strain / LC50 of sensitive strain. Microsoft Excel 2010 (Microsoft, USA), SPSS 21.0 (IBM, USA), and GraphPad Prism 9 (USA) were used for data statistical analysis and correlation analysis, and correlation coefficients were calculated. Univariate ANOVA and Tukey's new complex range method were used to test the significance of differences. According to the developmental period (day) of each state at different temperatures (°C), the starting point temperature and effective accumulated temperature of each state were calculated[14]. The least square method was used in the calculation according to the effective accumulated temperature rule, and the formula was used as per the study by Yang[16].

    • The ratio of the length of the M3+4 terminal segment to the secondary terminal segment was about 3 (Fig. 1a). The inner and outer top bristle areas of the head were yellow (Fig. 1b). As shown in Fig. 1c, the black stripes on the back of the abdomen of L. trifolii were interrupted, and a yellow stripe formed in the middle. A yellow notch could occasionally be observed in the lower middle of the second to the last clear black stripe (Fig. 1d).
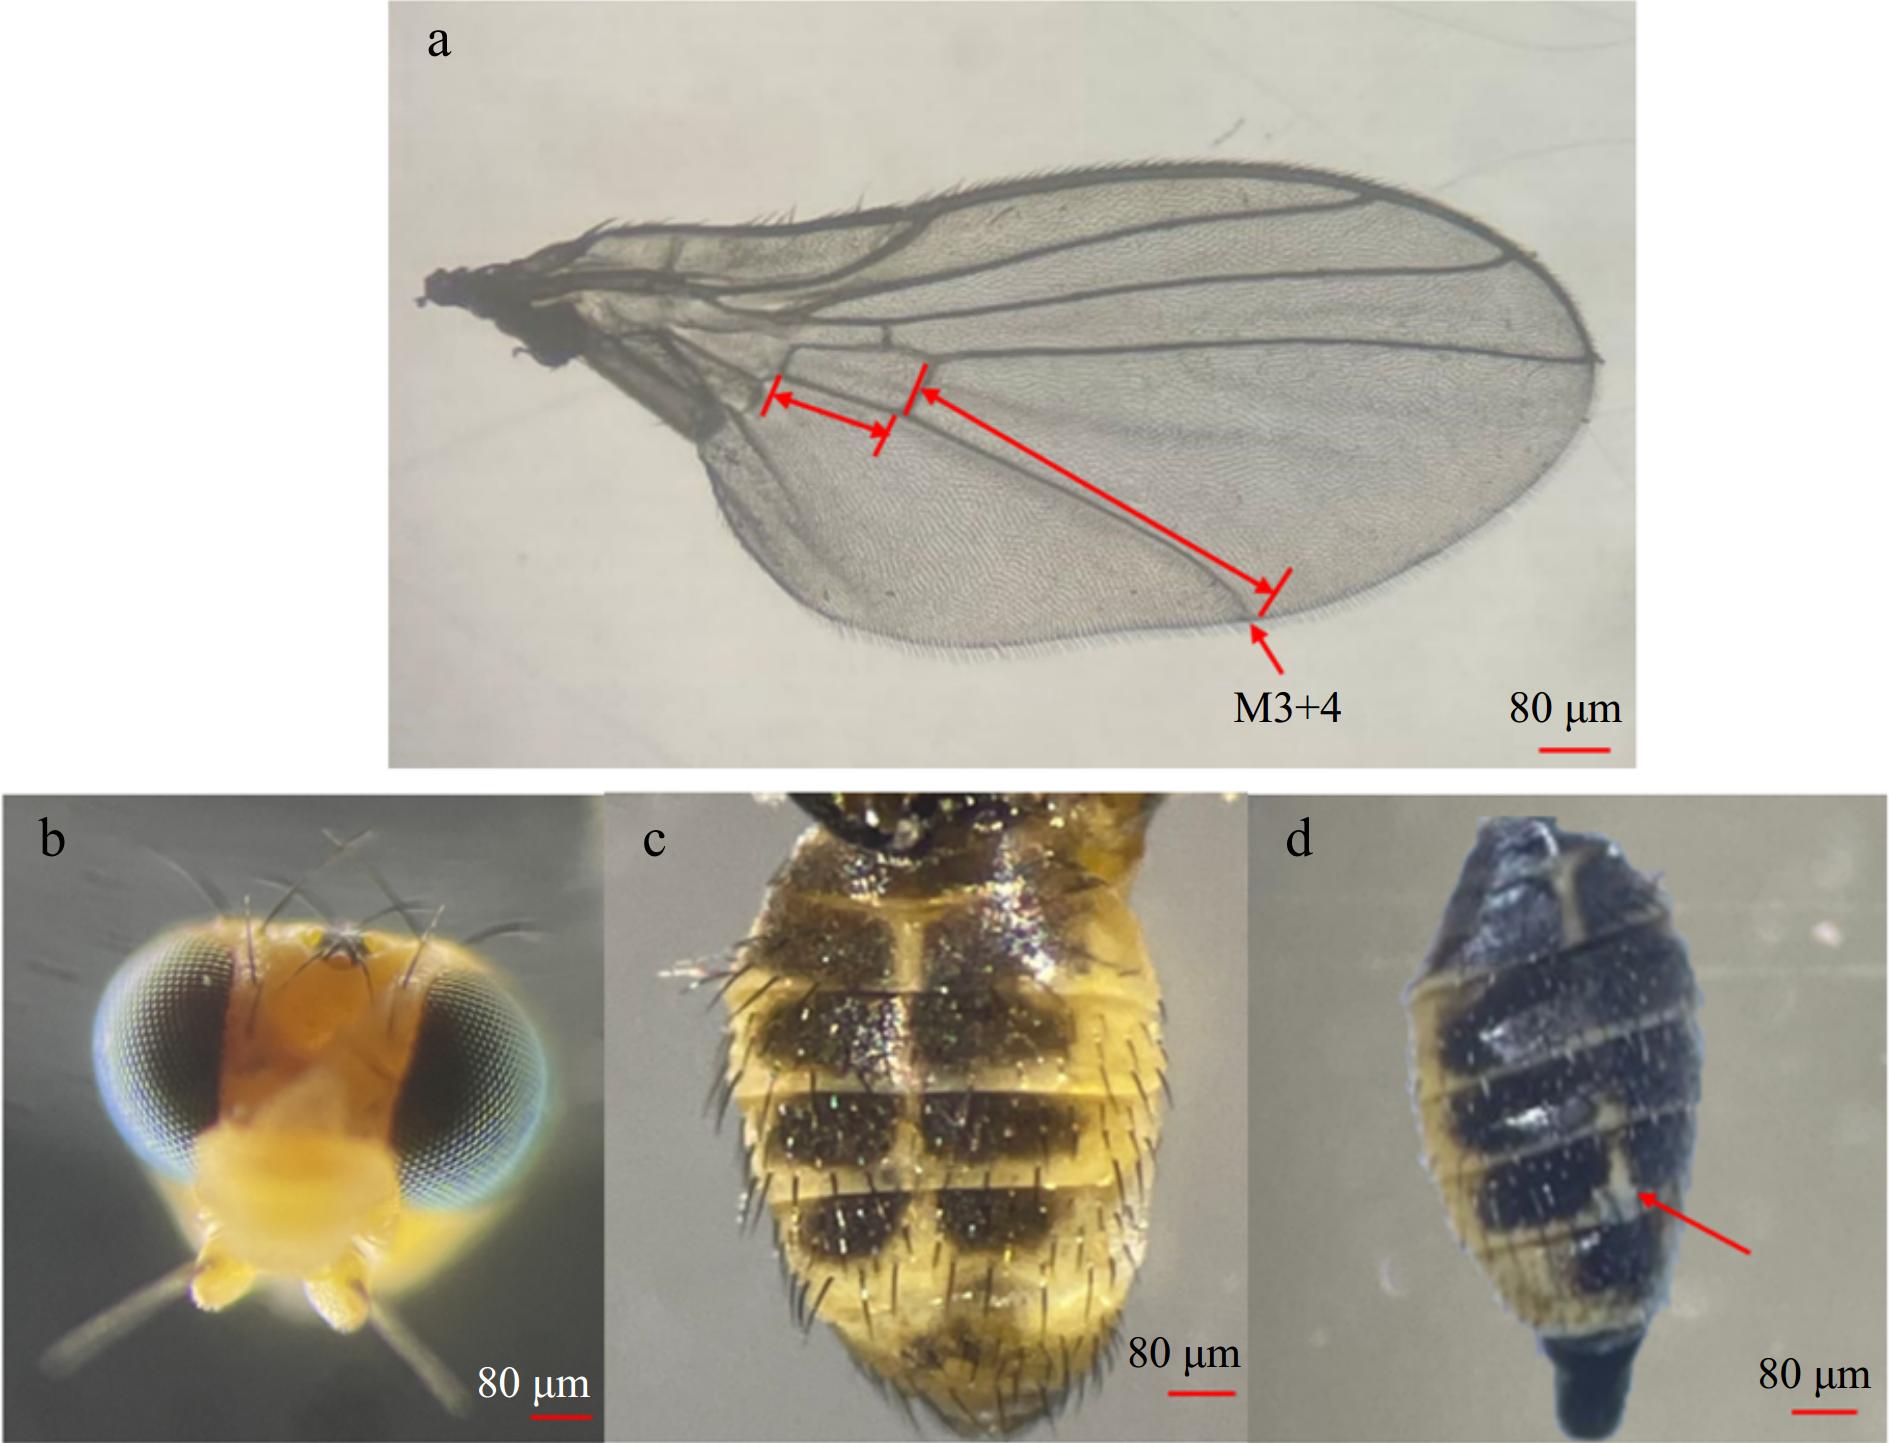
      Figure 1. 

      Anatomical morphology male adult L. trifolii. (a) Forewing, (b) head, (c), (d) dorsal side of the abdomen.

      The mitochondrial COI gene was amplified in the pupae of L. trifolii, and PCR results showed a single bright band at the expected location (Fig. 2). A COI gene sequence with a length of about 700 bp was obtained, which was blasted in the NCBI database. The results showed that the sequence was 99.84% consistent with the COI gene of L. trifolii (Gene Bank entry number: ON565812.1). The contents of the A, G, C, and T bases in the measured COI gene sequence were 30.15%, 22.7%, 18.8%, and 28.4%, respectively. The content of A + T was 58.5%, and the content of G+C was 41.5% (Fig. 3). The results revealed an obvious bias toward the A+T base, which was consistent with the characteristics of the base composition of insect mitochondrial genes[17].
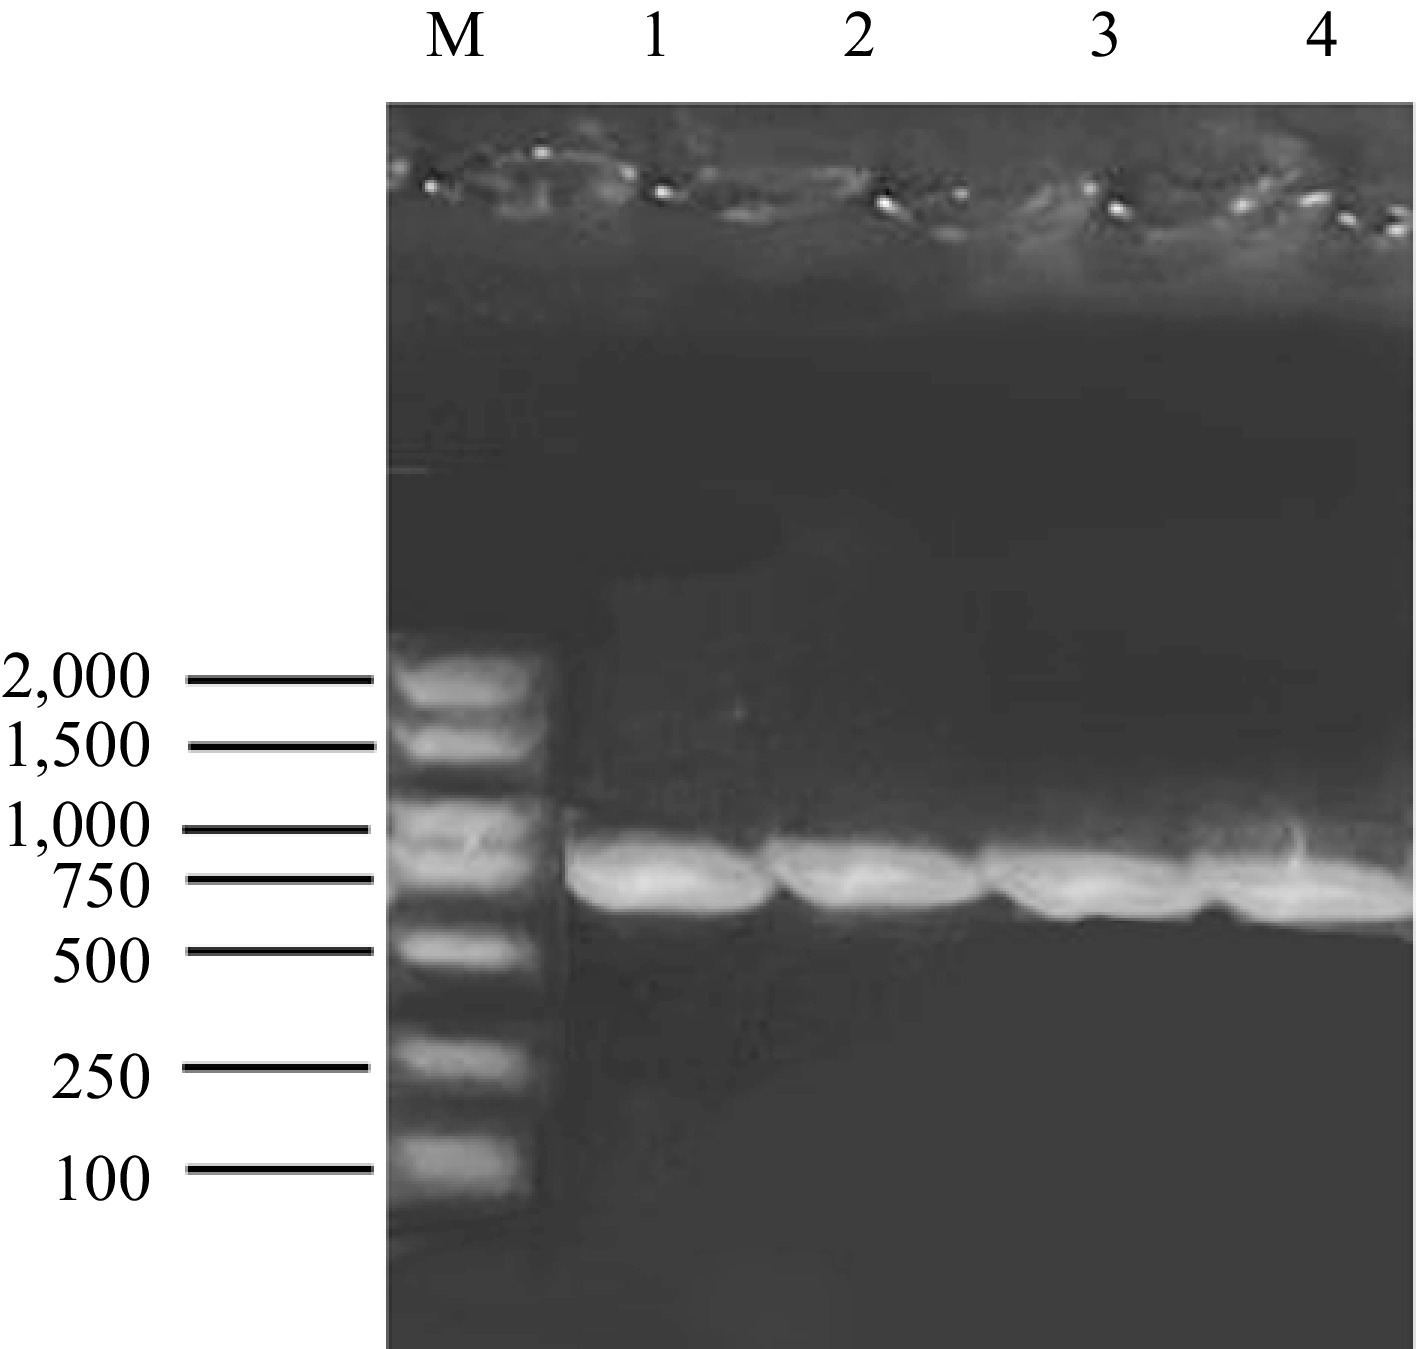
      Figure 2. 

      PCR of the COI gene of L. trifolii. M showed DNA Marker DL2000 (Purchased from TaKaRa, Japan); Lines 1−4 represent four repetitions of PCR.
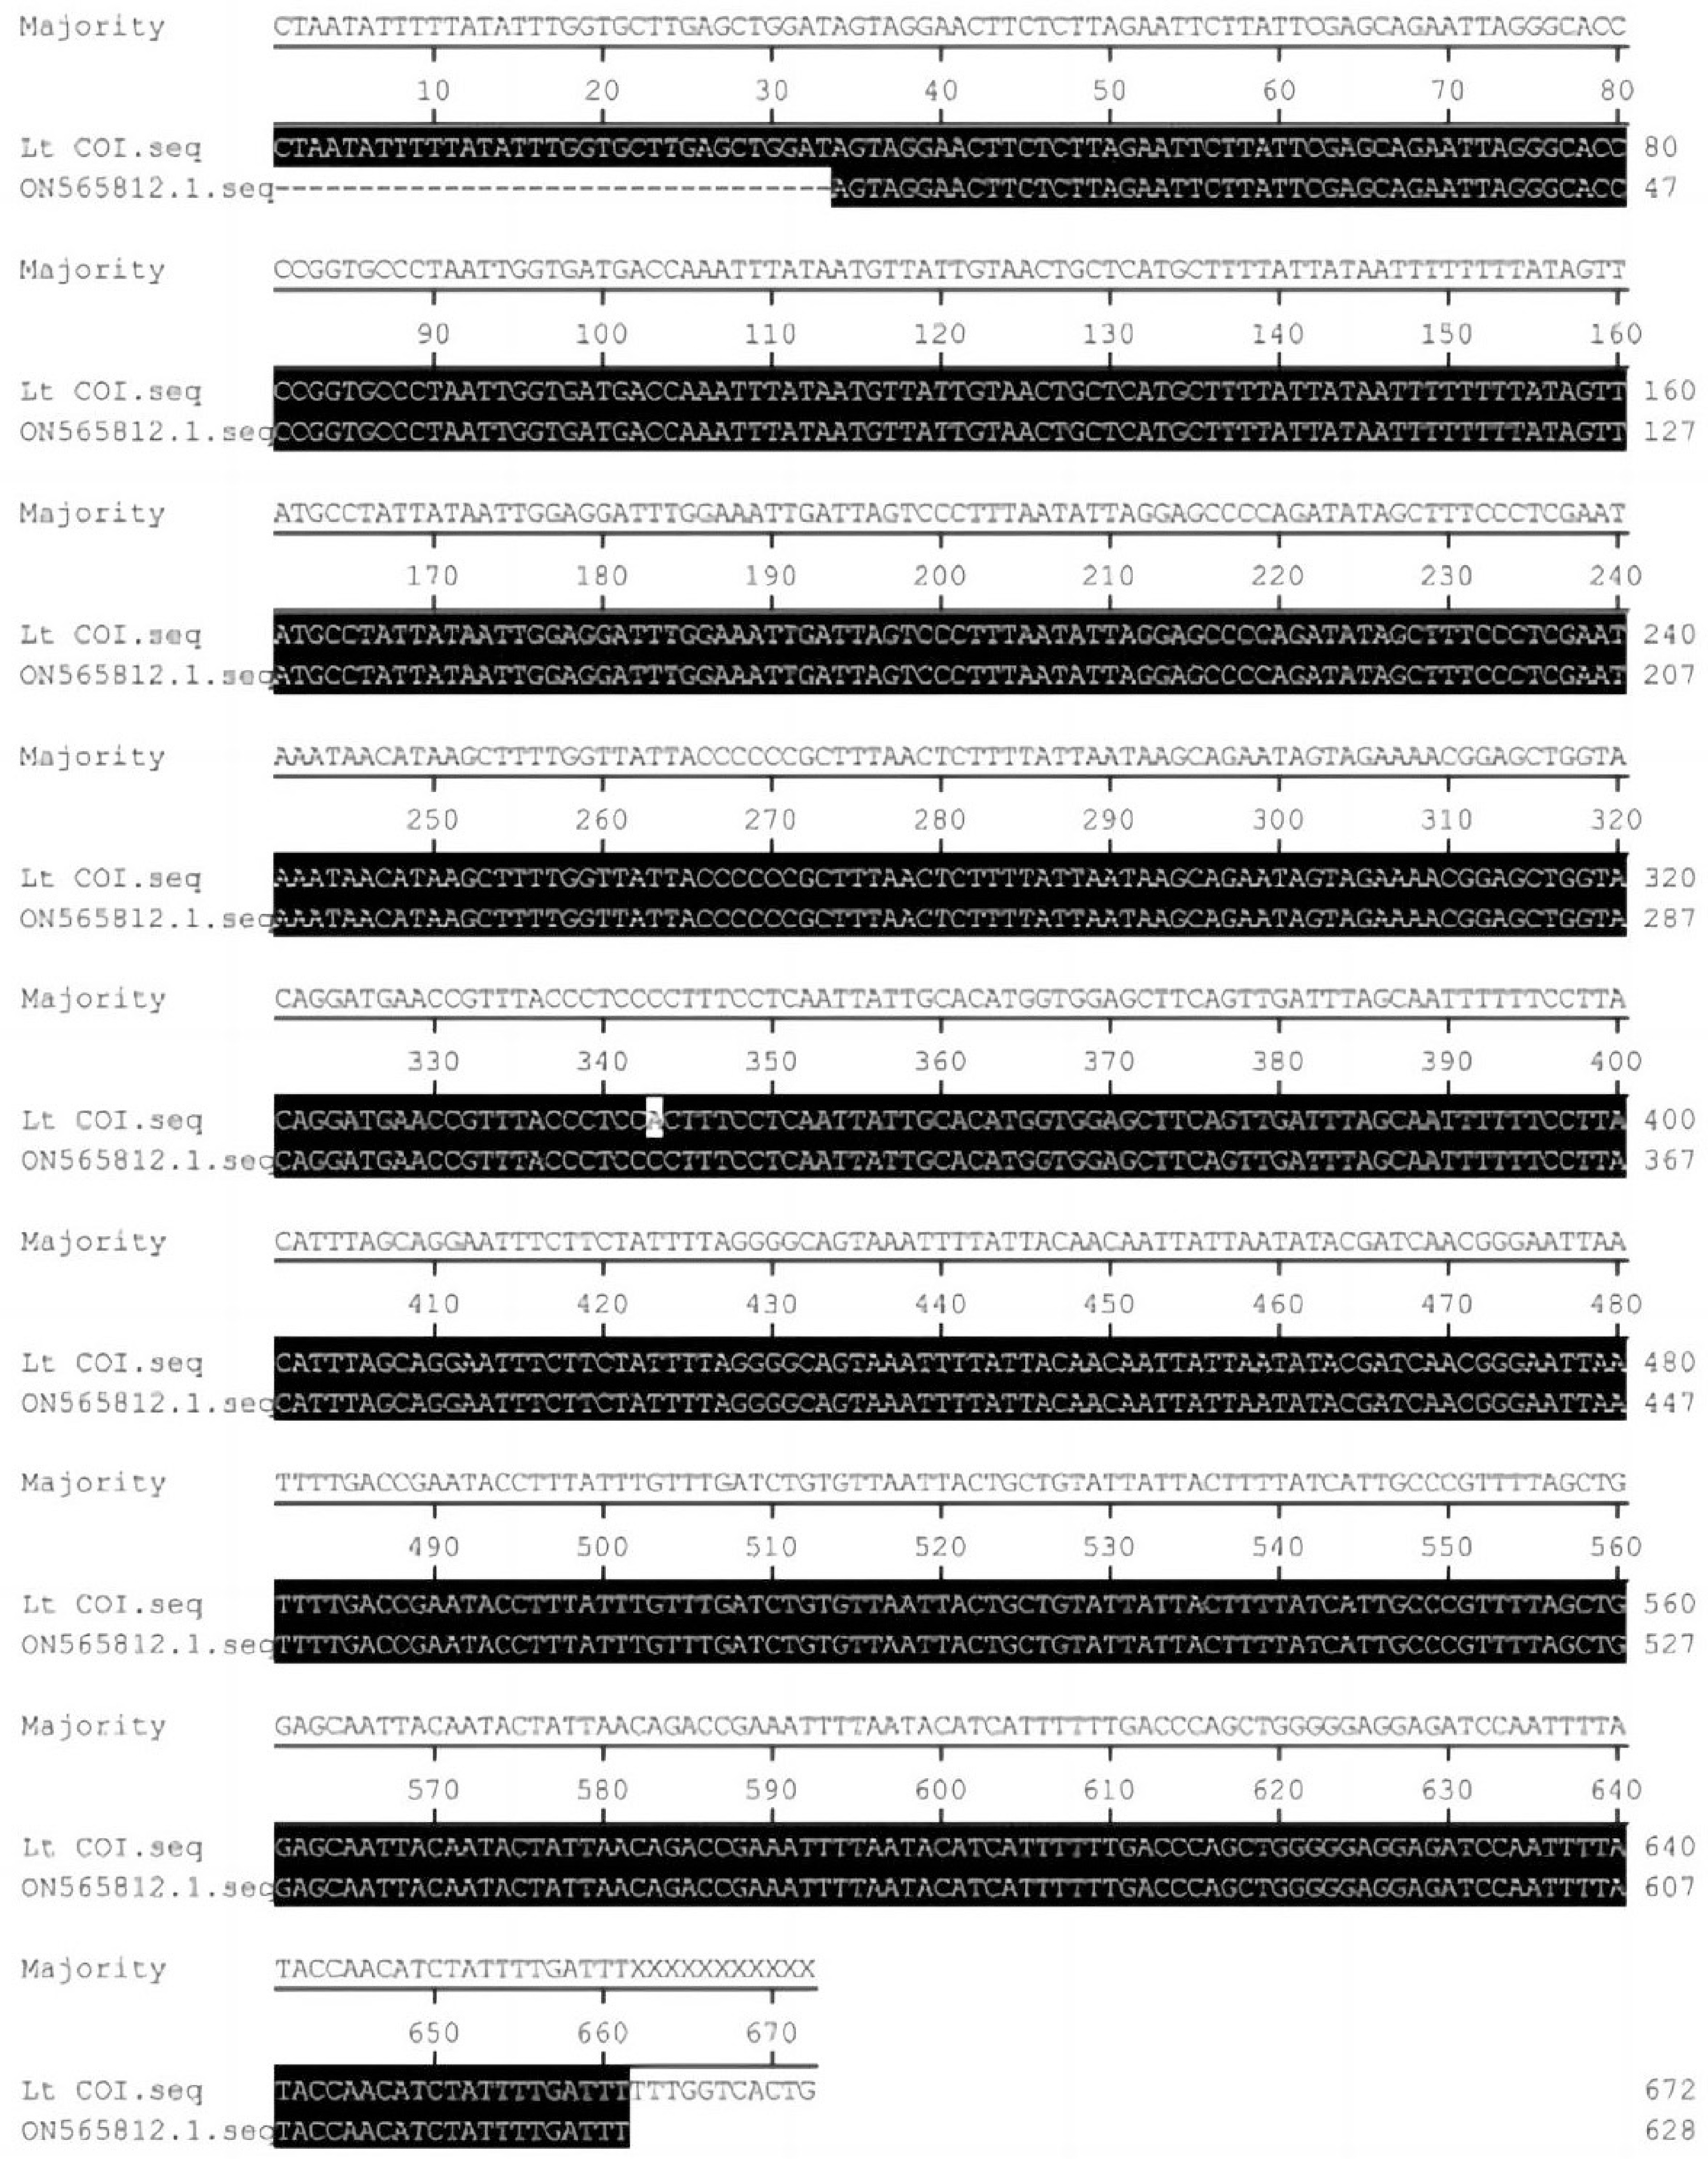
      Figure 3. 

      Sequence comparison between amplified and the COI gene from the NCBI database.

    • The LC50 of indoxacarb against the second-instar larvae of the sensitive strain was 0.89 mg/L, the 95% confidence interval was 0.59−1.36, and χ2 (df) was 11.632 (13). The resistance ratio of the second-instar larvae to indoxacarb was 1. The LC50 of indoxacarb against the second-instar larvae of the field strain was 762.59 mg/L with 95% confidence interval of 203.58−16,554.02, and χ2 (df) was 6.17 (13). The resistance ratio of the second-instar larvae to indoxacarb reached 856.84 times. In the 95% confidence interval, the critical value of the chi-square test with 13 degrees of freedom was 22.362, and the virulence measurements were consistent with the probability model (Table 1).

      Table 1.  Resistance level of indoxacarb resistance of Sanya population of L. trifolii in Hainan province.

      Population Year LC50 (95% CL)
      (mg/L)
      Slope ± SE χ2 (df) Resistance
      ratioa
      Sensitive strains 0.90
      (0.29−3.15)
      1.00 ± 0.10 46.68 (10) 1
      Sanya 2022 697.00
      (241.80−
      13,809.27)
      0.68 ± 0.23 4.76 (13) 776.17
      a Resistance ratio = LC50 of field strain / LC50 of sensitive strain.

      The activities of GST, carboxylesterase, and acetylcholinesterase in the indoor-sensitive and second-instar larvae of the Sanya field strain before and after indoxacarb treatment were measured. As shown in Table 2, the activities of two detoxification enzymes and acetylcholinesterase in the second-instar larvae of the Sanya field strain before and after indoxacarb treatment increased compared with those of the sensitive strain. Before treatment, the activities of GST, carboxylesterase, and acetylcholinesterase in the second-instar larvae of field strain increased by 15.35, 4.51, and 1.49 times compared with those of sensitive strain, respectively. After treatment, the activities of GST, carboxylesterase, and acetylcholinesterase in the second-instar larvae of the field strain increased by 10.09, 9.26, and 2.06 times compared with those of the sensitive strain, respectively. In addition, indoxacarb treatment could increase the activities of GST, CarE, and AChE in both the sensitive and field strains of the second-instar larvae, but only GST activity significantly increased in the sensitive strains of the second-instar larvae (p < 0.05). Only AChE significantly increased in the second-instar larvae of the field strain (p < 0.05).

      Table 2.  Activities of two detoxification enzymes and acetylcholinesterase enzyme (U/mg pro) in the second-instar larva of L. trifolii after treatment with LC50 (697.00 mg/L) indoxacarb.

      Detoxification
      enzyme
      Before indoxacarb treatment Increased multiplier After indoxacarb treatment Increased multiplier
      Sensitive strain Field strain in Sanya Sensitive strain Field strain in Sanya
      GST 0.23 ± 0.27 c 3.53 ± 0.29 a 15.35 0.99 ± 0.47 b 9.99 ± 9.45 a 10.09
      AChE 50.74 ± 29.29 c 229.02 ± 50.56 b 4.51 65.77 ± 11.74 c 609.16 ± 22.19 a 9.26
      CarE 2.70 ± 0.07 b 4.01 ± 0.90 ab 1.49 3.14 ± 0.33 b 6.46 ± 1.66 a 2.06
      GST: Glutathione S-transferase; CarE: Carboxylesterase enzymes; AChE: Acetylcholinesterase enzyme. Data in the table are mean ± SD, and different small letters in the same line mean significant difference (p < 0.05) in the enzymatic activity of sensitive strain and field strain in Sanya between before indoxacarb treatment and after indoxacarb treatment by Tukey's multiple test.

      Correlation analysis between the resistance to indoxacarb and the activities of three enzymes of the second-instar larvae of the field strain of L. trifolii (Table 3) revealed that the correlation coefficient between the resistance to indoxacarb and the activity of GST of the second-instar larvae before indoxacarb treatment was greater than 0.80, indicating a strong positive correlation. The correlation coefficients between the activity of AChE and CarE and the resistance of field strains to indoxacarb were 0.79 and 0.45, respectively, with moderate positive correlation. After indoxacarb treatment, the correlation coefficients between indoxacarb resistance and the activities of AChE, GST, and CarE were 0.85, 0.73, and 0.64, respectively, indicating strong positive correlations among them.

      Table 3.  Correlation between enzyme activity and the resistance of the second-instar larva of field L. trifolii in Sanya to LC50 (697.00 mg/L) indoxacarb.

      Enzyme Regression equation r
      Before indoxacarb treatment GST y = 0.2337 + 0.0034x 0.82
      AChE y = 46.259 + 0.1895x 0.79
      CarE y = 2.1688 + 0.0016x 0.45
      After indoxacarb treatment GST y = 0.879 + 0.0116x 0.73
      AChE y = 54.349 + 0.615x 0.85
      CarE y = 2.5721 + 0.0038x 0.64
      GST: Glutathione S-transferase; CarE: Carboxylesterase enzymes; AChE: Acetylcholinesterase enzyme.
    • Under different temperature treatments, the development history of each state of the Sanya field strain is shown in Table 4. From 16 to 34 °C, the developmental period of each species decreased with the increase in temperature. The developmental duration of eggs at 16 °C was 6.67 d, which was significantly higher than that at 25 and 34 °C (F(2,6) = 52.33, p < 0.05). The developmental duration of eggs at 25 and 34 °C was 2.67 and 2.33 days, respectively, with no significant difference (p > 0.05). The developmental duration of larvae was significantly different between 16 and 34 °C (13.67, 7.33, and 4.67 d, respectively; F(2,6) = 130.20, p < 0.05). Pupae stopped developing at 34 °C, and the development duration was significantly lower than that at 16 and 25 °C (F(2,6) = 197.24, p < 0.05).

      Table 4.  Developmental duration of field Liriomyza trifolii in Sanya under treatments with different temperatures and foods.

      Developmental stage Food Temperature (°C)
      16 25 34
      Egg 6.67±0.58 a 2.67±0.58 b 2.33±0.58 c
      Larva 13.67±0.58 a 7.33±0.58 b 4.67±0.58 b
      Pupa 17.11±1.84 a 7.00±0.00 b 0.00±0.00 c
      Adult 10% Honey water 22.00±6.93 aB 6.33±7.51 bB 3.33±0.58 cB
      27.25±7.63 aA 5.67±2.31 bB 2.67±0.58 cB
      Sterile water 4.33±0.58 aC 1.67±0.58 bB 1.33±0.58 cB
      4.67±1.15 aC 1.67±0.58 bB 1.33±0.58 cB
      Data in the table are mean ± SD, and different small letters in the same row and different capital letters in the same column mean significant difference (p < 0.05) in the developmental duration between different temperatures and food treatments by Tukey's multiple test.

      After feeding the samples with different kinds of food, the development time of adult L. trifolii was the longest (22.00 d for females and 27.25 d for males) when fed honey water at 16 °C. The developmental period of female adults fed honey water was significantly longer than those fed sterile water (F(3,8) = 19.42, p < 0.005). At 25 and 34 °C, no significant difference in the developmental period of male and female adults fed the same or different food was found (p > 0.05).

    • The survival rate of the Sanya field strain was closely related to temperature change at each developmental stage (Fig. 4). At 16, 25, and 34 °C, the egg survival rate was above 90%. The larval survival rate reached 100% at 25 °C, and the pupal survival rate was only 48% at 34 °C. The survival rate of pupae was the highest at 25 °C and only 33.0% at 16 °C. The survival rate of pupae at 34 °C was 0, which was significantly lower than that of larvea and eggs (F(2,18) = 22.75, p < 0.01).
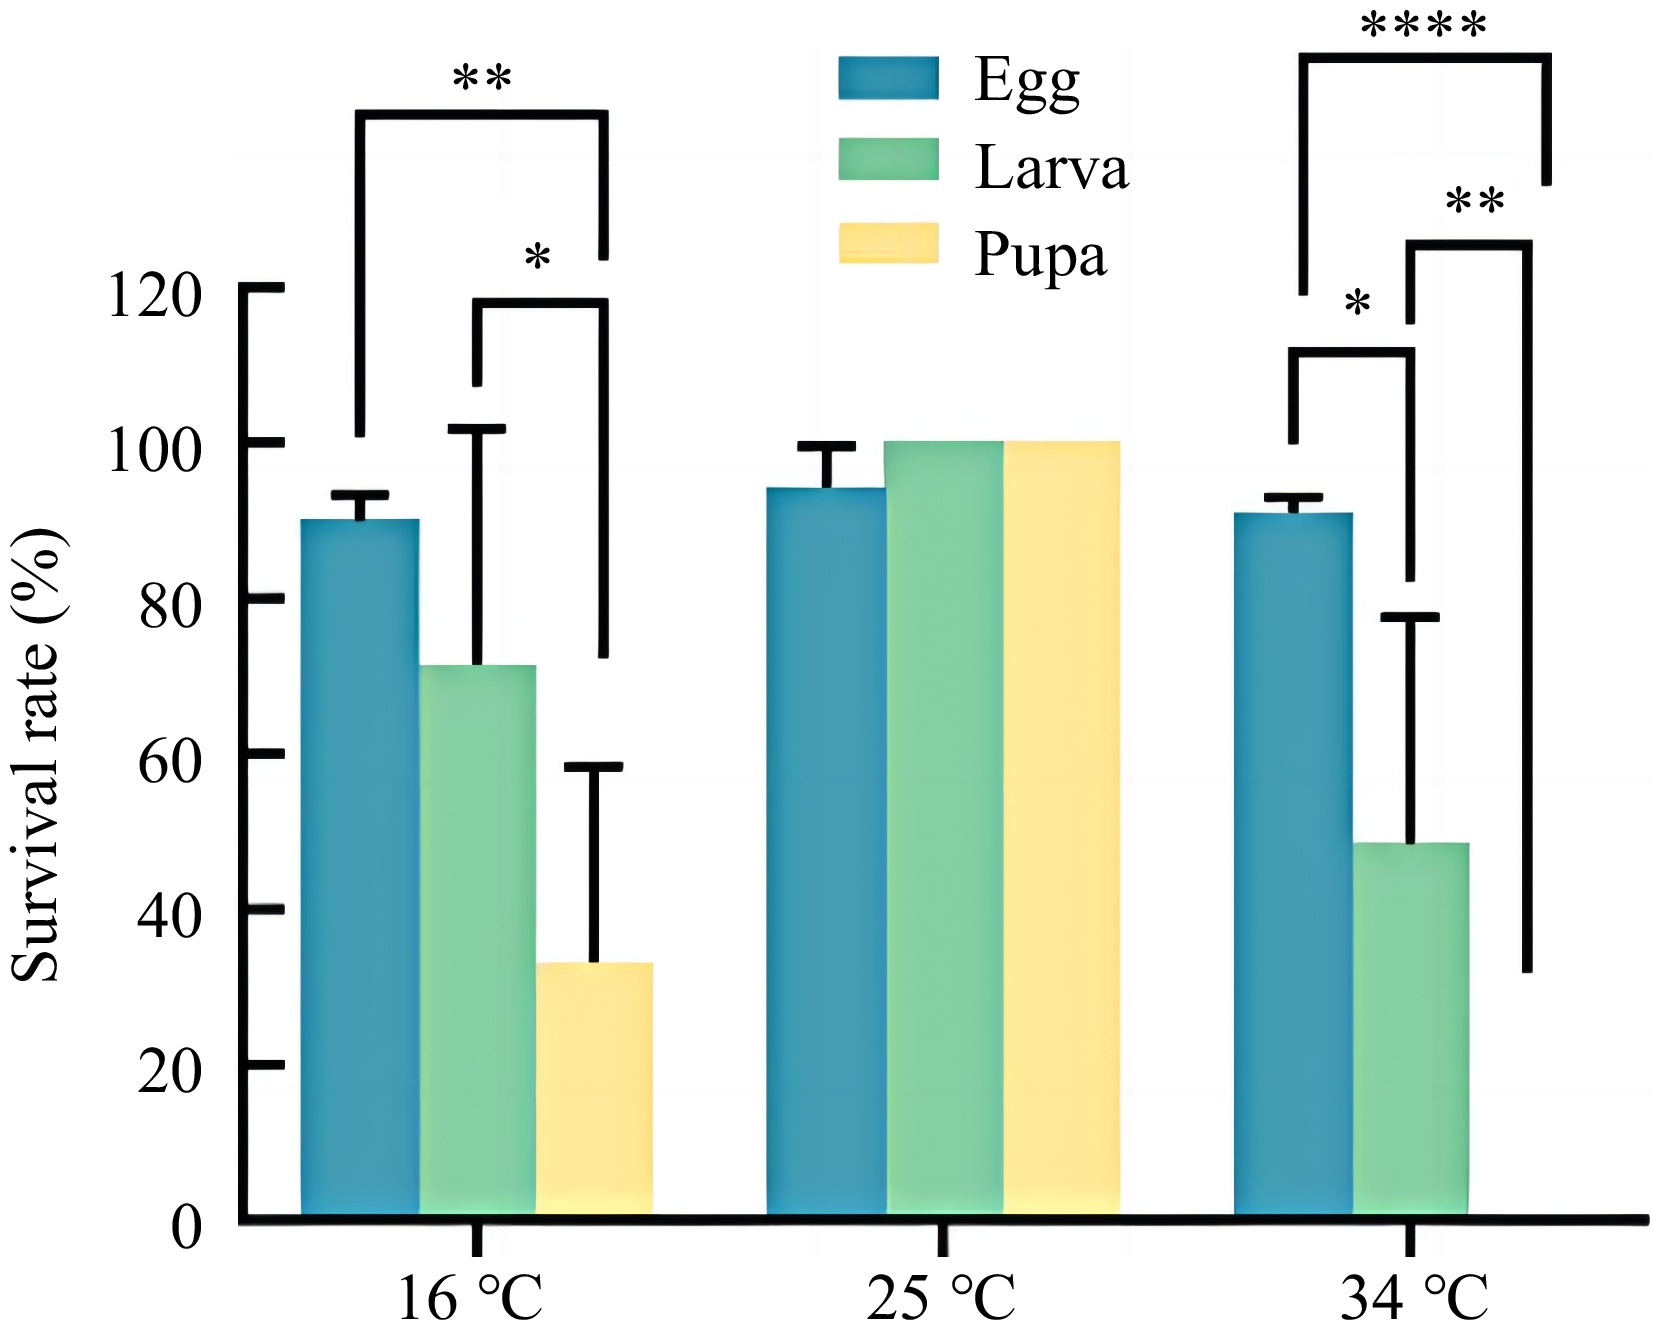
      Figure 4. 

      Survival rate of field L. trifolii in Sanya under different temperatures. Data in the figure are mean ± SD. Asterisks above bars indicates significant difference (p < 0.05) between two groups by Tukey's multiple test.

    • As shown in Table 5, the body length of pupa at 16−34 °C was 0.12−0.16 cm. With the growth and development of pupa at different temperatures, its body length and body weight did not change significantly (p > 0.05).

      Table 5.  Body length and body weight of pupae of field L. trifolii in Sanya under different temperatures.

      Number of
      tested insects
      Temperature Body length Body weight
      30 16 0.2 ± 0.01 a 0.01 ± 0.004 a
      0.2 ± 0.01 a 0.03 ± 0.02 a
      0.2 ± 0.01 a 0.02 ± 0.02 a
      30 25 0.1 ± 0.02 a 0.02 ± 0.02 a
      0.1 ± 0.02 a 0.05 ± 0.04 a
      0.1 ± 0.02 a 0.03 ± 0.007 a
      30 34 0.1 ± 0.006 a 0.09 ± 0.002 a
      0.1 ± 0.004 a 0.02 ± 0.009 a
      0.1 ± 0.004 a 0.06 ± 0.0006 a
      Data in the table are mean ± SD. Different small letters in the same column mean significant difference (p < 0.05) in the body length and body weight between different temperatures by Tukey's multiple test.
    • As shown in Table 6, the starting temperature of larval development was the lowest at only 2.75 °C, and the effective accumulated temperature was 17.53 day·°C. The starting temperature of pupal development was the highest at 12.30 °C, and the effective accumulated temperature was 110.23 day·°C. The egg had a starting temperature of development of 10.82 °C. The starting temperature of adult development is 7.11 °C. The effective accumulated temperatures of egg and adult are 43.23 and 8.37 day·°C, respectively.

      Table 6.  Developmental threshold temperature (T0) and effective accumulated temperature (K) of field L. trifolii in Sanya at different stages.

      Development stage T0 K
      Egg 10.82 ± 1.70 43.23 ± 4.77
      Larva 2.75 ± 8.72 17.53 ± 6.20
      Pupa 12.30 ± 1.70 110.23 ± 12.49
      Adult 7.11 ± 6.57 8.37 ± 2.98
    • The growing areas of the inner and outer top bristles on the head of Liriomyza are diverse. Chen[18] found that more than 70% of the inner and outer top bristles are yellow, about 20% of the inner top bristles are yellow, about 10% of the inner top bristles are yellow and the outer top bristles are black. In all the insects collected in this study, the outer top bristle growth area was yellow, and no black growth area was found (Fig. 1). Many species of Liriomyza have been reported; the individual insects are small, and the abdominal pattern is changeable. Through observation and comparison, the abdominal characteristics of L. trifolii are the most obvious and the simplest way to distinguish L. sativae and L. chinensis. The COI gene can be used as a molecular basis for species identification of L. trifolii to distinguish it from other species of L. huidobrensis[18]. In this study, the molecular identification of the collected COI gene was conducted, and the COI gene sequence of the collected COI gene was 99.84% consistent with that of the NCBI database. Aided by morphological characteristics, the collected specimens were identified as L. trifolii.

      Since the invasion of L. trifolii, many studies on its biological characteristics and dynamic monitoring of damage have been published, but research on its resistance level, especially on the resistance level of indoxacarb, is limited. Only Li et al. studied the resistance of the Sanya field population, the Wuzhishan population, and Ledong population to indoxacarb in Hainan Province; they found that the resistance level of the Sanya field population to indoxacarb was the highest in 2021, LC50 reached 631.80 mg/L, and the resistance multiple reached 768.61 times[7]. By contrast, the resistance ratio of the Wuzhishan and Ledong populations to indoxacarb was 531.16 and 140.03 times, respectively. In this study, the resistance to indoxacarb of the Sanya field strain in Hainan Province in 2022 was up to 856.84 times, which was higher than the resistance level reported by Li et al. Given that indoxacarb was used, field populations of various insects have developed different levels of resistance to the insecticide. Zhao et al.[19] monitored the resistance of Plutella xylostella population in Hawaii and found that the population of P. xylostella in Hawaii is not sensitive to indoxacarb and has reached a high level of resistance. Sayyed et al.[20] found that Spodoptera litura field population in the Multan area of Pakistan had developed a moderate level of resistance to indoxacarb, with a resistance multiple of 15 times. The results of this study showed that the resistance to indoxacarb in the field population of Sanya was high. By further measuring the activity of detoxification enzyme between the sensitive and field populations, we found that the activity of AChE in the field population was higher than that of the sensitive strains, and the activity of AChE and CarE was significantly induced after treatment with indoxacarb (Table 2). Many studies also showed that detoxification enzymes might be involved in the resistance mechanism of insects to indoxacarb. For example, Shono[21] found that the multifunctional oxidase improves the resistance of Musca domestica to indoxacarb. Different esterases in S. litura all play a role in resistance to indoxacarb to a certain extent[22]. Similarly, Li et al.[23] pointed out that the activation and metabolism of indoxacarb in P. xylostella may be related to esterase. This finding was similar to the results of this study, indicating that esterase plays an important role in the resistance of L. trifolii to indoxacarb (Table 3).

      In addition to pesticides and other non-natural factors in the field that can affect insects, natural factors such as temperature have an important impact on the growth and development of insects. The developmental starting point temperature and effective accumulated temperature are the basic parameters and biological characteristics of insect growth and development. At a suitable temperature range, the growth, development, and reproduction rates of insects are significantly accelerated. Studies of the biological characteristics of L. trifolii can be traced back to 2011[11] and even to the 1980s. In Hainan Province, the number of L. huidobrensis has declined sharply and even gradually replaced by L. trifolii, and the difference in its biological characteristics may be one of the reasons for this phenomenon. As a result of the temperature variation range and light conditions in Hainan Province, the field environment is continuously simulated. In this study, three temperatures were selected to explore the development history and survival rate of each state of L. trifolii, and the developmental starting temperature and effective accumulated temperature were calculated. The results showed that temperature influenced the growth, development, and reproduction of L. trifolii. With the increase in temperature, the time required by L. trifolii to complete a stage was gradually shortened (Table 4). The influence of temperature on different insect states varied; the pupa was the most sensitive to temperature, whereas the larva was the least sensitive, which was consistent with the results of Xiao et al.[11]. At 34 °C, the pupae cannot emerge, but 16−34 °C is suitable for the development of the eggs and larvae of L. trifolii (Fig. 2).

      Although the same insect was used in the present experiment, the time difference of 10 years and the space difference of 20,000 km, which led to many generations of variation and adaptation, resulted in obvious differences in their biology. In this study, the starting temperatures of eggs, larvae, pupae, and adults were 10.82, 2.75, 12.30, and 7.11 °C, respectively. According to the study of Xiao et al., the developmental starting point temperatures of eggs, larvae, and adults are 10.80, 6.43, and 8.40 °C, respectively[11]; the developmental starting point temperatures of larvae were significantly different from those in this study. China has a vast land area, and the climate difference between the north and the south is substantial. The climate diversity in China may be the reason for the variation in L. trifolii loon in different places[19,24]. However, different from other similar studies, at least five temperatures were used to calculate the starting point temperature and effective accumulated temperature. In this study, the developmental starting point temperature and effective accumulated temperature of each state were measured at 16, 25, and 34 °C, so the developmental starting point temperature and effective accumulated temperature of each developmental stage measured in this study could be used as a reference (Table 6). In this study, the adult development time of L. trifolii fed honey water significantly increased. Notably, the developmental period of female adults fed honey water at 16 °C was significantly higher than that of female adults fed sterile water (Table 4). Therefore, changing the nutritional state of the adult can change its development period, which also provides ideas for reducing the population density of L. trifolii.

      In summary, this study found that indoxacarb was no longer suitable for field control of L. trifolii in Sanya, and other agents such as abamectin and cyromazine should be reduced or mixed. Molecular control methods could be found by studying the physiological and biochemical mechanisms of its detoxification enzyme. Above 34 °C, the survival rate of the pupae decreased, and the survival rate could be reduced by high-temperature confinement and other methods to reduce the insect population density. Honey water was used to trap and kill adult L. trifolii to reduce its egg production and damage degree. This study has guided a significance for the green control of L. trifolii in the field.

    • The authors confirm contribution to the paper as follows: study conception and design: Gong X, Dong W, Li F, Wu S; data collection: Gong X; analysis and interpretation of results: Gong X, Chen Y; draft manuscript preparation: Gong X, Dong W. All authors reviewed the results and approved the final version of the manuscript.

    • All data generated or analyzed during this study are included in this published article.

      • This study was supported by the National Key Research and Development Project of China (2021YFC2600600), the Hainan Major Science and Technology Project (ZDKJ2021016), the Hainan Major Science and Technology Project (ZDKJ2021007), the Project of Sanya Yazhou Bay Science and Technology City (SCKJ-JYRC-2023-15), and the National Key Research and Development Program of China (2022YFD1401200 and 2022YFD1400900).

      • The authors declare that they have no conflict of interest.

      • Received 31 May 2024; Accepted 15 July 2024; Published online 23 August 2024

      • L. trifolii has developed high resistance to indoxacarb in Sanya.

        Detoxification enzymes of L. trifolii maybe involved in the detoxification metabolism of indoxacarb.

        Temperature and food have an effect on the growth and development of L. trifolii.

      • Copyright: © 2024 by the author(s). Published by Maximum Academic Press on behalf of Hainan University. This article is an open access article distributed under Creative Commons Attribution License (CC BY 4.0), visit https://creativecommons.org/licenses/by/4.0/.
    Figure (4)  Table (6) References (24)
  • About this article
    Cite this article
    Gong X, Chen Y, Dong W, Li F, Wu S. 2024. Toxicity of indoxacarb to the population of Liriomyza trifolii (Diptera: Agromyzidae) in Sanya (China), and the effects of temperature and food on its biological characteristics. Tropical Plants 3: e028 doi: 10.48130/tp-0024-0032
    Gong X, Chen Y, Dong W, Li F, Wu S. 2024. Toxicity of indoxacarb to the population of Liriomyza trifolii (Diptera: Agromyzidae) in Sanya (China), and the effects of temperature and food on its biological characteristics. Tropical Plants 3: e028 doi: 10.48130/tp-0024-0032

Catalog

  • About this article

/

DownLoad:  Full-Size Img  PowerPoint
Return
Return