ARTICLE   Open Access    

Effects of aromatic amino acids on callus growth and accumulation of secondary metabolites in amaranth

More Information
  • Received: 18 April 2024
    Revised: 16 July 2024
    Accepted: 26 July 2024
    Published online: 20 September 2024
    Tropical Plants  3 Article number: e032 (2024)  |  Cite this article
  • Aromatic amino acids could promote the growth of amaranth callus.

    Optimum concentrations of tyrosine and phenylalanine were beneficial for flavonoid content in the callus.

  • Amaranth, a green leafy vegetable with high edible value, is rich in flavonoids and carotenoids. Aromatic amino acids are favored to secondary metabolites biosynthesis as precursors. Our previous study showed that flavonoids could be produced using amaranth callus. However, the effects of aromatic amino acids on the callus growth, the accumulation of secondary metabolites, and the expression of related genes in amaranth are still unclear. In this study, the results showed that aromatic amino acids could promote the growth of amaranth callus. Meanwhile, tyrosine and phenylalanine within fitting concentrations were beneficial to flavonoid accumulation and expression regulation of the related gene. In contrast, aromatic amino acids reduced carotenoid accumulation. The results provide a scientific basis and method for callus culture and flavonoid production by the callus of amaranth.
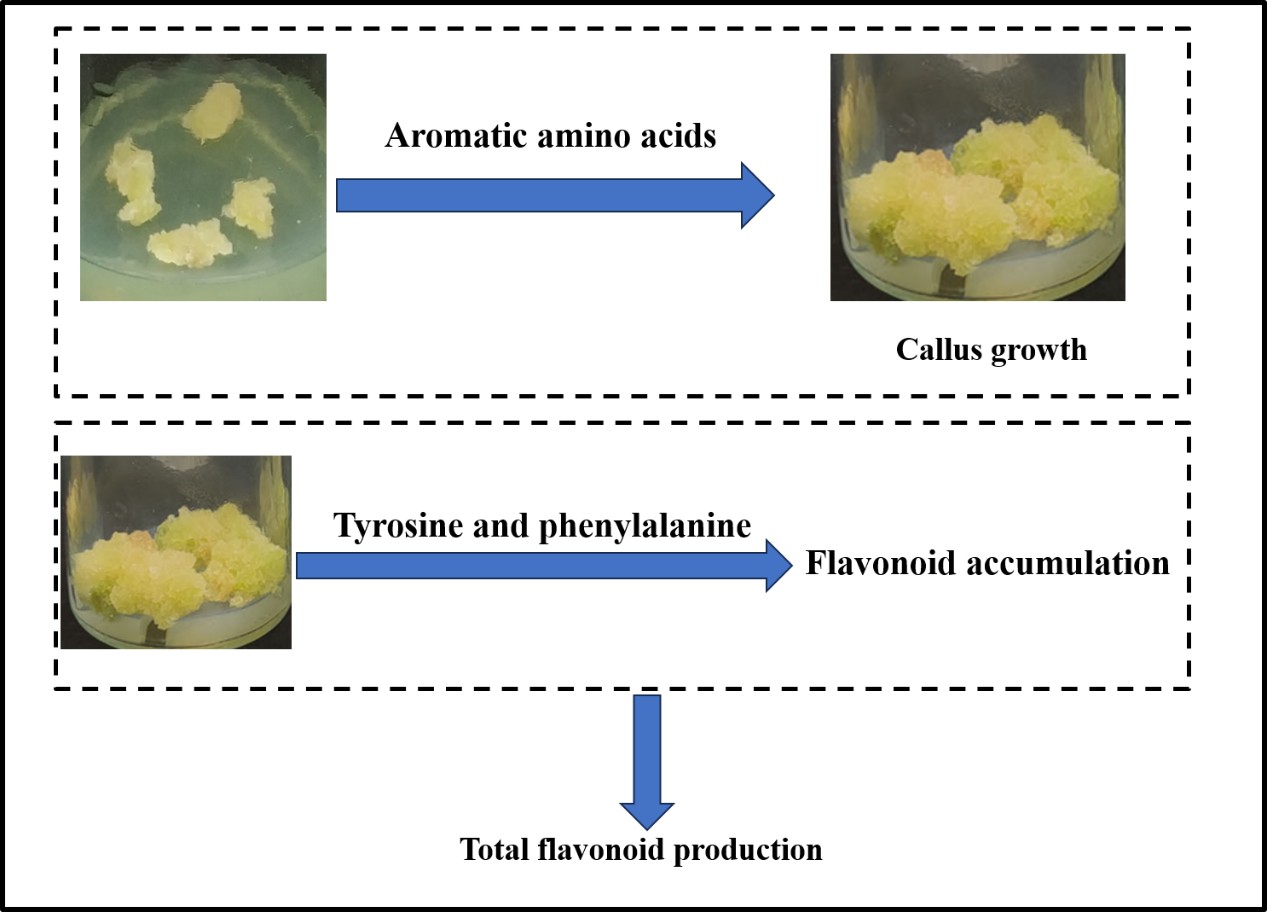
    Graphical Abstract
  • Drought is a major abiotic stress affecting plant growth which becomes even more intensified as water availability for irrigation is limited with current climate changes[1]. Timely detection and identification of drought symptoms are critically important to develop efficient and water-saving irrigation programs and drought-tolerance turfgrasses. However, turfgrass assessments of stress damages have been mainly using the visual rating of turf quality which is subjective in nature and inclined to individual differences in light perception that drives inconsistency in estimating color, texture, and pattern of stress symptoms in grass species[24]. Remote sensing with appropriate imaging technology provides an objective, consistent, and rapid method of detecting and monitoring drought stress in large-scale turfgrass areas, which can be useful for developing precision irrigation programs and high-throughput phenotyping of drought-tolerance species and cultivars in breeding selection[5].

    Spectral reflectance and chlorophyll fluorescence imaging are emerging tools for rapid and non-destructive monitoring of drought effects in crops. These tools combine imaging and spectroscopy modalities to rigorously dissect the structural and physiological status of plants[6,7]. Spectral reflectance imaging captures reflected light (one out of three fates of light: reflect, absorb and transmit when striking leaf) at different wavelengths ranging from visible to near-infrared regions to characterize vegetation traits[8,9]. Within spectral reflectance imaging, multispectral imaging on one hand measures reflected light in three to ten different broad spectral bands in individual pixels[10,11]. Hyperspectral imaging on the other hand captures reflected light in narrow and more than 200 contiguous spectral bands. Some absorbed light by leaf is re-radiated back in the form of fluorescence and fluorescence imaging utilizes those lights in red and far-red regions to capture plant physiological status[12]. When drought progresses, plants start to develop various symptoms (physiological modifications) gradually over time[13]. Some of those symptoms include stomata closure, impediment in gas exchange, change in pigment composition and distribution which result in wilting and associated morphological alteration in leaf color (senescence), shape (leaf curling) and overall plant architecture. As different plant components or properties reflect light differently at different wavelengths and patterns of reflectance and fluorescence change along with plant stress and related symptoms development, spectral reflectance and fluorescence imaging provide accurate, reliable and detailed information for crop drought monitoring. Fluorescence imaging primarily based on fluorescing plant components or chlorophyll complex in photosynthetic antenna and reaction centers and therefore it mainly monitors stress development by tracking changes in overall photosynthetic performance or other metabolism that interfere with photosynthetic operation[9,14]. Multispectral imaging, hyperspectral imaging, or chlorophyll fluorescence has been used in different studies for plant responses to drought stress in various plant species[10,1517]. The comparative approach of multiple imaging technologies could help to find the efficient methods for the evaluation of plant responses and tolerance to drought[18].

    Vegetation indices derived from multispectral or hyperspectral imaging and fluorescence parameters typically are ratio or linear combinations of reflectance and fluorescence emissions from leaves or canopy of plants, respectively[19,20]. Canopy reflectance at different wavelengths and chlorophyll fluorescence varies with canopy color and density and changes with environmental conditions that affect plant growth, including drought stress[14,20,21]. These variations in reflectance and fluorescence are captured by vegetation indices, such as normalized difference vegetation index (NDVI) and fluorescence parameters including the ratio of variable fluorescence to maximum fluorescence (Fv/m) which are commonly used to evaluate environmental impact on plant growth. Other indices reflect physiological health of plants, such as photochemical reflectance index (PRI) has recently been reported to be useful for drought stress assessment in crops[19]. Previous research identified varying sensitivity of PRI and NDVI to detect water stress; for example, Sun et al.[22] found PRI to be a prominent indicator of drought stress whereas Kim et al.[20] discovered NDVI had greater correlation with drought stress development. There are also several conflicting findings on the responsiveness of fluorescence parameters to drought stress. Photochemical efficiency of PSII (Fv/Fm) was found to be greatly related to drought stress by Panigada et al.[23] but Jansen et al.[24] reported Fv/Fm to be relatively insensitive to drought progression. Lu & Zhang[25] identified that coefficient of photochemical quenching (qP) was insensitive to drought stress whereas Moustakas et al.[26] reported that (qP) being the most sensitive indicator of such stress conditions. There is a need for a comprehensive study that examines multiple vegetation indices (both hyperspectral and multispectral indices) and fluorescence parameters, and parallelly assess their sensitivities to reflect plant growth and physiological status during drought stress.

    The objectives of the current study were: (1) to perform comparative analysis of drought responses of vegetation and photosynthetic indices using multispectral, hyperspectral and chlorophyll fluorescence imaging for Kentucky bluegrass (Poa pratensis L.), a cool-season perennial grass species widely used as turfgrass; (2) identify major vegetation and photosynthetic indices from the imaging technologies and correlated to visual turf quality and leaf relative water content from the destructive measurement; and (3) determine the major vegetation and photosynthetic indices that are most responsive or sensitive to the progression of drought stress that may be useful to early detection and monitoring the level of drought stress causing growth and physiological damages in cool-season grass species.

    Sod strips of Kentucky bluegrass cultivar 'Dauntless' were collected from established field plots at the Rutgers Plant Science Research and Extension Farm, Adelphia, NJ, USA. Sods were planted in plastic pots of 18 cm diameter and 20 cm length filled with a mixture of soil (sandy loam, semi-active, mesic Typic Hapludult; pH 6.55; 260 kg·P·ha−1, 300 kg·K·ha−1) and sand in the ratio of 2/1 (v/v). Plants were established for 50-d in a greenhouse with 24/22 °C day/night average temperatures, 12-h average photoperiod and 750 μmol·m−2·s−1 average photosynthetically active radiation (PAR) with natural sunlight and supplemental lightings. Plants were well-watered, trimmed weekly to 100 mm and fertilized weekly with a 24–3.5–10 (N–P–K) fertilizer (Scotts Miracle-Gro) at the rate of 2.6 g·N·m−2 during the establishment period in the greenhouse. Once plants were well-established, they were moved to the controlled environmental growth chamber (GC72, Environmental Growth Chambers, Chagrin Falls, OH, USA). The growth chamber was controlled at 22/18 °C day/night temperature, 60% relative humidity, 12-h photoperiod and 650 μmol·m−2·s−1 PAR at the canopy level. Plants were allowed to acclimate for a week within the growth chamber conditions and then treatments were initiated.

    There were two different treatments: well-watered control and drought stress. For the well-watered control, plants were irrigated once every two days with sufficient water until drainage occurred from the pot bottom or when soil water content reached the field capacity. Drought stress was imposed by withholding irrigation from each pot throughout the experiment period. Each treatment had five replicates. The experimental treatments were arranged as a complete randomized design with plants of both treatments randomly placed and relocated in the chamber twice each week to minimize effects of potential microenvironment variations in the growth chamber.

    A time-domain reflectometry system (Model 6050 × 1; Soil Moisture Equipment, Santa Barbara, CA, USA) installed with 20 cm soil moisture probe was used to measure soil volumetric water content. Volumetric water content was measured every two days in each pot to track soil moisture dynamics in control and drought stress treatments. To assess plant responses at different soil moisture levels, turfgrass quality (TQ) and leaf relative water content (RWC) were evaluated. Turfgrass quality was visually rated on a scale of 1-9 depending upon canopy color, uniformity and density[27]. A rating of 1 indicates discolored and completely dead plants, 9 indicates lush green colored healthy plants and 6 indicates the minimum acceptable turfgrass quality. Leaf RWC was measured by soaking 0.2 g fresh leaves in distilled water overnight at 4 °C[28]. Turgid leaves after overnight soaking were oven dried at 70 °C to a constant dry weight. Leaf RWC was calculated as [(fresh weight – dry weight)/ (turgid weight – dry weight)] × 100.

    Control and drought stress pots were scanned using a close-range benchtop hyperspectral imaging system (Resonon Inc., Bozeman, MT, USA) containing Pika XC2 camera equipped with 23 mm lens. This camera took images in spectral range of 400–1,000 nm with much detailed spectral resolution of 1.9 nm in 447 different spectral channels. The camera provided 1600 spatial pixels and maximum frame rate of 165 frames per second. It had 23.1° field of view and 0.52 milli-radians instantaneous field of view. Resonon hyperspectral imaging systems are line-scan imagers (also referred to as push-broom imagers) that collect spectral data from each pixel on one line at a time. Multiple lines are imaged when an object or pot kept in scanning stage of linear stage assembly underneath the camera is moved by a stage motor. Those line images are assembled to form a complete image. The systems had regulated lights placed above the linear stage assembly to create optimal conditions for performing the scans. Lights were at the same level as the lens on a parallel plane. Distance between lens and the top of grass canopy was maintained at 0.4 m for capturing the best representation of drought progression. All scans were performed using spectronon pro (Resonon Inc., Bozeman, MT, USA) software connected to the camera using a USB cable. Before performing a scan, the lens was appropriately focused, dark current noise was removed and the system was calibrated for reflectance measurement using a white tile provided by the manufacturer. To ensure distortion-free hyperspectral datacube with a unit-aspect-ratio image, benchtop system's swatch settings were adjusted using pixel aspect ratio calibration sheet also provided by the manufacturer. Once the system was ready, controlled- and stressed-pots were scanned individually every two days throughout the experiment. As the lens was focused centrally, obtained images were of the central grass area and were processed using spectronon pro data analysis software. The entire grass image was selected using a selection tool and the spectrum was generated. From each spectrum, vegetation indices were calculated either using built-in plugins or by manually creating algorithms. The list of vegetation indices calculated using image analysis is mentioned in Table 1.

    Table 1.  List of vegetation indices calculated using hyperspectral and multispectral image analysis for drought stress monitoring in Kentucky bluegrass. Name and number in subscript following the letter R in each formula represent the reflectance at individual light and particular wavelength.
    Vegetation indexIndex abbreviation and formula
    Hyperspectral analysisMultispectral analysis
    Structure Independent Pigment IndexSIPI = (R800 – R445) / (R800 + R680)SIPIm = (RNIR840 – RBlue444) / (RNIR840 + RRed668)
    Simple Ratio IndexSRI = R800 / R675SRIm = RNIR840 / RRed668
    Plant Senescence Reflectance IndexPSRI = (R680 –R500) / R750PSRIm = (RRed668 – RBlue475) / RRededge740
    Photochemical Reflectance IndexPRI = (R570 – R531) / (R570 + R531)PRI = (RGreen560 – RGreen531) / (RGreen560 + RGreen531)
    Normalized Difference Vegetation IndexNDVI = (R800 – R680) / (R800 + R680)NDVIm = (RNIR840 – RRed668) / (RNIR840 + RRed668)
    Normalized Difference Red EdgeNDRE = (R750 – R705) / (R750 + R705)NDREm = (RRededge717 – RRed668) / (RRededge717 + RRed668)
     | Show Table
    DownLoad: CSV

    Micasense Rededge-MX dual camera system (AgEagle Sensor Systems Inc., Wichita, KS, USA) was used to collect multispectral images of controlled- and drought stressed-pots placed within a light box (1.2 m × 0.6 m × 0.6 m). The multispectral camera system had 1,280 × 960 resolution, 47.2° field of view and 5.4 mm focal length. The camera captured ten different spectral bands simultaneously on a command (Table 2). To allow the multispectral camera system, which was designed for aerial operation, to work in the light box settings, a downwelling light sensor (DLS) module provided by the manufacturer was installed to the camera system. Images were captured manually through WIFI connection from mobile devices or computer to the multispectral camera system. The sensor layout of the dual camera system, while causing negligible error in aerial condition, led to mismatching between spectral bands in a close distance, therefore, spectral bands needed to be overlapped during post-processing. The captured images of individual spectral bands were stored as separate .jpgf image files and then were used to calculate the relevant vegetation indices. Multispectral image analysis was executed using Python (Version 3.10) code by Rublee et al.[29]. Image analysis aligned ten spectral bands using Oriented FAST and Rotated BRIEF algorithm to achieve complete overlap between spectral band images. The reflectance correction panel provided by the manufacturer was used to account for the illumination condition in light box environment and the correction was reflected in pixel value adjustment for each band in python code; vegetation indices based on the aligned images were then calculated using the corresponding formula (Table 1). Images that included background noise were excluded from analysis.

    Table 2.  Spectral band details (center wavelength and band width) for Micasense Rededge-MX dual camera system.
    Band nameCentral wavelength (nm)Band width (nm)
    Blue44444428
    Blue47547532
    Green53153114
    Green56056027
    Red65065016
    Red66866814
    RE70570510
    RE71771712
    RE74074018
    NIR84084257
     | Show Table
    DownLoad: CSV

    Chlorophyll fluorescence images were taken using a pulse amplitude modulated fluorescence imaging system (FC 800-O/1010, Photon System Instruments, Drasov, Czech Republic). A high-speed charge-coupled device (CCD) camera was mounted on a robotic arm placed in the middle of LED light panels. The camera had 720 × 560 pixels spatial resolution, 50 frames per second frame rate and 12-bit depth. Four different LED light panels each of 20 cm × 20 cm size were equipped with 64 orange-red (617 nm) LEDs in three panels and 64 cool-white LEDs (6,500 k) in the rest of one panel. Before making measurements, plants were dark-adapted for 25 min in a dark room to open all PSII reaction centers. The distance between camera and the top of the grass canopy was maintained at 0.3 m while taking images to ensure optimum quality. Images were acquired following the Kautsky effect measured in a pulse amplitude modulated mode[30,31]. Briefly, dark-adapted plants were first exposed to non-actinic measuring light for 5 s to measure minimum fluorescence at the dark-adapted state (Fo). Plants were immediately exposed to 800 ms saturation pulse of 3,350 µmol·m−2·s−1 to measure maximum fluorescence after dark adaptation (Fm). They were kept under dark relaxation for 17 s and then exposed to actinic light 750 µmol·m−2·s−1 for 70 s. Plants were exposed to a series of saturating pulses at 8 s, 18 s, 28 s, 48 s and 68 s during their exposure to actinic light conditions and maximum fluorescence at different light levels and steady state were measured. They were kept under dark relaxation again for 100 s and irradiated with saturating pulses at 28 s, 58 s and 88 s during dark relaxation for measuring maximum fluorescence during the relaxation. Selected durations for each light and dark relaxation state were preset in default quenching-act2 protocol of the fluorescence imaging system. Fluorescence at different light levels and steady states were used to calculate several fluorescence parameters (Table 3).

    Table 3.  Chlorophyll fluorescence parameters calculated from pulse amplitude modulated fluorescence imaging system.
    Chlorophyll fluorescence parameterFormula
    Maximum photochemical efficiency of PSII (Fv / Fm)(Fm-Fo) / Fm
    Photochemical efficiency of open PSII centers
    (F'v / F'm)
    (F'm – F'o) / F'm
    Actual photochemical quantum yield of PSII centers Y(PSII)(F'm – Fs) / F'm
    Photochemical quenching coefficient (Puddle model; qP)(F'm – Fs) / (F'm – F'o)
    Photochemical quenching coefficient (Lake model; qL)qP × F'o / Fs
    Non-photochemical quenching coefficient (qN)(Fm-F'm) / Fm
    Non-photochemical quenching (NPQ)(Fm-F'm) / F'm
    Chlorophyll fluorescence decrease ratio (Rfd)(Fm-Fs) / Fs
     | Show Table
    DownLoad: CSV

    The two-way repeated measure analysis of variance was performed to determine treatment effects and t-test was performed to compare control and drought stress treatments at a given day of measurement. Correlation analysis using all individual observations (five replications for each control and drought stress treatments) was performed to determine the relationship among all measured traits, vegetation indices and fluorescence parameters. Partial least square regression (PLSR) models were developed in SAS JMP (version 13.2; SAS Institute, Cary, NC, USA) for comparing hyperspectral, multispectral and chlorophyll fluorescence imaging in their overall associations with physiological assessments of drought stress. Vegetation indices and fluorescence parameters from individual imaging technologies were predictor variables, and turfgrass quality and leaf relative water content were response variables. A leave one out cross validation approach was used to develop the best performing partial least square model for each imaging technology. A model was first established with all predictor variables and the variable with the lowest importance was removed from the dataset and the model was rebuilt with the remaining variables. The rebuilt model was re-validated using leave one out cross validation and assessed checking root mean PRESS and percent variation explained for cumulative Y values. From each loop of operation, one variable was removed, and a new model was developed. The whole process ended when the last variable was removed and thus no more models could be developed. Finally, a series of models was obtained, and they were compared to identify a model with the highest accuracy for individual imaging technologies. The best performing model from each imaging technology was used to estimate turfgrass quality and leaf relative water content.

    The initial soil water content prior to drought stress was maintained at the field capacity of 29% and remained at this level in the well-watered control treatment during the entire experimental period (20 d) (Fig. 1a). SWC in the drought treatment significantly decreased to below the well-watered treatment, beginning at 4 d, and declined to 5.8% by 20 d.

    Figure 1.  Drought stress affected turf quality, leaf relative water content and soil volumetric water content during 20 d of stress period in Kentucky bluegrass. * indicates significant difference between control and drought stress treatments (p ≤ 0.05) at each day of measurement. Presented values represent average of five data points.

    Leaf RWC was ≥ 93% in all plants prior to drought stress and declined to a significantly lower level than that of the control plants, beginning at 10 d of treatment when SWC declined to 16% (Fig. 1b). TQ began to decrease to a significantly lower level than the that of the well-watered plants at 10 d of drought stress at RWC of 87% and SWC of 16%, and further declined to the minimally acceptable level of 6.0 at 16 d of drought stress when RWC decreased to 66% and SWC dropped to 8% during drought stress (Fig. 1c).

    Most hyperspectral imaging indices, including SIPI (Fig. 2a), SRI (Fig. 2b), PRI (Fig. 2d), NDVI (Fig. 2e) and NDRE (Fig. 2f) exhibited a declining trend during 20-d drought stress while PSRI (Fig. 2C) showed increases during drought stress. The index value of drought-stressed plants became significantly lower than that of the well-watered plants, beginning at 14 d for SIPI and SRI, 16 d for PRI and PSRI, and 18 d for NDVI and NDRE. The multispectral SIPIm and SRIm did not differ between drought-stressed plants from the control plants until 18 d of treatment (Fig. 3a, b) while NDVIm, NDREm , PRIm , and PSRIm values were significantly lower than those of well-watered control plants at 16 d of drought stress (Fig. 3cf).

    Figure 2.  Vegetation indices generated by hyperspectral sensing and sensitivity of these indices in monitoring drought in Kentucky bluegrass exposed to 20 d of drought stress. * indicates significant difference between control and drought stress treatments (p ≤ 0.05) at each day of measurement. Presented values represent average of five data points.
    Figure 3.  Vegetation indices generated by multispectral image analysis and sensitivity of these indices in monitoring drought in Kentucky bluegrass exposed to 20 d of drought tress. * indicates significant difference between control and drought stress treatments (p ≤ 0.05) at each day of measurement. Presented values represent average of five data points.

    Chlorophyll fluorescence indices detected drought damages in leaf photosynthesis systems, as shown by declines in different indices during drought stress (Fig. 4). Drought-stressed plants exhibited significant lower chlorophyll fluorescence levels than that of the well-watered plants, beginning at 12 d for NPQ (Fig. 4a), 16 d for Fv/Fm (Fig. 4b), and 18 d for F'V/F'm (Fig. 4c), Y(PSII) (Fig. 4d), qP (Fig. 4e), and qL (Fig. 4f). Separation between drought-stressed and well-watered plants were also evident in index- or parameter- generated images (Fig. 5).

    Figure 4.  Chlorophyll fluorescence parameters measured by pulse amplitude modulated fluorescence imaging system and detection of drought by these parameters in Kentucky bluegrass exposed to 20 d of drought stress. * indicates significant difference between control and drought stress treatments (p ≤ 0.05) at each day of measurement. Presented values represent average of five data points. NPQ, Non-photochemical quenching; Fv /Fm, Maximum photochemical efficiency of PSII; F'v/F'm, Photochemical efficiency of open PSII centers; Y(PSII), Actual photochemical quantum yield of PSII centers; qP, Photochemical quenching coefficient (Puddle model); qL, Photochemical quenching coefficient (Lake model); qN, Non-photochemical quenching coefficient; Rfd, Chlorophyll fluorescence decrease ratio.
    Figure 5.  Maps generated by the three most drought sensitive indices and parameters [hyperspectral structure independent pigment index (SIPI), multispectral normalized difference vegetation index (NDVIm) and chlorophyll fluorescence NPQ]. These maps clearly separated control and drought stress after 18 d of treatment when majorities of indices and parameters detected drought stress.

    Leaf RWC and TQ had significant correlation with most of indices and parameters calculated using three different imaging sensors (hyperspectral, multispectral and chlorophyll fluorescence) (Table 4). Among the indices, RWC had the strongest correlations with chlorophyll fluorescence NPQ (r = 0.88) and qL (r = 0.89), hyperspectral PRI (r = 0.94), and multispectral PSRIm (−0.92). TQ was most correlated to chlorophyll fluorescence NPQ (r = 0.89), hyperspectral PSRI (r = −0.90), and multispectral PSRIm (r = −0.85).

    Table 4.  Correlations among several physiological traits, vegetation indices and chlorophyll fluorescence parameters.
    RWCTQFV/FmF'v/F'mY(PSII)NPQqNqPqLRfdSIPISRIPSRIPRINDVINDREWBISIPImPSRImPRImNDVImNDREm
    RWC1.00
    TQ0.95*1.00
    FV/Fm0.87*0.85*1.00
    F'v/F'm0.81*0.77*0.95*1.00
    Y(PSII)0.85*0.74*0.80*0.74*1.00
    NPQ0.88*0.89*0.95*0.84*0.75*1.00
    qN0.84*0.83*0.96*0.84*0.77*0.96*1.00
    qP0.82*0.70*0.73*0.66*0.99*0.69*0.72*1.00
    qL0.89*0.81*0.90*0.86*0.97*0.83*0.86*0.95*1.00
    Rfd0.84*0.82*0.89*0.83*0.77*0.92*0.86*0.72*0.83*1.00
    SIPI0.84*0.71*0.63*0.58*0.51*0.57*0.69*0.48*0.60*0.46*1.00
    SRI0.57*0.62*0.44*0.45*0.330.41*0.45*0.300.400.330.83*1.00
    PSRI−0.83*−0.90*−0.90*−0.86*−0.76*−0.83*−0.87*−0.71*−0.86*−0.76*−0.75*−0.57*1.00
    PRI0.94*0.82*0.80*0.76*0.71*0.79*0.71*0.66*0.77*0.78*0.260.17−0.78*1.00
    NDVI0.53*0.65*0.41*0.43*0.41*0.42*0.400.380.43*0.42*0.50*0.42*−0.54*0.311.00
    NDRE0.64*0.73*0.64*0.63*0.45*0.54*0.64*0.400.56*0.44*0.92*0.85*−0.75*0.330.50*1.00
    SIPIm0.52*0.50*0.56*0.58*0.47*0.52*0.49*0.43*0.52*0.51*0.330.28−0.58*0.61*0.270.39−0.281.00
    PSRIm−0.92*−0.85*−0.85*−0.85*−0.83*−0.80*−0.77*−0.79*−0.88*−0.77*−0.40−0.230.77*−0.82*−0.41−0.400.32−0.52*1.00
    PRIm0.20−0.030.06−0.010.280.140.110.310.200.180.050.100.01−0.040.000.090.060.09−0.041.00
    NDVIm0.75*0.74*0.77*0.78*0.67*0.72*0.68*0.62*0.73*0.70*0.43*0.33−0.76*0.81*0.370.47*−0.350.93*−0.76*−0.051.00
    NDREm0.90*0.89*0.89*0.89*0.81*0.83*0.81*0.76*0.88*0.81*0.52*0.41*−0.87*0.87*0.45*0.53*−0.320.62*−0.87*−0.040.85*1.00
    Details for individual abbreviations of vegetation indices and fluorescence parameters used in this table were previously mentioned in Tables 1 & 3. Some other abbreviations are: RWC, leaf relative water content; and TQ, turfgrass quality. Values followed by * indicate significant correlation at p ≤ 0.05. Correlation analysis was performed using all individual data points (five replications for each control and drought stress treatments).
     | Show Table
    DownLoad: CSV

    Correlations among different vegetation indices and parameters were also significant in many cases. Hyperspectral indices such as PSRI and PRI were significantly correlated with all multispectral indices except PRIm. Multispectral NDVIm and NDREm were significantly correlated with all hyperspectral indices. When hyperspectral and multispectral indices were correlated with chlorophyll fluorescence parameters, majorities of these indices significantly associated with fluorescence parameters with exceptions of multispectral PRIm which had weak and positive (r ranges 0.06 to 0.31) associations with fluorescence parameters.

    Partial least square regression models were developed by integrating all indices from individual imaging technologies which identified the most reliable imaging systems to detect and monitor plant responses to drought stress. The PLSR model developed using hyperspectral imaging indices had improved predictability (root mean PRESS ≤ 0.38 and percent variation explained ≥ 87) compared to such models developed using other imaging systems and associated indices (Table 5). Comparing multispectral imaging with chlorophyll fluorescence imaging, multispectral imaging had slightly better predictability [root mean PRESS = 0.40 (RWC) and 0.44 (TQ) and percent variation explained = 86 (RWC) and 83 (TQ)] considering similar number of predictor variables used for estimating TQ and RWC in all imaging systems.

    Table 5.  Summary of partial least square model showing predictability of individual models using specific numbers of predictor variables (identified by leave one out cross validation) generated by different sensing technologies. Details of individual abbreviations are mentioned in previous tables. Partial least square was performed using all individual data points (five replications for each control and drought stress treatments).
    Sensing technology used for predictionPredicted
    variable
    No. of predictors usedPredictor variablesRoot mean
    PRESS
    Percent variation explained
    for cumulative Y
    Cumulative Q2
    HyperspectralTQ4PRI, PSRI, NDRE, SIPI0.36870.99
    RWC4PRI, PSRI, NDRE, SIPI0.38890.99
    MultispectralTQ3PSRIm, NDVIm, NDREm0.44850.97
    RWC3PSRIm, NDVIm, NDREm0.40860.97
    Chlorophyll fluorescenceTQ4Fv/Fm, NPQ, qN, qL0.46830.95
    RWC3Fv/Fm, NPQ, qL0.59840.93
     | Show Table
    DownLoad: CSV

    The integrated indices from each of the three imaging systems were highly correlated to TQ, with R2 of 0.90, 0.85, and 0.83 for hyperspectral imaging, multispectral imaging, and chlorophyll fluorescence, respectively (Fig. 6). For RWC, the correlation R2 was 0.88, 0.84, and 0.80, respectively with hyperspectral imaging, multispectral imaging, and chlorophyll fluorescence. The hyperspectral imaging was better be able to predict TQ and RWC compared to other imaging systems (Fig. 6).

    Figure 6.  Comparison of predicted turfgrass quality (TQ) and leaf relative water content (RWC) versus their measured values using partial least square regression model. Turfgrass quality and relative water contents were predicted using various indices generated by hyperspectral, multispectral and chlorophyll fluorescence sensing technologies. The dashed line represents the I:I line. Regression analysis was performed using all individual data points (five replications for each control and drought stress treatments).

    Leaf RWC and TQ are the two most widely used parameters or traits to evaluate turfgrass responses to drought stress[28,32,33]. In this study, RWC detected water deficit in leaves at 10 d of drought stress when SWC declined to 16% and TQ declined to below the minimal acceptable level of 6.0 at 16 d of drought stress when RWC decreased to 66% and SWC dropped to 8% during drought stress. These results suggested that RWC was a sensitive trait to detect water stress in plants, which is in agreement with previous research[34,35]. However, leaf RWC is a destructive measurement and TQ is a subjective estimate. Nondestructive and quantitative detection of stress symptoms in plants through assessing changes in phenotypic and physiological responses of plants to drought stress is critical for developing water-saving irrigation programs and breeding selection traits to increase water use efficiency and improve plant tolerance to drought stress. In this study, some of the phenotypic traits assessed by hyperspectral and multispectral imaging analysis and photosynthetic parameters measured by chlorophyll fluorescence were highly correlated to leaf RWC or visual TQ, as discussed in detail below, which could be used as non-destructive indicators or predictors for the level of drought stress in Kentucky bluegrass and other cool-season turfgrass species.

    The strong correlation of integrated indices from each of the three imaging systems with TQ (R2 of 0.90, 0.85, and 0.83, respectively) and RWC (R2 of 0.88, 0.84, and 0.80, respectively) for hyperspectral imaging, multispectral imaging, and chlorophyll fluorescence suggested that all three non-destructive imaging systems could be used as a non-destructive technique to detect and monitor water stress in Kentucky bluegrass. However, the hyperspectral imaging indices had higher predictability to RWC and visual TQ compared to the indices from multispectral imaging and chlorophyll fluorescence based on the PLSR models. Hyperspectral imaging used in this study captured images in 447 different spectral bands and gathered much more details about individual components of entire vegetation as each component has its own spectral signature. Multispectral imaging captures images with ten spectral bands and chlorophyll fluorescence imaging used only emitted red and far-red lights to snap images. Nevertheless, our results suggested that the PLSR models by integrating all indices from each individual imaging technologies identified the most reliable imaging systems to detect and monitor plant responses to drought stress in this study.

    The indices derived from the three imaging systems varied in their correlation to RWC or TQ in Kentucky bluegrass in this study. Among the indices, RWC had the strongest correlations with chlorophyll fluorescence NPQ (r = 0.88) and qL (r = 0.89), hyperspectral PRI (r = 0.94), and multispectral PSRIm (r = −0.92). TQ was most correlated to chlorophyll fluorescence NPQ (r = 0.89), hyperspectral PSRI (r = −0.90), and multispectral PSRIm (r = −0.85). The indices also varied in their sensitivity to drought stress for Kentucky bluegrass, and therefore they detected drought stress in plants at different times of treatment. The hyperspectral SIPI and SRI were the most responsive to drought stress with significant decline at 14 d followed by PRI and PSRI at 16 d while NDVI and NDRE were slowest showing decline (18 d) in response to drought. Multispectral indices exhibited decline later during drought at 16 d of drought stress for NDVIm, NDREm , PRIm , and PSRIm and 18 d for SIPIm and SRIm. Indices SIPI and SRI are related to leaf carotenoid composition and vegetation density and high spectral resolution of hyperspectral system was able to capture subtle changes in pigment concentration and canopy (slight leaf shrinking and rolling) at early phase of drought progression[36,37]. Index PSRI is indicative of the ratio of bulk carotenoids including α- and β-carotenes to chlorophylls and PRI is sensitive to xanthophyll cycle particularly de-epoxidation of zeaxanthin that releases excess energy as heat in order to photoprotection[3840]. Activation of photoprotective mechanisms including xanthophyl cycle require a certain level of stress severity depending on type of abiotic stress and plant species[41]. The PSRI calculated using both hyperspectral and multispectral imaging systems exhibited similar trends, and PSRI and PRI from either imaging system detected drought stress after 16 days of treatment applications. In agreement with our results, Das & Seshasai[42] found that PSRI showed similar trends when its value > −0.2 regardless of whether measured using hyperspectral or multispectral imaging. Both PSRI and PRI were also highly correlated to leaf RWC or TQ in Kentucky bluegrass exposed to drought stress in this study, suggesting that these two indices could be useful parameters to detect and monitor plant responses to drought stress.

    Vegetation index of NDVI has been the most widely used vegetation index in several crops such as wheat (Triticum aestivum L.)[43], cool- and warm-season turfgrass species including perennial ryegrass (Lolium perenne L.), tall fescue (Festuca arundinacea Schreb.), seashore paspalum (Paspalum vaginatum Sw.) and hybrid bermudagrass [Cynodon dactylon (L.) Pers. × C. transvaalensis Burtt-Davy][2, 44, 45]. For example, Bhandari et al.[43] and Badzmierowski et al.[14] found NDVI was correlated to overall turfgrass quality and chlorophyll content under nitrogen and drought stresses in tall fescue and citrus (Citrus spp.) plants. In this study, NDVI and NDRE were also correlated to leaf RWC and TQ, both NDVI and NDRE calculated from hyperspectral or multispectral imaging were least responsive to drought stress or detected drought stress later than other indices. Hong et al.[46] reported that NDVI being a better indicator than NDRE for early drought stress detection in turfgrasses when these indices were measured by handheld multispectral sensor. Eitel et al.[47] utilized broadband satellite images to estimate NDVI and NDRE and identified NDRE being a better option for early detection of stress condition in woodland area. Either NDVI or NDRE could be used as indices for vegetation density, but not sensitive indicators for plant responses to drought stress or for detecting drought damages in plants.

    Chlorophyll fluorescence reflects the integrity and functionality of photosystems in the light reactions of photosynthesis and serves as a good indicator for photochemical activity and efficiency[48]. The Y(PSII) is an effective quantum yield of photochemical energy conversion and estimates the actual proportion of absorbed light that is used for electron transport[49]. The ratio of F'v/F'm is maximum proportion of absorbed light that can be used for electron transport when all possible PSII reaction centers are open under light adapted state. Parameters qP and qL estimate the fraction of open PSII centers based on 'puddle' and 'lake or connected unit' models of photosynthetic antenna complex, respectively[50]. Rfd is an indicator for photosynthetic quantum conversion associated with functionality of the photosynthetic core unit. Overall, these parameters revolve around the operation status and functioning of PSII reaction centers or the core unit that possesses chlorophyll a-P680 in a matrix of proteins[51]. Parameter NPQ indicates non-photochemical quenching of fluorescence via heat dissipation involving xanthophyll cycle and state transition of photosystems[52]. This parameter is mostly associated with xanthophylls and other pigments in light harvesting antenna complex of photosystems but not with the PSII core unit[53]. Li et al.[9] reported that chlorophyll fluorescence imaging parameters including F'V/F'm have a limitation of late drought detection in plants. Shin et al.[54] reported F'V/F'm, Y(PSII), qP, and qL detected stress effects under severe drought when leaves were completely wilted and fresh weights declined in lettuce (Lactuca sativa L.) seedings. In this study, NPQ and Fv/Fm exhibited significant decline earlier (12−16 d of stress treatment) when drought was in mild to moderate level (> 60% leaf water content) compared to other chlorophyll fluorescence indices. The NPQ was strongly correlated to leaf RWC (r = 0.88) and TQ (r = 0.89) for Kentucky bluegrass exposed to drought stress. These results suggested that NPQ is a sensitive indicator of photosynthetic responses to drought stress and could be a useful parameter for evaluating plant tolerance to drought stress and monitoring drought responses.

    The comparative analysis of phenotypic and photosynthetic responses to drought stress using three imaging technologies (hyperspectral, multispectral and chlorophyll fluorescence) using the partial least square modeling demonstrated that the integrated vegetation indices from hyperspectral imaging had higher predictability for detecting turfgrass responses to drought stress relative to those from multispectral imaging and chlorophyll fluorescence. Among individual indices, SIPI and SRI from hyperspectral imaging were able to detect drought stress sooner than others while PSRI and PRI from both hyperspectral and multispectral imaging were also highly correlated to leaf RWC or TQ responses to drought stress, suggesting these indices could be useful parameters to detect and monitor drought stress in cool-season turfgrass. While NDVI or NDRE from both hyperspectral and multispectral imaging could be used as indices for vegetation density, but not sensitive indicators for plant responses to drought stress. Among chlorophyll fluorescence indices, NPQ and Fv/Fm were more closely correlated to RWC or TQ while NPQ was most responsive to drought stress, and therefore NPQ could be a useful indicator for detecting and monitoring cool-season turfgrass response to drought stress. The sensitivity and effectiveness of these indices associated with drought responses in this study could be further testified in other cool-season and warm-season turfgrass species under field conditions. As each imaging technology used in this experiment comes with bulky accessories such as LED panels, mounting tower and support system, capturing images within limited space of controlled environmental chambers are challenging. Future research should be in developing multimodal imaging integrating major features of all three technologies and reducing size and space requirement that would deliver improved decision support for drought monitoring and irrigation management in turfgrasses. Development of advanced algorithms that could incorporate broader spectral details or band reflectance for calculating novel vegetation indices are warranted.

    The research presented in this paper was funded by the United State Department of Agriculture - National Institute of Food and Agriculture (2021-51181-35855).

  • The authors declare that they have no conflict of interest. Bingru Huang is the Editorial Board member of Journal Grass Research who was blinded from reviewing or making decisions on the manuscript. The article was subject to the journal's standard procedures, with peer-review handled independently of this Editorial Board member and her research groups.

  • Supplemental Table S1 The primer pairs for the qRT-PCR analysis.
  • [1]

    Rastogi A, Shukla S. 2013. Amaranth: a new millennium crop of nutraceutical values. Critical Reviews in Food Science and Nutrition 53:109−25

    doi: 10.1080/10408398.2010.517876

    CrossRef   Google Scholar

    [2]

    Sarker U, Hossain MN, Iqbal MA, Oba S. 2020. Bioactive components and radical scavenging activity in selected advance lines of salt-tolerant vegetable amaranth. Frontiers in Nutrition 7:587257

    doi: 10.3389/fnut.2020.587257

    CrossRef   Google Scholar

    [3]

    Sarker U, Lin YP, Oba S, Yoshioka Y, Hoshikawa K. 2022. Prospects and potentials of underutilized leafy Amaranths as vegetable use for health-promotion. Plant Physiology and Biochemistry 182:104−23

    doi: 10.1016/j.plaphy.2022.04.011

    CrossRef   Google Scholar

    [4]

    Sarker U, Oba S. 2020. Nutraceuticals, phytochemicals, and radical quenching ability of selected drought-tolerant advance lines of vegetable amaranth. BMC Plant Biology 20:564

    doi: 10.1186/s12870-020-02780-y

    CrossRef   Google Scholar

    [5]

    Velička A, Tarasevičienė Ž, Hallmann E, Kieltyka-Dadasiewicz A. 2022. Impact of foliar application of amino acids on essential oil content, odor profile, and flavonoid content of different mint varieties in field conditions. Plants 11:2938

    doi: 10.3390/plants11212938

    CrossRef   Google Scholar

    [6]

    Adhikary S, Dasgupta N. 2023. Role of secondary metabolites in plant homeostasis during biotic stress. Biocatalysis and Agricultural Biotechnology 50:102712

    doi: 10.1016/j.bcab.2023.102712

    CrossRef   Google Scholar

    [7]

    Nabavi SM, Šamec D, Tomczyk M, Milella L, Russo D, et al. 2020. Flavonoid biosynthetic pathways in plants: Versatile targets for metabolic engineering. Biotechnology Advances 38:107316

    doi: 10.1016/j.biotechadv.2018.11.005

    CrossRef   Google Scholar

    [8]

    Chanoca A, Burkel B, Kovinich N, Grotewold E, Eliceiri KW, et al. 2016. Using fluorescence lifetime microscopy to study the subcellular localization of anthocyanins. The Plant Journal 88:895−903

    doi: 10.1111/tpj.13297

    CrossRef   Google Scholar

    [9]

    Kurepa J, Shull TE, Smalle JA. 2023. Friends in arms: Flavonoids and the auxin/cytokinin balance in terrestrialization. Plants 12:517

    doi: 10.3390/plants12030517

    CrossRef   Google Scholar

    [10]

    Xiong C, Li X, Wang X, Wang J, Lambers H, et al. 2022. Flavonoids are involved in phosphorus-deficiency-induced cluster-root formation in white lupin. Annals of Botany 129:101−12

    doi: 10.1093/aob/mcab131

    CrossRef   Google Scholar

    [11]

    Jiang L, Yanase E, Mori T, Kurata K, Toyama M, et al. 2019. Relationship between flavonoid structure and reactive oxygen species generation upon ultraviolet and X-ray irradiation. Journal of Photochemistry and Photobiology A: Chemistry 384:112044

    doi: 10.1016/j.jphotochem.2019.112044

    CrossRef   Google Scholar

    [12]

    Yang Z, Bai C, Wang P, Fu W, Wang L, et al. 2021. Sandbur drought tolerance reflects phenotypic plasticity based on the accumulation of sugars, lipids, and flavonoid intermediates and the scavenging of reactive oxygen species in the root. International Journal of Molecular Sciences 22:12615

    doi: 10.3390/ijms222312615

    CrossRef   Google Scholar

    [13]

    Zhang M, Liu C, Zhang Z, Yang S, Zhang B, et al. 2014. A new flavonoid regulates angiogenesis and reactive oxygen species production. In Oxygen Transport to Tissue XXXVI. Advances in Experimental Medicine and Biology, eds. Swartz HM, Harrison DK, Bruley DF. Vol 812. New York: Springer. pp. 149−55. doi: 10.1007/978-1-4939-0620-8_20

    [14]

    Wei L, Wang W, Li T, Chen O, Yao S, et al. 2023. Genome-wide identification of the CsPAL gene family and functional analysis for strengthening green mold resistance in citrus fruit. Postharvest Biology and Technology 196:112178

    doi: 10.1016/j.postharvbio.2022.112178

    CrossRef   Google Scholar

    [15]

    Chen X, Wang P, Gu M, Hou B, Zhang C, et al. 2022. Identification of PAL genes related to anthocyanin synthesis in tea plants and its correlation with anthocyanin content. Horticultural Plant Journal 8:381−94

    doi: 10.1016/j.hpj.2021.12.005

    CrossRef   Google Scholar

    [16]

    Bartas M, Volna A, Cerven J, Pucker B. 2023. Identification of annotation artifacts concerning the chalcone synthase (CHS). BMC Research Notes 16:109

    doi: 10.1186/s13104-023-06386-z

    CrossRef   Google Scholar

    [17]

    Ni R, Niu M, Fu J, Tan H, Zhu TT, et al. 2022. Molecular and structural characterization of a promiscuous chalcone synthase from the fern species Stenoloma chusanum. Journal of Integrative Plant Biology 64:1935−51

    doi: 10.1111/jipb.13335

    CrossRef   Google Scholar

    [18]

    Liu J, Hao XL, He XQ. 2021. Characterization of three chalcone synthase-like genes in Dianthus chinensis. Plant Cell, Tissue and Organ Culture 146:483−92

    doi: 10.1007/s11240-021-02081-8

    CrossRef   Google Scholar

    [19]

    Lin LM, Guo HY, Song X, Zhang DD, Long YH, et al. 2021. Adaptive evolution of Chalcone Isomerase superfamily in Fagaceae. Biochemical Genetics 59:491−505

    doi: 10.1007/s10528-020-10012-z

    CrossRef   Google Scholar

    [20]

    Park SI, Park HL, Bhoo SH, Lee SW, Cho MH. 2021. Biochemical and molecular characterization of the rice chalcone isomerase family. Plants 10:2064

    doi: 10.3390/plants10102064

    CrossRef   Google Scholar

    [21]

    Dai M, Kang X, Wang Y, Huang S, Guo Y, et al. 2022. Functional characterization of Flavanone 3-Hydroxylase (F3H) and its role in anthocyanin and flavonoid biosynthesis in mulberry. Molecules 27:3341

    doi: 10.3390/molecules27103341

    CrossRef   Google Scholar

    [22]

    Wu L, Tian J, Yu Y, Yuan L, Zhang Y, et al. 2023. Functional characterization of a cold related flavanone 3-hydroxylase from Tetrastigma hemsleyanum: an in vitro, in silico and in vivo study. Biotechnology Letters 45:1565−78

    doi: 10.1007/s10529-023-03440-5

    CrossRef   Google Scholar

    [23]

    Wang L, Lui AC, Lam PY, Liu G, Godwin ID, et al. 2020. Transgenic expression of flavanone 3-hydroxylase redirects flavonoid biosynthesis and alleviates anthracnose susceptibility in sorghum. Plant Biotechnology Journal 18:2170−72

    doi: 10.1111/pbi.13397

    CrossRef   Google Scholar

    [24]

    Maoka T. 2020. Carotenoids as natural functional pigments. Journal of Natural Medicines 74:1−16

    doi: 10.1007/s11418-019-01364-x

    CrossRef   Google Scholar

    [25]

    Wurtzel ET. 2019. Changing form and function through carotenoids and synthetic biology. Plant Physiology 179:830−43

    doi: 10.1104/pp.18.01122

    CrossRef   Google Scholar

    [26]

    Nguyen KO, Al-Rashid S, Clarke Miller M, Tom Diggs J, Lampert EC. 2019. Trichoplusia ni (Lepidoptera: Noctuidae) qualitative and quantitative sequestration of host plant carotenoids. Environmental Entomology 48:540−45

    doi: 10.1093/ee/nvz029

    CrossRef   Google Scholar

    [27]

    Wang JY, Lin PY, Al-Babili S. 2021. On the biosynthesis and evolution of apocarotenoid plant growth regulators. Seminars in Cell & Developmental Biology 109:3−11

    doi: 10.1016/j.semcdb.2020.07.007

    CrossRef   Google Scholar

    [28]

    Ding BY, Niu J, Shang F, Yang L, Chang TY, et al. 2019. Characterization of the geranylgeranyl diphosphate synthase gene in Acyrthosiphon pisum (Hemiptera: Aphididae) and its association with carotenoid biosynthesis. Frontiers in Physiology 10:1398

    doi: 10.3389/fphys.2019.01398

    CrossRef   Google Scholar

    [29]

    Ezquerro M, Li C, Pérez-Pérez J, Burbano-Erazo E, Barja MV, et al. 2023. Tomato geranylgeranyl diphosphate synthase isoform 1 is involved in the stress-triggered production of diterpenes in leaves and strigolactones in roots. New Phytologist 239:2292−306

    doi: 10.1111/nph.19109

    CrossRef   Google Scholar

    [30]

    Camagna M, Grundmann A, Bär C, Koschmieder J, Beyer P, et al. 2019. Enzyme fusion removes competition for geranylgeranyl diphosphate in carotenogenesis. Plant Physiology 179:1013−27

    doi: 10.1104/pp.18.01026

    CrossRef   Google Scholar

    [31]

    Zhou X, Rao S, Wrightstone E, Sun T, Lui ACW, et al. 2022. Phytoene synthase: the key rate-limiting enzyme of carotenoid biosynthesis in plants. Frontiers in Plant Science 13:884720

    doi: 10.3389/fpls.2022.884720

    CrossRef   Google Scholar

    [32]

    Hou X, Alagoz Y, Welsch R, Mortimer MD, Pogson BJ, et al. 2024. Reducing PHYTOENE SYNTHASE activity fine-tunes the abundance of a cis-carotene-derived signal that regulates the PIF3/HY5 module and plastid biogenesis. Journal of Experimental Botany 75:1187−204

    doi: 10.1093/jxb/erad443

    CrossRef   Google Scholar

    [33]

    Liang MH, Xie SR, Dai JL, Chen HH, Jiang JG. 2023. Roles of two phytoene synthases and orange protein in carotenoid metabolism of the β-carotene-accumulating Dunaliella salina. Microbiology Spectrum 11:e00069-23

    doi: 10.1128/spectrum.00069-23

    CrossRef   Google Scholar

    [34]

    Naing AH, Kyu SY, Pe PPW, Park KI, Lee JM, et al. 2019. Silencing of the phytoene desaturase (PDS) gene affects the expression of fruit-ripening genes in tomatoes. Plant Methods 15:110

    doi: 10.1186/s13007-019-0491-z

    CrossRef   Google Scholar

    [35]

    Guo W, Liu Y, Yan X, Liu M, Tang H, et al. 2015. Cloning and characterization of a phytoene dehydrogenase gene from marine yeast Rhodosporidium diobovatum. Antonie van Leeuwenhoek 107:1017−27

    doi: 10.1007/s10482-015-0394-6

    CrossRef   Google Scholar

    [36]

    Li C, Li B, Han X. 2016. Advances in phytoene dehydrogenase-A review. Acta Microbiologica Sinica 56:1680−90

    doi: 10.13343/j.cnki.wsxb.20160089

    CrossRef   Google Scholar

    [37]

    Matthews PD, Luo R, Wurtzel ET. 2003. Maize phytoene desaturase and ζ-carotene desaturase catalyse a poly-Z desaturation pathway: implications for genetic engineering of carotenoid content among cereal crops. Journal of Experimental Botany 54:2215−30

    doi: 10.1093/jxb/erg235

    CrossRef   Google Scholar

    [38]

    Dong H, Deng Y, Mu J, Lu Q, Wang Y, et al. 2007. The Arabidopsis Spontaneous Cell Death1 gene, encoding a ζ-carotene desaturase essential for carotenoid biosynthesis, is involved in chloroplast development, photoprotection and retrograde signalling. Cell Research 17:458−70

    doi: 10.1038/cr.2007.37

    CrossRef   Google Scholar

    [39]

    Danova K, Pistelli L. 2022. Plant tissue culture and secondary metabolites production. Plants 11:3312

    doi: 10.3390/plants11233312

    CrossRef   Google Scholar

    [40]

    Humbal A, Pathak B. 2023. Harnessing nanoparticle-mediated elicitation in plant tissue culture: a promising approach for secondary metabolite production. Plant Cell, Tissue and Organ Culture 155:385−402

    doi: 10.1007/s11240-023-02612-5

    CrossRef   Google Scholar

    [41]

    Li H, Meng X, Zhang Y, Guo M, Li L. 2023. Active components of Leontopodium alpinum Callus culture extract for blue light damage in human foreskin fibroblasts. Molecules 28:7319

    doi: 10.3390/molecules28217319

    CrossRef   Google Scholar

    [42]

    Khan RM, Akram M, Faisal M. 2023. Morphological identification and callus induction of most abundant brown seaweed from the coast of Karachi, Pakistan. Life Science Journal of Pakistan 5(2):3−8

    Google Scholar

    [43]

    Liu X, Wang P, Li R, Hyden B, An X, et al. 2023. Cellular and metabolic characteristics of peach anther-derived callus. Scientia Horticulturae 311:111796

    doi: 10.1016/j.scienta.2022.111796

    CrossRef   Google Scholar

    [44]

    Winson KWS, Chew BL, Sathasivam K, Subramaniam S. 2021. Effect of amino acid supplementation, elicitation and LEDs on Hylocereus costaricensis callus culture for the enhancement of betalain pigments. Scientia Horticulturae 289:110459

    doi: 10.1016/j.scienta.2021.110459

    CrossRef   Google Scholar

    [45]

    Wang G, Liu Y, Gao Z, Li H, Wang J. 2023. Effects of amino acids on callus proliferation and somatic embryogenesis in Litchi chinensis cv 'Feizixiao'. Horticulturae 9:1311

    doi: 10.3390/horticulturae9121311

    CrossRef   Google Scholar

    [46]

    Yang J, Gong Z, Tan X. 2008. Induction of callus and extraction of alkaloid from Yi Mu Cao (Leonurus heterophylus Sw) culture. African Journal of Biotechnology 7(8):1157−62

    Google Scholar

    [47]

    Masoumian M, Arbakariya A, Syahida A, Maziah M. 2011. Effect of precursors on flavonoid production by Hydrocotyle bonariensis callus tissues. African Journal of Biotechnology 10:6021−29

    Google Scholar

    [48]

    Xuan Y, Liu S, Xie L, Pan J. 2023. Establishment of Amaranthus spp. calluses and cell suspension culture, and the effect of plant growth regulators on total flavonoid content. Tropical Plants 2:15

    doi: 10.48130/tp-2023-0015

    CrossRef   Google Scholar

    [49]

    Xiao F , Zheng YF, Chen JL, Chen CL, Chen H, et al. 2021. Selection and validation of reference genes in all-red Amaranth (Amaranthus tricolor L.) seedlings under different culture conditions. The Journal of Horticultural Science and Biotechnology 96(5):604−13

    doi: 10.1080/14620316.2021.1879686

    CrossRef   Google Scholar

    [50]

    Rahmouni S, El Ansari ZN, Badoc A, Martin P, El Kbiach ML, et al. 2020. Effect of amino acids on secondary somatic embryogenesis of Moroccan cork oak (Quercus suber L.) tree. American Journal of Plant Sciences 11:626−41

    doi: 10.4236/ajps.2020.115047

    CrossRef   Google Scholar

    [51]

    Satish L, Rathinapriya P, Ceasar SA, Rency AS, Pandian S, et al. 2016. Effects of cefotaxime, amino acids and carbon source on somatic embryogenesis and plant regeneration in four Indian genotypes of foxtail millet (Setaria italica L.). In Vitro Cellular & Developmental Biology-Plant 52:140−53

    doi: 10.1007/s11627-015-9724-7

    CrossRef   Google Scholar

    [52]

    Aparna V, Neema M, Chandran KP, Muralikrishna KS, Karun A. 2023. Enhancement of callogenesis from plumular explants of coconut (Cocos nucifera) via exogenous supplementation of amino acids and casein hydrolysate. Current Horticulture 11:40−43

    doi: 10.5958/2455-7560.2023.00008.0

    CrossRef   Google Scholar

    [53]

    Liu S, Zheng X, Pan J, Peng L, Cheng C, et al. 2019. RNA-sequencing analysis reveals betalains metabolism in the leaf of Amaranthus tricolor L. PLoS ONE 14:e0216001

    doi: 10.1371/journal.pone.0216001

    CrossRef   Google Scholar

  • Cite this article

    Xuan Y, Feng W, Lai Z, Liu S. 2024. Effects of aromatic amino acids on callus growth and accumulation of secondary metabolites in amaranth. Tropical Plants 3: e032 doi: 10.48130/tp-0024-0034
    Xuan Y, Feng W, Lai Z, Liu S. 2024. Effects of aromatic amino acids on callus growth and accumulation of secondary metabolites in amaranth. Tropical Plants 3: e032 doi: 10.48130/tp-0024-0034

Figures(6)  /  Tables(2)

Article Metrics

Article views(1678) PDF downloads(336)

Other Articles By Authors

ARTICLE   Open Access    

Effects of aromatic amino acids on callus growth and accumulation of secondary metabolites in amaranth

Tropical Plants  3 Article number: e032  (2024)  |  Cite this article

Abstract: Amaranth, a green leafy vegetable with high edible value, is rich in flavonoids and carotenoids. Aromatic amino acids are favored to secondary metabolites biosynthesis as precursors. Our previous study showed that flavonoids could be produced using amaranth callus. However, the effects of aromatic amino acids on the callus growth, the accumulation of secondary metabolites, and the expression of related genes in amaranth are still unclear. In this study, the results showed that aromatic amino acids could promote the growth of amaranth callus. Meanwhile, tyrosine and phenylalanine within fitting concentrations were beneficial to flavonoid accumulation and expression regulation of the related gene. In contrast, aromatic amino acids reduced carotenoid accumulation. The results provide a scientific basis and method for callus culture and flavonoid production by the callus of amaranth.

    • Amaranth, a green leafy vegetable with high edible value, is rich in flavonoids, carotenoids, betalains, and other secondary metabolites[14]. Aromatic amino acids are precursors of secondary metabolites such as flavonoids, carotenoids, and alkaloids[5].

      Flavonoid compounds are important secondary metabolites produced by plants[6]. They are widely found in seeds, flowers, leaves, and fruits of plants, and most of them accumulate in the vacuoles of plant cells[7,8]. Flavonoids have a variety of biological functions. They can not only affect the transport of plant hormones[9,10], but also regulate the level of reactive oxygen species (ROS) in plants[1113]. Phenylalanine ammonia-lyase (PAL) is the first enzyme in the phenylpropane metabolic pathway and a key enzyme in the flavonoid metabolic pathway[14,15]. Chalcone synthase (CHS) is the first key enzyme in the flavonoid synthesis pathway, which leads the phenylpropane metabolic pathway to the flavonoid synthesis pathway[1618]. Chalcone isomerase (CHI) is an important rate-limiting enzyme in the synthesis pathway of flavonoid compounds, which catalyzes the chalcone cyclization[19,20]. Flavanone 3-carboxylase (F3H) catalyzes the synthesis of flavonols and substrates for anthocyanin synthesis[2123].

      Carotenoids are a group of yellow, red, or orange-red polyene substances. There are a wide variety of carotenoids, about 850 kinds[24], and they are widely found in the chloroplast and chromoplast membranes in plants. Carotenoids could participate in photosynthesis in plant cells and reduce photooxidation in precursor cells[24,25]. Carotenoids participated in the synthesis of plant hormones[26,27]. In the metabolic pathway of carotenoids, the transcription level of related enzymes affects the synthesis of carotenoids, geranylgeranyl diphosphate (GGPP) is a direct precursor in carotenoid biosynthesis pathway[28,29]. Two GGPPs are condensed into colorless phytoene under the catalysis of phytoene synthase (PSY)[30], which is the rate-limiting enzyme in the carotenoid synthesis pathway[3133]. Phytoene is converted to red phytoene by the co-catalysis of phytoene dehydrogenase (PDS) and carotene dehydrogenase (ZDS)[3436]. The content of phytoene was changed in maize by the PDS gene mutation[37], and the content of carotenoids was changed in Arabidopsis because of the ZDS gene mutation[38].

      Plant tissue culture is an important part of biotechnology and has become one of the most effective methods for the production of secondary metabolites[39,40]. During plant tissue culture, callus growth, and accumulation of secondary metabolites are affected by many factors, such as plant growth regulators, exogenous additives, light conditions, and so on[4143]. Amino acids, a sort of exogenous additive, are important factors affecting callus biomass, and different amino acids have different effects on the accumulation of secondary metabolites[44,45]. The addition of amino acids could increase the accumulation of alkaloids in the suspension callus of motherwort (Leonurus heterophyllus Sweet)[46]. Low concentrations of L-proline increased biomass and alkaloid accumulation in callus of Hydrocotyle bonariensis, while high concentrations inhibited it[47].

      Our previous study showed that flavonoids could be produced using amaranth callus[48]. However, the effects of aromatic amino acids on the callus growth, the accumulation of secondary metabolites, and the expression of related genes in amaranth are still unclear. Therefore, based on the previous research, an amaranth callus was used as the material to analyze the effects of aromatic amino acids on the growth of amaranth callus and the synthesis of secondary metabolites, suitable conditions were screened out for the production of flavonoids and carotenoids from amaranth callus, and the effect of exogenous amino acids on the gene expression of flavonoids and carotenoids were determined. The results provide a scientific basis and method for callus culture and flavonoid production by the callus of amaranth.

    • The callus was induced by 'Suxian No.1' as material, which were provided by Suzhou Academy of Agricultural Sciences (Suzhou, China).

    • Amaranth callus was inoculated into a basic medium (MS + 0.5 mg/L 2,4-D + 6.0 mg/L 6-BA + 30 g/L sucrose + 7 g/L agar)[48], supplemented with different concentrations of tyrosine (0, 2.0, 4.0, 6.0, and 8.0 mg/L), phenylalanine (0, 1.0, 2.0, 3.0, and 4.0 mg/L), and tryptophan (0, 0.5, 1.0, 1.5, and 2.0 mg/L). Each concentration was inoculated into 30 bottles, and three small pieces of amaranth callus (each piece was about 0.2 g fresh weight) were in each bottle. Three biological repeats were performed for each treatment. After 35 d of treatment, the growth of amaranth callus was observed, and the fresh weight and dry weight of callus were counted and sampled.

      Proliferation coefficient = Callus biomass after proliferation (g/bottle) / Initial callus biomass (g/bottle)

    • The flavonoid content in Amaranthus tricolor was determined according to the flavonoid extraction and determination protocol (Comin Biotechnology Co., Ltd., Suzhou, China). 10 mL 60% (v/v) ethanol solution was added into a conical flask with 20 mg dried powder of amaranth callus. Flavonoid extraction was performed with shaking at 60 °C for 2 h, followed by centrifugation at 10,000 rpm at 25 °C for 10 min. The supernatant, containing flavonoid, was detected at a wavelength of 510 nm in a ultraviolet-visible spectrum spectrophotometer (UV-900, Shanghai Yuan Analysis Instrument Co., Ltd, Shanghai, China). For quantitation, rutin was used as an internal standard for calibration.

      Standard curve: y = 5.02x + 0.0007,R2 = 0.9996

      Total flavonoid content (mg·g−1 DW) = (△A−0.0007) / 5.02 / (w/v)

      Carotenoid content was determined by ultraviolet-visible spectrum spectrophotometer. 2 ml of extraction solution of acetone : petroleum ether (1:1, v/v) was added into a tube with 20 mg dried powder of amaranth callus. And then the mixture was placed on a 200 rpm shaker to extract carotenoid for 8 h under dark conditions. Subsequently, the supernatant was collected by centrifuging at 10,000 rpm for 5 min at room temperature. Finally, the absorption peak of carotenoid at 445 nm was determined by a ultraviolet-visible spectrum spectrophotometer (UV-900, Shanghai Yuan Analysis Instrument Co., Ltd., Shanghai, China).

    • Total RNA was extracted was from all samples using a MolPure Plant Plus RNA Kit (Yeasen, China) according to the manufacturer's instructions. First-strand cDNA was then synthesized from 1 mg of total RNA using Recombinant M-MLV reverse transcriptase (TransGen Biotech, Beijing, China). Quantitative real time-PCR (qRT-PCR) was performed in optical 96-well plates using the Roche LightCycler 480II instrument (Roche, Sweden). The reactions were carried out in a 20 μL volume containing 10 μL of Hieff qPCR SYBR Green PCR Master Mix (Yeasen Biotechnology, China), 0.5 μL of gene-specific primers, 2 μL of diluted cDNA, and 7.0 μL of ddH2O. The PCR conditions were as follows: 30 s at 95 °C, 40 cycles of 10 s at 95 °C and 12 s at 59 °C, followed by 12 s at 72 °C. Three biological repeats were performed for each material. EF1α[49] was used as the reference gene. The 2ΔΔCᴛ method was used for quantitative analyses of gene expression. The primers used for qRT-PCR are listed in Supplemental Table S1.

    • Data are presented as mean ± standard error and were submitted to analysis of variance (ANOVA). Values of p < 0.05 were significant in comparisons between the treatments and controls. All statistical analyses were performed using SPSS 26 (IBM Corp., Armonk, NY, USA). GraphPad Prism 8.1 (GraphPad Software Inc., La Jolla, CA, USA) was used for the bar chart drawing.

    • After treatment with different concentrations of aromatic amino acids for 35 d, the amaranth callus growth was normal without browning (Fig. 1). On the medium with tyrosine, the callus color was green and yellow, but on the medium with phenylalanine, the callus color was white. The best medium was with tryptophan, where the callus color was yellow.
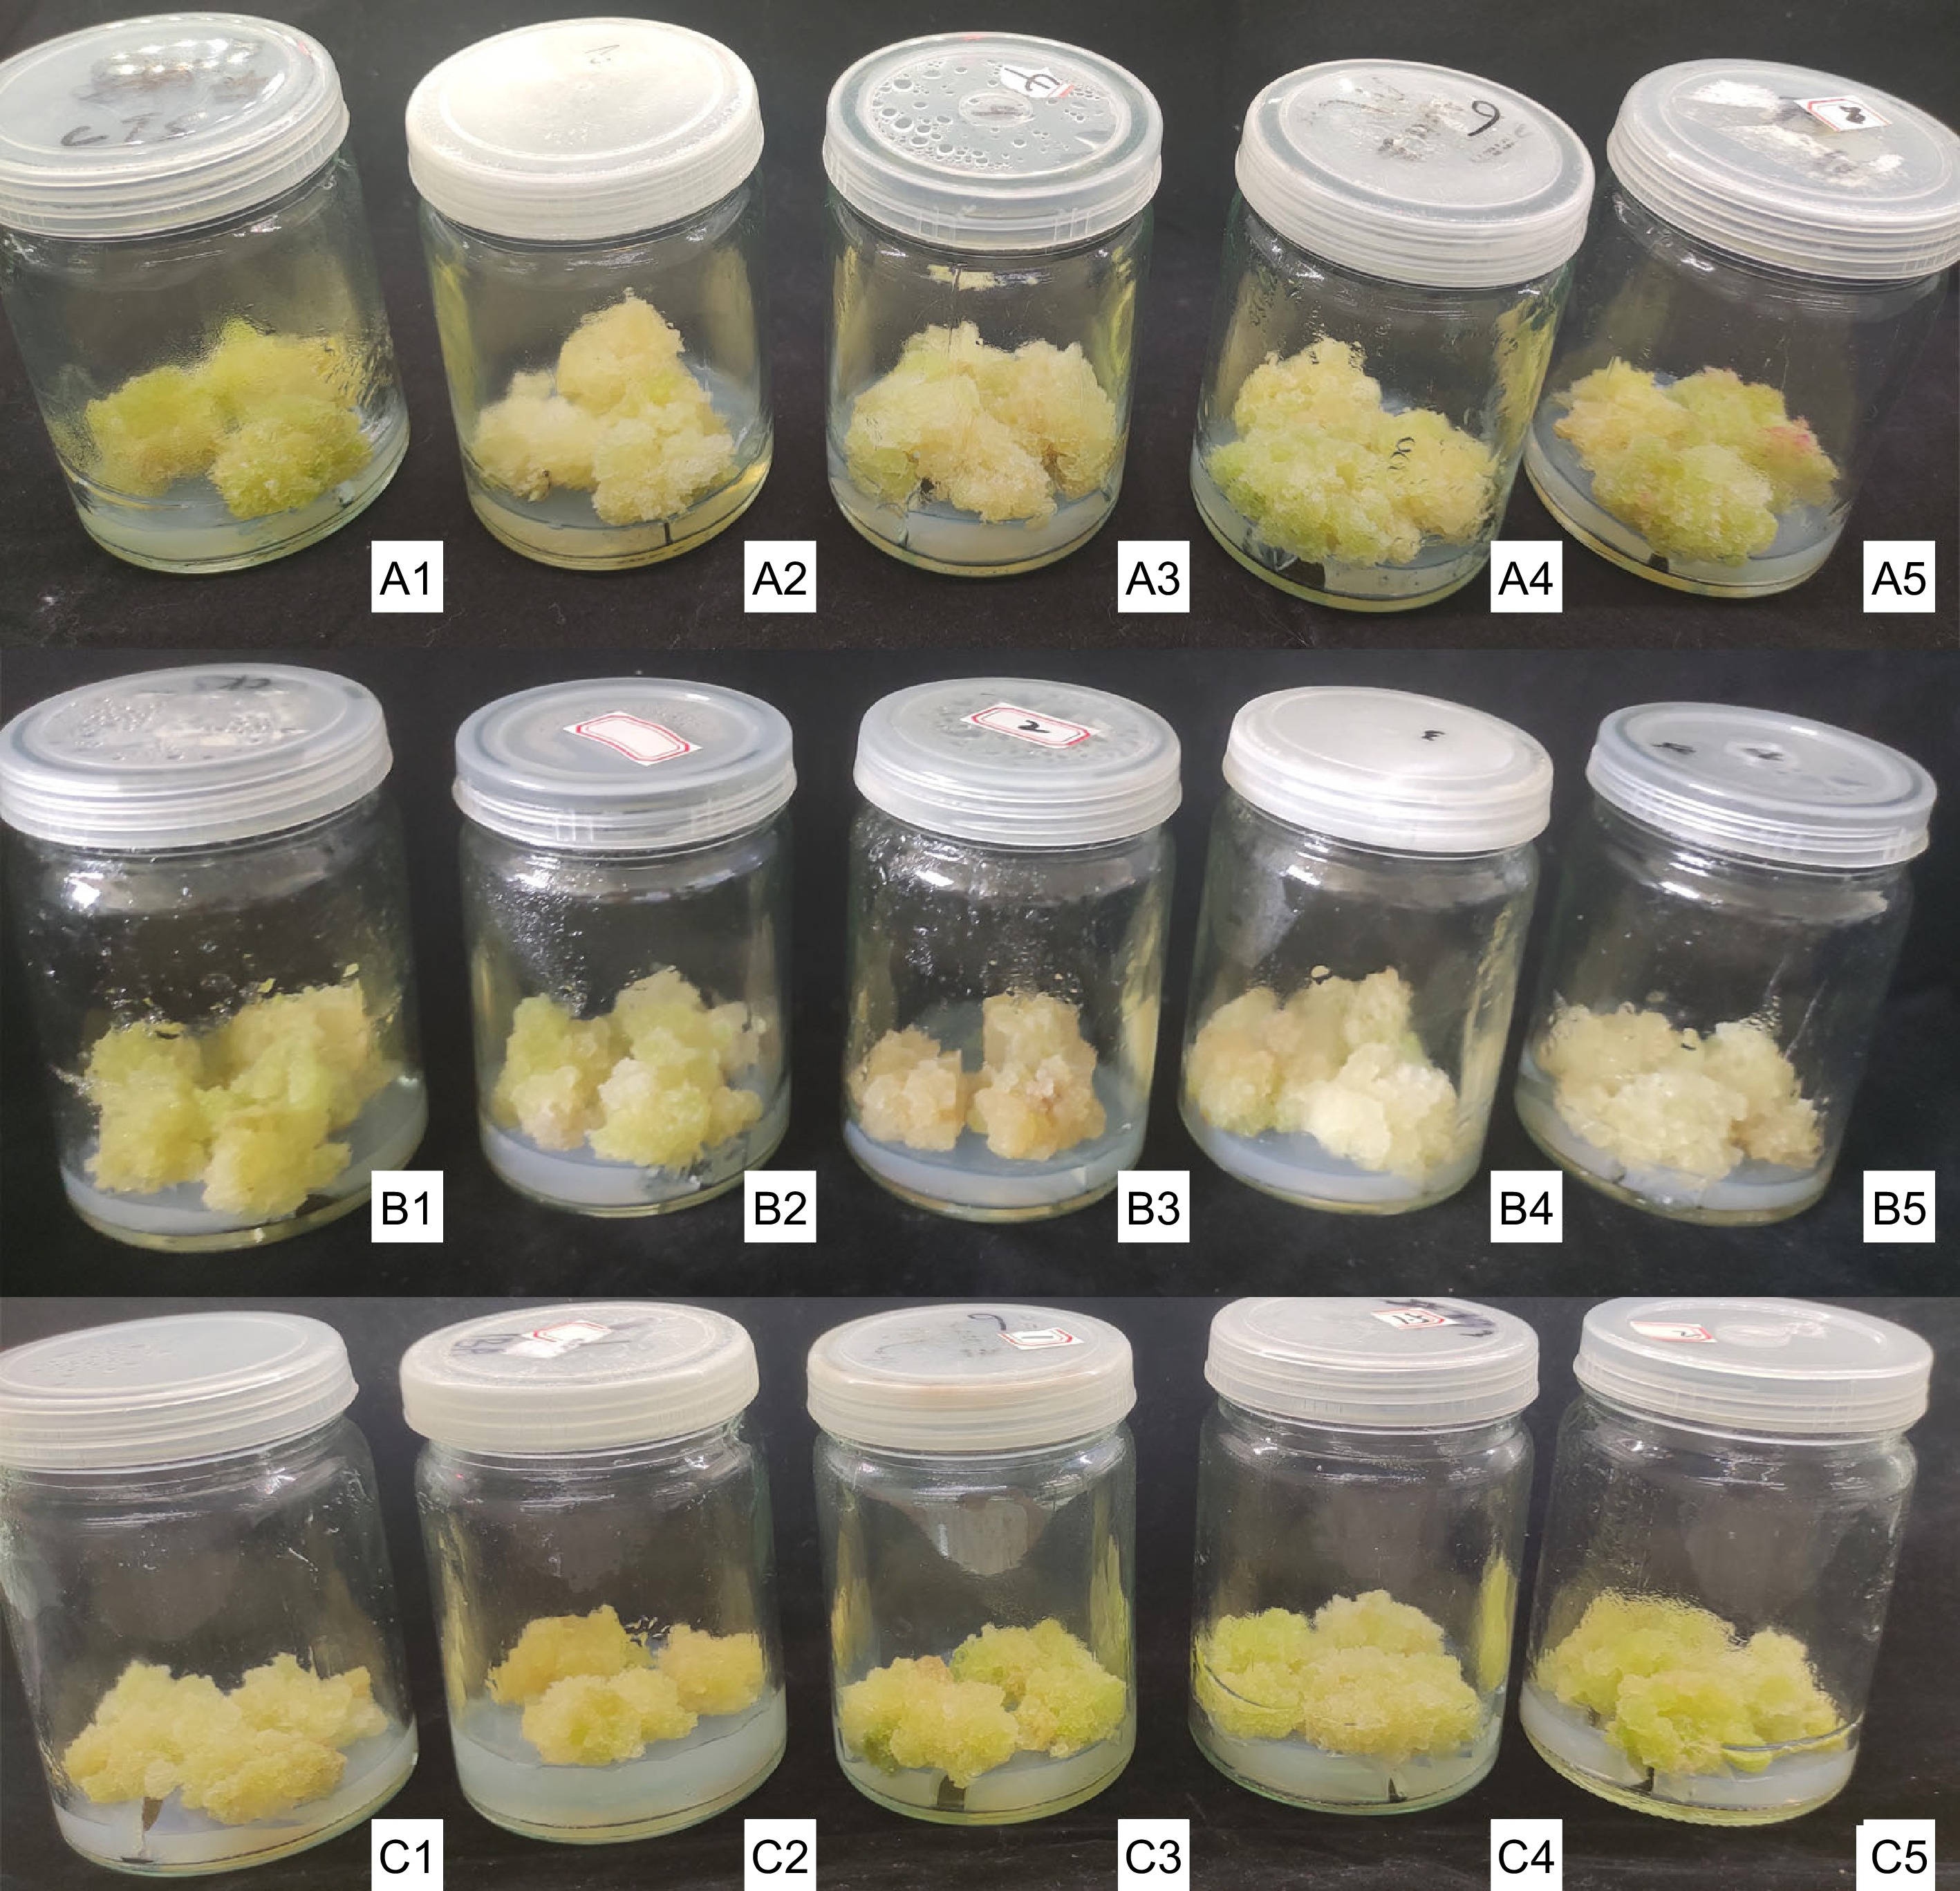
      Figure 1. 

      Effect of amaranth callus growth treated with aromatic amino acids. A1-A5 represents the amaranth callus with 0, 2, 4, 6, 8 mg/L tyrosine for 35 d; B1-B5 represents the amaranth callus with 0, 1, 2, 3, 4 mg/L phenylalanine for 35 d; C1-C5 represents the amaranth callus with 0, 0.5, 1.0, 1.5, 2.0 mg/L tryptophan for 35 d.

      Phenylalanine, tyrosine, and tryptophan all had significant promoting effects on the proliferation and dry matter accumulation of amaranth callus, besides 2.0 mg/L tryptophan (Fig. 2). With the increase in tyrosine concentration, the proliferation coefficient of amaranth callus increased first and then decreased (Fig. 2a). When the tyrosine concentration was 4.0 mg/L, the proliferation coefficient and dry weight of callus reached the maximum, reaching 15.6 and 0.43, respectively, which were significantly higher than those of other concentrations and control groups.
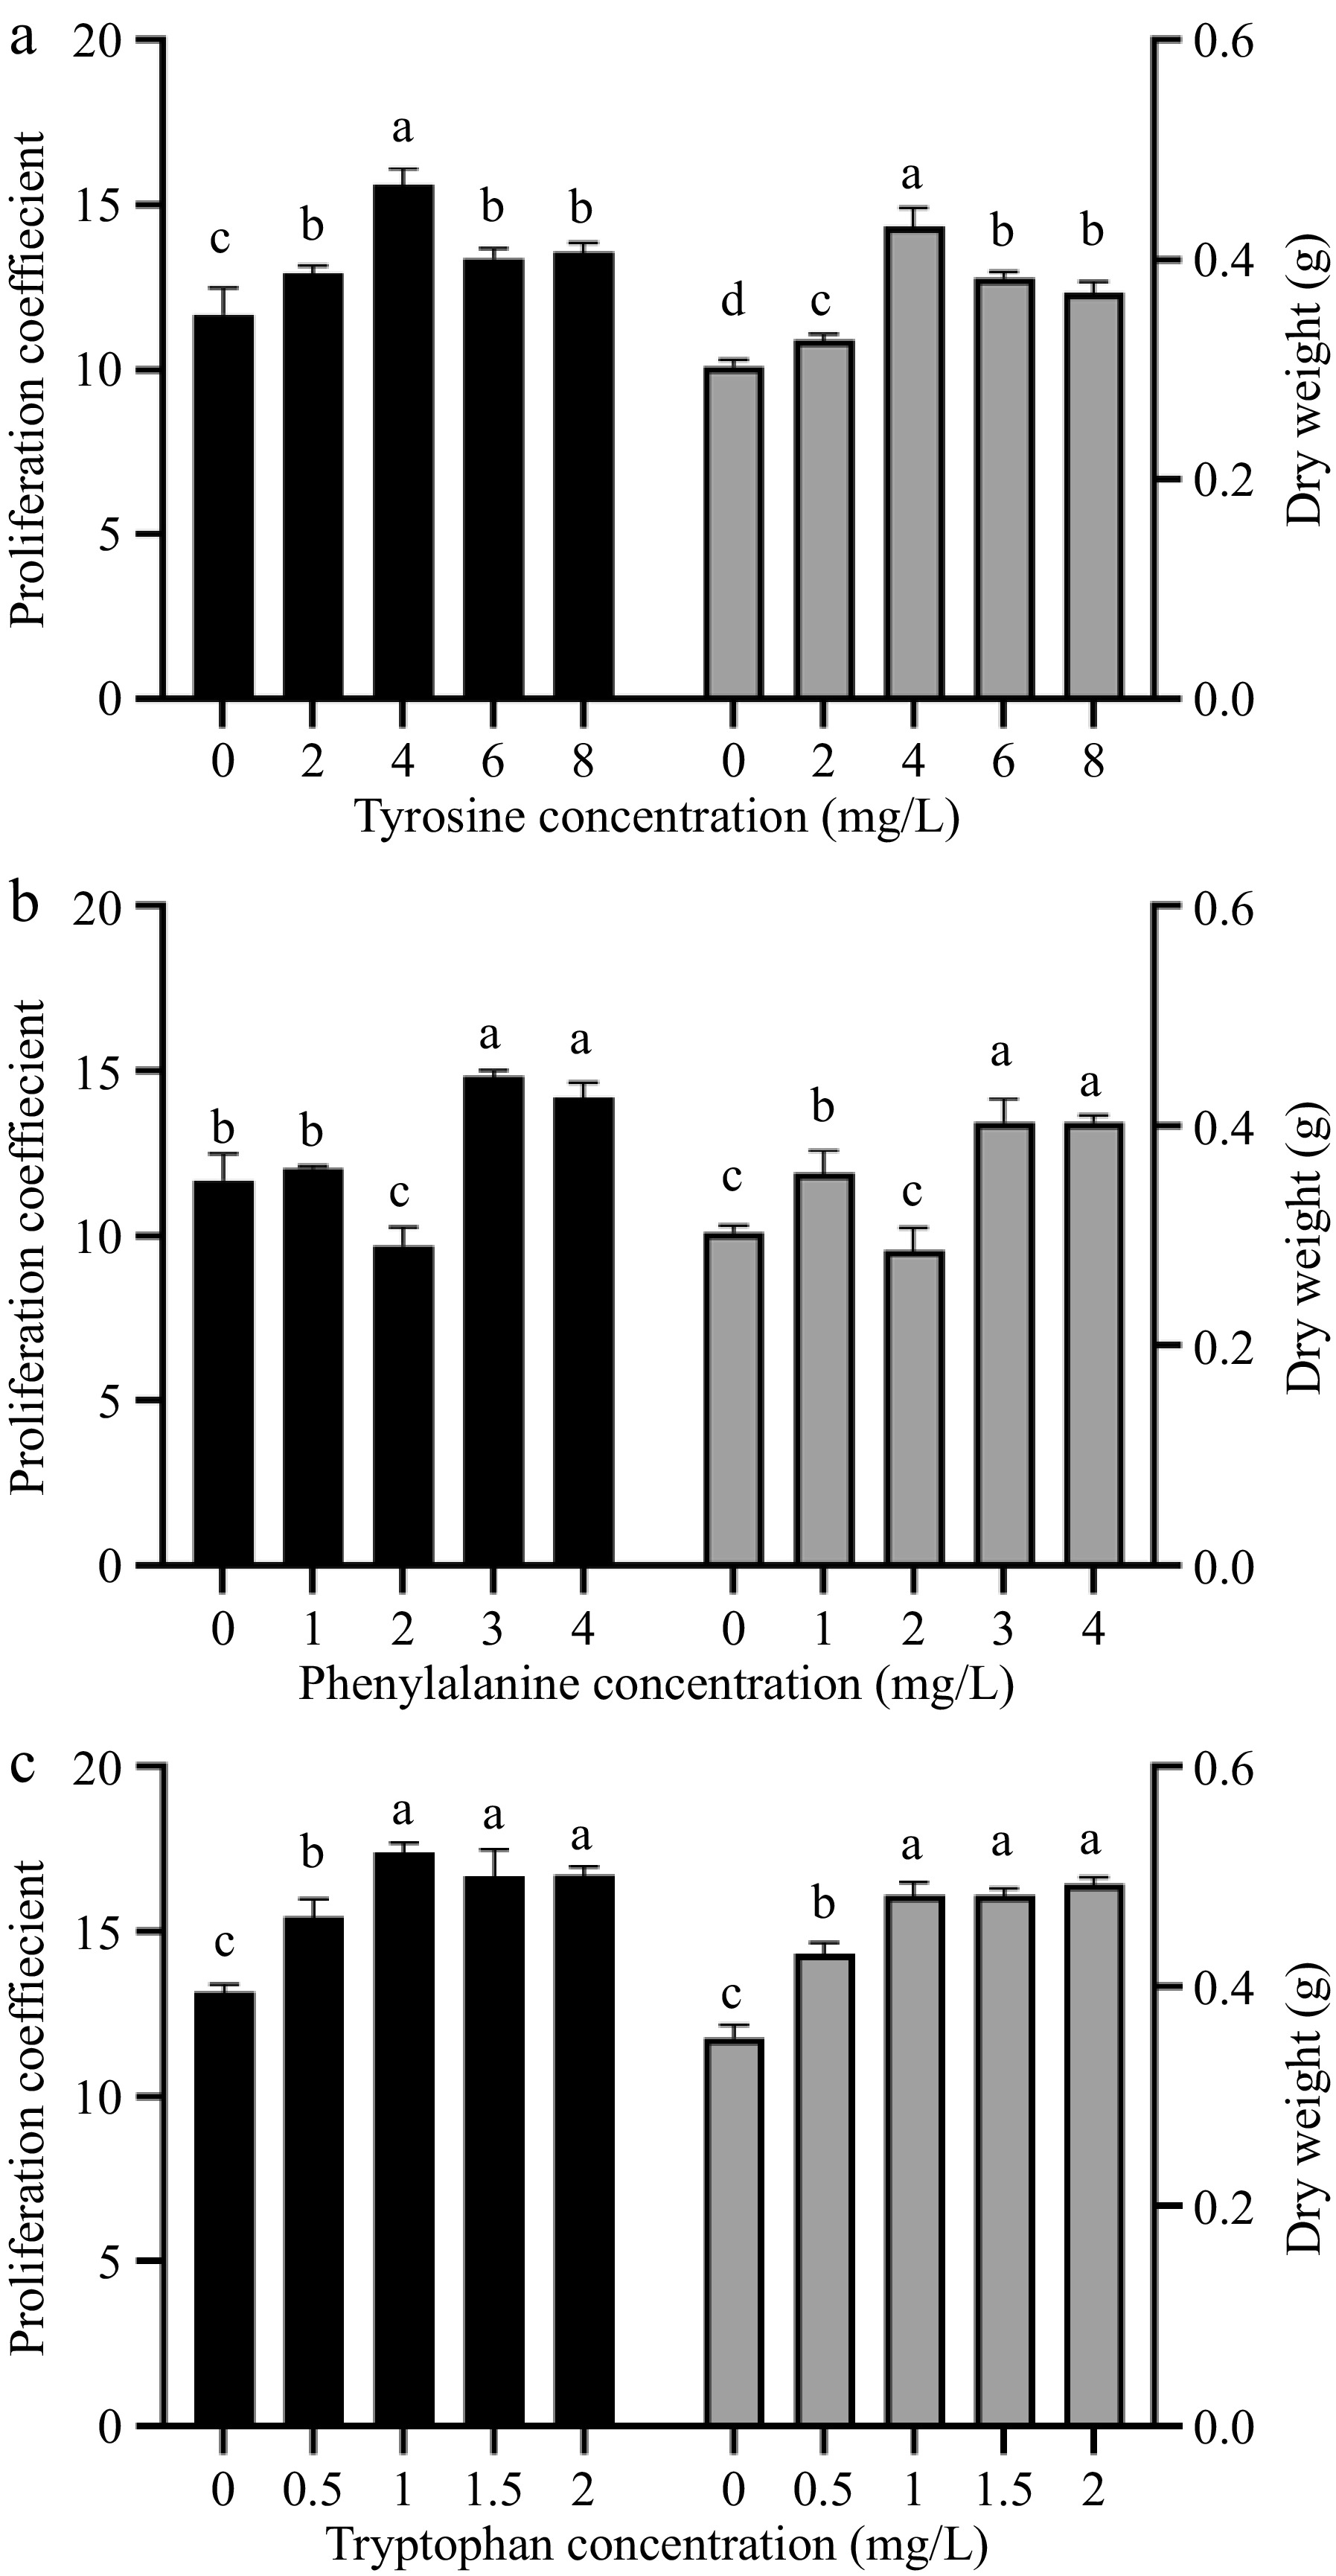
      Figure 2. 

      The effect of different concentrations of aromatic amino acids on amaranth callus proliferation and dry weight. Treatment of (a) tyrosine, (b) phenylalanine, and (c) tryptophan.

      With the increase in phenylalanine concentration, the callus proliferation coefficient and dry weight decreased first and then increased (Fig. 2b). When the concentration of phenylalanine was 2.0 mg/L, the callus proliferation coefficient and dry weight decreased to 9.7 and 0.29, respectively, and the callus proliferation coefficient was significantly lower than that of the control group, but the dry weight was not significant. When the concentration of phenylalanine was 3.0 mg/L, the callus proliferation coefficient and dry weight reached 14.82 and 0.4, respectively, which were significantly higher than those of the control group.

      With the increase of tryptophan concentration, the proliferation coefficient of amaranth callus showed a trend of first increasing and then decreasing (Fig. 2c). The proliferation coefficient increased to the highest at the concentration of 1 mg/L of tryptophan, reaching 17.39, which was significantly different from the control group. The dry weight showed an upward trend, and the highest at the concentration of 2 mg/L of tryptophan, reaching 0.4, which was significantly different from the control group.

    • The effect of different concentrations of aromatic amino acids on the flavonoid content in amaranth callus is shown in Fig. 3. With the increase in tyrosine concentration, the content of flavonoids in the callus reached the highest level (4.77 mg/g) when the tyrosine concentration was 2.0 mg/L, which was significantly different from that of the control (Fig. 3a).
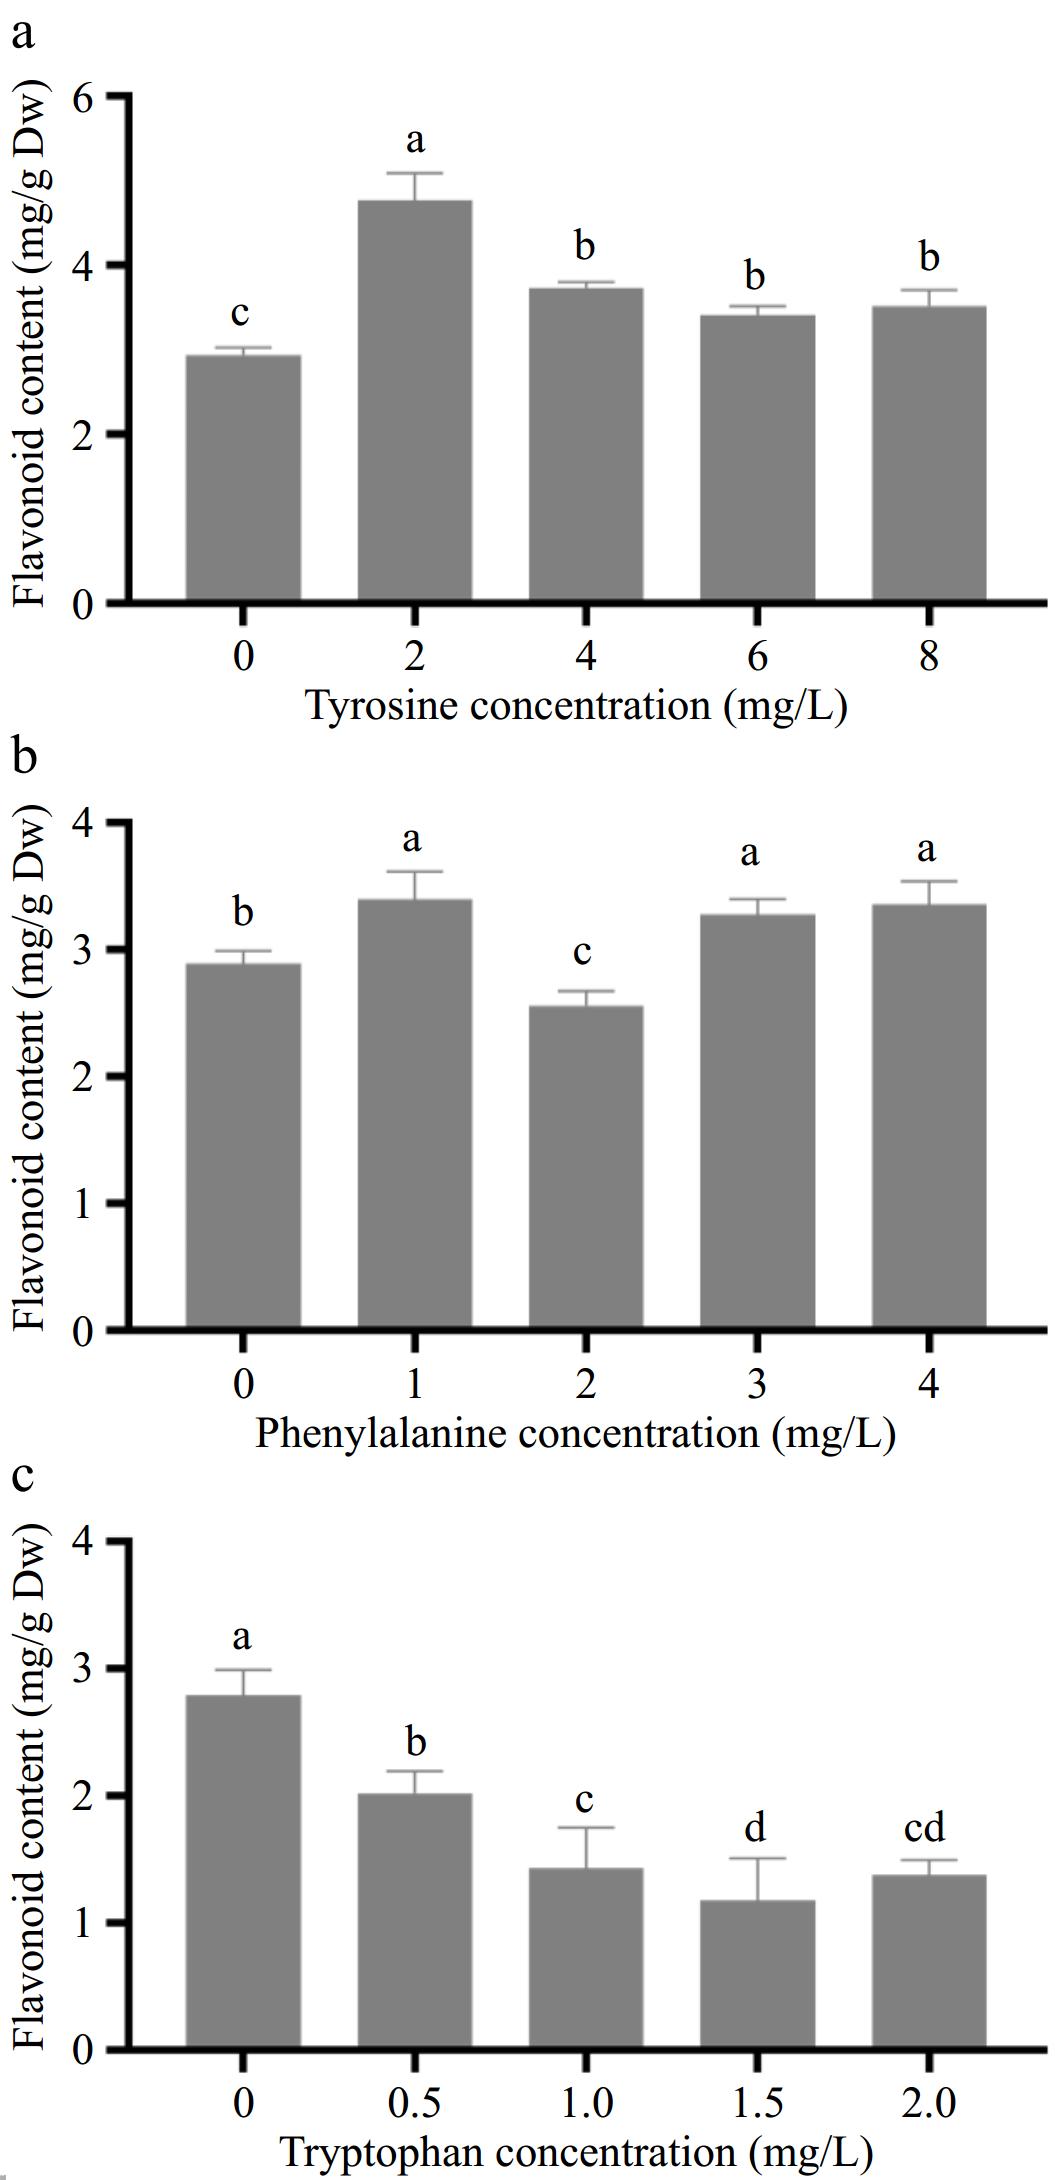
      Figure 3. 

      Effects of different concentrations of aromatic amino acids on flavonoid content in amaranth callus. (a) Tyrosine, (b) phenylalanine and, (c) tryptophan.

      With the increase in phenylalanine concentration, the content of flavonoids in the callus showed an upward trend (Fig. 3b). When the concentration of phenylalanine was 2.0 mg/L, the content of flavonoids decreased to 2.63 mg/g, which was lower than that of the control group (2.94 mg/g). When the concentration of phenylalanine was 1.0 mg/L, the content of flavonoids in the callus were the highest. It reached 3.42 mg/g, which was significantly different from the control group.

      With the increase in tryptophan concentration, the content of flavonoids in the callus decreased gradually, and the lowest was 1.18 mg/g when the tyrosine concentration was 1.5 mg/L, which was significantly different from the control group (Fig. 3c).

    • The effect of different concentrations of aromatic amino acids on carotenoid content in amaranth callus is shown in Fig. 4. With the increase in tyrosine concentration, the content of carotenoids in the callus decreased, and the minimum was 99.2 μg/g when the tyrosine concentration was 4.0 mg/L (Fig. 4a). With the increase of phenylalanine concentration, the content of carotenoids in callus decreased. When the concentration of phenylalanine was 2.0 mg/L, the content of carotenoids decreased to the lowest, reaching 64.6 μg/g (Fig. 4b).
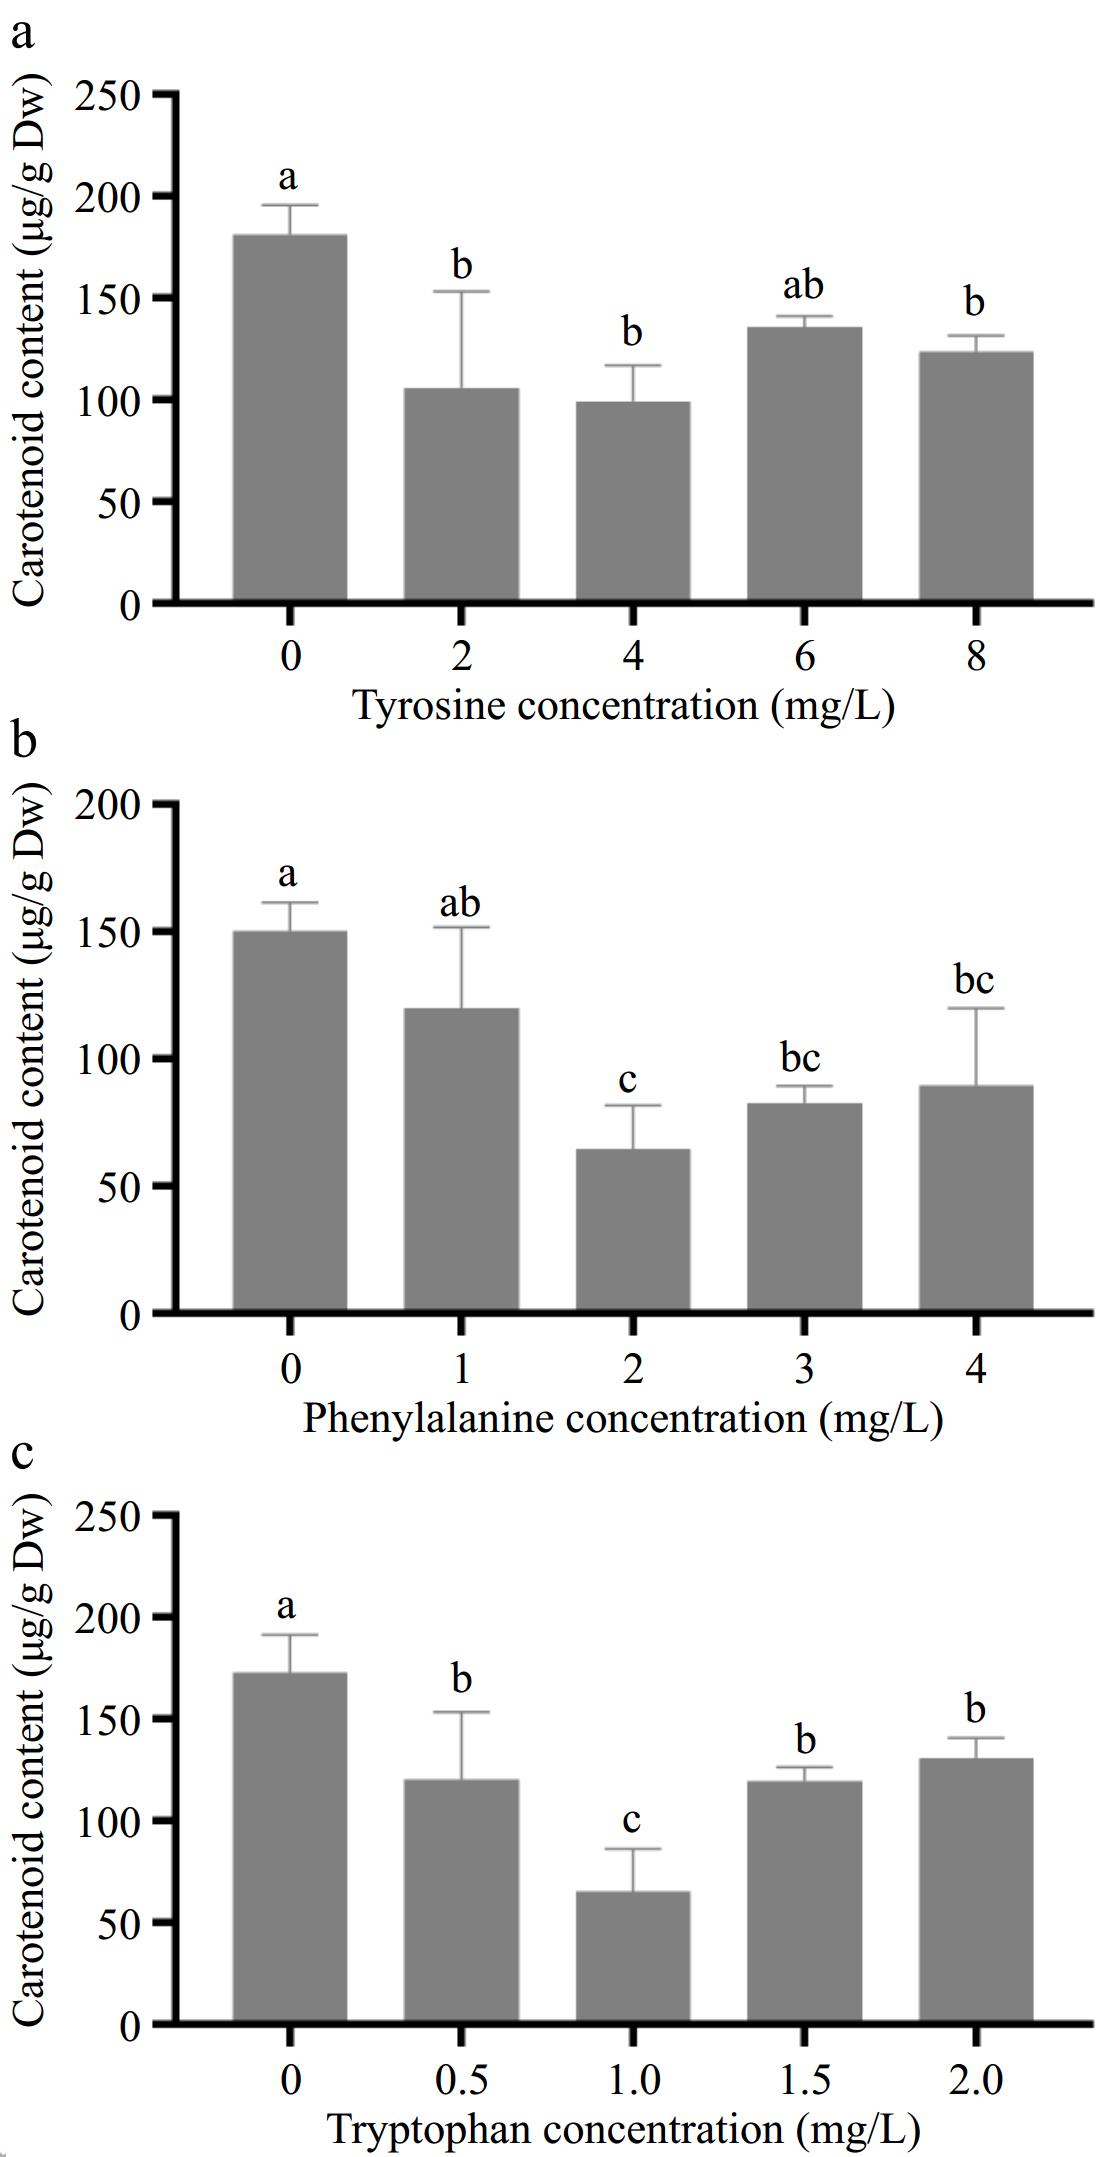
      Figure 4. 

      Effects of different concentrations of aromatic amino acids on carotenoid content in amaranth callus.

      With the increase in tryptophan concentration, the content of flavonoids in the callus decreased first and then increased. When the concentration of tryptophan was 1 mg/L, the content of flavonoids in callus was the lowest (63.6 μg/g), and when the concentration of tryptophan was 2.0 mg/L, the content of carotenoids was the highest (140.6 μg/g), which was lower than that of the control group (166 μg/g) (Fig. 4c).

    • The relative expression levels of flavonoid synthesis-related genes in amaranth callus treated with different concentrations of phenylalanine are shown in Fig. 5. The results showed that the gene expression of PAL, F3H, and CHS increased to the highest at the level of 1.0 mg/L phenylalanine, which was significantly different from the control.
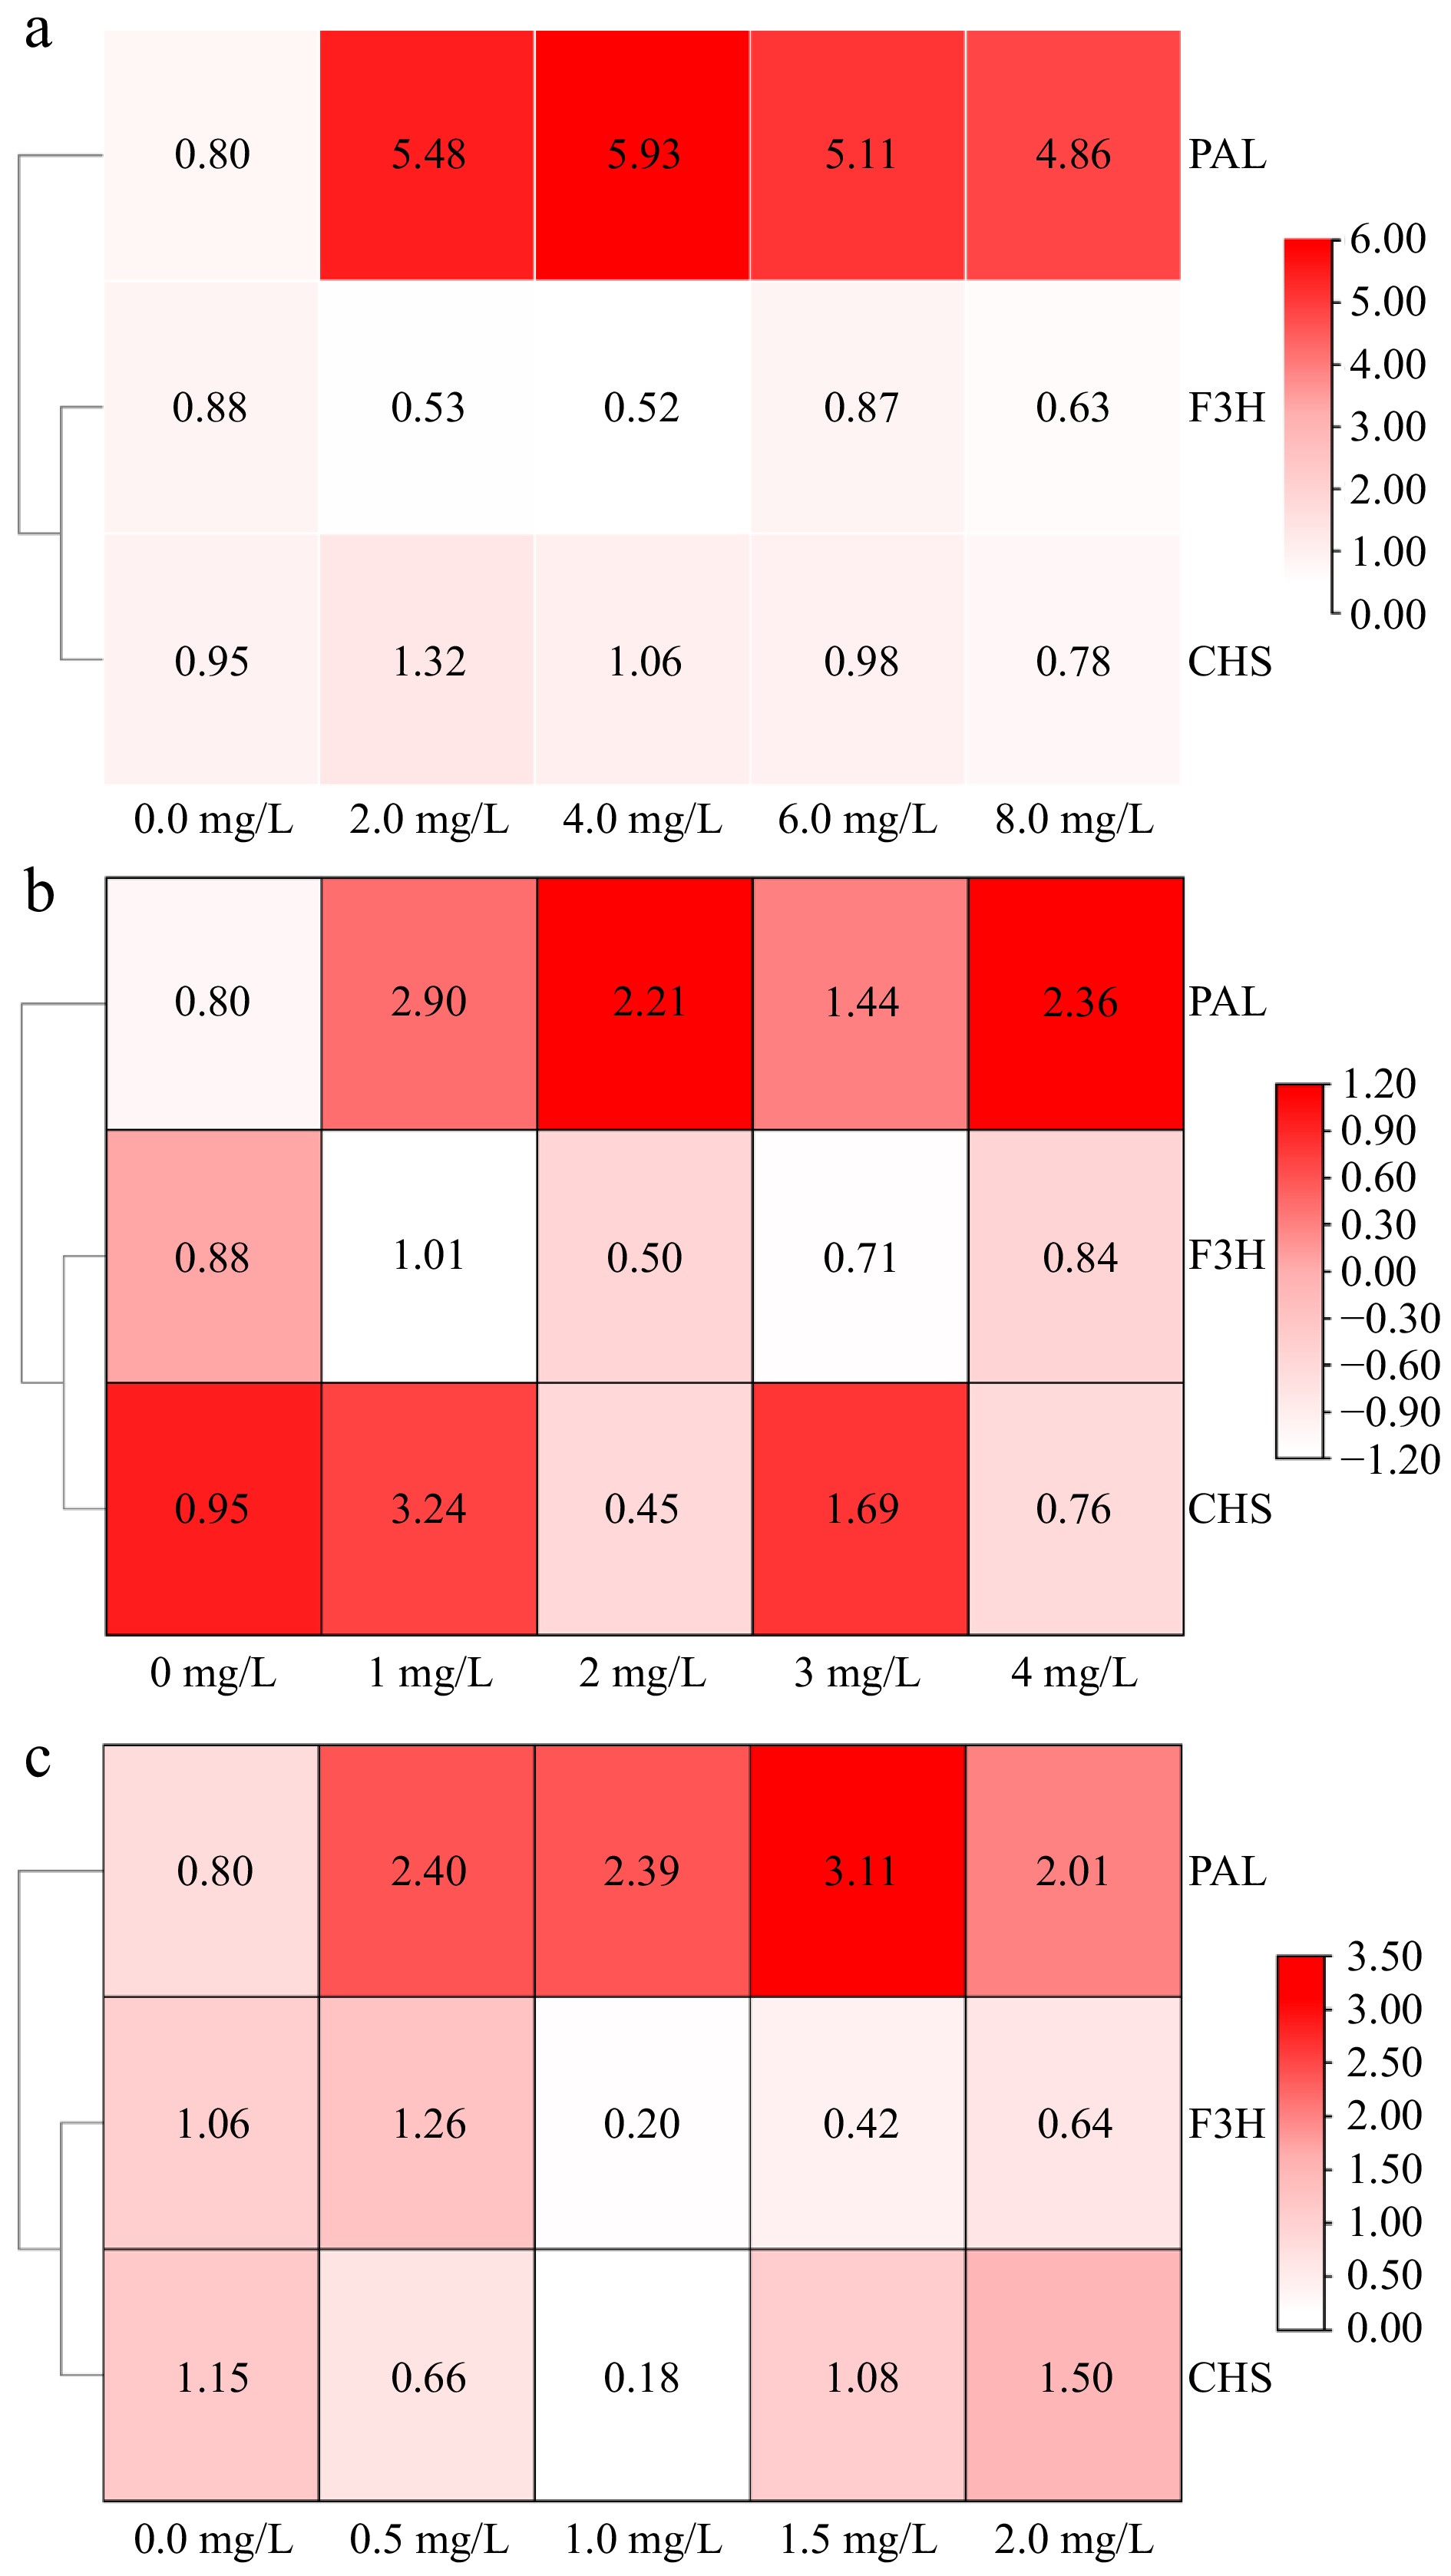
      Figure 5. 

      The effect of aromatic amino acids on the expression of flavonoids metabolism related genes in amaranth callus. (a) Tyrosine, (b) phenylalanine, and (c) tryptophan.

      The relative expression levels of genes involved in flavonoid synthesis in amaranth callus treated with different concentrations of tyrosine are shown in Fig. 5. The addition of tyrosine promoted PAL gene expression, reaching a significant difference compared with the control. However, there was no significant difference between different concentrations of tyrosine. The relative expression of the F3H and CHS genes were the highest when the concentration of tyrosine was 6.0 and 2.0 mg/L, respectively.

      The relative expression levels of genes involved in flavonoid synthesis in amaranth callus treated with different concentrations of tryptophan are shown in Fig. 5. The relative expression of PAL, F3H, and CHS genes were the highest when the concentration of tyrosine was 1.5, 0.5, and 2.0 mg/L, respectively. And they all reached a significant difference compared with the control.

    • SPSS 26 software was used to analyze the correlation between flavonoid content and flavonoid biosynthesis-related genes in amaranth callus treated with three aromatic amino acids (Table 1). The results show that the content of flavonoids was positively correlated with PAL under tyrosine treatment, but not under phenylalanine and tryptophan treatments. There was a significant positive correlation between F3H and flavonoid content under phenylalanine and tryptophan treatments, besides tryptophan treatment. There was a significant positive correlation between flavonoid content and CHS only under tyrosine treatment.

      Table 1.  Correlation analysis of flavonoid content and flavonoid-related genes.

      Aromatic
      amino acids
      PAL F3H CHS
      Tyrosine Pearson correlation 0.615* −0.659** 0.694**
      Significance (two-tailed) 0.015 0.007 0.004
      Phenylalanine Pearson correlation −0.183 0.669** 0.258
      Significance (two-tailed) 0.513 0.006 0.353
      Tryptophan Pearson correlation −0.858 0.753 0.076
      Significance (two-tailed) 0.063 0.142 0.90
      * indicates significant correlation at the p < 0.05 level, ** indicates extremely significant correlation at the p < 0.01 level.
    • Tyrosine had different effects on the expression of carotenoid synthesis genes in amaranth callus (Fig. 6a). Low concentrations of tyrosine (0−4 mg/L) could promote gene expression, whereas high concentrations inhibit PSY gene expression. When the tyrosine concentration was 4.0 mg/L, the relative expression reached the highest level. Tyrosine had no effect on the PDS gene expression However, it could inhibit the expression of the ZDS gene.
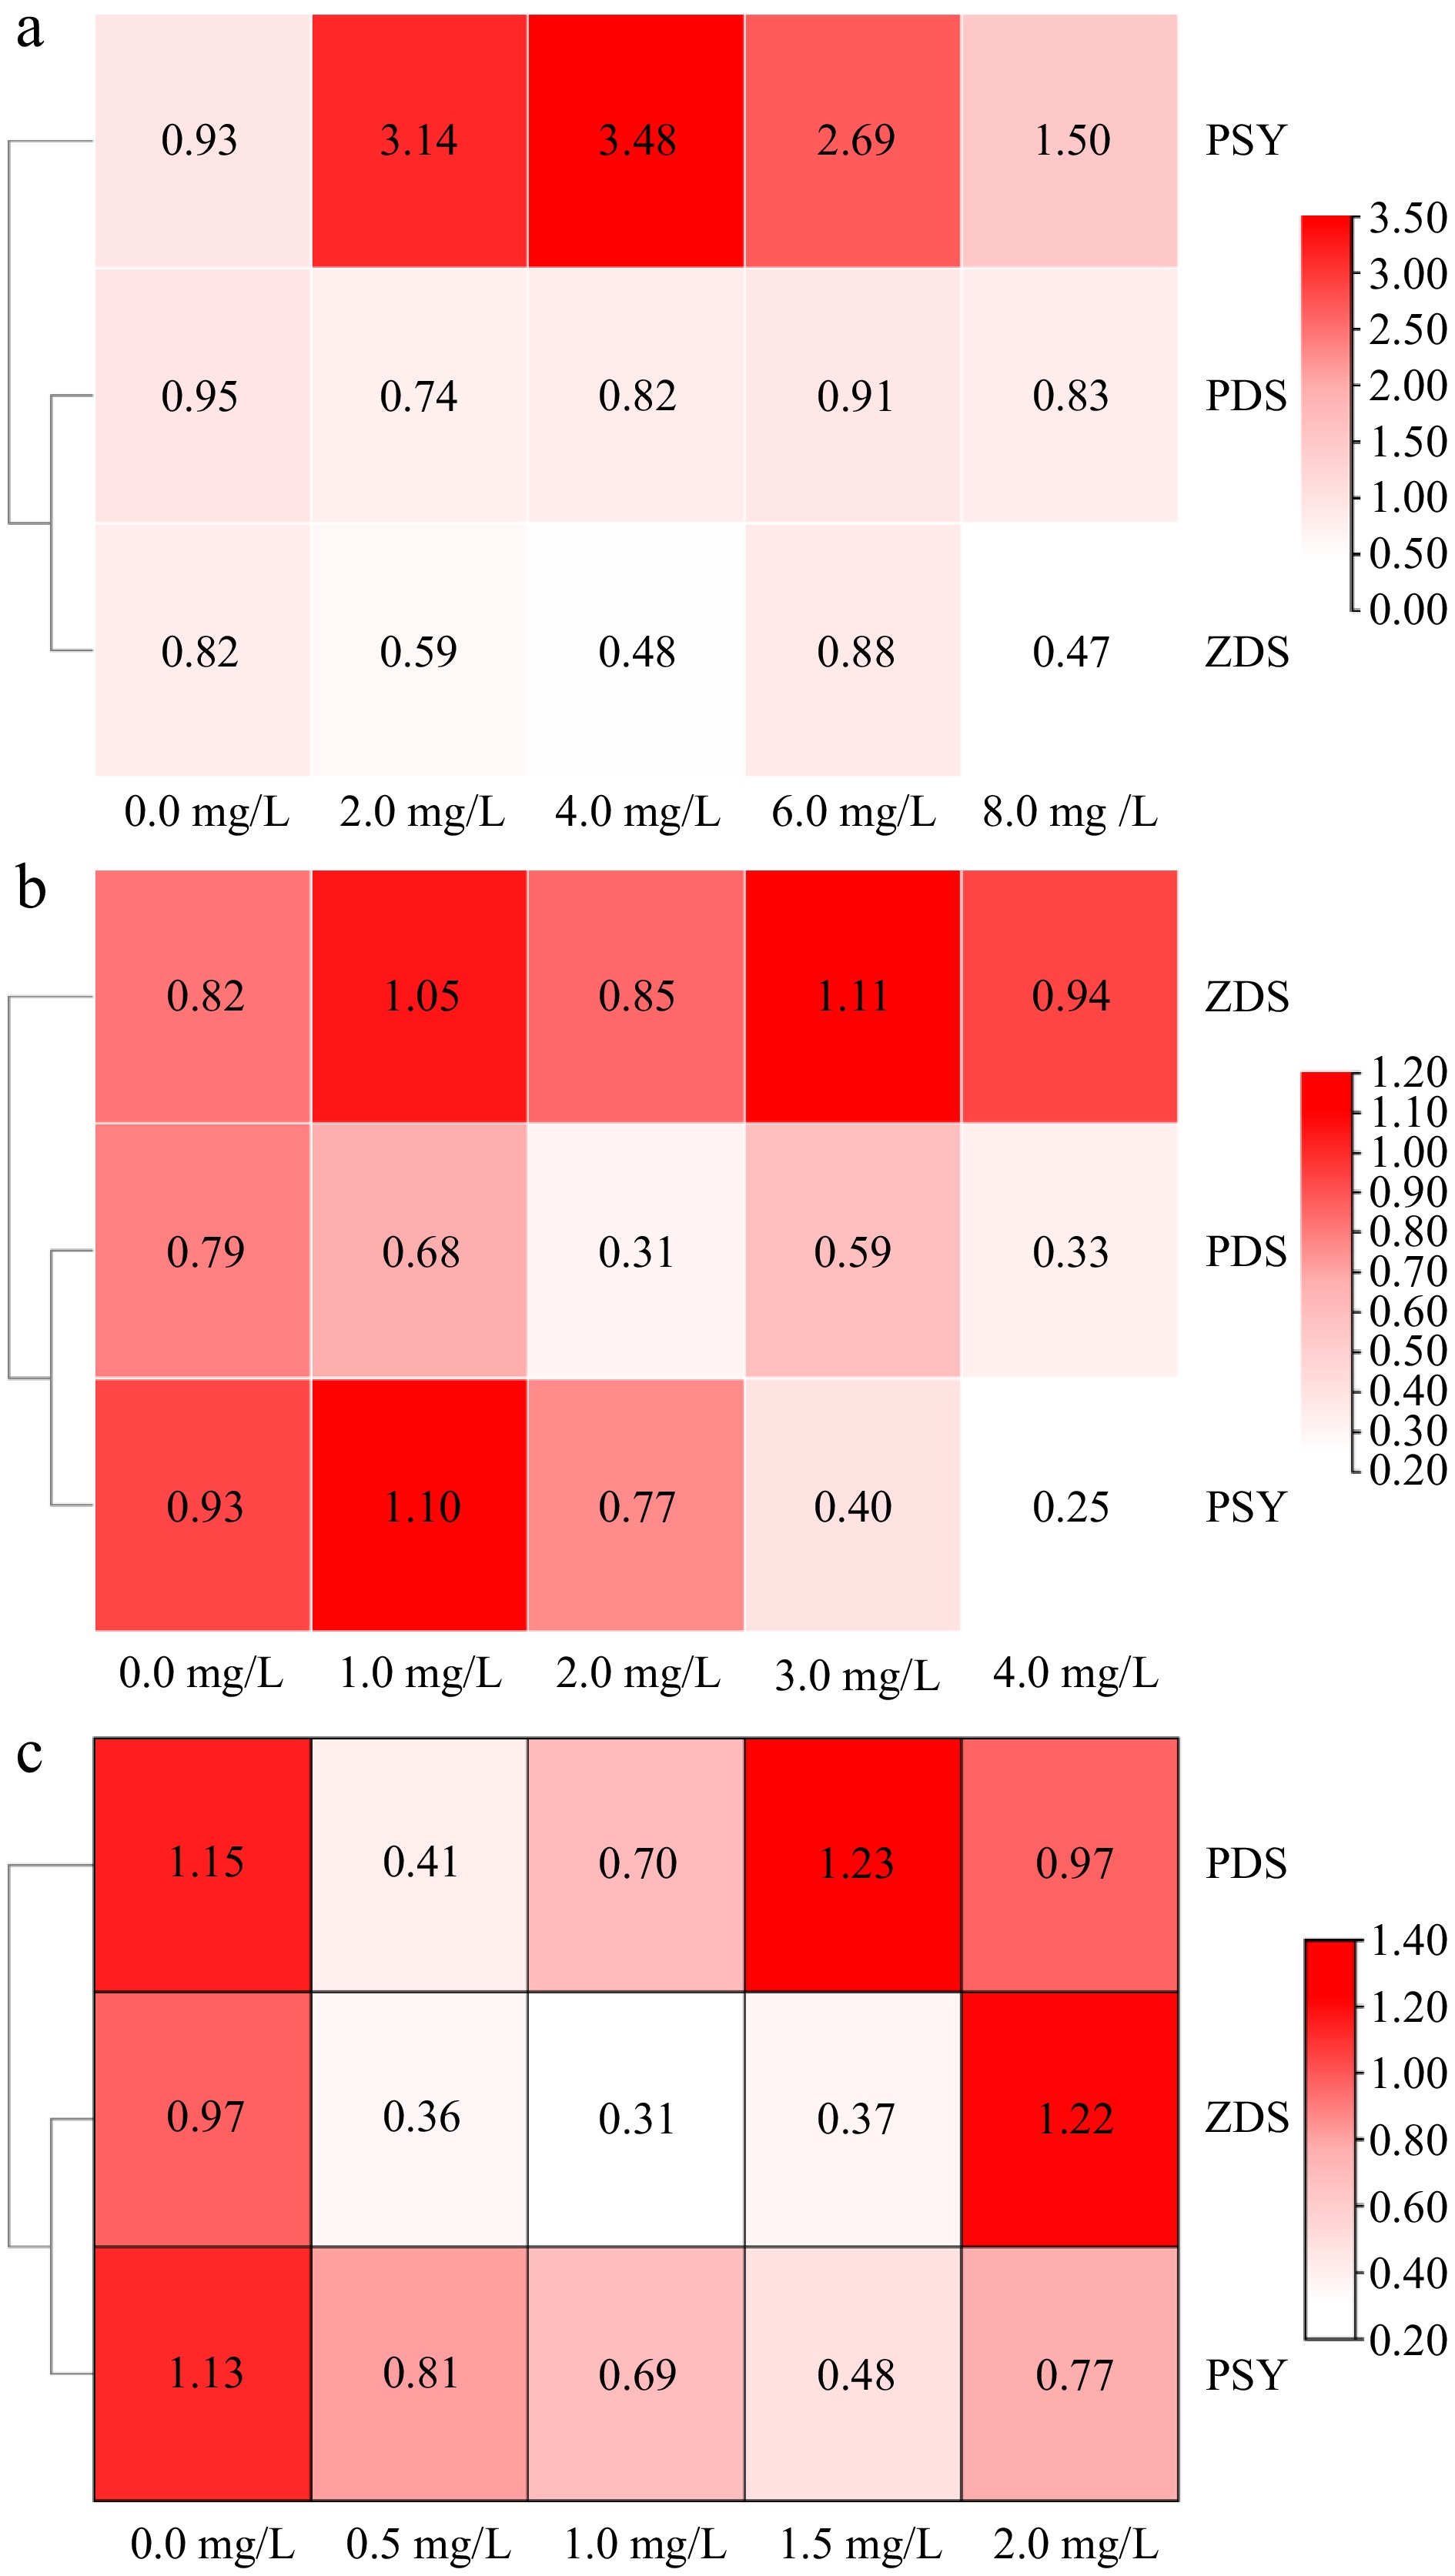
      Figure 6. 

      The effect of aromatic amino acids on the expression of carotenoid metabolism related genes in amaranth callus. (a) Tyrosine, (b) phenylalanine, and (c) tryptophan.

      The relative expression levels of carotenoid synthesis-related genes in amaranth callus treated with different concentrations of phenylalanine are shown in Fig. 6b. Phenylalanine could inhibit the expression of PDS and PSY, and there was no significant difference in the expression of the ZDS gene between the phenylalanine treatment and control. Under tryptophan treatment, the carotenoid synthesis gene (PDS, PSY, and ZDS) expression was inhibited in amaranth callus. There were significant differences from the control (Fig. 6c).

    • SPSS 26 software was used to analyze the correlation between carotenoid content and carotenoid biosynthesis related genes in amaranth callus treated with three aromatic amino acids (Table 2). The results show that the content of carotenoid was positively correlated with PDS under phenylalanine treatment, but not under tyrosine and tryptophan treatments. There was a significant positive correlation between PSY and carotenoid content under tryptophan treatments. There was a significant positive correlation between flavonoid content and ZDS under tyrosine and tryptophan treatment.

      Table 2.  Correlation analysis of carotenoids content and carotenoids-related genes.

      Aromatic
      amino acids
      PDS ZDS PSY
      Tyrosine Pearson correlation −0.348 −0.356 0.638*
      Significance (two-tailed) 0.204 0.192 0.011
      Phenylalanine Pearson correlation 0.694** −0.025 0.442
      Significance (two-tailed) 0.004 0.93 0.099
      Tryptophan Pearson correlation 0.342 0.591* 0.57*
      Significance (two-tailed) 0.212 0.02 0.026
      * indicates p < 0.05, ** indicates p < 0.01.
    • Amino acids as a source of organic nitrogen can promote plant growth and development, and play key roles in plant cells and tissues[45,50], and are important regulators in vitro[51]. Exogenous supplementation of amino acids and casein hydrolysate could enhance callogenesis from plumular explants of coconut (Cocos nucifera L.)[52]. The present results showed that phenylalanine, tyrosine, and tryptophan all had significant promoting effects on the proliferation and dry matter accumulation of amaranth callus. When the concentration of tryptophan was 1 and 2.0 mg/L, the effect of callus proliferation and dry matter accumulation was the best, and the effect was better than that of phenylalanine and tyrosine. It was hypothesized that tryptophan is an important precursor substance for auxin biosynthesis in plants and its structure is similar to IAA, and auxin is beneficial for callus induction and proliferation. So the addition of tryptophan 1.0–2.0 mg/L in the culture medium was most conducive to callus proliferation and dry matter accumulation.

      Aromatic amino acids are precursors of secondary metabolites such as flavonoids, carotenoids, and alkaloids[5]. Flavonoid compounds are important secondary metabolites produced by plants[6]. Flavonoids have a variety of biological functions. They can not only affect the transport of plant hormones[9,10], but also regulate the level of reactive oxygen species (ROS) in plants[1113]. Phenylalanine ammonia-lyase (PAL) is the first enzyme in the phenylpropane metabolic pathway and a key enzyme in the flavonoid metabolic pathway[14,15]. PAL and C4H can convert phenylalanine to p-coumaric acid. Meanwhile, tyrosine can be directly converted to p-coumaric acid[53]. Subsequently, p-coumaric acid is converted to flavonoids under the action of a series of enzymes, including 4CL, CHS[19,20], CHI, and F3H[2123]. The present results show that tyrosine was beneficial to increase the content of flavonoids in amaranth callus, and it was superior to phenylalanine. The two precursor amino acids are converted to flavonoids by different pathways. Through correlation analysis, there was a significant positive correlation between the PAL gene, CHS gene, F3H gene, and flavonoid content under tyrosine treatment, indicating that tyrosine affected the synthesis of flavonoids by regulating the expression of the three key genes. Under phenylalanine treatment, there was a significant positive correlation between F3H and flavonoid content, indicating that phenylalanine regulates the expression of F3H.

      Carotenoids are a sort of yellow, red, or orange-red polyene substance[24], which could participate in photosynthesis[24,25] and the synthesis of plant hormones[26,27]. Two geranylgeranyl diphosphates (GGPPs) are condensed into colorless phytoene under the catalysis of phytoene synthase (PSY)[30], which is the rate-limiting enzyme in the carotenoid synthesis pathway[3133]. Phytoene is converted to red phytoene by the co-catalysis of phytoene dehydrogenase (PDS) and carotene dehydrogenase (ZDS)[3436]. The present results showed that aromatic amino acids inhibited the carotenoids biosynthesis. Perhaps the degradation and transport of carotenoids affected their concentrations. However, the mechanism is not still clear.

    • Aromatic amino acids, especially tyrosine, could promote the growth of amaranth callus and flavonoid synthesis, and regulate related gene expression. In contrast, aromatic amino acids inhibited carotenoids synthesis in amaranth callus.

    • The authors confirm contribution to the paper as follows: writing – original draft, writing – review & editing: Liu S, Xuan Y; validation: Xuan Y; conceptualization: Liu S, Lai Z; methodology: Xuan Y, Feng W. All authors reviewed the results and approved the final version of the manuscript.

    • All data generated or analyzed during this study are included in this published article and its supplementary information files.

      • This work was supported by the Natural Science Foundation of Fujian Province (2023J01449), Innovation Foundation of Fujian Agriculture and Forestry University (KFb22024XA), Rural Revitalization Social Service Team of Fujian Agriculture and Forestry University (11899170125).

      • The authors declare that the research was conducted in the absence of any commercial or financial relationships that could be construed as a potential conflict of interest.

      • Received 18 April 2024; Accepted 26 July 2024; Published online 20 September 2024

      • Aromatic amino acids could promote the growth of amaranth callus.

        Optimum concentrations of tyrosine and phenylalanine were beneficial for flavonoid content in the callus.

      • Copyright: © 2024 by the author(s). Published by Maximum Academic Press on behalf of Hainan University. This article is an open access article distributed under Creative Commons Attribution License (CC BY 4.0), visit https://creativecommons.org/licenses/by/4.0/.
    Figure (6)  Table (2) References (53)
  • About this article
    Cite this article
    Xuan Y, Feng W, Lai Z, Liu S. 2024. Effects of aromatic amino acids on callus growth and accumulation of secondary metabolites in amaranth. Tropical Plants 3: e032 doi: 10.48130/tp-0024-0034
    Xuan Y, Feng W, Lai Z, Liu S. 2024. Effects of aromatic amino acids on callus growth and accumulation of secondary metabolites in amaranth. Tropical Plants 3: e032 doi: 10.48130/tp-0024-0034

Catalog

  • About this article

/

DownLoad:  Full-Size Img  PowerPoint
Return
Return